3. Microscopic analysis
The Utermöhl method (Utermöhl 1931; 1958; Edler & Elbrächter, 2010; HELCOM 2024) was used for the microscopic analysis of the samples. Organisms were identified based on their taxonomy and examples of identified phytoplankton species are shown in Fig. 3. From the 100 mL sample collected for phytoplankton analysis, 10-25 mL was sedimented for analysis using a special sedimentation chamber and a bottom counting slide (Fig. 2). The analysis was conducted based on the methods used in each institute for routine phytoplankton monitoring.
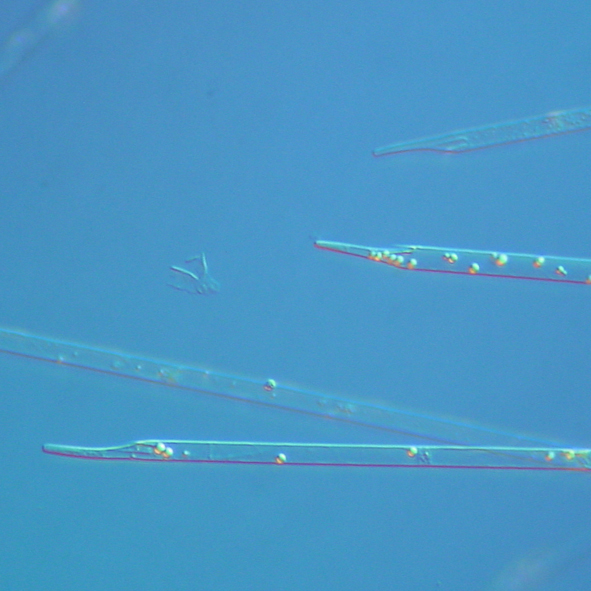
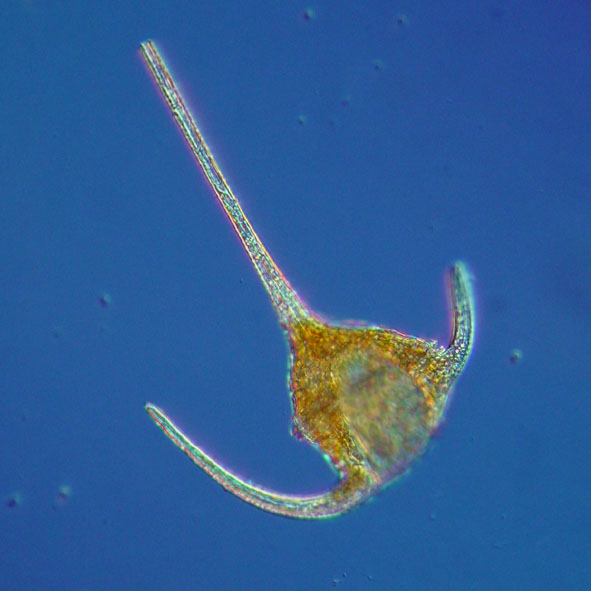
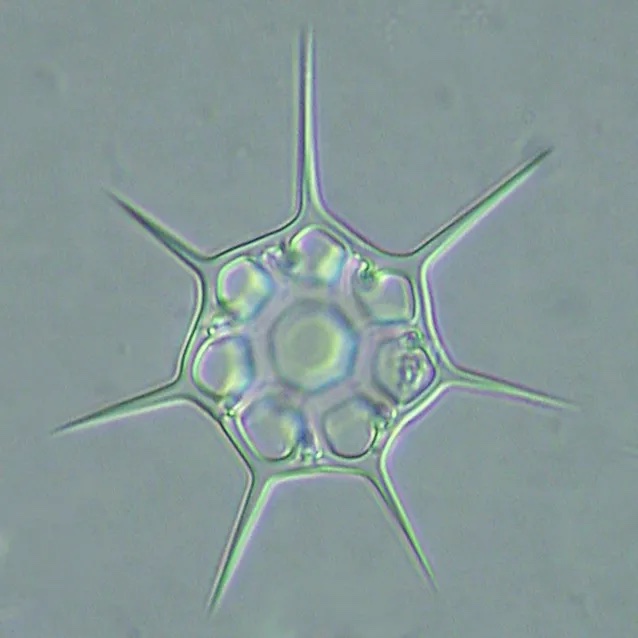
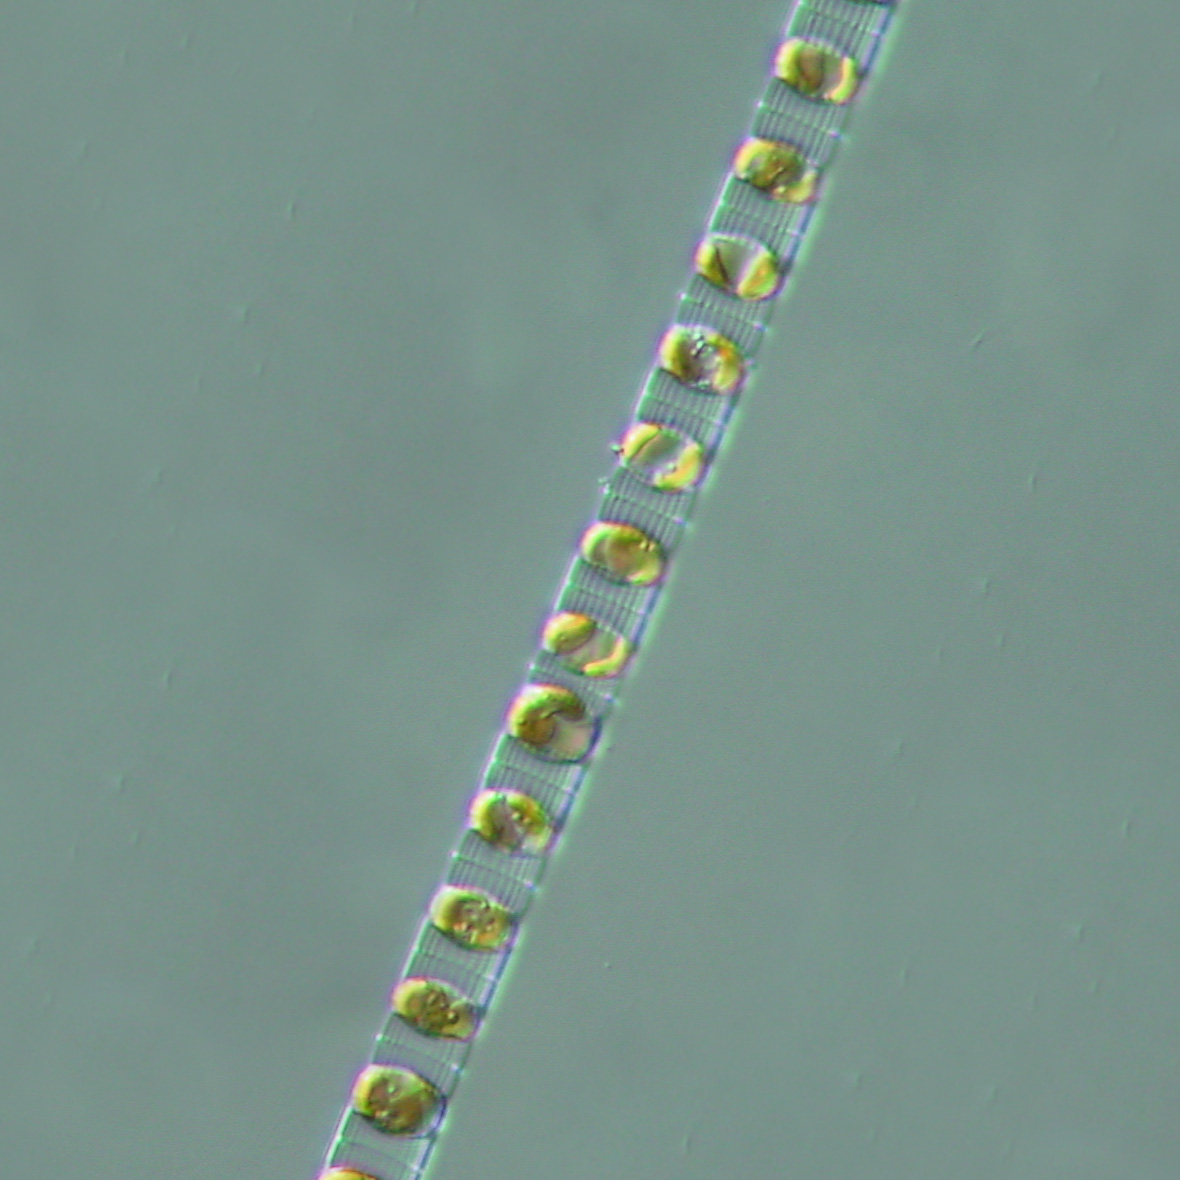
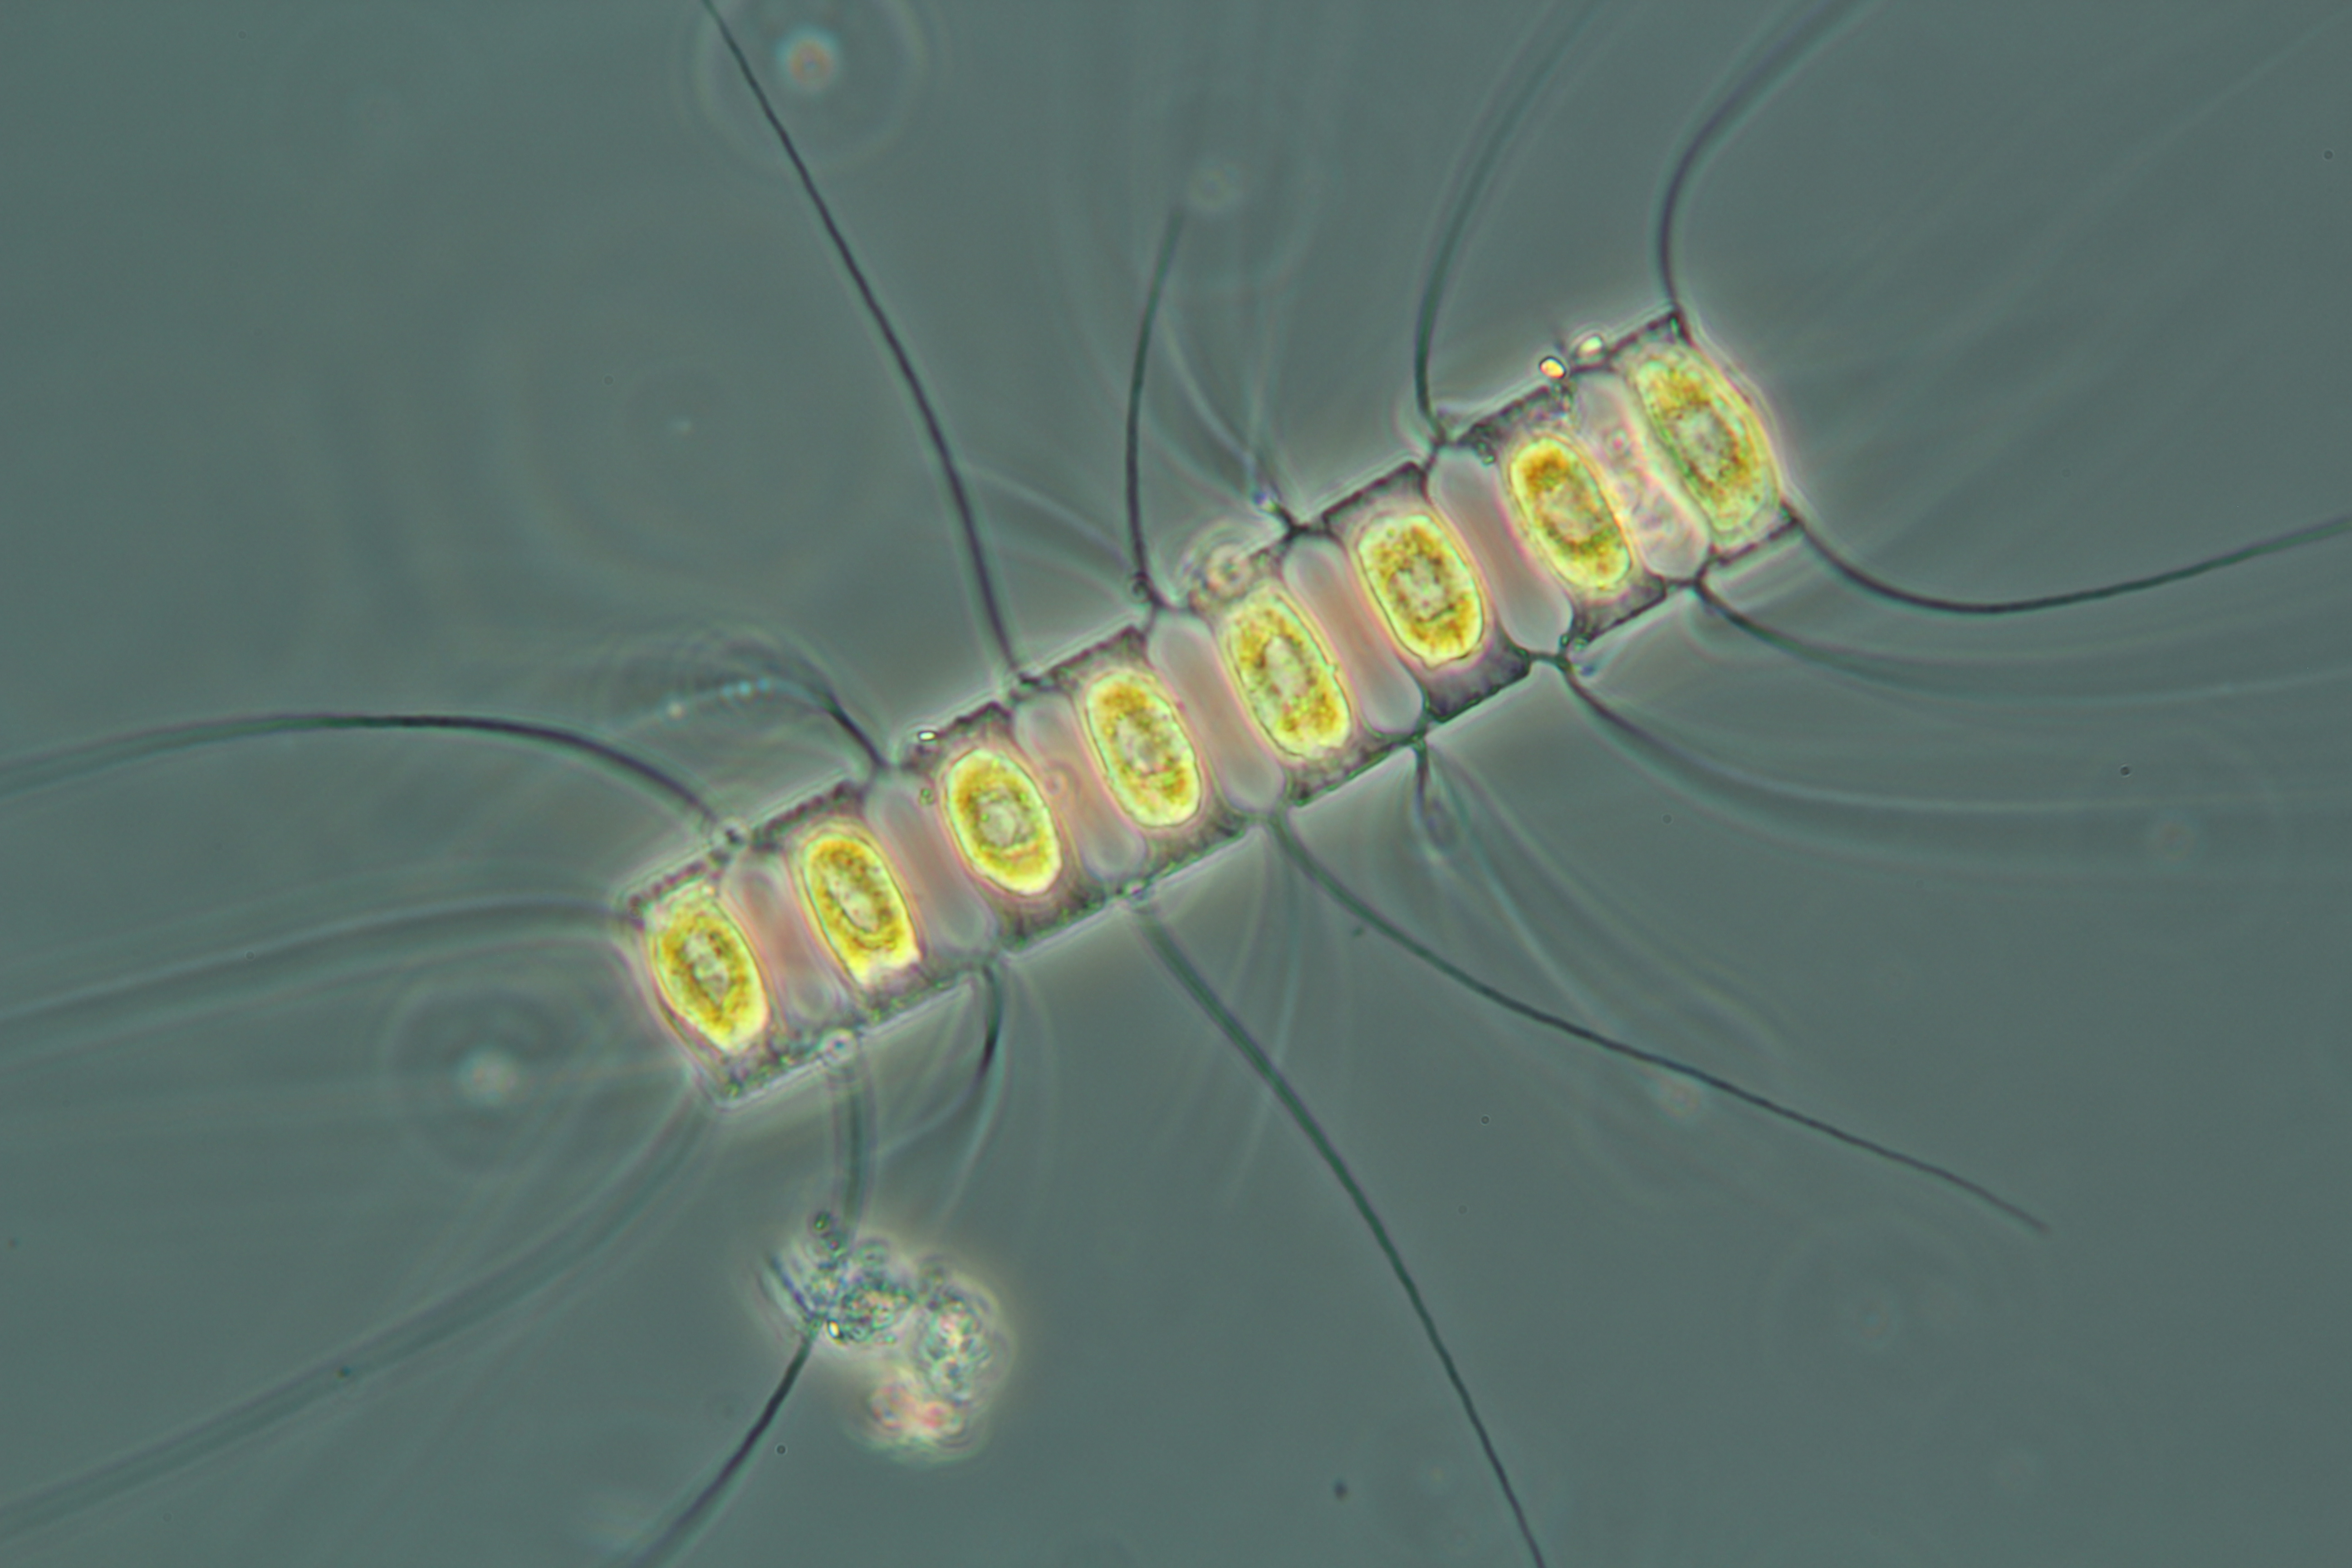
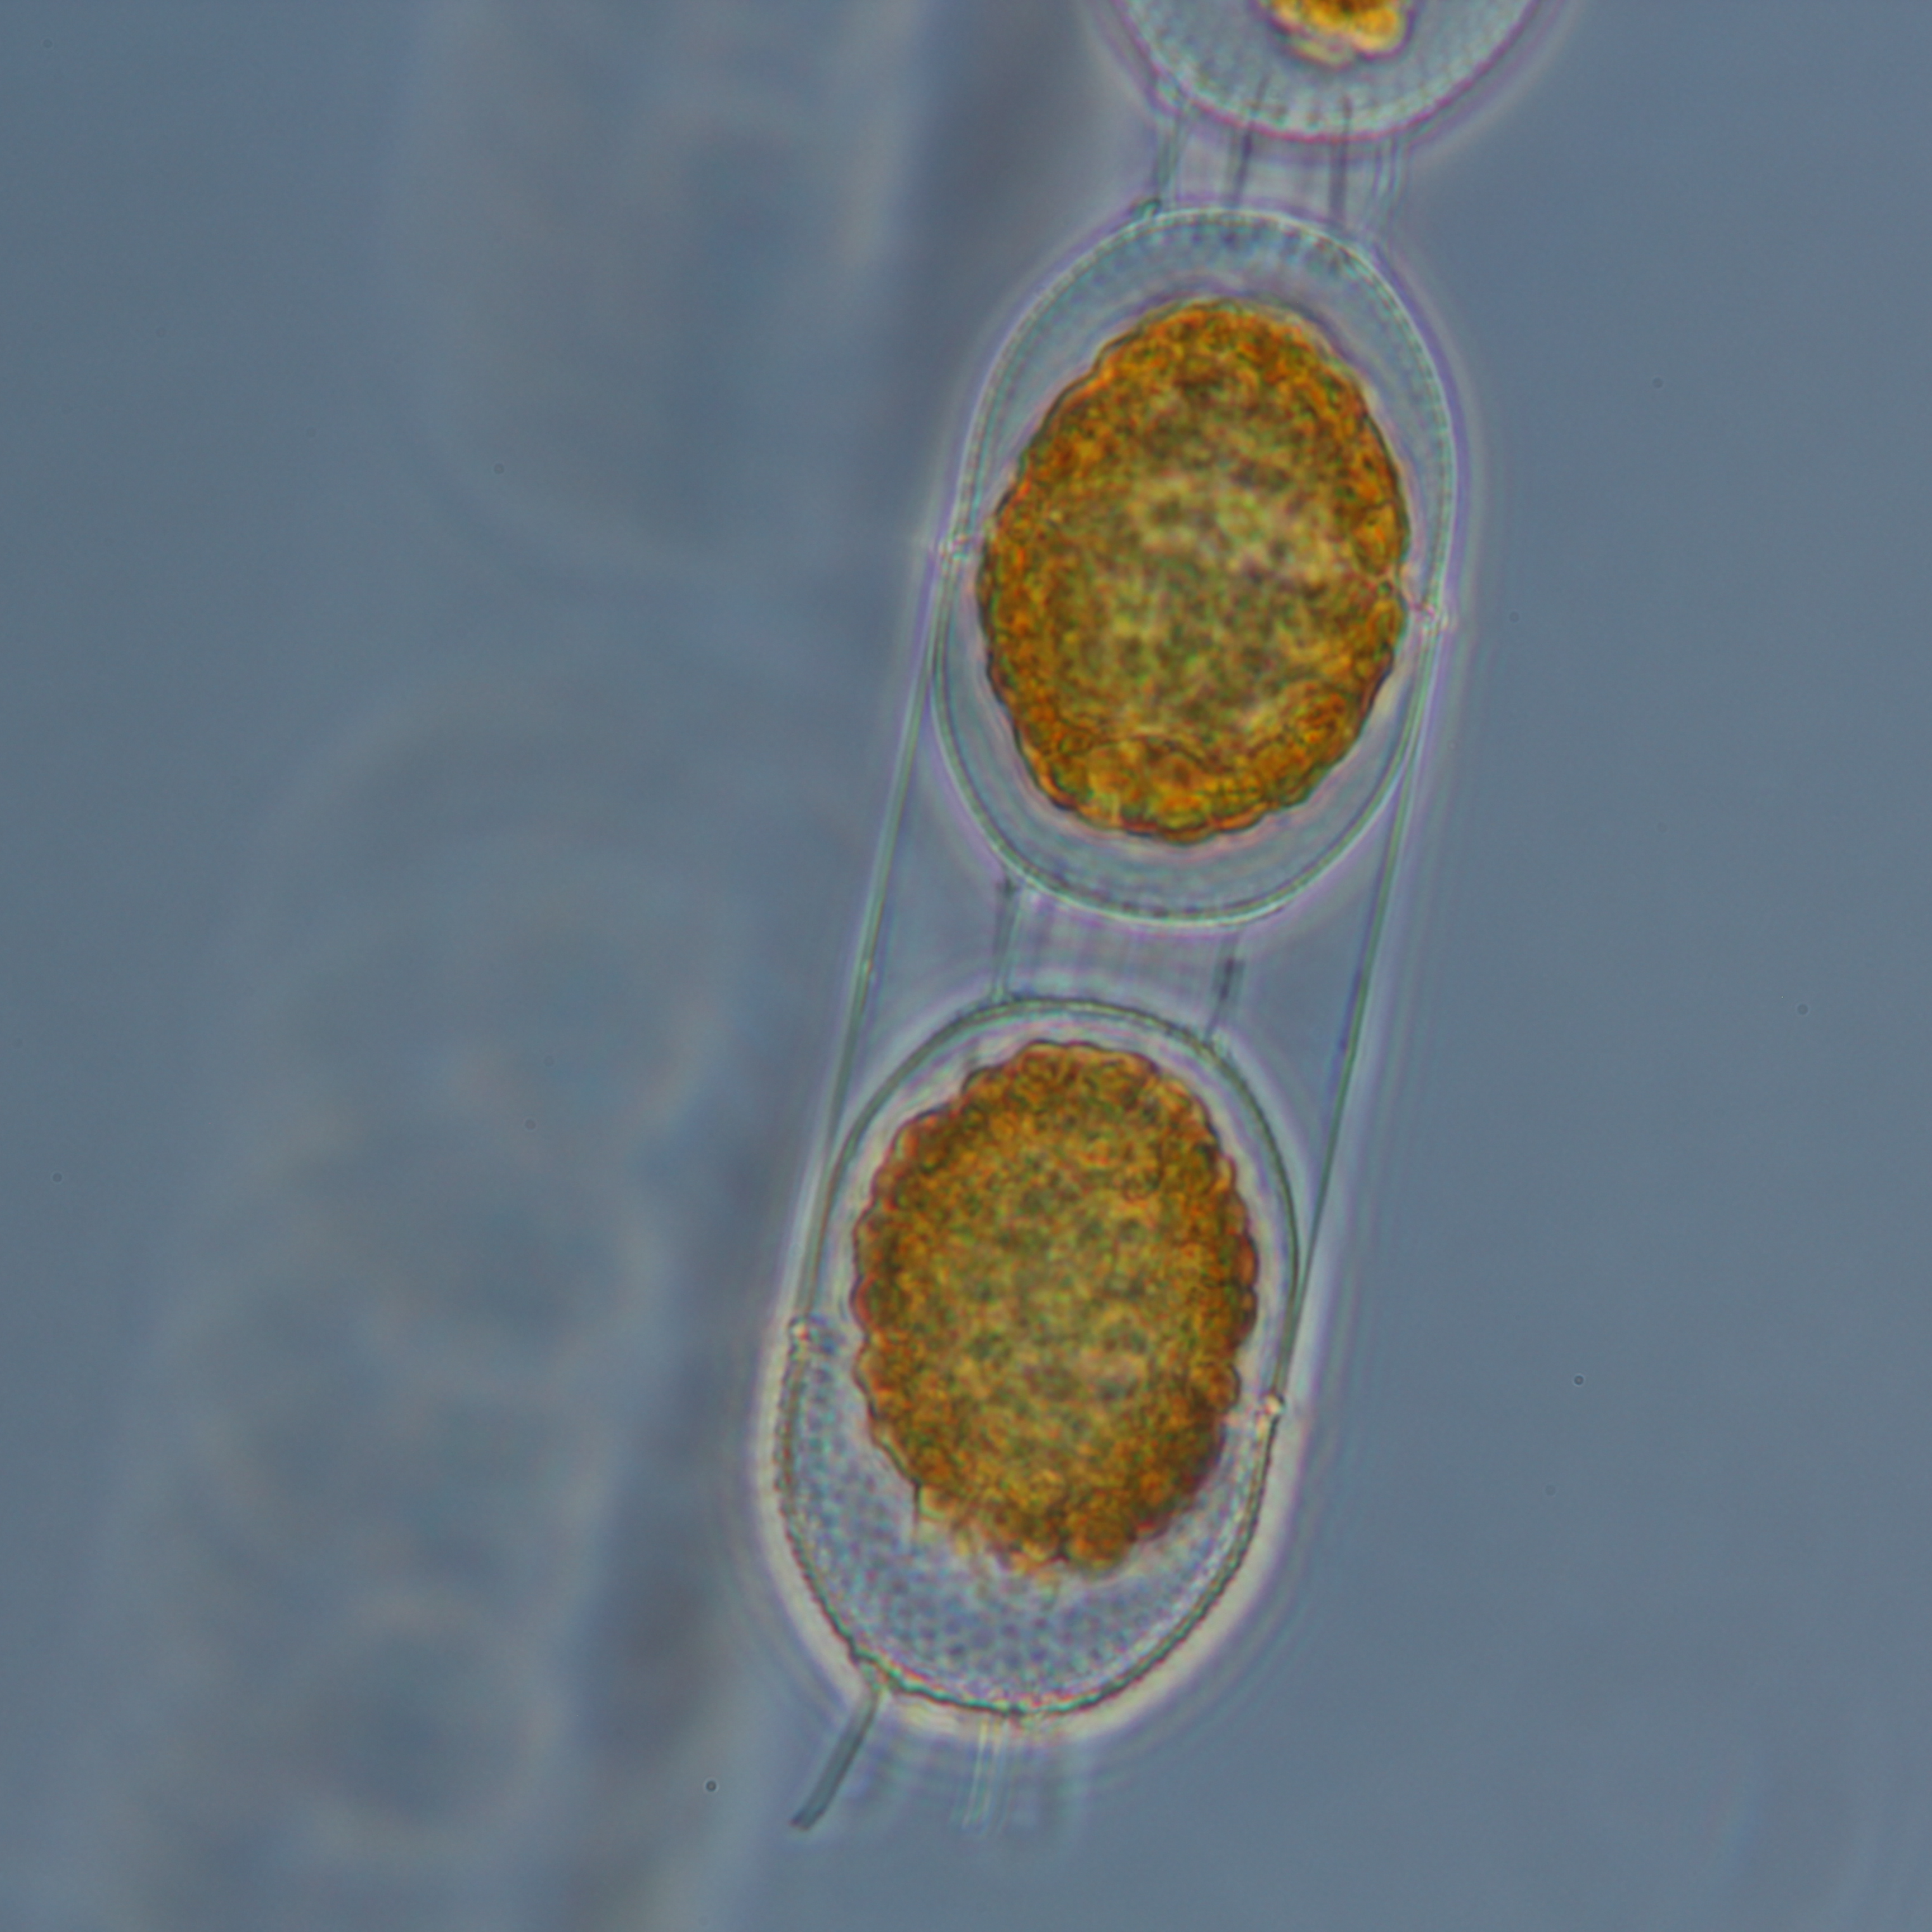
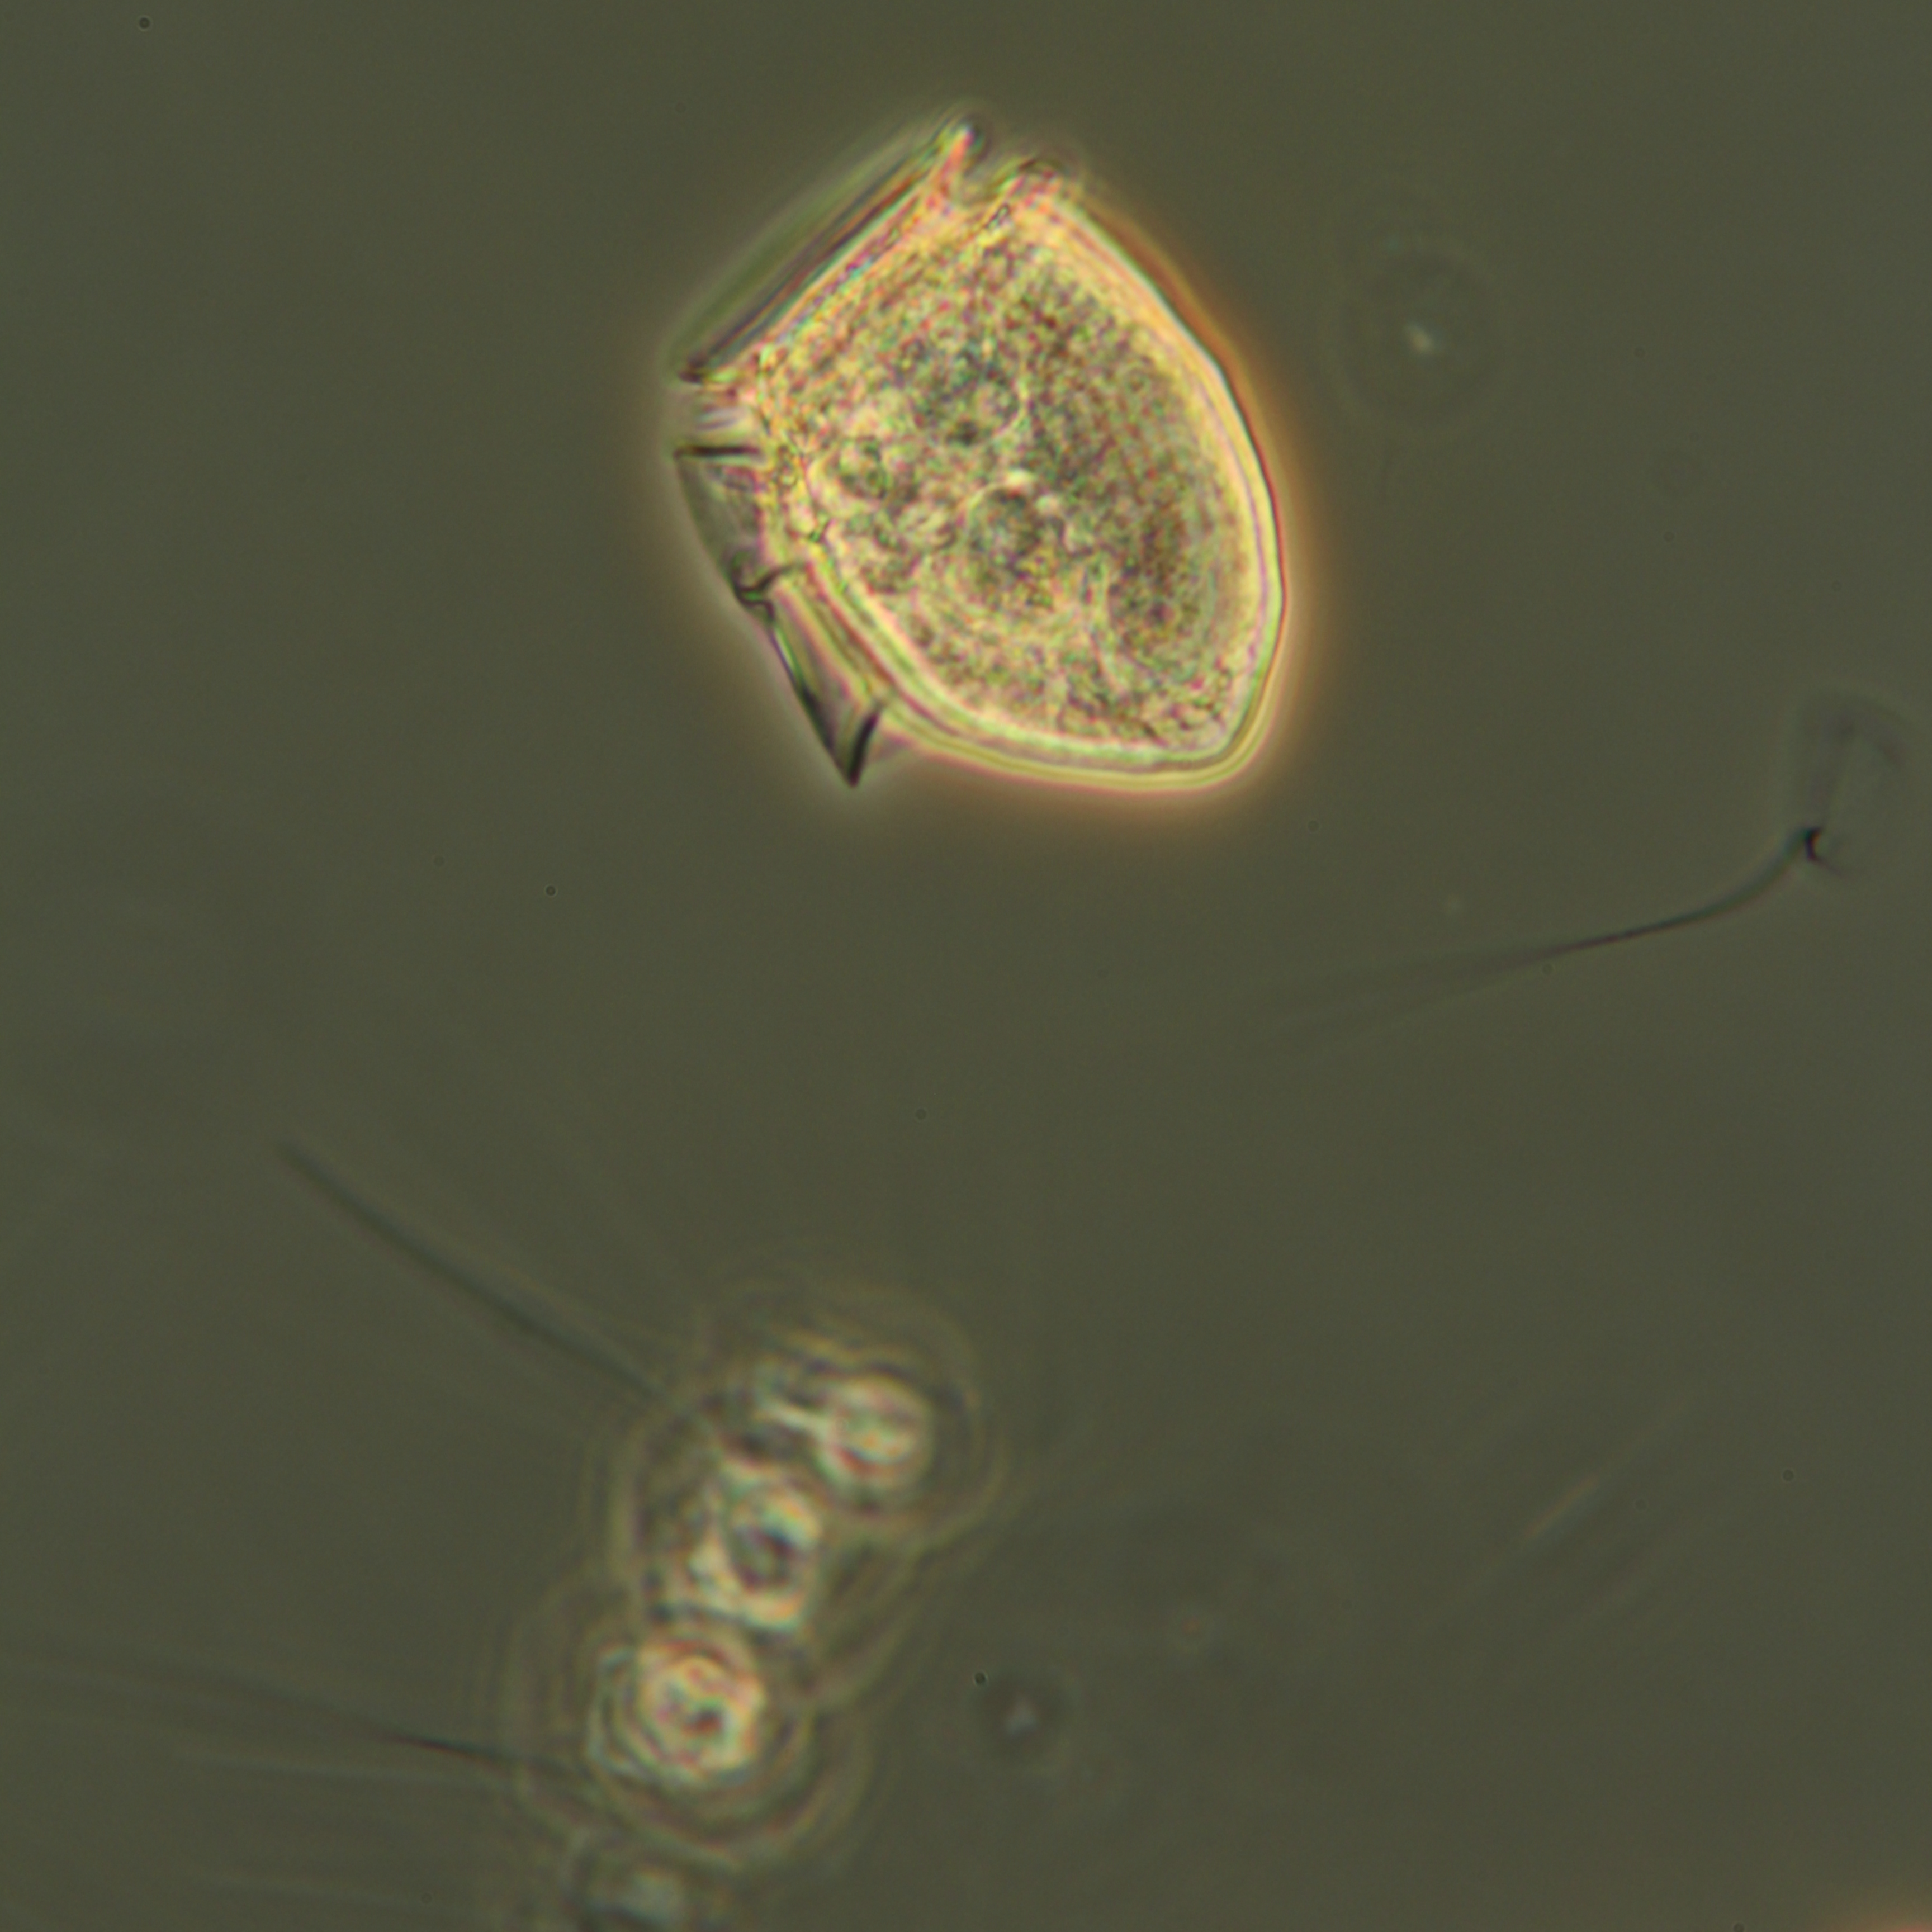
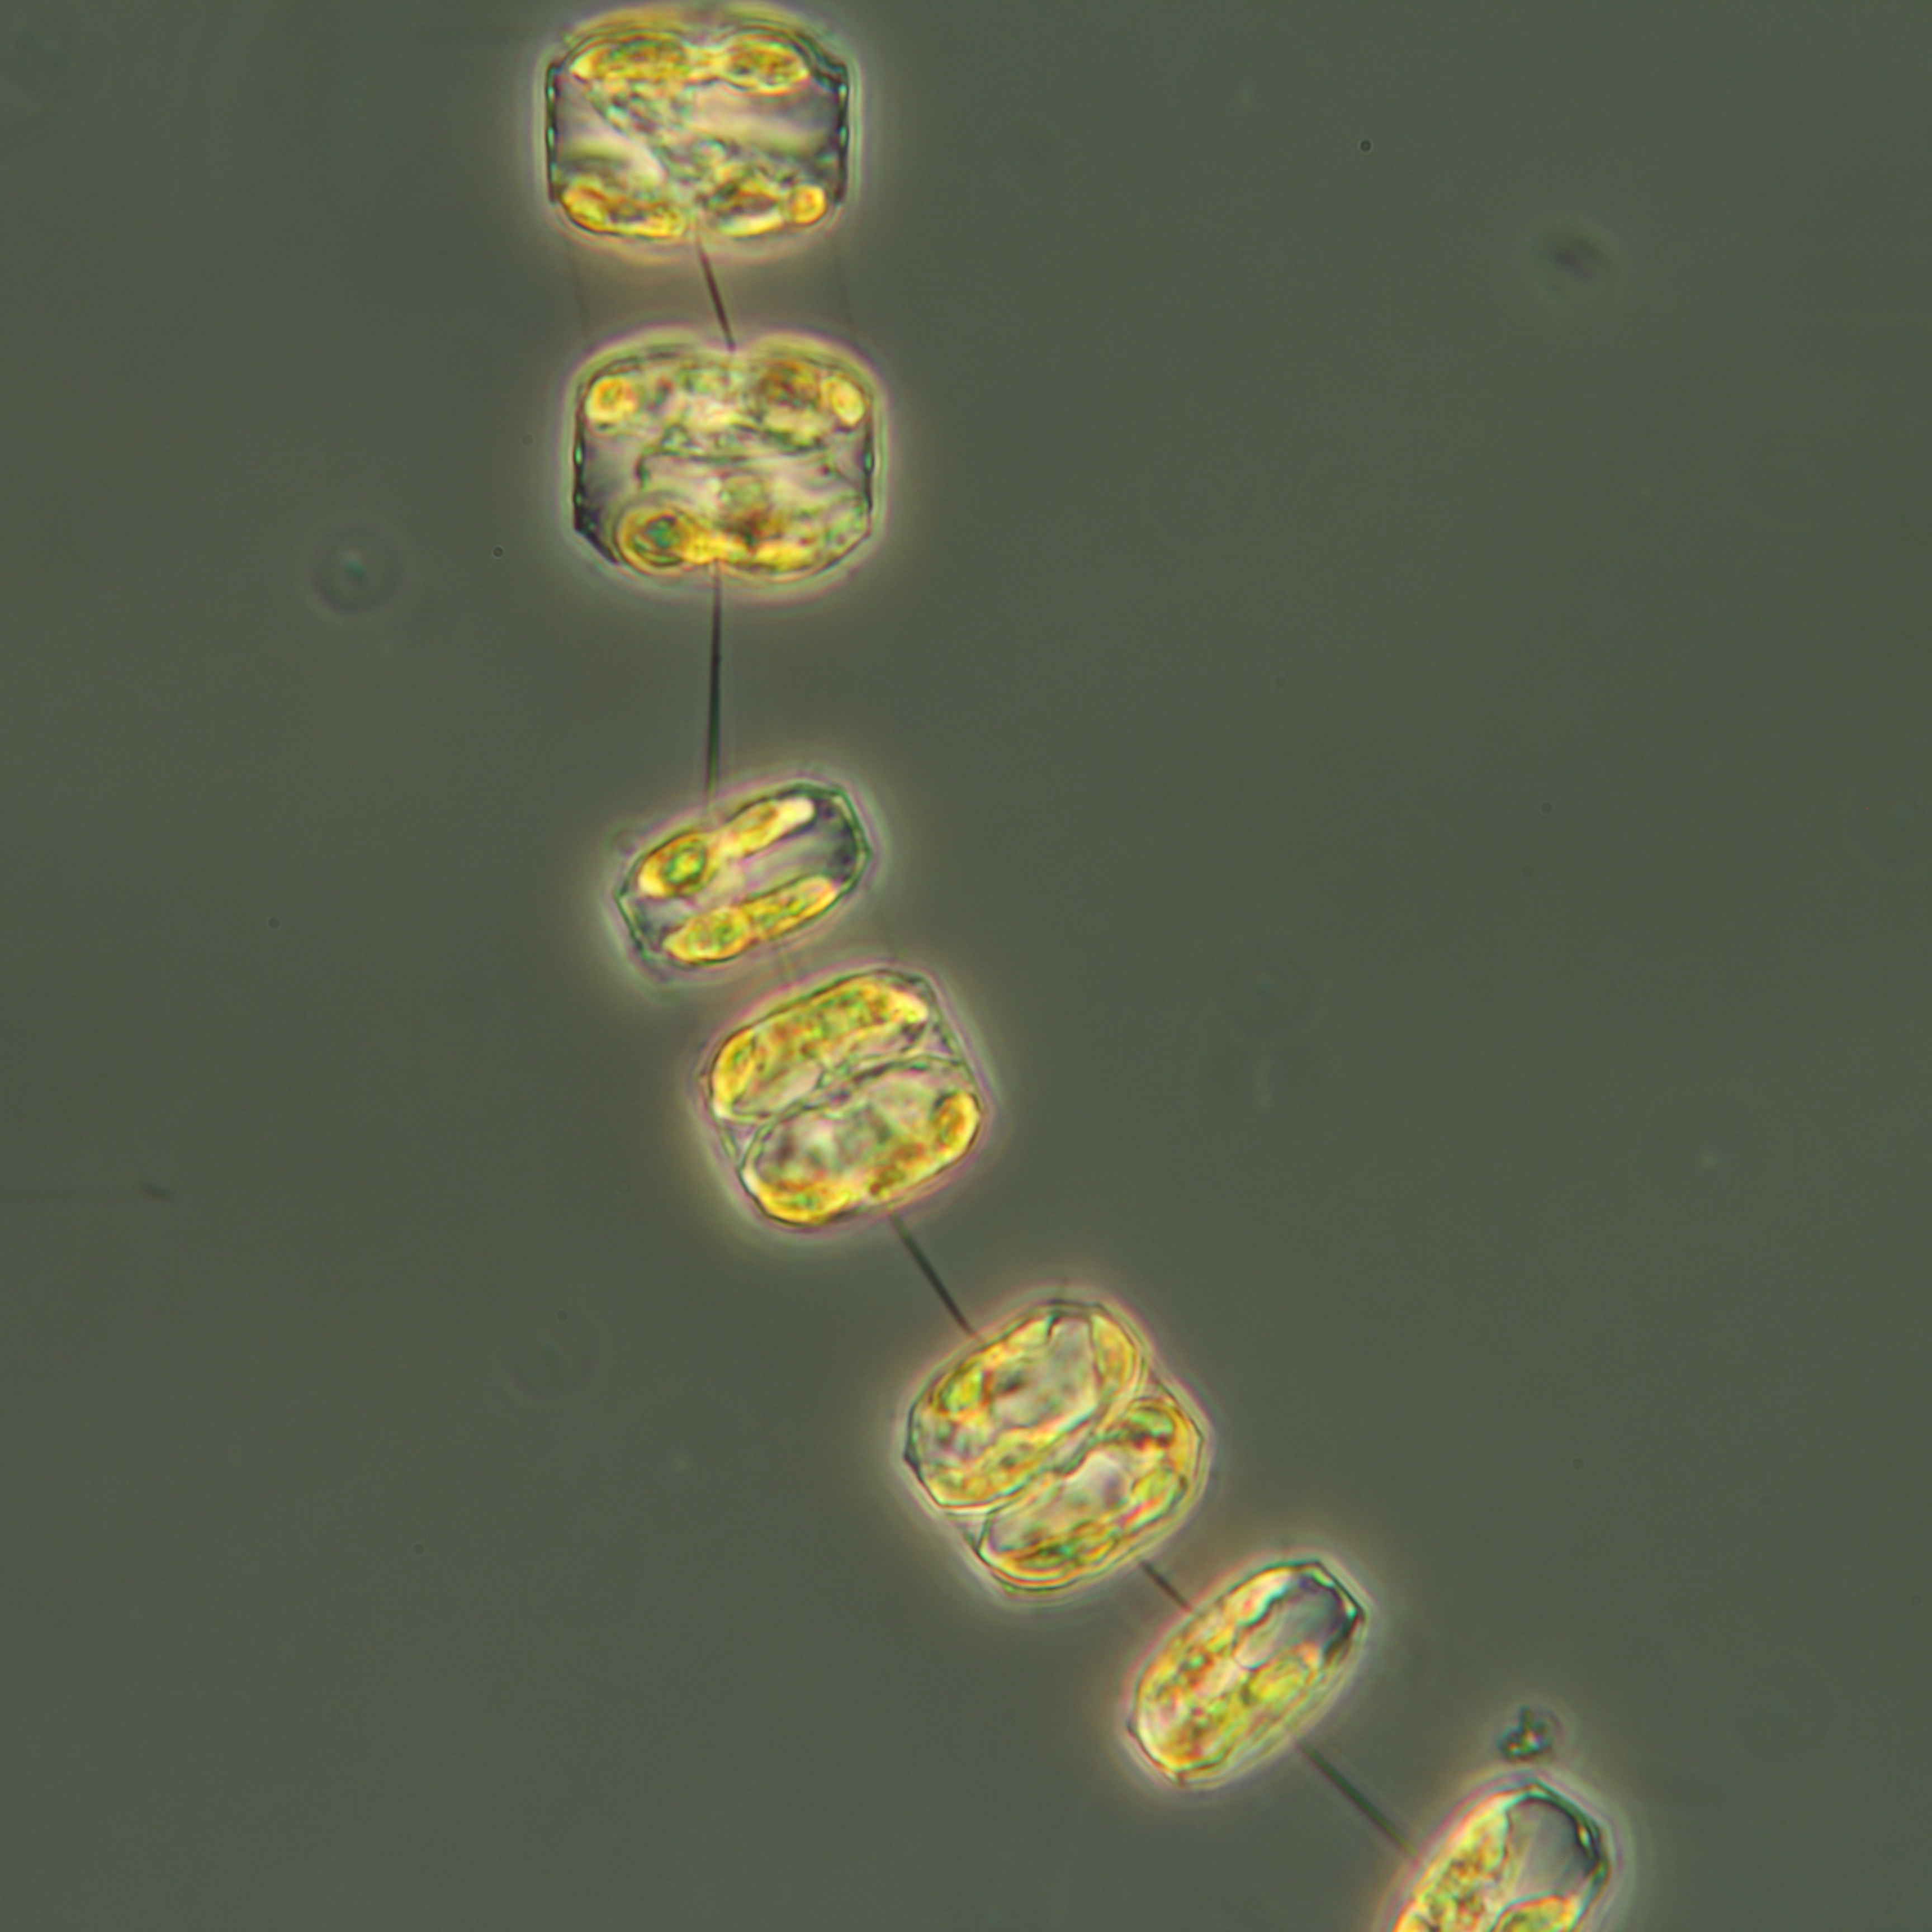
Figure 3. Examples of phytoplankton species observed in the samples using microscopy. The photos shown are generally from other samples collected as part of long-term monitoring programmes. The photos do not have the same scale.
Top row: left: Proboscia alata (a diatom), top middle left: Tripos muelleri (a dinoflagellate), top middle right: Octactis speculum (a silicoflagellate), top right: Skeletonema marinoi (a diatom). Photos by Bengt Karlson.
Bottom row: left: Chaetoceros diadema, bottom middle left: Stephanopyxis turris (both diatoms), bottom middle right: Dinophysis acuta (a dinoflagellate), bottom right: Thalassiosira nordenskioldii (a diatom). Photos by Sara Harðardóttir.