2. Methods
2.1 Sampling and filtration
Samples were collected from 13 locations in the Baltic Sea, the North Sea, and the northwestern Atlantic Ocean (Fig. 1, Table 1). Sampling and filtration were conducted following the same protocol (Appendix 1). Briefly, about 5.5 L of seawater was collected from each location and used for both the minimum sample volume experiment and traditional morphology-based phytoplankton analysis (Fig. 2). The seawater was thoroughly mixed, and subsamples of varying volumes (1000 mL, 500 mL, 200 mL, 20 mL) were taken for filtration. Different sample volumes were individually filtered through 0.4 µm pore size membrane filters (Whatman, product nr. 10417712) in triplicates. After filtration, the filters were stored at -20 °C to prevent DNA degradation. Samples intended for microscope analysis were preserved with acid Lugol`s or formalin solution according to the routine monitoring protocols used by the participating institutes.
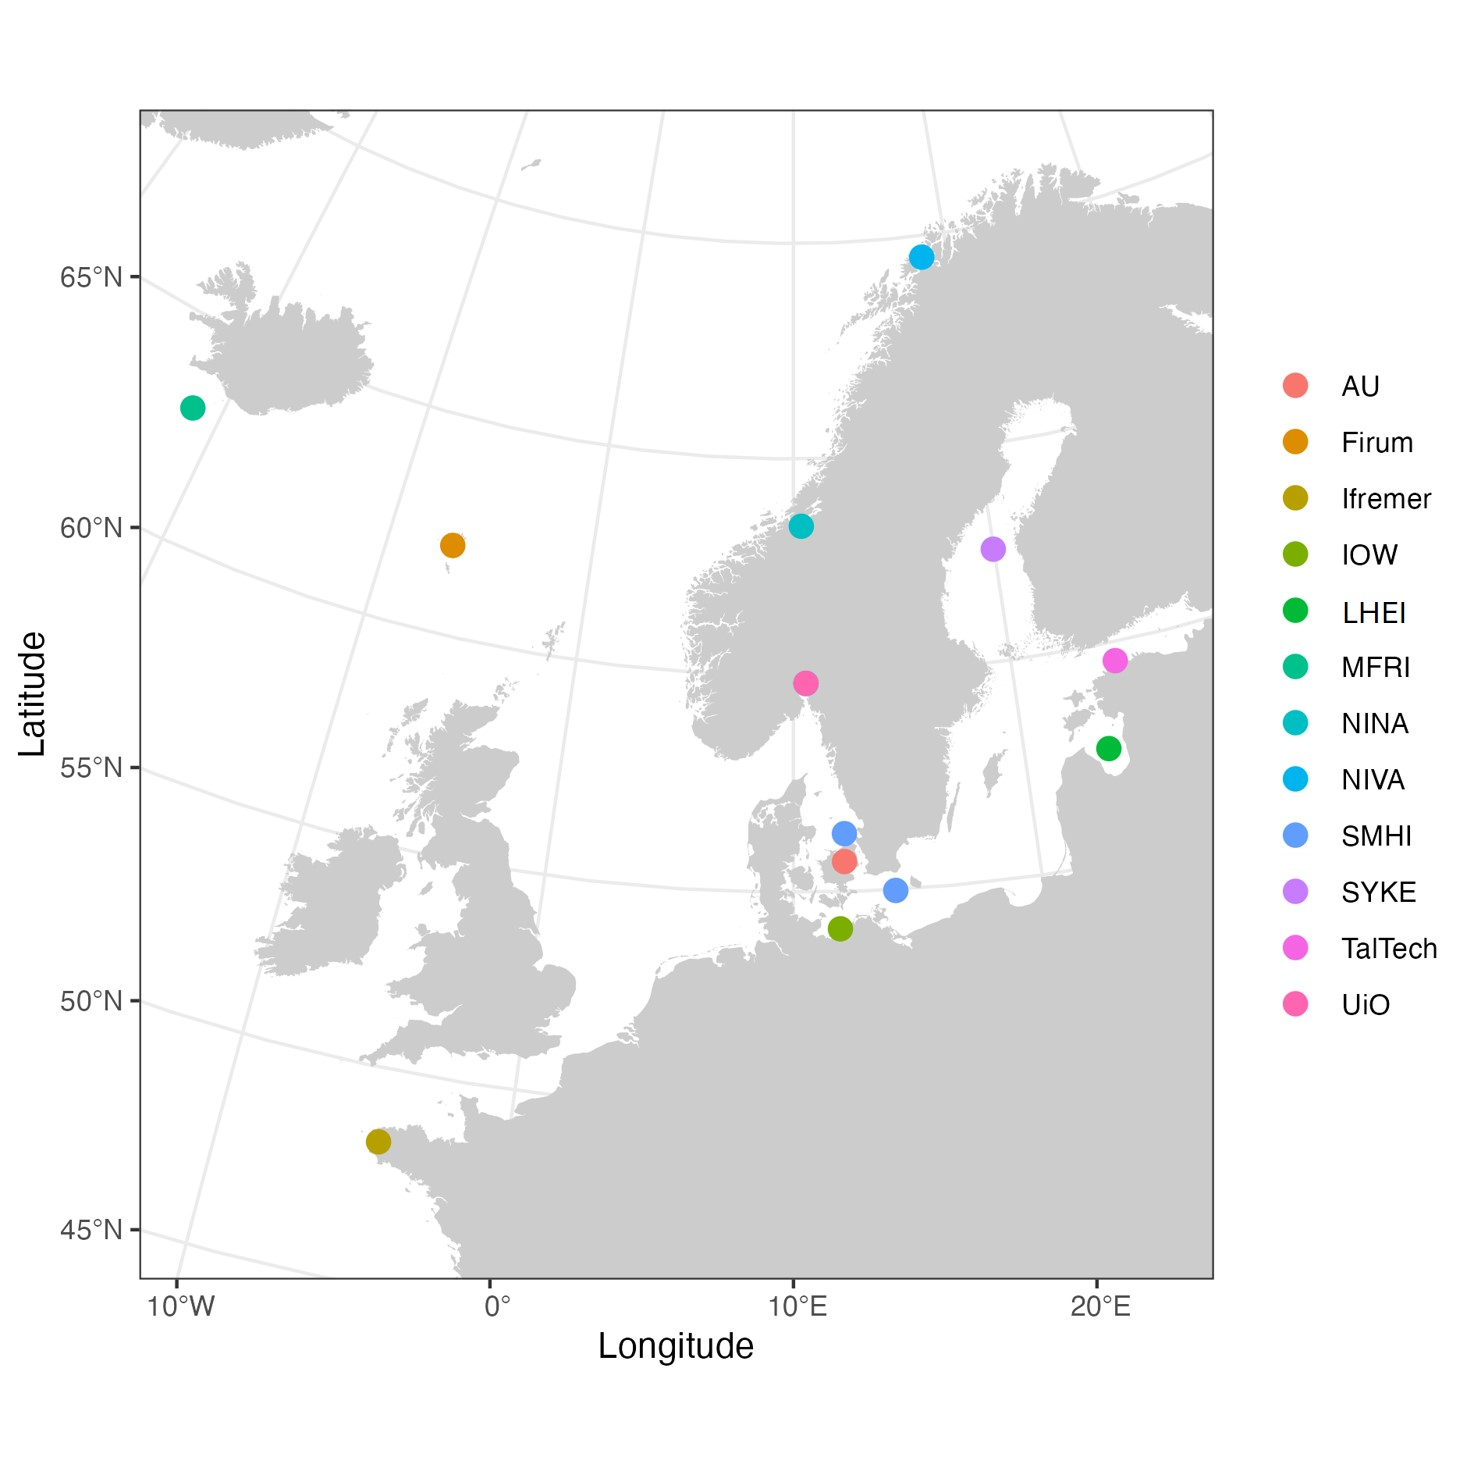
Figure 1. Sampling locations. The full names of the participating organizations are provided under Authors and Affiliations.
2.2 DNA extraction, amplification, and bioinformatics analyses
DNA was extracted from the filters and amplification of the DNA was done using the same protocol for all samples (Appendix 2). DNA was extracted using a commercial kit (Qiagen, product nr. 69506) and universal molecular markers targeting the V7-V9 variable region of the 18S ribosomal gene (Dzhembekova et al. 2018) were used. Success of the amplification was confirmed via gel electrophoresis. The samples were purified, amplified with index primers, and sequenced at the Genomics Core Facility, University of Tartu, Estonia. The resulting sequences were analysed using an in-house bioinformatics pipeline (Nagai et al. 2022). Taxonomic identification of the sequences was performed using the NCBI database.
2.2 Data analysis
Sequences associated with fungi, macroalgae, and vertebrates were removed from the final dataset to focus exclusively on phytoplankton and microzooplankton species. To ensure reliable identification of species at the highest taxonomic level using the eDNA approach, only sequences with ≥99% similarity to entries in the database were included in the final analysis. To compare differences between sample volumes, an analysis of variance (ANOVA) test was conducted based on average phytoplankton and microzooplankton abundance per volume. Harmful algal bloom species were determined based on the IOC-UNESCO Taxonomic Reference List of Harmful Micro Algae (Lundholm et al. 2024).
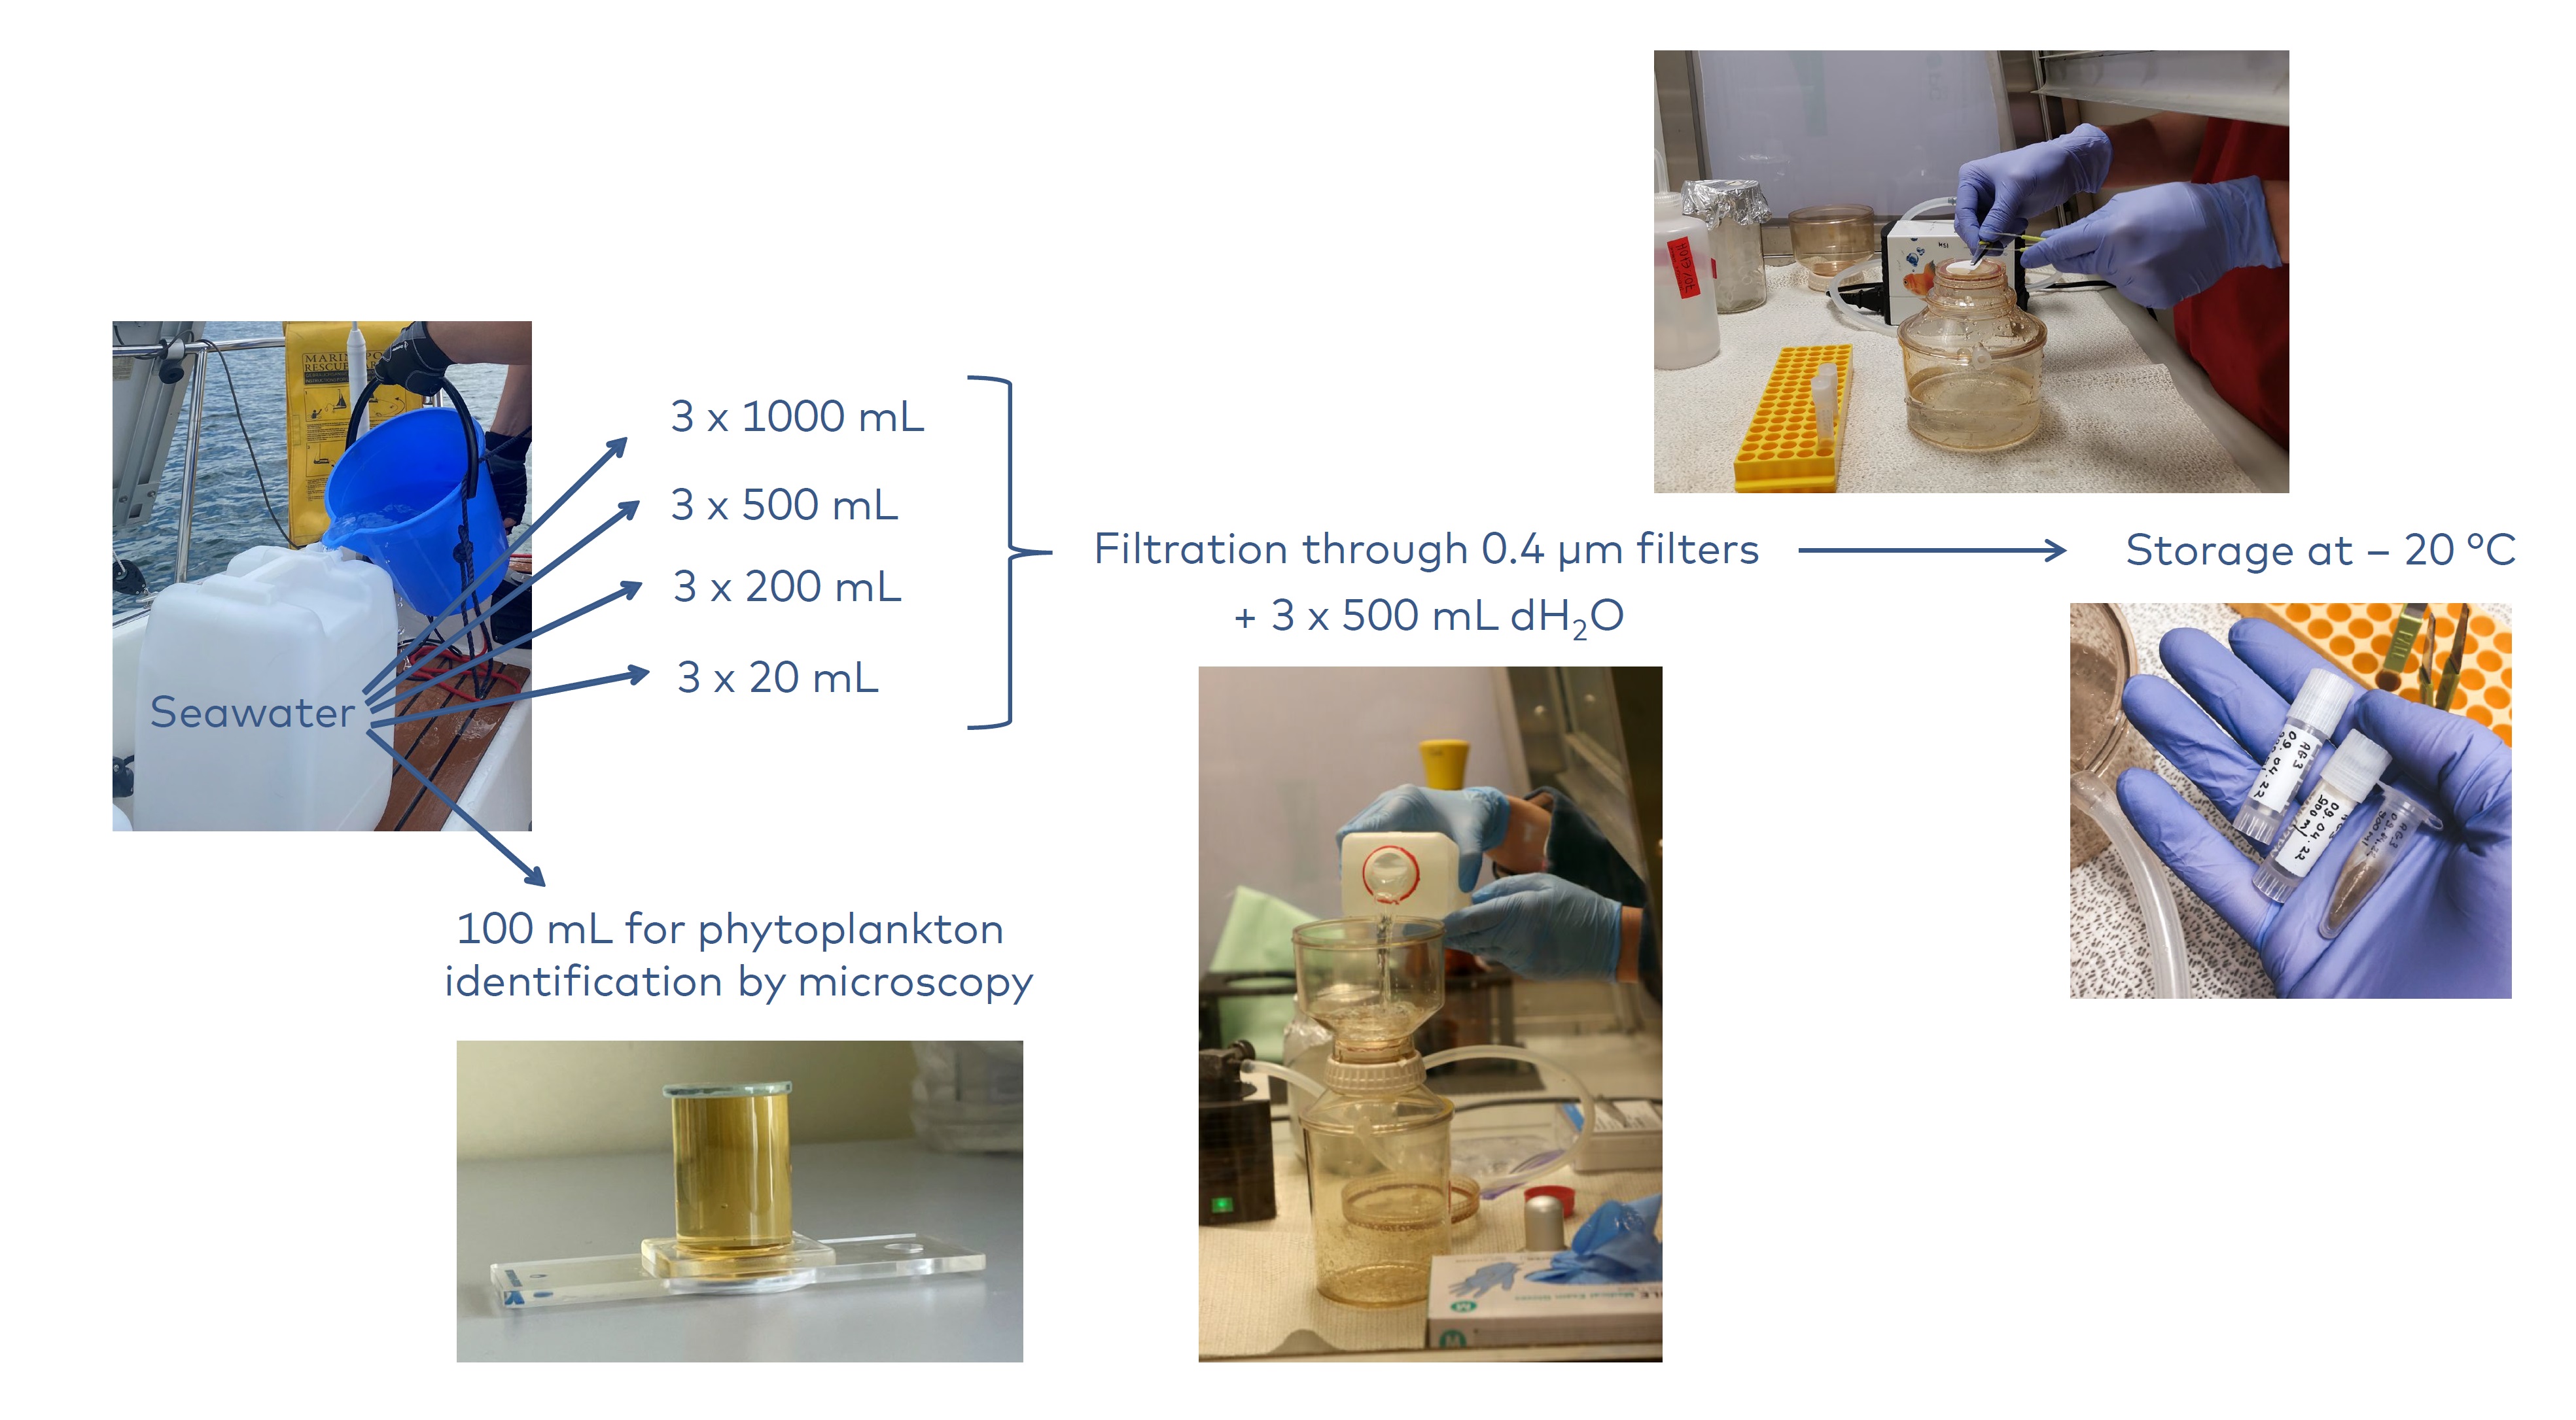
Figure 2. Overview of sampling and filtration. Photos by Sirje Sildever, Marlene Kaljumäe, and Kristian Pärt.