How specific human activities impact the marine ecosystem
Sea and shore-based human activities preventing good ecosystem state
The pressures Hydromorphological alteration, Physical alteration of bed/shore by navigation and Physical alteration of bed/shore by flood protection are the major physical pressures in the Baltic coastal waters according to the WFD reporting of the EU member states. Dredging for recreational, construction or navigational purposes is the main activity causing this pressure in the region.
HELCOM (2023) HELCOM Thematic assessment of spatial distribution of pressures and impacts 2016–2021. Baltic Sea Environment Proceedings No. 189.
The HELCOM holistic assessment indicates that physical disturbance to the seabed is significantly higher in the southern areas. While this geographical difference between areas is clear, more interesting are the activities causing this difference. Re-calculation of the HELCOM data shows that the mobile bottom-contacting fishing gears cause the highest proportion of the physical disturbance in the southern Baltic Sea (south of Gotland), dredging (both small-scale dredging and regulated dredging) is a major contributor in the northern parts, and shipping in shallow areas is a major contributor in all the sea areas.
Laamanen et al. (2021) Impacts on seabed: Approaches for assessment as step towards successful measures. HELCOM ACTION report. Available at: https://helcom.fi/helcom-at-work/projects/action/
COMA meta-analysis of seabed impacts from human activities
A meta-analysis of 132 studies of human impacts on the seafloor indicates clear differences in severity of human activities. The database included 1066 observed results of various impacts which are replicated and include control measurements. We analysed separately the responses of marine benthic animals and underwater macrophytes.
Seven out of nine human activities caused predominantly negative impacts on benthic fauna abundance in the northern cool temperate region (Fig. 2). The most impacting activities were maritime traffic, shoreline structures, bottom trawling, dredging and disposal of dredged spoils. Positive impacts on fauna abundance were seen from mariculture and offshore structures. The smaller sample size of the Baltic Sea studies showed comparable results (Fig. 2).
The underwater vegetation in the northern cool temperate region was impacted most strongly by plant removal, bottom-trawling, shoreline structures, mariculture, boat traffic, anchoring and dredging (Fig. 2). The Baltic Sea results showed the same pattern.
The responses are however species-specific and highest for eelgrass (Zostera marina), charophytes (Chara spp.) and the sea pen Pennatula phosphorea.
Nyström Sandman et al. (2024) Mänsklig påverkan och effekter på bentisk miljö. Metoder för bedömning av havsbottnens integritet i svenska hav. Naturvårdsverket (in preparation).
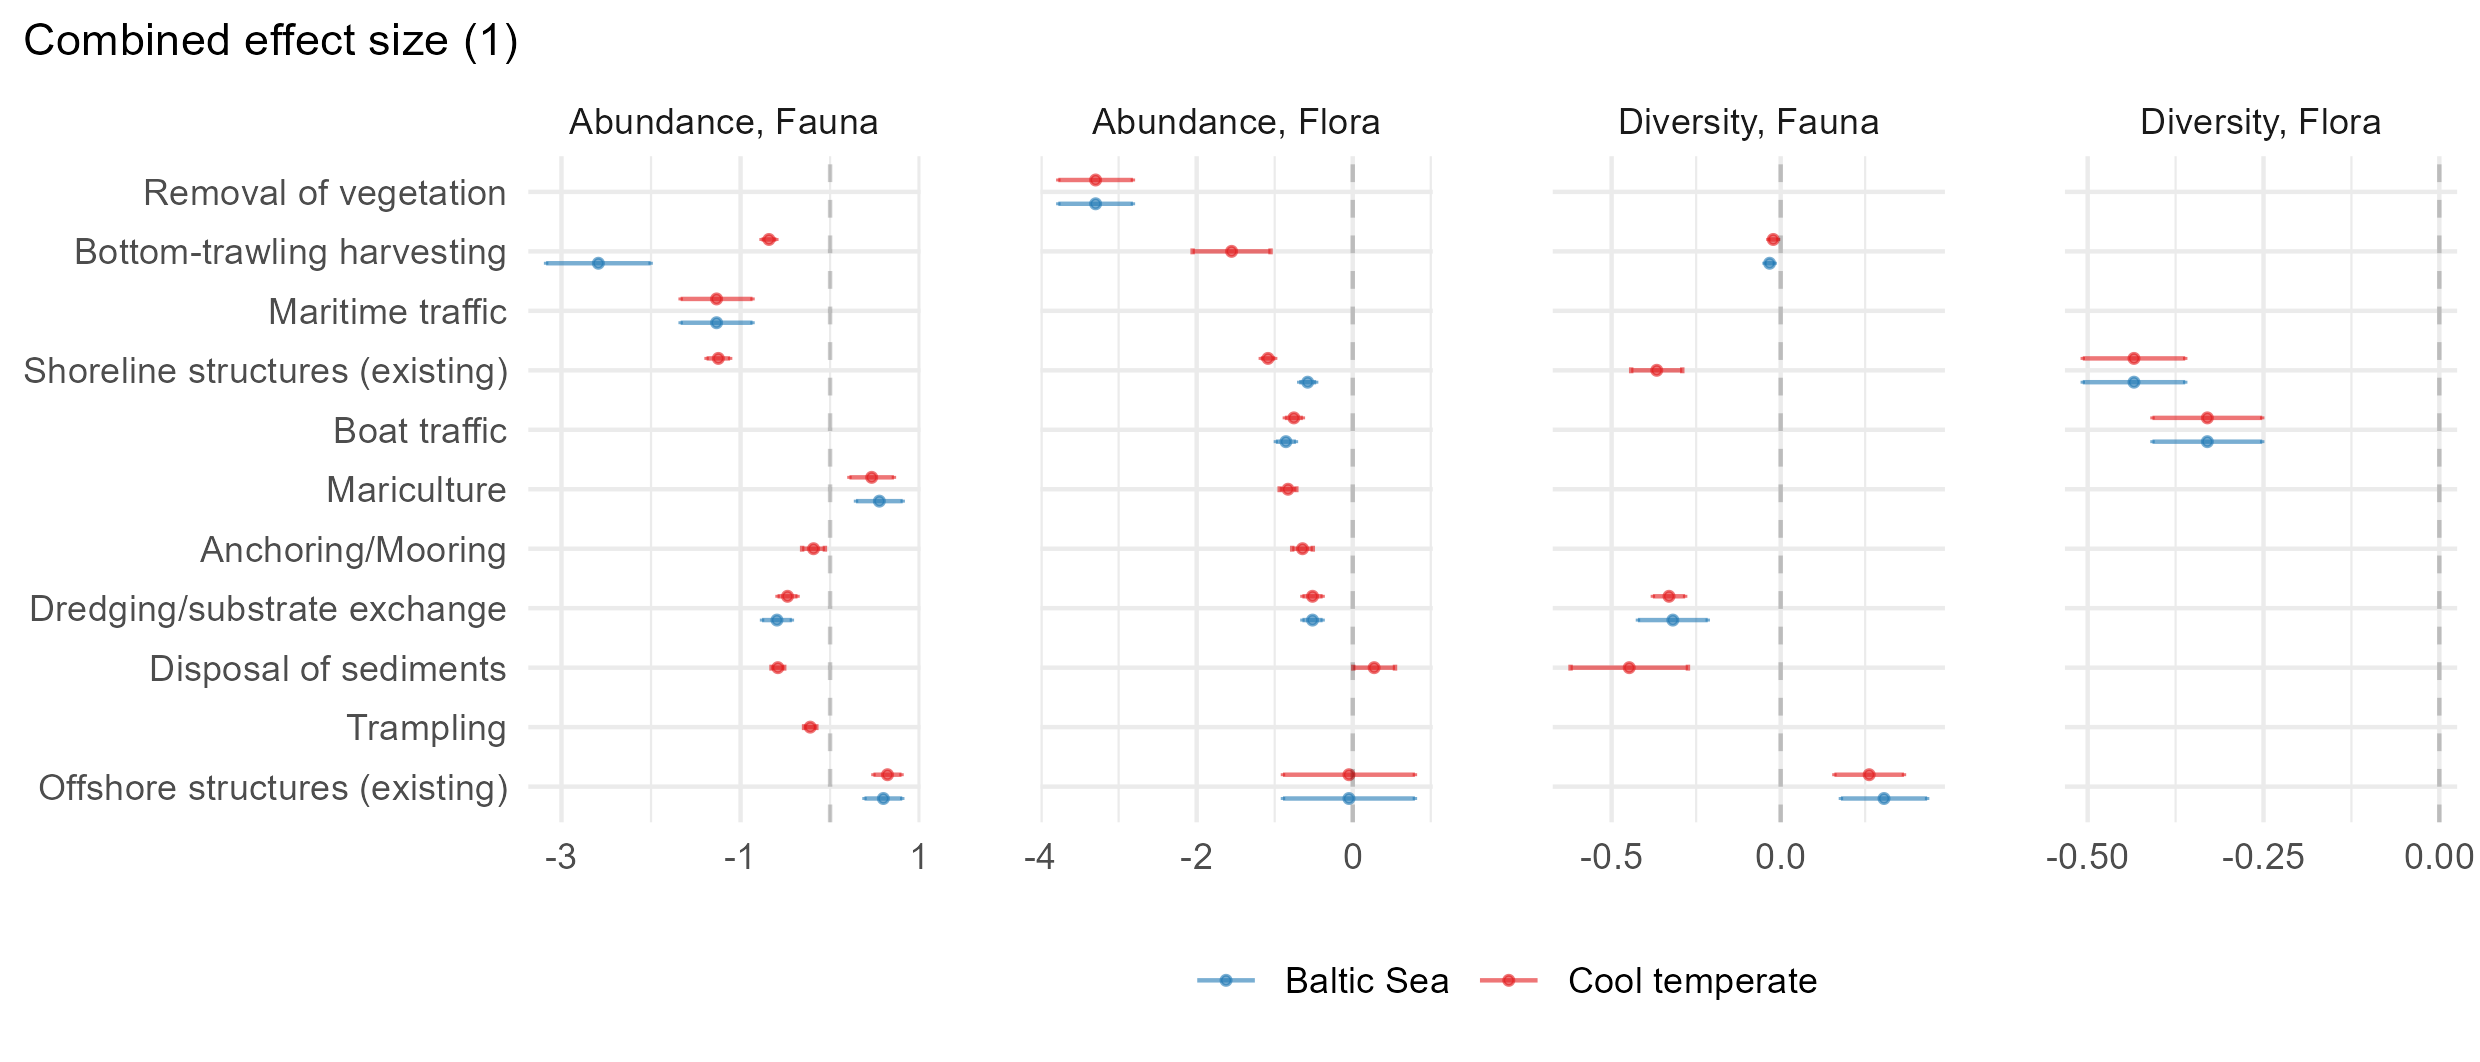
Figure 2. Responses (mean effect size and SD) of fauna and flora abundance and diversity to human activities in the Baltic Sea and the cool temperate region of the northern hemisphere.
COMA case study: Depth limit of eelgrass in response to eutrophication and mussel dredging
Eelgrass meadows in shallow coastal waters are under threat from several pressures, including eutrophication, climate change and physical disturbance. Krause-Jensen et al. (2021) conceptualised three main pressures on eelgrass meadows in shallow waters, where deeper eelgrass populations are shaded out by reduced light transparency caused by eutrophication and physically destroyed by bottom trawling while shallower eelgrass populations are vulnerable to warming and heat waves. The COMA case study exemplifies this by data from Nibe-Gjøl Bredning (Limfjorden), an estuarine complex in northern Denmark.
The depth limits of eelgrass in Nibe-Gjøl Bredning decreased from 1989 to around 2000 as a result of decreased water transparency caused by high nitrogen and phosphorus concentrations in the area (Fig. 3A). While the eutrophication stabilized, the depth limit degraded as a result of mussel harvesting starting in the area (Figure 3B). The mussel dredges caused high physical disturbance and sediment resuspension, which reduced the colonisation depths. Recolonisation at deeper depth occurred approximately 4–5 years after mussel dredging ceased. Eelgrass cover in the nearshore waters did not indicate high sensitivity to warming; neither to a general warm summer with a high average temperature or to shorter heatwaves indicated by high maximum temperature.
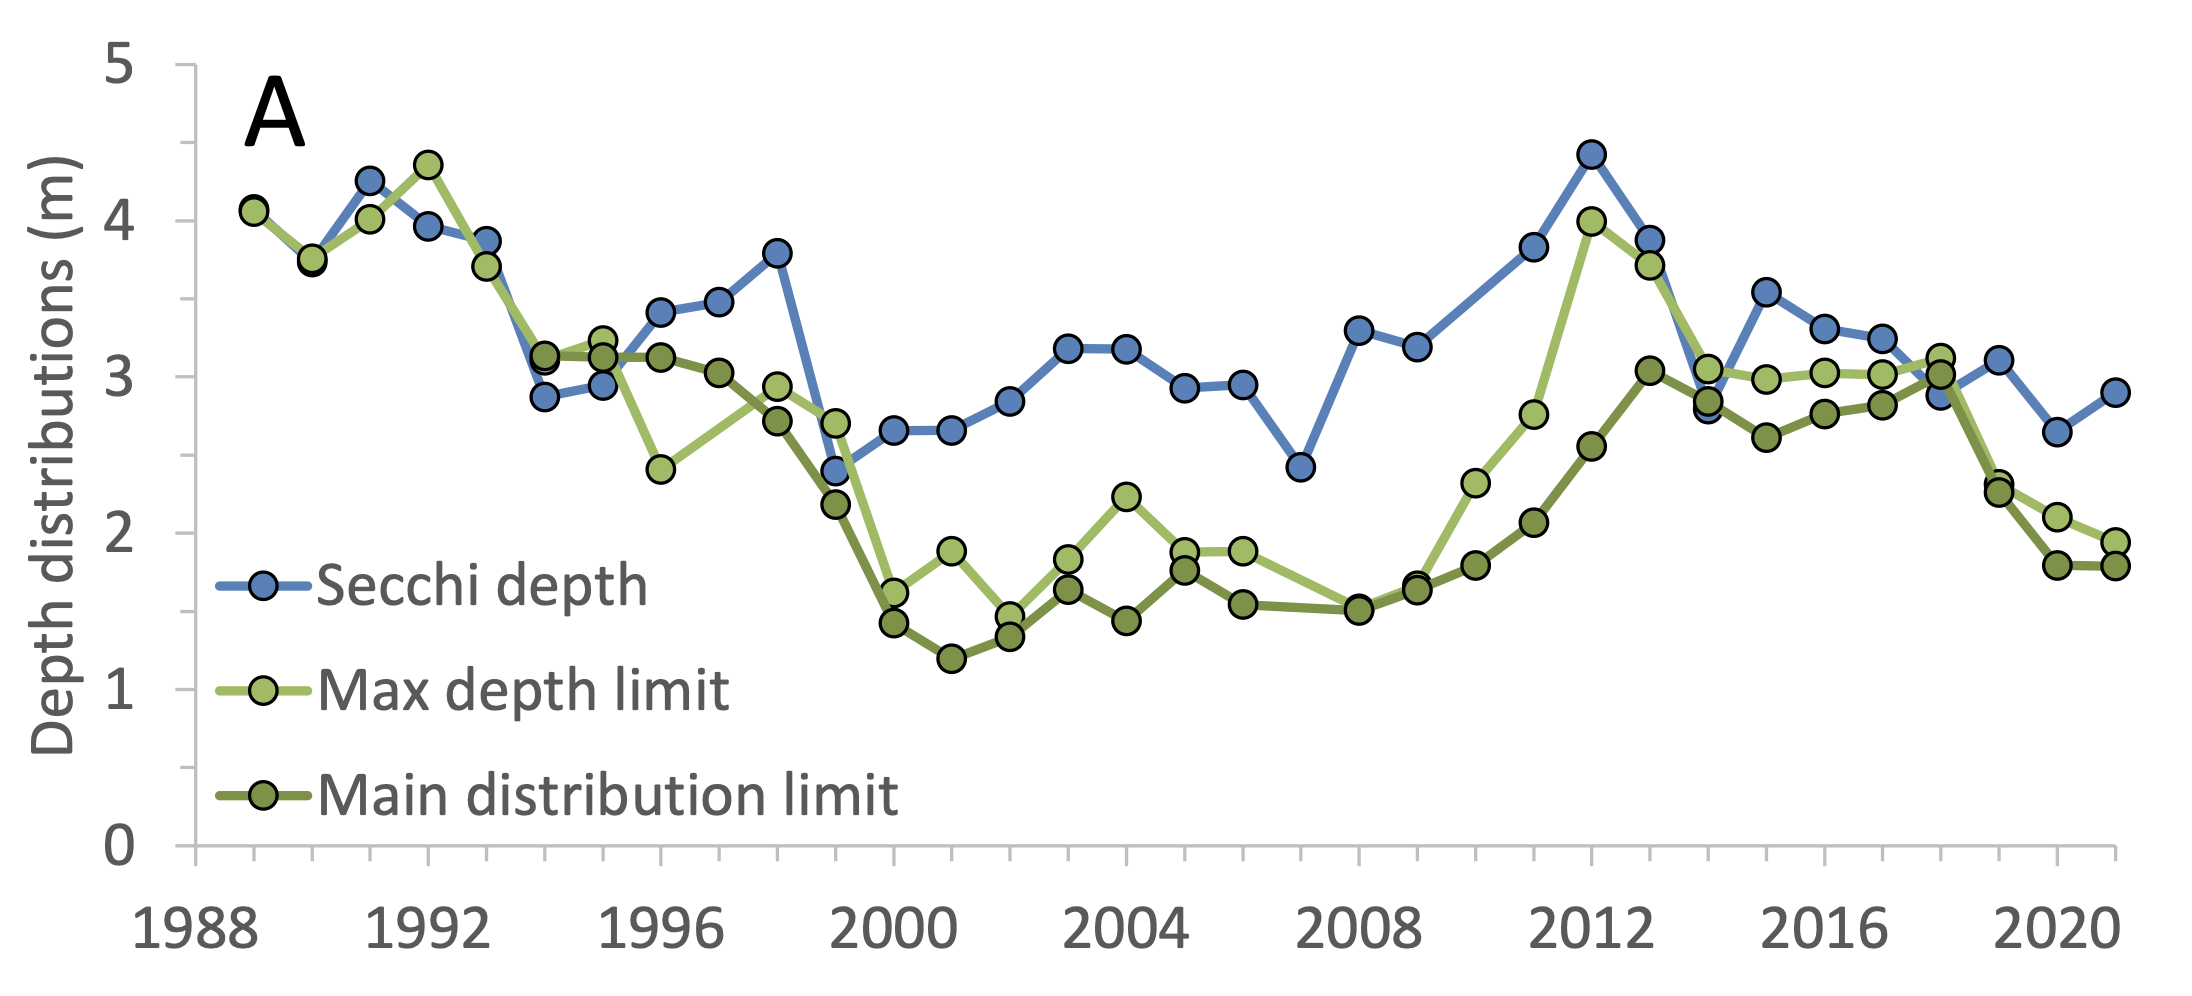
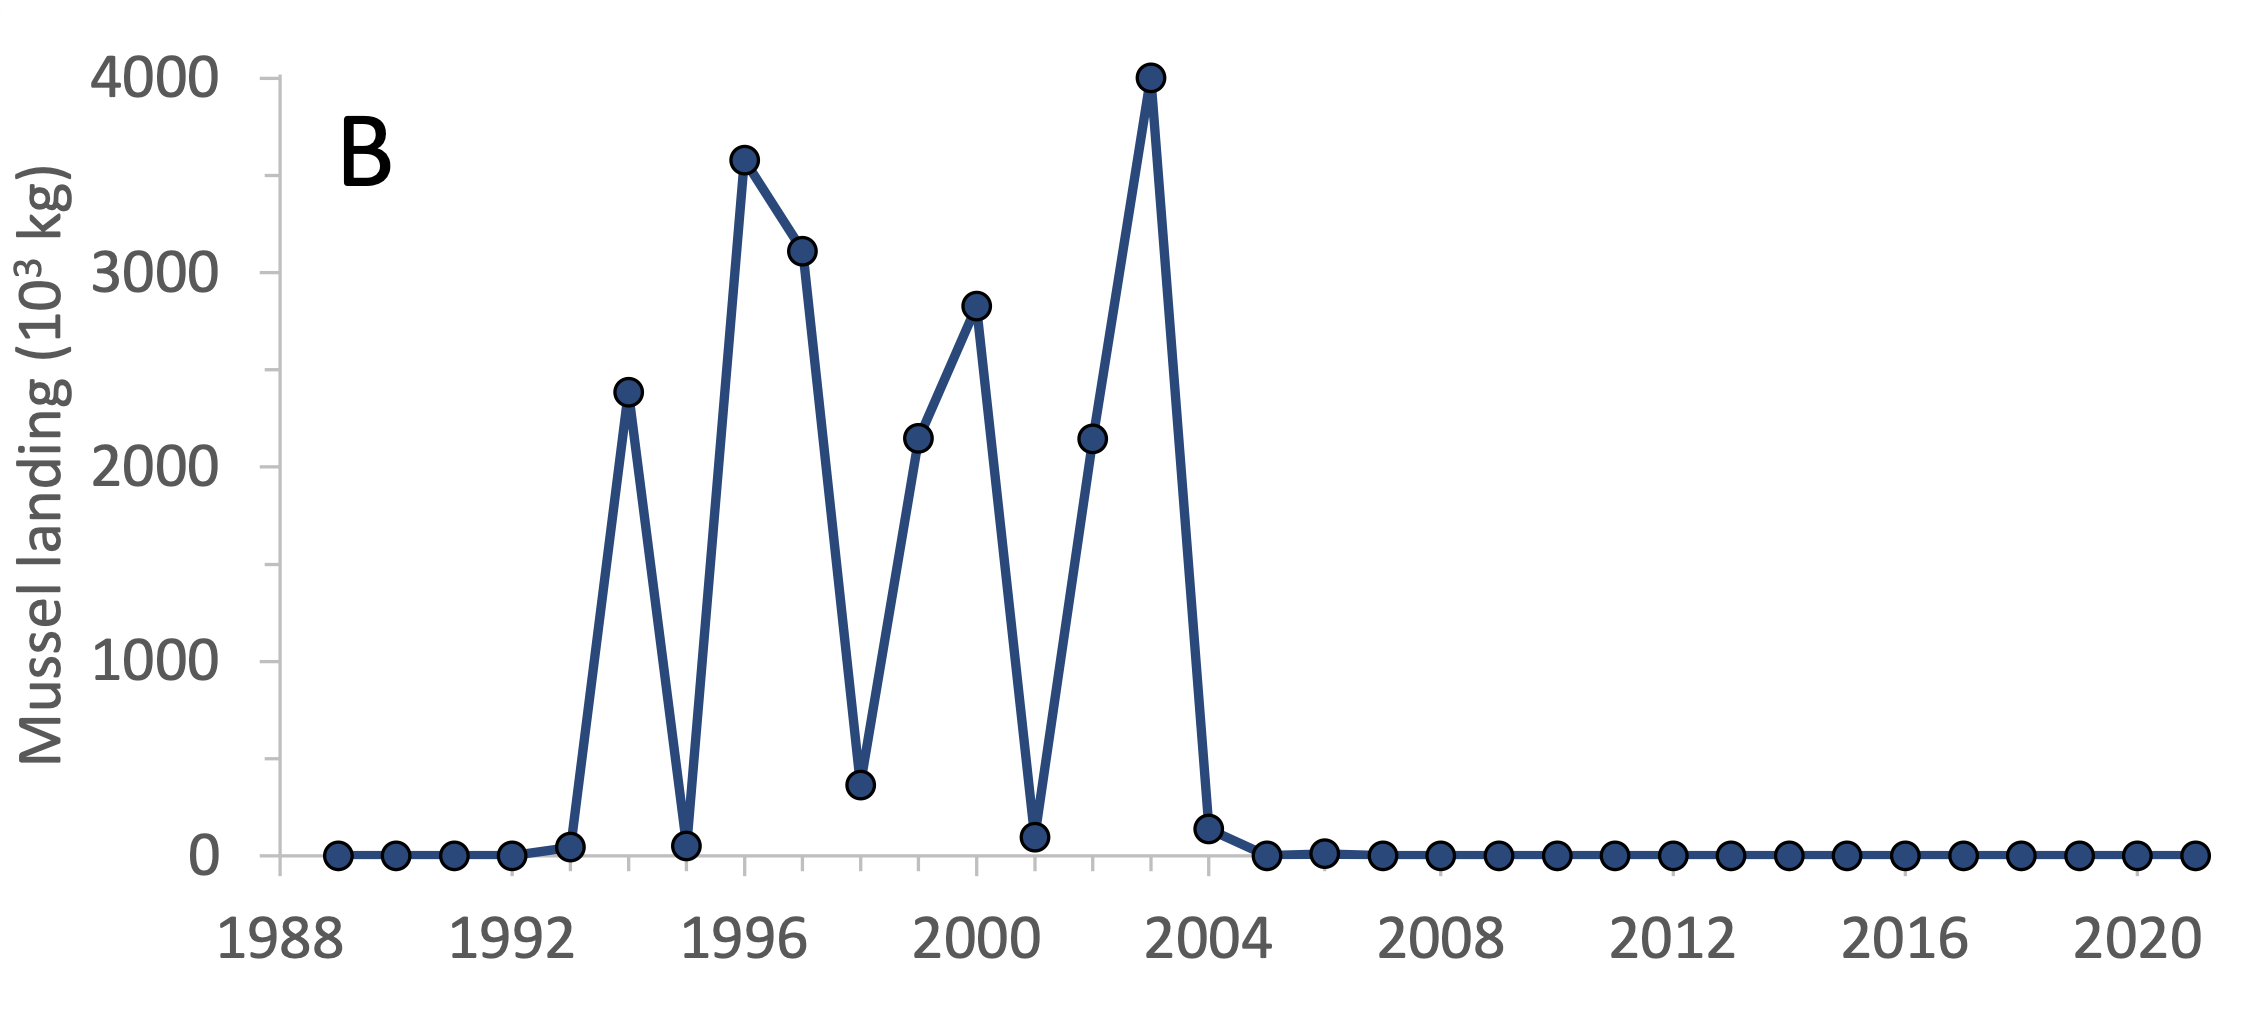
Figure 3. Trends in Nibe-Gjøl Bredning for A) eelgrass depth limits and Secchi depth, B) mussel landings from the area.
COMA case study: Impacts of eutrophication, boating and dredging on Finnish reef and lagoon vegetation
Underwater reefs and lagoons along the Finnish coast host substantial biological diversity, but are at the same time subjected to multiple interacting human pressures. Eutrophication increases sedimentation and reduces photic depth, resulting in reduced macrophyte cover at deeper depths and altered species composition. While eutrophication persists as a regional problem, human activities have local adverse effects on the ecosystem. In this case study, five different vegetation indicators were tested for evaluating impacts of eutrophication, boating and dredging.
In reefs, eutrophication had substantially strongest effect on four vegetation indicators calculated: macroalgal diversity, deepest macrophyte depth, depth of 10% macroalgal cover, and macrophyte quality index. The macroalgae indicators on reefs were positively associated with increasing Secchi depth and negatively with increasing total phosphorus.
In lagoons, both eutrophication and boating had a negative significant effect on macrophyte quality index which also characterises the vulnerable species of underwater flora (Fig 4). Surprisingly, the effects of dredging were non-significant, even though exploratory analyses showed otherwise.
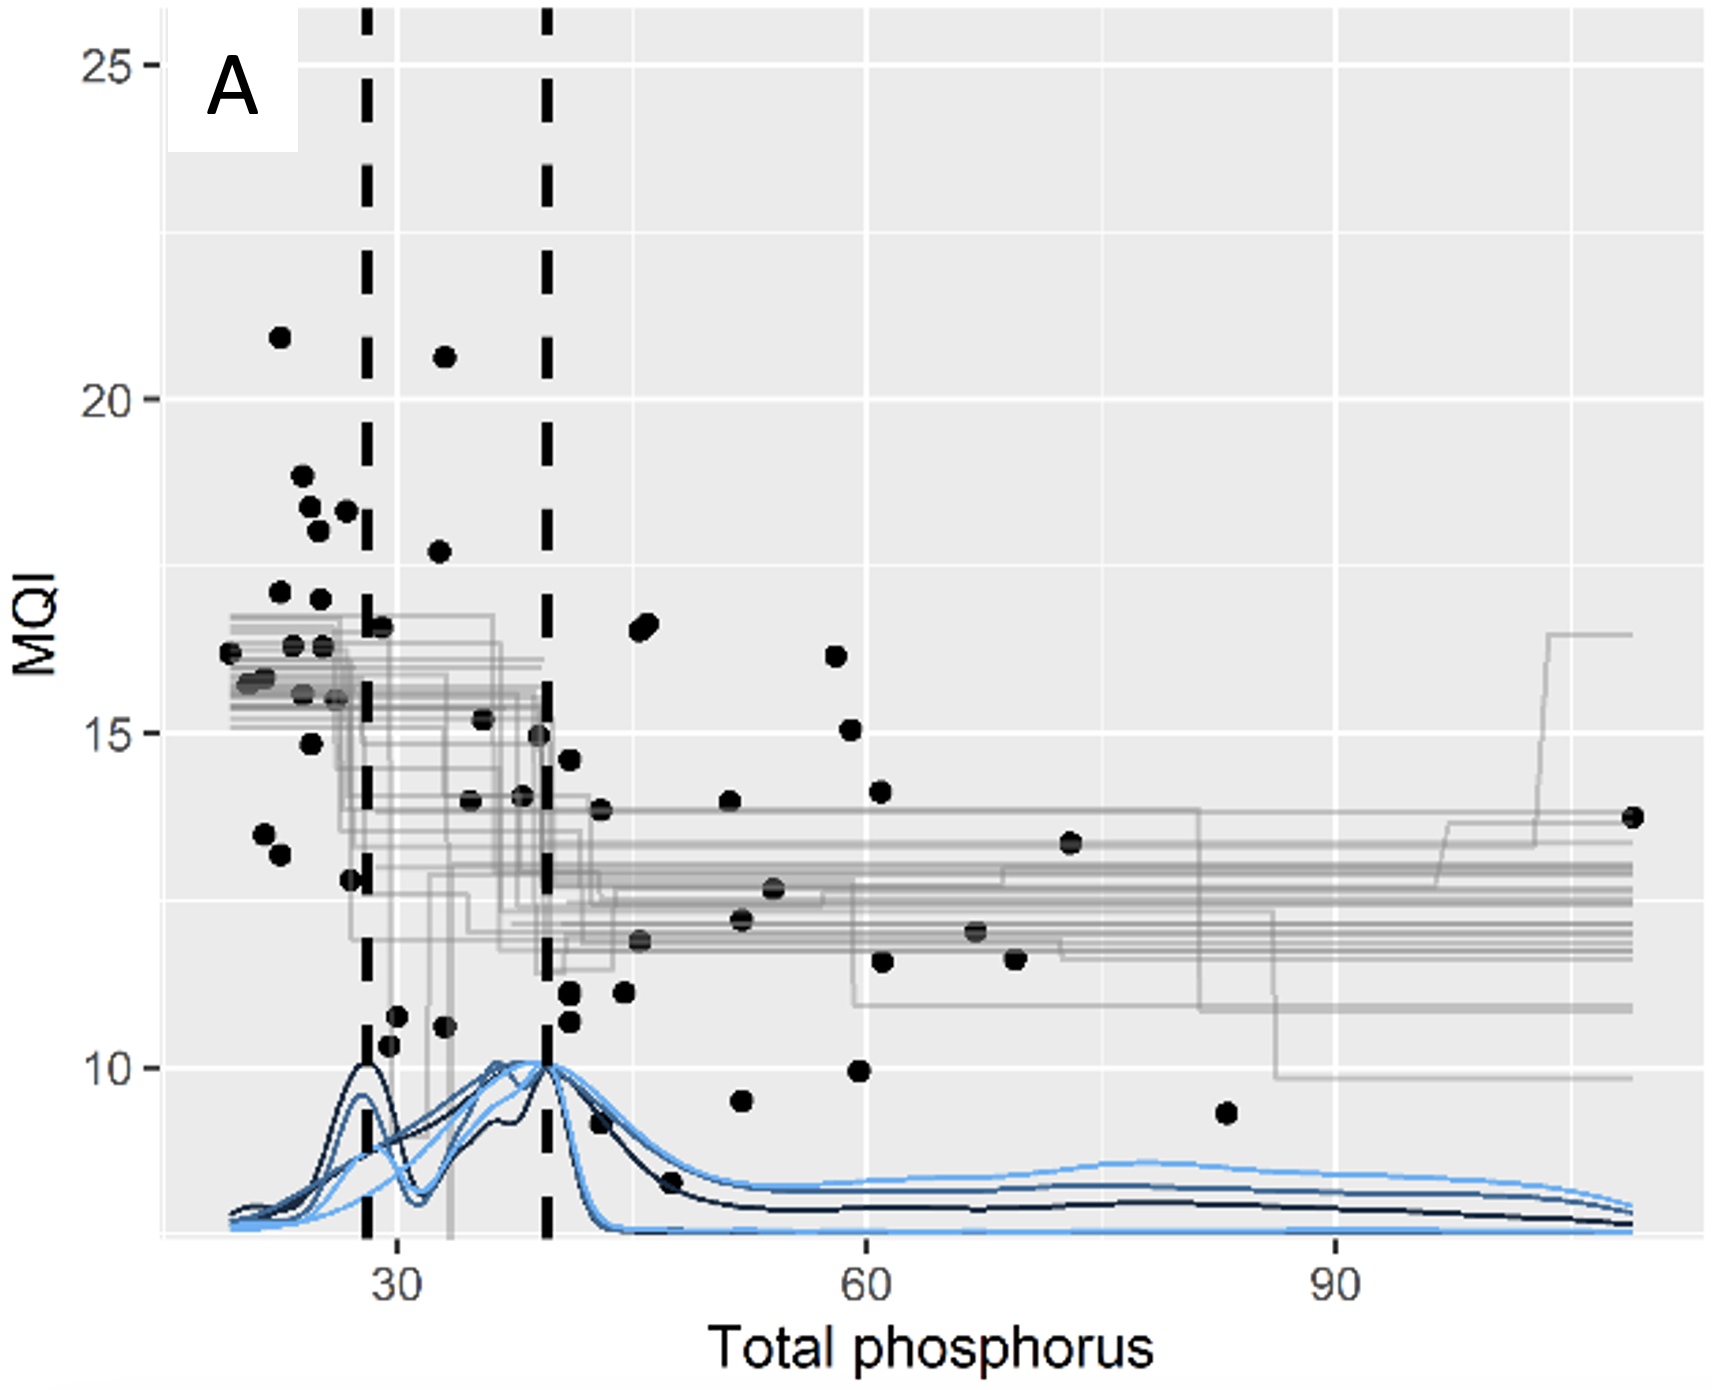
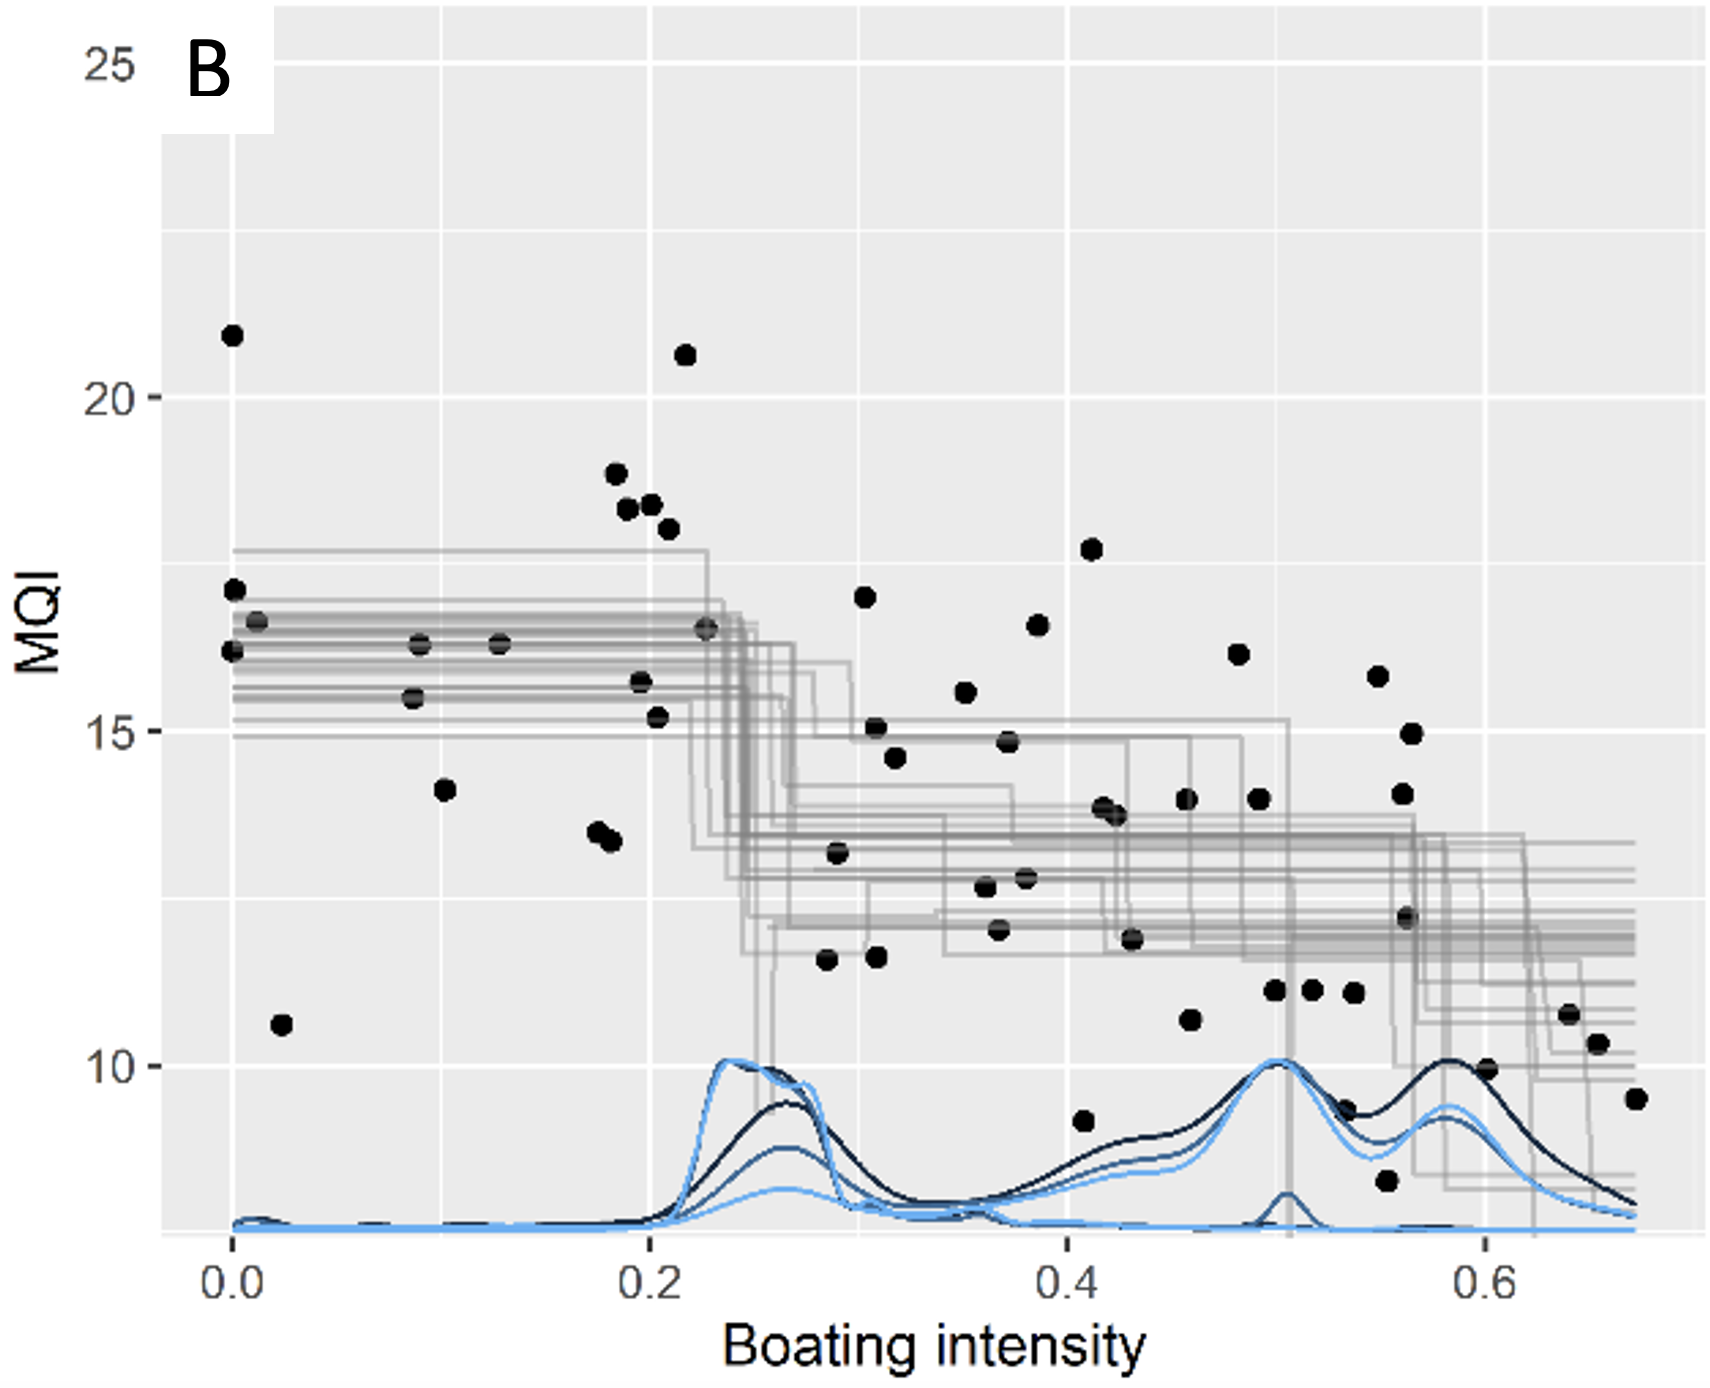
Figure 4. Change points on Macrophyte Quality Index (MQI) in a lagoon along the gradient of June total phosphorus concentration (left) and boating intensity (right). Gray lines are draws from posterior fit and colored density curves represent the posterior densities of the estimated change points. Dashed lines in panel A are modes of estimated first change point posterior density.