Nudges implemented
We tested various nudging techniques in collaboration with 21 coffee shops and cafeterias
We mention ‘Coffee shops’ and ‘café' throughout this report for readability but note that some of these locations are better described as ‘gas station adjacent convenience stores’ (Circle K), or ‘University cafeteria/canteen’ (Nordrest).
Each of the Swedish coffee shops offer customers the choice between single-use cups and reusable cups through a collaboration with Panter. Panter offers a system where the customers may borrow a reusable cup free of charge if the cup is returned within a certain time frame. To borrow a cup, the customers register themselves on a web application, and scan the cup with a smartphone both when borrowing and returning the cup. Prior to our tests, each location had used the Panter system for a short while. The use of reusable cups was virtually non-existing, with a share of 0-0.3% reusable cups borrowed in 15 coffee shops.
In the ISS location in Denmark, a sustainable cup choice is presented through Kleen Hub cups, which is a similar system to Panter. Additionally, ISS gives customers the option to bring their own cup, and as so, two different types of sustainable cups are an option at ISS. In the control period before testing (4 weeks), the number of cups sold was 6499, where 2.29% of them was in a Kleen Hub cup and 1.91% was customers own cup. This leaves the proportion of customers choosing a sustainable option prior to the experiment to be 4.20%.
In Original Coffee, the shops offer customers the choice between a single-use cup and reusable cups through collaborations with New Loop. New Loop is a deposit system where the customers pay 5 DKK to borrow a cup, which the customer gets in return when delivering the cup back to any New Loop collaborator. No registration is needed, and there is no deadline for the return. Before the test, the use of reusable cups was like in Sweden almost non-existing, where the majority of the shops had a share between 0-0.3%, though one shop had 2.1%.
To increase the use of reusable cups, eight nudging techniques or combinations of techniques, were tested at twelve coffee shops. Results of the nudges are measured as the difference between the share of coffees sold in reusable cups during and before the implementation period. For some tests, observations are also available after the implementation period, enabling us to see whether effects are lasting. We also compare before- and after measurements with data from nine similar coffee shops where no changes were implemented. These are treated as “control shops”, to examine whether any changes in behaviour are not some unknown time effect that influences the number of reusable cups sold during the time period. An overview of tests is presented in Table 1.
To develop the nudging techniques that were implemented, we engaged collaborating coffee shops, performed site visits, conducted behavioural analyses and discussed and selected nudging techniques together. The nudges are based on observed obstacles that customers face, hindering more use of reusable cups. Inspiration for the nudges were drawn both from the ‘Green Nudges Playbook’ (WRAP, 2022) and other previous tests as well as the general nudging literature (eg. OECD, 2019). Nudges implemented were also influenced by technical limitations and what coffee shops were willing to implement.
In the Danish tests, instructions to coffee shop staff were in Original Coffee also followed by daily monitoring, undercover visits, and feedback to coffee shops to ensure instructions were followed according to protocol. In the ISS café, monitory visits were made at a less frequent rate (approx. every second week) but phone calls with the café manager were made weekly. In the Swedish tests, this monitoring was replaced with post-intervention discussions to establish how well instructions were followed. This ultimately compares a normal implementation with a dynamic approach in tests in Denmark with a normal implementation with a static approach in Swedish tests. The main benefit of the dynamic approach is that it can increase the implementation of the nudge, and thereby the likelihood of a positive results, especially with nudges that contains some kind of human element like a prompt. A static approach may give a better indication of the likely effects of a typical upscaling unless specific efforts are made to scale with a dynamic approach.
City | Coffee shop | # of coffee shops (# of control sites) | Nudge types |
Copenhagen | Original Coffee | 3 (2) | OC1: Increased visibility (poster) + verbal prompt |
1 | Same as OC1 + add on: Descriptive social performance feedback loop | ||
1 | Same as OC1 + add on: Lottery mechanism in the return moment | ||
1 | Same as OC1 + add on: Lottery mechanism in the buying moment | ||
Amager | Nordea Café | 1 (0) | Increased visibility + verbal prompt + descriptive social performance feedback loop |
Uppsala | Nordrest | 1 (1) | Verbal prompt |
Stockholm | Espresso House | 3 (3) | Increased visibility (poster) + social norms |
Gothenburg | Circle K | 4 (3) | Increased visibility (poster) + gift |
Table 1. Overview of tests implemented.
Test 1. Original Coffee: Copenhagen, Denmark
Setting
Original Coffee was included in the project, as they had an alternative option to single-use to-go cups (New Loop) and we wanted to include the open setting that this type of coffee shop presents in the Danish tests. Original Coffee is one of the largest coffee chains in Copenhagen, with 18 shops throughout the city. They have had the more sustainable New Loop option (breakeven point of 2 uses) for 1.5 years prior to the experiment. This period provided sufficient baseline data for analyses.
As stated, the reusable option works as a deposit system, where customers pay an additional 5 DKK for their hot beverage and when they return the cup, they get the 5 DKK back. Prior to the test the cups were hardly ever used, as customers had to know of them and ask for the reusable cups themself to ever get the option. The New Loop cups were placed non-salient between the single-use cups above the coffee machine in all three shops and several of the employees did not know they had New-loop cups to offer.
Nudges implemented
In total, four nudges were implemented and tested in three different Original Coffee shops around Copenhagen from November 6th, 2023, until February 1st, 2024. During the same period, we have data from 2 other Original Coffees serving as controls. The experiment has three intervention periods and a control period from 24th of October – 5th of November, where no intervention was implemented at any café.
The first intervention period ran between 6th of November – 19th of November. During this period, a prompt and signs were implemented in the three test-cafés Store Kongensgade (SK), Bredgade (BR), and Istedgade (IS).
The second intervention period ran from 20th of November – 3rd of December, with one additional week at IS (10th of December). The add-on nudges were implemented in this period on top of the prompt and signs. A descriptive social performance feedback loop was implemented in SK, while a lottery mechanism in the return moment was implemented in BR, and a lottery mechanism in the buying moment was implemented in IS.
In the third intervention period, 4th of December – 1st of February, the prompt and respective add-ons were removed in BR and SK, while the signs remained. This was also done in IS after the additional week of the second intervention.
Donation boxes for the reusable to-go cups were also implemented in the three locations in all three intervention periods. This was to remove the hassle factor of returning the cups and customers could instead donate their 5 DKK deposit to charity (Red Cross Danmark).
Intervention 1 – Prompt and communicative signs
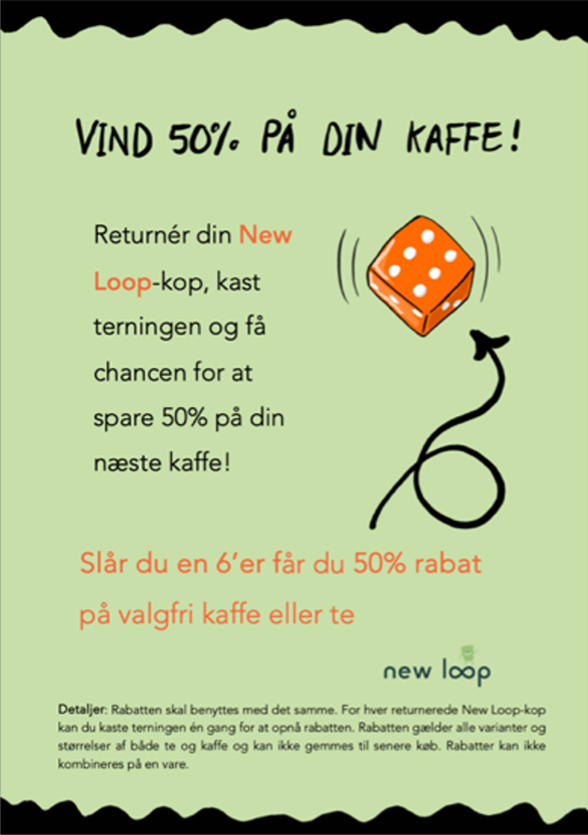
As mentioned, the first nudge was implemented in three test-cafés and contained both a prompt and communicative signs that were placed around the shops. The employees were instructed to prompt every customer who ordered a to-go coffee. Before the intervention customers were asked their order preference followed by the question; of being to-stay or to-go. The default option for to-stay is a reusable ceramic cup and for to-go is a single-use cup. The nudge-prompt happens after customers order a to-go beverage, where the employee will ask; “do you want it in a reusable New Loop cup or a single-use cup”. To minimize the interaction time for each employee, signs were placed both at the front door, at the tables, and at the counter aiming to inform customers of the reusable option and to intuitively explain the deposit system behind it. They were developed in collaboration with the famous Danish comic sketcher Anders Morgenthaler, and it draws on the already existing mental model for a deposit system that Danes have. This mental model is simply when you buy a bottle or a can in Denmark there is a deposit system, where you pay 1–3DKK depending on the bottle size and then you can return it in any supermarket to get the 1–3DKK back.


Picture 1. Signs designed by Anders Morgenthaler.
Intervention 2A – Descriptive social performance feedback loop
A second nudge was implemented at Store Kongensgade and was designed as a descriptive social performance feedback loop. In practice it was an A3 poster graph displaying customers accumulative choice of the reusable option for to-go cups compared to single-use cups, relative to the testing period. Posters were updated daily by the employee who opened the café, and they received a text message from iNudgeyou with the accurate number to update. This nudge was implemented as an add-on nudge, meaning that the prompt and signs were still active. Two posters were implemented to increase the likelihood of salience. One poster was placed next to the coffee menu on the wall behind the counter, and one on the coffee machine facing customers. A post-it note was added to both posters to highlight the current amount of the preferred behaviour.


Picture 2. The descriptive social performance feedback loop at Store Kongensgade.
Intervention 2B – Lottery mechanism in the return moment
At Bredgade a third nudge was implemented. In this, customers had the chance of a potential gain when returning a reusable to-go cup. The design was a lottery mechanism, where customers got the chance of getting 50% off their next beverage when they returned a New Loop cup. A red die was placed at the counter next to a sign explaining the concepts. The employees were instructed to add a short explanation of the concept to their existing prompt. When customers returned the reusable New Loop cup, they were allowed to throw the die. If the dice was a 6 it provided them a 50% discount on their beverage.
Intervention 2C – Lottery mechanism in the buying moment
The fourth nudge is similar to the previous lottery mechanism, where customers could potentially get 50% off their next beverage. However, instead of having the chance in the return moment, customers at Istedgade had the opportunity to get the discount when buying a to-go beverage in a reusable cup. The chance is the same, so if one rolls a sixth after choosing a New loop cup, they get 50% off their next beverage. The nudge was set up as the other lottery mechanism with a sign and a die at the counter, and the employees were instructed to add a short explanation in their prompt.
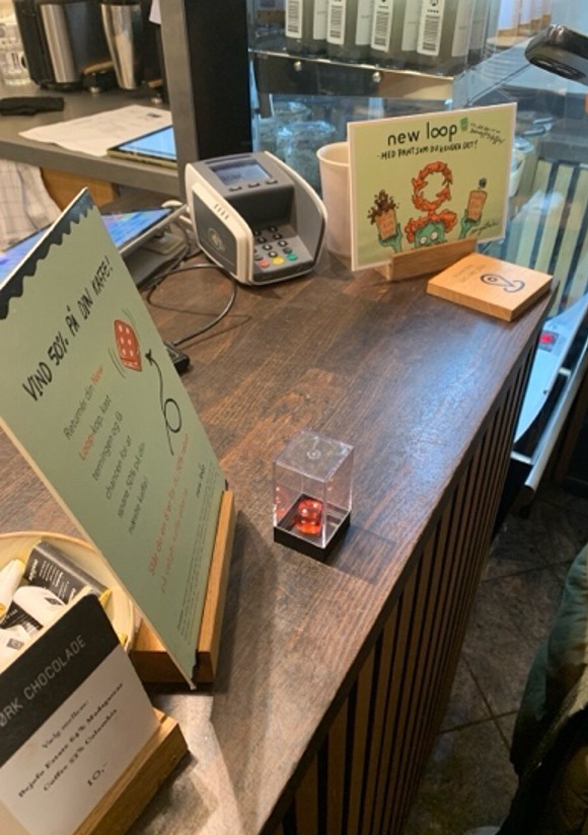
Picture 3. Lottery mechanism in the return at Bredgade.
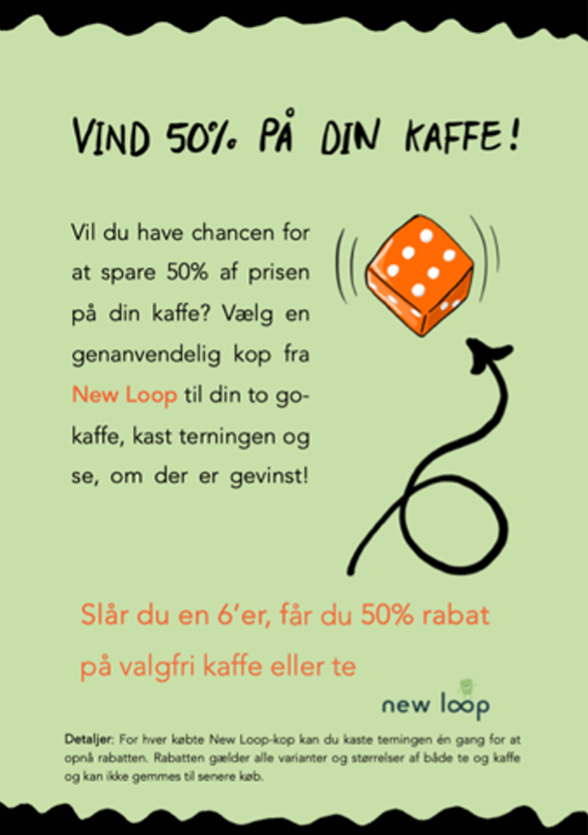
Picture 4. Lottery mechanism in the buying moment at Istegade.
Results
The results of the interventions at Original Coffee are shown in Figure 1.
Figure 1. Share of reusable cups compared to the total of hot to-go beverages sold across the three cafés: Store Kongensgade (SK), Bredgade (BR), Istedgade (IS), and the two control cafes Trianglen (TR), Dosseringen (DO), in the four different time periods of the experiment.
During the control period the share of reusable cups is almost at 0% across the cafés, except for IS where it was 2.12%, leading to the conclusion that almost no reusable cups was chosen as the to-go cup prior to the intervention periods.
In the first intervention period the consumer behaviour starts to change, and the share of reusable cups increased in all three test-cafés to 8.86%, 4.06% (8.21%) and 7.79% in SK, BR and IS respectively. The share remained low and close to zero in the two control cafes, 0.34% and 0.42% in TR and DO respectively. The first two days at BR the reusable cups were unusually high (25%). This was detected through our undercover visits, which was performed twice per week at every café during the experiment. These were done to support the daily monitoring visits – to ensure the prompt was implemented according to the instruction. The employees added multiple elements to the prompt making it almost like a sales pitch rather than just a prompt. This might explain why the share of reusable cups were relatively higher compared to any other day in the experiment in any of the shops. After day two, we aligned with the employees to prompt in agreement with protocol, which afterwards led to a drop in the reusable cups share. We have presented the share in BR in this period both with and without these two days.
In the second intervention period the share of reusable cups increased in BR and IS to 4.94% and 14.46% respectively. The increase, however, was larger in IS, where the lottery mechanism was linked to the buying moment, compared to BR, where the lottery mechanism was associated with the returning moment. This suggests that the chance of immediate rewards is more effective compared to possible future benefits upon cup return. In SK there was a slight decrease from 8.86% to 8.62% in the share in this period. The share remained low and close to zero in the two control cafes, 0.45% and 0% in TR and DO respectively.
In the third intervention period the share dropped in all of the test-cafes to 1.23%, 0.76% and 2.21% in SK, BR and IS respectively. The shares remained low in the control-cafes, at 0.25% and 0.05% in TR and DO respectively. This indicates that the prompt was the main driver for the positive change we saw from the control period to the first intervention period. To test for significance difference-in-differences regressions are made, which can be found elaborated in the Appendix. The estimated effect sizes are all significant on either a 1% or 5% level.
Monitoring visits noted that employee enthusiasm at Istedgade likely contributed to higher implementation rates and, consequently, more effective prompts. We recognize the distinction between optimal and normal implementation inherent in real-world experiments where complete control is impossible, as discussed later in the report.
Test 2. ISS Café, Nordea headquarters: Amager, Denmark
Setting
In Nordea Headquarters, ISS manage a café only available for Nordea employees (approx. 2000 people) and visiting guests. The setting is what we would call a closed setting, meaning that it’s only people within the closed security of the Nordea location who can access the cafe. Therefore, mainly regulars use the café, and the consumption of the beverage happens within the surrounding area. The café offers only to-go beverages, where the default prior to test was single-use cups. As mentioned, two reusable alternatives were already present prior to the experiment. One is Kleen Hub which is a metal cup with a breakeven point of 10 uses, where customers need to sign up to borrow the cup for free (similar to Panter). If they forget to return it after 10 days, there is a fee of 150DKK. Another alternative for customers is to bring their own cup with which they receive a 2DKK discount. A sign promoting this was on the counter, prior to our test.
Nudges implemented
In Nordea’s café the implementation involved three elements all in one intervention. A descriptive social performance feedback loop was tested along with signs placed around the cafe and on an internal-Nordea website that was displayed on small screens around the office. A prompt was also performed, but not in every transaction. The test spanned from November 6th, 2023 until March 3rd, 2024. The feedback-nudge was a graph visualising the proportion of the desired behaviour in percentage, being customers selecting one of the reusable alternatives instead of a single-use cup.
The experiment can be separated into two periods. The first period (four weeks) iNudgeyou updated the poster with the feedback loop twice a week to give the consumers as immediate feedback as possible. In second period (the remaining 13 weeks) the café updated the graph themselves on a weekly interval. We collected 5 weeks of baseline data to incorporate into the analyses, which were from the weeks leading up to the test.
First element of the intervention: Descriptive social performance feedback loop
The main nudge at Nordea’s café was designed as descriptive social performance feedback loop, that leverages on a community that was already present since we performed the experiment in a closed system with people working within Nordea. We used the nudging strategy “making it social” with the assumption that people already involved in a work-community will be more willing to shift towards a more sustainable behaviour just to improve their self-image in the community.
The continued feedback is to support the social motive to shift behaviour, and the nudge is designed on a large poster that is placed right next to the café where most employees pass by entering the building. There is also a post-it note attached to the graph to highlight the current percentage.


Picture 5. Descriptive social performance feedback loop at Nordea’s café
Second element of the intervention 2: Communicative signs
In the design phase discussions were made regarding potential behavioural insights that could be included as an element in the intervention. Due to the default single-use cup expressing “100% compostable” on its front, customers might consider that the cup is “fine to use” in an environmentally setting, and not that it’s coded with polyethylene (plastic) and the compostable statement refers to a specific sorting option and not that it will be dissolved naturally like an apple. Therefore, communicative signs were also made to be visible around the café informing about what is preferred behaviour and what options of cups is present.
The framing draws on a mental model that gives an intuitive understanding of the different options and which ones are considered desirable. Another element of the signs is the norm-framing that the café asks their costumers to help them (the café) to become more sustainable by choosing a sustainable cup when buying their coffee. These different signs were placed around the cafe, including on the counter. In the first four weeks, it was posted on an online Nordea platform as well, alongside the updated graph.

Picture 6. Communicative signs at Nordea’s café
Third element of the intervention 3: Prompt
Initially, we agreed to add a prompt where the café would ask all customers “What kind of cup do you want” in each service. After the first couple of days and talks with the Nordea manager it was agreed that they would only make an initial prompt, so every guest at least once got a prompt explaining the systems for the more sustainable behaviour and received information about the signs stating that they could follow the progress. The café manager deemed it to be unrealistic to make a prompt in every transaction because the employees take pride in knowing the customer and their usual ordering.
Results
Figures 2, 3 & 4 present the proportion of coffee buyers choosing “a green cup” at Nordea’s café for each period. Choosing “a green cup” in Nordea’s café can mean one of two things: either borrowing a Kleen Hub cup or bringing their own.
Figure 2. Share of green cups for the control period and the entire intervention period.
Figure 2 shows that in the 5 weeks of control 6,499 cups of coffee was sold and 4.20% of them was in green cups. In the entire intervention period of 17 weeks 20,717 cups of coffee were sold, and the proportion of green cups during that period increased to 13.33%. The average weekly share of green cups was 4.15% in the control period and 13.94% in the intervention period.
When we instead of looking at the green cups altogether, consider the share of Kleen Hub cups and own cups individually, the average weekly share of own cups is 1.87% in the control period and increased 7.33 pp to 9.20% in the treatment period. The average weekly share of Kleen Hub cups were 2.29% in the control period, and in the treatment period this increased 2.45 pp to 4.74%.
This suggests that the main part of the increase in share of green cups can be attributed to an increase in the share of own cups. Both differences are significant on a 1% significance level, however it’s worth noticing that the increase is highest for customers bringing their own cup rather than borrowing a Kleen Hub cup in this setting. A hypothesis for this could be due to the different incentive structure, where you get 2DKK discount when bringing your own cup and by choosing to borrow the Kleen Hub cup a hassle factor of a potential cost occurs that is relatively high of 150DKK.
Figure 3. Share of green cups across the control period and the first- and second intervention period.
Figure 3 presents the results where the intervention period is split into two. The difference is if the graph was updated 2 times weekly by iNudgeyou or 1 time weekly by the ISS’s manager. In the first intervention period 5,392 cups of coffee were sold, of which 9.87% were in a green cup. The average weekly share of green cups was 9.84 %. During the second intervention period there was 15325 cups of coffee sold, of which 14.55% were in a green cup. The average weekly share of green cups was 15.20%. The effects are statistically significant on a 1% level. This intuitively indicates that there isn’t any reason to update the graph more than 1 time a week. It should though be noted that the increase from control to the first intervention period is higher than from the first period to the second. This indicates that there is some kind of learning period in the closed settings at Nordea, where people over times opt-in. The next graph argues for this hypothesis.
Figure 4. Share of green cups displayed weekly during the experiment.
* iNudgeyou updates graph
** Nordea café updates graph
** Nordea café updates graph
Figure 4 presents the percentage of green cups on a weekly basis and is made to investigate potential outliers, but also any time effects referred to in the above. Overall, there is an increase in the share of green cups from week 40 (4.71%) until week 9 (14.66%). The most substantial gradual increase is seen during the first intervention period in week 45 to 48, where the increase is from 4.58% to 12.81% respectively. The average weekly increase in this period is 2.06 pp (time effect). The effect is statistically significant on a 5% level, and it’s the only period where the time effect is significant. This indicates that there is a learning effect in the beginning of the intervention and that there is an onboarding period of for the employees at Nordea. It though doesn’t clarify if there is a potential max learning effect. Weeks 52, 1, and 7 have the highest share of green cups sold, which can be explained because these weeks are around Christmas and the Winter holiday. Here fewer people were at the office, leading to a relatively lower total sales of to-go coffee. When these weeks are excluded from the analysis, we still get significant results.
Overall, the results show a significant effect for the nudge, meaning that by implementing a descriptive social performance feedback loop, intuitive signs, and a single time prompt in Nordea’s café positively increased the consumption of more sustainable options when buying to-go coffee in comparison with single-use cups. To test for significance t-tests were used. An elaboration of these test and a table summarizing the results can be found in the Appendix.
Test 3. Nordrest: Uppsala, Sweden
Setting
Nordrest operates restaurants/cafeterias at universities, schools, hospitals, offices, and other public spaces. Two of these cafeterias are located at Uppsala university campus, at Ekonomikum (where students in social sciences study) and Ångströmslaboratoriet (where students in natural sciences and engineering study). Both cafeterias have offered reusable cups through Panter, but with a limited share of beverages sold in the reusable alternative. To receive a reusable cup, customers had to specifically ask the staff for one, and information was available on posters.
Nudge implemented
To increase the share of beverages sold in reusable cups, we instructed staff to specifically ask customers if they wanted their coffee (or other beverage) in a reusable cup, when they ordered coffee to-go. This prompt was provided in one of the two Nordrest cafeterias, while the other is treated as a control to compare any differences. While it’s safe to say that for the two other tests in Sweden all customers in the shops had the same possibility to read the signs, we can only confirm that the likelihood that customers were asked if they wanted a reusable cup was higher during the nudge treatment, without any guarantee that all customers received this question.
Data on the number of cups sold is available from 5th of February until 31st of March. The nudge was implemented on one of the cafeterias from 4th of March and onwards until the end of the test period. During the period 5th of February until 3rd of March the total amount of take-out coffees came to 5,932, while the equivalent number for 4th of March until 31st of March was 4,978 take out coffees.
Results
With the nudge implemented, the share of reusable cups sold increased from 0.04 to 1.33% in the treated cafeteria, as shown in Figure 5. This can be compared with a minor change from 0.03 to 0.07% in the control cafeteria. We can then conclude that the nudge had a positive effect, whereas any time-effects are comparably negligible. While the effect of the nudge is large in relative terms, the number of reusable cups sold is still low, at slightly more than one of every 100 single-use cups sold.
After the implementation period, we confirmed with managers how well the instructions for the verbal prompt were followed. There was a considerable risk that all customers did not receive the same treatment with the verbal prompt asking whether they wanted their coffee in a reusable cup. Managers noted that this could have happened when staff felt that asking would be experienced as an inconvenience for the customer, when queues were long, or by staff simply forgetting. This non-full compliance would of course lower the potential for the nudge effect.
Figure 5. Results Nordrest.
Test 4. Espresso House: Stockholm, Sweden
Setting
The second test in Sweden was conducted at Espresso House coffee shops in Stockholm. Espresso House is one of the leading coffee shop chains in Sweden and throughout the Nordics. Before any tests were implemented, Espresso House offered the reusable cup alternative through collaboration with Panter. The number of reusable cups sold at selected coffee shops had however been low, at well below 1 % of all coffee sold. The visibility of the reusable option was low, and after site visits, we considered this as one of the major obstacles to reaching a higher share of reusable cups sold.
Nudge implemented
The nudge in this test consisted of increased visibility and communication of social norms in the form of signs. These signs were larger and more colourful than previous signage. In this test, we also communicate that many other customers chose to use the reusable cup system by stating “12 000 people use reusable cups instead – test it yourself!”.
Based on Panter numbers, not specific to the specific coffee shops.

Picture 7. Poster communicating social norms at Espresso House
Data on coffee sales are available between 5th of February and the 31st of March. Six coffee shops were randomly selected into a control group and a treatment group. Again, the test began with a time period without any nudges, followed by a second time period where three of the six shops were treated with the nudge. The second time period ran between 4th of March until the end of the test period. During the first period a total of 6,538 coffee to-go was sold, while the equivalent number for the second period was 6,274.
Results
The result from this test is displayed in Figure 6. Shares of reusable cups sold are very low in all groups, both before and during the nudge intervention. In the nudge group, the share increased from 0.1 to 0.22%, but this increase is not statistically significant. Meanwhile, the share in the control group fell from 0.26 to 0.03%. These changes, however, represent such small amounts of cups sold, that we cannot establish any statistical significance or draw any practical. The higher pre-intervention share in the control group is driven by one day in one restaurant when the cups were first introduced. The results may hint at an effect in a positive direction, but the change is neither statistically nor practically significant.
Figure 6. Result from Espresso House
Test 5. Circle K: Gothenburg, Sweden
Setting
Circle K is one of the major gas stations operating in Sweden. While selling transportation fuels is their main business, they also operate convenience stores. Among other goods, they sell coffee and other beverages. Customers are mostly car-borne passing by to refill their cars with fuel, although customers may also come for the convenience store alone. Inside the store, customers are met with a strong visual profile and multiple signs and posters highlighting various offers. At the coffee station, single-use cups are highly visible while the option of reusable cups is less salient. Signs promoting the reusable cups are there (the two grey signs in Picture 1 below), but customers need to go to the counter and ask the cashiers to receive the reusable cups, in addition to registering on the Panter web-application. To promote the use of reusable cups, there was already a discount of 2 SEK when buying coffee in reusable cups instead of single-use cups.

Picture 8. Circle K coffee station, before nudging.
Nudges implemented
We considered low visibility and the initial hurdle of choosing reusable cups as major obstacles for reaching higher shares of beverages sold in reusable cups. To compensate for this, we increased visibility through larger and more colourful posters (see picture 2). Posters were designed in collaboration with Panter and Studio Berget. The first time a customer registers at the Panter application, Circle K would now offer a gift of free coffee at their next visit. This was highlighted in one poster, while the other highlighted the 2 SEK discount. Treated stores included both posters.


Picture 9. Posters at Circle K: Free coffee at next visit (left) and 2 SEK discount (right).
The test was conducted on seven Circle K stations in Gothenburg and its surroundings. The test period was divided into two time periods. The first period was a reference period, running from the 15th of January to 11th of February. The intervention period ran from 12th of February to 15th of March. During the treatment period, these changes were implemented on four of the seven stations, leaving the other three stations as a control group. For the first period a total of 27,492 coffees where sold, while the equivalent number for the second period was 34,148 coffees.
Results
The nudging implemented at Circle K stations resulted in no positive change in behaviour, as shown in Figure 7. The number of reusable cups registered to customers was higher before the intervention period, although the total number and differences are too small to confirm any statistically significant difference. The results confirm that the increased visibility through posters, in combination with the offers of a free coffee and the pre-existing discount, was not enough to increase the use of reusable cups among the Circle K customers.
The result from this test is visualised in Figure 7. As seen on the sizes of the bars there seems to be no effect from the nudge in Circle K. The number of reusable cups sold was very low in all stores, both before and during the intervention. The number of reusable cups sold was actually higher in the nudge group before the intervention, indicating a negative effect of the nudge. We interpret this mostly as an unfortunate outlier effect, as the manager of one of the stations was very positive to the reusable cups when implemented, and thereby had a comparable high share of reusable cups during the first weeks. Either way, shares are so low that we find no statistically significant effect.
Figure 7. Results from Circle K