3. The big picture
3.1. Plastics in the world
A global challenge
Attempts at mapping global plastic flows with available data suggests that ending plastic pollution is a massive undertaking. In their Global Plastics Outlook, the OECD estimate that plastic production has doubled from 234 Mt in 2000 to 460 Mt in 2019 and is expected to increase threefold by 2060
OECD (2022) – Global Plastic Outlook. Plastic flows were modelled by the OECD using ENV-Linkages; their in-house dynamic computable general equilibrium mode. Read more. https://doi.org/10.1787/5jz2qck2b2vd-en
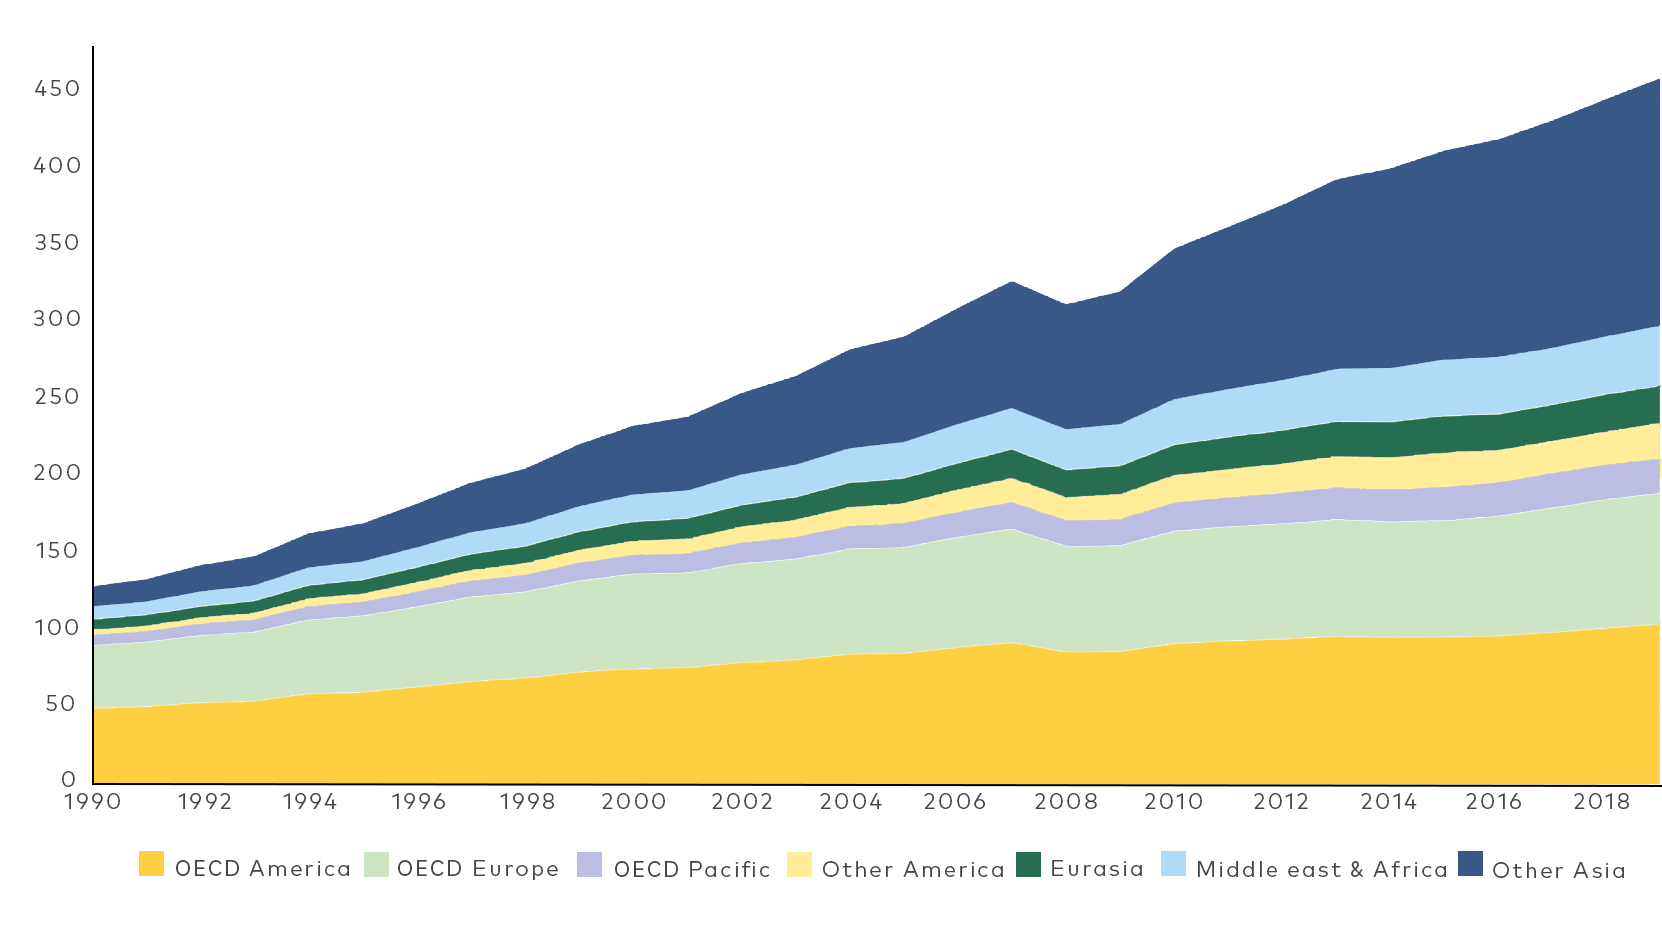
Figure 1: Plastics use by region globally in million tonnes.
Source: OECD – Global Plastics Outlook (2022)
Source: OECD – Global Plastics Outlook (2022)
Figure 2 presents a global material flow of plastics, which suggests that globally, efforts should be focused on addressing management of plastic waste at the bottom of the waste hierarchy; 21% of plastic waste is assumed to be mismanaged ending up at dump sites, in open pit burning or leaking into the environment. Almost half of plastic waste globally is landfilled.
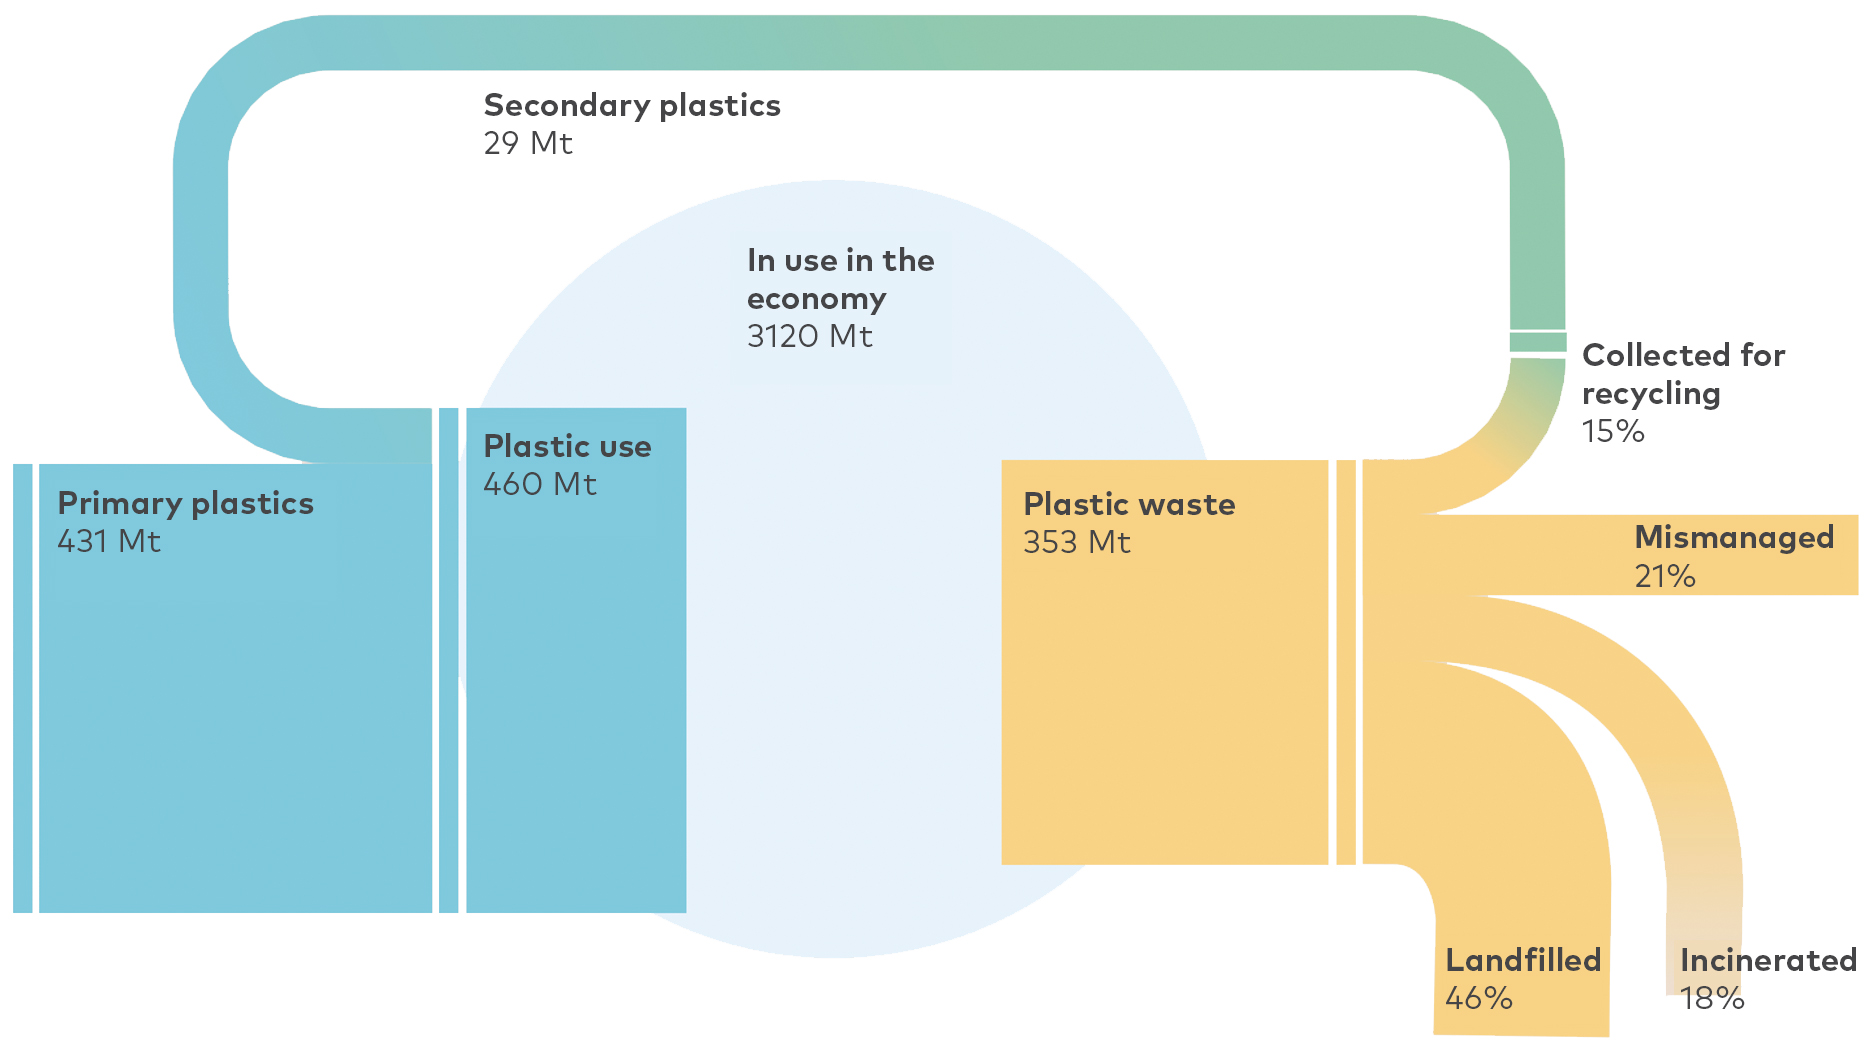
Figure 2: Global flow of plastics as modelled by OECD using their model ENV-Linkages.
Source: OECD – Global Plastics Outlook (2022)
Source: OECD – Global Plastics Outlook (2022)
3.1. Plastics in Europe
If we narrow the scope to the regional level, specifically Europe, analyses suggest a total plastics converters demand in 2021 of 50,3 Mt
Plastics Europe (2021) – including 2,3 % bioplastics and 10,1 post-consumer recycled plastics
Figure 3: Total plastics converters demand in 2021.
Source: Plastics Europe
Source: Plastics Europe
Eurostat has attempted to map a complete material flow of plastics in Europe as shown in figure 4, with data from a variety of sources including Plastics Europe, production statistics and the relatively extensive reporting done under directives regulating plastic packaging waste, end- of-life vehicles and electronics. Unofficial results
Interview with Oscar Gomez, February 2024.
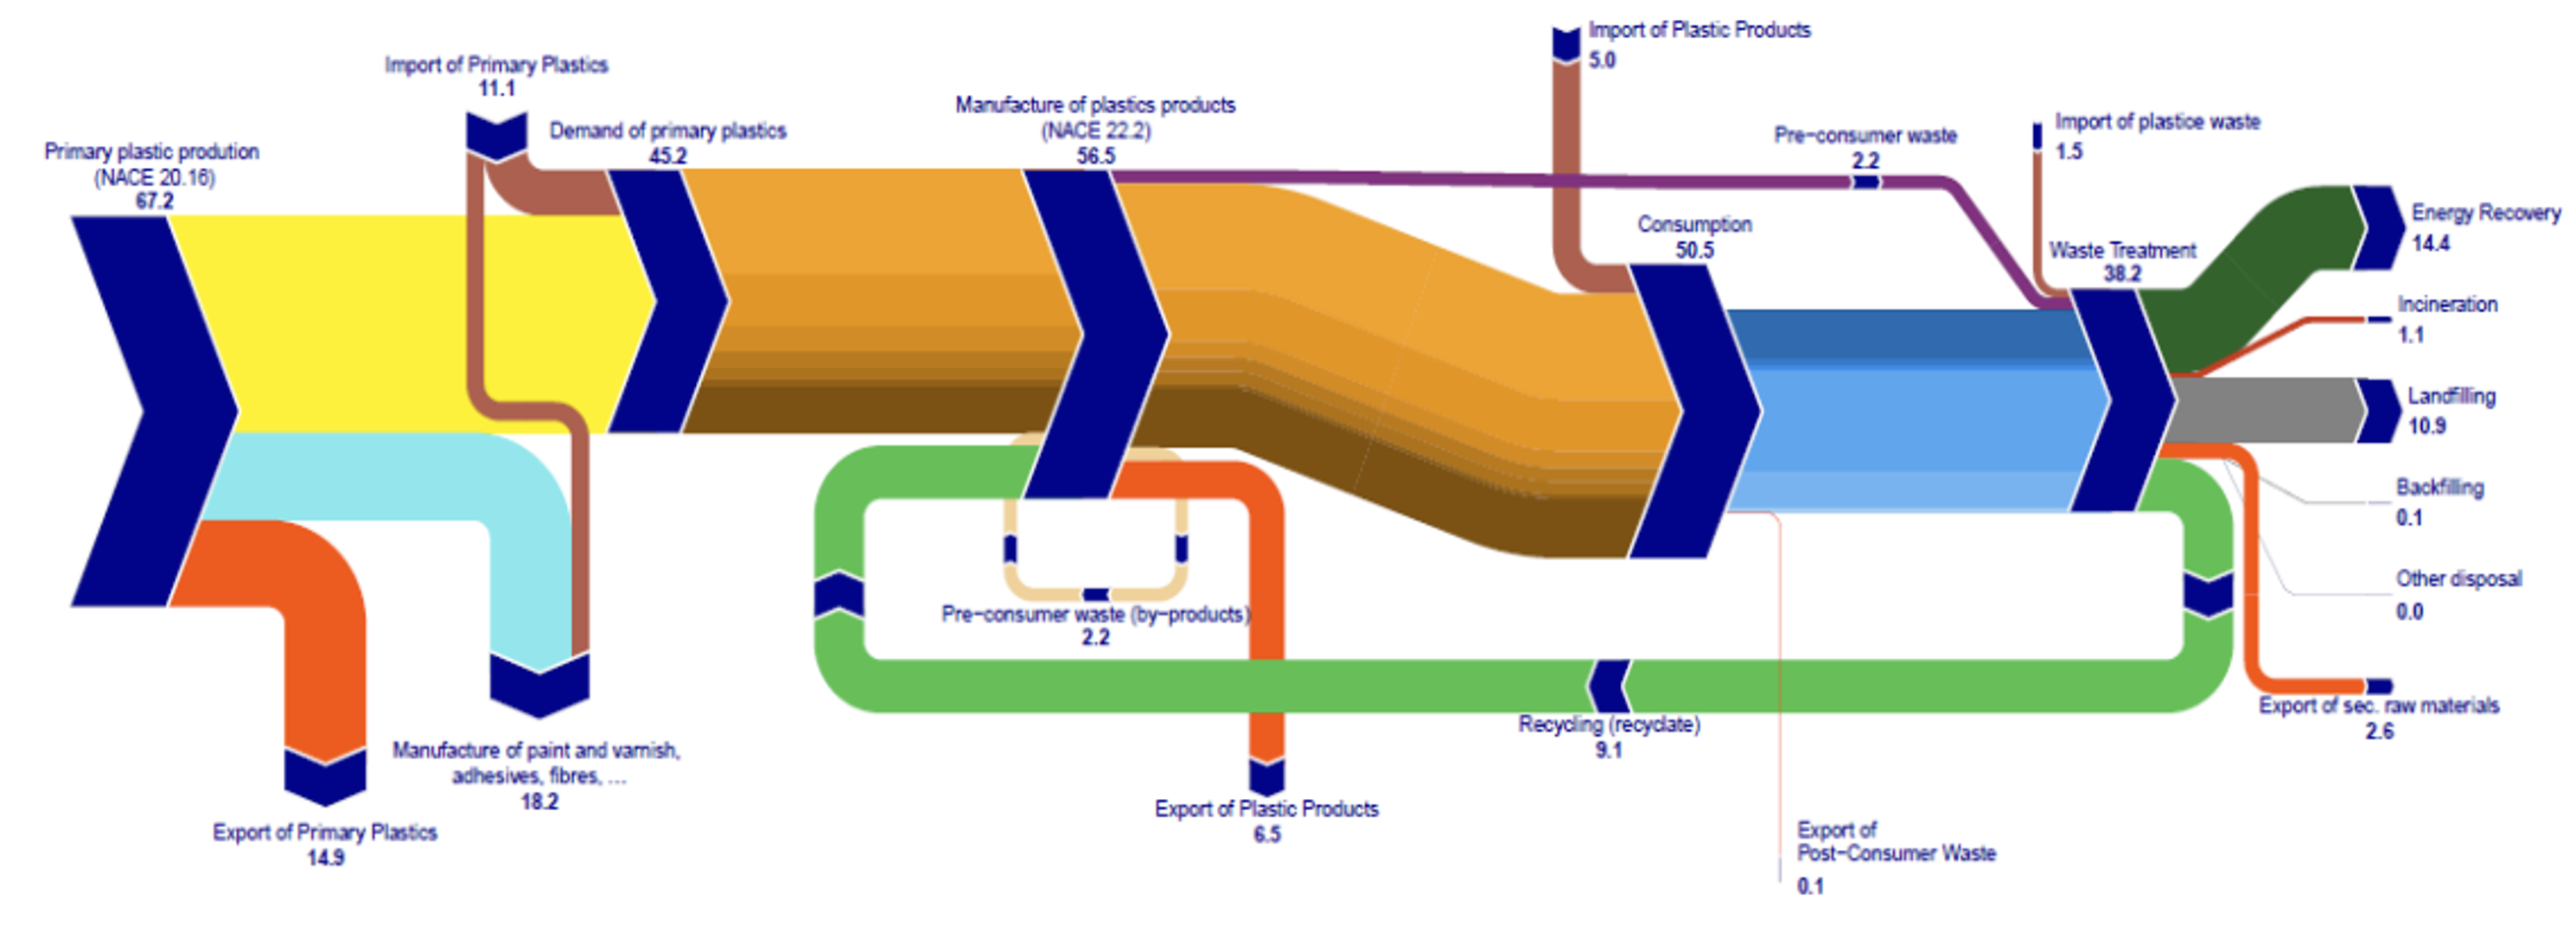
Figure 4: Plastic flow from production to treatment and recycling throught the EU27, 2016.
Source: Eurostat
Source: Eurostat
Leader of the team Circular Economy and Waste Statistics in Eurostat, Oscar Gomez, presented the results of this analysis to the Nordic technical experts during the workshop, and supported the message that there is a great need for better and harmonized data, especially on the production side of the value chain.
3.3. Global and regional needs for improved plastics statistics
Material flow analyses of plastics globally and in Europe highlight the need for more detailed national inventories of plastic flows to create more reliable statistics for regions and in the world economy. This is also the clear message from parties involved in the negotiations of the UN plastic treaty. Global Plastics Policy Manager in WWF, Eirik Lindebjerg, and International Relations Officer in the Directorate-General for the Environment of the European Commission, Christoffer Vestli, presented at the workshop in Oslo and underscored the crucial role of statistics in the ongoing negotiations for a binding, global treaty to end plastic pollution.
Lindebjerg emphasized the current unique opportunity to address the global plastic pollution crisis by establishing a regulatory framework at the global level. He highlighted the importance of reliable data on plastic flows, composition, and waste treatment for effective policy design, implementation, and impact assessment. The focus includes global bans on high-risk, harmful, and highly-leakage plastic products, as well as harmful chemical additives, materials, and polymers. Lindebjerg also stressed the need for product requirements to ensure that all plastic products are designed for reuse and recycling with minimal plastic usage, excluding harmful plastics. The success of a global treaty, he argued, hinges on the availability of robust data to identify targeted plastic products and assess the impact of policy measures.
Christoffer Vestli, representing the European Commission, reiterated the significance of data in identifying feasible policies. The EU early warning system on packing waste targets shows that especially on plastic packing, most of the member states are at risk of missing the target. He pointed out the current discrepancies in studies estimating plastics consumption, waste generation, and recycling, emphasizing the need for accurate and comprehensive data. Vestli highlighted potential data needs for technical negotiations on the global treaty, including information on products put on the market (polymers and chemicals of concern), high-impact consumption sectors, and trade flows for both plastic products and waste. The call from both WWF and the European Commission resonates: a global treaty to combat plastic pollution requires a solid foundation of accurate and standardized statistics to inform and evaluate effective policies.
3.4. Plastics in the Nordics – experiences from mapping plastic flows
The current lack of standardized methodology for mapping plastic flows in different countries makes comparisons less useful and aggregation to regional and global inventories burdened with uncertainty. Several Nordic countries have attempted to map the flow of plastics in their countries
Norway, 2023, Statistics Norway, Report: Plastic Account for Norway: (ssb.no)
Sweden, 2020, Naturvärdsverket, Report: Kartlägging av plastflöden i Sverige: Rapport 7038. Kartläggning av plastflöden i Sverige 2020. ISBN 978-91-620-7038-0 (naturvardsverket.se)
Sweden, 2020, Naturvärdsverket, Report: Kartlägging av plastflöden i Sverige: Rapport 7038. Kartläggning av plastflöden i Sverige 2020. ISBN 978-91-620-7038-0 (naturvardsverket.se)
Denmark, 2021, Statistics Denmark, Report: Accounts and indicators for Danish plastic flows: Microsoft Word - Final report 2021_Master.docx (dst.dk)
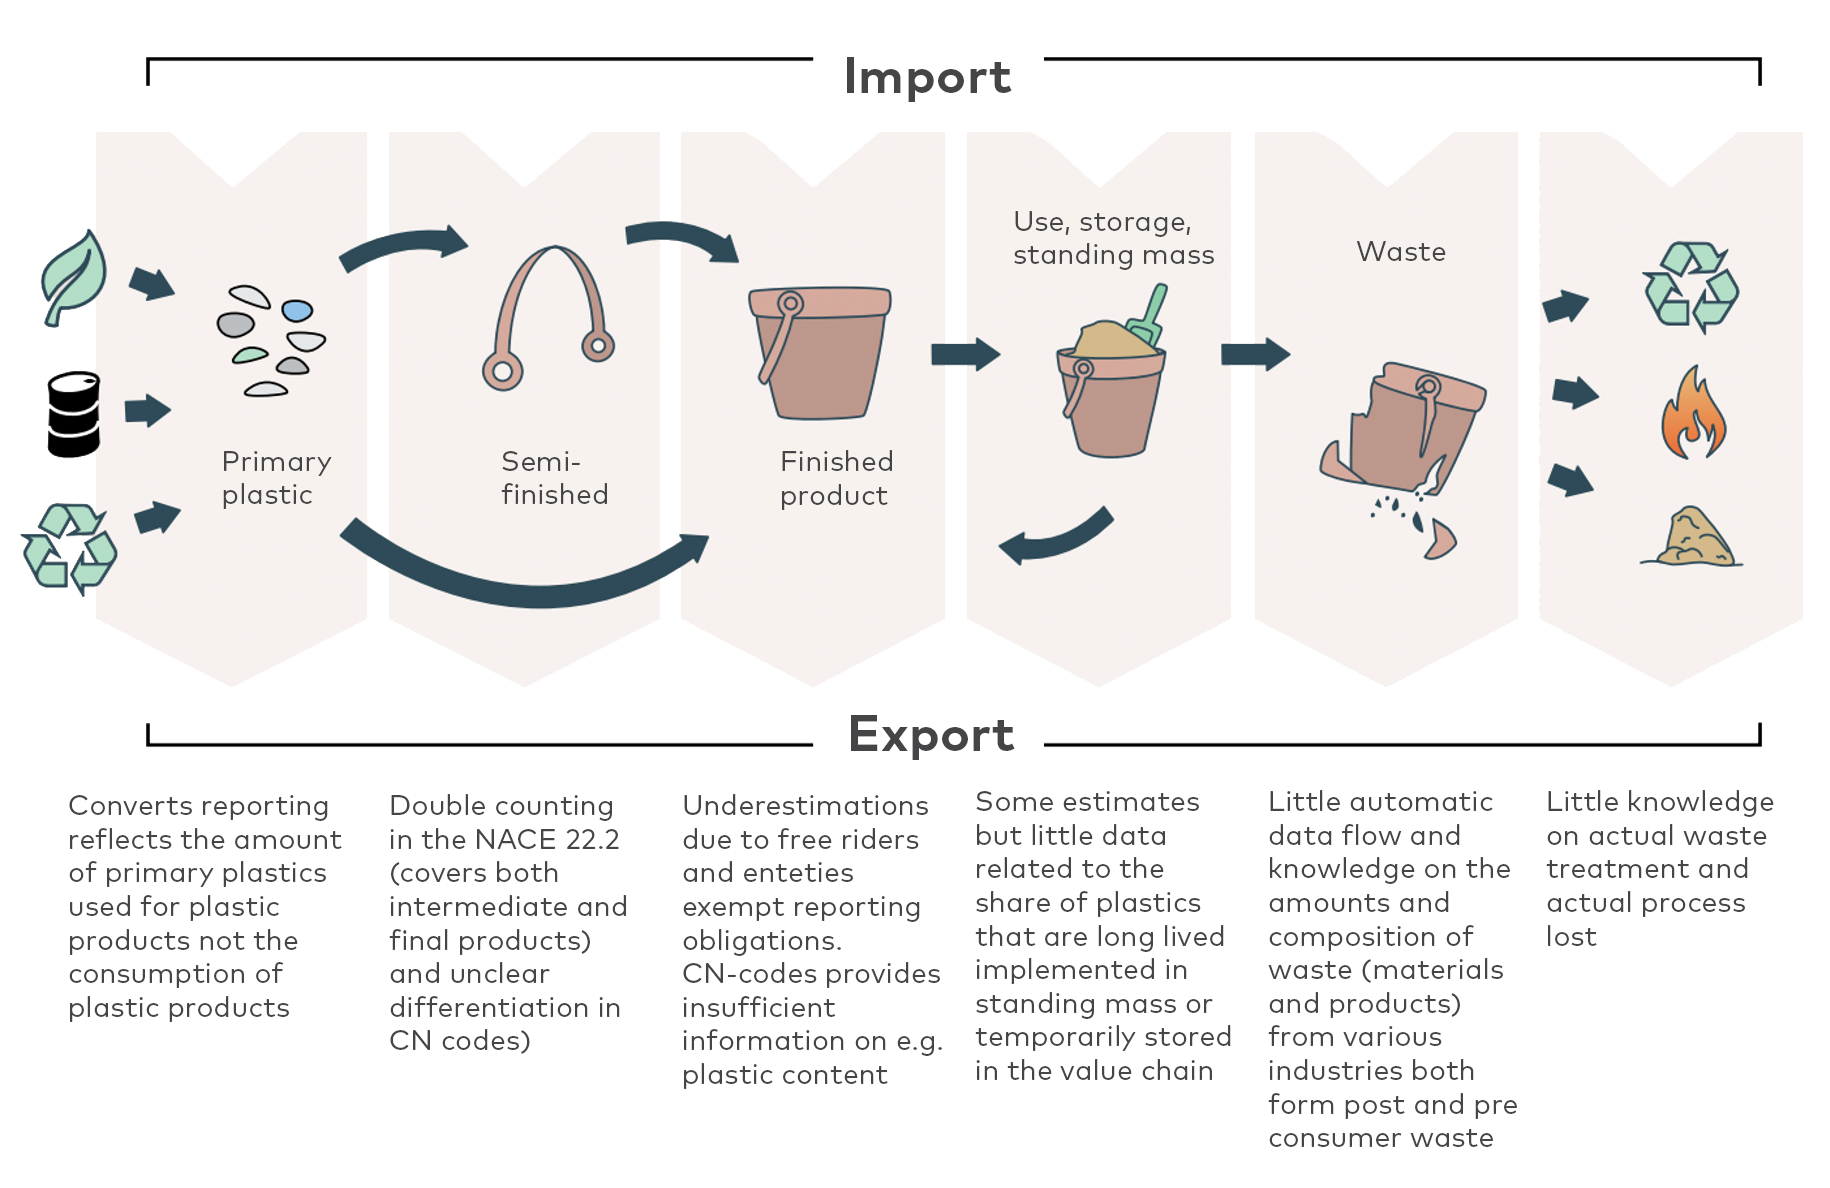
Figure 5: Summary of identified knowledge gaps and challenges found in attempts to map the national inventories of plastics in the Nordic countries.
Source: Danish, Swedish and Norwegian statistical agencies
Source: Danish, Swedish and Norwegian statistical agencies
3.5. UNITARs Plastic KEYS – a step in the right direction
Ongoing work by the UN could greatly help with several of the issues that the Nordic countries pointed out in their plastic flow analyses. The United Nations Institute for Training and Research (UNITAR) is currently developing statistical guidelines for plastic flow and plastic monitoring within the sustainable cycles programme (SCYCLE
UNITAR has created a plastic toolkit based on Plastic-KEYs, as shown in figure 6, with built-in models to calculate plastic put on the market and plastic waste generated, by polymer type and by economic sector. The necessary parameters embedded in the toolkit include plastic fraction, average weight, polymer composition, and expected lifetime for products.
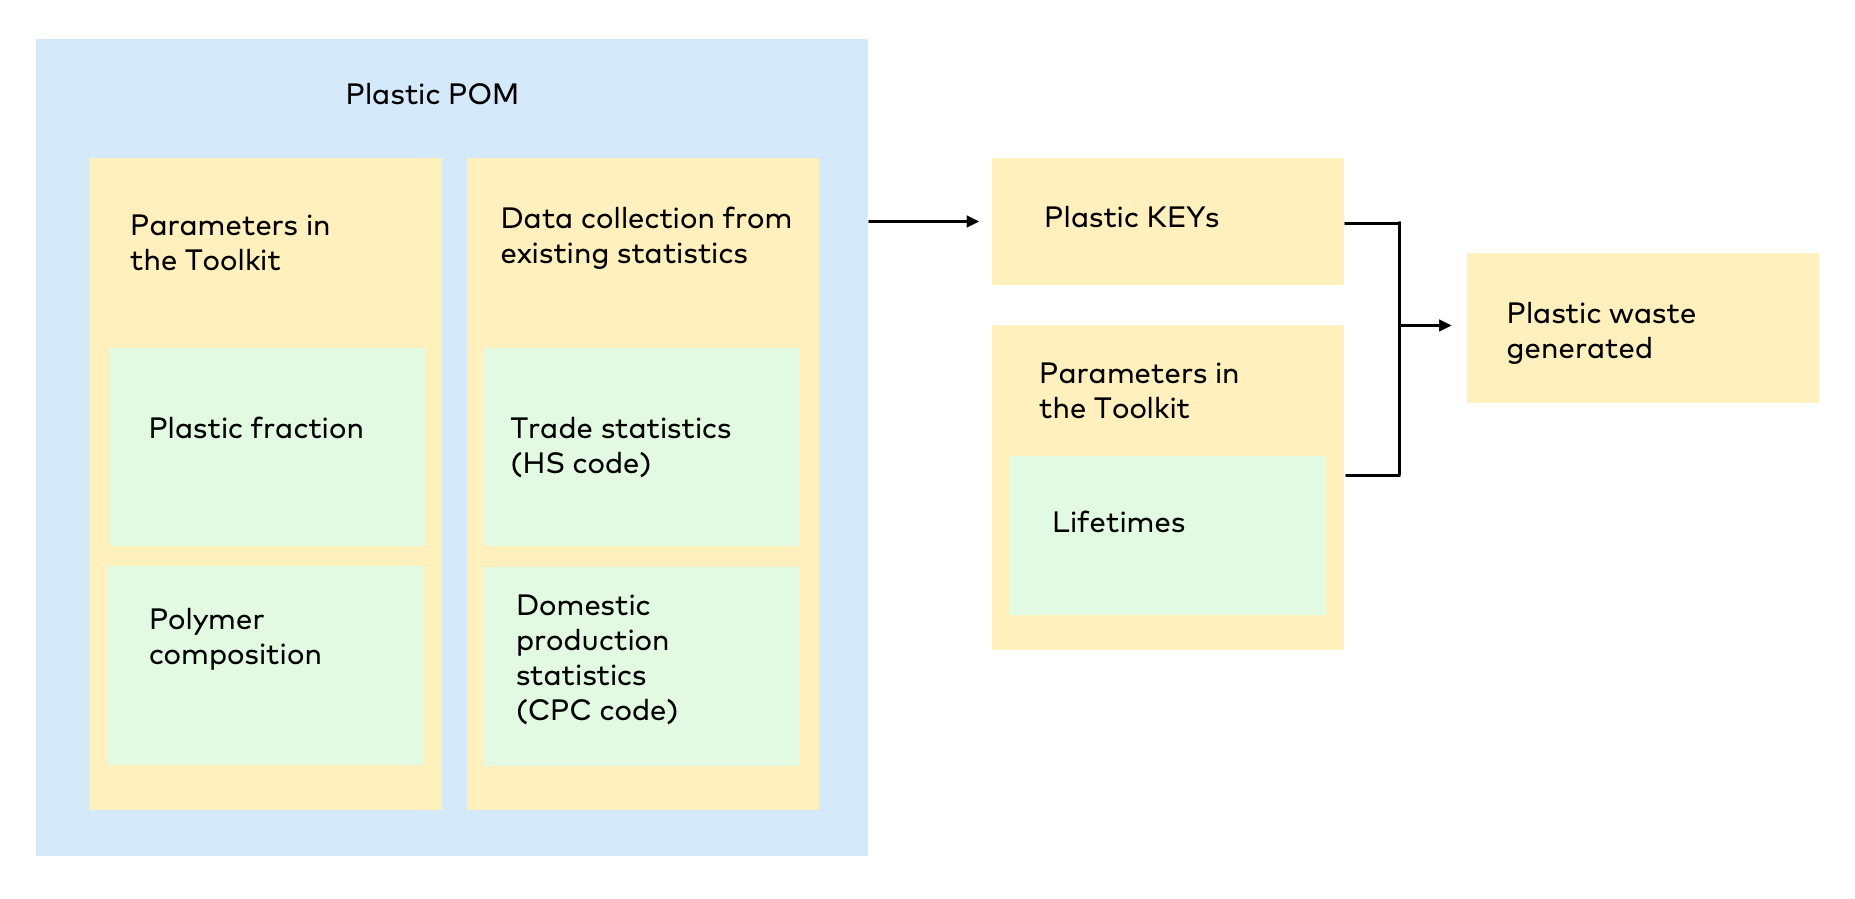
Figure 6: The basics of the Plastic-KEYs toolkit to help estimating plastic waste amounts generated
Source: UNITAR
Source: UNITAR