3 Results
Tire related additive chemicals were found in all samples analysed, except for two sediment samples from the Faroe Islands. TPPD was the predominant compound in all sample matrices, while CPPD, 77PD, Solvent red 52 and Et2N-PD were not detected in any sample (see Table 2 detection frequencies). All results are listed in Table A1 in Appendix A.
Table 2: Detection Frequencies (%) of tire related chemicals in environmental samples. Only concentrations > 1 ng/L or 1ng/g were included as detected.
Water | Sediments/Soil | Biota | ||||||
Function | Compound/Matrix | Road run-off/stormwater | Recipient | Snow | Other* | Snow dumping site/Recipient | Urban | Blue mussels |
n=20 | n=15 | n=9 | n=8 | n=12 | n=3 | n=20 | ||
Antioxidants/Antiozonants | 6PPD | 40 | 20 | 11 | 75 | 58 | 0 | 10 |
IPPD | 0 | 0 | 0 | 0 | 8 | 0 | 0 | |
77PD | 0 | 0 | 0 | 0 | 0 | 0 | 0 | |
DPPD | 35 | 7 | 44 | 63 | 50 | 67 | 0 | |
CPPD | 0 | 0 | 0 | 0 | 0 | 0 | 0 | |
TPPD | 60 | 73 | 44 | 100 | 83 | 67 | 100 | |
44PD | 5 | 7 | 0 | 0 | 0 | 0 | 0 | |
DNPD | 5 | 0 | 0 | 0 | 0 | 0 | 0 | |
DTPD | 40 | 13 | 33 | 50 | 17 | 67 | 0 | |
Et2N-PD | 0 | 0 | 0 | 0 | 0 | 0 | 0 | |
Transformation products | 6PPD-Q | 80 | 67 | 89 | 63 | 33 | 67 | 0 |
IPPD-Q | 15 | 13 | 33 | 0 | 0 | 0 | 10 | |
CPPD-Q | 15 | 0 | 11 | 0 | 8 | 0 | 95 | |
Crosslinking agent | HMMM | 100 | 100 | 89 | 88 | 0 | 0 | 5 |
Dye | Solvent red 52 | 0 | 0 | 0 | 0 | 0 | 0 | 0 |
*water from precipitation (n=5) or from sedimentation basins from a snow treatment facility (n=3).
3.1 Water samples
TPPD was generally the predominant compound in water samples, with a maximum concentration of 449,023 ng/L detected in a road run-off sample. For easier interpretation of the results, the data is being presented separately for each country (Figures 5–10). Hereby, the chemicals which were the most abundant in the samples from each country were selected for the graphical representation.
In Iceland sample number 10, collected at a road with heavy traffic, exhibited highest TPPD (18,325 ng/L), HMMM (11,548 ng/L), 6PPD (109 ng/L) and 6PPD-Q (354 ng/L) concentrations (Figure 5). Sample Iceland 17 was collected at the same location, but consisted of snow/melting snow and was collected approximately 3 weeks earlier, which could explain the still high (TPPD 7,610 ng/L; HMMM 2,769 ng/L; 6PPD n.d.; 6PPD-Q 83.4 ng/L), but significantly lower concentrations compared to sample Iceland 10. Samples collected in Akureyri (Iceland 01, 04-06; right map in Figure 5) generally exhibited lower additive concentrations compared to samples collected in Reykjavik (left map in Figure 5).
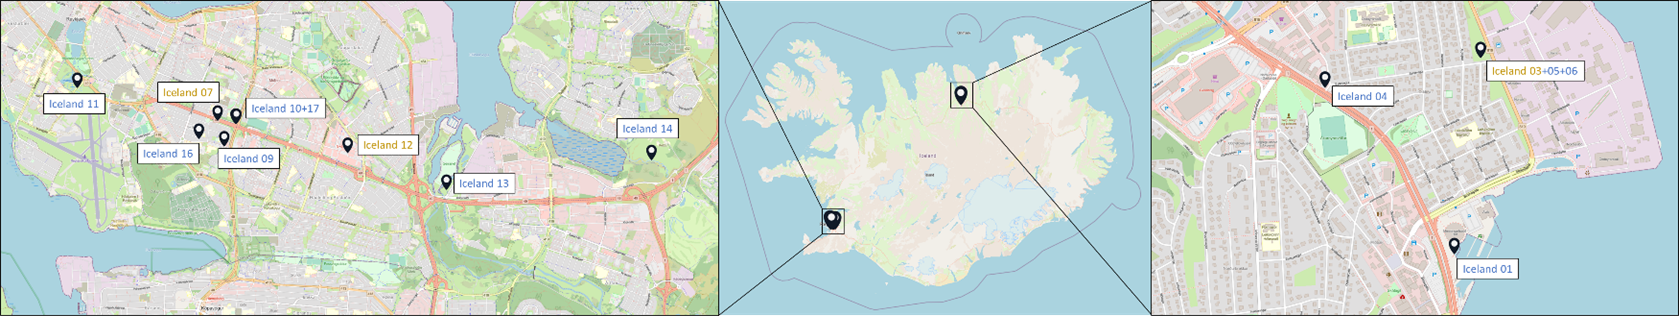
Figure 5: Concentrations in ng/L of selected tire related additive chemicals detected in water samples from Iceland.
In samples from Sweden, TPPD concentrations reached a maximum of 1,026 ng/L (Sweden 11) and HMMM a maximum of 97.5 ng/L (Sweden 17). This example shows that which TPPD and HMMM are the two predominant compounds in water samples, they do not necessarily follow the same trends. Sample Sweden 19 exhibited the lowest additive concentrations, with a ∑ concentration of 4.1 ng/L. The examples of samples Sweden 11 + 12, Sweden 17 + 18 and Sweden 19 + 20 indicate that the chemical pattern observed in stormwater tubes and their corresponding recipients can be very different (Figure 6). This information can be of high relevance for stakeholders, e.g. for the selection of relevant sites for the monitoring of tire related additive chemicals.
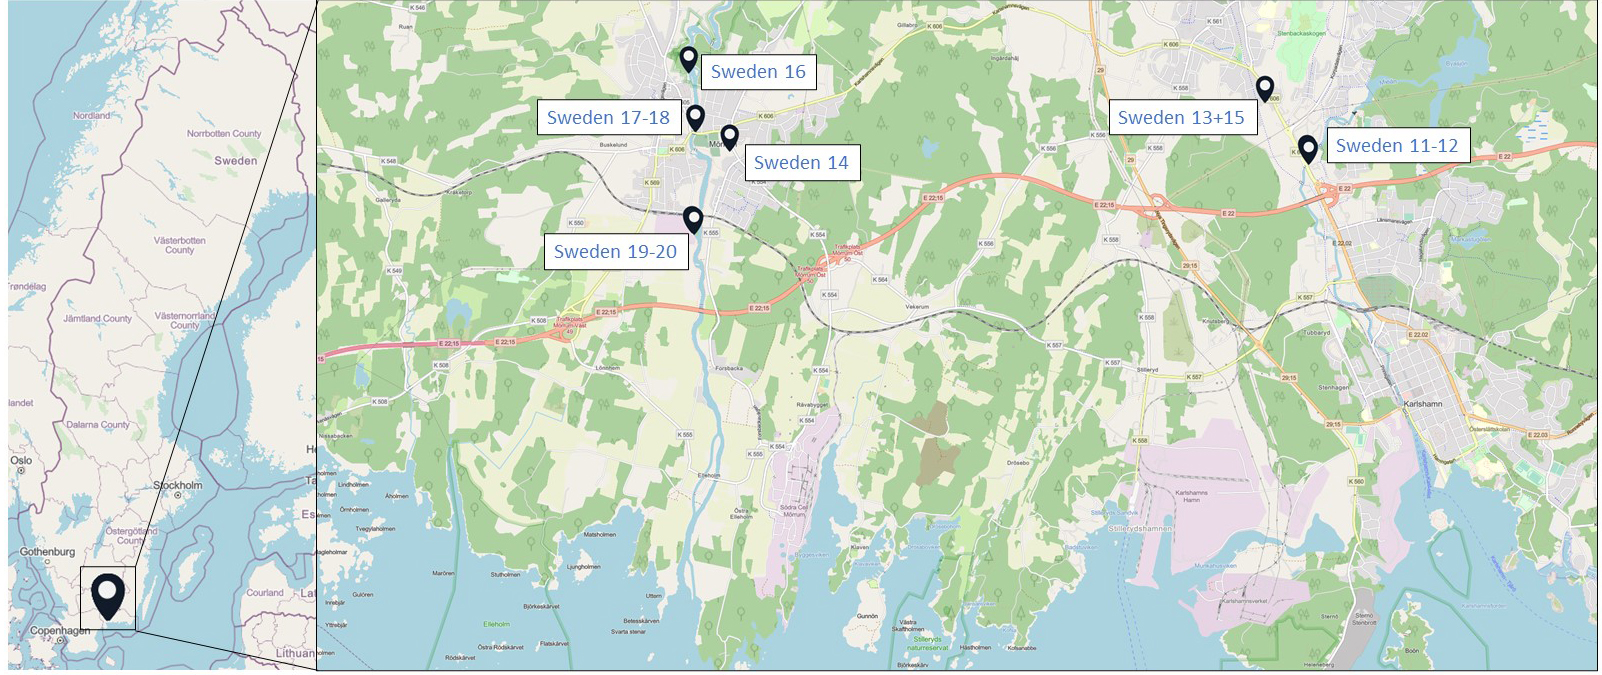
Figure 6: Concentrations in ng/L of selected tire related additive chemicals detected in water samples from Sweden.
In samples from the Faroe Islands a high heterogeneity was observed, e.g. in the TPPD concentrations which ranged from 4,185 ng/L (Faroe Islands 10) to 449,023 ng/L (Faroe Islands 07), the highest TPPD concentration detected in this study. Generally, the road run-off samples exhibited highest concentrations of tire related additive chemicals (Faroe Islands 03, 05-07), while samples from recipients (Faroe Islands 08 & 10) exhibited lowest concentrations (Figure 7).
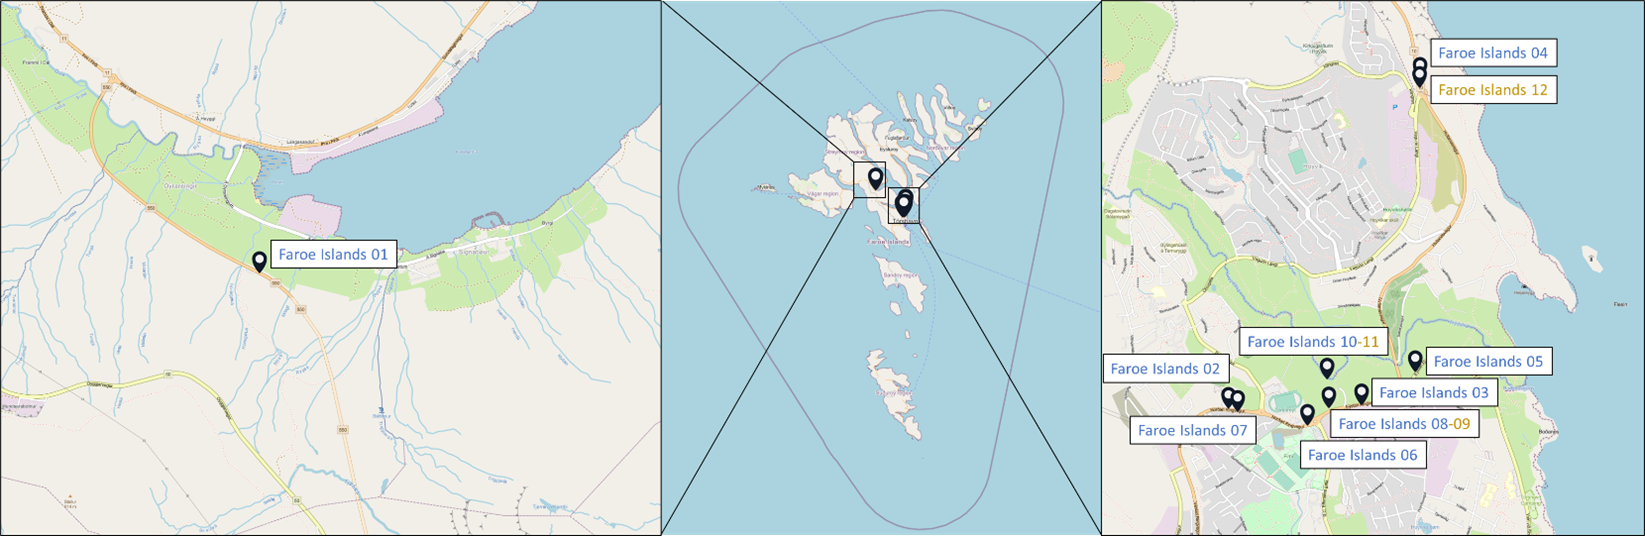
Figure 7: Concentrations in ng/L of selected tire related additive chemicals detected in water samples from the Faroe Islands.
In water samples from Finland, the two storm-/meltwater samples Finland 12 and 13, collected at the same location, exhibited highest TPPD, HMMM and 6PPD-Q concentrations (Figure 8). Sample Finland 11, collected at an urban stream, showed lowest concentrations, with a ∑ concentration of 235 ng/L. The stormwater samples collected after filtration ponds (Finland 09 & 15) show that after the natural filtration system (based on vegetation), tire related additive chemicals can still be detected in the water, though at varying concentrations.
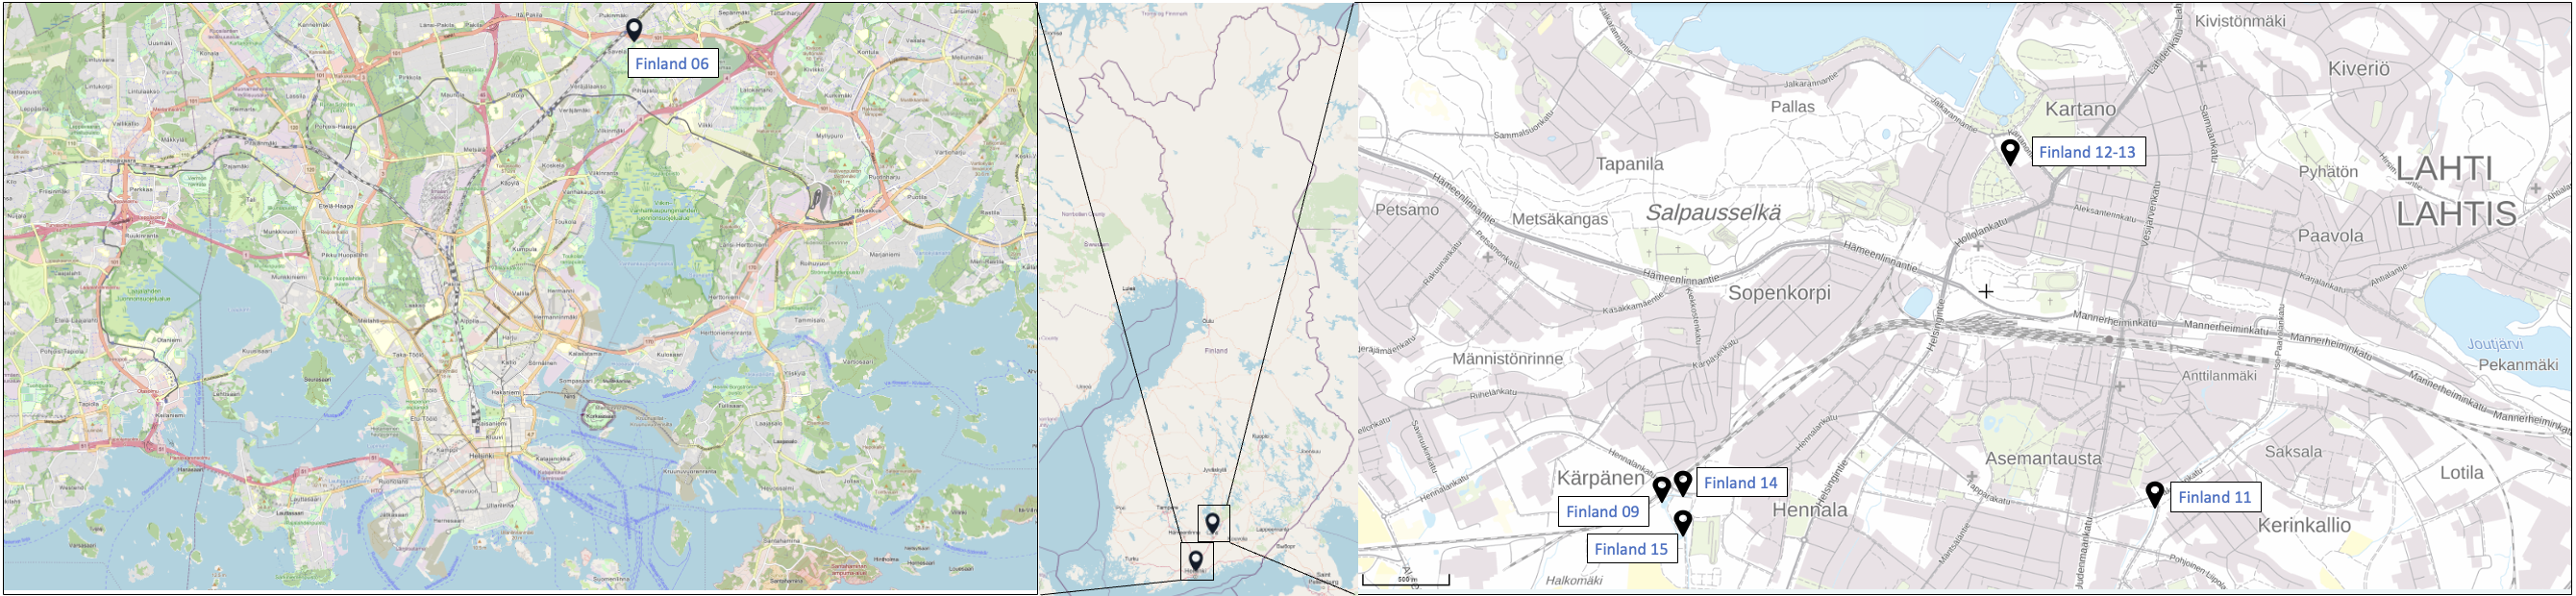
Figure 8: Concentrations in ng/L of selected tire related additive chemicals detected in water samples from Finland.
Water samples from Denmark consisted of road run-off (Denmark 03 & 05) and recipient waters (Denmark 02, 06 & 08) from/near a major road (Figure 9). Interestingly, TPPD was not detected in the two road run-off samples, but they exhibited the highest HMMM concentrations (1,674 and 1,295 ng/L, respectively). 6PPD-Q showed highest concentrations in sample Denmark 03 (35.3 ng/L), while its parent compound 6PPD was absent in this sample.
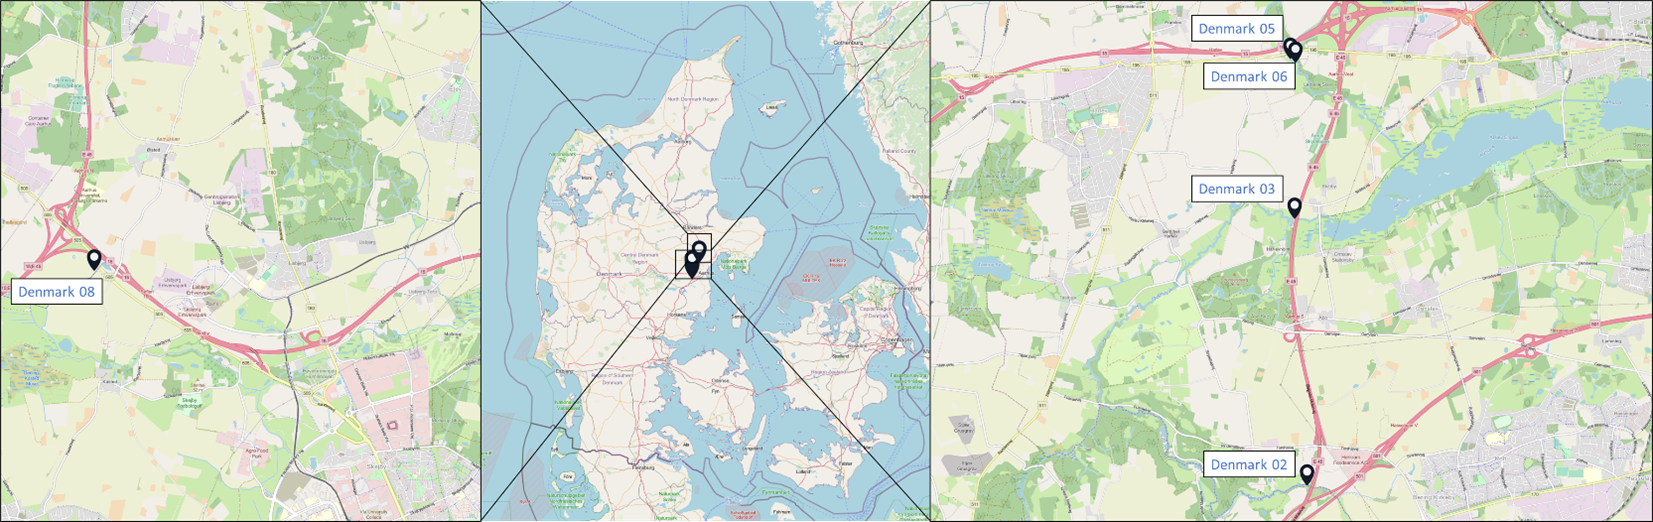
Figure 9: Concentrations in ng/L of selected tire related additive chemicals detected in water samples from Denmark.
In Norway, a snow sample from a residential background site (Norway 01) exhibited lowest additive concentrations (∑ 4.0 ng/L), while samples with highest concentrations all originated from a snow treatment facility (Norway 03, 04 & 06) (Figure 10). Samples Norway 15-19 represent dry and wet atmospheric deposition collected during a 14-day period each. The amount of tire related additive chemicals in these samples is not correlated with the amount of precipitation during the sampling periods (see Table 1). This suggests that the presence of these chemicals in these samples might rather be related to the presence of small airborne tire wear particles. The increasing concentrations towards the later sampling timepoints (e.g. Norway 18: 27.09.2023-11.10.2023 and Norway 19: 11.10.2023-25.10.2023) might be correlated with a switch from summer tires to winter tires.
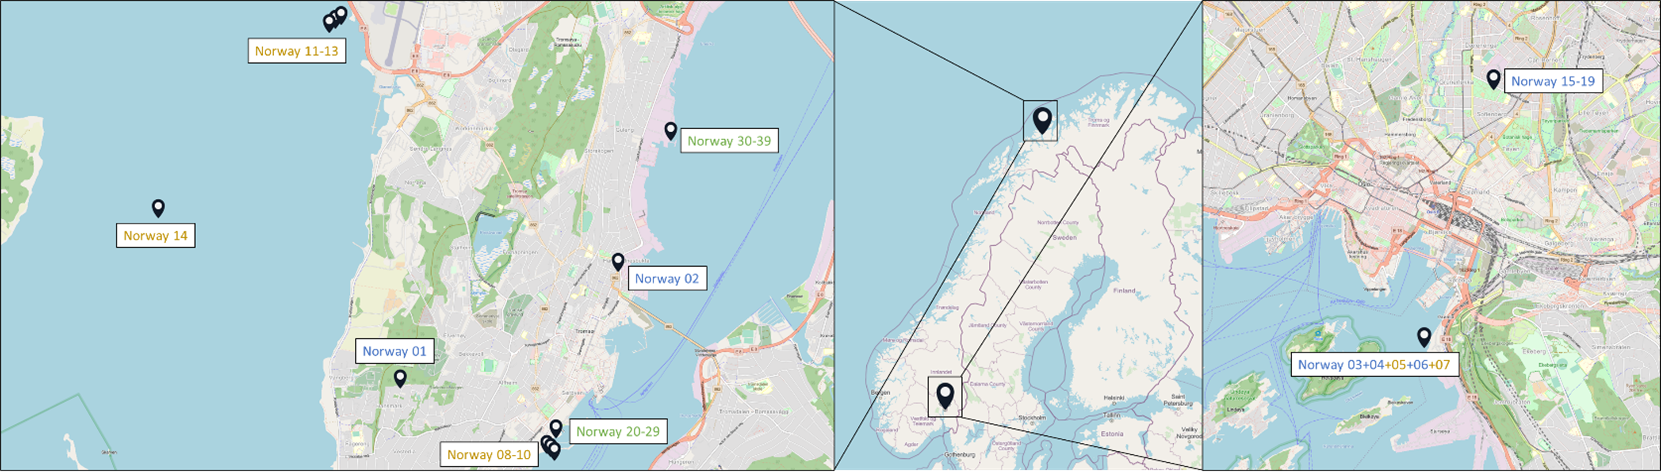
Figure 10: Concentrations in ng/L of selected tire related additive chemicals detected in water samples from Norway.
3.2 Sediment samples
In sediment samples, the highest chemical concentrations were observed in the two samples from the snow treatment facility in Oslo (Norway 05 and 07). Here, TPPD reached concentrations of 83,746-131,064 ng/g (Figure 11). The maximum 6PPD concentration was 278 ng/g, while its transformation product 6PPD-Q reached 13.7 ng/g.
Figure 11: Concentrations in ng/g (dry weight) of tire related additive chemicals detected in sediment samples. Only chemicals detected at concentrations >LOQ in at least one sample are included. Please note the different scales on the y-axes.
3.3 Biota samples
As for water and sediment samples, TPPD was the predominant compound in blue mussel samples, with a maximum concentration of 737 ng/g and a high variability in concentrations among individual mussels (Figure 12). Of the three antioxidant transformation products measured in this study, CPPD-Q was the most abundant compound in biota samples, detected in all samples except one with values ranging from 1.2 to 9.6 ng/g.
Figure 12: Concentrations in ng/g (wet weight) of tire related additive chemicals detected in blue mussel samples. Only chemicals that were detected in at least one sample at concentrations >LOQ are included. Please note the different scales on the y-axes.