2 Methods
2.1 Screening strategy
Samples originated from six Nordic countries, namely Iceland, the Faroe Islands, Norway, Denmark, Sweden and Finland (Figure 1). The locations of the individual sampling stations are indicated in Figure 2. To screen for tire related additive chemicals in a variety of sample types and environmental contexts, the sampling locations chosen in this study include urban areas with high and low road traffic and background sites. Sites, where specific measures are taken to stock or treat road run-off or snow from roads, were also included. These comprise snow dumping sites, a snow treatment facility in Oslo (Norway) and a stormwater treatment system in Finland. Some examples of sampling stations are shown in Figure 3.
Whenever available, information concerning rainfall or the application of road salts during the sampling period was collected.
Due to challenges, such as a lack of rain during long periods in spring in the Nordic countries, not all planned samples could be collected, and some sample bottles broke during shipment. To compensate, five samples of atmospheric deposition and 20 blue mussel samples were included for analysis.
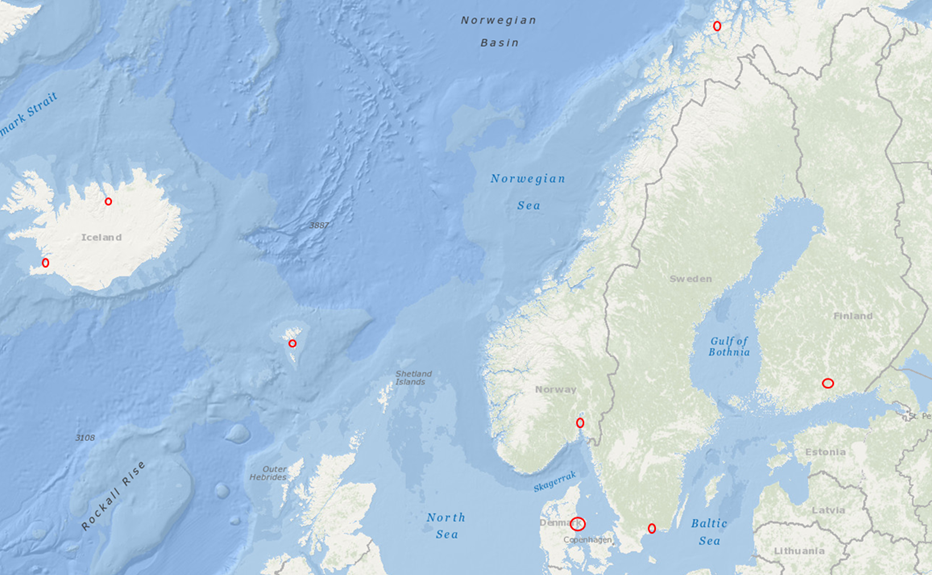
Figure 1: Sampling locations in Iceland, the Faroe Islands, Norway, Denmark, Sweden and Finland. Map source: NOAA.
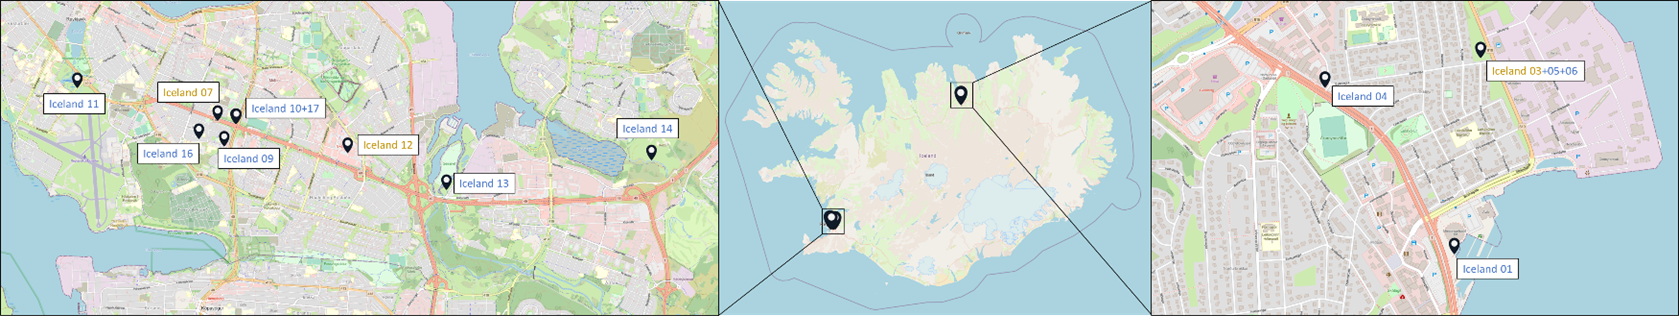
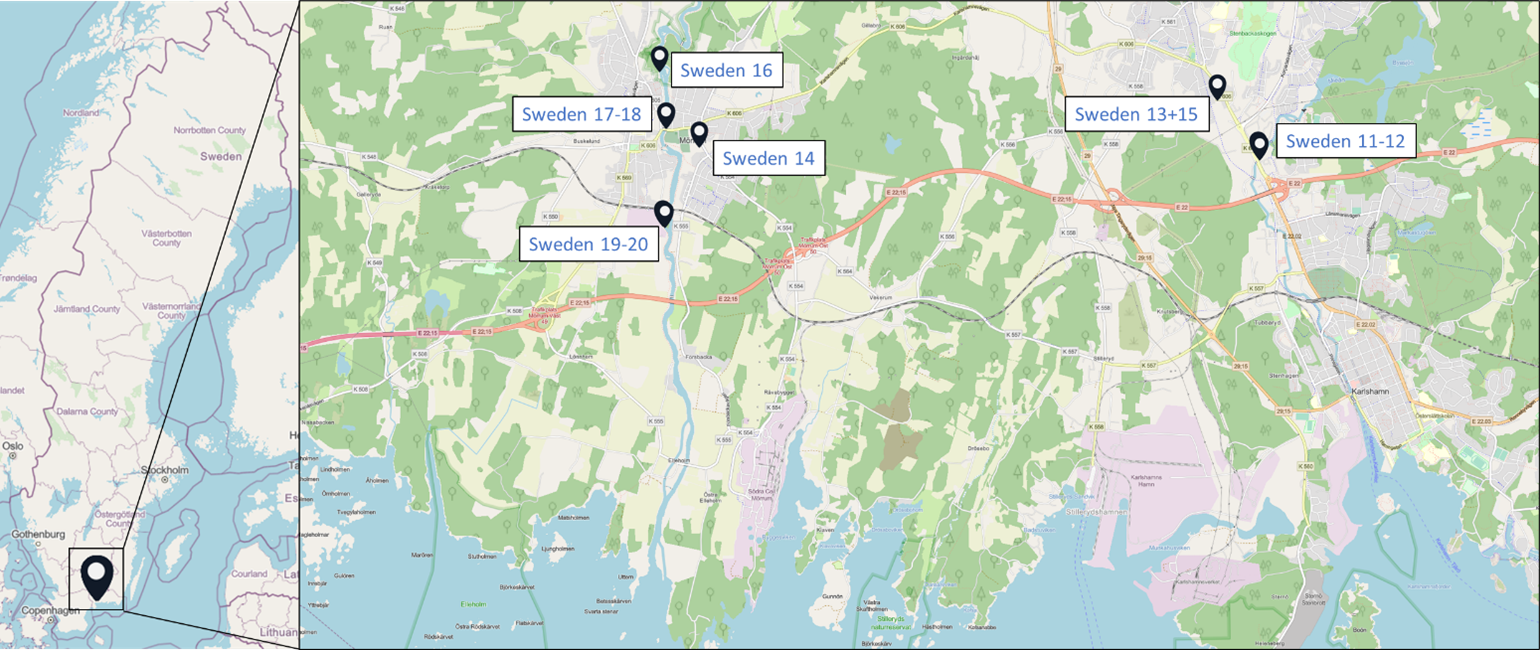
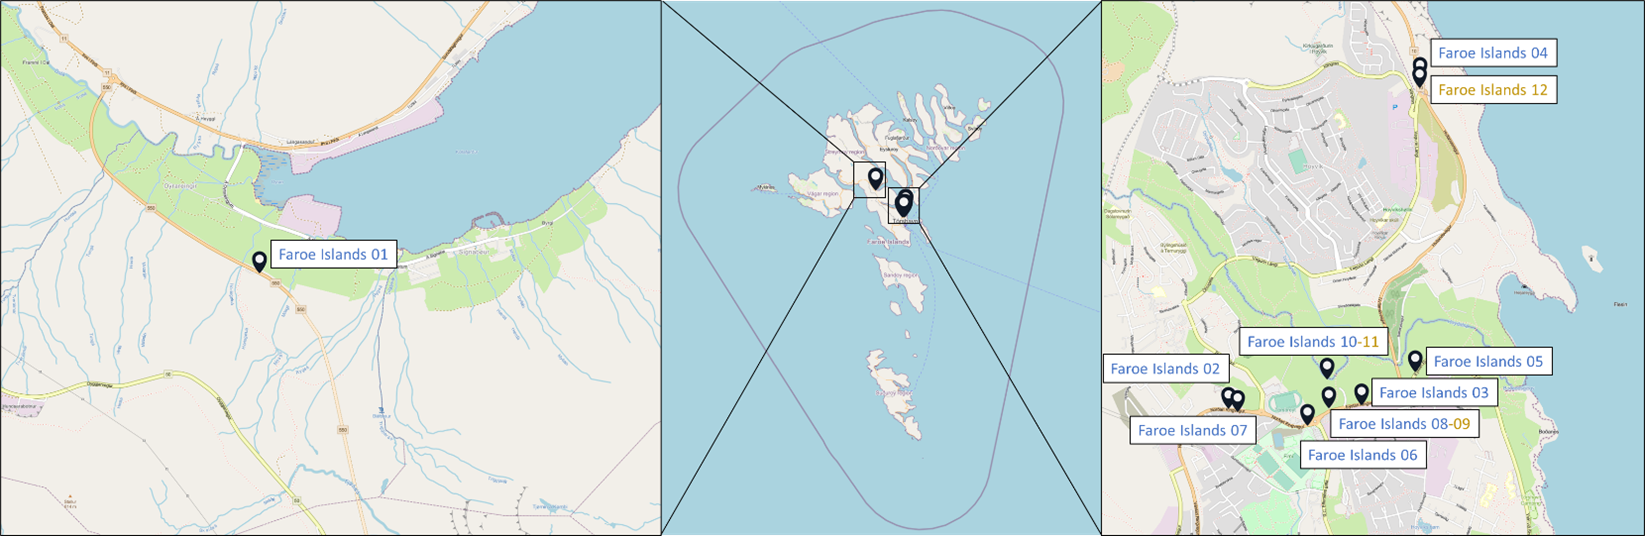
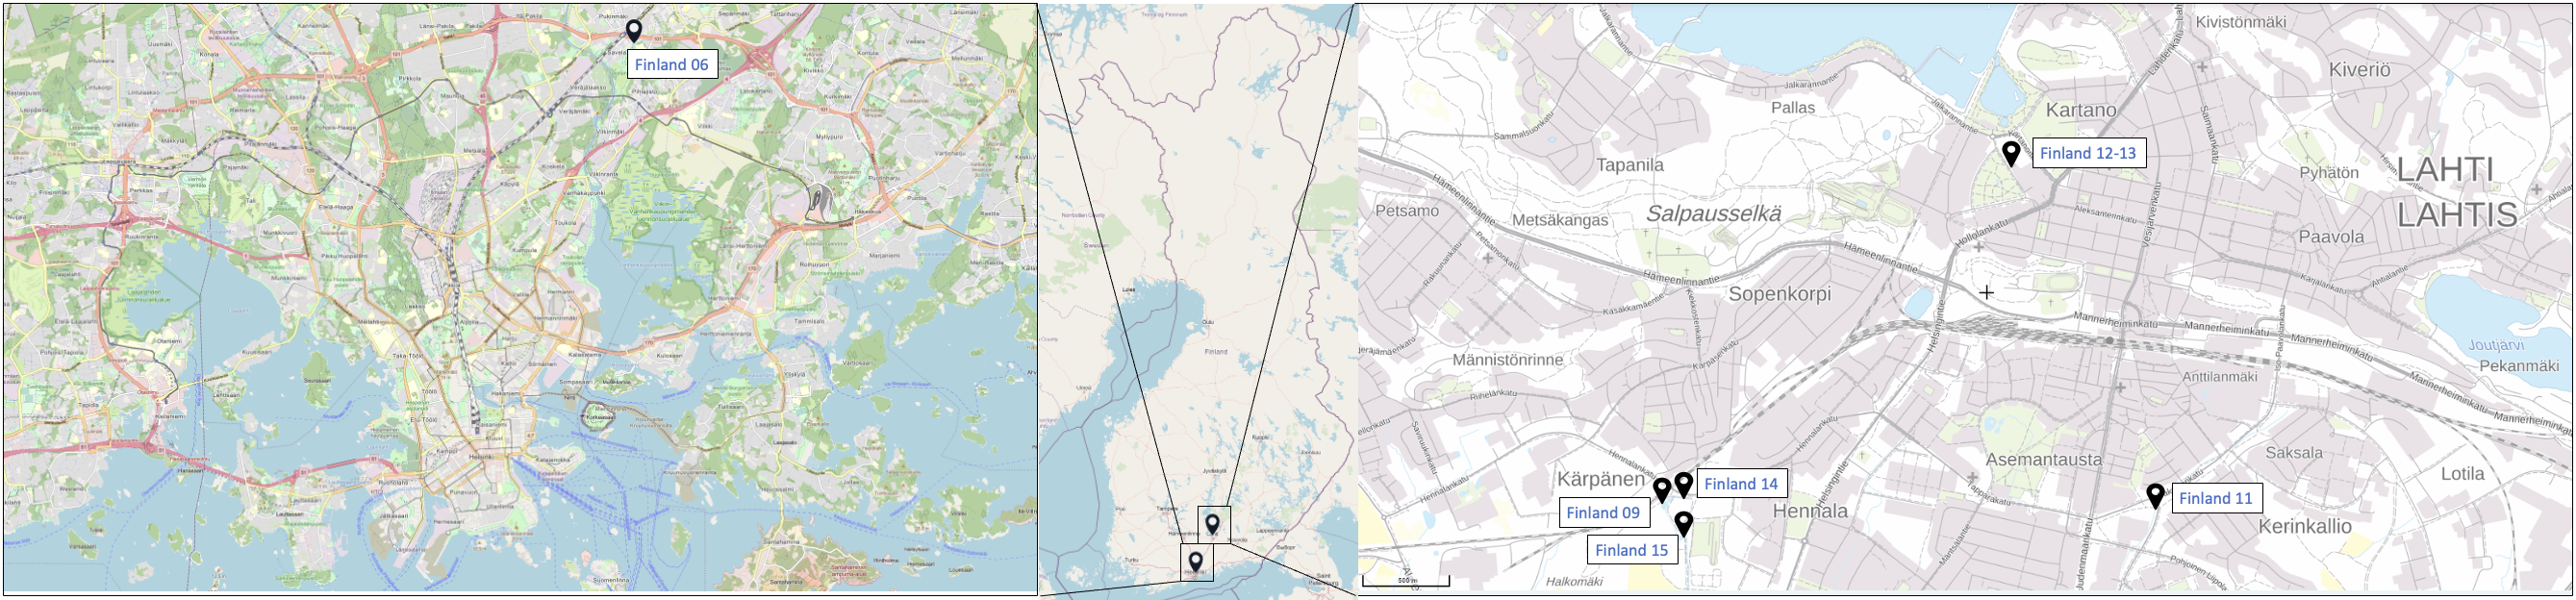
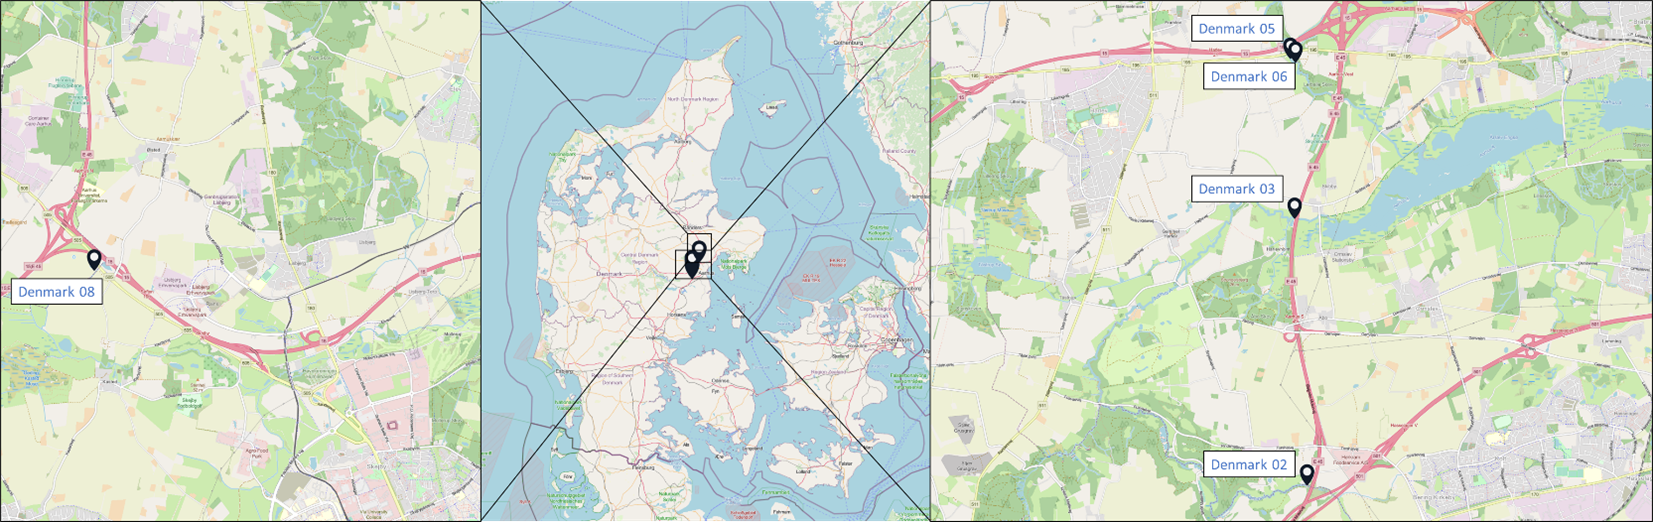
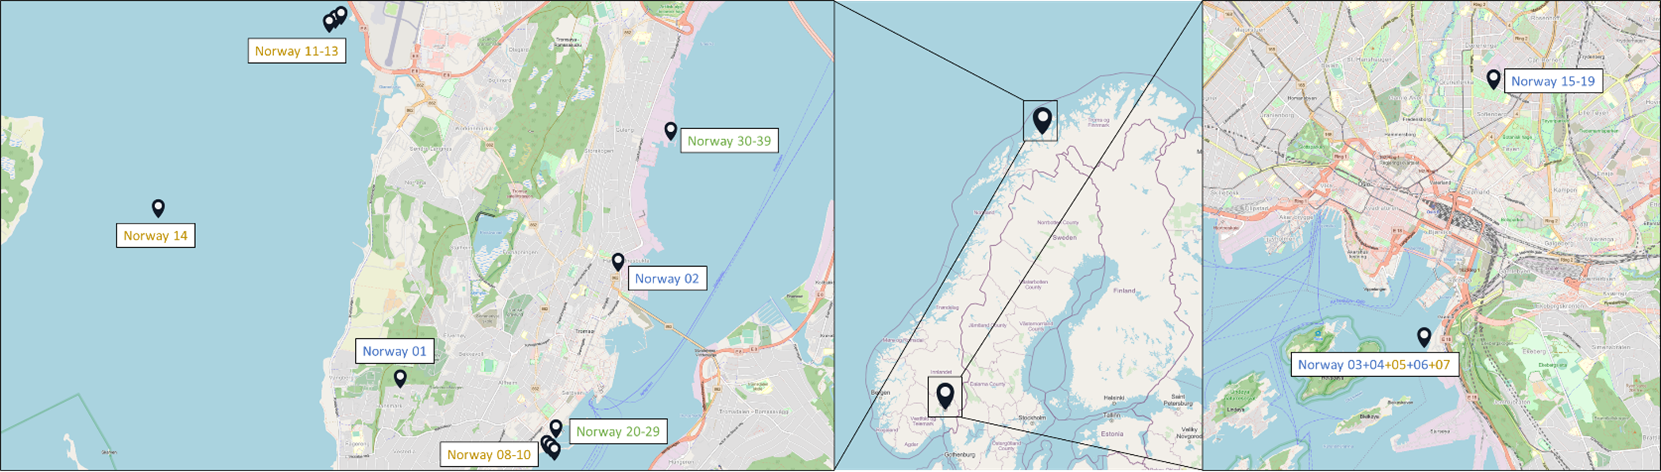
Figure 2: Location of the sampling stations in (from top to bottom) Iceland, Sweden, the Faroe Islands, Finland, Denmark and Norway. The font colour of the sample IDs indicates the sample types: water [including snow and precipitation] (blue), sediment (brown) or biota (green).
Map source: NOAA.
Map source: NOAA.
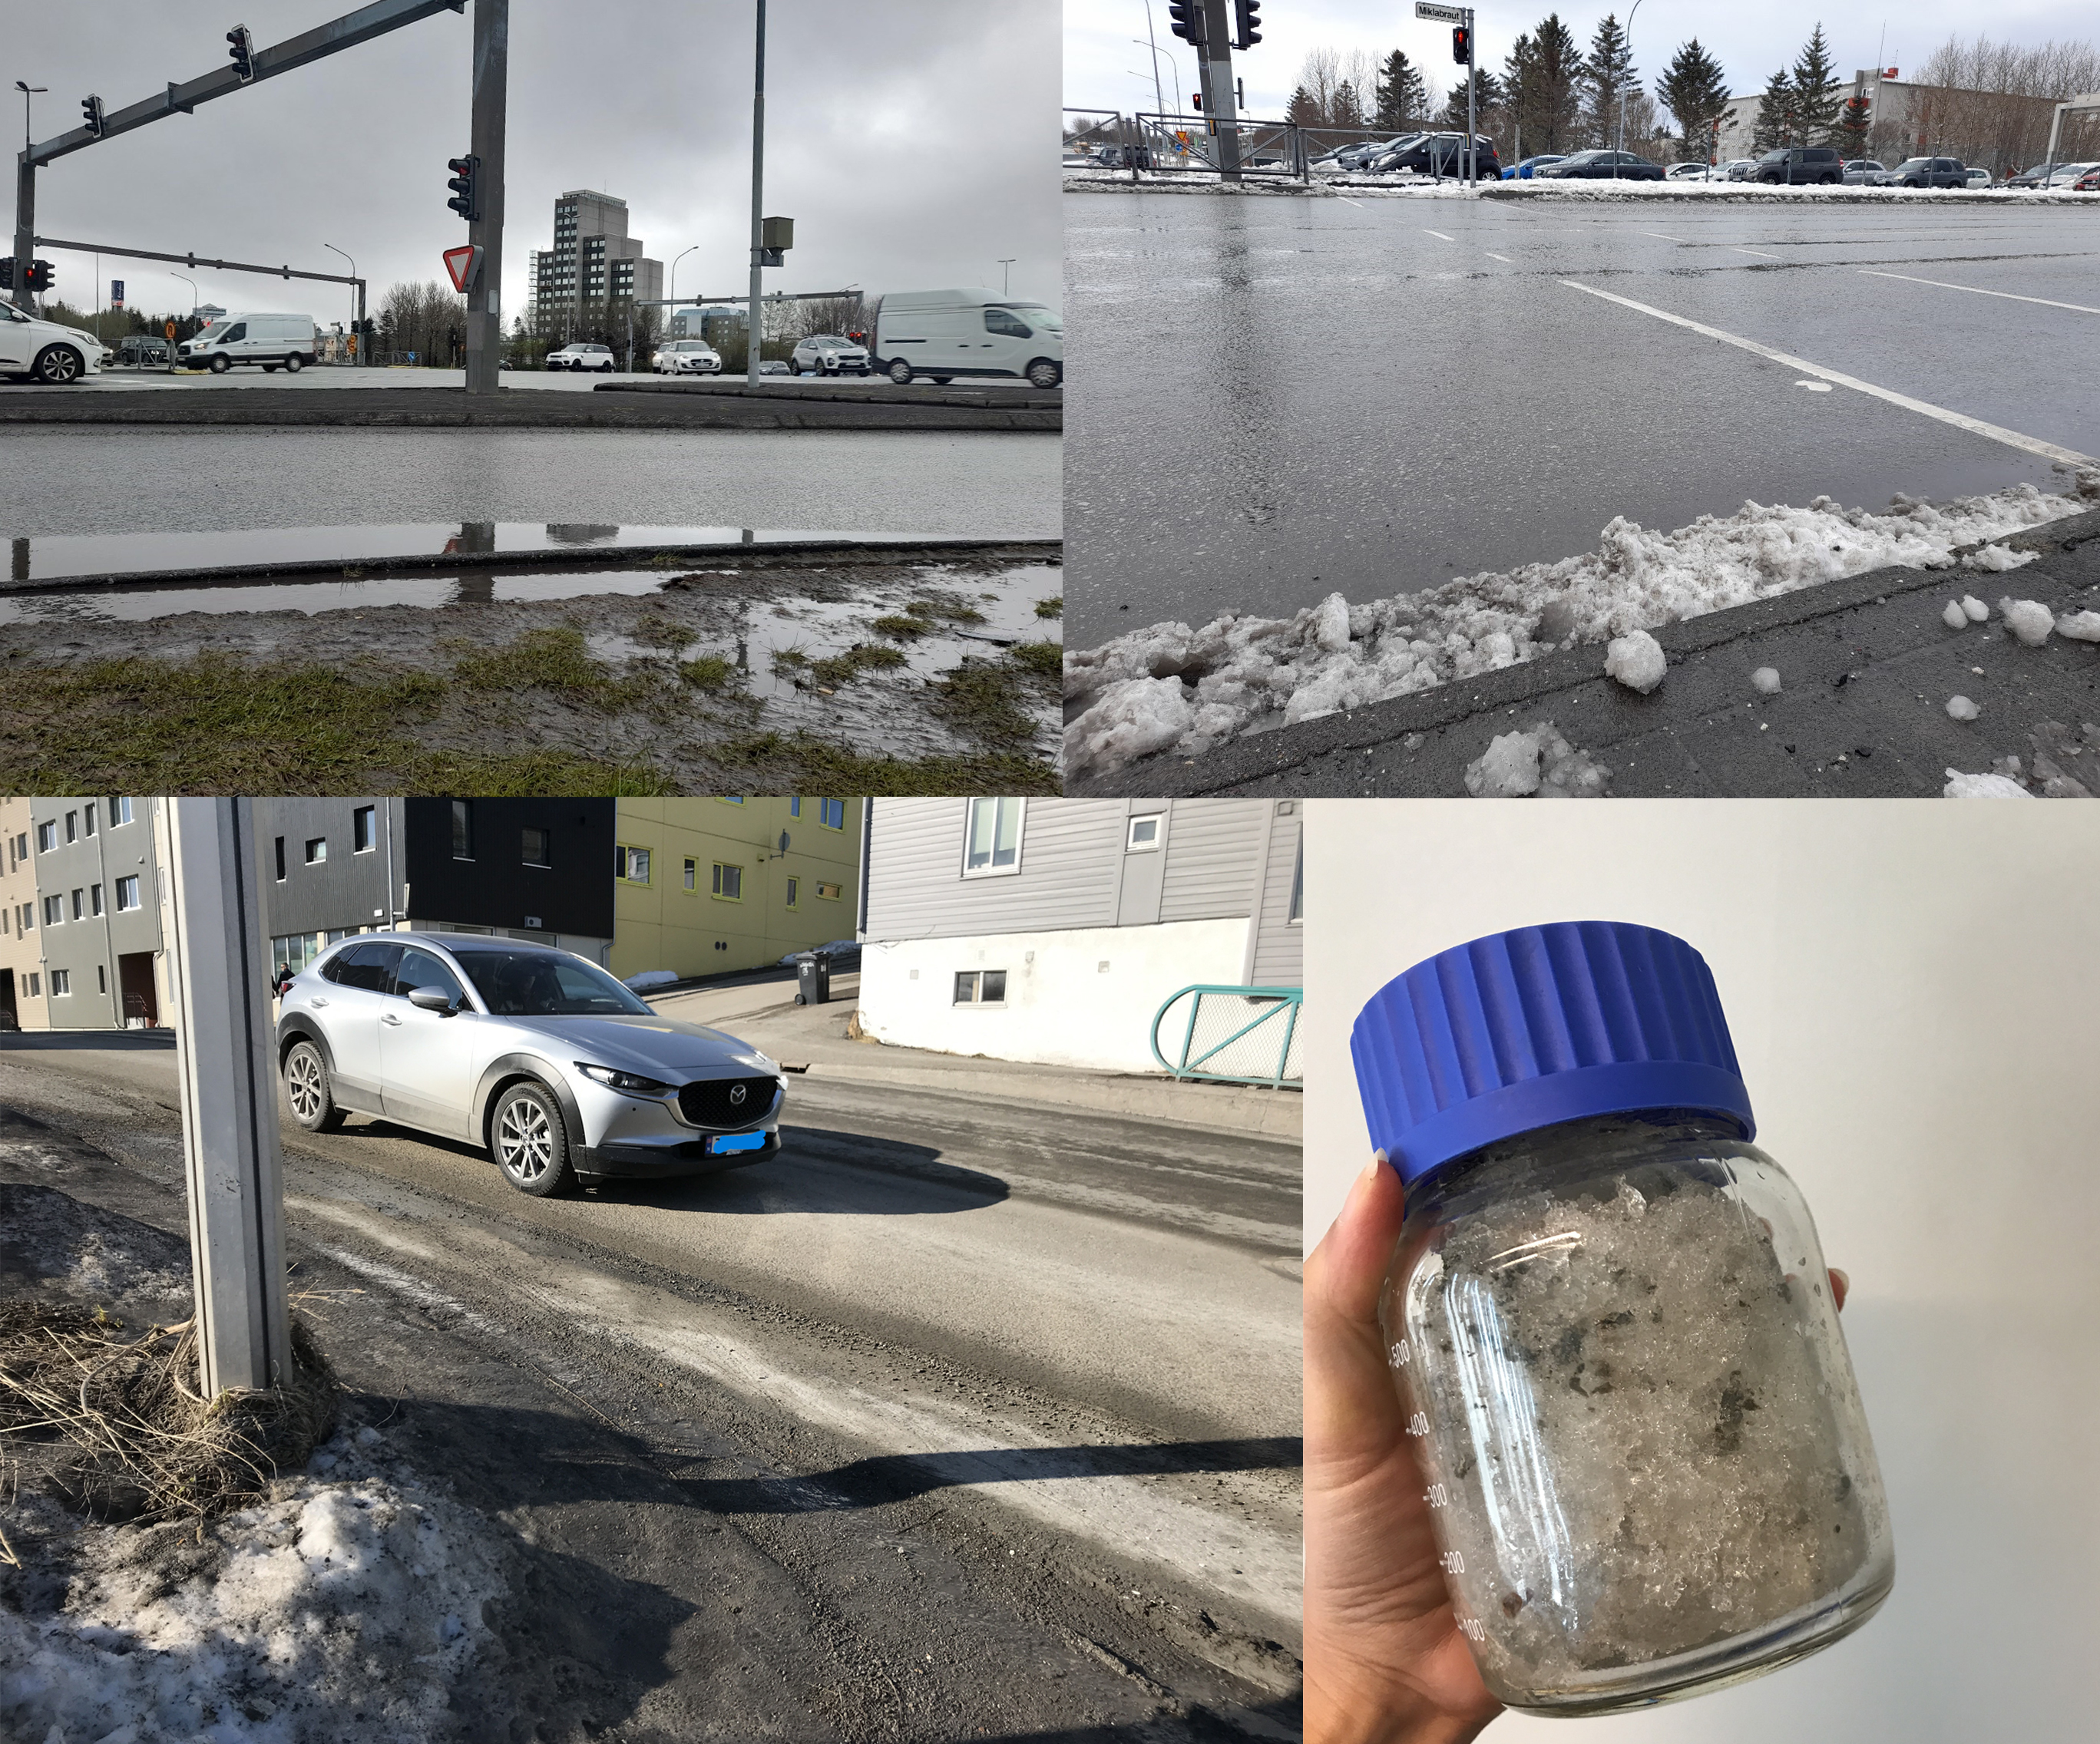
Figure 3: Examples of sampling location. Top left: Iceland 10, top right: Iceland 17, bottom left: Norway 02, bottom right: Norway 02 sample in glass bottle. © Photos top left and top right: Bergdís Björk Bæringsdóttir. © Photos bottom left and bottom right: Natascha Schmidt.
2.2 Sampling methods
Samples were collected from late winter to early summer 2023. Road run-off was collected during or following rain events. All samples were collected in 500 mL or 1 L pre-burnt (450°C, 8 h) glass bottles covered with aluminum foil. If possible, samples were sent frozen to the NILU laboratory and stored in the freezer upon arrival. In total, 87 samples were analyzed. Sample details are listed in Table 1.
Table 1: Details on sample ID, sample type, location, date, rainfall within the past 24 hours before sampling (when relevant) and additional information.
Sample ID | Sample type | Location | Date | Rainfall (last 24 h) | Details |
Iceland 01 | Water | 65.682726, -18.087351 | 30.06.2023 | 0.2 mm | Road run-off recipient (ocean) |
Iceland 03 | Sediment | 65.688057, -18.085776 | 04.04.2023 | 0 mm | Soil from snow dumping site |
Iceland 04 | Water | 65.687221, -18.095865 | 30.06.2023 | 0.2 mm | Road run-off water |
Iceland 05 | Snow | 65.688057, -18.085776 | 04.04.2023 | 0 mm | Snow dumping site |
Iceland 06 | Snow | 65.688057, -18.085776 | 04.04.2023 | 0 mm | Snow dumping site |
Iceland 07 | Sediment | 64.133775, -21.903341 | 19.05.2023 | 2 mm | Soil close to road |
Iceland 09 | Water | 64.130688, -21.901615 | 12.05.2023 | 9.9 mm | Road run-off |
Iceland 10 | Water | 64.133450, -21.898427 | 19.05.2023 | 2 mm | Road with heavy traffic |
Iceland 11 | Water | 64.137682, -21.941952 | 12.05.2023 | 9.9 mm | Road run-off recipient, stream |
Iceland 12 | Sediment | 64.129918, -21.867733 | 12.05.2023 | 9.9 mm | Soil from big parking lot |
Iceland 13 | Water | 64.125484, -21.840630 | 12.05.2023 | 9.9 mm | Road run-off recipient, retention pond |
Iceland 14 | Water | 64.129029, -21.784306 | 12.05.2023 | 9.9 mm | Road run-off recipient, stream |
Iceland 16 | Snow | 64.131593, -21.908594 | 27.04.2023 | 0.5 mm | Snow/melting snow (little traffic) |
Iceland 17 | Snow | 64.133388, -21.898252 | 27.04.2023 | 0.5 mm | Snow/melting snow (heavy traffic) |
Sweden 11 | Water | 56.1911647, 14.8451090 | 19.06.2023 | 20 mm | Stormwater tube |
Sweden 12 | Water | 56.1911749, 14.8450171 | 19.06.2023 | 20 mm | Recipient |
Sweden 13 | Water | 56.1964898, 14.8383000 | 19.06.2023 | 20 mm | Stormwater tube |
Sweden 14 | Water | 56.1921212, 14.7545221 | 19.06.2023 | 20 mm | Stormwater tube/ very small stream |
Sweden 15 | Water | 56.1964898, 14.8383000 | 19.06.2023 | 20 mm | Stormwater well |
Sweden 16 | Water | 56.1989597, 14.7478497 | 19.06.2023 | 20 mm | Recipient |
Sweden 17 | Water | 56.1938351, 14.7491084 | 19.06.2023 | 20 mm | Stormwater tube |
Sweden 18 | Water | 56.1938552, 14.7489291 | 19.06.2023 | 20 mm | Recipient |
Sweden 19 | Water | 56.1849898, 14.7484205 | 19.06.2023 | 20 mm | Stormwater tube |
Sweden 20 | Water | 56.1849851, 14.7486089 | 19.06.2023 | 20 mm | Recipient |
Faroe Islands 01 | Snow | 62.095833, -6.944167 | 14.03.2023 | 1.4 mm | Snow (side of the road) |
Faroe Islands 02 | Snow | 62.021744, -6.785019 | 16.03.2023 | 7.2 mm | Snow (side of the road) |
Faroe Islands 03 | Water | 62.021908, -6.771858 | 23.03.2023 | 12 mm | Road run-off water |
Faroe Islands 04 | Snow | 62.036944, -6.766111 | 14.03.2023 | 1.4 mm | Snow |
Faroe Islands 05 | Water | 62.023364, -6.766742 | 23.03.2023 | 12 mm | Road run-off water |
Faroe Islands 06 | Water | 62.020944, -6.777294 | 23.03.2023 | 12 mm | Road run-off water |
Faroe Islands 07 | Water | 62.021617, -6.783922 | 23.03.2023 | 12 mm | Road run-off water |
Faroe Islands 08 | Water | 62.021731, -6.775153 | 23.03.2023 | 12 mm | Recipient |
Faroe Islands 09 | Sediment | 62.021731, -6.775153 | 23.03.2023 | 12 mm | Recipient |
Faroe Islands 10 | Water | 62.022981, -6.775047 | 23.03.2023 | 12 mm | Recipient |
Faroe Islands 11 | Sediment | 62.022981, -6.767547 | 23.03.2023 | 12 mm | Recipient |
Faroe Islands 12 | Sediment | 62.036617, -6.766206 | 11.04.2023 | 8.4 mm | Soil from side of the road |
Finland 06 | Water | 60.240463, 24.997300 | 18.04.2023 | 0 mm | Stream |
Finland 09 | Water | 60.967123, 25.110517 | 06.04.2023 | 0 mm | Stormwater after filtration pond |
Finland 11 | Water | 60.965572, 25.660345 | 06.04.2023 | 0 mm | Urban stream |
Finland 12 | Water | 60.985325, 25.646433 | 06.04.2023 | 0 mm | Storm/melt water |
Finland 13 | Water | 60.985325, 25.646433 | 06.04.2023 | 0 mm | Storm/melt water |
Finland 14 | Water | 60.967934, 25.610367 | 06.04.2023 | 0 mm | Storm/melt water |
Finland 15 | Water | 60.965782, 23.445733 | 06.04.2023 | 0 mm | Stormwater after filtration ponds |
Denmark 02 | Water | 56.104740, 10.037850 | 10.07.2023 | 8 mm | Recipient |
Denmark 03 | Water | 56.134560, 10.035190 | 10.07.2023 | 11 mm | Road run-off |
Denmark 05 | Water | 56.152270, 10.034550 | 10.07.2023 | 14 mm | Road run-off |
Denmark 06 | Water | 56.151970, 10.035350 | 10.07.2023 | 14 mm | Recipient |
Denmark 08 | Water | 56.22020, 10.126170 | 10.07.2023 | 15 mm | Recipient |
Norway 01 | Snow | 69.647226, 18.914239 | 14.04.2023 | 0 mm | Residential area, background site |
Norway 02 | Snow | 69.656328, 18.963571 | 14.04.2023 | 0 mm | Road with heavy traffic |
Norway 03 | Water | 59.896573, 10.749784 | 10.02.2023 | - | Outlet of snow treatment facility |
Norway 04 | Water | 59.896573, 10.749784 | 10.02.2023 | - | Last sedimentation basin before filtration step, snow treatment facility |
Norway 05 | Sediment | 59.896573, 10.749784 | 10.02.2023 | - | First sedimentation basin, snow treatment facility |
Norway 06 | Water | 59.896573, 10.749784 | 10.02.2023 | - | First sedimentation basin, snow treatment facility |
Norway 07 | Sediment | 59.896573, 10.749784 | 10.02.2023 | - | Sludge from membrane filter, snow treatment facility |
Norway 08 | Sediment | 69.641946, 18.947395 | 06.03.2023 | - | Transect 1 snow dumping site (marine) |
Norway 09 | Sediment | 69.641627, 18.947928 | 06.03.2023 | - | Transect 1 snow dumping site (marine) |
Norway 10 | Sediment | 69.641102, 18.948792 | 06.03.2023 | - | Transect 1 snow dumping site (marine) |
Norway 11 | Sediment | 69.675692, 18.901104 | 06.03.2023 | - | Transect 2 snow dumping site (marine) |
Norway 12 | Sediment | 69.675371, 18.899716 | 06.03.2023 | - | Transect 2 snow dumping site (marine) |
Norway 13 | Sediment | 69.675051, 18.898106 | 06.03.2023 | - | Transect 2 snow dumping site (marine) |
Norway 14 | Sediment | 69.662416, 18.864808 | 06.03.2023 | - | Reference/background site (marine) |
Norway 15 | Water | 59.923048, 10.765784 | 16.08.2023–30.08.2023 | 208 mm* | Atmospheric deposition (dry & wet) |
Norway 16 | Water | 59.923048, 10.765784 | 30.08.2023–14.09.2023 | 3.3 mm* | Atmospheric deposition (dry & wet) |
Norway 17 | Water | 59.923048, 10.765784 | 14.09.2023–27.09.2023 | 89 mm* | Atmospheric deposition (dry & wet) |
Norway 18 | Water | 59.923048, 10.765784 | 27.09.2023–11.10.2023 | 17 mm* | Atmospheric deposition (dry & wet) |
Norway 19 | Water | 59.923048, 10.765784 | 11.10.2023–25.10.2023 | 5 mm* | Atmospheric deposition (dry & wet) |
Norway 20 | Biota | 69.643241, 18.949529 | 13.06.2023 | - | Blue mussel |
Norway 21 | Biota | 69.643241, 18.949529 | 13.06.2023 | - | Blue mussel |
Norway 22 | Biota | 69.643241, 18.949529 | 13.06.2023 | - | Blue mussel |
Norway 23 | Biota | 69.643241, 18.949529 | 13.06.2023 | - | Blue mussel |
Norway 24 | Biota | 69.643241, 18.949529 | 13.06.2023 | - | Blue mussel |
Norway 25 | Biota | 69.643241, 18.949529 | 13.06.2023 | - | Blue mussel |
Norway 26 | Biota | 69.643241, 18.949529 | 13.06.2023 | - | Blue mussel |
Norway 27 | Biota | 69.643241, 18.949529 | 13.06.2023 | - | Blue mussel |
Norway 28 | Biota | 69.643241, 18.949529 | 13.06.2023 | - | Blue mussel |
Norway 29 | Biota | 69.643241, 18.949529 | 13.06.2023 | - | Blue mussel |
Norway 30 | Biota | 69.666653, 18.975562 | 12.06.2023 | - | Blue mussel |
Norway 31 | Biota | 69.666653, 18.975562 | 12.06.2023 | - | Blue mussel |
Norway 32 | Biota | 69.666653, 18.975562 | 12.06.2023 | - | Blue mussel |
Norway 33 | Biota | 69.666653, 18.975562 | 12.06.2023 | - | Blue mussel |
Norway 34 | Biota | 69.666653, 18.975562 | 12.06.2023 | - | Blue mussel |
Norway 35 | Biota | 69.666653, 18.975562 | 12.06.2023 | - | Blue mussel |
Norway 36 | Biota | 69.666653, 18.975562 | 12.06.2023 | - | Blue mussel |
Norway 37 | Biota | 69.666653, 18.975562 | 12.06.2023 | - | Blue mussel |
Norway 38 | Biota | 69.666653, 18.975562 | 12.06.2023 | - | Blue mussel |
Norway 39 | Biota | 69.666653, 18.975562 | 12.06.2023 | - | Blue mussel |
2.3 Sample preparation & chemical analysis
2.3.1 Water samples
Water (n = 43) and snow (n = 9) samples were left to de-freeze at room temperature and filtered through pre-burnt (450°C, 8 h) GF/F filters (pore size 0.7 µm) using a glass filtration unit. A sub-sample of 300 mL or less was taken, dependent on the sample amount available. Internal standards (50 µL, 0.4 ng/µL 6PPD-D5 & 6PPD-Q-D5) were added and the samples were left to equilibrate for 30 minutes. Extraction was performed in batches using Solid Phase Extraction (SPE). The samples were passed through pre-conditioned SPE cartridges (HLB Oasis, 200 mg sorbent, Waters®) using PTFE liners. The cartridges were left to vacuum-dry for 1–2 hours. Then, the target chemicals were eluted with 9 mL of methanol in 3x3 mL aliquots. Finally, the extracts were concentrated to 1 mL using nitrogen and a 50 µL aliquot was taken out for analysis and mixed with 25 µL buffer.
2.3.2 Sediment samples
Sediment samples (n = 15) were transferred to glass petri dishes and dried at 50°C for 48 h. If necessary, larger stones were removed through sieving (2 mm mesh size). Sub-samples of 200 mg were weighed out and spiked with internal standards (50 µL, 0.4 ng/µL, 6PPD-D5 & 6PPD-Q-D5). After adding 1 mL of acetonitrile, the sample was vortexed and extracted through ultrasonication for 15 minutes. After centrifugation, the extract was collected and the extraction was repeated with 1 mL of acetonitrile. Next, the extracts were combined, dried to dryness and redissolved in 100 µL of acetonitrile. Finally, the sample was filtered through press filters before taking out 50 µL sample for analysis and mixed with 25 µL buffer.
2.3.3 Biota samples
Blue mussel (Mytilus edulis; 1 g each) samples (n = 20) were homogenized, internal standards (50 µL, 0.4 ng/µL, 6PPD-D5 & 6PPD-Q-D5), ceramic beads and 0.5 g of Na2SO4 were added. Next, 1.5 mL of acetonitrile were added, the samples were vortexed and extracted through ultrasonication for 15 minutes. The vortex and ultrasonication steps were repeated once. The samples were further placed on a horizontal shaker for 25 minutes and then centrifuged for 10 minutes. The acetonitrile was transferred into a glass vial and a 50 µL aliquot was taken out for analysis and mixed with 25 µL buffer.
2.3.4 LC/MS analysis
The samples were analyzed by ultrahigh pressure liquid chromatography triple–quadrupole mass-spectrometry (UHPLC-MS/MS). Analysis was performed on a Thermo Scientific quaternary Accela 1250 pump (Thermo Fisher Scientific Inc., Waltham, MA, USA) with a PAL Sample Manager (Thermo Fisher Scientific Inc., Waltham, MA, USA) coupled to a Thermo Scientific Vantage MS/MS (Vantage TSQ) (Thermo Fisher Scientific Inc., Waltham, MA, USA); 10 μL were injected on a Waters Acquity UPLC HSS 3 T column (2.1×100 mm, 1,8 μm) (Waters Corporation, Milford, MA, USA) equipped with a Waters Van guard HSS T3 guard column (2.1×5 mm, 1.8 μm) (Waters Corporation, Milford, MA, USA). Separation was achieved using 2 mM NH4OAc in 90:10 methanol/water (A) and 2 mM NH4OAc in methanol (B) as the mobile phases. Ionization was conducted in the positive electrospray ionization mode (ESI+). The results were not blank corrected. LODs were calculated based on signals in the blank samples.
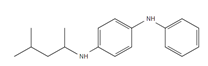
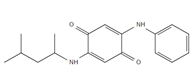
Samples were screened for the presence of the antioxidants/antiozonants 6PPD, IPPD, DPPD, CPPD, TPPD, 44PD, 77PD, DNPD and DTPD, the transformation products 6PPD-Q, IPPD-Q and CPPD-Q, the crosslinking agent HMMM, Solvent red 52, 4-amino-N,N-diethylaniline. Chemicals structures and full names of the target analytes are given in Figure 4.
 | 6PPD: N-(1,3-dimethylbutyl)-N’-phenyl-p-phenylenediamine |
 | 6PPD-Q: 6PPD-Quinone |
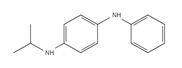 | IPPD: N-Isopropyl-N′-phenyl-1,4-phenylenediamine |
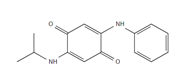 | IPPD-Q: IPPD-Quinone |
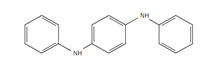 | DPPD: N,N′-Diphenyl-p-phenylendiamin |
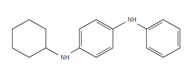 | CPPD: N-Cyclohexyl-N’-phenyl-p-phenylenediamine |
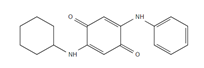 | CPPD-Q: CPPD-Quinone |
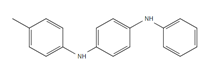 | * TPPD: N-Phenyl-N’-tolyl-p-phenylenediamine |
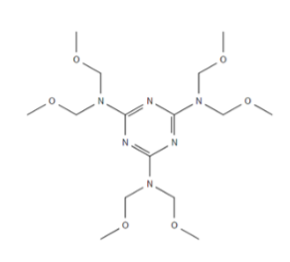 | HMMM: Hexa(methoxymethyl) melamin |
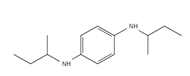 | 44PD: N,N′-Di-2-butyl-1,4-phenylenediamine |
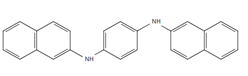 | DNPD: N,N’-Di-2-naphthyl-p-phenylenediamine |
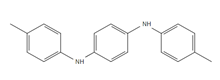 | * DTPD: N,N′-Di-(p-tolyl)-p-phenylenediamine |
 | 77PD: N,N′-Bis(1,4-dimethylpentyl)-p-phenylenediamine |
 | Solvent red 52 |
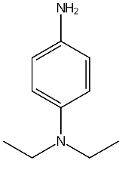
 | Et2N-PD: N,N-Diethyl-p-phenylenediamine |
Figure 4: Chemical structure, acronym and full name of the chemicals analysed in this study.
* Provisional structures for TPPD and DTPD. TPPD and DTPD were quantified using a commercial antioxidant mixture (Vulcanox®).
2.3.5 Quality assurance
A laboratory blank was processed with every 10th sample. There are no standard methods for these compounds. For water and sediment samples, we adapted methods that were published in peer-review journals (Rauert et al., 2022; Zeng et al., 2023). For biota samples we used an extraction method previously developed in-house (Galtung, 2023).
We spiked all three sample matrices with a mix of the targeted compounds to verify the extraction method.
2.3.5.1 Sample conservation and storage
The target substances include compounds which can be readily transformed by UV irradiation, which is why special care needs to be taken during sample handling and storage. Rubber materials can be alternative sources for some of these compounds and should therefore be avoided. Studies have shown that the 6-PPD half-life is about 8 h at environmental pH, because both hydrolysis and oxidation are occurring (ECHA) increasing the HDPA and 6-PPDQ concentrations in the sample. To reduce transformation effects, it is recommended to freeze the sample until analysis.
Guidelines concerning the sampling, sample handling and shipment of samples for analysis of substances found in relation to tire wear particles (TWP) were developed, summarized in a sampling manual (see Appendix B) and sent to the partner countries. These guidelines aim to ensure easy, fast and reliable sampling of road run-off, snow, sediments and soils.