2 Scoping and state of play
The starting point for the work is the existing regulation on servers and data storage products, the ongoing review of this regulation and the increasing focus on resource efficiency in the European product policy.
The aim of this section is to describe servers and data storage products and the relevant legislation with main focus on resource efficiency and especially on scarce and critical raw materials (CRMs) and other environmental relevant materials. Other environmentally relevant materials in servers are primarily plastics. Plastics is chosen as a focus point, as it is, together with CRMs, the most problematic materials to recover from servers (WeLOOP, 2020).
The scope of the study is enterprise servers (rack servers and blade servers) and data storage products as defined in the current ecodesign regulation for servers and data storage products.
2.1 Servers and data storage products
Servers and data storage products consist of computer systems and associated components, mostly operated interconnectedly and typically housed in data centres. The report on “Reporting requirements of data centres for the European Energy Efficiency Directive” (Viegand Maagøe, 2023) estimates there in the EU are around 55.000 very small data centres (below 100 kW threshold
Threshold for the proposed reporting requirements for data centres
Enterprise servers and storage products are commercial information and communication technology (ICT) sold in the business-to-business (B2B) market. Server and storage products provide individual functionalities and are two separate product categories even though they are both covered by the same ecodesign regulation. The provided IT services are not created by a single machine but through a combined (virtual) server and storage environment.
Most servers except for stand-alone products such as tower servers are mounted in standardised 19-inch rack cabinets (or chassis). The chassis encloses and makes it possible to mount the servers and main subassemblies.
This study focuses on enterprise servers and data storage products used in server rooms and data centres.
2.1.1 Servers
Enterprise servers can in broad terms be categorized as:
- Rack servers: are designed to be inserted and fixed directly in the 19-inch rack. The server rack usually fits multiple rack servers.
- Blade servers: are servers with a modular design, that fits into a blade enclosure (or cabinet/chassis), which holds multiple blade servers.
Rack servers integrate all functional elements of a server including the mainboard (populated with processor, memory, and other active and passive electronics), passive and active cooling devices, power supply unit, interfaces and connectors in a single enclosure (called cabinet or chassis). The individual servers need to be manually connected to the power distribution and network (cabling). The hardware and software configuration of rack servers are optimised for a certain application spectrum and performance.
Blade servers have many components removed to save space, minimize power consumption and other considerations. The blade server fits inside a blade enclosure, providing services (the so-called shared resources) including power supply, active cooling, storage capacity and network connections. Together, blades and the blade enclosure form a blade system. Different blade providers have differing principles regarding what to include in the blade itself, and in the blade system as a whole.
Blade servers have the highest processing power and can be ‘hot-swapped’ (easily removed from the chassis and replaced to avoid redundancy).
Enterprise server consists of the following main components (European Commission, 2015b; JRC, 2015):
- Chassis/cabinet: A housing made of metal and plastic material that encloses the electronic components and provides mounting features e.g. for the power supply unit, cooling elements, and other functional components.
- Main board (also referred to as motherboard)
- Other PCBs: A number of other PCBs of different dimensions/mass and grades are included in servers. PCBs are located in chassis, HDDs, ODDs, mainboard, PSU, expansion card, memory cards (from JRC environmental footprint study table 19).
- Cooling system: The cooling of the active electronic components such as the CPU is typically achieved by a combination of passive and active technologies. In general, passive cooling includes a heat spreader directly attached to the top of the processor chip, a large heat sink or heat pipes that distribute the thermal energy away from the chip and towards the active cooling system which is most often a fan unit.
- Storage devices and drives: The storage system derives historically from hard disc drives (HDD) and includes nowadays 3.5-inch and 2.5-inch HDDs as well as 2.5-inch solid state drives (SSDs). Some servers feature other drives (CD-ROM/Blu-Ray) as well.
- Input/Output (I/O) control and network connectors: Servers are remotely accessible via Ethernet connection and therefore feature multiple network interfaces and links (connectors) on the backside.
- Power supply unit (PSU): The PSU is typically configured as a single unit or a multiple unit and comes in its own housing (metal cage). It typically receives alternating current (AC) from the main and transform it to direct current (DC) at the relevant voltage and provides the power for server.
- Cables. Various cables connections
- CPU (Central Processing Unit). Handling all instructions and commands for all incoming and outgoing data. Is typically placed on the motherboard mentioned above.
- GPU (graphic processing unit): Offers increased power and speed (compared to the CPU) for running computationally intensive tasks, such as video rendering, data analytics, and machine learning.
The composition of the servers and where the components are placed varies from product to product.
Looking at results of environmental assessments for servers it is important to observe the boundaries i.e. which components and auxiliary items are included in the Bill of Material (BoM).
2.1.2 Data storage products
A data storage product is a storage system that supplies data storage services to clients and devices attached directly to the device or through a network (to remote clients). A storage product composed of integrated storage controllers, storage media (typically HDDs and/or SSDs), embedded network elements, software, and other devices. The main components include housing elements, a disk platter, spindle and voice coil motors, read and write heads, active and passive electronic components including semiconductor devices, cooling elements and connectors.
Data storage equipment is operated free standing (pedestal) or in a cabinet (rack-mounted) and is most often installed in a server room or data centre.
The data storage system supplements the server’s internal memory, by providing more capacity, redundancy, and flexible data management. The storage system hardware consists basically of a larger number of storage media (HDDs or SDDs), a controller that handles the input and output (IO) requests, and the necessary connectivity for data transmission. All these devices are mounted in a chassis together with power supply units, active cooling devices (fans) and management interfaces. The storage system is connected to the servers or clients by means of direct connections or network connections.
Data storage systems include following subsystems (from EU prep study):
- Storage media and devices: These include hard disk drives (HDDs), solid state devices (SSDs), tape cartridges, and optical disks providing non-volatile data.
- Storage controller: External or internal subassembly including a processor (sequencer) and other electronics which autonomously process a substantial portion of IO requests (input/output request) directed to storage devices.
- Storage elements: Product configuration (e.g. controller enclosure or disk enclosure) such as redundant array of independent disks (RAID) or a robotic tape library with a number of storage devices and integrated storage controller for handling I/O requests.
- Connectivity and network elements: Storage devices can be directly connected to a host or connected through a network. Connectivity and networks are based on various technologies (protocols) including Serial Advanced Technology Attachment (SATA), Serial Attached SCSI (SAS), Fibre Channel (FC), Infiniband (IB) or Ethernet (TCP/IP).
- Connectors and cables: The data transmission between servers and storage devices requires interface controllers (integrated or on separated cards), connectors and cables. The functionality, performance and form factors are important aspects.
HDDs are used in combination with SSDs for data storage [WeLOOP,2020]. As SSDs score better than HDDs in many performance indicators, the HDDs are gradually disappearing and being replaced by SSDs. Another core replacement reason next to performance is the decreasing price of SSDs. Nevertheless, HDDs still have a strong edge in terms of cost and capacity (JRC, 2023a). HDDs provide high capacity at lower cost for “cold” data, which is rarely accessed, whereas SSDs outperform “warm” data which needs to be accessed more rapidly and more frequently.
HDDs use the magnetism of materials on a rotating platter to store data. Permanent magnets (NdFeB) are used. HDDs contain REE such as Nd and Dy. Other metals and plastics are also used and there is a high concentration of aluminium (WeLOOP, 2020).
SSDs are based on semiconductor engineering materials. High purity silicon is the main material found in flash memories, made of floating-gate transistors. SSDs mainly contain PGMs and silicon metals. The most interesting property is the higher read and write speed compared to HDDs. The absence of mechanical parts in SSDs make the reading process faster, given that fragmentation of data does not affect the speed of the process. The heat and the noise produced are also much lower than those from HDDs, so the energy savings in cooling are also an advantage of this technology.
2.2 Technical evolution of servers and data storage products
2.2.1 A movement from HDD to SSD
In the current regulation, the information requirements relevant for CRMs focus on neodymium in HDDs
(Hard Disk Drives), and cobalt in batteries. In this regard, the replacement of HDDs by SSDs (Solid-State Drivers) and how this is affecting servers is a significant technology change.
Input from stakeholders
Question: What type of data storage products are used in data centres and is there a trend towards one or the other?
Answer 1: “We expect the % of SSD to continually increase in comparison to HDD.”
Answer 2: “We can confirm that the development is going from HDD to SSD “
Question: To your knowledge, can the replacement of HDDs by SSDs affect material efficiency and circularity of servers and storage, or more generally on ICT products?
Answer 1: “The CEDaCI project’s criticality assessments show that criticality risk is lower in SDDs than HDDs per unit of storage (GB/TB etc).”
Answer 2: “Not to a great extent. According to analysis I have seen, there is strong overlap between SSDs and HDDs”.
The foresight study by JRC (2023a), finds that HDDs are gradually being replaced by SSDs. This observation was supported by the stakeholders interviewed for this project.
This replacement will influence the content of CRMs in servers and data storage products, especially as it will reduce the content of neodymium. SSDs do not contain magnets and thus no neodymium, but SSDs is constituted by flash memories containing high purity silicon metal among other CRMs found in PCBs. The weight of CRMs is lower in SSDs compared to HDDs, however, the number of different CRMs is higher. The CEDaCI project assesses that the criticality of SSDs is generally lower than HDDs. But as the heterogeneity is higher in SSDs it might be even more difficult to achieve circularity of the materials used in them as recycling streams will be smaller and the materials more mixed. The functionality of the two types of drives also differs, and so it is not considered prudent to push for a faster shift towards SSDs through regulation or to promote the replacement through other means. This is further elaborated in Section 021.
When switching from HDD to SDD it is, also important to be aware of a potentially increased climate impact from the production phase, as at least one product declaration from Samsung, cited in the ‘Ecodesign preparatory study on enterprise servers and data equipment’, estimates that the emissions of greenhouse gases is more than 6 times higher for the production of SSDs.
As for the batteries, these are typically small CR2032 lithium batteries for preserving the memory data, during power absence. This battery technology is expected to continue to be used in the near future.
2.2.2 Gallium based semiconductors
There are constant innovations and changes made in the tech industry. One of them is the increasing use of gallium nitride (GaN) semiconductors as an alternative to the typical silicon semiconductors used in PCBs (S. Glaser, 2023). As literature indicates that this type of semiconductor has the potential to yield higher energy efficiency than the typical silicon version, it might become an increasingly utilized technology, to meet continues energy efficiency targets. As gallium is also a CRM, this change in technology will switch rather than reduce the number of CRMs in servers and data storage products. If this technology becomes market dominant a large part of the silicon metal currently found in servers and data storage products, will be replaced by gallium. However, the weight of gallium needed in semiconductors is unknown.
Input from stakeholders
Question: Do you see quantum computers becoming an integral part of data centers in the future?
Answer: “Yes, it will replace other servers and become an integral part of DCs, but the timeframe is currently not clear.”
Question: Do you know any technological evolution that can affect material efficiency and circularity of servers and storage, or more generally on ICT products?
Answer: “Possibly quantum computing but it is still very conceptual and there are no LCAs or CRM studies to date.”
2.2.3 Quantum computing
The company IBM Quantum has announced plans to open the first quantum data centre in Europe, which is scheduled to be operational in 2024 (IBM, 2023). IBM Quantum already operates a quantum data centre in New York, USA, (IBM, 2022), and the company Equinix have installed a quantum computer in their data centre in Tokyo (Equinix, 2023). The technology is still in its very early stages, but as the examples above show the technology is already being tested at large scales. If it overcomes its technical barriers, it has the potential to become a market disruptor. Although the broad use of quantum computers in the data centre industry might still be several years into the future, it would be prudent to take the market impact into consideration.
Although data is still poor the content of CRMs quantum devices is analysed in a Dutch study from 2021 (Gloria, 2021). It has assessed the contents of CRMs in different selected Quantum communication devices and the results are shown in the Figure 1. CRMs in electronics are not included in the figure, since no proper data could be retrieved on what kind of PCBs were used in the different devices.
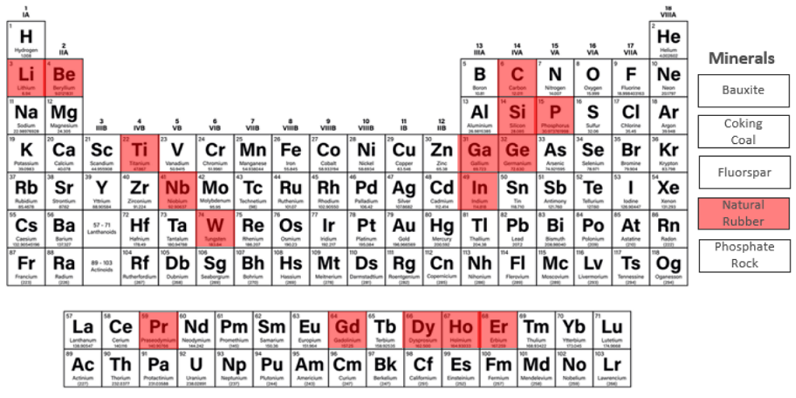
Figure 1. Critical Raw Materials contained in Quantum Technologies (PCBs not included).
2.2.4 On premises or cloud-based solutions
Historically, servers were set up at the same physical location where the service was needed – a model also known as a physical DC model (WeLOOP, 2020). However, there has been a paradigm shift towards data virtualization and the utilization of Cloud Data Centres, where data can be stored and accessed in and from different locations. This has given rise to massive-scale data centres owned and operated by the data storage providers. It was estimated in the ICT Impact study from 2020, that Cloud Data Centres represented 83% of the market in 2016 and was anticipated to handle 94% of the total global workload by 2021 (VHK and Viegand Maagøe, 2020). See the graph and table below.
Input from stakeholder
“Most in quantities are in the data centres. Normal servers are 50/50 between the two, but customized are most in DCs.” – Industry organisation”
Figure 2. Expected global trend in internet traffic and data centre workloads 2014-2021. Based on data from (VHK and Viegand Maagøe, 2020)
2014 | 2015 | 2016 | 2017 | 2018 | 2019 | 2020 | 2021 | |
|---|---|---|---|---|---|---|---|---|
Traditional DC | 36% | 25% | 17% | 14% | 11% | 9% | 7% | 6% |
Cloud DC | 64% | 75% | 83% | 86% | 89% | 91% | 93% | 94% |
Table 1. Share of total workload and compute instances between traditional data centers and cloud data centres. Source: (VHK and Viegand Maagøe, 2020)
Speaking with stakeholders there seems to be less of a clear trend in regard to where the majority of servers can be found. It was argued by one stakeholder, that it has become much easier and cheaper to get highly energy efficient on-premises service solutions, which have a faster response time than cloud. Another argued that the GDPR had been a hindrance for many to shift to cloud, as the DC were often located outside EU, and not compliant with the regulation. Although there appears to be consensus that DC’s handle most of the data traffic, it was estimated by one stakeholder that the share of market servers (not custom made) was distributed with a 50/50 share between cloud and on-premises solutions. This was not contested by any of the other stakeholders when presented with the information.
Input from stakeholders
“The trend is that more companies are moving part of their storage to their own premises away from the cloud. It is easier to get energy efficient solutions in server rooms today than what it used to. Having the servers on premise can give a higher respond time.” – Industry organisation
“As long as there are no security issues, then people are shifting to cloud” – Procurer
“People are moving away from cloud and towards ownership.” – Refurbisher
“GDPR has been an obstacle for more companies to transition to the cloud. Most cloud companies are not located in the EU, so they have not complied with the EU's GDPR regulations. However, this is supposed to have been resolved now.” - Procurer
2.3 Critical raw materials
Servers and data storage products include various precious and critical raw materials. Raw materials are crucial to Europe’s economy and to the economy of the Nordic countries. A secure and sustainable supply of raw materials is a prerequisite for a resilient economy and raw materials are essential for the green and digital transition which is of high priority in both the EU and in the Nordic countries.
The supply of many critical raw materials is highly concentrated. For example, China provides a very large share of EU’s supply of rare earth elements (European Commission, 2023a) (100% of HREEs
HREEs: Dysprosium, erbium, europium, gadolinium, holmium, lutetium, terbium, thulium, ytterbium, yttrium
LREEs: Cerium, lanthanum, neodymium, praseodymium and samarium
The EU has in December 2023 adopted a new regulation on strategic and critical raw materials (see more in section 4. The regulation includes in its Annex 1 a list of strategic raw materials as well as an updated list of critical raw materials.
Strategic materials are selected based on the relevance of a raw material for the green and digital transition and defence and space applications, taking into account:
- the amount of strategic technologies using a raw material as an input
- the amount of a raw material needed for manufacturing relevant strategic technologies
- the expected global demand for relevant strategic technologies.
Various of the materials are categorised as both strategic and critical materials.
2.3.1 List of critical raw materials
Every third year the EU publish a list of critical raw materials (CRMs). The list is based on an assessment covering a larger number of materials. The fourth list was published in 2020 (European Commission, 2020a) and the fifth list in 2023 (European Commission, 2023a).
The first assessment (2011) identified 14 critical raw materials (CRMs) out of the 41 nonenergy, non-agricultural candidate raw materials. In the 2014 exercise, 20 raw materials were identified as critical out of 54 candidates. In 2017, 27 CRMs were identified among 78 candidates in 2017. The 2020 list includes 30 raw materials identified as critical.
According to the Critical Raw Materials Alliance (n.d.), Critical Raw Materials (CRMs) are those raw materials, which are economically and strategically important for the European economy but have a high-risk associated with their supply. They are classified as ‘critical’ because:
- They have a significant economic importance for key sectors in the European economy, such as consumer electronics, environmental technologies, automotive, aerospace, defence, health and steel.
- They have a high supply risk due to the very high import dependence and high level of concentration of set critical raw materials in particular countries.
- There is a lack of (viable) substitutes, due to the unique and reliable properties of these materials for existing, as well as future applications; combined with low recycling rates.
The Commission committed to updating the list at least every 3 years to reflect production, market, and technological developments.
Fifth list of critical raw materials
The fifth technical assessment 2023 of critical raw materials screens 70 candidate raw materials comprising 67 individual materials and three materials groups: ten heavy rare earths elements (HREEs), five light rare earths elements (LREEs), and five platinum-group metals (PGMs), 87 individual raw materials in total (European Commission, 2023a).
Four new materials have been assessed: neon, krypton, xenon and roundwood. Titanium metal has been assessed in addition to titanium. Aluminium and bauxite have been merged for consistency reasons.
The proposal of the CRM Act Regulation contains the list of Strategic Raw Materials (SRMs) and the list of CRMs. The Regulation proposes to automatically add SRMs selected based on a new methodology (Annex 1 of the Regulation) on the CRMs list, defined by the established CRM methodology (Annex 2 of the Regulation). The CRM methodology was developed by the European Commission in cooperation with the Ad hoc Working Group on Defining Critical Raw Materials (AHWG) in 2017. The methodology is based on the two main criteria of Economic Importance (EI) and Supply Risk (SR). The thresholds remain at SR ≥ 1.0 and EI ≥ 2.8 rounded to one decimal. The method is described in Annex II of the proposed regulation (European Commission, 2023b).
Main results of the 2023 criticality assessment
Table 3 shows the 34 raw materials proposed for the CRM list 2023. New CRMs compared to the 2020 CRM list are shown in italics. The list includes both critical and strategic raw materials. Table 2 highlights the strategic materials in italics.
New CRMs on the list in 2023 are arsenic, feldspar, helium, manganese, copper and nickel. Copper and nickel do not meet the CRM thresholds but are included as Strategic Raw Materials. Materials that are no longer on the list are indium and natural rubber. For indium used in flat panels displays both supply risk and economic importance of have dropped below thresholds and for Natural rubber used in tyres the supply risk has decreased below the threshold mainly due to increased recycling. See Table 4 for comparison of the 2023 list with the one from 2020. The materials in red are new materials in the list in 2023 compared to the list in 2020. It is important to notice that with the adoption of the Critical Raw Materials Act in December 2023 two changes were made to the list. Aluminium/Bauxite is changed to Bauxite/Alumina/Aluminium (to include alumina the intermediate processing form of aluminium) and ‘Graphite – battery grade’ is added to the list.
2023 Critical Raw Materials (new CRMs in italics) | |||
Aluminium/bauxite | Coking coal | lithium | phosphorus |
Aantimony | feldspar | LREE | scandium |
arsenic | fluorspar | magnesium | silicon metal |
baryte | gallium | manganese | strontium |
beryllium | germanium | natural graphite | tantalum |
bismuth | hafnium | niobium | titanium metal |
boron/borate | helium | PGM | tungsten |
colbalt | HREE | phosphate rock | vanadium |
copper* | nickel* | ||
Table 2. Critical raw materials in the 2023 CRM list. *Copper and nickel do not meet the CRM thresholds but are included as Strategic Raw Materials. PGM: Platinum Group Metals. Source: (European Commission, 2023a)
2023 Critical Raw Materials (Strategic Raw Materials in italics) | |||
Aluminium/bauxite | Coking coal | lithium | phosphorus |
Aantimony | feldspar | LREE | scandium |
arsenic | fluorspar | magnesium | silicon metal |
baryte | gallium | manganese | strontium |
beryllium | germanium | natural graphite | tantalum |
bismuth | hafnium | niobium | titanium metal |
boron/borate | helium | PGM | tungsten |
colbalt | HREE | phosphate rock | vanadium |
copper* | nickel* | ||
Table 3. Critical raw material list 2023 with strategic raw materials in italics. *Copper and nickel do not meet the CRM thresholds but are included as Strategic Raw Materials. PGM: Platinum Group Metals. Source: (European Commission, 2023a)
With the adoption of the Critical Raw Materials Act in December 2023 two changes have been made to the list. Aluminium/Bauxite is changed to Bauxite/Alumina/Aluminium (to include alumina the intermediate processing form of aluminium) and ‘Graphite – battery grade’ is added to the list.
2023 Critical Raw Materials (Strategic Raw Materials in italics) | |||
Aluminium/bauxite | gallium | phosphate rock | vanadium |
Aantimony | germanium | phosphorus | arsenic |
baryte | hafnium | PGM | feldspar |
beryllium | HREE | scandium | helium |
bismuth | lithium | silicon metal | maganese |
borate | LREE | strontium | copper |
colbalt | magnesium | tantalum | nickel |
coking coal | natural graphite | titanium metal | |
fluorspar | niobium | tungsten | |
Table 4. Comparison of the 2020 CRM list with the 2023 list. Source: (European Commission, 2023a). See also footnote 9.
Legend:
Black: CRMs in 2023 and 2020
Red: CRMs in 2023, non-CRMs in 2020
Strike: Non-CRMs in 2023 that were critical in 2020
Black: CRMs in 2023 and 2020
The three materials groups on the list contain:
- HREE: dysprosium, erbium, europium, gadolinium, holmium, lutetium, terbium, thulium, ytterbium, yttrium
- LREE: cerium, lanthanum, neodymium, praseodymium and samarium
- PGM: iridium, palladium, platinum, rhodium, ruthenium
2.3.2 Conflict materials
Two of the materials on the EU list of critical raw materials are also appointed as conflict materials in the EU Conflict Minerals Regulation
REGULATION (EU) 2017/821 OF THE EUROPEAN PARLIAMENT AND OF THE COUNCIL of 17 May 2017 laying down supply chain due diligence obligations for Union importers of tin, tantalum and tungsten, their ores, and gold originating from conflict-affected and high-risk areas https://eur-lex.europa.eu/legal-content/EN/TXT/PDF/?uri=OJ:L:2017:130:FULL
The conflict materials come from politically unstable areas, where the minerals trade can be used to finance armed groups, fuel forced labour and other human rights abuses, and support corruption and money laundering. The Conflict Minerals Regulation aims to help stem the trade of four minerals which as mentioned sometimes finance armed conflict or are mined using forced labour.
2.3.3 Use of critical Raw materials
The EU foresight study (JRC, 2023a) investigates the use and supply chain structure and future demand for the main raw materials of 15 selected key technologies across the five strategic sectors (renewable energy, electromobility, energy intensive industry, digital, and aerospace/defence great importance for the green transition and digital development. The analysis includes data servers and storage products in the sector digital.
The study shows that various strategic and critical raw materials are used in the selected technologies including for servers and data storage products.
Strategic raw materials found in servers and data storage: Gallium, Magnesium, REE (magnets)
REE (magnets): REE used in permanent magnets such as neodymium and dysprosium
Critical raw materials found in servers and data storage: HREE (rest)
Without the RRE in the magnets
The highest supply risk is found for Gallium, Magnesium, REE (magnets), Boron and HREE (rest).
According to the study cobalt is not used in servers and data storage products. But other sources indicate that cobalt is included in the batteries.
2.3.4 Supply of critical raw materials
CRMs are supplied to the EU from all over the world. Figure 3 gives an overview of the biggest suppliers to the EU of specific raw materials. As can be seen, China is a major supplier of many CRMs to the EU, and many other countries are the primary supplier of specific raw materials such as South Africa, Chile, Brazil, DR Congo, Turkey, Guinea and Kazakhstan. For some CRMs EU countries contribute significantly to the EU supply e.g. hafnium from France, strontium from Spain and nickel from Finland.
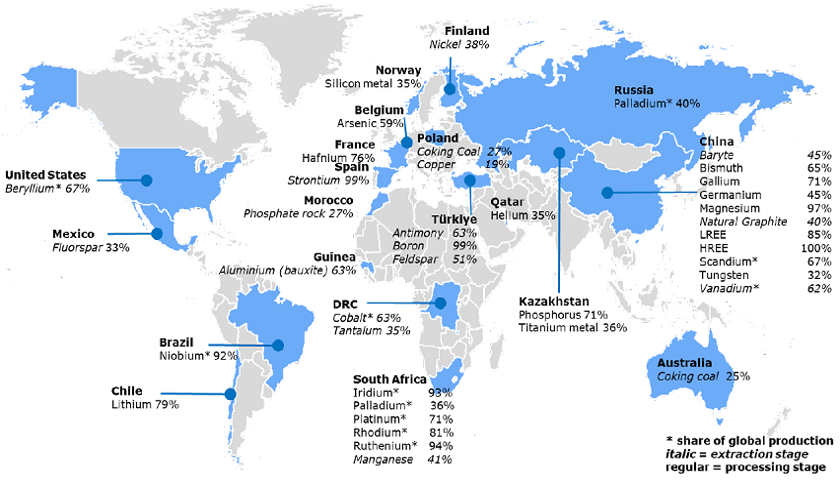
Figure 3. The biggest suppliers of CRM to the EU (European Commission, 2023a).
There are several differences on the map compared to the situation in the previous assessment (European Commission, 2022a): Belgium appears as the major EU supplier of arsenic (59%); major production of germanium in Finland ceased in 2015; Finnish production of nickel doubled and supplies 38% of the EU consumption; Germany ceased gallium production in 2016 and China became major supplier to the EU with 71%; Qatar appears as the main supplier of helium (35%); South Africa is our main supplier of manganese with 41%. It also appears that the Nordic countries are the main suppliers of CRMs to the EU on a few CRMs, i.e. silicon metal and nickel. For these materials Finland’s share is 38% of the EU supply of nickel and Norway’s share is 35% for silicon metal.
However, other CRMs such as copper, cobalt, phosphate, and platinum are also extracted in the Nordic countries, but only in small amounts compared to the global supply.
Figure 4 shows the European countries share of the global extraction and processing of CRMs. As the figure shows, the EU only account for a small share of the global CRM extraction, with the exception being the extraction of strontium in Spain.
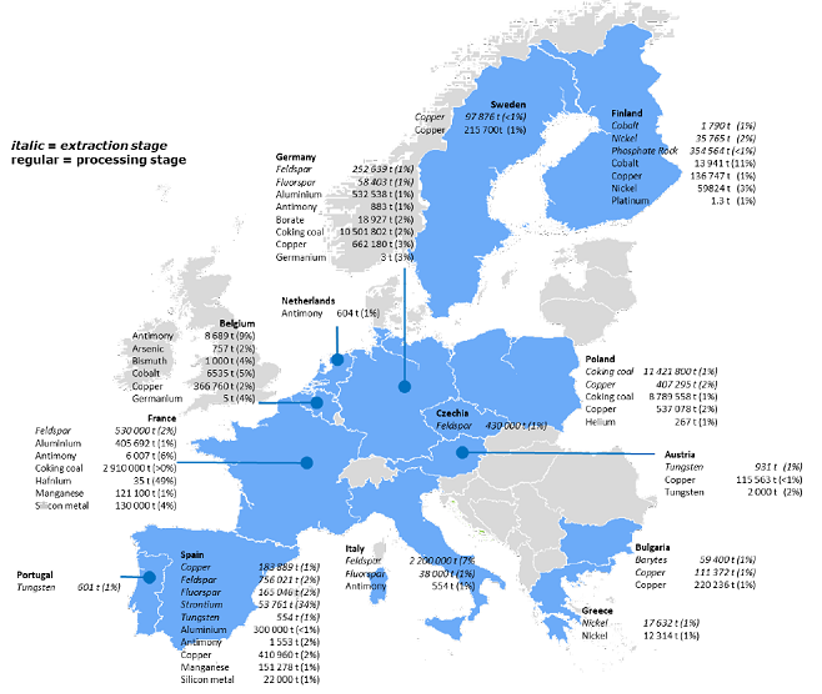
Figure 4. EU producers of CRMs with a global share of over 0.5%. Share of global supply in brackets. (2016–2020) (European Commission, 2023a).
2.3.5 Reserves of CRMs in the EU and Nordic countries
There are various reserves of CRMs in the EU and in the Nordic countries which are currently not utilized (mined). Specifically, Finland, Iceland, Norway, Sweden and Greenland, feature some of the most extensive active mining industries, mining and mineral processing technology developers, and untapped mineral and metal resources in Europe today (Eilu, et al., 2021).
It is increasingly recognized that mining countries now aspire to higher environmental, social and governance standards for exploitation and production of metals and minerals on a global scale. Here, the Nordic countries have several advantages due to a combination of a longstanding and technologically highly developed mining and mineral processing industry combined with strict environmental and health regulations. Expanding production in the Nordic countries would contribute to making Europe more resilient to supply risk and help to secure more responsible sourcing of the raw materials that are necessary for a green energy transition. This should preferably also include the development of new processing and manufacturing capacity for CRMs, such as the REEs, to ensure complete European supply chains and, thus, minimize supply risk issues.
Figure 5 shows an overview of all major known critical metal and mineral deposits, and their most prospective areas (in pink) in the Nordic countries. The mapping includes all critical raw materials on the EU 2020 list of critical raw materials. Recently the EU has published a new 2023 list with some new critical materials which are not included in the mapping. The new materials are arsenic, feldspar, helium, manganese, copper, and nickel. Regarding the new materials Finland in a large supplier of nickel. The figure shows that there are various unexploited deposits of critical raw materials in the Nordic countries. Iceland is not shown in. Overall, only sparse occurrences of CRMs are known in Iceland, but do include baryte, fluorspar and titanium, and also minor non-CRM albeit green energy relevant copper mineralization.
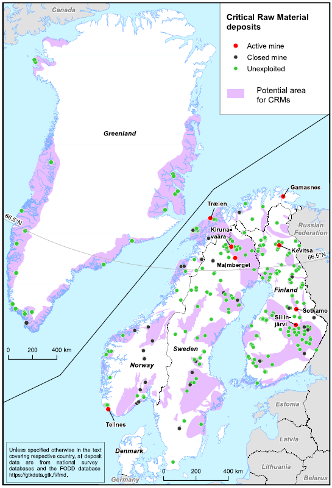
Figure 5. Map of all major known critical metal and mineral deposits, and their most prospective areas (in pink) in the Nordic countries (2020 list of CRMs). Mines in active operation (red dots) are named. Note that production at Kiruna and Malmberget is currently of iron ore only (Eilu, et al., 2021).
2.3.6 Future needs for CRMs
The 2023 foresight study also assesses the EU’s materials needs and vulnerabilities now and in the future for the 15 key technologies.
It estimates that the need for CRMs in Europe will increase significantly over the coming decades. Table 5 shows the projected increase in CRMs in 2030 and 2050 compared to 2020.
CRM | 2030 | 2050 |
Lithium | x 12 | x 21 |
Graphite | x 14 | x 26 |
Cobalt | x 6 | x 5 |
Nickel | x 10 | x 16 |
Dysprosium | x 6 | x 7 |
Terbium | x 4 | x 5 |
Neodymium | x 5 | x 6 |
Praseodymium | x 4 | x 4 |
Platinum | x 30 | x 200 |
Silicon metal | x 2 | x 1 |
Copper | x 6 | x 10 |
Aluminium | x 4 | x 6 |
Table 5. Projected demand of selected CRM in 2030 and 2050 compared to 2020 (JRC, 2023a).
It can be observed that the demand for almost all the select CRMs is projected to increase significantly. Especially, the use of Platinum is expected to increase dramatically (x 30 in 2030 and x 200 in 2050). Platinum is one of the materials in the PGM group
PGM group: iridium, palladium, platinum, rhodium, ruthenium.
Emerging technologies such as ferroelectric RAM would require up to 40 kilotons of platinum, which is about 600 times the currently yearly demand of the EU. With regards of tantalum, its main application is in special capacitators, characterised by high capacitance, small size and high performance. Thin layers of tantalum are also used in integrated circuits. Tantalum’s use in electronic applications will also increase dramatically, and it could overtake the current use of this material of all applications factored together. On the other hand, other CRMs such as gallium, dysprosium, palladium are expected to stagnate, according to some sources mentioned in the foresight study. However, the authors highlight that these scenarios are based on conservative and technology-constant approach of digitalisation, and other sources suggest a much larger increase in material consumption.
2.3.7 Secondary raw material input
A higher share of End-of-Life recycling of critical raw materials could help reduce the supply risk. The 2023 EU CRM study reports end-of life recycling input rates (EOL-RIR) for CRMs as shown in Figure 6 (European Commission, 2023a).
The End-of-Life Recycling Input Rate (EOL-RIR) is the percentage of overall demand that can be satisfied through secondary raw materials (resulting ratio of recycling from old scrap to European demanding the manufacturing stage).
The data on EOL-RIR shows that there for some materials is no input from recycled material in the manufacturing process which indicates that there might be a large unexploited source of CRMs in the products we throw out, which if fully utilized could supply a large part of the EU’s demand for certain CRMs.
Figure 6. End of life recycling input rate (EOL-RIR). Source: (European Commission, 2023a)
2.4 Plastics
Plastics are widely used in energy related products and also in servers and data storage products, where it is often found in e.g., the chassis, fans and cables. Plastics is indicated by literature to make up between 1–7% of the total server weight, see Section 4.1.4 and 4.5.2.
Plastic is an extraordinarily versatile material. When subjected to heat, it becomes highly malleable, allowing for the creation of a vast array of shapes and forms. By introducing various additives, plastic can be tailored to possess a wide range of properties, making it suitable for even the most demanding applications. However, this inherent adaptability, which proves invaluable during its use in products and various applications, transforms into a significant challenge when it reaches the hands of recyclers upon disposal.
The issue arises from the fact that different types of plastics do not blend well together. To obtain a high-quality secondary plastic stream, an effective separation process is essential. This separation can be particularly challenging when plastics are part of a composite with other materials. Additionally, the presence of various additives in plastics, such as dyes, fillers, and flame retardants, further complicates the recycling process.
Recycling the material also needs to be economically viable, and for this to happen several factors must align. There needs to be a substantial waste stream of plastic material, the plastic must be recyclable into a sufficiently high-quality product, and there must be a market demand for the recycled material.
In this section, we address the current state of plastics recycling in the European Union, highlighting the need for improvements in recycling practices, especially concerning servers and data storage products. Later in the report, we will explore the types of plastics commonly found in servers and propose strategies to enhance their recyclability.
2.4.1 Current state of plastics recycling and policy in the EU
To sketch out the playing field, we should first look at what the legislative focus on plastic has been over the last years. In December 2015, the Commission adopted the first Circular Economy Action Plan (CEAP), in which plastics were identified as a focus area (European Commission, 2015a). In 2018 this resulted in the creation of ‘A European Strategy for Plastics in a Circular Economy’, which set out key commitments for action at EU level (European Commission, 2018a). In March 2020 The European Commission adopted the new Circular Economy Action Plan (CEAP), which is an initiative under the European Green Deal, Europe’s new agenda for sustainable growth (European Commission, 2020b).
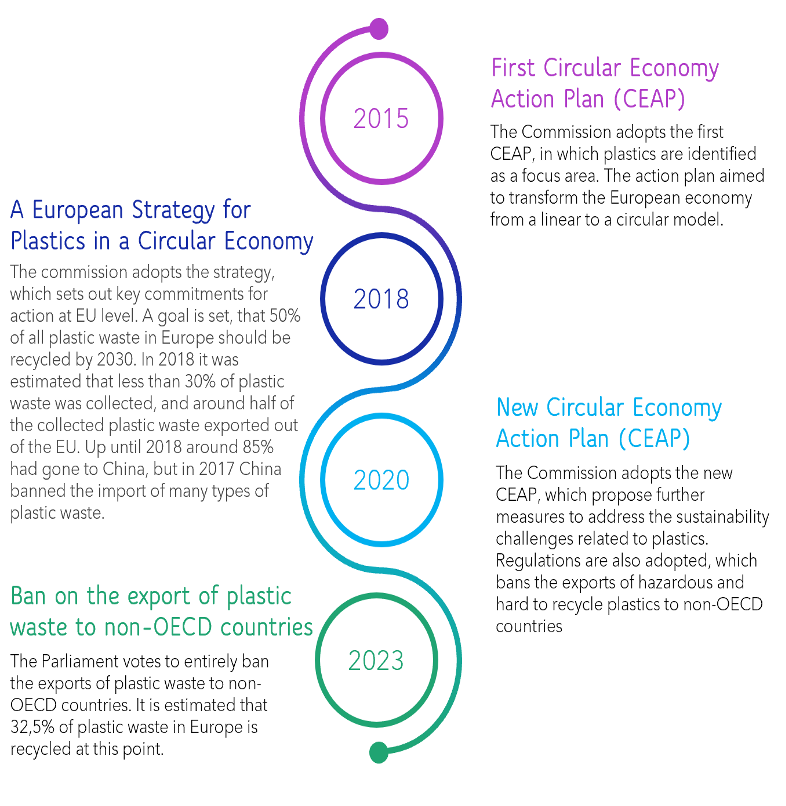
Figure 7. Selected EU legislation on plastics. Own creation.
In a communication from the European Commission in 2018 on ‘A European Strategy for Plastics in a Circular Economy’, a strategic vision for Europe’s new plastics economy was sketched out (European Commission, 2018a). The vision states that by 2030 more than half of all plastics waste generated in Europe should be recycled. In 2018 the available data showed that less than 30% of plastic waste in Europe was collected for recycling, and that around half of it was sent outside of Europe for treatment. This export of, often low quality, plastic waste has been the topic of much debate and has generated significant attention over environmental, economic, and ethical concerns. Before 2018 close to 85% of the exported plastic waste had furthermore gone to China, where its subsequent fate is unknown.
However, in 2017 China banned the import of many types of plastic waste fractions which fostered an abrupt shift in the European plastic waste management strategy. In 2020 the EU adopted regulations banning the exports of hazardous and hard to recycle plastics to non-OECD countries (European Parliament, 2020), and in January 2023 the EU Parliament voted to entirely ban the exports of plastic waste to non-OECD countries (EU Monitor, 2023).
Currently the estimated recycling rate of plastics in the EU is estimated at 32,5% based on 2018 numbers (European Parliament, 2023a). Around half of all plastic waste collected in the EU is still exported to be treated outside the EU.
The current political focus and discourse on plastic waste exports reflects a growing awareness of the need to manage plastic waste more responsibly and sustainably, both at the national and international levels. However, it puts pressure on the European recycling infrastructure, which consequently will have to manage a larger amount of plastic waste than it currently does. Hopefully it will create incentives to invest, expand, regulate, and redesign.
2.4.2 The impact of plastic consumption, waste, and recycling
About 6% of global oil consumption is used to produce plastics; by 2050, this share could reach 20% (European Parliament, 2023b). This is due to an expected doubling of plastics consumption in the coming 20 years (European Commission, 2020b), coupled with a general reduction in the use of oil for fuel and energy purposes.
The European plastic use makes up around 14% of the global use (Statista, 2023), and electronics accounts for around 6% of the European plastics demand (Plastics Europe, 2022). Servers and data storage devices makes up an unknown portion of the electronics plastics demand. The Information and communication technology (ICT) sector is, however, growing rapidly and two experts in the field, Deborah Andrews and Beth Whitehead, have projected the data centre industry to increase fivefold towards 2030, compared to 2018 (Andrews & Whitehead, 2019).
ICT products are becoming more technologically advanced, incorporating intricate plastic elements and plastics fused with other materials, as well as containing hazardous components that create obstacles for recovery within current recycling systems (European Commission, 2018a). The products also contain many different types of polymers, which can be difficult for the recyclers to identify, and the products can be hard and time consuming to dismantle.
In the communication from the EC it is stated, in relation to the recycling of plastics from electronics, together with the automotive and construction industry, that:
“There is little incentive to take into account recycling or reuse aspects when designing plastics for applications in […] electronics given that the plastic waste fraction is small and there are no EU wide targets for recycling and recovery.” –(European Commission, 2018a)
It further states, that the EU targets on plastics recycling can be met with only a minimum amount of recycling of plastics from the electronics, automotive and construction industry (European Commission, 2018a). This together with the small waste fractions, and the lack of specific reuse and recycling targets, creates little incentive to account for end-of-life aspects in the design phase. Thus, design for reuse and recycling has generally not been a priority for the EEE industry. It is important to create this incentive so that the end-of-life aspects can be prioritised in the design phase on par with the technical, economic, and marketing aspects.
Conversely, increased regulation on environmentally hazardous substances in plastics has enhanced the opportunity for recycling, as many harmful substances have been, and continues to be, phased out (European Commission, 2018a). Although, hazardous substances within WEEE are still considered to be a major obstacle to recycling. When it comes to reuse of plastic parts from WEEE, the lack of standardisation in part types is brought forth as the main obstacle for large scale reuse. As there is a limited number of players on the data centre server market, and the end users of the products is often businesses, there might be an opportunity to create standardisation on plastic types and additives used, which would create larger and cleaner waste streams, with the possibility of establishing closed loop recycling.