3. Results
3.1 Macro-plastics (>25 mm)
All items with size >25 mm were easily defined and characterized due to their relatively well conserved structure. The results revealed significant amounts of items as wet wipes, sanitary pads and condoms in the wastewater in both Sisimiut and Nuuk, with total loads of 32 items in a sampling time of 445 minutes for Sisimiut, and 13 items in a sampling time of 190 minutes for Nuuk, corresponding to an equal daily input of 104 and 99 items, respectively (Table 2). The polymeric characterization of the macro-items by ATR-FTIR analyses (Figure 5) revealed that for Sisimiut the 23 wet wipes were of PET (polyethylene terephthalate), the single condom of rubber, the 3 sanitary pads of PP (polypropylene), one piece of foil and 3 cotton buds of cellulose. In Nuuk, the wet wipes were characterized as 6 pieces of PET, 3 of viscose and 3 of cellulose. Also, one sanitary pad was characterized as PE (polyethylene). Thus, 87% and 77% of the items were of synthetic (PET, PE, PP, rubber) or semi-synthetic (viscose) origin in Sisimiut and Nuuk, respectively (Figure 5).
Table 2 Quantification and dominant polymer of different plastic or plasticized fractions found in wastewater in Sisimiut and Nuuk. The sampling of macro-plastics was conducted over a total of 445 minutes in Sisimiut and 190 minutes in Nuuk. Meso- and large sized microplastics were sampled in 90 L in both Sisimiut and Nuuk and microplastics in 650 mL in 2 replicates in Sisimiut. The yearly input of mass of plastic items through wastewater is estimated assuming a normal capitata consumption of 104 L of water pr day (Marechal et al. 2022).
Site | Size Fraction | Type of items | Abundant Polymer | Number of items | Mass (g) | Total mass (g) | Yearly marine input of plastic (g/year/capita) |
Sisimiut | > 25 mm | Wet wipes | PET | 25 | 37.4 g | 46.5 g | 27.5 |
Sanitary pads | PP | 3 | 7.5 g | ||||
Condoms | Rubber | 1 | 1.6 g | ||||
Cotton buds | Cellulose | 3 | 0.87 g** | ||||
5-25 mm | Film/foil | PE | 1 | <0.005 g*** | 0.005 g | 2.3 | |
1-5 mm | Fiber/thread bundle | PET | 1 | 0.01 g | 0.015 g | 6.9 | |
Film/foil | PE | 1 | <0.005 g*** | ||||
20-1000 µm | Microplastic fragments | PE | 32 L-1 | 12.8 µg L-1 | 0.5 | ||
PP | 131 L-1 | ||||||
PES | 20 L-1 | ||||||
PS | 7 L-1 | ||||||
PVC | <3 L-1*** | ||||||
PC | <2 L-1*** | ||||||
PMMA | <2 L-1*** | ||||||
PA | <2 L-1*** | ||||||
PUR | <2 L-1*** | ||||||
ABS | <2 L-1*** | ||||||
Other polymers | 28 L-1 | ||||||
Other rubbers | <5 L-1*** | ||||||
Nuuk | > 25 mm | Wet wipes | PET | 6 | 10.2 g | 16.9 g | 23.4 |
Viscose | 3 | 4.8 g* | |||||
Cellulose | 3 | 4.8 g*/** | |||||
Sanitary pads | PE | 1 | 1.9 g | ||||
5-25 mm | N/A | - | - | 0 g | 0 g | 0 | |
1-5 mm | Film/foil/fragment | PE | 4 | 0.02 g* | 0.03 g | 12.7 | |
Film/foil/fragment | PUR | 2 | 0.01 g* |
Polymer type: PE (polyethylene), PP (polypropylene), PS (polystyrene), PES (polyester), PVC (polyvinylchloride), PC (polycarbonate), PMMA (polymethylmethacrylate), PA (polyamide), PUR (polyurethan), ABS (akrylonitril-butadien-styrene)
N/A: Not detected, *Estimated weight. **The masses of cellulose wet wipes and cotton buds are not included in the estimation of yearly marine input of plastic. *** Under detection limit (the total mass and yearly marine input for these items are therefore an absolute maximum). See Table S2 for detection limits of quantification of polymer types.
Figure 5 Items with size >25 mm in wastewater in a) Sisimiut, where a total number of 31 items were found in a raw wastewater sample collected during 445 min, and b) Nuuk, with a total of 13 items in a raw wastewater sample collected during 190 min. n indicates number of items.
3.2 Meso-plastics (5-25 mm)
Only one meso-plastic sized particle polymeric characterization as PE was sampled in Sisimiut, whereas no particles in this size range were found in Nuuk (Table 2).
3.3 Large-sized Microplastics (1-5 mm)
Of the large sized microplastics, 2 and 6 items were sampled in Sisimiut and Nuuk, respectively. The items from Sisimiut consisted of one PET fiber/thread and one PE film/foil (Table 2). The 6 items from Nuuk consisted of 2 items of film/foil, besides 2 pieces of PE and 2 pieces of PUR (polyurethane). The latter four items were not visually characterized as they were lost between the ATR-FTIR analysis and the visual characterization and size measurement. The items are denoted film/foil/fragments in Table 2 and for inclusion in data, the mass of the items was estimated based on the mass of similar items.
3.4 Microplastics (20-1000 µm)
Figure 6 Size distribution of MPs identified in sewage water samples from Sisimiut. The figure indicates counts of particles within each size group per liter sample. Minor and major dimensions describe the shortest and the longest length of the particle, respectively. Note: the size group of 5.5-19 µm (grey colors) is below the filter used in the extraction procedures, wherefore the number must be seen as an absolute minimum. The size distribution is shown for the dimensions of the particles measured on the longest and the shortest edge by µFTIR image analysis and use of siMPle software (https://simple-plastics.eu/) data output.
The content of microplastics in the two wastewater samples (each of 650 mL) from Sisimiut determined by µFTIR analyses showed a presence of microplastics at levels significantly higher than the detection limits (Table 2 and S2). By employing µFTIR analyses on the sample, the average number of MPs was determined to 217 L-1 (range: 159-276 L-1). By µFTIR analyses the primary polymer types were identified as PP (65%), PE (15 %), and PES (polyester, 6% (PES includes PET, PBT and other polymers)), but a few microplastic particles consisting of PS (polystyrene) were also identified in the samples (1%). The group of other synthetic polymers like EVA (ethylen-vinylacetat) contributed ~13% (Figure 7).
Figure 7 Polymer distribution of the MPs in sewage water samples from Sisimiut identified by µFTIR analysis. The largest part of the MPs was polypropylene (PP, 65%), but also MPs of polyethylene (PE, 15%), polyester (PES, 6%, PES includes PET, PBT and other polymers), polystyrene (PS) and also other polymers were detected (13%).
Looking into the microfiber content of the wastewater, visual inspection revealed a rather large contribution of white/transparent fibers (range 102–352 fibers L-1) well above the detection limit (DL: 77 fibers L-1; range 17-64), while the colored fibers in the wastewater (range 7–8 fibers L-1; range 0-31) were below the detection limit (DL: 39 fibers L-1). This visual quantification was confirmed by the µFTIR analyses.
The µFTIR analyses revealed that the most part of the fibers was of organic material (cellulose or protein) and only 18% were of plastic polymers (10% PES and 8% PP) (Figure 8). Figure 9 shows a PET fiber likely to be a result of laundry. Due to methodological limitations the cellulose fraction, or at least a portion of it, may be considered as viscose. This uncertainty arises from the limitations of FTIR analysis in separating cellulose and viscose, and the inclusion of cellulose-degrading enzymes in the extraction methods, potentially leading to the degradation of true cellulose during the extraction process.
Figure 8 Polymer distribution of the fibers only (20-1000 µm) identified in sewage water samples from Sisimiut by µFTIR imaging analysis. A total number of 124 fibers were detected in total in the two samples, equaling 94 fibers per liter. The figure shows that of all fibers in the sample, only 18% was identified as MP plastic fibers as polyester (PES that in the analyses includes PET, PBT and other polymers) and polypropylene (PP). 67% of the fibers were identified as cellulose, but due to µFTIR analytic limitations and extraction methodologies using cellulose-degrading enzymes, it cannot be excluded that this fraction is fully or partly viscose fibers.

Figure 9 A PET fiber bundle was found in the larger microplastic fraction (1-5 mm) in the wastewater sample collected in Sisimiut. The PET fiber bundle is probably a result of machine washing of textiles. Photo by Hadi Salame.
The size distribution of the identified microplastic particles revealed that 81% of the particles were in size fractions less than 100 µm, measured along the longest dimension, while only 2% were longer than 300 µm (Figure 6). Only 4% were smaller than 20 µm, which is due to methodology limitations of the usage of a 20-µm mesh steel filter during the extraction process. Additionally, during the image analysis using siMPle software, the identification of microplastic particles was set to include only particles where at least 2 neighboring pixels, each measuring 5.5 µm, support the same identified polymer for a given particle. In addition, the µFTIR analyses are also limited by the so-called diffraction index, generally affecting the spectroscopic quality needed for identifying particles smaller than 15–20 in thickness, which also affect the inclusion of microplastic particles smaller than 20 µm. Without these methodology limitations, the size fraction of < 20 µm would most likely have held significantly higher amounts.
3.5 Estimated loads of plastic litter entering the marine environment.
The annual input of marine plastic litter from the household wastewater to the marine environment was estimated using the PE loads of 2000 for each of the two outlets in Sisimiut and Nuuk, the sampling time period (Table S1) and average daily water consumption capita-1 of 104 L day-1 person-1 in Greenlandic towns (Marechal et al. 2022).
In Sisimiut, the macro-plastic items contributed the most to the mass of litter items, which consisted primarily of wet wipes (74% of the total input) but also sanitary pads and condoms, would by estimate give a yearly input to the marine environment of 27.5 g capitata-1. Taking all size fractions into consideration, an estimated yearly input will be 36.4 g capitata-1, thus the 5,460 inhabitants in Sisimiut (Statbank Greenland, 2023) emit approximately 199 kg plastic L year-1 to the marine environment via the 11 sewage outlets.
In Nuuk, the macro-plastic items, which consisted of wet wipes and sanitary pads (23.4 g capitata-1 year-1) contributed somewhat more than the larger microplastic items (12.7 g capitata-1 year-1) to the input of litter to the marine environment. In total, the data points to a yearly input of 36.0 g capitata-1 in Nuuk, and with a population of 19,866 inhabitants (Statbank Greenland, 2023), this approximates to a total annual input of 716 kg plastic litter to the marine environment of Nuuk Fjord via 19 sewage outlets. It is however important to note that these Nuuk estimations do not include the MP size fraction of 20–1000 µm.
3.6 Survey of wet wipes in trade in Greenland
In total 26 different wet wipes for sanitary (n = 17) and cleaning (n = 9) purposes, were collected during the trade survey in Sisimiut. The ATR-FTIR analysis of the wet wipes (Figure 10) revealed that the primary polymer for wet wipes for both cleaning and sanitary purposes mainly were viscose (41%) and PET (37%), while the primary polymer was cellulose for a minor part (15%). By ATR-FTIR analyses, we found that the product declaration of wet wipes did not fully correspond to our analyses on polymer composition (Table S3). For example, were some products declared as being biodegradable determined by ATR-FTIR to be of viscose.
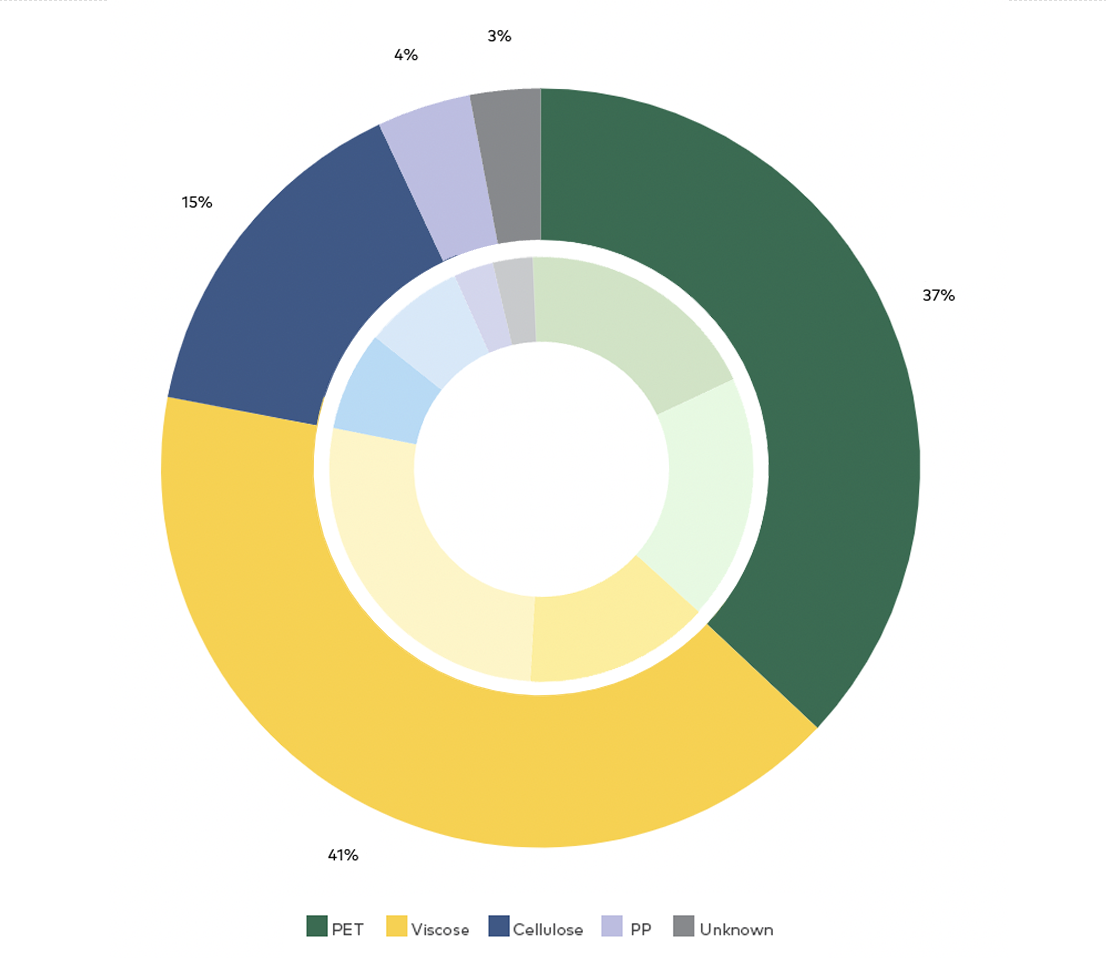
Figure 10 Polymer composition of wet wipes in grocery stores and healthcare shops in Sisimiut (shown as average in outer circle). The polymers were characterized by FTIR analyses. The wet wipes were either related to sanitary (darker in inner circle) or cleaning purposes (lighter in inner circle).
3.7 Beach surveys
During the two 'wet wipe surveys' at an adjacent beach to the wastewater outlet in Sisimiut, we could not identify any wet wipes. This was supplemented by visual inspection adjacent to the wastewater outlet in Sisimiut at low tide, and in Aasiaat, clearly showing wet wipes at the seabed (Figures 11a & c).
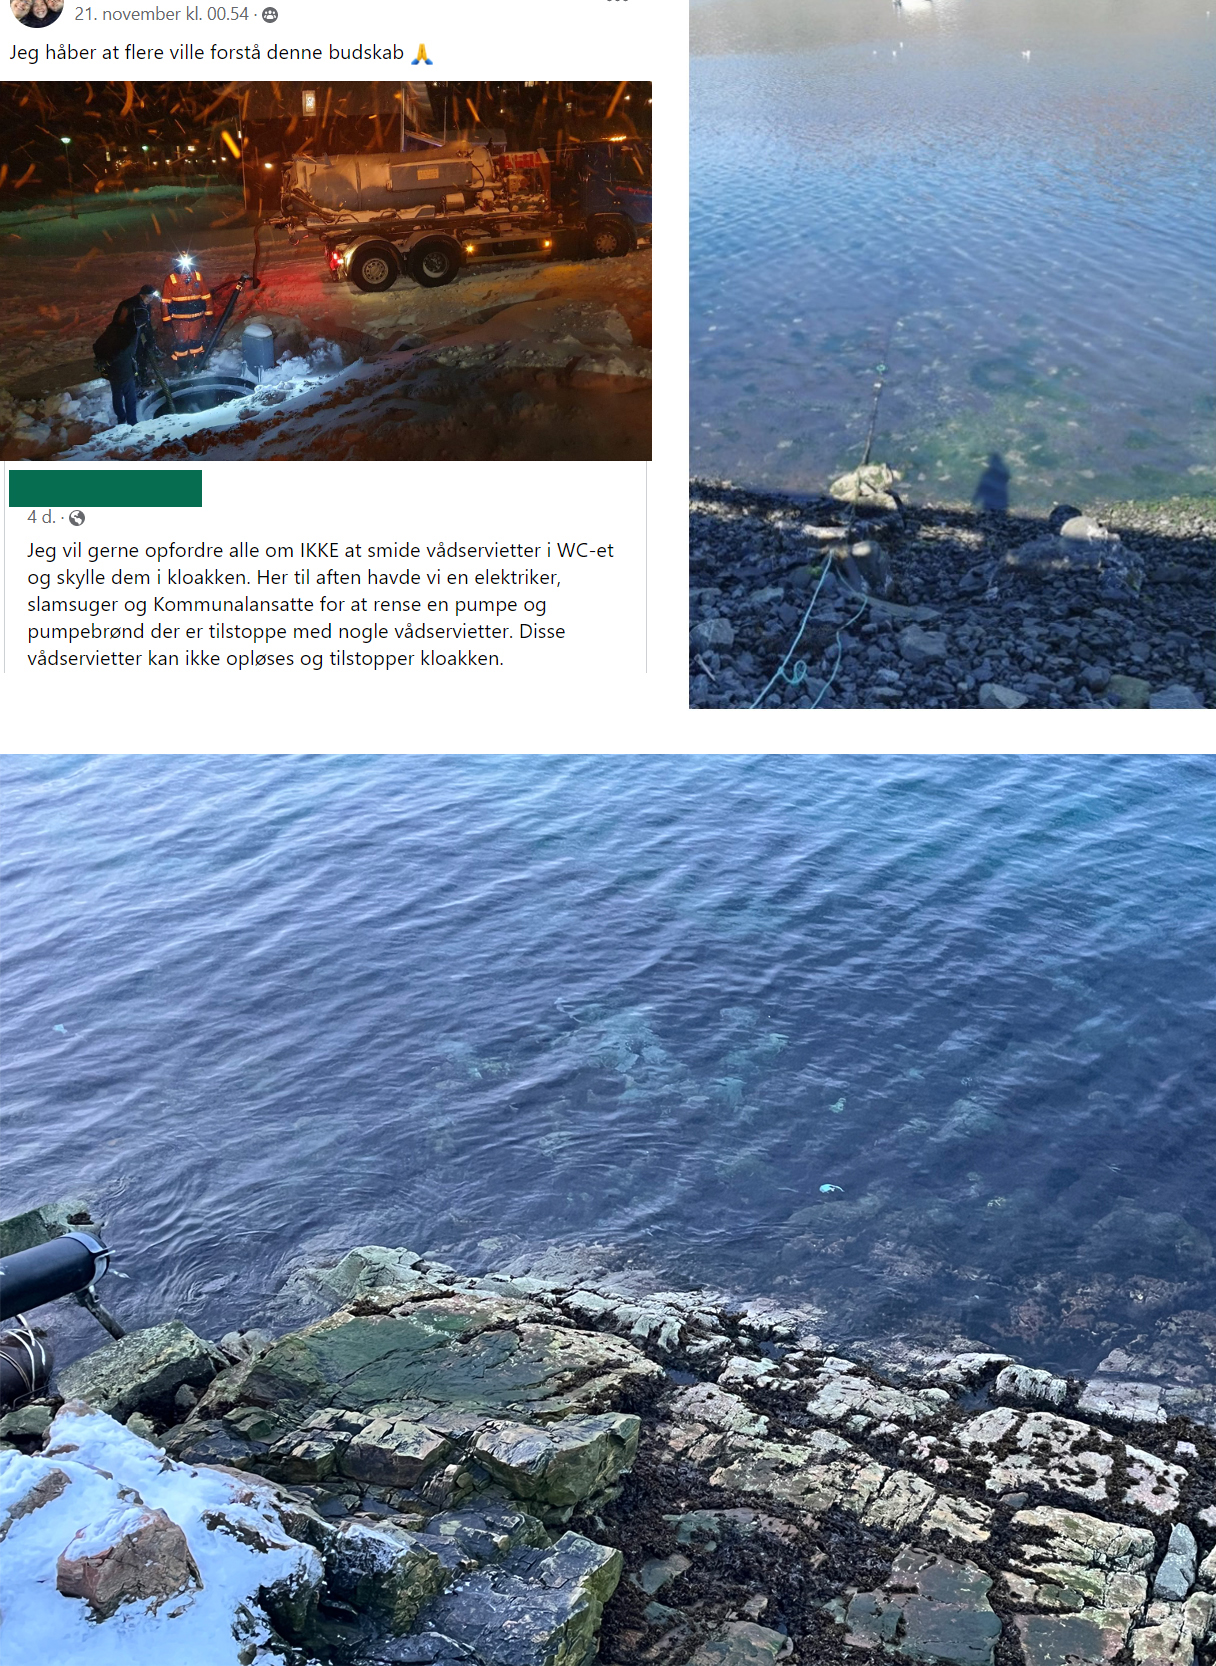
Figure 11 a) FaceBook post regarding clogging of sewage pumps due to wet wipes in sewer, November 2023. Text says: I hope more people will understand this message. I want to encourage everyone to NOT discharge wet wipes in the toilet and flush them in the sewer. This evening we needed an electrician, a vacuum tanker, and municipality professionals to clean the pump and the well, which were clogged by wet wipes. Wet wipes do not dissolve, and they clog the sewer. b) Wet wipes at the seabed next to the sampled outlet U1 in Sisimiut at low tide. Photo Haid Salamé. c) White objects likely to be wet wipes at the seabed by a wastewater outlet in Aasiaat, Greenland. Photo: Pernille Erland Jensen.