2. Methodology
2.1 Study areas
Sampling for plastics was conducted at two wastewater outlets in Greenland, one in the capital of Greenland, Nuuk, with ~ 19,870 inhabitants and one in the second largest town, Sisimiut, with ~ 5,460 inhabitants. The sampling sites were chosen based on the preference for outlets receiving wastewater primarily from households while avoiding wastewater from fish and seafood processing industry. Two outlets meeting this criterion, and with similar PE (Person Equivalents) loads of approximately 2,000 PE (i.e., 3.6% of the Greenlandic population) and easy accessibility were selected. The outlet sampled in Sisimiut was U1, where samples were taken from well number 08A0001A, while the outlet sampled in Nuuk was U15, which was sampled from well number 0620004 (Figures 1, 2 and 3).
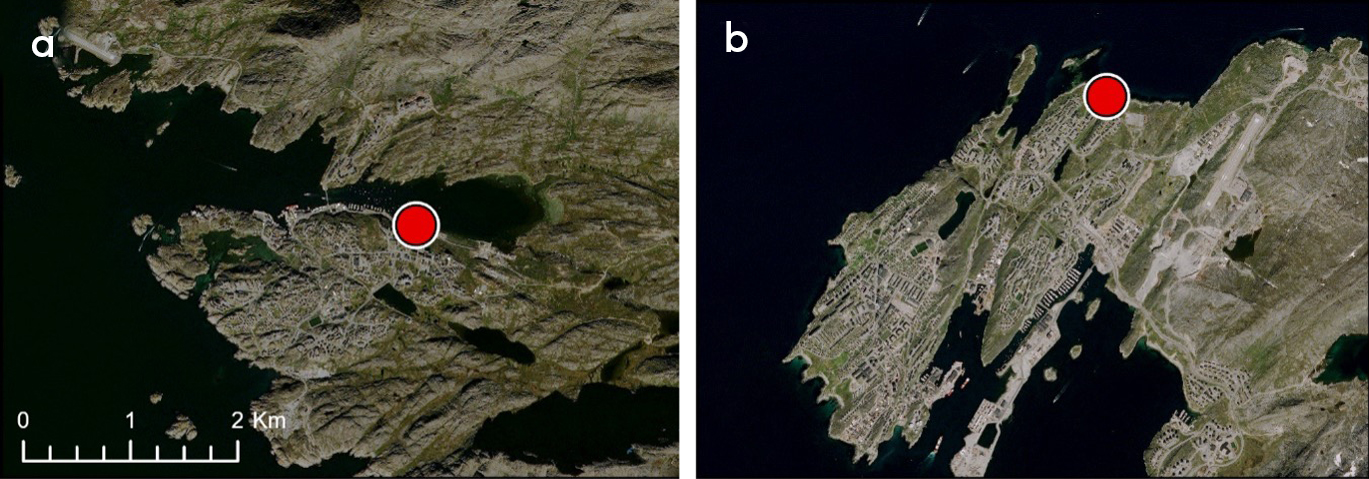
Figure 1 Site of sampling in a) Sisimiut and b) Nuuk. At both sites, the sewer discharges raw wastewater from approximately 2000 PE.
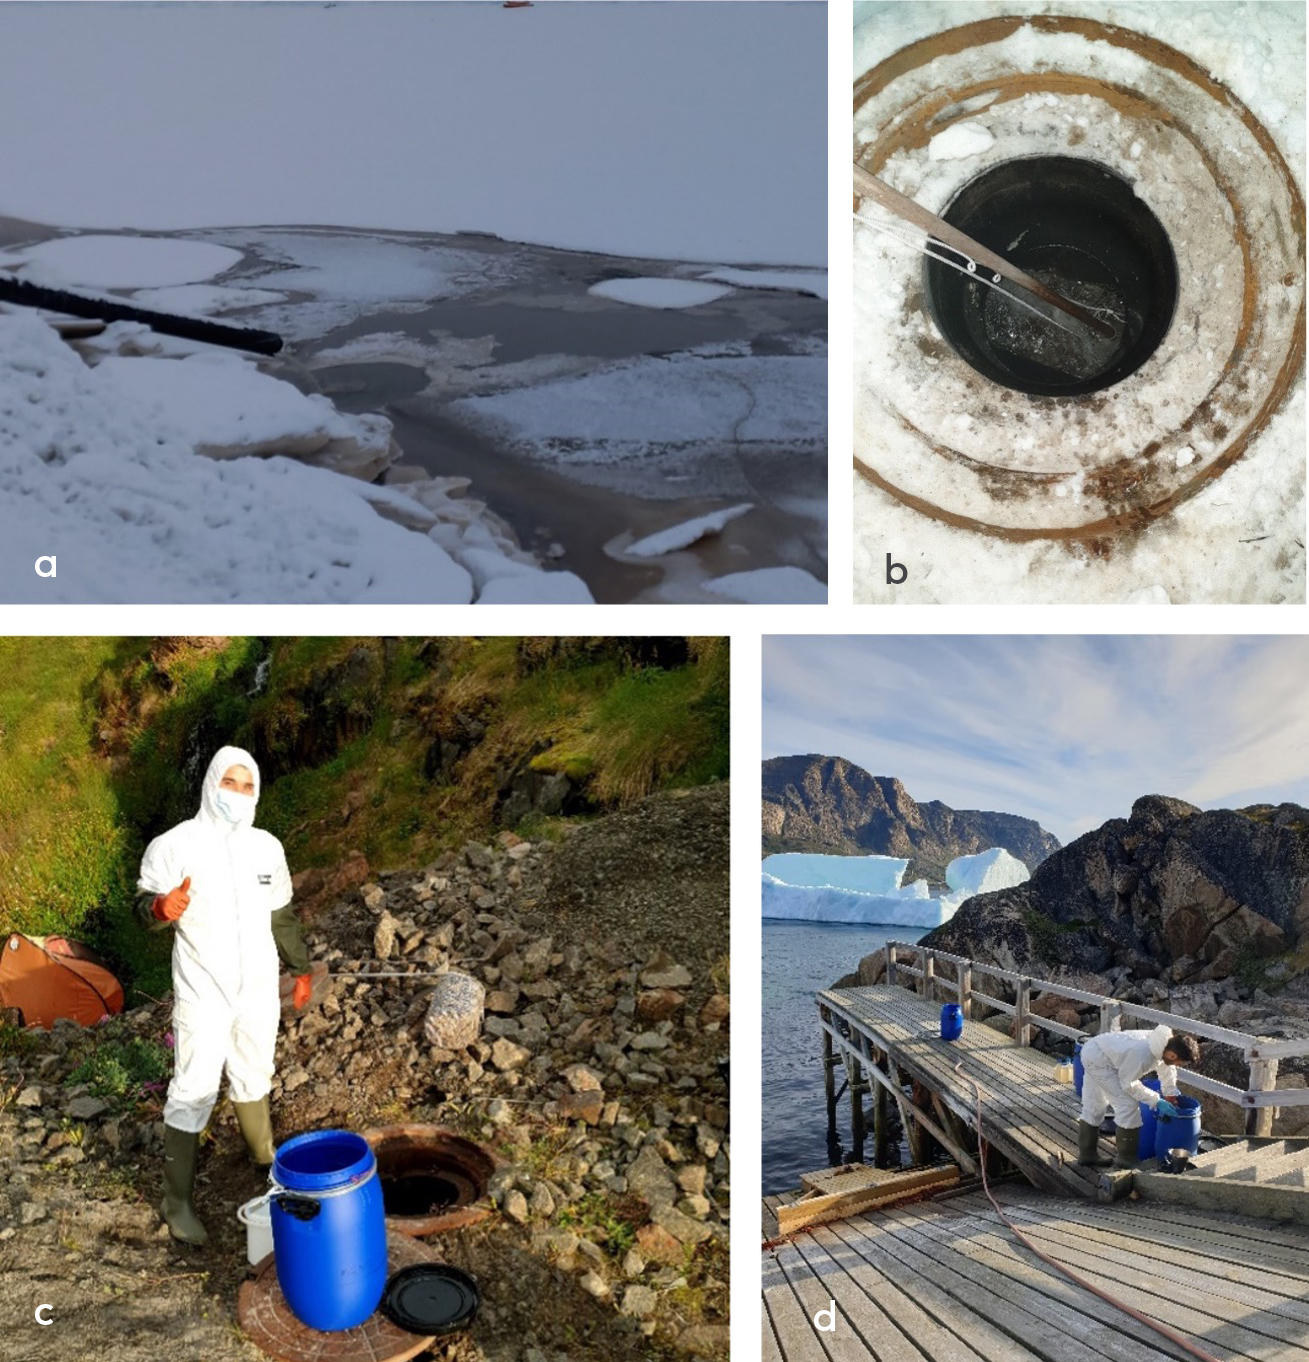
Figure 2 a) Wastewater outlet U1 in Sisimiut, March 2022, b) Sampling of macroplastics, c) Sampling of meso-plastic, d) Cleaning of meso-plastic and macro-plastic samples in Sisimiut. Photos: Pernille E. Jensen
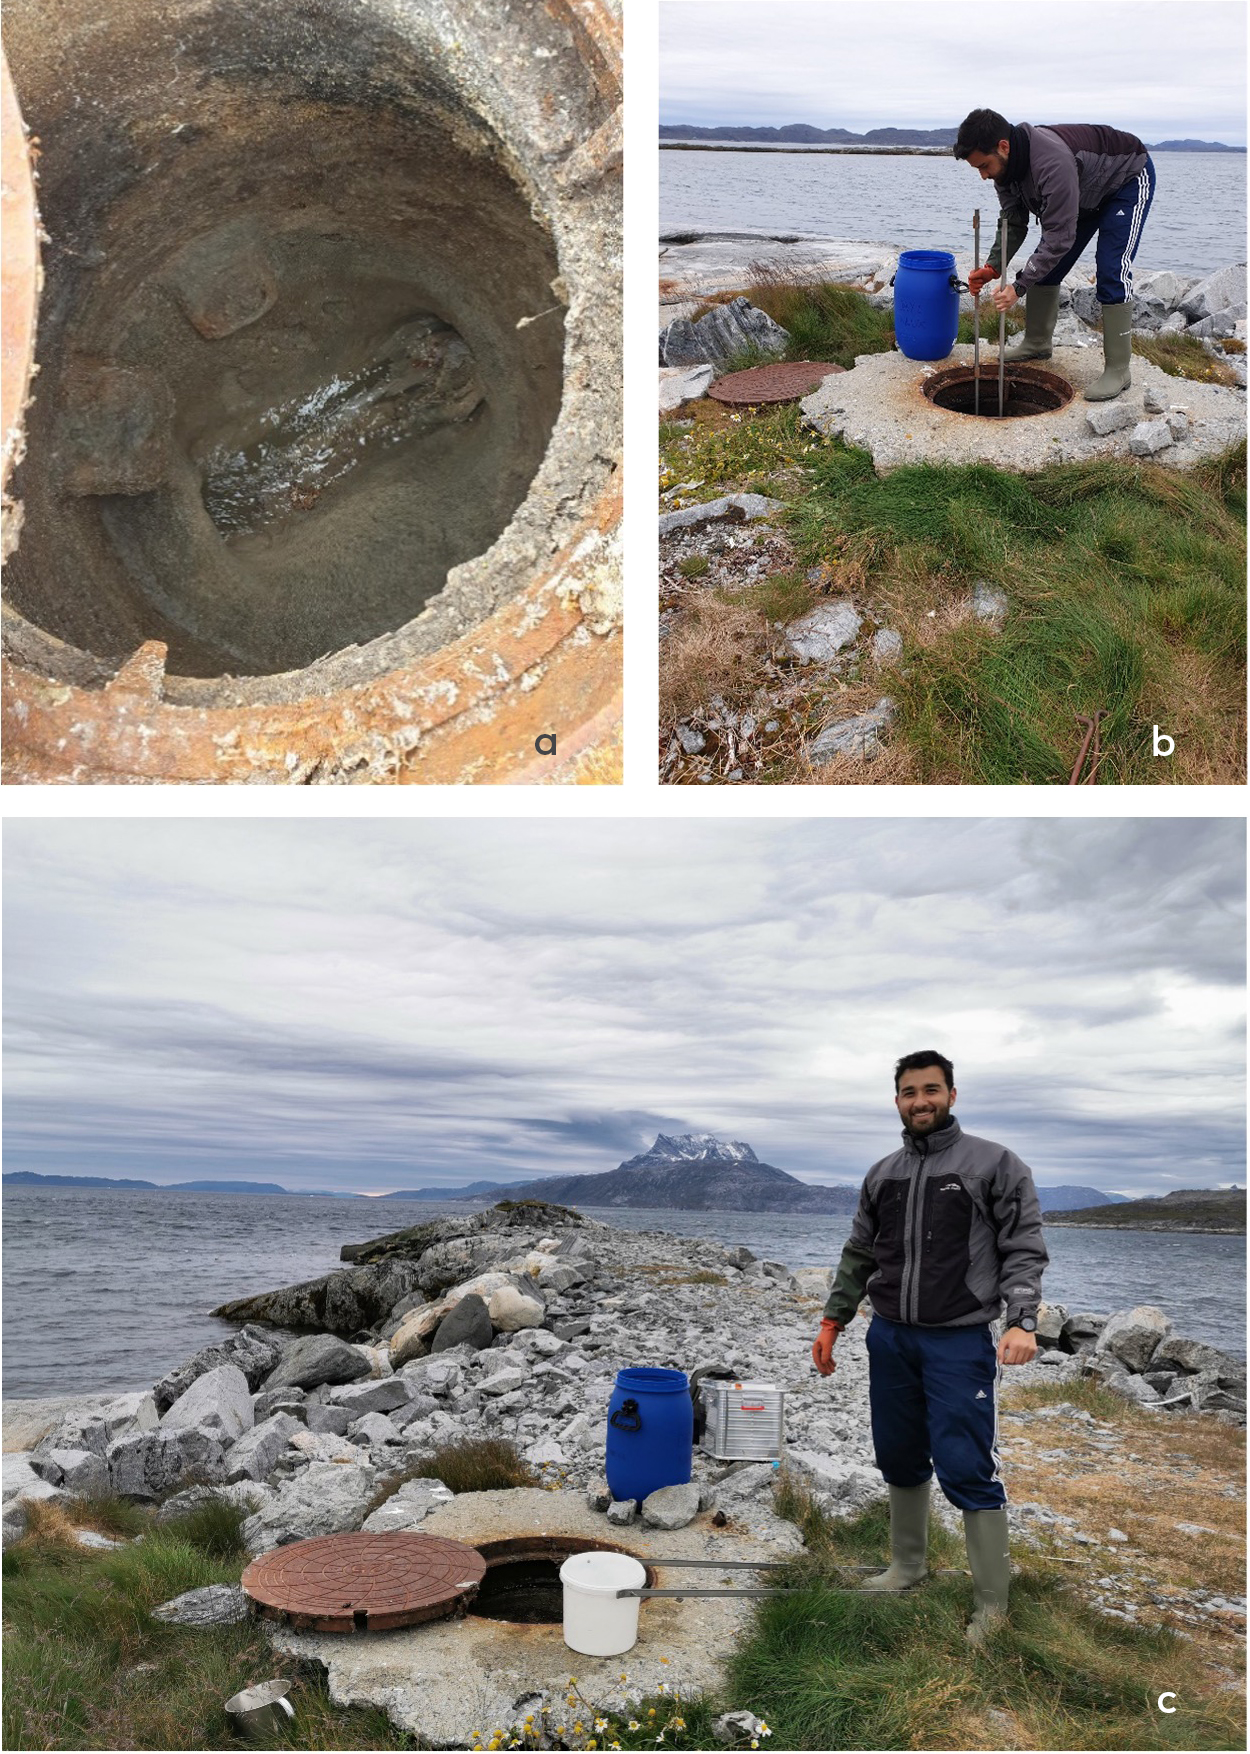
Figure 3 a) Sewer U15 sampled in Nuuk, b) Sampling of macro-plastic in Nuuk, c) sampling meso-sized plastic in Nuuk. Photos: Pernille E. Jensen
2.2 Sampling and processing
Sampling was conducted to distinguish four plastic size fractions: macro-plastics (> 25 mm), meso-plastics (5–25 mm), large-sized microplastics (1–5 mm) and microplastics (20 µm–1 mm) according to the recommendations of the GESAMP for the monitoring and assessment of plastic litter in the ocean (GESAMP, 2019). These recommendations were also followed when classifying the plastics into color, shapes, and sources.
As differences in amounts and types of litter in the wastewater during daily routines and throughout the week are expected, the sampling was conducted at times representing different times throughout the day and different weekdays. Despite the sewers in Greenland being separate (i.e., rainwater and snow melt water runs in separate ditches), increased flow of sewage in pipes has been visually observed on previous occasions. Samples diluted by rainwater were avoided by not sampling for at least 48 hours after any rainfall. A detailed overview of the sampling scheme can be found in Table S1.
2.2.1 Sampling of macro-plastics (> 25 mm) in Nuuk and Sisimiut
To collect macro-plastics, a steel sieve with a pore size of 25 mm was designed and positioned in the sewer ensuring that all wastewaters would flow through while collecting litter of > 25 mm. Sampling was continued until the matter collected in the sieve clogged the sewer (between 30 minutes and 3 hours). Detailed information about the duration of sampling can be found in supplementary material S1. After sampling, the steel sieve was thoroughly rinsed with tap-water via a hose to remove any matter smaller than 25 mm trapped within the sieve. To dissolve any remaining easily degradable organic matter such as toilet paper, food items and feces, as well as to disinfect the sieve and remaining material, the sieve was submerged in a 60 L blue HDPE (High density polyethylene) plastic barrel filled with an alkali solution pre-prepared by mixing cleaning agent Vip 1 (a mixture of sodiumhydroxide, disodiummetasilicate, penta-hydrate and sodiumhypochlorite, commonly used for cleaning and disinfection of milking equipment supplied by linds.dk) with tap-water in a 1:1 solution, and left for 24 hours. Finally, the sieve with remaining content was removed, rinsed with tap-water and left to air-dry before the collected items were retrieved, packaged and transported by plane to the laboratory at Ecoscience, Aarhus University in Roskilde, Denmark, for further analysis.
2.2.2 Sampling of meso-plastics (5-25 mm) in Sisimiut
Over the course of three individual days, a total of 90 L of raw wastewater was collected from each sampling site using a 1 L steel beaker measuring cup. Each day, 30 L of raw wastewater was collected in a blue HDPE plastic barrel by collecting 1 L at a time over a duration of a 2.5-hour period. Wastewater from the entire flow was collected. The collected wastewater was filtered through a 5 mm metal sieve. No items larger than 25 mm were collected, and the resulting sample represents particles ranging from 5–25 mm in size, only. The samples were rinsed, disinfected, packed and shipped according to the procedure described in 2.2.1.
2.2.3 Sampling of large-sized microplastics (1-5 mm) in Nuuk and Sisimiut
After the 5 mm filtration for collection of meso-plastics (as described in section 2.2.2), a subsample (30 L) of the filtrate was further filtered through a 1 mm plankton-net to achieve a sample of large-sized microplastics (1–5 mm). The 1 mm net including retained particles was rinsed, disinfected, packed and shipped according to the procedure described in 2.2.1.
2.2.4 Sampling of microplastics (20-1000 µm) in Sisimiut
Sampling for microplastics was done in Sisimiut, in digested (muffled) 1 L blue-cap glass flasks by hand by a person wearing no synthetic textiles, to avoid plastic contamination. Two flasks were filled with approximately 1700 mL of wastewater from three sampling occasions (due to shallow water they could not be filled completely). A blind sampling subjected to an identical procedure, though not letting any water in, was also included at each sampling round. These samples served as field blanks. All flasks were transported by plane to the laboratory at Ecoscience, Aarhus University, in Roskilde, Denmark, for further analysis.
Two of the collected wastewater samples (~ 600–700 ml each) were analyzed for the smallest types of MPs in the size fraction of 20–1000 µm, applying a modification of the procedure described for sample preparation in Rasmussen et al. (2021). The samples were weighed and thereafter purified to remove as much natural material as possible. Initially, the samples were filtered through a 20 µm stainless-steel filter, whereafter the filter with the collected material was subjected to ultrasonication in acetate buffer (pH 4.8) with the addition of SDS (sodium dodecyl sulphate) as a detergent. The samples were transferred to a bottle with cellulose-degrading enzymes (cellulase and viscozyme), followed by 40 hours reaction time in a water bath at 50 °C. Subsequently, the samples were filtered (20 µm), and the filter was ultrasonicated in the acetate buffer for 5 minutes once more. The samples were then treated with a mixture of a strong alkaline solution (10% KOH) and hypochlorite (7% NaOCl) as an oxidizing agent for 24 hours, after which the samples were filtered again (20 µm). Finally, a solution of zinc chloride with a density of 1.5 g/ml was used to separate heavier particles from those suspended in the liquid in a separating funnel. The upper part of the liquid fraction was then filtered through a series of stainless-steel filters with mesh sizes of 1000, 100, and 20 µm. The lower part of the liquid fraction was discarded.
The size fractions 20–100 µm and 100–1000 µm of the purified sample were transferred to separate silicon membranes (MakroPor, SmartMembranes) with a diameter of 13 mm and a pore size of 5–6 µm. The size fraction 100–1000 µm was examined under a microscope for particles resembling microplastics.
2.3 Sample analyses
2.3.1 Analyses of macro-plastics (>25 mm)
Initially, the plastic items >25 mm were visually characterized according to EUs JRC 2021 technical report 'A Joint List of Litter Categories for Marine Macro-litter Monitoring' (European Commission Joint Research Centre, 2021).
To validate the visual classification along with polymer specific identification, representative items and particles >25 mm were identified using the ATR-FTIR (Fourier transform infrared spectroscopy-attenuated total reflectance) spectroscopy and relevant spectral libraries. Measurements were carried out using Agilent Technologies 4500a Series Portable FTIR. The spectrometer was equipped with a triple-reflection diamond ATR sample interface and an in-depth ATR polymer library. The absorbance spectra were collected using 32 background scans at a 4 cm-1 resolution, measuring a spectral range between 650 and 4000 cm-1. A background atmospheric spectrum was subtracted from all sample spectra, and 8 sample scans were performed for each sample. The library used for the polymer identification was an in-house spectral reference library of FTIR-ATR spectra of multiple synthetic and natural materials developed by the Department of Ecoscience at Aarhus University. All the items/particles were dried prior to chemical analysis to reduce interference of H2O in the IR (infrared) spectrum.
For the ATR-FTIR analyses, the 'Microlab' software was used as an initial assessment as it automatically compares the collected spectrum with a spectral library and associates the best spectral match. Subsequently, the 'Essential FTIR' software was applied for the data processing and interpretation of the final polymer ID. All generated spectra in this study were smoothed and baseline adjusted as such corrections are critical preprocessing techniques for improving the quality of raw FTIR spectra and obtaining a more precise analysis.
2.3.2 Analyses of meso-plastics (5-25 mm) and large-sized microplastics (1-5 mm)
Particles within the two size groups, i.e., meso-plastics of 5–25 mm and large-sized microplastics (1–5 mm), were visually characterized according to their morphology (e.g., fibers, films, fragments, pellets, etc.), color, length, and width using a "Nikon SMZ18" stereomicroscope. Subsequently, the particles were polymer characterized by the same method that was applied for analysis of macro-plastics (ATR-FTIR) and described above in section 2.3.1.
2.3.3 Analyses of microplastics (20-1000 µm)
The particles collected by the silicon membranes were analyzed using µFTIR spectroscopy in transmission mode, utilizing an Agilent Cary 620/670 FTIR microscope with a 128 x 128-pixel resolution FPA (Focal Plane Array), where each pixel size was 5.5 µm. The analyses were performed with a resolution of 4 cm-1 and 8 scans per pixel measuring a spectral range between 870 and 4000 cm-1. To cover the entire area of the silicon membrane, a mosaic of 15 x 15 = 225 image parts were assembled, resulting in a total dataset of 3,686,400 FTIR spectra. These extensive spectral image mosaics were analyzed using siMPle software developed for automated image analysis (https://simple-plastics.eu/) (Figure 4). For polymer identification, a µFTIR spectral reference library (MP-AU4a) developed at Aarhus University was used, containing 106 spectra of the 10 primary plastic polymer groups (PE (polyethylene), PP (polypropylene), PES (polyester), PS (polystyrene), PVC (polyvinylchloride), PC (polycarbonate), PMMA (polymethylmethacrylate), PA (polyamide), PUR (polyurethan), and ABS (akrylonitril-butadien-styrene) as well as broader groups for other plastic-polymers and rubbers. In addition, the reference library also contained µFTIR spectra of various types of naturally occurring organic materials made of cellulose, proteins, and minerals. Additionally, siMPle software was used to estimate the mass of the microplastics based on their volume, taking into account particle area and assuming a proportional relative thickness.
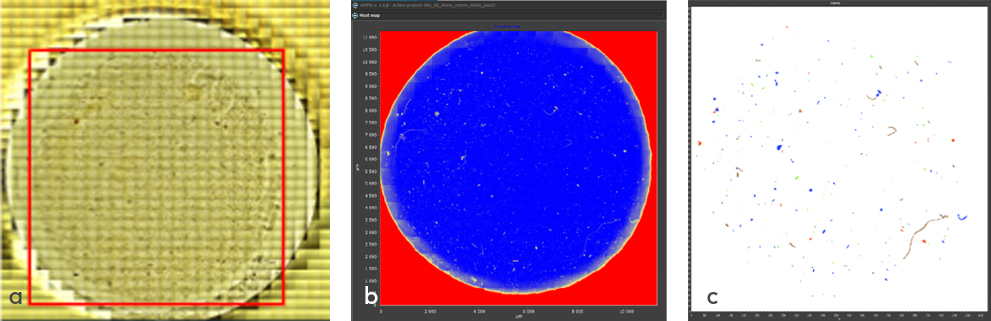
Figure 4 Different types of images of the full sample 1B collected at the 20 µm filter fraction and transferred to a silicon membrane and analyzed with µFTIR spectroscopy. a) the visual image where the analyzed part is marked with red square, b) the spectral heatmap of all particles on the silicon membrane disk and c) the map of all identified microplastic particles at a mosaic consisting of 225 tiles, each tile composed by 128x128 times of 5.5 µm pixels.
To minimize the risk of contamination, all reagents were filtered through a 0.2 µm GF filter, and all glassware and steel filters were wrapped in aluminum foil and heated at 450 °C. Rubber seals and stainless-steel filter chambers were cleaned through regular machine dishwashing, followed by ultrasonic treatment in SDS solution and then ethanol.
Field blank samples and laboratory blind samples were analyzed to assess the potential risk of external contamination during sample handling. In total, 2 field blank samples and 2 laboratory blind samples were analyzed, each divided into size fractions of 20–99 µm and 100–999 µm. Based on the blind samples, analytical detection limits (DL) were determined being equivalent to the mean value plus 3 standard deviations for individual polymer types and for the total number of identified microplastics, as shown in Table S2. For polymer types not identified in the blind samples, the detection limit is set at 1 per sample, corresponding to 2 L-1 when analyzing sample volumes of approximately 650 mL.
The quantification of fibers on the silicon membranes using visual microscopy revealed a possible internal contamination of the blind samples. With quantification of an average 35 transparent or white fibers per sample, and an average of 9 colored fibers per sample in predominantly black, blue, and red colors, this likely points to an internal fiber contamination, which would result in a detection limit of 77 white/transparent fibers and 39 colored fibers per sample (calculated as average + 3 x standard deviation (SD)). As a result of the relatively high level of fibers in the blind samples, which for the colored fibers was at the same level as the number of colored fibers found in wastewater samples, the data on colored fibers are reported as < SD for these samples.
2.4 Survey of wet wipes in trade in Greenland
Due to the identification of wet wipes in the sewage as a significant source of plastic litter pollution, a survey of the wet wipes in trade in Greenland was made. In Sisimiut, we purchased any commonly available wet wipes both for sanitary and cleaning purposes. During the 1st – 3rd of July 2023, we visited all grocery stores in Sisimiut as well as other stores that sell beauty products. All different types of wet wipes available were collected. The wet wipes were analyzed for primary and possible secondary polymer by the same method (ATR-FTIR) as described for macro-plastics and described above in section 2.3.1.
2.5 Beach surveys
Due to the findings of significant amounts of wet wipes in the sewage, two rounds of survey of the beach in the inner part of the Kangerluarsunnguaq Bay in Sisimiut, the recipient of the sewage samples was done in June and July 2023.