2 Overview on PFAS analytical methods
In the following chapter a summary on commercially available PFAS analysis methods as well as current developments on existing and new methods is presented. The method details are presented based on both the feedback received during stakeholder consultations and on literature search performed according to search criteria developed in section 1.1.2. This section is divided into four distinct parts, starting with the description of methods aiming at monitoring the total fluorine content of samples (section 2.1), and then progressively evolving toward more specific analytical and structural methods such as non-targeted and suspect screening analysis using high resolution mass spectrometry (section 2.2), as well as targeted analysis (section 2.3). Section 2.4 covers additional characterization methods that are more related to structural analysis and complement the portfolio presented in the report. A graphical table of content of the section is provided in Figure 1.

Figure 1: Graphical overview of the architecture of the report. The analytical method section is divided into four distinct parts. The section starts with methods related to the determination of the total fluorine content (section 2.1), then non-targeted and suspect screening HRMS-based methods (section 2.2) as well as targeted analysis methods (section 2.3) are developed, and finally structural analysis approaches and additional methods (section 2.4) end the section 2.
The analytical method section is designed to first introduce analytical methods that provides broad information content on total fluorine content without the need to identify and quantify each individual PFAS compound separately (section 2.1) (Figure 2). These more straightforward methods require minimal time and cost investments to implement and consequently already found applications for commercial use and are developed to have a broader view on what is present in the sample and can be used as a first screening step. Section 2.2 is dedicated to the presentation of high-resolution mass spectrometry-based methods that provide high accuracy mass and structural data on both known and unknown PFAS compounds (Figure 2). Information obtained from non-targeted analysis and suspect screening workflows are very rich in information and allow to identify new PFAS compounds in complex matrices environment with a high degree of confidence. The identified PFAS are then used to developed more targeted analytical methods as described in section 2.3. Because of the expensive instrument for the non-targeted analysis and the highly trained experienced people needed for the data processing, reduced workflows and data-processing can be of more interest. Targeted methods are very specific approaches that aim to probe, i.e. identify and quantify, PFAS compounds at the individual level with a high degree of precision and sensitivity. Finally, structural methods highlighted in section 2.4 can be run in parallel to HRMS analysis to confirm the identity of PFAS compounds based on complementary structural tools such as nuclear magnetic resonance spectroscopy and Fourier transform infrared spectroscopy.

Figure 2: Different categories of fluorinated compounds. Organic fluorinated compounds include PFAS, which are divided into polymeric and non-polymeric compounds. The main analytical techniques applied to each category are displayed. Adapted from PFAS — Per- and Polyfluoroalkyl Substances (itrcweb.org).
Most of the analytical methods presented in this report were tailored to the analysis of environmental samples and biological samples. However, it is evident from our research that these methods could be transferred to the articles and chemical products by means of adequate sample preparation steps. Whenever possible, application to different matrices is presented for each technique. However, when there was no publication or stakeholder research relating to articles and chemical product analysis, the analytical technique is developed in the context of a different matrices. The Excel spreadsheet attached to the current PFAS restriction proposal compiles analytical methods available extracted from peer-reviewed literature (2010–2022) for different matrices (Appendix E4).
2.1 Determination of total fluorine content
The determination of sum parameters in PFAS analysis can be valuable to provide a comprehensive assessment of PFAS contamination without the need to identify and quantify each individual PFAS compound separately. Some common sum parameters used in the context of PFAS analysis include:
- Total Fluorine (TF): TF represents the sum of all fluorine-containing compounds in a sample. It includes both inorganic fluorine (IF) and organic fluorine (OF), which may consist of various PFAS compounds. TF can be determined using techniques like combustion ion chromatography (CIC), instrumental neutron activation analysis (INAA), particle-induced gamma-ray emission spectroscopy (PIGE), and X-ray photoelectron spectroscopy (XPS).
- Total Organic Fluorine (TOF): TOF specifically measures the sum of organic fluorine compounds, which are general assumed to be predominantly PFAS and their precursors. TOF analysis is useful for assessing the overall presence of PFAS in a sample, but TOF is not necessarily equal to the amount of PFAS, as non-PFAS organic substances containing fluorine may also be included. Separating TOF from TF typically requires the removal of IF.
- Extractable Organic Fluorine (EOF): EOF refers to the portion of organic fluorine that can be extracted from a sample using specific solvents or extraction techniques. It can be further divided into quantifiable and non-quantifiable fractions, with quantifiable EOF representing PFAS compounds that can be measured and identified.
- Adsorbable Organic Fluorine (AOF): AOF is determined by passing a sample through an adsorbent material that captures PFAS compounds. This method measures the organic fluorine content that adheres to the adsorbent.
In the European Union (EU), initial interlaboratory comparisons of EOF and fluorine mass balance in sludge and water matrices have shown promising accuracy, robustness, and reporting limits. However, certain substances, such as trifluoroacetic acid, exhibited poor extraction efficiency (Kärrman et al., 2021). Further a consultancy project commissioned by the DG ENV to give more advice on methods also for the Total PFAS limit value of the DWD was just kicked-off. To find a method with sufficient low detection limits is expected to be challenging. First results are expected end of 2023.
Further, first initiatives are taken to collaborate with the different EU member states within the CEN working group for the development of a EOF method for the analysis in soil samples (expectation date is probably 2026).
PIGE and XPS are surface measurement techniques, whereas INAA and CIC are bulk volume methods. PIGE, INAA, and XPS are non-destructive and offer high-throughput capabilities. These methods and other approaching methods are further elaborated in the subsequent sections. It's worth noting that while all these methods can theoretically be used for TF/TOF determination, only XPS can distinguish between TOF and IF. Therefore, the removal of IF from the sample is necessary for accurate TOF determination.
2.1.1 Combustion Ion Chromatography (CIC)
Using Combustion Ion Chromatography (CIC) total fluorine can directly be measured. Furthermore, it can be employed to estimate the quantitative amount of extractable organic fluorine after the extraction of samples or after elution of the adsorbent the amount of adsorbable organic fluorine. The fundamental principle underlying CIC involves subjecting the sample, whether solid, liquid, or gaseous, to thermal oxidation within a stream of moist oxygen at high temperatures ranging from 900 to 1050 °C. During this process organic fluorine is converted into hydrogen fluoride, which is subsequently absorbed in an aqueous medium, such as Milli-Q water or hydrogen peroxide. The thus liberated anions are identified via ion chromatography, followed by conductimetric detection.
When performing this method multiple potential influences must be taken into account though, especially the presence of inorganic fluoride and chloride. Further considerations include the potential devitrification of the combustion tube (typically quartz), which can be induced by elevated levels of alkaline earth elements like calcium or potassium, or the differences between calibration with inorganic fluorine and organic fluorine as well as dissimilar combustion efficiencies for various PFAS (R. Aro et al., 2021) which have to be accounted for. These influences can lead to an underestimation of the extractable organic fluorine content.
Limits of 0.05 mg F/kg (total fluorine), which could be lowered to 0.02 mg F/kg (extractable organic fluorine) introducing an extraction step prior to the analysis, by direct combustion of the materials were reported. The limits reported for adsorbable organic fluorine were strongly dependent on the presence of suspended solids (0.001 mg F/L instead of 0.01 mg/F/L, comparing clean water with water containing significant amounts of suspended solids).
Six respondents reported on PFAS analysis methods based on CIC during the survey. Five of these reports were by research laboratories or agency representatives and one was reported by a commercial laboratory. Nevertheless, this makes it the second most reported analysis method after LC-MS in this survey.
Established methods for commercial use
The standard CEN/EN 14582 specifies a combustion method for the determination of halogen and sulphur contents in materials by combustion in a closed system containing oxygen (calorimetric bomb), and the subsequent analysis of the combustion product using different analytical techniques. This method is applicable to solid, pasty and liquid samples containing more than 0.025 g/kg of halogen and as such be used for the analysis of chemical products and articles. However, insoluble halides and sulphate present in the sample or produced during the combustion step are not completely determined by this method. The method can only report the levels of fluoride present in the sample. It includes both organic and inorganic fluor and cannot make a distinction between the two.
Table 1: Overview on analytical standard methods for the determination of total fluor by CIC.
Method | Media | Validation Status | Method Type (Sampling, Preparation, Analysis) | Quantification limits |
CEN/EN 14582 | Solid, pasty and liquid samples | Multi-laboratory validated | Preparation and Analysis | Depends on matrix and analytical method used (samples with more than 0.025 g/kg halogen) |
DIN 38409-59 | Water, waste water and sludge | Validated (no further information) | Preparation and Analysis | LOQ of 2 µg/L for fluorine |
A German standard DIN 38409-59 is available the for the examination of water, wastewater and sludge for adsorbable organically bound fluorine, chlorine, bromine and iodine (AOF, AOCl, AOBr, AOI) by combustion followed by ion chromatography. In this DIN, a LOQ of 2 µg/L is reported.
An ISO/CD 18127 is currently under development for the determination of adsorbable organic fluorine, chlorine, bromine and iodine (AOF, AOCl, AOBr, AOI) – method using combustion followed by ion chromatography. The method is only applicable to water samples and will be available soon and can be used as a generic method for AOF in PFAS enforcement.
The results of the Single Laboratory Validation for the Clean Water Act (Draft Method 1621) on Adsorbable Organic Fluoride (AOF) are now accessible. The study aimed to validate a screening method for determining AOF in aqueous samples. Draft Method 1621 estimates the combined concentration of organofluorine compounds retained on granular activated carbon (GAC) sorbent and measured by CIC. Primarily designed for wastewater compliance monitoring, the method covers ten sample types, such as wastewater effluents, influents, and surface water. The study provided initial precision and recovery data for aqueous matrices. Of the thirty matrix spike samples analysed, twenty-nine showed recoveries between 50 and 150 percent, indicating satisfactory performance for a screening method. The method, sensitive down to 2.4 µg F-/L with stringent cleaning and low fluorine background in GAC columns, allows for a broad assessment of organofluorine contamination in aqueous matrices. It aggregates responses for adsorbable organofluorine, covering single compounds with chain lengths C4 to C8 and non-PFAS fluorinated compounds, using combustion ion chromatography. The method is suitable for screening and can be implemented in mid-sized environmental laboratories (US-EPA, 2022).
A technical guidance document on PFAS substances under the recast drinking water directive (DWD) was published. This is a summary report of the technical evaluations. All methods were assessed against technical evaluation criteria. For the total PFAS methods the criteria were: number of validated PFAS, selectivity, sensitivity, measurement uncertainty, sampling issues and sample preparation steps. An evaluation was made, and the aggregated results are presented as acceptable (>80 points), tentatively acceptable (50–80 points) or unacceptable (<50 points). In this document AOF (based on DIN38409-59 and the EPA draft method 1621) scored unacceptable (<50 points) in the sum of PFAS and total PFAS sections. This was unexpected and does not necessarily mean that the technique is incapable, but the method is designed to measure 20 individual PFAS and there is a lack of validation data to cover the list for the sum of PFAS. Another thing is that the technique lacks the sensitivity for the sum of PFAS (low ng/L). In another context, if not compared to the 20 PFAS compounds of the DWD, the technique can be very valuable for monitoring and regulation (IWW, 2023).
One commercial laboratory reported that they conducted detailed inter-laboratory and inter-method comparison experiments to determine the suitability of CIC based on method EN 14582 for the detection of surface fluorocarbons. Therefore, selected objects (e.g. coffee cup, foam, wire, disk) were intentionally sprayed with PFAS containing coating or mould release sprays prior to testing. The samples were tested by XRF-WD and FTIR as received, then sprayed with PFAS, tested by CIC and re-tested by XRF-WD. The tests showed that CIC was ineffective at detecting fluoro-coatings, in particular mold-release agents over 50 ppm on the surface of plastics and rubbers. It was estimated that the method would give a false “pass” (no PFAS found) in roughly ~50% of the real-world samples containing over 50 ppm of PFAS. According to the laboratory, the method cannot be used for samples that are not clearly homogeneous and cannot detect PFAS coatings in plastics and rubbers. The laboratory further states, that the method should not be used as a general method for total fluorine determination in PFAS enforcement.
Ongoing activities by research institutes
One research laboratory reported that they achieve about 10 ppm LOQ for the total fluorine determination by CIC analysis in a wide range of different products, articles, and others depending on sample preparation steps. The method quantifies total fluorine that give an indication about all types of PFAS independent on origin. Polymeric PFAS can be detected with this method along with acid alcohols etc. Thus, the method can be used as a first screening method for PFAS but cannot distinguish between different PFAS nor between inorganic and organic fluorine. One challenge they observed was a possible contamination of fluorine from calorimetric bombs used in a variety of projects.
It is important to note that CIC does not distinguish between organic fluorine and fluoride, and it doesn't provide insights into the molecular structures of the compounds found. The specificity of EOF and AOF assays comes from the sample preparation method chosen to isolate the organofluorine segment before CIC evaluation (Y. Shen et al., 2023).
An agency representative reported that CIC can be used for both total fluorine detection and total organic fluorine detection, however the latter require more experience of laboratory staff. For the total fluorine determination, a LOQ of approximately 20 ppm can be achieved determined by using the standard deviation of measurements on water blanks.
In the following research development regarding determination of EOF and AOF are presented separately.
EOF
More and more EOF is used together with the targeted analysis and other techniques to close the gaps in mass balances. In the fluorine mass balance, EOF is an important component of TF and can reveal unknown organic fluorine (UOF) by combining data from EOF and target PFAS. The CIC method measures the total fluorine (TF) content of the sample, so it is necessary to pre-treat the sample to remove the inorganic fluorine (IF) component or design an extraction method without co-extraction of IF to measure the EOF content (Y. Shen et al., 2023). The EOF assay, often termed as total organofluorine-combustion ion chromatography (TOF-CIC), broadly refers to techniques where the organic fluorine component is separated using ion pairing methods, and the overall fluorine content is gauged using CIC. EOF is the predominant method for measuring total organofluorine in environmental studies and it is applied to a variety of matrices.
Two research laboratories reported that they are using CIC for the determination of EOF. One respondent reported that they measure EOF by CIC after extraction via liquid extraction (SPE-free) optimized for fluoropolymer-based PFAS to determine PFAS in consumer goods. The method is optimized for fluoropolymer-based products but can also be applied to waste or solid environmental samples such as soil, sludge and sediments. It was stated that different matrices require slightly different approaches. They determined an instrumental LOD and LOQ of 1.0 µg/L and 2.0 µg/L, respectively. Challenges observed by the laboratory were the evaporation of analytes, wrong sample treatment and a need for pre-concentration of samples, otherwise PFAS sum values cannot be detected. It was assumed that CIC could be made available for commercial use, but this will require skilled and trained personal. One advantage, however, would be the fact that analytical devices such as CIC and HR-GF-MAS count as standard equipment.
Another respondent reported on a CIC method for EOF determination of water, human blood and solid samples. Depending on the matrix they are using and different sample preparation workflows different detection limits of 10–50 ng/mL can be achieved. The method is proposed as a new ISO method and as such will be undergoing interlaboratory comparison validation when the funding is available. One challenge observed is the co-extraction of inorganic anionic fluorides in the sample confounding the detection of organofluorine. It is expected that the method can be made available for commercial laboratories if instruments are available.
Relatively low limits of detection measurable for fluorine in water samples of 1–100 ng F/L after concentrating the sample by a factor of 500–800 were reported by researchers (Kärrman et al., 2019; Miyake et al., 2007; Wagner et al., 2013).
Rudolf Aro et al. (2021) investigated the presence of unidentified organofluorine compounds (UOF) and he applied fluorine mass balance analysis on different types of environmental samples (river, sewage, fish liver, etc.) to determine the fraction of UOF. It was clear that for samples above the LOD, more than 70% could not be accounted for by the 37 monitored in the study.
Simon et al. (2023) presented an analytical method encompassing PFAS target analysis, non-target screening (NTS), direct oxidizable precursor (DOPA), and extractable organically bound fluorine (EOF). Consequently, suspended particulate matter (SPM) samples from various locations in German rivers were examined over a time series spanning from 2005 to 2020 to explore temporal and spatial trends. Three PFAS mass balance approaches were employed in this investigation: (i) PFAA target vs. PFAS dTOPA, (ii) PFAS target vs. EOF, and (iii) PFAS target vs. PFAS dTOPA vs. organofluorine NTS vs. EOF. Approach (i) revealed elevated levels of precursors in the SPM samples. As a complementary strategy, both EOF and dTOPA unveiled unidentified gaps in the PFAS mass balance, providing valuable insights for PFAS risk assessment.
The emission of PFAS from the use of cosmetics was examined by Putz et al. (2022). The European Commission database of cosmetic substances and ingredients was used to identify 170 structures containing at least -CF2- or -CF3 as ingredients in cosmetics on the European market. These structures were then cross-referenced with the CosmEthics database to identify PFAS-containing products. Among these products, polytetrafluoroethylene (PTFE) and C9-15 fluoroalcohol phosphate were the most frequently listed PFAS ingredients. TF and EOF were applied to 45 cosmetic products. For TF, the cosmetic product was weighed into a ceramic boot containing glass wool. For EOF, the cosmetic product was extracted with alkaline methanol. The samples were vortexed and sonicated for 30 minutes at room temperature. The supernatant was collected and transferred to a conical tube for centrifugation. Extraction was repeated with methanol. The two extracts were combined and evaporated under a gentle nitrogen stream. An additional clean-up with graphitised carbon was performed before measurement. While the proportion of products listing PFAS ingredients is small compared to the total number of products on the market, emissions to wastewater and solid waste can be significant, but where lower than other sources (e.g. outdoor textiles). The TF LOD was in the µg - mg F/g range while the EOF LOD was in the low µg/g F range.
AOF
The method for determining adsorbable organic fluorine (AOF) differs from the extractable organic fluorine (EOF) assay in terms of how organofluorines are extracted from the surrounding matrix. In the AOF assay, the sample is passed through cartridges containing synthetic polystyrenedivinylbenzene-based activated carbon (AC), selectively capturing only species that can be adsorbed to AC. Any residual fluoride is then removed using a sodium nitrate washing solution. Subsequently, the adsorbent is subjected to analysis by combustion ion chromatography (CIC) (McDonough et al., 2019). Up to now, AOF has exclusively been applied to water samples, and to our knowledge, there has been no published study directly comparing the organofluorine content in both EOF and AOF fractions within the same samples.
For the analysis of total PFAS analysis in water, the AOF method was improved and validated in one study by Han et al. (2021). The method has limits of detection and quantification of 300 and 400 ng/L respectively, which is more sensitive than previously reported AOF methods. The improved method was as follows; water samples were centrifuged, and the supernatant was amended with 0.01M KNO3. The active carbon of Analytik Jena had the best performance with a native fluorine level of 0.37 µg/g and was selected. Each sorbent was packed with 80 mg and quartz wool was plugged at the end. The cartridge was rinsed wit ultrapure water and 30 mL of a 5 g/L nitrate solution. Afterwards the sample was loaded (300 mL) and after loading rinsed with 30 mL of 5 g/L nitrate solution. After adsorption, the 80 mg sorbent was placed in a ceramic boat and burned at 1000 °C for 10 min. AOF recovery for 29 individual PFAS ranged 53–113%, while three short-chain PFAS yielded lower recovery (19–39%) due to low adsorption efficiency. The validated method was applied to different environmental water samples, and AOF data were compared to results from other total PFAS analyses, including total fluorine, extractable organic fluorine, total oxidizable precursors, and summed individual PFAS. The fluorine contents from targeted PFAS analysis only contributed 0.4–29% of AOF concentrations in all except two samples, indicating the significance of AOF for estimating unknown PFAS concentrations, screening PFAS contamination, and assessing PFAS exposure (Han et al., 2021).
Forster et al. (2023) improved the total organic fluorine methods for more comprehensive measurement of PFAS in industrial wastewater, river water and air. The AOF that was developed can archive a LOD of 0.3 µg/L and for EOF a LOD of 0.1 µg/L. The final optimized AOF method was as follows. The samples were filtered, and the pH was adjusted to pH<1. Samples (50 or 500 mL) were passed through two AC (activated carbon) columns in series. The columns were rinsed with alkalic 0.01% NH4OH solution. The columns were rinsed with alkalic 0.01% NH4OH solution and loaded in a pre-baked (1000⁰C for 5 min) ceramic boat and combusted at 1000 °C for 10 min. The effluent gasses were collected in a 50 mL tube that contained 5 mL of 1 mM sodium carbonate and 0.01% H2O absorption solution for fluoride and measured with ion chromatography.
The LOD may still not be low enough and it should be considered that methods are needed to capture as many classes of compounds as possible. Non-target LC-MS/MS analysis can also be combined with target analysis in future work to identify unknown organic fluorine, especially in samples with high TOF, such as the industrial wastewater samples. For volatile and semi-volatile PFAS, target and non-target GC-MS(/MS) can also be used in future work to identify organofluorine compounds. Finally, while target LC-MS/MS can achieve lower LOQs for PFAS, the results demonstrate how TOF methods provide a more comprehensive measurement of the total PFAS present, capturing known and unknown organofluorine.
2.1.2 High resolution-continuum source-graphite furnace molecular absorption spectrometry (HR-CS-GF-MAS)
High-resolution-continuum source-graphite furnace molecular absorption spectrometry (HR-CS-GF-MAS) is an advanced analytical technique designed for the highly sensitive and selective determination of certain molecular species in samples. This method combines a high-resolution continuum source (HR-CS) spectrometer, a graphite furnace (GF) atomizer, and molecular absorption spectrometry (MAS) principles.
In HR-CS-GF-MAS, a high-intensity xenon lamp or similar source emits a broad spectrum of continuous light, enabling the simultaneous measurement of absorption lines from various molecular species. The sample is introduced into a graphite furnace, where it undergoes vaporization and atomization. Unlike atomic absorption, which focuses on individual atoms, this technique is specifically suited for diatomic or polyatomic molecules, such as oxides, hydrides, and carbides.
HR-CS-GF-MAS is particularly valuable for analysing trace levels of hydride-forming elements like arsenic and selenium in diverse sample matrices, including environmental, biological, and industrial samples. Its exceptional sensitivity and selectivity make it a crucial tool in analytical chemistry, environmental monitoring, and scientific research where the precise determination of molecular species is essential.
Established methods for commercial use
To the best of our knowledge, this method is not currently being used commercially for the determination of PFAS.
Ongoing activities by research institutes
The study by Gehrenkemper et al. (2021) compared combustion ion chromatography (CIC) and high resolution-continuum source-graphite furnace molecular absorption spectrometry (HR-CS-GFMAS) for analysing organically bound fluorine in River Spree samples. A mass balance and sum parameter analysis were applied, which is schematically described in Figure 3. TF concentrations determined via HR-CS-GFMAS and CIC were comparable between 148 and 270 μg/L. However, HR-CS-GFMAS outperformed CIC in terms of speed, sensitivity, and precision, especially in the low microgram per litre range. On average, AOF concentrations were higher than EOF concentrations, with AOF making up 0.14–0.81% of TF (determined using CIC) and EOF 0.04–0.28% of TF (determined using HR-CSGFMAS). The direct analysis capability of HR-CS-GFMAS without dilution issues, and its sensitivity in the lower concentration range, make it preferable for risk evaluation in determining extractable organically bound fluorine since in environmental samples usually only < 1% of TF depends on EOF or AOF. Overall, the study recommends HR-CS-GFMAS over CIC for accurate organically bound fluorine analysis in environmental samples.
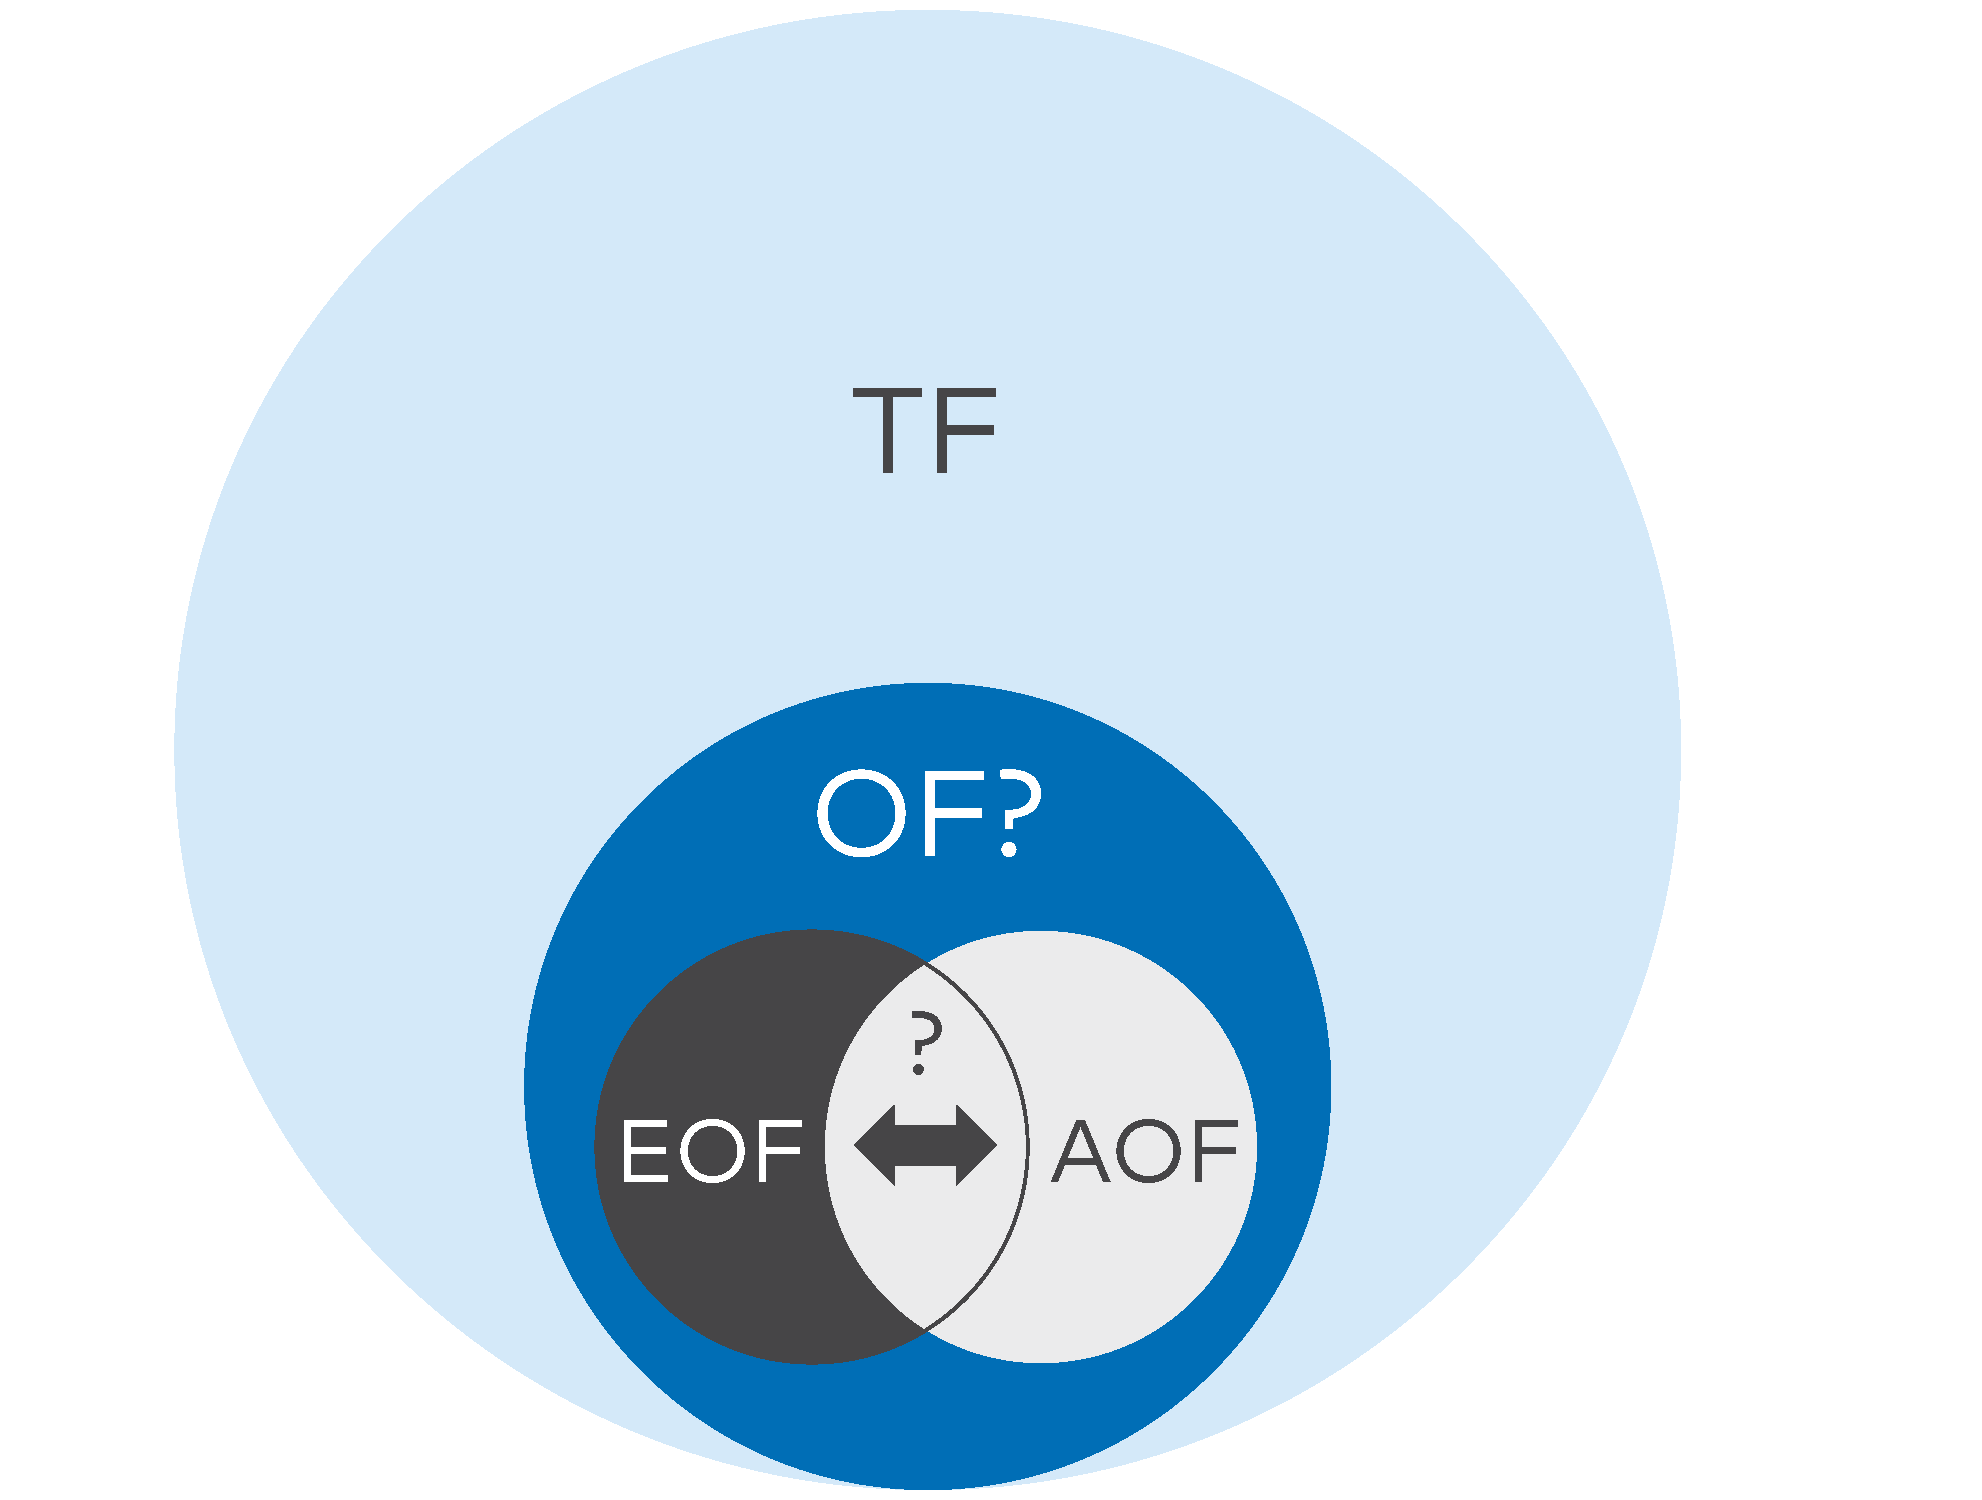
Figure 3: Scheme of a fluorine mass balance approach applying organically bound fluorine sum parameter. Reprinted with permission from Gehrenkemper et al. (2021).
In their study, Nxumalo et al. (2023), utilized HR-CS-GFMAS to assess extractable organically bound fluorine (EOF) in surface water. The method was then compared with the quantified levels of PFAS identified through targeted analysis. The analysis revealed that predominantly short-chained PFCA and PFSA are present in the water, constituting less than 10% of the total EOF. Interestingly, the rise in EOF concentration in the Teltow Canal showed a strong correlation with the increase in PFHxA. This suggests that while PFHxA is a characteristic component of the discharged EOF, it may not be solely responsible for the observed increase.
Simon et al. (2022) devised an efficient and rapid extraction technique for determining PFAS in soils using HR–CS–GFMAS. The calibration reference standard in this method was PFOA, and there is a need for further optimization of various calibrators in HR–CS–GFMAS to align with the EOF composition of the sample and enhance the reduction of LOQs. The method involved using acidified methanol as the extraction solvent, with the extraction process repeated four times. A comparison between the optimized method with and without an additional solid-phase extraction (SPE) clean-up step revealed a significant underestimation of EOF concentrations when using SPE. The LOQ achieved by the developed method was 10.30 μg/kg, proving sufficient for the analysis of all tested samples. This optimized extraction method holds promise as a valuable contribution to potential regulatory decisions.
In a study by Kowalewska et al. (2021), HR-CS-MS was employed for fluorine determination in petroleum, a method not previously applied to the analysis of petroleum or its products. Gallium fluoride was selected as the target molecule due to its low-temperature atomization and known sensitivity in fluorine determination. The research addressed and successfully overcame challenges related to the dissolution of organic substances, flame variability dependent on the sample, compensation for OH molecule absorption, and high noise levels in oxygen-deficient flame conditions. The sensitivity of the method was found to be highest for fluorinated alcohols, lower for fluorohydrocarbons, and lowest for fluorinated carbocyclic acids, possibly influenced by hydrogen bonding effects. Calibration was performed using HFB (2,3,3,3,4,4,4-heptafluoro-1-butanol) as a reference standard. The method demonstrated a recovery of 110–122% relative to a routine standard method, with an analysis RSD below 20%. For HFB, the method achieved a characteristic concentration of 3.2 mg/L and a detection limit of 0.93 mg/L in a sample at the usual 1:4 v:v dilution. The study concludes that this proposed method is a valuable and efficient tool for the quick and straightforward identification of organic fluorine contamination in gasoline or its components (Kowalewska et al., 2021).
A toxicity characteristic leaching procedure (TCLP) was performed as a standard extraction procedure in acetic acid medium for toxicity assessment. In this study CaF was used to determine the leached fluorine (F) of residues from the oil and gas industry. As a calibration, F was used against aqueous standards. Low limits of detection (0.01 mg/L) and good precision (RSD <=5%) were achieved for determination of the extracted F concentration leachate extracts. The stability of the extracted F concentration was evaluated after 21 days and the analyte remained stable (T. T. Moro et al., 2021).
Gawor et al. (2021) introduced an enhanced methodology for determining fluorine in biological samples using HR-CS-GFMAS. The challenging matrix of biological tissues, characterized by matrix interferences, makes HR-CS-GFMAS the optimal choice, particularly with carefully selected modifiers. The study optimized experimental conditions, including time/temperature programs and the addition of gallium and modifier mixtures in a combined mode, to achieve sensitive and precise fluorine determination. Stabilization of fluoride in the sample was achieved under these optimized conditions. Efficient removal of matrix components was facilitated by optimizing various parameters and utilizing a complex matrix mixture. Calibration against aqueous reference standard solutions was possible, with solid modifiers such as palladium and zirconium deposited onto the graphite surface. Direct addition of sodium acetate and ruthenium modifiers to the sample further improved the method. The LOD and characteristic mass of the method were found to be 0.43 µg/L and 8.7 pg, respectively.
2.1.3 Particle induced gamma-ray Emission (PIGE)
Particle-induced gamma ray emission (PIGE) spectroscopy is a surface analysis and non-destructive technique for quantification of elemental fluorine. PIGE is used for the determination of total fluorine (organic and inorganic). PIGE is a surface technique and requires the sample to be in a specific form (thin layer). It uses an accelerated proton ion beam to excite atoms within the sample, resulting in the emission of distinct gamma rays, which can be attributed to fluorine. The focused, accelerated proton beam is used to bombard the surfaces of solid samples, causing any fluorine nuclei present to emit unique γ-rays which can be used for isotopic identification and quantification, in this case for total fluorine-19 measurement. Gamma rays emitted upon de-excitation provide a unique signature proportional to the number of fluorine atoms on the surface. These summed γ-rays can then be converted to total F concentrations, as expressed in ppm F, by generating calibration curves using inorganic F standards, for which we can relate concentration of F to the PIGE counts. The intensity is directly proportional to the amount of fluorine in the sample. With a probing depth of 250 μm into the surface material, it is commonly used for solid samples. However other samples are possible as well with further preparation, such as the compacting of powder into pellets, or liquid samples, which need a sorbent to be analysed (Koch, 2020).
The biggest advantages of this method are its non-destructiveness and avoids matrix effects. Further, if only solid samples are measured, the need for sample preparation can be omitted and thus a high sample throughput of over 20 samples per hour can be achieved. One challenge this method presents though is the non-discrimination between inorganic or total organic fluorine. As such inorganic fluorine needs to be removed for the analysis of complex matrices such as soil, sediment, or biota. PIGE is used to determine the total fluorine content of a sample.
PIGE can be very useful for regulatory monitoring because it could screen large numbers of materials for total fluorine (inorganic and organic) in a limited amount of time. The PIGE analysis is a quick method when it can directly be applied to the materials of interest (e.g., food contact materials and cosmetics). The detection limits might not be low enough for trace analysis. To overcome this problem, sample preparation is mandatory, and it needs to be in a specific form (e.g., thin layer of activated carbon felt).
Established methods for commercial use
To the best of our knowledge, this method is not currently being used commercially for the determination of PFAS.
Ongoing activities by research institutes
During the survey two respondents reported ongoing research activities of PFAS analysis methods based on PIGE.
One agency representative reported that the PIGE method achieve quantification limits of approximately 50 ppm for the total fluorine determination of a broad range of consumer products and environmental media. However, the respondent stated that the method cannot be made easily available to commercial laboratories. Even though only low skilled staff to perform the method would be needed, currently PIGE instruments in laboratories are rare and the number of instruments would have to be increased.
One research laboratory reported on a PIGE method which was already validated by a single laboratory validation method. The method was developed pursuing mostly drinking water for commercialization, the analysis of soils and consumer products were of second priority. According to the respondent solid matrices or semi-solid matrices are standard and they can achieve LOQs of a few ppm. For aqueous samples they have a volume dependent limit of detection (currently they achieve a total absorbable organic fluorine limit of detection of 20 ppt for 3.78 L of water but are aiming to 4 ppt with 20 L of filtered water). No spectral interferences were observed but the solid phase extraction step used as sample preparation for aqueous samples can have binding competition effects from high organic content samples, unless additional sample preparation is done which is still a challenge for this method. They are funded to build a benchtop prototype device (testing planned in 2024 and commercial availability planned in 2025). A challenge limiting commercial use was reported to be the high capital cost, but the large sample throughput should compensate this. Further they have a spin-off company with this technology which will be available for testing in 2024.
Because PIGE irradiated photons are limited to reaching depths into solids, varying sample thickness can lead to varying fluorine signal response. To account for varying thickness in fast food packaging samples, quantification of total fluorine was performed using sample thickness to perform thickness-dependent quantification (Schwartz-Narbonne et al., 2023). In their study Schwartz-Narbonne et al. (2023) used PIGE for the screening of fast-food packaging samples for total fluorine (F) content. 55% of the samples contained no detectable F, defined here as <3580 μg F/m2. 19% of the samples contained trace levels of F ranging from 3580 to 10800 μg F/m2, and 26% of the samples had >10800 μg F/m2. PIGE analysis highlighted the relationship between material type and the amount of F. Typical limit of detections were for food packaging bowls (thickness > 620 µm): LOD = 20600 µg F/m2, LOQ=62500 µg F/m2; for paper bags and paper wrapper (thickness ≤ 180): LOD = 3580 µg F/m2, LOQ=10800 µg F/m2.
The study by Whitehead et al. (2021) employed PIGE to screen various cosmetics for total fluorine. Elevated levels of total fluorine (≥0.384 F/cm2) were identified in foundations, mascaras, and lip products. The samples were placed on a fluorine-free filter paper or standard fluorine-free copier paper and secured with a stainless-steel target frame. The LOD was determined as 0.127 μg F/cm2, and the LOQ was 0.384 μg F/cm2 using prepared external inorganic fluoride standards. Notably, cosmetic products advertising features like "wear-resistant" to water and oils or "long-lasting" exhibited high fluorine levels, aligning with the functionality associated with many PFAS in cosmetics according to industrial literature. The findings imply a potential connection between the high fluorine concentrations in cosmetics and the use of fluorinated ingredients in their manufacturing.
In an investigation conducted by Wu et al. (2021), a combination of analytical instruments, including MS, PIGE, and XPS, was employed to evaluate the fluorine content in fabrics and foam derived from widely used children's car seats recently introduced to the US market. PIGE was utilized to measure overall fluorine content, covering both organic and inorganic forms, while XPS allowed for the differentiation between organic and inorganic fluorine based on binding energy. The study utilized PIGE to quantify the total fluorine content and harnessed XPS to characterize the nature of fluorine present in the examined samples (for more details see section 2.1.5).
As PIGE requires solid samples for analysis, to analyse water samples, a solid-phase extraction method for collecting the PFAS from drinking water is necessary. PIGE has been applied by Tighe et al. (2021) to a rapid screening of drinking water for the presence of PFAS. The method used makes use of filtering the drinking water over an activated carbon felt by use of gravity forces. Afterward, the felt's surface is examined using particle-induced gamma-ray emission (PIGE) spectroscopy. PIGE cannot make a difference between individual PFAS and a mixture of PFAS. The calibration was done with a mixture of PFAS. Using this technique, the total fluorine measurements by PIGE produced linear calibration curves adequate to measure below 50 ppt or 50 ng/L (LOD) total fluorine from PFAS in drinking water for as little as 2 L of sample. Inorganic fluoride and PFAS were successfully differentiated by acidifying the sample prior to filtration. Because of the low cost of the sample solid phase extraction and the limited amount of time needed makes this technique very relevant for regulatory monitoring of all PFAS analytes simultaneously.
2.1.4 Laser-induced breakdown spectroscopy (LIBS)
Laser-Induced Breakdown Spectroscopy (LIBS) is a powerful analytical technique that uses a high-energy laser pulse to create a plasma or spark on a sample's surface. This plasma contains excited atoms and ions from the sample and as these species return to their ground states, they emit characteristic, and element unique, light, which is analysed to determine the elemental composition of the sample. The intensity of the spectral lines is hereby proportional to the concentration of the corresponding elements in the sample. LIBS is known for its speed and versatility, as it provides rapid, real-time results and can analyse a wide range of elements, from hydrogen to heavy metals. It has the advantage of a spatially resolved analysis and it is employed in various fields, including environmental science, geology, materials analysis, and quality control. LIBS requires minimal sample preparation, making it non-destructive in many cases, and offers the advantage of on-site or in-situ analysis. While it has some limitations, such as the need for high-energy lasers, matrix effects in complex samples, and challenges in trace element quantification, LIBS remains a valuable tool for quick elemental analysis, particularly when other methods are impractical or time-consuming.
Established methods for commercial use
To the best of our knowledge, this method is not currently being used commercially for the determination of PFAS.
Ongoing activities by research institutes
A quantitative mapping of fluorine in fluoropolymer (PTFE) pure samples was obtained using LIBS and was based on the molecular emission band of molecule-forming partners (CuF or CaF) arising from fluorine containing molecules (Weiss et al., 2022). The elements Cu or Ca are deposited in the sample surface prior to analysis either via spray coating or sputter coating. Spray coating is an established method for applying matrices for matrix assisted laser desorption ionization mass spectrometry (MALDI-MS) measurements, while sputter coating is a widespread method for the deposition of thin films in material sciences. Both methods allowed quantitative determination of fluorine in ppm (µg/g) range and showed to be sensitive enough to detect fluorine at single shot level. Whereas sputter-coating of copper yielded a better sensitivity, spray coating of calcium provided a higher spatial resolution, and one must decide the best criteria for a particular application.
2.1.5 X-ray photoelectron spectroscopy (XPS)
X-ray Photoelectron Spectroscopy (XPS) is a powerful surface analysis technique used to determine the elemental composition, chemical state, and electronic structure of materials. XPS is a non-destructive and highly quantitative method. In XPS, a sample is bombarded with X-rays of a specific energy (usually x-rays generated from a monochromatic X-ray source), causing the emission of photoelectrons from its surface. The photoelectrons emitted from the innermost atomic orbitals (core electrons) are unique for each element, are collected, and analysed based on their kinetic energy and binding energy. XPS provides valuable insights into a material's surface chemistry by measuring the binding energies of photoelectrons, which are characteristic of specific elements and their chemical states. It can identify elements from hydrogen to uranium and distinguish between different chemical forms of the same element. It can be used to distinguish between organic and inorganic fluorine.
Established methods for commercial use
To the best of our knowledge, this method is not currently being used commercially for the determination of PFAS.
Ongoing activities by research institutes
A study by Wu et al. (2021) utilized complementary analytical instruments (MS, PIGE, and XPS) to assess fluorine content in fabrics and foam from popular children's car seats recently marketed in the US. Fabric and foam samples from children's car seats underwent testing for total fluorine content using XPS. The samples were cut into small pieces and directly used for PIGE and XPS analyses, both of which are surface-sensitive spectroscopic techniques. PIGE measured total fluorine, encompassing both organic and inorganic forms, while XPS could differentiate between organic and inorganic fluorine based on binding energy. PIGE was employed to measure total fluorine content, and XPS was utilized to discern the nature of fluorine present in the samples. However, due to XPS's relatively high detection limit, reliable differentiation between organic and inorganic fluorine was only feasible for samples with fluorine content exceeding 500–1000 mg/g. The XPS analysis utilized a PHI Versa Probe II Scanning X-ray Microprobe system with a focused monochromatic Al Ka source. High-resolution spectra were recorded for C 1s (278e296 eV) and F 1s (676e694 eV). For composite samples, PIGE and XPS analyses were conducted on the fabric side. The XPS analysis confirmed the presence of organic fluorine and CF2 moieties, monitoring peaks at 688.4e689.0 and 292 eV, respectively. However, only a small signal for inorganic fluorine (682.7e687.0 eV) was observed. The study concluded that it was unlikely that a significant amount of inorganic fluorine was added to textiles during production, as indicated by XPS's detection limit (0.05–0.1% by weight).
2.1.6 WD-X-ray Fluorescence (WDXRF)
WDXRF is an analytical technique primarily used for elemental analysis. The principle of XRF revolves around the interaction of x-rays with the atoms in a sample. XRF mapping allows for a unique element-specific visualization at the sample surface and enables localization of fluorine containing compounds to a depth of 1 mm. It can be used to determine the total Fluorine content of a sample.
Established methods for commercial use
To the best of our knowledge, this method is not currently being used commercially for the determination of PFAS.
Ongoing activities by research institutes
Roesch et al. (2023) introduced a novel approach by combining m-X-ray fluorescence (m-XRF) mapping with fluorine K-edge m-X-ray absorption near-edge structure (m-XANES) spectroscopy for the visualization of PFAS contamination and inorganic fluoride in samples with concentrations down to 100 mg/kg fluoride. Various samples, including PFAS-contaminated soil and sludge, as well as selected consumer products like textiles, food contact paper, and permanent baking sheets, were examined. This innovative technique provides a unique and element-specific visualization at the sample surface, facilitating the localization of compounds containing fluorine. Identified fluorine-rich spots were then further analysed using fluorine K-edge m-XANES spectroscopy. Although the technique is still in the development phase, it holds the potential to become an important tool for future assessments of PFAS in surface coatings of consumer products or contaminated environmental samples.
2.1.7 Instrumental Neutron Activation Analysis (INAA)
Instrumental Neutron Activation Analysis (INAA) is a non-destructive technique capable of conducting multi-element analyses for both major and trace elements. It provides the flexibility to perform both qualitative and quantitative identifications across various sample matrices. In the INAA process, a sample undergoes irradiation with neutrons, causing its nuclei to become radioactive isotopes through neutron activation. The subsequent radioactive emission and decay are element-specific, enabling the determination of individual elements. INAA possesses the advantages of being a non-selective, high-throughput method suitable for analysing bulk samples as well as liquid and solid matrices (Koch, 2020). This analytical approach is particularly employed to ascertain the total fluorine content in a given sample.
Established methods for commercial use
To the best of our knowledge, this method is not currently being used commercially for the determination of PFAS.
Ongoing activities by research institutes
The method was first applied in Schultes et al. (2019) for quantitative determination of EOF of consumer products. However, interferences from e.g. aluminium were found for the tested certified reference material, making INAA unsuitable for that matrix. In this study the F detection limit was 20 µg/g (= 20 ppm) for a sample with the mass of 0.01 g. Accurate quantitative analysis with INAA require calibration with certified reference materials of known elemental composition though.
INAA presents a greater linear range than PIGE, for instance, and are needed to quantify very high levels of total fluorine. The total fluorine quantification in firefighter turnout gear samples was done based on the response of CaF2 standards, and in the absence of high background counts, an F concentration of 13 ± 5 ppm was detected in a 1.4 g sample. Detection limits for fluorine by INAA are strongly dependent on sample matrix and are adversely affected by the presence of other short half-life isotopes, notably 28Al, 38Cl, and/or 80Br (Muensterman et al., 2022).
2.1.8 Summary of key information
Combustion Ion Chromatography:
- Combustion ion chromatography is a powerful technique for the analysis of total fluorine (TF), EOF and AOF
- Sample preparation is needed for the determination of AOF or EOF.
- For EOF a sample pre-treatment is necessary to remove the inorganic (IF) fluorine component. Without pre-treatment the IF can interfere with EOFs.
- Depending on how the sample preparation is done TF (none), EOF or AOF can be measured.
- Disadvantage of the technique is that higher levels are reported - µg/L as LOD, some publications already show lower LOD (ng/L range). Currently, the LOD is not low enough for the measurements of drinking water.
- However, the technique can be very powerful to have a first idea of the total PFAS present in a sample.
- CIC can be optimized for faster analysis, making them suitable for high-throughput screening, which is essential for large-scale environmental monitoring.
- Still, there are some things to consider, like the target analysis, no internal standards can be used for compensation of loses during the sample preparation and matrix suppression. It is not known if the short chains can be retained or not during the sample preparation. This would lead to underestimation of the value.
- The separation of PFAS compounds is based on their ionic properties using ion chromatography, this makes it highly selective because of the effective separation from matrix interferences.
High resolution – continuum source-graphite furnace molecular absorption spectrometry (HR-CS-GF-MAS):
- HR-CS-GF-MAS is a technique used for elemental analysis, it measures the absorption of molecular bands or atomic lines in a graphite furnace. Modifiers are used (Gallium) to makes it high selective.
- Few commercial labs have this technique in house, it is still more ‘in-development’ at universities and institutes where research is done.
- It measures the total fluorine content or when directly applied to the sample or it can measure AOF/EOF depending on the sample preparation that is needed.
- It is a powerful technique because lower LOD can be obtained than CIC.
Particle induced gamma-ray Emission (PIGE):
- Non-destructive technique for determination of total fluorine content.
- It is a rare technique, and it did not find its way into the commercial labs.
- The advantage is that it is surface technique and because of that there is an absence of matrix effects.
- PIGE can provide rapid results, which can be beneficial in various research and industrial applications.
- Because solid samples can be directly applied there is no need for an extensive sample preparation, the limit of detection for the direct analysis is in the range of mg/g.
- If a lower limit of detection is needed, a sample preparation can be applied. For drinking water samples, the LOD that can be achieved is in the range of 20 – 50 ppt or ng/L.
Laser-induced breakdown spectroscopy (LIBS):
- LIBS is known for its speed and versatility, as it provides rapid, real-time results and can analyse a wide range of elements.
- LIBS requires minimal sample preparation, making it non-destructive in many cases,
- It has the advantage of on-site or in-situ analysis.
- It has some limitations, such as the need for high-energy lasers, matrix effects in complex samples, and challenges in trace element quantification.
- LIBS remains a valuable tool for quick elemental analysis, particularly when other methods are impractical or time-consuming.
X-ray photoelectron spectroscopy (XPS):
- X-ray photoelectron spectroscopy is a surface analysis (non – destructive) technique.
- It is a technique that is used for elemental analysis.
- XPS can make a difference between inorganic and organic fluorine.
- It is not a common technique that is used in commercial labs.
- XPS is not sensitive, high limit of detections is reported in the range of 500 – 1000 mg/g.
Wavelength dispersive - X-ray Fluorescence (WDXRF):
- WDXRF is a technique that is used for elemental analysis (non-destructive).
- It measures the total fluorine content.
- It is a technique that is not established in the commercial routine labs and it is a highly expensive equipment.
- Dedicated configuration of the instrument is needed for fluorine measurements.
- The technique is not sensitive, and the limit of detection is in the high range of ppm.
Instrumental Neutron Activation Analysis (INAA):
- INAA has advantages of being a non-selective high throughput method and can measure bulk samples as well as liquid and solid matrices.
- It is a non-destructive multi-element analysis.
- INAA presents a greater linear range than PIGE, for instance, and are needed to quantify very high levels of total fluorine.
- Limit of detection is in the ppm range.
- It is not a common technique that is used in commercial labs.
Use for enforcement/compliance testing:
To support regulatory work that considers PFAS as a group, analytical methods are needed that are able to measure total fluorine. Often these techniques are non-destructive and can give a quick idea of what the content of fluorine is in a sample. Not all techniques can make a distinguish between inorganic and organic fluorine and an overestimation is possible. The limit of detection is often in the mg/L range and the instruments didn’t find its way to the commercial labs.
Alternative CIC and HR-CS-GF-MAS can be used but these are destructive methods where often sample preparation is needed. Total fluorine can be measured, but for EOF and AOF the inorganic fluorine should be removed.
AOF analysis provides measure of the concentration of all fluorinated substances in the sample and thus includes targeted and non-targeted PFAS as well as other organic chemicals containing fluorine. Ultrashort-chain PFAS, however, remain a blind spot even for these “PFAS total” parameters.
Cost implications:
CIC, HR-CS-GF-MAS, PIGE, XPS, XRF, INAA and LIBS are emerging analytical tools for total fluorine measurements. Among them, INAA, PIGE, XPS, XRF and LIBS are non-destructive methods, while CIC and HR-CS-GF-MAS have the lowest detection limits.
The cost of the non-destructive methods (INAA, PIGE, XPS, XRF and LIBS) is rather low and low skilled staff are needed to perform the method. Currently the instruments in laboratories are rare and the number of instruments would have to be increased.
CIC is already well present in the analytical laboratories, HR-CS-GF-MAS is a rarer instrument and did not find its way to the analytical commercial laboratories (research and institutes).
2.2 Non-targeted methods & suspect screening using High Resolution Mass Spectrometry (HRMS)
Several analytical strategies are employed for non-targeted PFAS screening, with high-resolution mass spectrometry (HRMS)-based methods being the most used. Non-targeted screening involves utilizing accurate m/z values and secondary mass spectra obtained through the full scan data acquisition mode and the fragmentation mode of HRMS along with a range of screening and filtering tools, to identify unknown PFAS compounds. Emerging HRMS techniques, such as FT-ICR-MS and IM-MS, as well as complementary methods, such as ICP-MS, are also employed and discussed in the following sections. It is important to note that although HRMS approaches discussed hereafter have been mainly developed in the context of environmental sample analysis (water, soil, bio-based), each method can be adapted to most matrices, including consumer products. Depending on the products or matrices analysed, appropriate sample preparation steps need to be considered before HRMS analysis.
2.2.1 Overview of high-resolution mass spectrometry (HRMS) approaches
High-resolution mass spectrometry (HRMS)-based non-target screening methods for PFAS involve several approaches, including homologue screening, feature filtering, in-source feature fragmentation flagging, and case-control methods. The typical non-targeted analysis process can be summarized in five steps (Y. Shen et al., 2023):
- Full-Scan Data Acquisition: This step involves generating highly resolved full-scan chromatograms and/or spectra to reveal all detectable ions in the sample.
- Selection of Expected PFAS Features: Expected PFAS features are selected from the full-scan data based on different filtering approaches.
- Assignment of Plausible Molecular Formulae: Plausible molecular formulae are assigned to the selected features.
- Fragmentation Experiments: These tandem MS experiments are performed to confirm molecular formulae and to reveal structural information of PFAS architecture based on fragmentation patterns.
- Structural Proposal or Analyte Confirmation: Based on the obtained data, structural proposals for PFAS compounds are made, or the presence of specific analytes is confirmed.
Various screening methods using HRMS have led to the detection and proposal of structures for approximately 980 PFAS compounds in different environmental matrices over the last decade. One widely used method is CF2 homologue screening, which is applicable in various matrices, including water, biological, and soil. To manage the complexity of environmental samples numerous extracted peaks or features, computer-assisted tools like R and MATLAB are employed. These tools use filtering parameters such as mass error, retention time sequences, isotope peaks, dimer ions, and additive ions to reduce false-positive identifications of PFAS homologues. In-source feature fragmentation flagging screening methods have been proposed to address the limitations of homologue screening and feature filtering. These methods, often used in combination with complementary screening techniques, help identify suspected PFAS compounds and increase the number of unknown PFAS identified. The case-control method is another strategy used, particularly in samples with a history of exposure to PFAS. It involves comparing samples with and without PFAS exposure and applying statistical methods to identify potential PFAS features that are differentially present in the experimental and control groups. Established non-targeted workflows in HRMS often require the application of a range of sample preparation techniques, the use of various ionization modes operating under different instrumental conditions to achieve the desired results, i.e., a comprehensive covering of a sample PFAS content. The complexity of the analysis and of the data processing therefor often involve scientists with specific HRMS knowledges. A summary of the different analysis steps performed during non-targeted and suspect screening workflows is presented in Figure 4 and are exemplified in the following sections. The features identified and assigned with a high level of confidence according to these workflows (panel 1) are then used in targeted methods (panel 2) discussed in section 2.3. The identified and quantified PFAS compounds can further be used for risk evaluation and prioritization (Hu et al., 2023).

Figure 4: (A) Workflow for target, suspect and nontarget screening of PFAS and risk-based prioritization and (B) proposed structures of PFAS identified by the suspect and nontarget screening. PFAS (1), (3), (4), (5), (7), (8), (10), (11), (12) were confirmed using authentic standards (level 1). Based on study of Hu et al. (2023).
Established methods for commercial use
There is no validated standard method available for non-targeted screening by HRMS. We have no information if commercial laboratories offer this kind of PFAS analysis method and no stakeholders partaking in the questionnaire provided information on this method for commercial use.
Recently, in the NORMAN network, a NORMAN guidance on suspect and non-target screening in environmental monitoring was published. This marks the first initiative providing instructions on conducting non-targeted screening studies of high quality, including data interpretation. The guidance presents information for every analysis step (LC and GC) and discusses a variety of ionisation techniques. It details suitable analytical methods, data processing techniques, and databases gathered in which are part of the NTS workflow for environmental monitoring. Quality assurance, quantification without reference standards, and reporting results with unequivocal identification assignment are all included in the guidance. This NORMAN guideline can serve as a vital resource for non-target screening of PFAS in various matrices and will prove beneficial in implementing and standardizing methods for commercial application.
Ongoing activities by research institutes
In the stakeholder consultation three respondents reported the development of non-target screening methods.
One research laboratory reported a method to determine PFAS in sediment, biota, and water by UHPLC-ESI(neg)-Q-TOF-MSMS with either suspect or non-targeted screening methods (LOQ = 0.3-15 ppb). Currently they are using a simple sample preparation relying on sample extraction, but an on-line SPE directly coupled to HRMS instrument is under development. Their workflow uses Kendricks mass defect, predicted RT, and response factors to identify PFAS-related features. The method covers anionic PFAS and anionic PFAS adducts, including FTOHs, but can be adapted to cationic substances if needed. The method has been validated in-house for sediments and data treatment was performed by TargetLynx (Waters Corporation, UK). One challenge highlighted was that although ~150 Wellington reference standards are available for PFAS, there is a lack of PFOS derivatives reference standards and many more. This is problematic since it complicates proper identification that is based on RT and mass spectra comparison. The data treatment is often manual and therefore very time consuming. The respondent suggested the creation of a common library, which would ideally contain the mass spectra and relative retention times indices of validated PFAS compounds, and that could be used for a first screening of the data. This would be particularly useful in the absence of reference standards. It is expected that the high price and high-level skill will limit the commercial use of this method.
Another respondent reported the use of liquid chromatography (LC) coupled with a quadrupole time-of-flight (Q-ToF) mass spectrometer for the development of a non-target analysis method of PFAS-containing samples. Sample preparation methods, like targeted methods (see section 2.3), include the use of SPE for water samples, of solid/liquid extraction for soil samples, and of liquid/liquid extraction for serum samples. During the survey, the research laboratory stated that the authorisation and standardization of the method are still ongoing. No information regarding the limits of detection or quantification were given. The respondent commented that challenges arise during the data treatment step, especially during peak identification and during the evaluation of the results. The method was described as not being easily transferable to commercial laboratory standards due to the high instrument costs, the time needed for analysing the results, as well as the need for a high skill level staff and a laboratory equipment of high quality.
One research laboratory reported the planned development of a GC-MS based analysis method for non-targeted screening of PFAS. The method will be more elaborated than the ones used on lower resolution MS instrument and will feature a Q-ToF mass spectrometer. The stakeholder is aiming for soil and air measurements of non-ionic compounds. However, as the method development is currently still in planning, no information on matrices or validation status can be given at this point.
One of the biggest challenges for developing this method is the availability of reference standards. After development, the method should be transferred to a commercial laboratory within the ARAGORN (Achieving Remediation And Governing Restoration of contaminated soils Now) project. The ARAGORN project aims to gather and evaluate different soil decontamination strategies and remediation methods. It seeks to develop and implement nature-based solutions while enhancing knowledge on biodiversity. Furthermore, it promises to deliver a structured decision-making framework that outlines the optimal approach towards resilient restoration across various European nations. The project anticipates the need for specialized knowledge, appropriate equipment, and clients prepared to cover the cost of these services.
2.2.2 Suspect screening
Liquid Chromatography (LC) coupled with HRMS
Liquid chromatography (LC) coupled with high resolution mass spectrometry is a powerful platform for suspect screening and targeted analysis of PFAS-containing samples, water-based or soil-based. Koronaiou et al. (2022) used LC-HRMS to screen for PFAS in water samples, i.e., drinking water, surface water, wastewater, and leachates. Samples were first extracted using a weak anion exchange solid phase extraction method. The extracts were then separated on a C18 analytical column, ionized in negative electrospray ionization mode, and measured in mass spectrometry and tandem mass spectrometry using an orbitrap mass spectrometer. The main objective of the work is to develop, optimize, validate, and test the applicability of an integrated analytical workflow for the analysis of 27 PFAS in water samples. Parameters associated with liquid chromatography separation, gas-phase fragmentation, and MS detection were extensively tested. Method validation, quality insurance and quality control procedures, as well as identification, confirmation of analytes, and quantification, were performed according to the recommendations included in DG SANTE 12682/2019, ISO/IEC 17025:2017, and ISO 21675:2019. The method shows recovery and precision of 70–108% and <20%, respectively. The method also shows high linearity with limit of detection and quantification reaching the pg/L range. Isotopically labelled internal reference standards were used for quantification.
Although there are a very limited number of studies on LC-HRMS method developments applied to solid samples, suspect screening LC-HRMS workflows have be efficiently applied to waste-active sludge (WAS) and lime-stabilized primary solids (PS) (Dickman & Aga, 2022), as well as to contaminated agricultural soils and impregnated papers (Bugsel et al., 2022). Dickman & Aga (2022) used a parallel quantitative targeted analysis and qualitative suspect screening to monitor PFAS in both WAS and PS biosolid samples. Analogous to LC-HRMS workflows on liquid samples, the first step of their procedure consists in optimizing a sample clean-up method. Ultrasonication, followed by solid phase extraction were used to enrich the PFAS compounds. LC-HRMS data were acquired on an orbitrap high resolution mass spectrometer in negative electrospray ionization mode and analysed using Fluoromatch FlowTM (Innovative Omics). The software allows to extract chromatographic peaks from full MS scan data and to perform blank subtraction before comparing the exact measured masses to theoretical masses from the suspect list. The database is built from the EPA Master List of PFAS compounds and a compilation of known standards and literature results. A tolerance of ± 5 ppm was allowed during the comparison. Kendrick mass defect and homologue series are also used to filter the dataset. The identification of the compounds is confirmed based on the fragmentation spectra (data dependent tandem mass spectrometry). Identification and annotation of the fragmentation spectra are based on a set of common PFAS fragmentation rules and includes neutral losses. Each annotation and identity are manually checked before attributing a SMILE structure to the detected feature. Finally, labelled reference standards were used to confirm the detection and attribute a confidence level to the identification according to the Schymanski confidence scale (Schymanski et al., 2014). It is interesting to note that a curated inclusion list (i.e., no adducts, no long polymers) built from the EPA Master List was used for tandem MS measurements. The method shows good linearity from 1 to 250 ng/g. The method recovery ranges between 14%–165%, depending on PFAS compounds. Reproducibility was between 22–98% for PS, and 52–95% for WAS. 26 targeted PFAS were quantified with concentrations from 0.6–84.6 ng/g in WAS, and from 1.6–33.8 ng/g in PS. The suspect screening revealed 7 additional PFAS including 5 PFAS compounds that have never been reported in soil samples previously. An analogous approach was adopted by Bugsel et al. (2022) to analyse contaminated agricultural soils and impregnated papers, as well as groundwater, drinking water, and plants of the contaminated area. The authors set up a LC-HRMS suspect screening workflow for data acquired on a hybrid quadrupole time-of-flight high resolution mass spectrometer in negative electrospray ionization mode. No quantification was performed but the authors investigated the distribution of carbon chain lengths in these different media and highlighted the activity of biotic and abiotic degradation processes.
Focusing online SPE and LC-HRMS
To reduce interferences, cross-contamination, and sample losses during sample handling, and to favour high throughput analysis, Getzinger & Ferguson (2021) developed a peak-focusing online solid phase extraction (SPE) and HRMS suspect screening method applicable to environmental water analysis. The SPE column is directly online of a trapping C18 column and an analytical C18 column. The HRMS analysis is performed in negative ionization mode on an orbitrap instrument. Both accurate mass spectra and data dependent tandem mass spectra were acquired. The method was evaluated using 45 model PFAS from different classes. The SPE enrichment step has been automated and the trapping efficiency tested by comparing peaks areas of equal mass injection in both direct injection mode and the proposed online SPE method. A median trapping efficiency of 99.6% was obtained. It is highlighted that, in the case of samples containing a large quantity of suspended particles, SPE method refinements are necessary to improve recovery. Accuracy and precision on repeated analysis were 89–103% and <10%, respectively. A database made of 60,000 PFAS, reported as commercial products or predicted as environmental transformation were used. The database also contains predicted in silico MSMS spectra. The identification and assignment of a molecular and structural formula rely on the comparison of the experimental HRMS data (i.e., accurate mass, isotope patterns, and fragmentation spectra) with the database. In the absence of reference standard, three levels of verification were implemented to confidently confirm the identity of a detected compound. Experimental MSMS spectra were first compared with in silico generated fragments and with fragment ion trees generated by the SIRIUS software. The parent-product chemical relationship between detected features was then assessed. Finally, the obtained structures are screened for shared structure motifs using maximum common substructure analysis. Combined with an automated MS interpretation, the limited and straightforward sample preparation step (i.e., a unique centrifugation) allows to reduce the volume of sample (6 mL are needed), to shorten the MS analysis (< 40 min), and to lower the limit of detection to the low ng/L concentration (0.1–4 ng/L) range, when compared with direct infusion methods. In addition to the identification and quantification of PFAS, the work proposes an interpretation of the HRMS results according to a molecular networking approach associated with a semiautomatic annotation of the structures. This computer-based methodology allows to extract information on the degradation products and the possible environmental transformations occurring in the sample. The proposed high throughput, targeted analysis method of PFAS can also be transferred to low resolution MS.
Direct infusion via nanoESI
Wu et al. demonstrated in 2022 that direct infusion using nano electrospray ionization (nanoESI) and high-resolution mass spectrometry is an efficient strategy for the fast suspect screening and quantification of PFAS in environmental samples (e.g., aqueous film forming foams and wastewater samples) (Wu et al., 2022). In nanoESI, emitters with internal diameter smaller than 1 micron are used. These emitters have several advantages including: higher sensitivity (2 to 3 times higher signal intensity compared to conventional ESI), low injection volume (few µL), high ionization efficiency, reduced salt adduction and matrix effects, more stable and uniform spray that facilitate quantification, sample acquisition is very fast in the absence of upstream chromatography (~min), and emitters can be easily replaced between analysis to avoid cross-contamination and carry over. The suspect screening method consists of four steps: local database construction, background noise removal, positive hit screening (5 ppm mass error threshold allowed during screening), and finally molecular structure validation and attribution of a confidence score according to the confidence scale established by Schymanski et al. (2014). The database is based on the Master List of PFAS Substances (USEPA, 2020) added with published data from 2013–2020. It contains the monoisotopic molecular weight, monoisotopic mass of [M-H]-, chemical formula, and SMILES structures of about 7300 PFAS. Based on the suspect screening result of MS1 data, potential m/z species were manually selected for data dependent (DD) collision induced dissociation (CID) to collect MS2 data and validate their identity. Absolute and semi-quantification was performed using an internal reference standard solution that consists of 4 isotopically labelled PFAS targeting the quantification of four main PFAS groups (i.e., PFCAs, PFSAs, FTCAs, and FTSs). The reference standard solution was added to the calibration solutions and samples to achieve a concentration of 10 μg/L prior to the nESI-HRMS analysis. When compared to conventional LC-HRMS suspect screening workflows (i.e., reference EPA Method 537.1), nanoESI HRMS shows a high sensitivity with lower limits of detection comprised between 3.2 and 36.2 ng/L for 22 target PFAS analytes. The EPA Method 537.1 was used for quality control and quality assurance. The authors detected several new PFAS compounds in AFFF whose structures were validated based on DD-MS2 experiments. Direct infusion using nanoESI also successfully highlighted the generation of mid/short-chain perfluoroalkyl acids in wastewater samples.
Semi-quantification strategy for estimating suspect PFAS concentrations
Quantifying all PFAS compounds present in a complex sample is a challenge and a highly time-consuming task because individual calibrant standards need to be found for each of these targeted compounds. To simplify this process, surrogates are often used but there is a lack of uniformity in calibrant selection for estimating suspect concentrations among different laboratories, making comparison of reported suspect concentrations difficult. In this context, Cao et al. (2023) recently proposed a practical approach in which the area counts for 50 anionic and 5 zwitterionic/cationic target PFAS were ratioed to the average area of their respective stable-isotope labelled surrogates to create “average PFAS calibration curves” for suspects detected in both negative- and positive- electrospray ionization modes. The method was developed on a LC-Q-ToF instrument using data-independent acquisition and applied to a well characterized aqueous film forming foam standard sample. The method predicts the concentrations for 11 out of 50 negative-mode PFAS targets, falling within 70–130% of the known standard concentration. An average accuracy of 139% was reported, varying between 4% and 480%. LOQ was defined at 200 ng/L. Ratioing the suspect response to the average surrogate area results in a potentially more reproducible and translatable approach for estimating suspect concentrations within and between laboratories and across various sample matrices.
2.2.3 Non-targeted analysis
The goal of non-targeted analysis methods is to detect and identify emerging PFAS compounds in complex sample environments. HRMS is a powerful analytical tool to perform this task as high mass accuracy of the precursor ions (MS1) and of corresponding fragments (MS2) are necessary to identify new PFAS and draw their respective potential structure. The precursor peak area (MS1) can be used for quantification but fragment peak areas (MS2) can also be used for quantification similarly to methods developed on triple quadruple instruments (see section 2.3). Quadrupole time-of-flight (Q-ToF) mass spectrometer and orbitrap mass spectrometer, usually used in combination with online liquid chromatography, are currently the standard apparatus to perform these tasks. The rich datasets obtained from non-targeted analysis also provide fingerprints that describe the chemical composition of complex samples. These fingerprints can be used to rapidly highlight PFAS classes and sample identity, as well as to assess the relative abundance of known and unknown PFAS. An important aspect of non-targeted analysis is the choice of surrogate internal reference standards for quantification as emerging PFAS compounds typically do not have an associated authentic standard. It is commonly admitted that in such a case, the surrogate reference standard candidate should ideally have the same number of fluorine atoms and should be of the same or closely related chemical class.
Liquid chromatography (LC) coupled with HRMS
In a recent report, Enders et al. (2022) reported an absolute quantification method according to the development of a non-targeted analysis workflow on an LC-orbitrap platform. An aqueous mixture of 45 standard PFAS covering 8 different chemical classes as well as 23 labelled internal reference standards were used. The compounds were first separated on a fluorinated column showing similar performances than standard C18 column more commonly used in PFAS analyses. Ions were produced by negative electrospray ionization. The precursor peak area (MS1) was used for quantification, while the isotope patterns and fragmentation profiles (MS2) were used for identification purposes. The method was validated using the recommended guidelines from EPA Method 537.1. An open-source vendor neutral software (Skyline) was used to analyse the HRMS data and evaluate the non-targeted method. Such software is expected to facilitate sharing of data across labs and institutions. LOD ranges between 2 and 50 ng/L. Demonstration of precision (1–17%) and demonstration of accuracy (78–122%) were measured at 500 ng/L for each of the 45 PFAS compounds.
The same year, Peter et al. (2022) evaluated the reliability of non-targeted HRMS fingerprints for quantitative source apportionment in complex matrices samples. HRMS sample fingerprints are already used in food and medicinal fields to differentiate and authenticate samples. In this work, the authors proposed that a similar methodology could also be applied to water samples in the context of PFAS analysis. Aqueous film-forming foam (AFFF) was used as a reference material for fingerprint comparisons, and the method was tested on different types of water samples, i.e., ground water, pond water, and surface water. Samples were first extracted using solid-phase extraction, before being separated by liquid chromatography (C18 column) and measured on a Q-Exactive orbitrap (Thermo Fisher). Water samples and AFFF were analysed in both positive and negative electrospray ionization mode. Quality insurance and quality control were performed using 18 isotopically labelled internal reference standards together with 11 isotopically labelled surrogates. After acquisition, the data were first reduced and only features responding to specific criteria were retained: the feature is observed in three replicates, has <40% relative standard deviation in peak area among replicates, has an average peak area ≥105 and ≥3 times that of any blank features. Specific fingerprint features were selected based on different dilution levels and followed selection criteria: the feature must be present in all dilution level, the peak area should decrease concomitantly with increasing dilution, and should be characterized by a linear peak area vs source concentration relationship. The remaining fingerprint features were screened for known PFAS using an in-house database built from both literature data (~1500 PFAS) and the EPA Master List of PFAS. Identification was prioritized by CF2 and C2H4O homologous series screening (mass defect analysis). Finally, a confidence was assigned to each identification using the Schymanski confidence scale (Schymanski et al., 2014).
Thermo Scientific released an application note in which a discovery method was developed for unknown PFAS using a Thermo Scientific Q-ExactiveTM mass spectrometer, i.e., orbitrap mass spectrometer, coupled with a liquid chromatography system (REF: application note thermo) (Zhu & Walker, 2020). The data were analysed using Thermo ScientificTM software, i.e., Compound DiscoverTM and TraceFinderTM. The method was developed using a standard mix solution of 24 PFAS as well as labelled PFAS reference standards, before being applied to real consumable products such as pizza boxes, carpets, and tap water. The workflow is very versatile and relies on both full scan MS and MS2 acquisitions. The data are filtered using specific retention time patterns, mass defect, and inclusion lists. The resulting MS and MS2 data were also compared to mzCloud library, and a score was attributed to each identification. The workflow is a versatile way to analyse complex PFAS datasets and screen for both known and unknown PFAS. Agilent provided an environment application note related to a new data-independent acquisition mode on the Agilent 6546-LC/Q-ToF, known as Quadrupole-Resolved All Ions (Q-RAI) mode (Hunt et al., 2021). The Q-RAI mode was evaluated in the quantitative analysis of US EPA method 533 for PFAS contained in water samples. The method achieved relative standard deviation values for the 25 compounds tested were <20% and <11% at low calibration level. Lowest concentration minimum reporting levels as low as 5 ng/L are reported. Utilizing Q-RAI acquisition facilitates the gathering of precise mass precursor and fragment ions, all while concurrently minimizing or eliminating noise and interference that originate from precursors exterior to the quadrupole isolation window. The untargeted method setup and full scan spectra make possible the retrospective analysis of emerging PFAS.
Non-targeted HRMS analysis workflows can also be applied to track transformation products resulting from PFAS degradation. In 2023, Bowers et al. characterized the transformation products resulting from the reduction of PFAS contained in water samples with UV irradiation (Bowers et al., 2023). In this method, a hydrated electron is generated and used to reduce and degrade fluorine-containing compounds on a timescale of hours to days depending on the experimental conditions. Transformation product distributions over time during reduction by hydrated electrons produced by UV photolysis of sulfate of different classes of PFAS was monitored using a C18 liquid chromatography hyphenated with an orbitrap mass spectrometer. Both full MS scan mode and all-ion fragmentation scan mode were used in order to maximize the discovery of transformation products. A fluorine-atom balance, relying on LC-HRMS data, was also performed as fluorine was anticipated to be almost exclusively converted to fluoride ion or fluorinated compound during the reduction process. The non-targeted analysis was performed on mzMine, modular framework for processing, visualizing, and analysing MS-based molecular profile data. Briefly, peaks were identified using exact mass detection, chromatograms were built and deconvoluted, isotopic peaks were grouped, then peak alignment and gap-filling was performed. Identification was performed using formula prediction, constraining possible formulae based on the formula of the parent PFAS compound and constraining mass accuracy to 5 ppm. Of the resulting peaks, only those that had a formula that resulted in a structure hit in PubChem, or those that had an exact mass that matched a suspect based on previous literature were considered. Furthermore, only features that increased in peak area over the course of reaction are considered transformation products. Fragments from all-ion fragmentation scans were also used to inform identification. Confidence level in the identification was attributed following the PFAS-specific confidence levels system proposed by Charbonnet et al. (2022).
Novel analytes (FTEOs) in anti-fog products and two PFAS commercial formulations were quantified for the first time through a combination of additional analyses using high-performance liquid chromatography (HPLC)-HRMS methods. The distribution of ethoxymer in commercial mixtures was determined using HPLC combined with charged aerosol detection (CAD). The separation and quantification of FTEOs were carried out using HPLC with a CAD detector, where the CAD response exhibited proportionality to the total mass injected for non-volatile compounds. This response remained consistent across a wide range of molecule classes, irrespective of functional groups or chemical structures. Additionally, the identification of 6:2 FTEO ethoxymers was achieved by correlating the retention time with analogous HPLC-HRMS analysis. Semi-quantification of each individual ethoxymer in the mixture was computed as a percentage of the total peak area in the full HPLC-CAD chromatogram (Herkert et al., 2022).
Gas chromatography (GC) coupled with HRMS
Like LC-HRMS coupling, gas chromatography can be efficiently hyphenated with HRMS and used according to both non-targeted analysis and suspect screening workflows. Recently, Casey et al. (2023) set up a GC-HRMS coupling on orbitrap instrument equipped with different ionization sources, i.e., electron impact (EI), and positive/negative chemical ionization (PCI/NCI), with the objective to construct a GC-HRMS spectral database. The database contains 141 structurally different PFAS compounds and gathers information on the retention indices, the ionization susceptibility, the mass spectra from electron ionization (EI) mode, as well as MS and MS/MS spectra from positive and negative chemical ionization (PCI and NCI, respectively) modes. The GC-HRMS workflow was validated on a man-made complex mix of known PFAS and then challenged against an incineration sample (soil sample that has been exposed to AFFF). The workflow involves different levels of data filtering to only select features that can be tentatively assigned to PFAS. Additional care was taken in evaluating potential PFAS candidates, such as examining EI, PCI, and NCI spectra for molecular or pseudo-molecular ions, visually inspecting EI spectral matches for excessive noise and approximate ion ratios and eliminating candidates with extreme retention times based on structure. The non-targeted analysis of the incineration sample was performed using different databases including the custom database (3 features), the NIST20 and Wiley 11 databases (47 features). Confidence levels were assigned to tentative compounds based on the Koelmel scale, a confidence scale that is unique to GC-HRMS data (Koelmel et al., 2022).
2.2.4 Ion mobility mass spectrometry
Ion mobility (IM) is a gas phase analytical technique that separates charged analytes according to their size, shape, and charge. In an IM experiment, charged analytes travel through an inert buffer gas (N2 or He) under the influence of an external electric field. It results that, for a given charge state, small analytes travel the IM cell faster than bigger analytes, the latter being slowed down by numerous collisions with the background gas. The principle of IM-MS is illustrated in Figure 5.
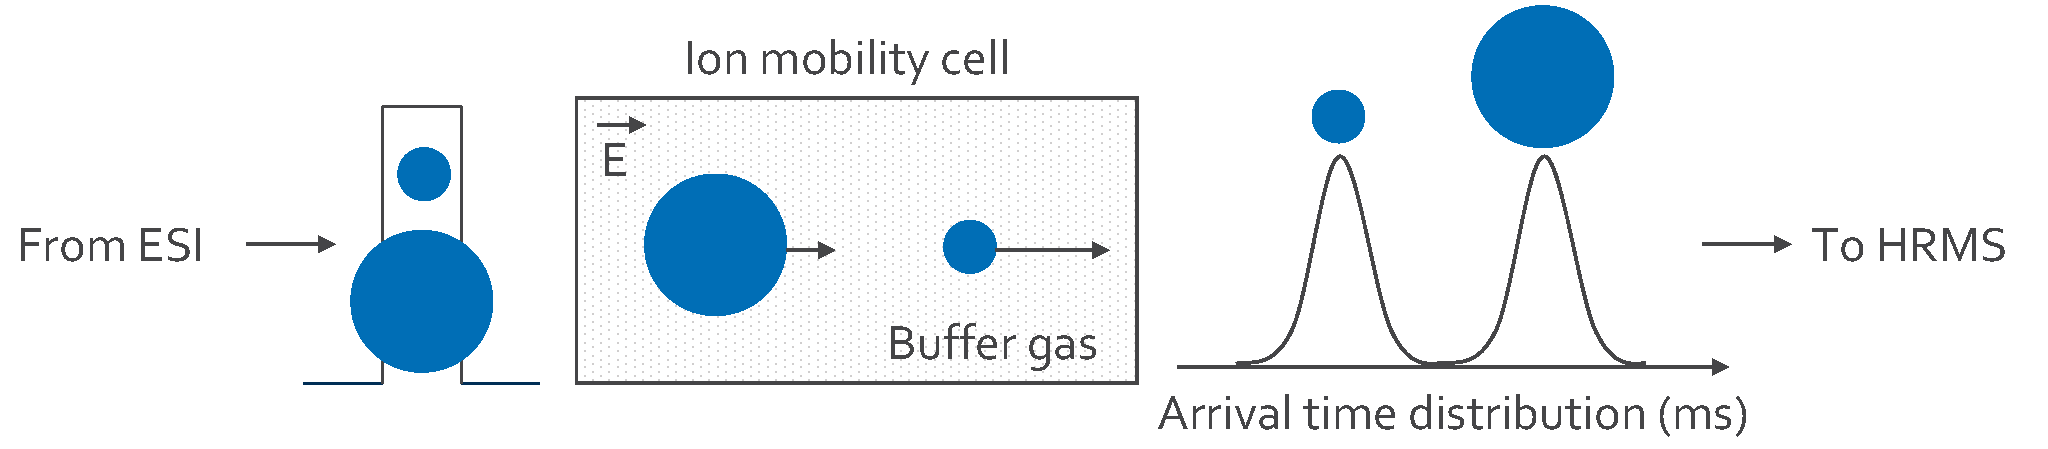
Figure 5: General principle of ion mobility (IM) separation. Ions are separated according to their size, shape, and charge as they pass through a mobility cell filled with an inert gas and under the influence of an external electric field. Large ions take more time to travel inside the IM cell than small ions, resulting in a time-resolved separation. (Source: VITO, 2023)
When coupled with HRMS, the m/z ratio of each mobility-separated ions can be assigned. IM-MS therefore provides an additional dimension of separation to HRMS-based analysis. IM is a highly versatile analytical tool:
- IM is often coupled with LC and GC dimension of separation. IM separation typically takes place in the millisecond timescale which allows a large sampling of chromatographic peaks.
- IM is compatible with different ionization sources including electrospray (ESI), atmospheric pressure chemical ionization (APCI), atmospheric pressure photoionization (APPI), direct analysis in real time (DART) source, and matrix assisted laser desorption ionization (MALDI), among others.
- IM can be efficiently incorporated in existing targeted and non-targeted workflows.
Ion mobility experiments provide a structural descriptor named collision cross section (CCS) which represents the rotationally averaged two-dimensional projection of the ion. This physicochemical quantity is related to the molecular size of the analytes, small analytes are characterized by small CCS values, while large analytes are characterized by large CCS values. IM-MS has been extensively used for the analysis of small compounds and particularly for distinguishing structural isomers, e.g., linear vs branched carbon chains, which can be challenging to resolve in LC or GC analysis and whose m/z ratios are identical in HRMS (isobar ions). In these cases, the CCS can be used as an additional robust descriptor to the retention time and the exact mass. For small analytes, the CCS quantity is independent of the type of IM cell used as long as the buffer gas is the same. Interlaboratory studies conducted on different commercially available instrumental setups revealed that differences in CCS rarely deviate more than +/-2%.
Today, only a few publications report the analysis of PFAS using IM-MS, and the first report dates from 2019. In 2021, Belova et al. reported a CCSs database of 148 contaminants of emerging concerns among which 65 are PFAS compounds (Belova et al., 2021). The PFAS investigated in this study included a set of PFCA and PFSA, as well as a selection of emerging PFAS, such as three fluorotelomer sulfonic acids (FTSA), N-alkylated perfluorooctanesulfonamides, and others. CCS were measured using negative ESI on a drift tube operated in nitrogen and coupled with a Q-ToF instrument (Agilent), an LC (C18) was also used upstream of the mobility separation as a first dimension of separation. CCS were measured with a percent difference <1% in comparison to known database values. The average absolute percent error in CCS among replicates is 0.28% (max. 1.15%, min. 0.02%). The study also revealed a correlation between the CCSs, and the m/z ratios associated with the different compound classes investigated. Figure 6 shows that PFAS compounds align according to a specific trend line that can be readily distinguished from other non-halogenated compounds. In complex matrices composed of multiple compound classes, this feature can be used in non-targeted analysis workflows to filter the data and facilitate their interpretation. As a proof of concept, human urine spiked with a range of contaminants of emerging concerns was analysed to investigate the influence of matrix effects on the reproducibility of CCS values.

Figure 6: Depiction of CCS vs m/z for all the compounds analysed by Belova et al. (2021). Grey marks are compound classes including bisphenol, organophosphorus flame retardants and metabolites, plasticizers and metabolites. Purple and blue marks are the [M-H]- ions of PFAS and the [M-H-CO2]- ions of PFCAs, respectively. PFAS ions align according to a defined trendline that can be distinguished from other compound classes. Reprinted with permission from Belova et al. (2021). Copyright 2021 American Chemical Society.
Liquid chromatography (C18) coupled with ion mobility and HRMS was shown to be successful for the simultaneous analysis of both known and unknown PFAS species, along with providing information on the total abundance of emerging PFAS contaminants. Gonzalez de Vega et al. (2021) developed a methodology that simultaneously provides targeted and non-targeted analysis of surface water samples from the great Sydney basin (Australia). The method was validated for the quantification of 14 sulfonate-based PFAS via MSMS. A non-targeted workflow using mass defect analysis as well as fragment and neutral losses analysis allowed for the detection of 107 unknown PFAS. This list includes isobaric compounds that only differ by their three-dimensional architecture and that were resolved in ion mobility. A similar approach was adopted by Valdiviezo et al. (2022) to perform untargeted analysis of surface water samples and follow the evolution of PFAS derivatives profiles with time in an area where PFAS-containing firefighting foams were deployed (Deer Park, TX, USA). The untargeted LC-IM-MS analysis workflow was directly compared with a targeted LC-MSMS study encompassing 30 PFAS compounds. The untargeted analysis revealed the presence of 19 additional PFAS compounds that were omitted in the targeted workflow. Identification of PFAS was made based on a library of PFAS compounds (76 PFAS reference standards analysed in triplicates) that contains the corresponding m/z and CCS values. Features were identified based on the m/z ratio listed in the library, and homologous series were next identified using Kendrick mass defect (CF2 scale) and patterns in CCS values. An isotope-labelled extraction reference standard (13C2PFDoA) was used to account for losses during sample preparation and instrument variability. The abundance of each PFAS compound was normalized to the standard and their respective relative abundance compared. LC-IM-MS can also be used as a fast-screening technique allowing for high throughput analysis of a variety of matrices without the need for extensive sample preparation and clean-up. Aly et al. (2022) used IM-MS to rapidly screen for 64 referenced persistent organic pollutants, including 10 PFAS and their subsequent degradation products, in the context of an environmental exposure assessment. A CCS was calculated for each substance and each isomer that can be used in further NTA investigations. Each collision cross section was determined in triplicate with relative standard deviations < 1%.
Gas chromatography (GC) can also be interfaced to IM-MS using an APCI source. MacNeil et al. (2022) proposed a non-targeted analysis workflow to screen for less polar unknown PFAS from indoor dust samples. The workflow was validated using SR2585, a standard reference material of household dust, and a quality control procedure was implemented to keep track of potential variations within the results. The first step of their analysis consists in building a theoretical database of predicted CCSs. The theoretical CCSs of the 17,428 industrial chemical structures listed in the Canadian Domestic Substances List and the Toxic Substances Control Act Inventory were calculated using AllCCS machine learning program and used to extract a general rule allowing to discriminate halogenated hydrocarbon chains from their non-halogenated counterparts based on the CCS values. This rule was applied on the non-targeted analysis of the SR2585 to first filter for halogenated compounds. Kendrick mass defect was also used to refine the filtering. Peaks were assigned based on their exact mass and on fragment ions masses. Two-dimensional maps of the IM drift time and the GC retention time allow to identify PFAS that belongs to the same structural class as highlighted in Figure 7. All PFAS homologues fall within the same diagonal line, while horizontal lines depict PFAS ions that generate and share a common fragment ion in their structure. Vertical lines are associated to PFAS structural isomers that coelute in the GC dimension but are separated and resolved in the IM dimension. The structure assignments were all characterized with the 5-level confidence scale from Schymanski (REF) (Schymanski et al., 2014).
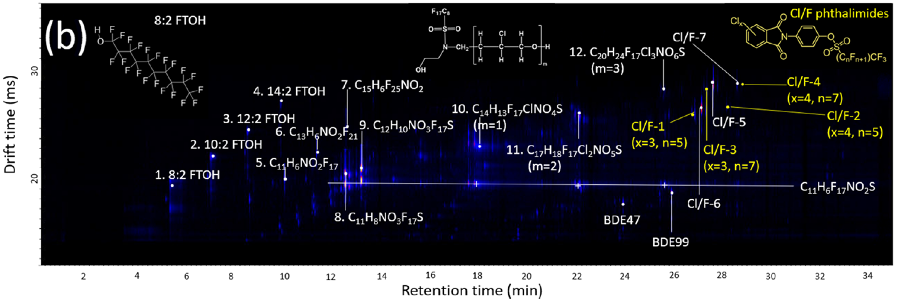
Figure 7: IM drift time vs GC retention time contour plots obtained from NIST SRM2585. Only ions with a CCS that correspond to halogenated hydrocarbon chains are presented. Diagonal lines correspond to PFAS homologues, horizontal lines correspond to PFAS that generate a common fragment in the gas phase, vertical lines correspond to PFAS structural isomers that coelute in GC but are separated in IM. Reprinted (adapted) with permission from MacNeil et al. (2022). Copyright 2022 American Chemical Society.
Today, CCS is foreseen as a universal structural descriptor of PFAS that increases the selectivity of the method and improves the confidence of identification. Ion mobility spectrum is used to filter key features related to complex matrices environments and allow to enhance the analytical sensitivity of high-resolution mass spectrometry measurements (Diaz-Galiano et al., 2023). A recent study performed by Diaz-Galiano et al. (2023) on biota (fish and mollusc samples), food (wheat flour), and human serum revealed that filtering the data for ions falling in a specific m/z range and arrival time window offers the possibility to increase the S/N ratio by decreasing the background noise (~50% improvement), to remove co-eluting interferences (~6% elimination), and to prevent false negatives for low abundance ions (~14% improvement). Such filtering increases the sensitivity of the detection and allows for a better detection of compounds at trace levels. A complete validation of the method was not performed but eight quality control samples spiked with 13C8-PFOS (injection standard) and containing known concentrations of PFAS (0.67 – 16 µg/kg) were used. All PFAS were successfully detected.
In the context of environment analysis, Bruker released an application note aiming at providing a standard-free screening workflow (Kiehne et al., 2022). Water samples were measured on a timsTOF Pro 2 system (Bruker Daltonics, Bremen, DE), a Q-ToF mass spectrometer equipped with a trapped ion mobility cell, and resulting data were analysed using MetaboScape® data analysis tools. Kendrick mass analysis using CF2 repeating unit was performed to reduce the data set and identify PFAS-related features. The 4D nature of the data collected, with high mass accuracy, near 95% MS/MS fragmentation coverage, and reproducible CCS ion mobility values, enabled confident identification of targeted PFAS, along with putative identification of untargeted PFAS. In-silico fragmentation patterns and CCS value predictions were used as standard-less identifiers and were compared to the corresponding experimental standard quantities. The method has not been developed for quantification of PFAS yet, but preliminary tests show detection sensitivity between 2 and 100 ng/L in direct analyses of higher samples volumes (200 µL).
2.2.5 Fast screening methods for identification and quantification
MALDI-Q-TOF
Matrix-assisted laser desorption ionization (MALDI) is a technique that consists in ionizing analytes contained in a solid matrix by means of a laser. The m/z ratio of the generated ions are then measured by mass spectrometry analysers such as Q-ToF. Compared to the established ESI methods, MALDI can be operated in an automatic fashion which allows for high throughput analysis at lower costs. Major drawbacks compared to ESI include lower reproducibility, sensitivity, and selectivity; a smaller dynamic range; the adaptation of the matrix to the PFAS compounds of interest to avoid interfering peaks (no universal matrix available). To achieve accurate quantitation as well as a high reproducibility and repeatability it is necessary to develop a robust sample preparation step and to carefully choose the matrix (type and concentration). It is also of importance to spike the sample with an adequate labelled internal reference standard in order to avoid spot-to-spot variability. Dilmetz et al. (2021) developed a MALDI-Q-ToF workflow to quantify PFOS from contaminated water. The procedure is relatively straightforward: the water sample is first extracted using SPE C18 cartridges, eluted with methanol and evaporated to dryness. The residues are then re-dissolved in methanol containing 1 ng/µL of an internal reference standard (M-PFOS) that accounts for spot-to-spot variability. The samples are subsequently spotted in replicate on a MALDI plate and overlaid with a matrix. The calibration curve is built using 5 different concentrations of L-PFOS, ranging from 0.1 to 10 ng/µl. M-PFOS is also added to each calibration spot to account for variability in spotting. The calibration curve was then constructed in Excel from the intensity values of the L-PFOS/M-PFOS ratio. The quantification procedure was evaluated on a test sample composed of PFOS spiked into ultrapure water at 0.07 µg/L. The calibration curve was used and a concentration of 0.91 +/- 1.06 × 10⁻⁴ µg/L was calculated and associated with a 30% error in the concentration estimation. MALDI-ToF is also used for the direct measurements of industrial components without the need to dissolve them. In an application note, Bruker Daltonics used MALDI ionization to obtain accurate mass data of the end groups of fluorinated synthetic polymers used as lubricants at the monolayer level from industrial products, such as lubricant applied to hard disk media (Kudo et al., 2021). The MALDI HRMS analyses were directly performed on the hard disk material after a cationizing agent solution was applied to its surface by a sprayer. A Kendrick mass defect analysis was applied to the data to identify repeating units and end groups. In addition to the end group assignments, information on the degree of polymerization and the polydispersity were obtained.
SPME-DART-LTQ-FT
Direct analysis in real time (DART) is a plasma-based ambient ionization technique that allows rapid analysis of a broad range of compounds, including PFAS. Emmons et al. (2023) recently developed a method that allows for the fast screening and quantification of PFAS using DART-MS in less than 20 s per sample. Four model analytes (PFOA, PFOS, GenX, PFBS) dissolved in water were first pre-concentrated using solid phase microextraction (SPME) and the extracts were then directly analysed using DART-MS. Experimental parameters influencing DART ionization, i.e., plasma temperature, plasma makeup, electric grid voltage, and interface pressure, were also investigated. All model PFAS shows in-source fragmentation because of the heated plasma (temperature ranges from 50 °C to 500 °C) used in DART. The degree of fragmentation is compound depend. Quantification was performed on [M-H]- ion for PFOS, PFBS, and PFOA, and on [M-H-CO2]- ion for GenX. The performance of the SPME-DART method was assessed by coupling the source to a linear triple quadrupole (LTQ) instrument using tandem mass spectrometry to enhance the sensitivity of the measurements. Eight calibration levels within 10 and 5000 ng/L were analysed and three isotopically labelled PFAS were spiked as internal reference standard at 750 ng/L for each concentration point. A high linearity in response was observed in the concentration range assessed, with repeatability below 10% relative standard deviation for most of the calibration levels. LOQs as low as 10 ng/L for all model analytes were reported using optimized instrumental conditions. Because of its large temperature range, from 25 to 600 °C, DART is also an adequate ionization technique to study the fate of thermally degraded PFAS in situ and in real-time (West et al., 2023). The thermal desorption-pyrolysis-direct analysis in real time-mass spectrometry (TD-pyro-DART-MS) is a robust high throughput platform that allows for both the rapid profiling of PFAS and their pyrolysis products, and the semi quantification of the compounds under ambient ionization conditions and with few to no sample preparation requirements. This thermal degradation method was first applied to different classes of PFAS standards, including perfluorooctanoic acid (PFOA), 6:2 fluorotelomer sulfonate (6:2 FTS), perfluorooctanesulfonate (PFOS), and the large carbon-chain PFAS perfluorodecanoic acid (PFDA) and perfluorotetradecanoic acid (PFTDA). Different degradation steps were observed depending on the source temperature with headgroup scission preceding carbon-carbon bond cleavages resulting in [CxFy]- fragments differing by CF2 (50 Da) and C2F4 (100 Da). The higher molecular weight PFAS, i.e., PFDA and PFTDA, results in more pyrolytic fragments than the lower molecular weight PFAS. The procedure was further applied to legacy aqueous film forming foam (AFFF) and showed that the thermal degradation is more complex because the matrix is more complex. HRMS was necessary to assign the different observed features. In comparison to pyrolysis-GC-MS, TD-pyro-DART-MS yields to simpler mass spectrum and therefore shorten both the analysis and data processing time.
2.2.6 Ultra-high resolution mass spectrometry (FT-ICR)
Accurate mass measurements play a central role in the identification of PFAS in complex mixtures. Accurate mass is used to assign a molecular formula to detected ions and provides information on their respective elemental composition. It however does not allow to differentiate structural isomers. Within an analytical error window, the number of possible molecular formulas increases with the molecular mass and the number of elements included in the formula which rapidly hamper the reliable identification of detected ions. A higher mass resolution together with a higher sensitivity to isotopologues of low abundance ions are then necessary to constrain the number of possible molecular formulas and further discriminate between similar compositions. Fourier-transform ion cyclotron resonance mass spectrometry (FT-ICR MS) equipped with a 21 Tesla magnet provides the highest resolving power in the current instrument market with sub-ppm mass errors across a large range of molecular weights. Young et al. (2022) used this very specific instrument setup together with direct infusion electrospray ionization to establish a list of exact masses and elemental composition that can be applied to future suspect screening workflows using LC-HRMS. Because direct infusion does not resolve structural isomers, their respective signal combine and raise their associated signal-to-noise ratio, thus improving the sensitivity of the measurement. The protocol was applied to aqueous film-forming foam (AFFF). Natural organic matter (NOM) sample free of PFAS was used as a negative control. Sample preparation was kept minimal before direct infusion. AFFF sample was only diluted in ultrahigh-purity methanol prior to FT-ICR MS analysis, solid-phase extraction was performed on the NOM sample. Each detected ions were first submitted for suspect screening against a database with a mass tolerance of ± 0.2 ppm. A molecular formula was then assigned to the remaining ions. A restriction was applied on the elemental composition with an attribution within ±0.5 ppm mass error window, and only ions smaller than m/z 865 Da were considered. Kendrick mass defect and Kendrick-analogous mass difference network were used to identify known and unknown PFAS, to sort and limit the number of formula entries. In this study, 163 known PFAS were found during the suspect screening using the NIST PFAS Suspect List, and 134 tentatively novel PFAS were detected during non-targeted screening. Compared with other conventional (hybrid) high resolution mass spectrometers that can be coupled with LC, FT-ICR instruments can detect more isotopologues and homologues. Major disadvantages of FT-ICR instruments are their high purchase and maintenance costs, as well as the need for specifically trained scientists to operate the instrument.
2.2.7 PFAS identification from HRMS data – handling HRMS data
In complex matrix environments, targeted and non-targeted HRMS-based methods allow for the detection of an enormous number of features among which it is necessary to discriminate for PFAS and PFAS derivatives (i.e., how many of the detected compounds are PFAS). Because a standard HRMS analysis can detect 10,000+ compounds for which an exhaustive manual analysis is impossible in a finite amount of time, tools have been developed to filter, sort, identify, and attribute a confidence level to PFAS detected in complex matrices.
Filter the data
Unlike other halogenated compounds, fluoro-based compounds are not characterized by a specific isotope pattern and are therefore hard to recognize in a mass spectrum. Because HRMS provides accurate mass measurements, Kendrick mass defect (KMD) analysis is often used to find compounds built from the same unit. In KMD analysis the measured exact mass of a compound is normalized by the integer mass of the repeating unit (e.g., CF2 unit in the case of PFAS). It results that all homologue compounds characterized by the same core structure but with varying number of the repeating unit have the same KMD (Emmons et al., 2023; Getzinger et al., 2021; Kaufmann et al., 2022; Kiehne et al., 2022; Koelmel et al., 2022; Young et al., 2022; Zweigle, Bugsel, & Zwiener, 2022). Once highlighted, these features can be extracted from the data for further analysis. A similar data reduction approach was proposed by Kaufmann et al. (2022) that relies on the ion abundance between the monoisotopic and the first isotopic peak. The number of carbons (C) was estimated for each extracted feature. A mass over carbon (m/C) and mass defect over carbon (md/C) ratio was calculated. By plotting the m/C ratio as a function the md/C ratio, PFAS compounds of high probability are selectively discriminated from other compounds present in a matrix (for more information see (Kaufmann et al., 2022)). PFAS compounds (red) are strongly discriminated over other compounds and more fine distinction between different PFAS classes is also possible as shown by theoretical predictions of the ratios. This strategy allows to increase the sensitivity of the method so that compounds present at low µg/kg concentration in complex matrices are detected (Kaufmann et al., 2022; J. Zweigle et al., 2023).
More recently, collision cross section (CCS) values issued from ion mobility mass spectrometry measurements have also been proposed as an additional filter for data reduction. Halogenated compounds are distinguishable from their non-halogenated counterparts based on their respective collision cross sections (MacNeil et al., 2022). This new possibility of filtering has not been implemented in a software tool yet but is expected as a promising additional filtering step in future HRMS analysis involving ion mobility separation. In 2022, Zweigle et al. proposed to perform another level of filtering on the MSMS data (Zweigle, Bugsel, & Zwiener, 2022). When fragmenting, PFAS generates specific fragments with characteristic mass differences. By screening for these mass differences in the tandem mass spectra, it is possible to increase the confidence level in the identification of PFAS.
Build comprehensive databases
The use of databases is necessary to confidently identify and to comprehensively annotate known and new PFAS compounds. Several databases exist for PFAS, including the United States Environmental Protection Agency (EPA) list (10,000+ PFAS), CAS SciFinder, ChemSpider, and PubChem that also contains 10,000+ PFAS, but custom databases are often built by research groups depending on their practice and needs. There is today a need for a centralized curated and comprehensive spectral library to support the high throughput analysis of data obtained from targeted and non-targeted HRMS workflows. Koelmel et al. (2022) compiled one of the largest PFAS libraries that is used to identify and annotate features in FluoroMatch 2.0. This combined library contains ~9500 PFAS in the form of [M-H]- ions and contains information on the retention time, the exact mass, the mass defect, the fragments mass, as well as in silico MSMS information. Getzinger et al. (2021) constructed a PFAS molecular database from in silico predicted transformation products and tandem mass spectra. The library allows for comparison between experimental fragmentation mass spectra and in silico generated ones. Each comparison is scored and ranked to facilitate the assignment of structure. Similarly, the collision cross sections are more and more used to identify and assign a structure to PFAS when the retention time and molecular formula are not sufficient to discriminate against structural isomers. In this context, libraries gathering information on CCS values of PFAS and PFAS isomers have been proposed (Belova et al., 2021; MacNeil et al., 2022).
Develop data analysis software
HRMS measurements generate a large set of data for which the development of robust software tools is necessary to handle the analysis workflow. Vendors are adapting existing software or developing new software components dedicated to PFAS identification and quantification, such as Skyline and Compound Discoverer from Thermo Scientific, but many research groups are also building in-house data analysis software that are specific to their needs. In 2021, Koelmel et al. introduced FluoroMatch Flow 2.0, a pioneering software tailored to manage the entire process of non-targeted data analysis for PFAS discovery using LC high-resolution tandem mass spectrometry (Koelmel et al., 2022). This software navigates through a series of steps, including feature detection, feature blank filtering, exact mass matching with catalogued PFAS, mass defect filtering, homologous series detection for enhanced PFAS coverage, retention time pattern analysis, class-based MS/MS screening, fragment screening, and predicted MS/MS derived from SMILES structures. A confidence score is also attributed to each feature according to a confidence levels scale that relate to the one proposed by Schymanski et al. (2014). FluoroMatch 2.0 was benchmarked using aqueous film forming foam (AFFF). 1000+ known and unknown PFAS compounds were discovered. 96% of the detected features were removed based on the different filtering steps which allows to drastically reduce the dataset and restrict it to PFAS-related compounds. FluoroMatch 2.0 identifies 50 homologous series with ≥3 members among which 22 series were confidently assigned a PFAS class. Current drawbacks include the limited library (only [M-H]- ions are considered), no accurate formula prediction, false negative rates of assignment have not been assessed, and false positive rates of assignment have only been evaluated for compounds identify with a high level of confidence (~0% based on non-labelled reference standards, ~5% based on predicted fragmentation). Alternatively, Zweigle, Bugsel, & Zwiener (2022) developed an open-source algorithm, FindPFΔS, that capitalizes on fragment mass differences in accurate MSMS data. Two pre-characterized reference samples (soil and paper) were used to establish a list of selective fragment differences obtained at various collision energy. Both diagnostic fragments and neutral losses are used. The method was validated using a mix of 38 different reference standard PFAS of different classes. 94% were identified using FindPFΔS algorithm. The algorithm allows to reduce false positive discovery rates by increasing the confidence in MSMS fragment assignment, although the process can be challenging when large number of fragments are present or/and if the spectra of co-eluting compounds are superimposed.
Confidence level scale
PFAS data obtained by non-targeted and suspect screening with HMRS require the definition of evaluation criteria that quantify for the certainty of identification of these PFAS and allow for reliable and harmonized communication of the results. In 2014, Schymanski et al. established a set of confidence level criteria for the identification of small molecules via HRMS, which is also applied to communicating confidence of PFAS (Schymanski et al., 2014). In 2022, Charbonnet et al. (2022) updated their former report and implemented criteria specific to PFAS in their confidence scale. This confidence scale, see Figure 8, is divided into 5 major levels and sub-divided into 12 minor sub-levels that correspond to more detailed criteria (e.g., 3a, 3b, 3c, and 3d). The highest confidence level, level 1a, refers to compounds that are confirmed by a reference standard. Level 5 is the lowest confidence level for which the compound is only identified through suspect screening or data filtering and solely assigned to an accurate mass. The detailed criteria for PFAS identification at various confidence levels are summarized in the table in Figure 8. The confidence scale is consistent with existing criteria used to communicate the identity of small molecules (i.e., analytical reference standard, library MS/MS, RT matching, precision mass matching, etc.), but also incorporates more specific criteria attributed to PFAS such as the detection of homologues and the use of mass defect. Namely, reliable identification of a single homologue can provide evidence to support the identification of other homologues in the series. By confirming reference standards at all levels and confirming homologue identification, it contributes to confidence communicating of PFAS structure identification. The confidence scale proposed by Charbonnet et al. (2022) highlights the necessity to harmonize data reported in the field of PFAS analysis.
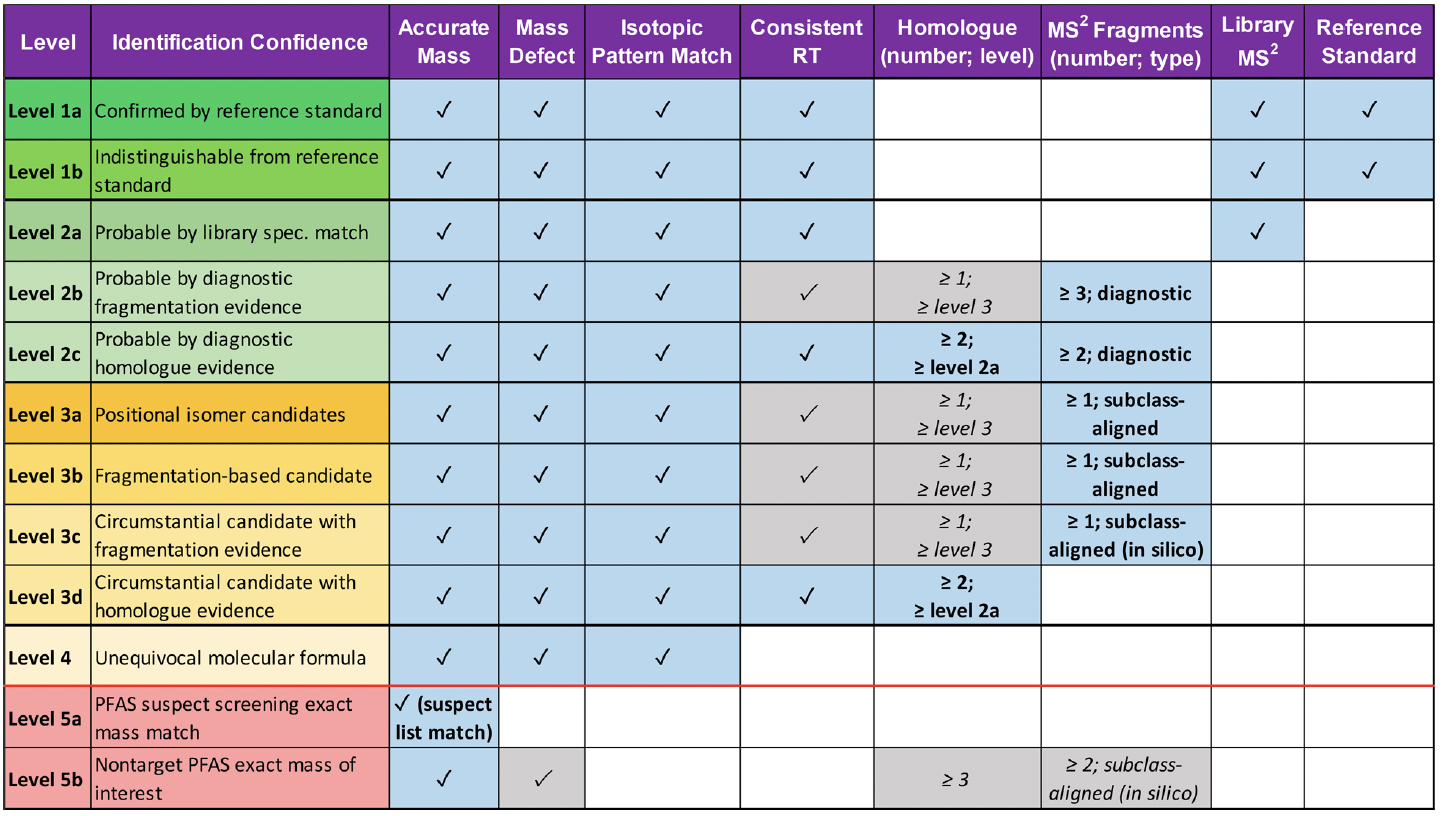
Figure 8: Criteria for PFAS identification at various confidence levels. Reprinted with permission from Charbonnet et al. (2022).
* Blue highlights with bold typeface indicate required criteria for PFAS identification at a certain level. Gray highlights and italic typeface indicate where any of several criteria may be used in identification.
2.2.8 Inductively coupled plasma - mass spectrometry (ICP-MS)
Inductively Coupled Plasma-Mass Spectrometry (ICP-MS) is a powerful analytical technique used for the sensitive and quantitative analysis of elements in a wide range of samples. It combines two critical components: inductively coupled plasma (ICP) as the ionization source and mass spectrometry (MS) for elemental detection, identification, and quantification. In ICP-MS, a sample is nebulized and introduced into an extremely hot and ionized plasma. Plasma is typically made by inductive coupling of radiofrequency (RF) energy into flowing argon, which is subsequently atomized and ionized into charged particles. These ions are then directed into a mass spectrometer, which separates them based on their mass-to-charge ratio (m/z). Typically, a quadrupole or magnetic sector mass analyser is used to filter, select, and detect ions of interest. However more specialised instruments may use time of flight (TOF) or quadrupole-TOF analysers. The detector measures the abundance of ions at various m/z values, allowing for the identification of elements and quantification of their concentrations. ICP-MS is known for its exceptional sensitivity, wide elemental coverage, and ability to detect trace elements at extremely low concentrations. It is widely used in diverse fields including environmental analysis providing insights into the elemental composition of various sample types. This technique plays a vital role in scientific research, quality control, and regulatory compliance due to its precision and versatility.
Established methods for commercial use
To the best of our knowledge, this method is not currently being used commercially for the determination of PFAS.
Ongoing activities by research institutes
In the field of PFAS analysis, ICP-MS is used as a powerful nonspecific analytical technique that allows to identify and quantify multiple elements in a single sample according to a large dynamic range of concentration, covering up to 6 orders of magnitude. Compared to other nonspecific detection instruments (CIC and HR-GF-MAS), ICP-MS can be easily connected to a liquid chromatography (LC) instrument, which provides retention time (RT) information as an additional dimension of separation. Coupling with LC instruments allows to reduce the complexity of the analysis, limit the amount of data, and help to elucidate unknown and novel PFAS when used in combination with HRMS techniques. Importantly, ICP-MS analysis workflows are characterized by a high matrix tolerance limit and provide compound-independent response factors so that compound-specific reference standards are not necessary to quantify the elements present in a sample. In comparison with suspect and non-targeted screening methods, involving ESI, MALDI or DART as ionization techniques, and often requiring labelled reference standards for quantification, ICP-MS provides a unique quantification platform that is independent of the PFAS class analysed (Y. Shen et al., 2023). ICP-MS has been applied for PFAS analysis in the following related studies.
Heuckeroth et al. (2021) and Y. Shen et al. (2023) demonstrated how liquid chromatography (LC) hyphenated with a dual detection system made for both element specific detection (ICP-MS/MS) and molecular specific detection (ESI-MS/MS) in combination with an appropriate data processing (mZmine) can help identifying unknown organofluorine substances in non-targeted analysis. According to this complementary combination, metabolites were detected in aerobic sewage sludge by use of a model compound (8:2 FTOH). Because the degradation products of 8:2 FTOH are known, the methodology was validated. Fluorine, detected as a [BaF]+ cluster in the ICP-MS analysis, enables identifying retention time associated with PFAS following an untargeted approach. The ESI-MS data can be filtered for a retention time window in addition to other software-based approaches, such as removal of blank and control sample features. This entire procedure reduces the data by 99.7%, i.e., the initially 5115 features detected reduces to 15, which can greatly increase efficiency of unknown organofluorine detection. A disadvantage of the fluorine speciation via ICP-MS is the high detection limits (0.34 mg(F)/L for PFOA and 0.06 mg(F)/L for 8:2 FTOH).
[BaF]+ diatomic ions formed in high-temperature plasma in conventional ICP-MS experiments can be inefficient and often lead to low sensitivities. To overcome this low sensitivity issues, White et al. (2022) recently implemented a new post-ICP chemical ionization approach to better form and detect F element in [BaF]+ during ICP-MS measurements of liquid samples. Solutions of fluorochemicals are introduced into an ICP leading to formation of HF in the afterglow. Subsequently, reagent ions from nanospray of sodium acetate and barium acetate electrolytes are utilized to ionize HF to [Na2F]+ and [BaF]+, respectively, via post-plasma ion-neutral reactions. Compared to [BaF]+ formed inside the plasma in conventional ICP-MS methods, [Na2F]+ and [BaF]+ formed in the nanospray-ICP interface provide two orders of magnitude higher sensitivities (280 cps/ppb) and a LOD in the range of 10 ng(F)/mL. This new method also reduces interferences, leaving F background as the main factor in LOD determination. A similar species-independent quantification of Fluoro- and Chloro-containing compounds was proposed by Redeker et al. (2022). Recoveries higher than 90% and LOD of 5–12 pmol F were reported. Altogether, ICP-nanospray is compatible with current HRMS instruments with minimal instrument modifications. In this case, HRMS allows to reduce isobaric interferences. The facile development of effective post-plasma ionization chemistries offers a path for further improvements in F elemental analysis and constitutes an option for standard-less analysis.
2.2.9 Summary of key information
High resolution mass spectrometry for the analysis of PFAS in complex matrix environments offers a promising alternative to more established analytical methods because of its high sensitivity, specificity, and versatility. Advances in HRMS instrumentations and the option of upstream coupling with complementary analytical techniques such as chromatography and ion mobility, opens perspectives for the development of non-targeted analysis and suspect screening methods that rely on the high resolving power, the sensitivity, and mass accuracy of HRMS.
Main drawbacks imputed to HRMS platforms include:
- The high cost of the technology and of its maintenance.
- The high training level of the scientists performing the measurements and the data treatment.
- The large dataset generated, heavy data treatment, and lack of automation.
- The whole process is slower than targeted analysis performed on low resolution MS instruments.
- Big commercial labs have often a high-resolution instrument available, but the smaller commercial labs do not have it because of the high cost of the instrument.
Main benefits of HRMS platforms include:
- HRMS provides information on the accurate precursor mass and associated fragments mass, eventually allowing to assign an elemental composition and a structure to detected PFAS.
- HRMS has the advantage to be easily hyphenated with complementary analytical tools such as gas/liquid chromatography, and ion mobility, and can use a wide range of ionization methods allowing to cover different classes of PFAS compounds.
- HRMS is used to detect multiple known and unknown analytes in a single analysis.
- LOD and LOQ reaching the pg/L range have been reported and differ around a factor 10 (loss in sensitivity) when compared with the traditional targeted analysis. Nano-ESI can be used to overcome this loss in sensitivity.
- Recent developments in the data treatment set the basis for high throughput analysis.
Future focus for regulatory enforcements and cooperative actions on PFAS analysis should focus on:
- Enhancing low-cost and simplified analysis workflows.
- Development of robust and user-friendly software tools for automation in the data treatment.
- Encourage the use of a universal confidence scale for compound identification scoring.
- Encouraging the availability of PFAS reference standards and certified reference materials as well as the development of complementary standard-free approaches.
- Standardizing sample preparation, and simultaneously eliminating cross-contamination.
- Exploiting the existing know-how and PFAS databases to establish suspect and non-target screening approaches to trace the new PFAS and combining other, more established techniques such as NMR to determine the position of the H-substituents and confirm HRMS identifications.
- Build a universal comprehensive compendium with all PFAS descriptors.
- Promote data sharing between institutions and research groups (FAIR data).
- Promoting joint assessments of PFAS by developing grouping approaches and mechanistic understanding of the physicochemical properties of PFAS.
- Investigate degradation products and transformation pathways.
Suspect screening:
- More and more PFAS libraries are online available (e.g. EPA master list). The libraries and especially libraries with structures can be easily used for identification of existing compounds that are not yet included in the targeted methods, because of lack of commercially available reference standards. The benefit of using the libraries is that with the accurate mass, retention time, fragmentation patterns the “known” compounds can be quickly identified and verified at a high confidence level. By using a reference compounds per PFAS class, a semi-quantification is also possible. It should be stated out that every PFAS compound (even isomers) will act differently in a mass spectrometer (due to the response factor) and that underestimation and overestimation is possible even within the same PFAS classes. If commercial standards are available, the highest level of confidence can be reached. The benefit is that a large group of PFAS can be monitored in one single run.
Non target analysis:
GC and LC can be coupled easily to HRMS instruments. The combination of techniques can cover a wide range of PFAS compounds. Using additional techniques to overcome false positives and have a bigger confidence level, ion mobility can be used as an additional tool. To introduce samples into the LC and GC system, sample preparation steps are needed (offline or online). Sampling and sample preparation are crucial steps in the non-targeted analysis. These steps should be chosen wisely to overcome elimination of certain PFAS classes or at least there should be awareness that this can happen.
To overcome this problem, fast screening methods will gain more and more attention, the introduction of the sample is directly or by use of limited sample preparation into the HRMS system. No resolution due to the chromatographic separation occurs but the resolution can be obtained by the high accurate mass. There are some drawbacks about these techniques; they are less sensitive and under influence of matrix effects. Although they can give quick an idea of the PFAS present in the samples.
Inductively coupled plasma – mass spectrometry (ICP-OES):
- ICP-OES is a technique that is used for elemental analysis.
- It has a high limit of detection ppm level and to lower the limit of detection.
- Use of post-ICP chemical ionization can lower the LOD of the method.
- It is a common technique that is used in commercial labs.
- Sample preparation (destruction of the sample) is needed for measurement with ICP-OES.
- In combination with HRMS can it be a powerful technique for identification and quantification (without the need for reference standards) of PFAS compounds.
Use for enforcement/compliance testing:
Non-target screening is a very powerful tool to screen for newly PFAS compounds. Non-target screening can act as a bridge between the total PFAS analysis and the target analysis that are needed for regulation. The total fluorine methods, gives an idea of the total amount of fluorine in a sample but does not tell anything about the PFAS compounds itself that are present (identification). Non target screening can provide at least an accurate mass, an elemental composition (formula), or a structure and if possible, at the highest level a complete identification (name). When there is a commercial standard available, the transfer to a quantitative target analysis can be easily and quickly done.
The rich datasets obtained from non-targeted analysis can provide fingerprints that describe the chemical composition of complex samples and can give a first idea about the source of contamination (origin). These fingerprints can be used to rapidly highlight PFAS classes and sample identity, as well as to assess the relative abundance of known and unknown PFAS. Non target screening will not only provide information about the PFAS compounds and fingerprints but also to track transformation products resulting from PFAS degradation.
However, harmonization and standardisation of the PFAS analysis in non-target screening methods is lacking. First efforts for standardisation and harmonization were taken in the NORMAN network. Recently, a NORMAN guidance on suspect and non-target screening in environmental samples is published. This guidance can be used as a first step in harmonization of non-target screening methods that can be used as an example for the harmonization of PFAS analysis in different types of matrices (others than environmental samples).
Cost implications:
The cost for implementation of a HRMS approach is high. The instrument cost, implementation, setting-up the instrument, maintenance of the instrument, investment in software and updates will require a huge investment. For the non-target screening, highly trained, educated, and experienced people are needed to do the interpretation of the mass spectrometer data for the non-targeted screening. Software can support the interpretation by visualisation tools (Kendrick mass defect plots, homologue series, …) but at the end the people have to assign the right compound to the peak, this is often based on years of experience.
Due to this costs of the non-target screening, standard commercial labs do not often invest in HRMS. HMRS is a technique that is more imbedded at universities, bigger commercial labs and research institutes. However, when more lists of PFAS that companies are using comes into public (expand), suspect screening can be a good tool that commercial labs can implement. The workflow is more aligned and narrowed down, so it can overcome the need of the highly trained experienced people.
2.3 Targeted methods for individual PFAS
Targeted methods are used to quantify levels of specific PFAS in various matrices. In general, targeted methods involve chromatography hyphenated to mass spectrometry (MS). Liquid (LC) or gas chromatography (GC) can be applied. For quantification, an appropriate reference standard is necessary. Such reference standards are only available for certain PFAS and therefore only these specific substances can be quantified. The choice of PFAS has been driven mainly by a mixture of practical analytical reasons and the purpose to act regulatory compliant. Thus, the main focus lays on PFAAs (especially PFCAs and PFSAs) and some newer replacement substances like fluorotelomers and perfluoroalkylethers (ADONA, GenX). For the analysis of polymeric PFAS, coupling a thermo-desorption or pyrolysis unit to the GC-MS method is generally carried out.
Target analysis is advantageous because it provides an accurate PFAS concentration, and the achievable reporting limit of 1–2 ng/L (1000 ppt) meets the regulatory requirements. However, this analytical technique only applies to a limited subset of PFAS (as explained above), and it is not sufficient to provide a comprehensive indication of the total PFAS population that may be present in a sample.
2.3.1 Liquid chromatography – Mass spectrometry (LC-MS)
Liquid Chromatography-Mass Spectrometry (LC-MS) is an analytical technique that combines liquid chromatography with mass spectrometry to separate, identify, and quantify compounds within a sample. In LC-MS, a liquid mobile phase is used to carry the sample through a chromatographic column, separating compounds based on their chemical properties such as polarity, size, or charge. The eluted compounds are then directed into a mass spectrometer, where they are ionized and analysed based on their mass-to-charge ratio (m/z). By comparing the mass spectra with a database of known compounds or through fragmentation patterns, the identity of the compounds in the sample can be determined. The better option is the direct comparison with isotopic labelled reference standards. Additionally, LC-MS can provide quantitative data, allowing for the measurement of the concentration of each compound in the sample.
During the stakeholder consultations LC-MS was the most common reported targeted analysis method used for PFAS analysis for commercial use (8 out of 10 reported) and being further developed in research laboratories (11 out of 12 reported).
Normal-phase vs. reversed phase LC
Normal phase liquid chromatography NP-LC uses a non-polar mobile phase (e.g., hexane or dichloromethane) and polar stationary phase (e.g., silica). The analytes are retained by the polar stationary phase depending on their polarity. This method works effectively for separating analytes readily soluble in non-polar solvents. For the separation of polar and moderately polar compounds (e.g., most PFAS) reversed phase liquid chromatography (RP-LC) is better suited.
In RP-LC, the stationary phase is nonpolar or hydrophobic. Common stationary phases used include C18 (octadecylsilane) or C8 (octylsilane), which have hydrocarbon chains bonded to silica particles. The mobile phase is typically a polar solvent or a mixture of polar and organic solvents. Water and organic solvents like methanol or acetonitrile are commonly used.
Established methods for commercial use
Target analysis of PFAS by LC-MS/MS is well established. There are several validated standard methods available for the determination of a specific subset of PFAS in various matrices. Many methods were developed for environmental media, especially aqueous media. However, there are also methods available for e.g., food, tissue and solids including consumer products. An overview on all identified available standard methods is summarized in Table 2. A list of PFAS that are covered by these standard methods is presented in Table 3. The standard method CEN/TS 15968 (entry no. 12) can be used to measure the extractable PFOS in coated and impregnated solid articles and liquids like firefighting foams by LC-tandem MS or LC-qMS. It is applicable to a concentration range between 0.5 μg/L up to 50 μg/L. It is in practice also applied for other PFAS than PFOS.
ISO standard 23702-1 was formulated to determine the presence of non-volatile PFAS in leather. The procedure involves extracting PFAS from the sample using methanol and analysing them through LC-MS/MS. While this method is specifically designed for the targeted analysis of long-chain PFAS (C7 to C14), it can also be adapted for the analysis of other PFAS compounds following a thorough analytical evaluation. The first standard method CEN/EN 17681 is now available since 2022 for targeted analysis of PFAS in textiles and textile products. It describes that a combination of targeted analysis using LC (CEN/EN 17681-1, entry nr. 13) and GC (CEN/EN 17681-2) as the most suitable approach.
There are two US EPA methods for water (drinking and non-potable water)
GenX and ADONA are processing aids (dispersing agents (surfactants)) in the polymerization of some types of fluoropolymers – e.g. dispersion polymerization of tetrafluoroethylene (to produce dispersion of fine powder PTFE). Both were considered as PFAS alternatives.
DIN 38407-42 “German standard methods for the examination of water, waste water and sludge - Jointly determinable substances (group F) - Part 42: Determination of selected polyfluorinated compounds (PFC) in water - Method using high performance liquid chromatography and mass spectrometric detection (HPLC/MS-MS) after solid-liquid extraction” https://www.beuth.de/de/norm/din-38407-42/137282966
DIN 38414-14 “German standard methods for the examination of water, waste water and sludge - Sludge and sediments (group S) - Part 14: Determination of selected polyfluorinated compounds (PFC) in sludge, compost and soil - Method using high performance liquid chromatography and mass spectrometric detection (HPLC-MS/MS)” https://www.beuth.de/en/standard/din-38414-14/142612398
The EU Drinking Water Directive EU 2020/2184 (DWD) includes PFAS as a parameter for surveillance, with a maximum parametric limit value of 0.10 μg/L for the sum of 20 selected PFAS. These include both PFCA and PFSA with chain lengths ranging from four to thirteen carbon atoms. To meet these criteria, the DG Environment of the European Commission has tasked the IWW (Rheinisch-Westfälisches Institut für Wasser) with developing a new standardized method (DIN CEN/TC 230, entry nr. 14) for the targeted analysis of these 20 PFAS in drinking water using liquid chromatography/tandem-mass spectrometry (LC-MS/MS).
The developed method allows for the analysis of the 20 PFAS listed in point 3 of Part B of Annex III of the DWD. An existing issue with available DIN methods was the inability to detect long-chain PFAS (e.g., PFCA with x ≥ 7 and PFSA with x ≥ 6, where x is the number of perfluorinated C-atoms in the chain) with sufficiently low detection limits, as these substances may distribute to water/vessel and water/air interfaces. This method addresses this challenge by enabling the detection of long-chain PFAS with low detection limits. The interference issues arising from the geometry and material of sample vessels can be mitigated by minimizing sample surface, such as using narrow vessels with a small surface area. This method, currently under validation, offers a limit of quantification (LOQ) of 1 ng/L for many relevant substances. It is designed for both direct injection and solid-phase extraction (SPE) and primarily focuses on drinking water. While the method's applicability to other types of water, such as fresh waters (e.g., ground and surface water) or treated wastewater, has not been validated due to time constraints, ongoing validation efforts are expected to conclude by the end of 2023. The method is anticipated to be easily adaptable by commercial and reference laboratories.
The CEN working group is working on the standardisation of a standard method for the analysis of PFAS in soil, sediment, sludge, and waste by HPLC and mass spectrometry. A draft document is written and at the end of 2023 a first ring trial will be done. Next year, the data will be evaluated, and extra actions will be taken if needed (based on the outcome of the ring trial).
Table 2: Overview on analytical standard methods for the targeted determination of PFAS in various media by LC-MS/MS (expanded from the list on analytical methods prepared by ITRC https://pfas-1.itrcweb.org/).
Entry No. | Method | Media | Validation Status | Method Type (Sampling, Preparation, Analysis) | Quantification limits |
1 | USEPA 537.1 | Drinking water | Multi-laboratory validated | Preparation and Analysis | LCMRL: Range from 0.53 ng/L to 6.3 ng/L, depending on analyte |
2 | USEPA 533 | Drinking water | Multi-laboratory validated | Preparation and Analysis | LCMRL: Range from 1.4 ng/L to 13 ng/L, depending on analyte |
3 | USEPA SW-846 Method 3512 and 8327 | Surface water, groundwater, and wastewater | Multi-laboratory validated | Preparation (3512) and Analysis (8327) | Not provided |
4 | USEPA 1633 (Draft) | Aqueous, Solid, Biosolids, and Tissue | Single laboratory validated | Preparation and Analysis | Not specified |
5 | DoD AFFF01 | AFFF Concentrates | Multi-laboratory validated | Sampling, preparation, and analysis | LOQ of < 25 ppb for PFOA and PFOS each |
6 | ISO 21675 | Unfiltered drinking water, groundwater, and surface water | Multi-laboratory validated | Preparation and Analysis | ≥ 0.2 ng/L as LoQ can be achieved |
7 | ISO 25101 | Unfiltered drinking water, groundwater, surface water, and wastewaters containing less than 2 g/L solid particulate material | Multi-laboratory validated | Preparation and Analysis | Reporting Limit: 2.0 ng/L PFOS and 10 ng/L PFOA |
8 | ASTM D7979-20 | Water sludge, influent, effluent, and wastewater | Multi-laboratory validated | Preparation and Analysis | MDL (ng/L) = 0.7 (PFTrDA) – 4.6 (PFBA, PFPeA), 47.2 (FDEA), 92.9 (FHEA), 106.8 (FOEA) |
9 | ASTM D7968-17a | Soil | Single laboratory validated | Preparation and Analysis | Reporting limit: Ranges from 25 ng/kg to 750 ng/kg, depending on analyte |
10 | FDA CAM Method: C-010.01 | Food (Bread, Lettuce, Milk, and Fish) | Single laboratory validated | Preparation and Analysis | Not specified |
11 | CDC: 6304.09 | Blood Serum | Single laboratory validated | Preparation and Analysis | Limit of Detection: 0.1 ng/mL |
12 | CEN/TS 15968 | Coated and impregnated solid articles, liquids and firefighting foams | Validated (no further information) | Preparation and Analysis | 0.5 µg/L PFOS in extract |
13 | CEN/EN 17681-1 | Textiles and textile products | Validated (no further information) | Preparation and Analysis | PFOA and PFOS LOQ = 2 µg/kg |
14 | DIN CEN/TC 230 (Draft) | Drinking water | Ongoing | Preparation and Analysis | LOQ: 1 ng/L |
15 | ISO 23702-1 | Leather | Multi-laboratory validated | Analysis | LOQ (PFOS): 0.2 mg/kg |
16 | DIN 38407-42 | water, waste water and sludge | Multi-laboratory validated | Preparation and Analysis | The lower limit of application is 0,01 μg/L, or 0,025 μg/L for treated waste water |
17 | DIN 38414-14 | sludge, compost and soil | Multi-laboratory validated | Preparation and Analysis | LoQ: 10 µg/kg |
Table 3: Overview on PFAS analytes that can be determined by the respective standard LC-MS methods.
Compound | CAS number | USEPA 537.1 | USEPA 533 | USEPA SW-846 Method 3512/8327 | USEPA 1633 (Draft)* | ISO 25101 | ISO 21675 | ASTM D7979-20 | ASTM D7968-17a | FDA CAM Method: C-010.01, Version 2019 | CDC: 6304.09 | CEN/TS 15968 | DIN CEN/TC 230 (Draft) | ISO 23702-1:2018 (Part 1) | DIN 38407-42:2011 | DIN 38414-14 |
|---|---|---|---|---|---|---|---|---|---|---|---|---|---|---|---|---|
Perfluorobutanoic acid (PFBA) | 375-22-4 | X | X | X | X | X | X | X | X | X | X | X | ||||
Perfluoropentanoic acid (PFPeA) | 2706-90-3 | X | X | X | X | X | X | X | X | X | X | X | ||||
Perfluorohexanoic acid (PFHxA) | 307-24-4 | X | X | X | X | X | X | X | X | X | X | X | X | |||
Perfluoroheptanoic acid (PFHpA) | 375-85-9 | X | X | X | X | X | X | X | X | X | X | X | X | |||
Perfluorooctanoic acid (PFOA) | 335-67-1 | X | X | X | X | X | X | X | X | X | X | X | X | X | X | |
Perfluorononanoic acid (PFNA) | 375-95-1 | X | X | X | X | X | X | X | X | X | X | X | X | |||
Perfluorodecanoic acid (PFDA) | 335-76-2 | X | X | X | X | X | X | X | X | X | X | X | X | X | ||
Perfluoroundecanoic acid (PFUnDA) | 2058-94-8 | X | X | X | X | X | X | X | X | X | ||||||
Perfluorododecanoic acid (PFDoDA) | 307-55-1 | X | X | X | X | X | X | X | X | |||||||
Perfluorotridecanoic Acid (PFTrDA) | 72629-94-8 | X | X | X | X | X | X | X | ||||||||
Nonafluoro-3,6-dioxaheptanoic acid (NFDHA) | 151772-58-6 | X | X | |||||||||||||
Perfluoro-3-methoxypropanoic acid (PFMPA) | 377-73-1 | X | X | |||||||||||||
Perfluoro-4-methoxybutanoic acid (PFMBA) | 863090-89-5 | X | X | |||||||||||||
Perfluorotetradecanoic acid (PFTeDA) | 376-06-7 | X | X | X | X | X | ||||||||||
Perfluorohexadecanoic acid (PFHxDA) | 67905-19-5 | X | ||||||||||||||
Perfluorobutane sulfonic acid (PFBS) | 375-73-5 | X | X | X | X | X | X | X | X | X | X | X | X | |||
Perfluoropentane sulfonic acid (PFPeS) | 2706-91-4 | X | X | X | X | X | X | |||||||||
Perfluorohexane sulfonic acid (PFHxS) | 355-46-4 | X | X | X | X | X | X | X | X | X | X | X | X | X | ||
Perfluoroheptane sulfonic Acid (PFHpS) | 375-92-8 | X | X | X | X | X | X | X | ||||||||
Perfluorooctane sulfonic acid (PFOS) | 1763-23-1 | X | X | X | X | X | X | X | X | X | X | X | X | X | X | X |
Perfluorononane sulfonic acid (PFNS) | 68259-21-1 | X | X | X | X | |||||||||||
Perfluorodecane sulfonic acid (PFDS) | 335-77-3 | X | X | X | X | |||||||||||
Perfluoro(2-ethoxyethane) sulfonic acid (PFEESA) | 113507-82-7 | X | X | |||||||||||||
Perfluorooctanesulfonamide (PFOSA) | 754-91-6 | X | X | X | X | X | ||||||||||
N-methyl perfluorooctane sulfonamidoacetic acid (NMeFOSAA) | 2355-31-9 | X | X | X | X | X | ||||||||||
N-ethyl perfluorooctane sulfonamidoacetic acid (NEtFOSAA) | 2991-50-6 | X | X | X | X | X | X | |||||||||
1H, 1H, 2H, 2H-Perfluorohexane sulfonic acid (4:2FTS) | 757124-72-4 | X | X | X | ||||||||||||
1H, 1H, 2H, 2H-Perfluorooctane sulfonic acid (6:2 FTS) | 27619-97-2 | X | X | X | X | |||||||||||
1H, 1H, 2H, 2H-Perfluorodecane sulfonic acid (8:2FTS) | 39108-34-4 | X | X | X | X | |||||||||||
N-Methyl perfluorooctane sulfonamidoethanol (NMeFOSE) | 24448-09-7 | X | X | |||||||||||||
N-Ethyl perfluorooctane sulfonamidoethanol (NEtFOSE) | 1691-99-2 | X | X | |||||||||||||
N-Methyl perfluorooctane sulfonamide (NMeFOSA) | 31506-32-8 | X | X | X | ||||||||||||
N-Ethyl perfluorooctane sulfonamide (NEtFOSA) | 4151-50-2 | X | X | X | ||||||||||||
Decafluoro-4-(pentafluoroethyl) cyclohexane sulfonic acid (PFecHS) | 67584-42-3 | X | X | |||||||||||||
2-perfluorohexyl ethanoic acid (FHEA) | 53826-12-3 | X | X | |||||||||||||
2-perfluorooctyl ethanoic acid (FOEA) | 27854-31-5 | X | X | |||||||||||||
2-perfluorodecyl ethanoic acid (FDEA) | 53826-13-4 | X | X | |||||||||||||
2H-perfluoro-2-decenoic acid (FOUEA) | 70887-84-2 | X | X | |||||||||||||
3-perfluoroheptyl propanoic acid (FHpPA) | 812-70-4 | X | X | |||||||||||||
2H-perfluoro-2-octenoic acid (FHUEA) | 70887-88-6 | X | X | |||||||||||||
Hexafluoropropylene oxide dimer acid (HFPO-DA) | 13252-13-6 | X | X | X | X | X | X | X | ||||||||
11-Chloroeicosafluoro-3-oxaundecane-1- sulfonic acid (11Cl- PF3OUdS) | 763051-92-9 | X | X | X | X | |||||||||||
9-Chlorohexadecafluoro-3-oxanonane-1- sulfonic acid (9Cl-PF3ONS) | 756426-58-1 | X | X | X | X | X | X | X | ||||||||
4,8-Dioxa-3H-perfluorononanoic acid (ADONA) | 919005-14-4 | X | X | X | X | X | X |
* Additional PFAS that can be analysed but are not in the table: PFDoS, 3:3 FTCA, 5:3 FTCA, 7:3 FTCA.
As previously stated, analysis via LC-MS represent the most reported method for commercial use in targeted PFAS analysis in the stakeholder consultation. The reported methods were usually based on other methods, such as USEPA 1633, DIN 38414-14, ASTM D7968-17a, ASTM D7979, CEN/TS 15968 and ISO 25101 (entry nr.4, 17, 9, 8, 12, and 7 respectively). All reported methods are expected to be suitable for additional matrices beyond the original intended matrix (including e.g. consumer products and other chemical products). Most respondents also elaborated, that their methods can either be extended to other non-volatile, non-polymeric PFAS beyond the initially planned PFAS. It was mentioned that the primary limitation when it comes to individual PFAS is rather the access to analytical reference standards. However, not all PFAS are suitable for LC analysis and differences in extraction efficiencies have to be taken into account.
The California Department of Toxic Substances Control reported on a LC-MS method which was originally intended for water (not further specified) but is suitable for a broad range of other matrices and applications (e.g. consumer products, textiles, food contact material, cosmetics, ski waxes, medical devices, electrical equipment, construction products, lubricants), except F-gases. It was assumed that the method can also be extended to more matrices. However, it was stated that the low molecular weight PFAS that are measurable by LC-MS are not commonly used as intentional ingredients in consumer products. In many types of consumer products polymeric PFAS are used intentionally and low molecular weight PFAS may be present as impurities, residuals, or by-products. Thus, positive detection of PFAS in a product using a sensitive LC-MS method does not necessarily disclose what type of PFAS were intentionally added to the product.
One commercial laboratory reported that they are using a modified DIN 38414-14 method. While this method was originally intended for soil and other environmental solids, the basic principle of a (alkaline) methanol extraction and LC-MS/MS analysis can be extended to a wide range of matrices (e.g. textiles, food contact material, metal plating, consumer products, cosmetics, medical devices and products, flame retardants and resins, construction products, lubricants, petroleum, and mining). However, the method is not always suitable for the whole article and matrix specific modifications need to be considered which are e.g., different clean-up procedures, interferences, influence on LOQ and the difference of sample amount vs. extraction volume.
One stakeholder from a national research institute reported that they use a LC-MS method originally intended for textiles, biota, human blood, dust and AFFF (not specified) for the analysis of food contact material, ski waxes, cosmetics, petroleum and mining applications. It was mentioned that for the determination of ionic PFAS an specific LC-MS/MS set up (LC triple Q
An LC-MS/MS (Liquid Chromatography-Tandem Mass Spectrometry) method with a triple quadrupole mass spectrometer, often referred to as LC-MS/MS triple quadrupole or LC triple Q method, is a powerful analytical technique used in chemical analysis, particularly in the fields of pharmaceuticals, environmental analysis, and biochemistry due to its sensitivity, selectivity, and ability to quantify multiple analytes in a single run. The triple quadrupole mass spectrometer consists of three quadrupoles arranged in series: Q1 (First Quadrupole): Selects the precursor ion from the ions generated in the ion source; Q2 (Second Quadrupole): Serves as a collision cell where the precursor ion is fragmented into product ions and Q3 (Third Quadrupole): Selects specific product ions for detection.
Furthermore, some respondents mentioned that new similar methods based on the reported ones are currently being developed.
One stakeholder from a research laboratory highlighted that LC-MS methods in general can only be used to quantify specific PFAS. Many PFAS substances may be missed because they need to be predefined. For example, polymeric PFAS will not be detected with this technique. However, LC-MS is assumed to be suitable for PFAS enforcement. For specific substances ppb concentration limits and a total sum of 250 ppb according to the EU restriction proposal can be achieved with this technique. It was stated that is has to be decided which PFAS should be included in the analysis for the total sum not exceeding 250 ppb. It should also be decided if a target analysis only or a combination with other methods (e.g. TOPA) should be taken into account.
Ongoing activities by research institutes
Just as for the established methods used by commercial laboratories, the targeted PFAS analysis methods reported in the stakeholder consultation by research laboratories are mainly based on LC-MS measurements as well. Many methods were developed during the HBM4EU
HBM4EU “Human Biomonitoring for Europe”, European biomonitoring project from 2016-2022, https://www.hbm4eu.eu/ .
Perfluorobutanoic acid (PFBA), one of the smaller carboxylic acids containing-PFAS, has only one major MS/MS transition, preventing the use of qualitative transitions for verification on low-resolution instrumentation.
One research laboratory reported a method to determine PFCAs and PFSAs in human serum and plasma (LOQ = 0.01–0.5 ng/mL) (Marra et al., 2020). It is assumed that the method can be extended to more PFAS and made be available to commercial laboratories, however highly equipped staff and equipment is needed. The laboratory is accredited for the analysis of PFAS in human serum according to ISO/IEC 17025 and participated in the intercomparison exercises. One challenge reported was the level of contamination of blanks. Another method was reported for the determination of PFCAs and PFSAs (i.e. PFPeA, PFBS, PFHxA, PFHpA, PFHxS, PFOA, PFNA, PFOS, PFDA, PFUndA) in human serum by UPLC-MS/MS followed a SPE sample preparation (LOQ = 0.1–0.5 µg/L). The laboratory participated in several ring tests within the HMB4EU initiative and other initiatives (e.g. Arctic Monitoring and Assessment Program (AMAP)). The main challenge which might limit a commercial use of the method was stated to be the ability to use UPLC-MS/MS instrument. Another method was developed for the determination of PFAS in human plasma and serum by LC-MS/MS after deproteinization of human plasma with acetonitrile (buffered at ph4) and SPE. The method was reported to be suitable for a broader range of PFAS analytes (i.e. PFHxA, PFHpA, PFOA, PFNA, PFDA, PFUnDA, PFDoDA, PFTriDA, PFTeDA, PFBS, lin-PFHxS, PFHpS, PFECHS, lin-PFOS, PFDS, FOSA, FOSAA, Methyl-FOSAA, Ethyl-FOSAA, 6:2 Cl-PFESA, 8:2 Cl-PFESA, HFPO-DA ("Gen-X"), ADONA) achieving a LOQ of 0.01 µg/L, however the determination of HFPO-DA in serum/plasma is challenging with higher LOD (0.1 µg/L). This method was also validated during HMB4EU and is assumed to be made available for commercial use if analytical reference standards, columns and commitment are available.
There were other methods reported that were used for more matrices next to human samples.
One method was reported for the analysis of PFCAs, PFSAs, PFECAs, PFESAs in water, AFFF, soil, biota and human serum using various sample preparation depending on the matrix (LOQ = 0.07–2.60 ppb). It was highlighted that matrices such as soil and food organics have a higher level of interference and matrix suppression than matrices such as serum. The biggest challenge is trying to find the best way to quantify PFAS that do not have a matching labelled internal reference standard. Results vary widely depending on which surrogate is chosen, and there are no 'rules' that will work across all PFAS (such as matching by retention time, or chemical structure).
Another respondent reported that they use different workflows for different matrices (food and feed, water, food contact materials, biota, abiotic environmental solids, human samples). For fruit and vegetables samples were prepared by clean-up with WAX SPE and LOQs were achieved up to 0.5 pg/g. A broad range of non-polar and polar PFAS (including ultra-short chain PFAS, C2 – C3) can be covered with this method (i.e. PFCAs, PFSAs, PFECAs, PFESAs, fluorotelomer alcohols, perfluoroalkylether non-polymers, telomer sulfonates, sulfonamides, phosphates and phosphinates). The analytes they are analysing per matrix is also deviating. It was stated that PFAS-analysis is challenging due to the large variety in compounds and matrix effects. Few issues are experienced in regard of selectivity though and it is expected that the method can be made available for commercial use if staff is trained to avoid contaminations and clean chemicals and materials are used. Another method was reported for the determination of PFCAs, PFSAs, PFECAs, polyfluoroalkyl-ether carboxylic acids and polyfluoroalkylether sulfonic acids in chemical products, water, air, waste, abiotic environmental solids, biota and human samples (LOQ = 0.5 µg/kg, internal reference standards are available for about 20 out of 40 of the analytes). A challenge which might limit commercial use was reported to be blank contamination.
Further, methods were reported with the focus on environmental samples (water, soil, sediments, biota). One stakeholder from a national Nordic institute reported a method for the analyses of PFCAs and PFSAs in ground/surface water, effluent wastewater, sediment, sludge and biota (fish meat, mussels, earthworms). LOQs are depending on the matrix (water: 0.1–2 ng/L, biota: 0.01–0.15 μg/kg, solids: 0.05–0.20 ug/kg). The respondent stated that PFAS impurity background of certain PFAS is still an issue to be resolved, but they are working on extending the method to more analytes and on a semi-automated system for sample preparation of water samples which should help in throughput. Another method was reported for the determination of PFCAs and PFSAs and substitutes (ADONA, GenX, 4:2 FTS, 6:2 FTS, 8:2 FTS) in food and feed following ion pair extraction and dispersive SPE (LOQ = 0.1–0.5 µg/kg in feed). PFBA could not be validated due to interference observed for PFBA.
Conventional approaches in PFAS compound analysis generally prioritize linear structures, overlooking the existence of branched structures resulting from diverse manufacturing processes. The identification of branched isomers often suggests electrochemical fluorination (ECF) manufacturing, whereas products from fluorotelomerization (FT) processes tend to exhibit a predominantly linear configuration (Charbonnet et al., 2021). Many branched PFAS isomers can be separated from their linear counterparts using LC and analysed using targeted methods. Neglecting to account for branched PFAS isomers in quantification can lead to underestimating their concentrations. However, it is important to note that reference standards for branched isomers are not readily available for all PFAS compounds. Ongoing research is exploring this area, and reviews are already available that provide insights into the distribution of branched PFAS in various environmental matrices (Schulz et al., 2020).
Recently, advancements have been made in enhancing the separation, verification, and identification of PFAS compounds by incorporating ion mobility as an additional separation step. While this methodology is still in the research phase, it holds promise for improving the detection of PFAS compounds and enhancing the separation of branched PFAS isomers (Yukioka et al., 2020).
According to bibliographic search, the measurement of PFAS in articles and chemical products still commonly use LC-MS methods. For instance, drinking straws were extracted either with 0.3% methanolic ammonium hydroxide or water (at 4 °C, 20 °C or 90 °C). They were paper, plastic or plant-based straws, and the results obtained using LC-MS/MS showed the presence of total PFAS ranging from 0.043 to 29.1 ng/straw, with no PFAS detected in plastic-based straws. The most frequently detected PFAS were PFCA (PFBA and PFOA) and PFSA (PFOS), and approximately two thirds of total extractable PFAS levels (in methanol) leached into water at all different temperatures tested (Timshina et al., 2021).
Food packaging were also evaluated for the presence of PFAS (PFCAs, PFSAs, FOSAs, FTOHs, PAPs and diPAPs), where pieces of 10cm x 10 cm were submitted to an extraction protocol with methanol and ultrasonication (50 °C, 45 min). After centrifugation, filtration (Nylon filter) and concentration, the instrumental analysis using UPLC-MS/MS showed a LOQ in the range of 0.20–15 ng/g, except for FTOHs (LOQ 22 – 152 ng/g). Among all packages tested (e.g., noodle bowl, wrapping paper, paper bag, cups), microwave popcorn packaging contained higher levels of PFCA (with PFOA at 223 ng/g) and FTOH (8:2 FTOH reaching 7373 ng/g) (Siao et al., 2022). Another study evaluated 1 g of paper and cardboard-based food contact material with a similar extraction procedure but using acetonitrile:water as solvent and 5 min of ultrasonication. The LOD was in a similar range, from 0.5 to 3 ng/g, without the detection of any of the 21 targeted PFAS (including PFCAs, PFSAs, PFOSA and 7:3FTA). The target analysis was performed with UPLC-HRMS (QExactive, data dependent MS2 mode) (Miralles et al., 2023). In an application note of Agilent (Dao et al., 2022), samples from leather and textiles (1 g and 100 cm2) were similarly extracted, with methanol and ultrasonic batch (60 °C, for 1 or 2 hours) and evaluated using LC-MS/MS, with an MDL of 0.3 to 3 ng/g.
A new LC-MS/MS method was recently proposed for the evaluation of neutral PFAS (four FTOHs and two FOSEs) in textiles samples. 1 g of sample was sonicated with methanol (30 min), followed and centrifugation and filtration. The mass transitions of these compounds were optimized, and the acetate adduct ion [M+CH3COO]- in negative mode was chosen as precursor, while the acetate ion [CH3COO]- were monitored as product ion. The LOQ for four FTOHs are in the range of 0.5~3.7 ng/mL, while lower LOQs were obtained for two FOSEs, at the range of 0.002 ng/mL (Dao et al., 2022).
Applying a single LC method for the analysis of compounds with a broad range of hydrophilicity is a common goal in several LC-MS method development studies. Mixed-mode liquid chromatography (MMLC, Obelisc N, composed of ion exchange mode and normal phase mode) was recently developed and tested for four sulfonates showing diverse aqueous mobility, including per and polyfluoro ones (TFMS (trifluoromethanesulfonate), PFBS and 2-ACO-DFEtS (2-(1-adamantanecarbonyloxy) −1,1- difluoroethanesulfonate)), with a LOD in the 4 –16 ng/L range. SPE method (WAX cartridges) proved to be necessary for samples of high inorganic content, significantly reducing the LOD to 0.02–0.06 ng/L. Although the method used a HRMS instrument (QExactive), the target analysis via parallel reaction monitoring (PRM) of the mentioned compounds was aimed (Niu et al., 2022).
The overcome the lack of sensitive methods for certain PFAS compounds, such as perfluoroalkanesulfonyl fluorides, which do not contain effective ionizable groups of chromophores, Bao et al. (2023) developed a method based on chemical derivatization with p-toluenethiol. The corresponding perfluoroalkane sulfonic acids of PFOSF (Perfluorooctane sulfonyl fluoride) and PFHxSF (perfluorohexane sulfonyl fluoride) were obtained and detected by LC-MS/MS, using acetonitrile as extraction solvent. With an LOD in the range of 0.07 ng/g, these compounds were detected in soils of a 2-years abandoned fluorochemical manufacturing facility in the range of 0.23 to 357 ng/g.
The development of a novel adsorbent for SPE of PFAS compounds was the objective of the study by Lin et al. (2023). They prepared magnetic fluorinated porous carbons via the carbonization and further fluorination of Fe-Zr bimetal-organic frameworks, resulting in an excellent adsorption performance and a low LOD in the 0.02–0.16 ng/L range. This dispersive SPE with high adsorption capacity and selectivity was applied to water and soil samples, which were further analysed by LC-MS/MS.
Efforts towards isomers separation in tandem mass spectrometry were also reported. The detection of short chains perfluoroalkyl ether carboxylic acids (PFECA), used as alternative due to phasing out of legacy PFAS, using LC-MS/MS includes the compounds PFMPA (perfluoro-3-methoxypropanoic acid) and PFMBA (perfluoro-4-methoxybutanoic acid). However, many methods do not monitor their branched isomers, PMPA (perfluoro-2-methoxypropanoic acid) and PEPA (perfluoro-2-ethoxypropanoic acid). Optimized transitions for PMPA (m/z 185 à 85) and PEPA (m/z 235 à 135), differing from the ones used for PFMPA (m/z 229 à 85) and PFMBA (m/z 279 à 85), were proposed and allowed to increase the sensitivity of these compounds, which were detected in water sampled near chemical manufacturing plants (Miller & Strynar, 2022).
For the measurement of the monohydrogen-substituted perfluoralkyl carboxylic acids (H-PFCAs) a weak anion exchange solid phase extraction-liquid chromatography tandem mass spectrometry method for the quantitative determination of H-FPCAs in surface water was developed, validated and applied to samples. For the short chain PFAS the method was improved by us of an ion-pairing agent (tetrabutylammonium hydrogen sulphate, TBAS). To improve the chromatographic separation, TBAS was added to the sample vial (5 ng/mL), the retention time and peak shape improved by the addition of TBAS. The detection limits ranged from 0.03 – 0.75 ng/mL (Awchi et al., 2022).
Hydrophilic Interaction Liquid Chromatography (HILIC)
Hydrophilic Interaction Liquid Chromatography (HILIC) is a specialized variant of liquid chromatography (LC) used for the separation and analysis of polar and hydrophilic compounds. Unlike traditional RP-LC, which is based on the hydrophobic interactions between nonpolar compounds and a hydrophobic stationary phase, HILIC relies on the retention and separation of polar and hydrophilic analytes using a hydrophilic stationary phase composed of polar or hydrophilic materials. The mobile phase is therefore mostly consisting of organic solvents with a high concentration of a water-rich buffer solution. The method is particularly useful for the separation of polar and hydrophilic compounds, which may be challenging to separate by traditional reverse-phase chromatography. It has found use in analysis of organic acids, carbohydrates, amino acids, peptides, nucleosides, and other polar molecules. It advantages are further the suitability of a wide range of polarities, and it can be used in various LC-MS applications. However, due to the optimization of the stationary and mobile phase, method development can be quite complex.
Established methods for commercial use
Routine laboratories often refer to one application note of Restek where a raptor column is used (Liang, 2021). The raptor column combines HILIC and anion-exchange retention mechanism together in a single ligand. The raptor column looks very promising for retention of the short chain PFAS (< C6), although, there are some limitations. There are differences between batches noticed and lack in performance between batches. Because of the anion-exchange mechanism the column is very sensitive to little pH changes which makes the method not robust and reliable (Liang, 2021).
Recently, a new mixed-mode anion-reverse phase chromatography column by Waters was made available (Atlantis Premier BEH C18 AX Column) (Organtini et al., 2023). Instead of working with an isocratic gradient elution, the separation is done with by varying pH over the gradient. Although the application note looks promising, in practice the pH of the gradient elution is difficult to control, and retention time shifts might occur. Also, the pH of the sample should be adapted according to the origin. This makes it difficult in practice because the origin is not always known and that makes it difficult to choose the right pH. The use of hybrid mixture chromatographic columns is not easy to implement by routine laboratories. Often, instruments should be dedicated to this type of measurements because of the long equilibration and conditioning time for this type of chromatographic columns, hampering the switch between different applications (e.g., reversed phase methods).
Recently, a draft method for measuring the short chain PFAS compound with LC-MS/MS was published in Flanders. A ring trial will be organized at the beginning of 2024 and after succeeding, the commercial labs have the accreditation for the analysis of the short chain PFAS compounds in water samples.
Ongoing activities by research institutes
The use of HILIC is mainly applied for the analysis of short-chain PFAS, which comprise compounds with a C1-C5 fluorinated carbon backbone. However, publications often mention the application to short chain PFAS when only the analysis of C3 compounds is performed (PFPrA or PFPrS) (Kim et al., 2022; Chow et al., 2021).
An online SPE LC-MS/MS method for the rapid and simultaneous quantification of 10 short- and ultrashort-chain PFAS (TFMS, PFPrS, PFBS, PFPeS, PFHxS, TFA, PFPrA, PFBA, PFPeA and PFHxA) was recently developed and optimized. The online SPE is based on a mixed-mode retention mechanism (weak anion combined with reversed-phase) which is ideal for simultaneously retaining anionic and hydrophobic analytes. The LOQs are in the range of 1 ng/L and for TFA in the range of 10 ng/L. The method was applied to water samples collected from a variety of natural, engineered, industrial, and commercial water systems. Ultrashort-chain PFAS were detected in every sample, including hydraulic fracturing water and wastewater samples and wastewater from electronic fabrication facilities, identifying previously unknown sources of ultrashort-chain PFAS (Jacob & Helbling, 2023). The same study showed structure-specific matrix effects for ultrashort chain PFAS when measured in negative mode HILIC ESI HRMS. It was hypothesized that shorter-chain PFCA and PFSA have a lower surface activity than longer-chain ones, resulting in greater ion suppression of the former during ESI in the presence of co-eluting inorganic ions. Therefore, the removal of inorganic ions should be considered when matrix effects are noticed.
The analysis of ultra-short-chain PFAS (≤C2 for PFCA, ≤3 for PFSA, and other PFAS) in water samples obtained from various sources of German drinking water utilized an Acquity Amide chromatography column (HILIC). For enrichment, trifluoromethanesulfonate (TFMS), tris-(pentafluoroethyl) trifluorophosphate (FAP), bis-(trifluoromethylsulfonyl)imide (NTf2), PFEtS, and perfluoropropanoate (PFPrA) were employed along with multilayer solid-phase extraction (mlSPE) as the extraction method. The mlSPE cartridges contained an anion exchange combined with a graphitized carbon black packing. The water sample's pH (200 mL) was adjusted to 5.5 using formic acid or ammonia solution. Cartridges were conditioned with a methanolic ammonia solution (5%), 1 mL of methanolic formic acid solution (2%), 1 mL of methanol, and 3 mL of water. After loading the samples onto the cartridge and allowing for drying, elution was carried out using 3 mL of methanolic ammonia solution (5%), 3 mL of methanolic formic acid solution (2%), and methanol. The resulting extract was concentrated and reconstituted in 1 mL acetonitrile:water (95:5 v/v).
In 39 out of 46 cases, the cumulative concentration of four ultra-short-chain PFAS (PFAS TFA, TFMS, PFPrA, and PFPrS) alone surpassed the EU DWD limit for "PFAS total" of 0.5 µg/L. This underscores the necessity for analytical methods targeting these highly mobile PFAS to ensure a comprehensive representation of the PFAS load in drinking water, rather than overlooking a substantial portion of it (Neuwald et al., 2022).
2.3.2 Total oxidizable precursor assay (TOPA)
- It is not a total PFAS method, it gives an idea of the PFAA precursors present in a sample.
- The precursor oxidation, is not specific, producing a broad range of intermediate PFAS transformation products PFAAs. Not only PFAAs are formed, also new classes of PFAS that are formed were identified by use of the suspect screening method.
- The oxidation process can produce ultrashort chain PFAS, such as TFA and PFPrA. If the ultrashort chain PFAS are not considered, this can lead to an underestimation of total concentration of precursors in the sample.
- Selectivity is missing; PFAS which contain ether functional groups may be resistant to oxidation or may produce oxidation products that are not typically measured by targeted PFAS methods (underestimated TOP assay values).
- Incomplete oxidation can occur.
- Interlaboratory studies show significant variabilities, this variability may be due to the fact that there is no standardized method available.
- Two target analysis are needed which makes the cost high (before and after reaction)
- Few commercial labs are using TOPA, it is more at the level of universities and institutes.
- Alternative assays are in development (Phototop, Total hydrolysable assay) but still under development.
- No standards or guidance are available yet, because of the robustness and because it gives only insights in the presence of precursors, it will be hard to implement and use the TOP assay into regulation.
The originally by Houtz & Sedlak (2012) developed Total oxidizable precursor assay (TOP assay or TOPA) method can be used to identify PFAA precursors through converting these PFAA precursors (e.g. fluorotelomers) into PFAAs via a hydroxyl radical based oxidation reaction. To obtain concentrations on PFAA precursors, the concentration of common target PFAS is measured before and after the oxidation using conventional targeted analysis methods like LC-MS. Thus, if PFAA precursors are present in the sample, the concentration of the respective PFAA increases after the oxidation reaction. The challenges of this method differ depending on when the oxidation process is performed. If it is performed prior to the sample extraction, pH can be affected or the matrix can react with the hydroxyl radicals, slowing down the reaction or leading to a non-quantitative reaction. If it is performed after the sample extraction, these matrix effects can be reduced, however some PFAA precursors may not be extracted from the sample and thus not be identified and analysed.
There are also different methods available to check whether the oxidation reaction is complete, by either adding 13C mass labelled precursors and see when the added precursor is consumed or by performing the analysis in duplicate with the second analysis being performed diluted by a factor of 10 and checking if the measured levels of PFAA between the original and diluted samples are the same.
This method can also be used when looking for legacy and emerging PFAS or unknown precursors for C2-C3 PFCA (Chen et al., 2019; Wang et al., 2020).
The indirect determination of precursors and therefore not being able to determine the chemical identity of the precursors is, next to being a labour-intensive method, one of the big drawbacks of this method.
In the stakeholder consultation three respondents provided information on TOPA, one was reported by a commercial laboratory, one by an agency and one from a research laboratory.
Established methods for commercial use
Currently there is no certified standard method for TOPA PFAS analysis available. However, some commercial laboratories offer TOPA as an addition to targeted PFAS analysis, especially for aqueous samples and AFFF.
One commercial laboratory reported that they are using TOPA based on a method developed by Houtz & Sedlak (2012). They stated that it was originally intended for soil and water samples but has been used for many more matrices or can be extended to further matrices (i.e. AFFF, textiles, paper, food contact material, metal plating, consumer products, cosmetics, flame retardants and resins and construction products). It was highlighted that in most cases the method won’t be quantitative but may provide valuable structural information given the nature of the precursors and/or side chain co-polymer. However, there were some challenges encountered which are problems with recovery, total oxidation, and competition effects from the matrix. Also, ultra-short PFAS (e.g. 4:2 and 6:2 telomers) are difficult to assess.
An agency representative stated that TOPA might be relevant for PFAS enforcement. However, no fluoropolymers can be measured by this method.
Ongoing activities by research institutes
One research lab also reported a PFAS analysis method based on TOPA. The method was validated (SANTE/3029) for PFCAs and PFSAs in the oxidation solution. It has a reported limit of quantification of roughly 2.5 μg/kg depending on the matrix. According to the respondent, the method can easily be made available for commercial labs, as the staff skill level needed is low and the laboratory equipment needed can be found in a standard equipped laboratory. The respondent stated that quantification of well-known end products is not a problem, but checking for complete oxidation is an issue as there are no applicable internal reference standards available at the moment. It was also reported that contamination marks the biggest obstacle of this method.
The total oxidizable precursor (TOP) assay serves as a selective surrogate analytical method for PFAS. This assay specifically targets compounds that can undergo oxidation to produce the desired perfluorocarboxylic acids (PFCAs). Originally developed by Houtz & Sedlak (2012), the TOP assay quantifies the overall quantity of chemical "precursors" to perfluoroalkyl acids (PFAAs) in a sample. This is achieved by comparing the concentrations of specific PFAAs before and after subjecting the sample to oxidation using an excess of hydroxyl radicals (Y. Shen et al., 2023).
A direct oxidation or direct TOP assay (dTOP) avoids an extraction discrimination by direct oxidation of a small aliquot of a soil sample with a high excess of a highly concentrated oxidation solution. Often an extraction is used and this can lead to higher detection limits and the major differences in the PFAS TOP assay method for aqueous and solid samples are related to sample preparation, matrix interference, detection limit, and calibration (Göckener et al., 2022).
The TOP assay as described by Heuckeroth et al. (2021) and Houtz & Sedlak (2012) is often used (without or small modifications) and applied to different kind of matrices e.g. treated landfill leachate and groundwater samples (Rehnstam et al., 2023), insecticides (Lasee et al., 2022), AFFF (Al Amin et al., 2021), serum (Cioni et al., 2022). The small adaptations to the original protocol were confirmed by the survey conducted by the Norman network (Alun, 2023). The survey showed that there was little continuity in the modifications made by the laboratories. Differing reaction times, reagent strength, heating methods and additional cleaning were used. Laboratories generally increased reagent strengths and decreased sample to liquid ratio (Alun, 2023).
Kaiser et al. (2021) used for the first-time ozone as oxidizing agent instead of the K2O2O8 oxidizing agent to estimate the total PFAS content in a WWTP effluent. Comparing the two TOP assays showed different outcomes might occur and this should be further investigated. Same conditions using the same matrix would be beneficial to evaluate the outcomes of both approaches accurately.
Important considerations when using the TOP assay include:
- The precursor oxidation is not specific, producing a broad range of intermediate PFAS transformation products PFAAs. Not only PFAAs are formed, also new classes of PFAS that are formed were identified by use of the suspect screening method (Shojaei et al., 2022). The distribution of the transformation products can vary based on the properties of the sample and oxidation conditions;
- The oxidation process can produce ultrashort chain PFAS, such as TFA and PFPrA. If the ultrashort chain PFAS are not considered this can lead to an underestimation of total concentration of precursors in the sample;
- Selectivity is missing; PFAS which contain ether functional groups may be resistant to oxidation or may produce oxidation products that are not typically measured by targeted PFAS methods (underestimated TOP assay values);
- Incomplete oxidation can occur due to the presence of co-contaminants in the sample matrix or the presence of natural organic matter that consume some of the oxidant, leading to an insufficient amount of chemical oxidant available to fully oxidize the sample;
- Interlaboratory studies show significant variabilities, this variability may be due to the fact that there is no standardized method available;
- Mass based concentrations are influence by both the amount present and the molecular weight of the chemical. Mole balances or mole yields have to be used to compare samples;
- The precursor transformation is complex and suggesting that the TOP assay and targeted PFAS methods not capture all the intermediates;
- During this degradation and oxidation process, the radicals randomly attack the non-C-F fragments first to initialize the oxidation, and subsequently attack the C-F skeleton to follow up the oxidation, which leads to the variations in the TOP assay products.
To overcome the above considerations, it is important to carefully review the quality assurance protocols and practices of commercial laboratories before selecting a vendor for the assay or to follow appropriate practices if conducting the assay in-house. It is also essential to consider the potential matrix effects that can impact the accuracy of the assay, as the presence of other background constituents (in the sample) can interfere with the measurement of PFAS precursors. It is useful to collect physicochemical data about the samples before analysis, including information on salinity, organic carbon content, and pH. These measurements can offer indirect insights to elucidate data variability and verify the intricate nature of the oxidation process. The use of matrix-spiked reference standards and internal reference standards can also help to address these matrix effects. Finally, the TOP assay may be used for estimating the presence of PFAS precursors at the environmental sites when careful consideration of sample collection, analysis, and quality assurance practices is performed for accurate and reliable results (Ateia et al., 2023).
One of the advantages of the TOP assay is its compatibility with the same analytical instrumentation utilized in targeted analysis, which renders it more accessible to laboratories, as they do not need to invest in additional instrumentation (Ateia et al., 2023). Another advantage is that the TOP assay can be used together with an app-based smartphone sensor as a pre-screening tool (Al Amin et al., 2021).
The typical sample preparation procedure aligns with that employed in targeted LC-MS/MS analysis. However, selectivity is constrained to compounds capable of oxidation, forming PFAS resistant to hydroxyl radicals and suitable for LC analysis. This selectivity relies on the compounds measured in targeted analysis, which means precursors oxidizing into unmonitored PFAS may go undetected. Additionally, inconsistent and low recoveries can result in false negatives. The identification of precursors in a mixture is often challenging, extending only to general observations (e.g., "PFOA precursors"), given the complexity and nonspecific nature of transformation processes (McDonough et al., 2019). Achieving a reproducible extent of conversion is difficult, as a limited oxidant quantity may be consumed by other sample compounds, hindering the oxidation of target compounds. This interference can impact the identification of precursors and the accurate quantitation of concealed PFAS (Nikiforov, 2021).
It is important to carefully review the quality assurance protocols and practices of commercial laboratories before selecting a vendor for the assay or to follow appropriate practices when conducting the assay in-house. It is also essential to consider the potential matrix effects that can impact the accuracy of the assay, as the presence of other background constituents in the sample can interfere with the measurement of PFAS precursors. The use of matrix-spiked reference standards and internal reference standards can also help to address these matrix effects. The TOP assay does not take into account the site-based oxidation potential. These limitations likely restrict the application of the TOP assay data (Al Amin et al., 2021; Ateia et al., 2023).
Round robin tests, interlaboratory comparison studies, and systematic robustness studies serving as the foundation for a standard are not only limited but also frequently concentrate on aqueous matrices. An interlaboratory study was carried out, and the outcomes of this comparison underscore the necessity for additional standardization of diverse TOP assay methodologies (Göckener et al., 2022).
The interpretation of TOP assay data varies significantly based on whether it is employed for research or regulatory purposes. In research, the data derived from the TOP assay can furnish valuable insights into sample contamination, guiding further analyses for a more comprehensive understanding of the issue. Conversely, when used for regulatory purposes, caution must be exercised in interpreting the data due to its potential far-reaching implications. If the TOP assay is integrated into regulatory processes, there is a crucial need for scientific consensus on the permissible interpretation of TOP assay data and the regulatory measures that can and should be derived from it. Despite the inherent limitations of the TOP assay, it serves as a valuable tool for obtaining an initial overview of potential PFAS risks in soil, groundwater pollution, and contamination of food and feed (Göckener et al., 2022).
The efficacy of the TOP assay is significantly influenced by operational conditions and the matrices under analysis. There is an urgent need for a standardized protocol at the international (ISO) or European level (CEN) to guarantee the comparability of results across various laboratories (Göckener et al., 2022).
Recently, deviations of the TOP assay were developed; the photoTOP assay and total hydrolysable precursor (THP) assay can be used directly on products (e.g., textiles). These techniques by Jonathan Zweigle et al. (2023) and Nikiforov (2021) are discussed in the next sections.

Figure 9: Schematic illustration of a textile containing an acrylate C6-based side-chain fluorinated polymer (SFP) and the respective end products of dTOP, PhotoTOP, and total hydrolysable precursor (THP) assay and EOF and TF analyses. Reprinted with permission from Jonathan Zweigle et al. (2023).
PhotoTOP assay
Zweigle, Bugsel, Capitain, et al. (2022) explored the use of photocatalysis (UV/TiO2) as a total oxidizable precursor approach (PhotoTOP) for characterizing perfluoroalkyl acid precursors through their conversion to PFCAs. The investigation should include an examination of the temperature's impact on chain shortening. Notably, this approach eliminates the need for salts, enabling direct injection with liquid chromatography-mass spectrometry, thereby bypassing time-consuming and potentially biased sample clean-up procedures. OH radicals were monitored using OH probes to assess reactivity. For eight distinct precursors (diPAPs, FTSAs, FTCAs, N-EtFOSAA, PFOSA), a mass balance was achieved within 4 hours of oxidation, and complete conversion was attainable in the presence of matrix. When applied to two PFAS-coated paper samples and technical PFAS mixtures, the PhotoTOP method qualitatively predicted the precursor chain length due to its milder conditions. The method was further applied to an unidentified fabric sample and a polymer mixture (with no detectable PFAS in extracts), revealing the presence of side-chain fluorinated polymers based on the generated PFCAs (Zweigle, Bugsel, Capitain, et al., 2022).

Figure 10: Principle of the PhotoTOP assay. Reprinted with permission from Zweigle, Bugsel, Capitain, et al. (2022). Copyright 2022 American Chemical Society.
Total hydrolysable precursors (THP)
When exploring available PFAS databases, it becomes evident that a significant portion of patented organofluorine compounds are derivatives of simple PFAS containing an oxygen link, such as polymers with fluorotelomer side-chains. These typical ester C-O bonds are known to undergo hydrolysis. Utilizing hydrolysis followed by targeted PFAS analysis can serve as an alternative or complementary method for assessing concealed PFAS. Hydrolysis offers several advantages, including the use of excess hydrolysis, the selective hydrolysis of specific chemical bonds (allowing differentiation between FTOH, PFCA, and PFSA derivatives), preservation of the original length of the perfluorinated chain, minimal risk of false positives, and compatibility with labelled reference standards. The hydrolysis process occurs under relatively mild basic conditions, although elevated temperature is required, and one or two hours may be insufficient for complete conversion.
Various types of organic solvents or mixtures can be employed, as long as they dissolve alkali, remain stable under reaction conditions, and facilitate convenient work-up after hydrolysis. In the hydrolysis of textile samples, 0.5 mL of 1M NaOH was added to approximately 30 mg of the textile sample. After the addition of internal reference standards, the vial was sealed, shaken, and placed in a heater, maintained at 60 °C overnight. Following a 16-hour incubation, the samples were cooled to room temperature. After precipitation, a portion of the clear upper layer was transferred to another vial. TBME (tert-butyl methyl ether) and n-hexane were added, followed by 2 mL of water. Although the organic layer remained in an emulsion, the bulk aqueous layer was removed, and Na2SO4 was added to the organic layer until it cleared. The analysed by GC-MS in positive chemical ionization (PCI) mode.
The FTOHs (6:2 FTOH, 8:2 FOH, and 10:2 FTOH) were measured before and after hydrolysis. Post-hydrolysis, the three FTOHs exhibited an increase of more than 500 times. The method unveiled the presence of an 8:2 FTOH precursor (accompanied by smaller amounts of 6:2 and 10:2 FTOH precursors) in total amounts of up to 1.3 mg/g or 0.3 g/m2. Typical limits of detection were 0.1 µg/g for the individual FTOHs. The expansion of the method to a broad range of precursors beyond FTOH esters will be the focus of future investigations (Nikiforov, 2021).
2.3.3 Gas chromatography - Mass spectrometry (GC-MS)
Gas Chromatography-Mass Spectrometry (GC-MS) is an analytical technique used to separate, identify, and quantify volatile and semi-volatile compounds in complex mixtures. In GC-MS, a gaseous sample is injected into a chromatographic column, where it is separated based on its chemical properties and affinity for the column's stationary phase. The separated compounds are then introduced into a mass spectrometer, where they are ionized and analysed based on their mass-to-charge ratio (m/z), by subjecting them to a magnetic field. The resulting spectrum provides information about the mass and abundance of ions in the sample. Targeted GC-MS measurements are especially helpful for the analysis of volatile and low mass PFAS, where electron impact (EI) and chemical ionization (CI) are two common ionization methods, though the latter was shown to be widely used for the PFAS analysis. Recent application of GC-HRMS for NTA of PFAS was reported, focusing on the construction of a GC-HRMS spectral database of PFAS compounds and development of a data evaluation workflow (Casey et al., 2023; MacNeil et al., 2022), which are further addressed in section 2.2.
Established methods for commercial use
The first standard method of CEN is now available since 2022 for targeted analysis of PFAS in textiles and textile products. It describes that a combination of targeted analysis using LC (CEN/EN 17681-1, see section 2.3.1) and GC (CEN/EN 17681-2-09, Table 4) as the most suitable approach. It also describes a standard method for the extraction of the PFAS. It is unclear if the same method could be applicable for chemical products (substances and mixtures such as ski waxes, firefighting foams, lubricants, etc.).
Table 4: Overview on analytical standard methods for the targeted determination of PFAS in various media by GC-MS.
Method | Media | Validation Status | Method Type (Sampling, Preparation, Analysis) | Quantification limits |
CEN/EN 17681-2 | Textiles and textile products | Validated | Preparation and analysis | 250 μg/kg (LOD: 100 μg/kg) |
Using the standard method CEN/EN 17681-2 the following PFAS can be analysed: PFOA, its salts and PFOA related compounds, like alkyl esters of PFOA (methyl and ethyl); and fluorotelomer acrylates (6:2 FTA, 8:2 FTA, 10:2 FTA) and fluorotelomer methyl acrylates (6:2 FTMA, 8:2 FTMA).
The California Department of Toxic Substances Control reported on a GC-MS method applicable for all matrices questioned
Textiles, leather, carpets, food contact material, metal plating, consumer products, ski way, cosmetics, F-gases, medical devises, medical products, electric and electronic equipment, energy sector, Transport, Flame retardants and resins, construction products. Lubricants and petroleum and mining.
Ongoing activities by research institutes
The development of GC-MS analysis of PFAS focuses primarily on improving sampling and sample extraction procedures for volatile and/or neutral PFAS. Most studies have focused on air samples, although some efforts have been made for the analysis of water samples.
Analysis of PFAS in both the particulate and gaseous phases of an air sampler, comprising quartz fibre filters (QFFs), polyurethane foam (PUF), and artificial activated charcoal (GAIAC™), revealed a distinct partitioning among various fractions. Perfluoroalkane sulfonamido ethanols (FOSEs) predominantly resided in PUF, while other neutral analytes were primarily concentrated in GAIAC™. Overall, nearly all target analytes were effectively captured in GAIAC™. The GC analysis utilized a DB-WAX column, with the MS ion source operating in EI mode. The method LOQ was in the range of 0.030 to 0.16 pg/m3 (Wu et al., 2021).
The analysis of seven PFAS (6:2 FTOH, 8:2 FTOH, 10:2 FTOH, NMeFOSA, NEtFOSA, NMeFOSE, NEtFOSE) in PUF matrices was also performed in air samples from Pearl River Delta, employing DB-WAX column with CI mode and achieved a LOD of 0.20 to 0.81 pg/PUF (P. Shen et al., 2023).
The development of a passive detection tool composed of polyethylene (PE) sheets of different thickness was proposed to sample indoor air previously to GC-MS measurements in CI mode (Morales-McDevitt et al., 2021). Nine PFAS were analysed, like the study from Shen, Song et al. 2023, with the inclusion of 8:2FTAcr and 10:2FTAcr. The equilibrium partitioning of neutral PFAS between PE and air was reached after 14 days and the sheet of 50 µm PE was preferred due to the easier detection.
Turnout gear layers were also studied for the presence of volatile PFAS. In total, nine PFAS (6:2, 8:2, 10:2, and 12:2 FTOH, NMe- and NEtFOSE, 8:2 and 10:2 FTA, and 6:2 FTMA) were detected by GC-MS following a simple extraction procedure of methanol extraction of fabrics (Muensterman et al., 2022).
The determination of volatile PFAS in water using GC-MS/MS was performed following two innovative approaches of sample extraction: in situ-SPE or ‘Purge and trap’ (P&T) extraction. The former, using a combination of SPE-WAX (ion exchange material) + ACFF (activated charcoal fibre filter), enables the simultaneous extraction of both anionic and neutral PFAS from water samples and acceptable results for FTOHs (4:2, 6:2, 8:2 and 10:2). The P&T extraction using ACFF showed acceptable recoveries of seven PFAS (FTIs: 6:2, 8:2, and 10:2, and FTOHs: 4:2, 6:2, 8:2, and 10:2). However, NMeFOSA, NEtFOSA, NMeFOSE, and NEtFOSE seemed not suitable for P&T extraction. Using this method, detectable levels of 6.8 ng/L of 6:2 FTOH, 20 ng/L of 8:2 FTOH, and 27 ng/L of 10:2 FTOH were found in water samples (Taniyasu et al., 2022).
The development of derivatization methods to allow the detection of ionic PFAS using GC-MS was recently shown. PFHpA, PFOA and PFNA, were derivatized with two types of aromatic compounds containing bromomethyl group, i.e., 2-(bromomethyl)naphthalene (BMN) and benzyl bromide (BB), and a soft ionization method (ultraviolet femtosecond laser (267 nm)) followed by GC-TOFMS was applied. The BB showed superior GC separation and detection limits around 8.0 ng/mL, still considerably high compared to required reporting limits at the ng/L level for water samples (Wen et al., 2021).
Diphenyl diazomethane was also tested for the quantitation of C2−C14 PFCAs in aqueous matrices (Ye et al., 2023). A complete derivatization was obtained in less than 1 min, and the samples were then submitted to a SPE procedure. The retention and separation of C2/C3 PFAS was obtained using H2 carrier gas, and a limit of detection from 0.06 (C4-C14) to 14.6 (C2/C3) ng/L was achieved. The higher LOD of C2/C3 was shown to be a result of high levels of systematic contamination in the laboratory.
Ionic and neutral PFAS in ambient air were sampled using different sorbent tubes and directly evaluated using thermal desorption-GC-MS (TD-GC-MS), without derivatization. The TD unit offer the possibility of removing the water accumulated in the sorbent previously to thermal desorption of PFAS (PFCA of C1 to C14, FTOH (4:2, 6:2, 8:2 and 10:2), FTA, NMeFOSA), and allow samples to be split and re-collected onto a clean sorbent tube, allowing the re-analysis (e.g. TD100-xr, Markes International). The TD-GC-MS methods presented a detection limit below the 50 pg/m3 (Miles et al., 2023; Miles et al., 2022).
The majority of GC-MS methods employ mass-labelled internal reference standards for quantifying FTOHs. A recent study has drawn attention to the interference of these internal standards with the signal of non-labelled compounds, leading to false positives. This interference is ascribed to deuterium or hydrogen abstraction of mass-labelled reference standards and can be mitigated through measures such as blank subtraction, reducing mass-labelled reference standard concentrations, or opting for alternative mass-labelled reference standards (Cahuas et al., 2022).
The analysis of F-gases in air samples was also performed using thermal desorption-GC-MS. Specifically, perfluoroisobutene analysed by TD-GC-MS needed to be first derivatized with 3,4-dimercaptotoluene to avoid its degradation under thermal desorption condition and improve their retention in the chromatographic column. Quantification of perfluoroisobutene was possible in the range of 0.13–152 ppb. An attempt to detect carbonyl fluoride by direct analysis was also shown, but only possible for high concentrations and presented poor linearity. Attempts to derivatize this gas formed the same derivatization product as phosgene, resulting in an ambiguous identification. Further studies are needed to explore other unambiguous analytical techniques to discriminate low levels of those species in air samples (Wingfors et al., 2022).
For the analysis of TFA, 19 mL of the sample was mixed with 500 µL ammoniumcarbonate (1M) and 50 µL internal standard (IS chlorodifluoroacetic acid) in a 20 mL headspace vial. The mixture was evaporated to dryness. After cooling, 4 mL of derivatization solution (75% sulfonic acid (9M) + 25% methanol) was added and the vial was closed. The extract was measured with a GC-MS system. The used column was a Phenomenex ZB624 column. TFA was measured in the highest concentration in drinking water production and show that regulation in the form preventive measures is required to manage them (Neuwald et al., 2022).
2.3.4 Pyrolysis - Gas chromatography - Mass spectrometry (pyr-GC-MS)
Pyr-GC-MS is a conventional technique for the bulk characterization of polymers. Volatile compounds generated by pyrolysis are analysed by mass spectrometry and used to identify the nature and elucidate the structure of fluorinated polymers. Fluorinated polymers are all polymers for which one or more of the monomer unit contains fluor, in the backbone and/or side chains, and they can be divided into side-chain fluorinated polymers (SFP), fluoropolymers, and perfluoropolyethers (Buck et al., 2011). Fluoropolymers consist of a polymeric carbon backbone with fluorine atoms (F) bound to carbon, e.g., polytetrafluoroethylene (PTFE), and are the most used fluorinated polymer. Side-chain fluorinated polymers (SFP) comprise of a polymeric hydrocarbon backbone of variable composition (e.g., acrylate and/or methacrylate, urethane, and oxetane) with poly(or per)fluoroalkyl side chains. Perfluoropolyethers consist of hydrocarbon backbones, with fluorine atoms directly bond to it, separated by oxygen atoms. Under environmental conditions, fluorinated polymers might degrade, releasing smaller PFAS.
Established methods for commercial use
To the best of our knowledge, this method is not currently being used commercially for the determination of PFAS.
Ongoing activities by research institutes
Pyr-GC-MS analysis was applied to characterize the composition of consumer products materials when it involved fluorinated polymers. For instance, different layers of firefighter turnout gear were evaluated to differentiate fluoropolymer films from textiles layers finished with SFP, with a pyrolysis at 600 °C (Muensterman et al., 2022). As a result, moisture barrier layers comprised a PTFE film, while outer and thermal layers comprised aromatic polyamide-based fibres (aramid) treated with SFP and had lower levels of individual non-volatile and volatile PFAS (Muensterman et al., 2022). The distinction between 3 different SFP in textiles was recently done in a study from Skedung et al. (2023). Three SFP-coated polyamide textiles were chosen as reference and showed a more complex chromatograms than the ones obtained with single PFAS, with pyrolysis at 700 °C. The major fluorinated peaks generated from SFP pyrolysis elute early, between 1–2 min. They recommend the use of reference standards and the detection of at least 3 ions eluting at the same RT to confirm the presence of SFP in a sample. The m/z 131 is recommended as a first step in screening for SFPs in textiles. The same study detected PTFE in cookware, dental products, and electronics at concentrations of 0.1–0.2 wt%. For PTFE, a single chromatographic peak at 1.3 min was noticed, and the main difference from this polymer to single PFAS pyrolysis was the presence of ions with m/z 100 ([C2F4]+), m/z 50 ([CF2]+) and 150 ([C3F6]+), which is consistent with findings from Muensterman et al. (2022). These ions are also generated from other fluoropolymers, such as PFA and FEP. Therefore, signal at 1.3 min from m/z 50, 100, and 150 should be considered a general indicator for the occurrence of PTFE and its co-polymers (Skedung et al., 2023). According to this study, the 50 ppm restriction limit suggested in the recent PFAS restriction proposal appears to well distinguish textiles containing SFP-treatments from PFAS-free treatments.
The elemental detection of fluorine has also been performed using pyr-GC-plasma-assisted reaction chemical ionization (PARCI)-MS at a single fibre level from fluorinated coatings under forensic purposes (Dolan et al., 2021). This was particularly interesting for the analysis of fibre surface, because the use of pyr-GC-MS analysis results in a substantial portion of the pyrolysates originating from the fibre core. Thus, analytical challenges are encountered when detecting ions specific to the thin fibre surface when working with pyr-GC-MS. In the case of textiles and other coated materials, where the surface is normally fluorinated, weight-based concentrations can be strongly influenced by fabric density. Therefore, manufacturers could opt for higher density base materials to comply with established limits. As proposed by Skedung et al. (2023), the creation of area-based concentration limits, in addition to the existing weight-based limits, is a necessary approach.
2.3.5 Supercritical-fluid-chromatography - mass spectrometry (SFC-MS)
Supercritical-Fluid-Chromatography (SFC) utilizes, as the name states, a supercritical fluid, typically carbon dioxide (CO2) in the supercritical state, as the mobile phase. In this state CO2 exhibits properties of both gases and liquids, making it an efficient solvent for a wide range of compounds. Its polarity in chromatographic processes is equal to that of hydrocarbons such as n-hexane as used in standard LC. SFC is particularly useful for analysing non-volatile, thermally labile and less polar compounds, which may not be suitable for traditional LC or GC. A mass spectrometry that if often coupled with these systems is Quadrupole-time-of-flight (QTOF), which is a combination of mass spectrometry methods. The quadrupole component selectively filters and detects ions based on their mass-to-charge ratio using four parallel rods, which create a radiofrequency field. The time-of-flight component measures the time it takes for ions to travel certain distances in an electric field. Coupling these two methods with the chromatography component thus creates a strong hybrid technique for analysis especially for compounds, which might be challenging to analyse using traditional techniques.
Established methods for commercial use
To the best of our knowledge, this method is not currently being used commercially for the determination of PFAS.
Ongoing activities by research institutes
One research laboratory reported a targeted Supercritical-fluid-chromatography-quadrupole-time of flight-mass spectrometry (SFC-QTOF-MS) method. A main advantage of SFC is that it increases the ionization efficiency for low-molecular-weight micropollutants (m/z < 300 Da) by a factor 2 to 87 times, which significantly improved the mass spectra for identifying very polar compounds. The method was developed for very water-soluble compounds/PFAS (generally very mobile and ionic compounds), like for the conventional LC-MS methods, it needs a specific sample preparation, which includes double SPE sample preparation and water evaporation to enrich the samples. With these characteristics the method is still in ongoing development for groundwater (Tisler et al., 2022) and wastewater (Tisler et al., 2023) analysis. However environmental, biota and human matrices are also to be included as possibilities. As of now the stakeholder reported, that it will not easily be possible to make the method available for commercial use, due to the specific instruments and highly skilled and trained staff needed to perform this analysis. Currently no information could be obtained on the LOQ or LOD of this method as well as its validation or standardization status.
A novel green analytical strategy (in this context, "green" means using less solvents), characterized by the use of fewer solvents, has been pioneered by Li et al. (2021) for the analysis of 10 perfluorinated compounds (PFAS). This approach incorporates supramolecular solvent (SUPRAS)-based extraction and ultra-high performance supercritical fluid chromatography (UHPSFC)-tandem mass spectrometry. The formation of positively charged complexes, achieved through charge complexation of PFAS analysis with a dicationic ionic liquid (DIL) reagent, led to enhanced ionization efficiency and analytical sensitivity. In the positive ionization mode, the signal intensity was magnified by one to two orders of magnitude compared to the negative ionization mode, and this improvement was attained without using the dicationic ion-pairing reagent.
The developed protocol was applied to analyse real textiles and six samples of actual food packaging materials. Measurements using the newly developed technique and the conventional LC-MS/MS technique both confirmed the presence of PFDoA and PFOA. The typical LOQs ranged between 0.2 and 3.2 µg/kg for the SUPRAS-based extraction system coupled with SFC. However, the utilization of the SUPRAS-based extraction with SFC is not a commonly employed routine methodology, and its integration into commercial laboratories may pose a challenge (Li et al., 2021).
Short chain PFAS (C1-C4) were measured and detected in surface snow (by use of SFC-MS/MS) on the island of Spitsbergen in the Norwegian Arctic during January–August 2019. The samples were extracted by weak anion exchange SPE, after evaporation and addition of internal reference standards, the extracts were injected into an SFC-MS/MS. Trifluoroacetic acid (TFA), perfluoropropanoic acid (PFPrA), perfluorobutanoic acid (PFBA), and trifluoromethane sulfonic acid (TFMS) were detected in most samples. Very low LOQ’s were obtained, ranging from 0.002 – 0.009 ng/L (Björnsdotter et al., 2021).
An Ultra-High Performance Supercritical Fluid Chromatography coupled with tandem Mass Spectrometry analytical method (UHPSFC-MS/MS) was developed. The strategy was successfully applied to the characterization of a range (n > 30) of food-related matrices (red meat, poultry meat, eggs, fish and breast milk). The method can be used as an alternative to LCMS/MS for the analysis of PFAS, it offers the possibility to perform rapid analyses with very high efficiency for a wide range of substances from apolar to polar and even very polar compounds. In addition to the environmental advantages of SFC such as low organic solvent use, the developed method enables instrumental LOQ of 0.2 ng/g for 33 individual PFAS, which allows to meet the requirements of the European Union Reference Laboratory (EURL) for the determination of the four individual PFAS (PFOS, PFOA, PFNA and PFHxS) indicating a LOQ ≤ 0.3 µg/kg (w/w) for recommended range of food matrices (Amziane et al., 2022).
The modified legacy PFAS classes are shifting more and more towards short chain PFAS and perfluoroalkylether alternatives. To discover and characterize these new PFAS, new methods need to be developed and the diversity of their physico-chemical properties needs to be taken into account. Supercritical Fluid Chromatography which is attracting attention as a third chromatographic method following LC/GC, appears a suitable alternative to address PFAS. Although the limits of quantification of the SFC method, in general, were higher than those of the conventional LC-MS/MS techniques it allowed simultaneous determination of different classes (i.e., carboxylates, sulfonates, phosphonates, and phosphinates) of PFAS ranging from short-chain (C2) to long-chain (C14) PFAS. The SFC based methods show plenty of potential to become the alternative routine methods for analysis of PFAS in food, food related, environmental, and biological samples (Amziane et al., 2022).
2.3.6 Sensors
In general, PFAS are difficult to measure using sensing devices because they are not active electrochemically or optically. Therefore, different sensing methodologies need to be developed in order to allow a fast, low-cost and on-site screening of PFAS. Sensors are mainly divided based on their detection mechanism into electrochemical, optical, and biological sensors. Electrochemical sensors are mainly based on potentiometric and voltametric activities, measuring the change in the potential between sensor electrodes or the change in voltage, respectively. Optical sensors convert optical signal into electrical signals for detection and can be subdivided in fluorescence, colorimetric and spectrophotometric. The emission intensity of the fluorescent material is correlated with the presence of a PFAS. Colorimetric sensors utilize organic cationic dyes to interact with PFAS to form ion pairs and then detect optical changes in colour. Spectrophotometric sensor is a type of sensor that use UV-spectrophotometers to detect response signals. Biosensor combines biomolecules that exhibit electrochemical or optical principles, with biomolecules capable of reacting with PFAS to produce changes in the potential, current, or colour intensity (Y. Shen et al., 2023).
Established methods for commercial use
To the best of our knowledge, this method is not currently being used commercially for the determination of PFAS, but for HF detection (Krebs et al., 2022). Sensors of different detection methods, such as colorimetric, electrochemical, mechanical or optical, are mainly applied to detect HF generation during fire scenarios, according to Krebs et al. (2022). These sensors might allow real-time concentration determination, which can reach the low ppm range (Table 5). Optical sensors were the most developed technique for fast HF gas detection fire suppression scenario, but still further improvements are needed to achieve all the requirements of rapidity, sensitivity, accuracy, and portability of a sensor (Krebs et al., 2022).
Detection Method | Sensor | Manufacturer | Detectable range for HF (ppm) |
Colorimetric | Gas Detector Tubes | Sensidyne® | 0.17–30 |
Dräger X-am® 5100 | Draeger Inc. | 0–30 | |
MDA Scientific SPM Chemcassette® | Honeywell | 0.6–9 | |
Matheson-Kitagawa Gas Detector Tubes | Matheson Gas | 0.17–30 | |
Chameleon® Cassette | Morphix® Technologies | 3–15 | |
Electrochemical | PortaSens III | Analytical Technology, Inc. | 10–200 |
MGS-150 | Bacharach® | 0–10 | |
TARGET Multi Gas Detector | Enmet Corporation | 0–10 | |
Shur-ShotTM | ATB Analytics LLC | Go/No-Go | |
ToxiRAE Pro | RAE® Systems | 0–10 | |
Mechanical | SABRETM 5000 | Smiths Detection | Low ppm range |
ChemPro100 | Environics USA | 30 | |
Mechanical/Electrochemical | GDA-FR Detector Array First Response | Airsense Analytics® | 5 |
Optical | L500 Laser Diode Gas Analyzer | OPSIS | 100 |
EM27/SUN spectrometer | Bruker | 0–500+ | |
AnatarisTM IGS analyser | Thermo ScientificTM | 0–10 ppb | |
GASFINDER3-OP | ©Boreal Laser Inc. | 0–250 or 4–1000 | |
Senscient Enhanced Laser Diode Spectroscopy (ELDS)TM | MSA | Various | |
O & M GasSens | Analytical Technology, Inc | 0–200 | |
Ultima® XE | MSA | 0–10 | |
DX4000 | GasmetTM | ppb, ppm |
Table 5: Summary of commercial detection systems for HF based on Krebs et al. (2022).
Ongoing activities by research institutes
The main research activities related to the development of PFAS sensors are described below and are presented according to the main sensing detection mechanism.
Electrochemical sensors
Due to the electrochemical inactivity of the main PFAS, which cannot undergo redox reaction analysis, indirect electrochemical analysis is commonly applied (e.g., photoelectrochemical, electrochemiluminescence and voltammetry). Molecularly imprinted polymers (MIP) are a popular surface functionalization strategy based on polymerization of chosen monomers in the presence of a template molecule. This template molecule is the target compound to be detected, which is then extracted from the polymer, leading to nano-cavities with complementary size and shape of the target compound, and strong molecular recognition capabilities. MIP need to be associated with multiple transducer principles, like electrochemical, optical, and heat-transfer methods (Tabar et al., 2023; Tasfaout et al., 2023). In the presence of the molecule in the nano-cavity, the electrode surface area decreases, consequently affecting the electrochemical signal in a proportional way. Enhancing the sensitivity and selectivity of these sensors can be achieved through the selection of the monomer and modifications of the electrode surface, e.g. using a nanomaterial-modified electrode surface. For example, poly-o-phenylenediamine (o-PD) was electrodeposited on a gold electrode surface with a limit of detection in the range of few µg/L (Hassan et al., 2021). The polymerization of acrylamide and heat transfer method detection presented a LOD for PFOA in spiked water sample of few ng/L (Tabar et al., 2023). Also, modification of Au-electrode chips with Cu2O@C@NiCo2O4 microparticles allowed increased electrode surface area and conductivity, resulting in improved detection sensitivity for PFOA, with a linear range 207–4140 ng/L (Wei et al., 2023).
Glassy carbon electrodes (GCE) with fold nanoparticles were prepared through the in situ electropolymerization of dopamine using PFOS as template. They were applied to water samples, previously filtered, and presented a LOD of 2.0 µg/L (Gao et al., 2023). Modifications to electrode surface with a thin coat of gold nanostar (AuNS) enhanced the voltametric response and resulted in the detection of PFOS in 7.5 ppt in tap water (Lu et al., 2022). Upconversion nanoprobes based on lanthanide-doped upconversion nanoparticles (UCNPs), which can convert near-infrared light into visible light, was also applied PFOS detection in complexes matrices, as environmental samples, human serum and egg extract, and showed a LOD 0.5 ng/L (Tian et al., 2021).
Recently, a direct sensor of PFOA was developed through the selection of a selective ionomer coating (i.e., a perfluorinated anion exchange ionomer (PFAEI)), thus without the need of a redox probe. This approached resulted in a LOD around 6 µg/L, with the major disadvantage of requiring an optimal pH around 1.5 to ensure the neutrality of PFOA for the adsorption onto the PFAEI (Sahu et al., 2022)
Optical sensors
Optical sensing techniques are often based on organic dyes and the detection can often be performed with the eye. Paper-based analytical devices (PAD), for instance, were developed based on the colour change from the ion-pairing between PFOS and methylene green, allowing PFOS quantification with of LOD 10 ppm. Due to this high LOD, a sample preparation step is preconized, and fluoro-SPE resulted in sample enrichment of 1000-fold (Menger et al., 2022). However, the inclusion of sample pre-concentration steps hinders the benefits of portability and on-site application of sensing devices. Porphyrins sensors were also developed for PFOA detection based on the production of an instant colour change discernible to the naked eye. The porphyrin functionalized with fluorinated chains created fluorophilic cavity which allowed the PFOA detection in an extracted soil sample to concentration of 3 ppm (Taylor et al., 2021).
Fluorescent sensing was applied to differentiate a PFAS mixture (PFOA, PFOS, GenX, PFHpA, PFHxA, and PFPeA) using molecular imprinting technique followed by differentiate analysis via fluorescent fingerprint (Harrison & Waters, 2023). This technique presented a LOD in the 40 nM range when applied to tap water, which was higher than the LOD using buffer solution due to the greater complexity of the background. Further optimization might allow to increase the sensitivity and the applicability of the array and, consequently, decrease the still high LOD.
Recently, the use of amplifying fluorescent polymers (AFPs) for a selectively detection of PFOA and PFOS at concentrations of ng/L was shown (Concellon et al., 2023). The AFPs are highly fluorinated and have selectors that react with acidic PFAS via a proton-transfer reaction, results in shifting of the fluorescence spectra and LOD around 1 µg/L. The application of higher-surface area nanoparticles allowed the detection of aqueous PFAS concentrations of ∼100 ppt.
The use of a fluorescent organic compound of imine derivative to detect PFOA showed response by colorimetric and fluorimetric methods, with a LOD of 3 nM for human biofluids and water samples (Vijayakumar et al., 2023).
Further development of fluorescent probes includes the use of water soluble CdTe quantum dots (CdTe QDs), which was recently applied for PFOS and PFOA detection in water samples with LOD of 48 and 57 pM, respectively (Sunantha & Vasudevan, 2021). These advancements represent a promising platform in environmental monitoring and assessment.
Biological sensors
Biosensors are mainly based on the recognition of a compound by a receptor. Identifying such bioreceptor is the first step, which must demonstrate low LOD and high specificity. Next, the bioreceptor must be conjugated to a labelling molecule.
A recent work searched for reagents that show competitive interactions with cellulose membrane and PFOA, (Breshears et al., 2023) resulting in a sensor based on the complex PFOA-BSA (bovine serum albumin) onto a paper microfluidic chip. The detection was based on changes in the capillary flow rate, which was recorded through a smartphone, and a LOD of 10 ppt for PFOA. PFOS was also tested in the similar set-up and showed lower sensitivity than PFOA. Such methods based on flow rate might present variations due to water turbidity and ionic strength (Breshears et al., 2023).
Human serum albumin (hSA) was also used as biological recognition layer for PFOA in aqueous solution. The conformational changes related to the formation of hSA/PFOA complexes were followed via optical monitoring of fibre biosensors and was capable of PFOA detection in the low ng/mL range (G. Moro et al., 2021). Fluorescence based DNA aptasensors, which are single-stranded DNA or RNA molecules that undergo three-dimensional conformational changes in the presence of target molecules, were recently developed for the selective detection of PFOA in water with a LOD of 70 µg/L (Park et al., 2022). The differentiation between three different long-chain PFAS (PFDoDA, PFDA and PFTeDA) in tap water or serum samples was obtained with double fluorescent biosensors (‘DT sensor’, DNA probe + thioflavin T (ThT), and ‘FT sensor’, lysozyme fibre + ThT). Due to the strong hydrophobicity, the long-chain PFAS can interact with DNA probe and lysozyme fibre to change their spatial structure, resulting in fluorescence signal responses of ThT. With a preconcentration step (e.g., SPE), a LOD of 0.5 µg/L can be achieved (Tian et al., 2021).
Genetically engineered bacterial biosensor was developed by integrating two genes called regulatory (defluorinase gene) and reporter gene (green fluorescence gene). This biosensor was employed to the detection of PFOA and PFOS in water samples upon induction of the regulatory gene and expression of green fluorescence protein, which was visualized using fluorescence microscopic images. A LOD of 10 ng/L was achieved, but with an analysis time of 24h (Sunantha & Vasudevan, 2021).
The development of sensors follows different and diverse strategies, and are specific to one or few molecules, mainly PFOS and/or PFOA. In most cases, sensors are not as sensitive as LC-MS methods, but allows a fast, low-cost and portable solution for fast detection of PFAS. Low LOD, in compliance with current legislation, might be achieve for some sensor detection techniques, such as MIP-based and fluorescent probes with CdTe quantum dots. It is expected that testing kit and portable devices will receive more attention for on-site and fast detection of PFAS, mainly in water matrices.
2.3.7 Summary of key information
Six different targeted analytical approaches are elaborated in detail.
Liquid chromatography – mass spectrometry:
- LC methods used either reversed phase, normal phase, or mixed phase chromatography to separate different PFAS.
- Efforts towards the inclusion of new compounds in target LC-MS include the optimization of extraction procedures, derivatization methods, improving chromatographic resolution and MS transitions.
- Sample preparation might consist of a simple solvent extraction, mainly using methanol, or further applying SPE for a better sample clean-up. Development of new SPE adsorbents, as fluorinated materials, also provided sensitive and reliable method for PFAS detection.
- This method is still the most widely used for the quantification of several ionizable PFAS, mainly by the isotope dilution method, and in several different matrices.
TOP assay (Liquid chromatography – mass spectrometry):
- This assay gives an idea of the PFAA precursors present in a sample. The precursors are oxidized and the products, mainly PFAAs, are monitored via a targeted approach mainly using LC-MS.
- Two target analysis are needed to monitor the PFAAs before and after the oxidation reaction, increasing the costs of this approach.
- The precursor oxidation is not specific and produces a broad range of intermediate PFAS transformation products PFAAs, depending on oxidation conditions. Not only PFAAs are formed, also new classes of PFAS were identified by using the suspect screening approach. The oxidation process can produce ultrashort chain PFAS, such as TFA and PFPrA. If the ultrashort chain PFAS are not considered, this can lead to an underestimation of total concentration of precursors in the sample.
- PFAS which contain ether functional groups may be resistant to oxidation or may produce oxidation products that are not typically measured by targeted PFAS methods (underestimated TOP assay values). Incomplete oxidation can occur.
- Interlaboratory studies show significant variabilities, this variability may be because there is no standardized method available. Alternative assays aiming to improve the oxidation are in development (Phototop assay, Total Hydrolysable assay).
- No standards or guidelines are available yet because of the lack of robustness and because it provides only insights about the presence of precursors, making it difficult to implement and use the TOP assay into a regulation perspective.
Gas chromatography – mass spectrometry:
- GC-MS is a powerful tool to measure the volatile and neutral PFAS in water and air samples.
- Different sampling techniques are used; for the water samples often a liquid-liquid extraction with methanol or a purge and trap method is used.
- For the analysis of air samples, PUFs, filters and charcoal were often used. Depending on the choice of the sampler, different types of PFAS will be trapped.
- All these sampling techniques are well known, an interesting novelty is the use of PE-sheets for trapping the PFAS compounds. The disadvantage is that an equilibrium should be established, and this often requires a long time. Also, the robustness of the method is often lacking but the advantage is that it can quickly give an identification of the presence of PFAS in air.
- Derivatization methods have also been developed to measure the more ionic PFAS with GC-MS. These techniques have often the drawback of high time-consumption and high LOQs (more in the µg/L range).
- The only way to trap the F-gases is using the thermal desorption technique. These analysis looks promising and can be a useful technique in the future analysis of the F-gases.
- Targeted GC-MS and GC-HRMS measurements are especially helpful for the analysis of volatile and low mass PFAS, where electron impact (EI) and chemical ionization (CI) are two common ionization methods, though the latter was shown to be widely used for the PFAS analysis.
- The recently developed CEN 17681-2 method (applied for textile and textile products) can be used as a basis to measure other matrices. However, a proper method validation and determination of the measurement uncertainty should be done.
Pyrolysis-GC-MS:
- For characterization of PFAS polymers pyrolysis GC-MS can be used.
- The pyrolysis promotes the degradation of polymers into smaller compounds, in a specific manner, which are therefore analysed using GC-MS.
- The interpretation of the complex spectra is needed to identify the original polymer and requires well trained lab technicians or researchers.
- Semi-quantification is possible with pyrolysis GC-MS and the targeted restriction limit of 50 ppm can be reached for the textiles. The technique can also be applied to other (solid) matrices to check if a similar LOQ can be established.
Supercritical – fluid – chromatography (SFC):
- SFC is often used to close the gap between GC and LC; compounds that are not volatile enough for GC analysis or compounds and the more polar compounds that are difficult to separate with the generic LC analysis (reversed phase). SFC can handle a wide range of polarities and molecular weights. SFC can provide a better resolution compared with the traditional liquid chromatography. This is important for PFAS analysis because these compounds often exist as a complex mixture with closely related chemical structures (isomers).
- The use of SFC allows faster analysis when compared with LC, it uses less solvents which makes it a more environmentally friendly (greener) technique.
A drawback of the method is that it is not a common technique in the routine laboratories or research laboratories, a limited standardized methods and less regulatory guidance compared to LC and GC makes the implementation and use of the technique more challenging for the analysis of PFAS compounds.
Sensors:
- Sensors have the advantage of low cost, rapid detection, portability (on-site detection) and real-time PFAS concentration assessment, with the potential of being used as pre-screening tools.
- They are mainly applied to one or few molecules, mainly PFOS and/or PFOA, and mainly water samples.
- Recent development to improve sensitivity and selectivity of sensors showed LOD in the low ppt range.
Use for enforcement/compliance testing:
Targeted methods are still needed for the quantification and verification of PFAS compounds in different types of matrices. The targeted methods are the most sensitive and broadly used techniques that are presented. Compounds can be easily added (if they have a corresponding reference standard) to existing methods or additional methods can be used for the ‘new’ identified PFAS that were found in the non-target or suspect screening. Almost all commercial laboratories have the instruments in house. However, the use of a targeted approach is limited to some PFAS, and the other compounds eventually present will not be measured. LC-MS is capable of monitoring short chain PFAS and ionic PFAS, while GC-MS will measure the more neutral and volatile PFAS compounds. SFC-MS is often used to close the gap between GC and LC; compounds that are not volatile enough for GC analysis or compounds and the more polar compounds that are difficult to separate with the generic LC analysis (reversed phase). Pyrolysis-GC-MS allows the detection of polymeric PFAS via their pyrolysis degradation products. Sensors are mainly developed for the real-time detection of some specific PFAS compounds, mainly in high concentration. A combination of all targeted analysis will not be enough to cover the whole PFAS range and a total PFAS approach is needed to check for the presence of additional PFAS. The use of non-target methods is the way to go for the analysis of unknown PFAS, which could afterwards be included in targeted methods (if/when a corresponding reference standard is available). The trend of shifting towards lower LODs, at trace levels, means efforts towards more efficient pre-treatment methods, more sensitive instruments, and faster and more accurate data processing methods.
Today, there are only a limited number of standard analytical methods available and standardized preparation procedures are often lacking. There are numerous sampler types and different extraction methods, which also hinders the comparison between studies. The targeted methods are at the frontline for the PFAS analysis, but still more harmonization is necessary.
Cost implications:
The implementation cost is rather limited, most of the commercial labs have the instruments in house and there is no need to high educated lab technicians.
2.4 Other analytical methods and structural analysis
There are other methods that can be used to get indications of the presence of PFAS within a sample by structural analysis. These methods are described in the following.
2.4.1 19F-Nuclear magnetic resonance spectroscopy (19F-NMR)
19F-Nuclear magnetic resonance spectroscopy (19F-NMR) is a technique that utilizes the nuclear magnetic resonance properties of fluorine-19 nuclei. In this method, fluorine-containing compounds are subjected to a strong magnetic field, causing the fluorine nuclei to absorb and emit radiofrequency signals. The resulting NMR spectra provide valuable information about the chemical environment and molecular structure of fluorine-containing compounds in a sample. The utilization of 19F-NMR spectroscopy has been previously applied to quantify PFAS within various biological samples. The identification of PFAS hinges on the distinctive chemical shift displayed by the fluorine atoms of the substance in the NMR spectra. Quantification though involves a practical approach, in which the peak area corresponding to a terminal CF3 group is evaluated by first establishing a calibration curve using a reference standard component such as PFOS (Moody et al., 2001). The methodology can be used to selectively detect and identify PFAS, including branched isomers.
One drawback of this method however is the low sensitivity of 19F-NMR, leading to considerable sample preparation in which the concentration of the compounds is strongly increased or prolonged data acquisition times ranging from 45 to 60 minutes (Koch, 2020). Further challenges of the method are the high procurement costs of the instruments and depending on the instrument the high operational costs.
19F-NMR is currently the only technique available that can determine the total organic fluorine in a sample. 19F-NMR is able to detect higher concentrations of TFA than the targeted conventional LC-MS methods, which cannot easily detect the short-chain PFAS. In recent years, efforts have been made to overcome the limitations of 19F-NMR. A noise reduction strategy has been applied to lower the detection limit and the development/use of databases is facilitating the use of 19F-NMR as a routine analytical tool. However, the high cost of the instrument and the high level of expertise required for the analytical limits remain.
Established methods for commercial use
To the best of our knowledge, this method is not currently being used commercially for the determination of PFAS.
Ongoing activities by research institutes
One commercial laboratory reported to develop a PFAS analysis method based on 19F-NMR. The reported method aims at the direct detection and quantification of PFAS in consumer articles and construction products without extensive sample preparation and is still in the process of being validated. The method should provide a total fluorine sum value and be able to discriminate between organic and inorganic fluorine. Detection limits were reported to be 0.1 ppm. Despite aiming at usage for different matrices (liquid, solid and inhomogeneous) and organic as well as inorganic fluorine, the method can suffer from matrix effects due to the shift of inorganic fluorine being influenced by the matrix.
A limit of quantification of 0.1 μg/L was determined for this method and aside from the high prices of the instruments and the skilled staff needed, the method was described as being easily made available for commercial laboratories once validated and standardized.
Gauthier & Mabury (2022) developed a 19F-NMR technique that offers detailed information on fluorinated compounds in a sample, providing both quantitative and structural insights. The method incorporates a noise-reduction strategy to enhance the signal-to-noise ratio and has been successfully applied to various matrices, including environmental and biological samples such as rainwater, lake water, wastewater effluent, serum, and urine. Notably, the technique reveals the presence of PFAS, potentially overlooked by routine mass spectrometric methods, and achieves detection limits as low as 389 pg/L in rainwater. In comparison, an LC-MS/MS method analysing 47 PFAS compounds only accounts for 3.7–27% of the total fluorine concentration determined by the NMR strategy. With its simple sample preparation, minimal matrix effects, minimal background contamination, and increased sensitivity, this NMR method emerges as a valuable tool. The advantages suggest its potential as an easier-to-apply and more accurate tool for analysing total organic fluorine.
Camdzic et al. (2023) showcased the efficacy of 19F-NMR by comparing it with two commonly utilized methods for PFAS analysis: the total oxidizable precursor (TOP) assay and LC-high-resolution MS analysis for targeted quantification and suspect screening. In both scenarios, the 19F-NMR analyses revealed higher total PFAS quantities compared to either the TOP assay (63%) or LC-MS analyses (65%). These results indicate that LC-MS and TOP assays might result in the underreporting of PFAS. Notably, 19F-NMR detected trifluoroacetic acid at a concentration over five times higher than the total PFAS concentration quantified using LC-MS in the wastewater sample. The limit of detection for total PFAS analysis was 99.97 nM, equivalent to 50 μg/L perfluorosulfonic acid. However, the analytical limit of detection is higher than that of most corresponding LC-MS methods. Structural information in complex mixtures for TF analysis by 19F-NMR may be limited due to signal overlap in the characteristic -CF2 region.
There is resistance to further uptake of 19F-NMR spectroscopy as an analytical tool, owing to perceived difficulties in sensitivity and spectral overlap. Gauthier & Mabury (2023) measured the 19F-NMR spectrum of hundreds of fluorinated compounds and constructed a database to determine the concentration of PFAS in an extracted sample of a known aqueous firefighting foam-contaminated site. The developed 19F-NMR database can be used by other researchers. More and more are the agricultural compounds trending towards the inclusion of fluorine. Therefore, it is important to have non-targeted and unbiased methods of analysis that can detect, potentially identify, and monitor these compounds in environmental samples. While limitations still exist in 19F- NMR, including longer experimental times for comparable sensitivity to tandem mass spectrometers and spectral overlap of some resonances, it is anticipated that the fundamentals of environmental 19F-NMR discussed in this study and the included database of common PFAS of 19F-NMR as a routine analytical tool.
2.4.2 Fourier-transform infrared spectroscopy (FTIR)
Fourier-Transform Infrared Spectroscopy (FTIR) is an analytical technique used to identify and study the chemical composition of substances by analysing their interaction with infrared light. It works by passing infrared radiation through a sample, causing certain wavelengths of light to be absorbed based on the types of chemical bonds and functional groups present. The resulting spectrum provides valuable information about a sample's molecular structure, allowing for the identification of compounds, functional groups, and chemical bonds.
FTIR is non-destructive and offers high sensitivity, making it an essential tool for researchers and analysts seeking detailed insights into the composition and structure of diverse materials and compounds and might be relevant also for identification of PFAS.
Established methods for commercial use
One commercial laboratory reported that FTIR was used as a first indication if fluorocarbon might be present in the sample. If a spectrum identifies the material as potentially being a fluorocarbon, it is indicated as having a Fluorocarbon Marker present. The result may be verified by XRF-WD and/or CIC testing.
Ongoing activities by research institutes
No further ongoing research activities using FTIR for the determination of PFAS could be identified.
2.4.3 F K-edge X-ray absorption near-edge structure (XANES)
F K-edge X-ray Absorption Near-Edge Structure (XANES) is an advanced spectroscopic technique used to study the local electronic and structural properties of fluorine-containing compounds. It operates by bombarding a sample with high-energy X-rays, causing the inner-shell electrons of fluorine atoms to absorb energy and transition to higher energy levels. The resulting X-ray absorption spectrum provides insights into the chemical bonding and oxidation state of fluorine, as well as the coordination environment of the fluorine atoms in the material, as it is element specific.
F K-edge XANES is particularly valuable in various fields, including chemistry, materials science, and environmental science. It aids in the characterization of materials like catalysts, polymers, minerals, and biological molecules. The edge term defines, that the absorption is taking place at the energy threshold at which X-ray absorption begins for a specific element. XANES further is a region in the X-ray absorption spectrum, which is located just before the sharp increase in absorption energy at the K-edge. As such by analysing the fine structure of the XANES spectrum, researchers can determine the chemical speciation of fluorine and gain a deeper understanding of its role in complex systems. Analysis of the spectra is then performed by examination of the shape and position of the absorption peaks and comparison to reference spectra or theoretical calculations.
This technique is non-destructive and offers high sensitivity, making it an essential tool for elucidating the electronic and structural properties of fluorine-containing compounds, which play vital roles in many scientific and industrial applications.
Established methods for commercial use
To the best of our knowledge, this method is not currently being used commercially for the determination of PFAS.
Ongoing activities by research institutes
For the first time, Roesch et al. (2023) used µ-X-ray fluorescence (µ-XRF) mapping alongside fluorine K-edge µ-X-ray absorption near-edge structure (µ-XANES) spectroscopy for the first time to illustrate PFAS contamination and inorganic fluoride in samples with concentrations as low as 100 mg/kg fluoride. Demonstrating the method's matrix tolerance, they investigated PFAS-contaminated soil, sludge, and consumer products. µ-XRF mapping allowed unique element-specific visualization at the sample surface, enabling the localization of fluorine-containing compounds up to a depth of 1 mm. This method proved effective for visualizing hotspots and spatially distributing fluorinated compounds on environmental and consumer product surfaces, achieving successful visualization of PFAS and other organic fluorine compounds even on the surface of a fluorine-free sample.
2.4.4 Microwave-induced plasma optical emission spectrometry (MIP-OES)
Microwave-Induced Plasma Optical Emission Spectrometry (MIP-OES) is an analytical technique that utilizes a microwave-induced plasma as the excitation source for optical emission spectrometry. In this method, a microwave field ionizes and excites the sample, generating a high-temperature plasma that emits characteristic optical radiation. The emitted light is then dispersed and detected to identify and quantify the elemental composition of the sample. MIP-OES offers advantages such as rapid heating and stabilization, enabling efficient multi-elemental analysis with high sensitivity and precision. This technique is particularly useful in various fields, including environmental monitoring, materials science, and metallurgy, providing a versatile and reliable means of elemental analysis in diverse sample matrices.
Established methods for commercial use
To the best of our knowledge, this method is not currently being used commercially for the determination of PFAS.
Ongoing activities by research institutes
Akhdhar et al. (2021) introduced a novel technique for fluorine quantification using MIP-OES. Due to the low temperature of the plasma, atomic emission of fluorine was not feasible, leading to the measurement of CaF molecular emissions instead. A wavelength was selected based on the best signal-to-ratio for fluorine determination, resulting in a limit of detection around 1 mg/L. The method exhibited a linear response over two orders of magnitude. Application of this technique to tea infusion samples showed results comparable to those obtained using the reference method, high-resolution continuum source graphite furnace molecular absorption spectrometry (HR-GF-MAS). While potentially suitable for total fluorine determination and fluorine speciation analysis when coupled with HPLC, MIP-OES is not recommended for water sample testing due to its higher limit of quantification compared to the WHO guideline for fluoride in drinking water. The typical limit of quantification is around 1000 mg/L for fluorine, while the reference method HR-GF-MAS achieves 10 mg/L.
2.4.5 Raman spectroscopy and surface-enhanced Raman spectroscopy (SERS)
Raman spectroscopy is an inelastic light scattering technique that is used to determine the vibrational modes of a molecule. The interaction between incident photons and the molecule creates induces a polarizability change within the electron cloud of the molecule, leaving the molecule in an excited energy state. When relaxing, a Raman photon is emitted. The intensity of Raman scattering is proportional to the polarizability change and generally produces a relatively weak signal, thus highly specific and unique to the probed analyte. As a result, surface-enhanced Raman spectroscopy (SERS) has been developed that allows to amplify Raman scattering by up to 14 orders of magnitude. In SERS, analytes of interest are attached to the surface of noble metal nanoparticles, such as Ag or Au substrates. The high improvement in signal intensity is because metallic nanostructures help in the enhancement of electromagnetic signals through surface plasmon excitation. Signal in SERS depends on the size, shape, and structure of the metallic nanostructures, the orientation of the particles and their conformation, as well as the strength of the interaction between the analytes and the metallic substrate. Because of these considerations, the fabrication techniques used to create the metallic nanostructure substrates are relatively complex and expensive. Nevertheless, SERS allows to significantly lower the detection limit, while providing high sensitivity, selectivity, stability, multiplexing capability and single molecule detection, versatility, and is also non-destructive.
Established methods for commercial use
To the best of our knowledge, this method is not currently being used commercially for the determination of PFAS.
Ongoing activities by research institutes
In the following, we first illustrate the application of Raman spectroscopy to image Teflon released from non-stick cookware (Luo et al., 2022). The detection of PFAS using surface-enhanced Raman spectroscopy (SERS) is then discussed and illustrated.
Raman spectroscopy
Raman imaging involves collecting multiple spectra in a scanning position array of a sample surface. The collection of spectra thus obtained is then averaged at each point of the array over the scanned area allowing to reconstruct the Raman image of the surface. The main challenge of such process includes the data management of 1000+ spectra that characterize a surface in order to extract useful information regarding compound identity and spatial location. When successful, Raman imaging provides valuable information on the distribution of analytes on a surface. Luo et al. (2022) applied this approach to study the surface of different non-stick pots by following multiple characteristic Raman features of Teflon at the surface. After an appropriate data treatment to decode the large spectral matrices, the authors estimated that thousands of millions of Teflon microplastics and nanoplastics were released during mimic cooking process. Results were supported and confirmed by scanning electron microscopy.
Surface-enhanced Raman spectroscopy (SERS)
Only few studies on the detection of PFAS using SERS have been reported today although there is an urgent need to develop rapid and ultrasensitive detection methods (M.B et al., 2023). In 2022, Bai et al. created plasmonic superstructure arrays made of Ag nanoparticles and used them to detect PFOA during SERS analysis (Bai et al., 2022). To prevent fluorescence and promote Raman signal detection, the authors incorporate crystal violet into PFOA. This allows to promote the formation of ions-pairs among PFOA and crystal violet which in turn significantly reduces the power of the Raman excitation laser, shorten the exposure time, and suppress the fluorescence generated by PFOA, therefore allowing for precise sensing. Since the fluorescence of PFOA at higher concentrations obscures the Raman peaks of crystal violet, the authors used the fluorescence intensity to determine the upper detection limit for PFOA. The fabricated superstructure array offers superior characteristics for the quantitative analysis of fluorescent PFOA with a wide detection range from 11 ppb to 400 ppm. PFOS can also be analysed using SERS (Huang et al., 2022; McDonnell et al., 2022). McDonnel et al. used aerosol jet printing technologies to produce SERS substrates made of Ag nanoparticles and graphene inks at low-cost and high throughput (Huang et al., 2022; McDonnell et al., 2022). The substrate has an excellent shelf life (9 months) and was successfully used to sense PFAS. Under basic conditions (pH = 9), the addition of graphene greatly improved the SERS intensity of PFOA and PFOS compounds. SERS spectra of PFAS were recorded from nano- and picomolar (~0.4 ppt) concentrations for PFOA and PFOS, respectively. Alternatively, Huang et al. (2022) used 40 nm Ag nanoparticles to probe PFOA and PFOS. Their protocol shows that SERS can detect PFAS levels as low as 20 femtograms per litre in less than 30 seconds. Altogether, these results highlight that surface-enhanced Raman spectroscopy (SERS) is a very sensitive method for the detection of PFAS and that it can be used an alternative method in the future.
Table 6 summarizes the available literature on the detection of PFAS via SERS (M.B et al., 2023). It includes the support material used to enhance the Raman signal, the type of PFAS analysed, the limit of detection (LOD) reached, and the laser wavelength used to probe the compounds.
Table 6: Summary of published SERS methods for PFAS detection.
PFAS | Material for substrate | LOD | Wavelength | Reference |
PFOS and PFOA | Ag NPs* + graphene oxide | 50 ppb | 532 nm | (Fang et al., 2016)** |
PFOA | Ag NPs* + silica | 11–400 ppb | 405 nm | (Bai et al., 2022) |
PFOS and PFOA | Ag NPs* + graphene | 10-12 M (PFOS) 10-9 M (PFOA) | 532 nm (PFOS) 633 nm (PFOA) | (McDonnell et al., 2022) |
PFOS and PFOA | Ag NPs* | 10-15 g/L | 780 nm | (Huang et al., 2022) |
*NPs = nanoparticles, **For information only. Not discussed in the current report because the publication date is older than two years.
2.4.6 Summary of key information
19F-Nuclear magnetic resonance spectroscopy (19F-NMR):
- 19F-NMR is the only technique that can directly measure TOF.
- The sensitivity is low which leads to very long acquisition times.
- The instrument cost is very high and high educated/trained people are needed.
- Limited structural information is available due to signal overlap in the characteristic -CF2 region.
- A noise-reduction strategy was applied to lower the limit of detection and the development/use of databases makes it easier to use 19F-NMR as a routine analytical tool.
Fourier-transform infrared spectroscopy (FTIR):
- FTIR can be used for qualitative analysis, it is less suited for quantification, particularly in complex mixtures.
- FTIR can provide information on the functional groups present in a compound. This can be helpful in the identification of PFAS.
- Interferences can interfere with the spectrum, which makes the interpretation difficult.
- FTIR is not able to make a distinguish between related PFAS compounds due to the similar spectra.
- The interpretation requires expertise, particularly when dealing with complex mixtures or similar compounds.
- FTIR provides a fingerprint of the sample.
F K-edge X-ray absorption near-edge structure (XANES):
- It provides information over the structural properties of fluorine-containing compounds.
- It is a non-destructive technique.
- It is a complex technique that requires specialized equipment and expertise, which may not be available in many analytical laboratories.
- Quantification is difficult, especially when dealing with mixtures of PFAS.
- The limit of detention is high (100 mg/kg fluoride).
Microwave-induced plasma optical emission spectrometry MIP-OES:
- MIP-OES is designed to measure the elemental composition of a sample.
- The limit of detection is 1 mg/L CaF.
- It is a rare technique that is used for PFAS analysis.
Raman spectroscopy and surface-enhanced Raman spectroscopy (SERS):
- It is a non-destructive technique.
- Can be used to image a surface.
- The limit of detection can reach the picomolar level of concentration.
- The strong fluorescence of PFAS often hampers the detection of Raman signals.
- It is necessary to develop appropriate substrate that can enhance Raman signals.
Use for enforcement/compliance testing:
The structural analysis is rarely used for the analysis of PFAS. The complex techniques require specialized equipment and expertise, which may not be available in many laboratories. The high limit of detection makes it of less interest in compliance testing and quantification is often difficult. However, the techniques can provide rapidly results. Interpretation requires expertise, particularly when dealing with complex mixtures.
Cost implications:
The implementation cost will be high because the techniques are not yet established in commercial laboratories.