Janek Valdsalu / Unsplash
Six use cases supporting specific sea ice phenomena
NOCOS DT implemented six cryosphere-related use cases at the intersection of science and policy:
- The ship navigation risk indicator to improve information on navigability in varying ice conditions.
- An analysis tool diagnosing the period for landfast ice to inform people living in the cryosphere when and where it is safe to travel on ice, and a demonstration of an iceberg drift model.
- The provision of accurate and reliable data on ridged ice probability to improve winter navigation, increases safety at sea, and conduct efficient risk assessment for maritime operations, such as offshore construction.
- Regular monitoring and prediction of the marginal ice zone to increase understanding of the Nordic seas by providing locations, weekly evolution, and statistics.
- The marine spatial planning use case to pilot how the climate models' data can be utilized on planning platforms.
- Demonstration of an iceberg drift model.
- The development of a discrete element model-based sea ice model.
Ship navigation risk indicator
Ship navigability in ice-covered sea depends on sea ice concentration, ice thickness, fraction of pressure ridges and multi-year ice as well as ice speed and compression, but also importantly the ice class of the vessel.
The International Maritime Organisation (IMO) has introduced a Risk Index Outcome (RIO) method to provide ship-specific guidelines for safe navigation in ice-infested waters. Calculating RIO needs accurate, high-resolution sea ice information.
Goal
Improved information on navigability – develop a method to calculate a navigation risk indicator similar to RIO from model data and to estimate probabilities of sea ice extremes.
Users
Open-source code will be published on GitHub for scientific use, and the forecast of risk index can be provided to shipping companies.
Models and data
Copernicus, ECMWF and DMI HYCOM-CICE sea ice forecasting products have been used to develop the navigation risk indicator. The calculation method is implemented within the Destination Earth Climate Change Adaptation Digital Twin environment where the input data is streamed from the global high resolution Climate digital twin. Model outputs are validated by RIO in ice charts. In addition, an ice / no ice climatology and trend is derived.
Key innovations
The Risk Index Outcome is a new parameter in modeling, decided jointly by ice condition and ship class. Traditionally, the ice condition includes sea ice concentration and thickness. Salinity and age are introduced in the innovative RIO calculation algorithm developed by NOCOS DT as novel parameters, to better determine the POLARIS ice type, providing a more accurate RIO outcome.
Impact and legacy
- Daily updated RIO forecast derived from ECMWF S2S modeled ice data, including now-cast, +1, +2 and +3 days forecast, stored in FMI's internal FTP temporarily.
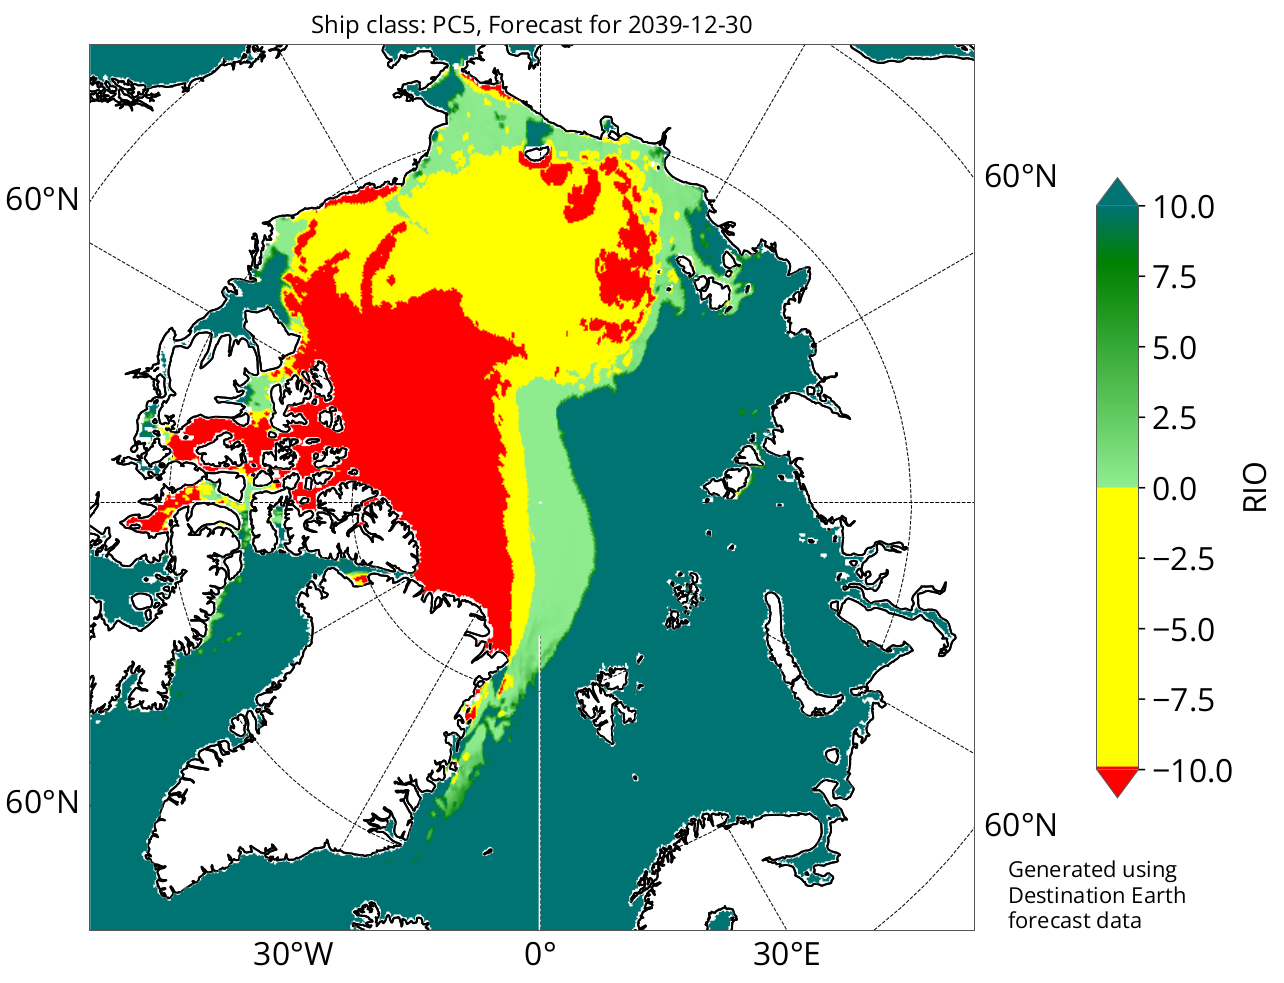
Figure 1 RIO distribution in the Arctic
© Finnish Meteorological Institute (FMI)
© Finnish Meteorological Institute (FMI)
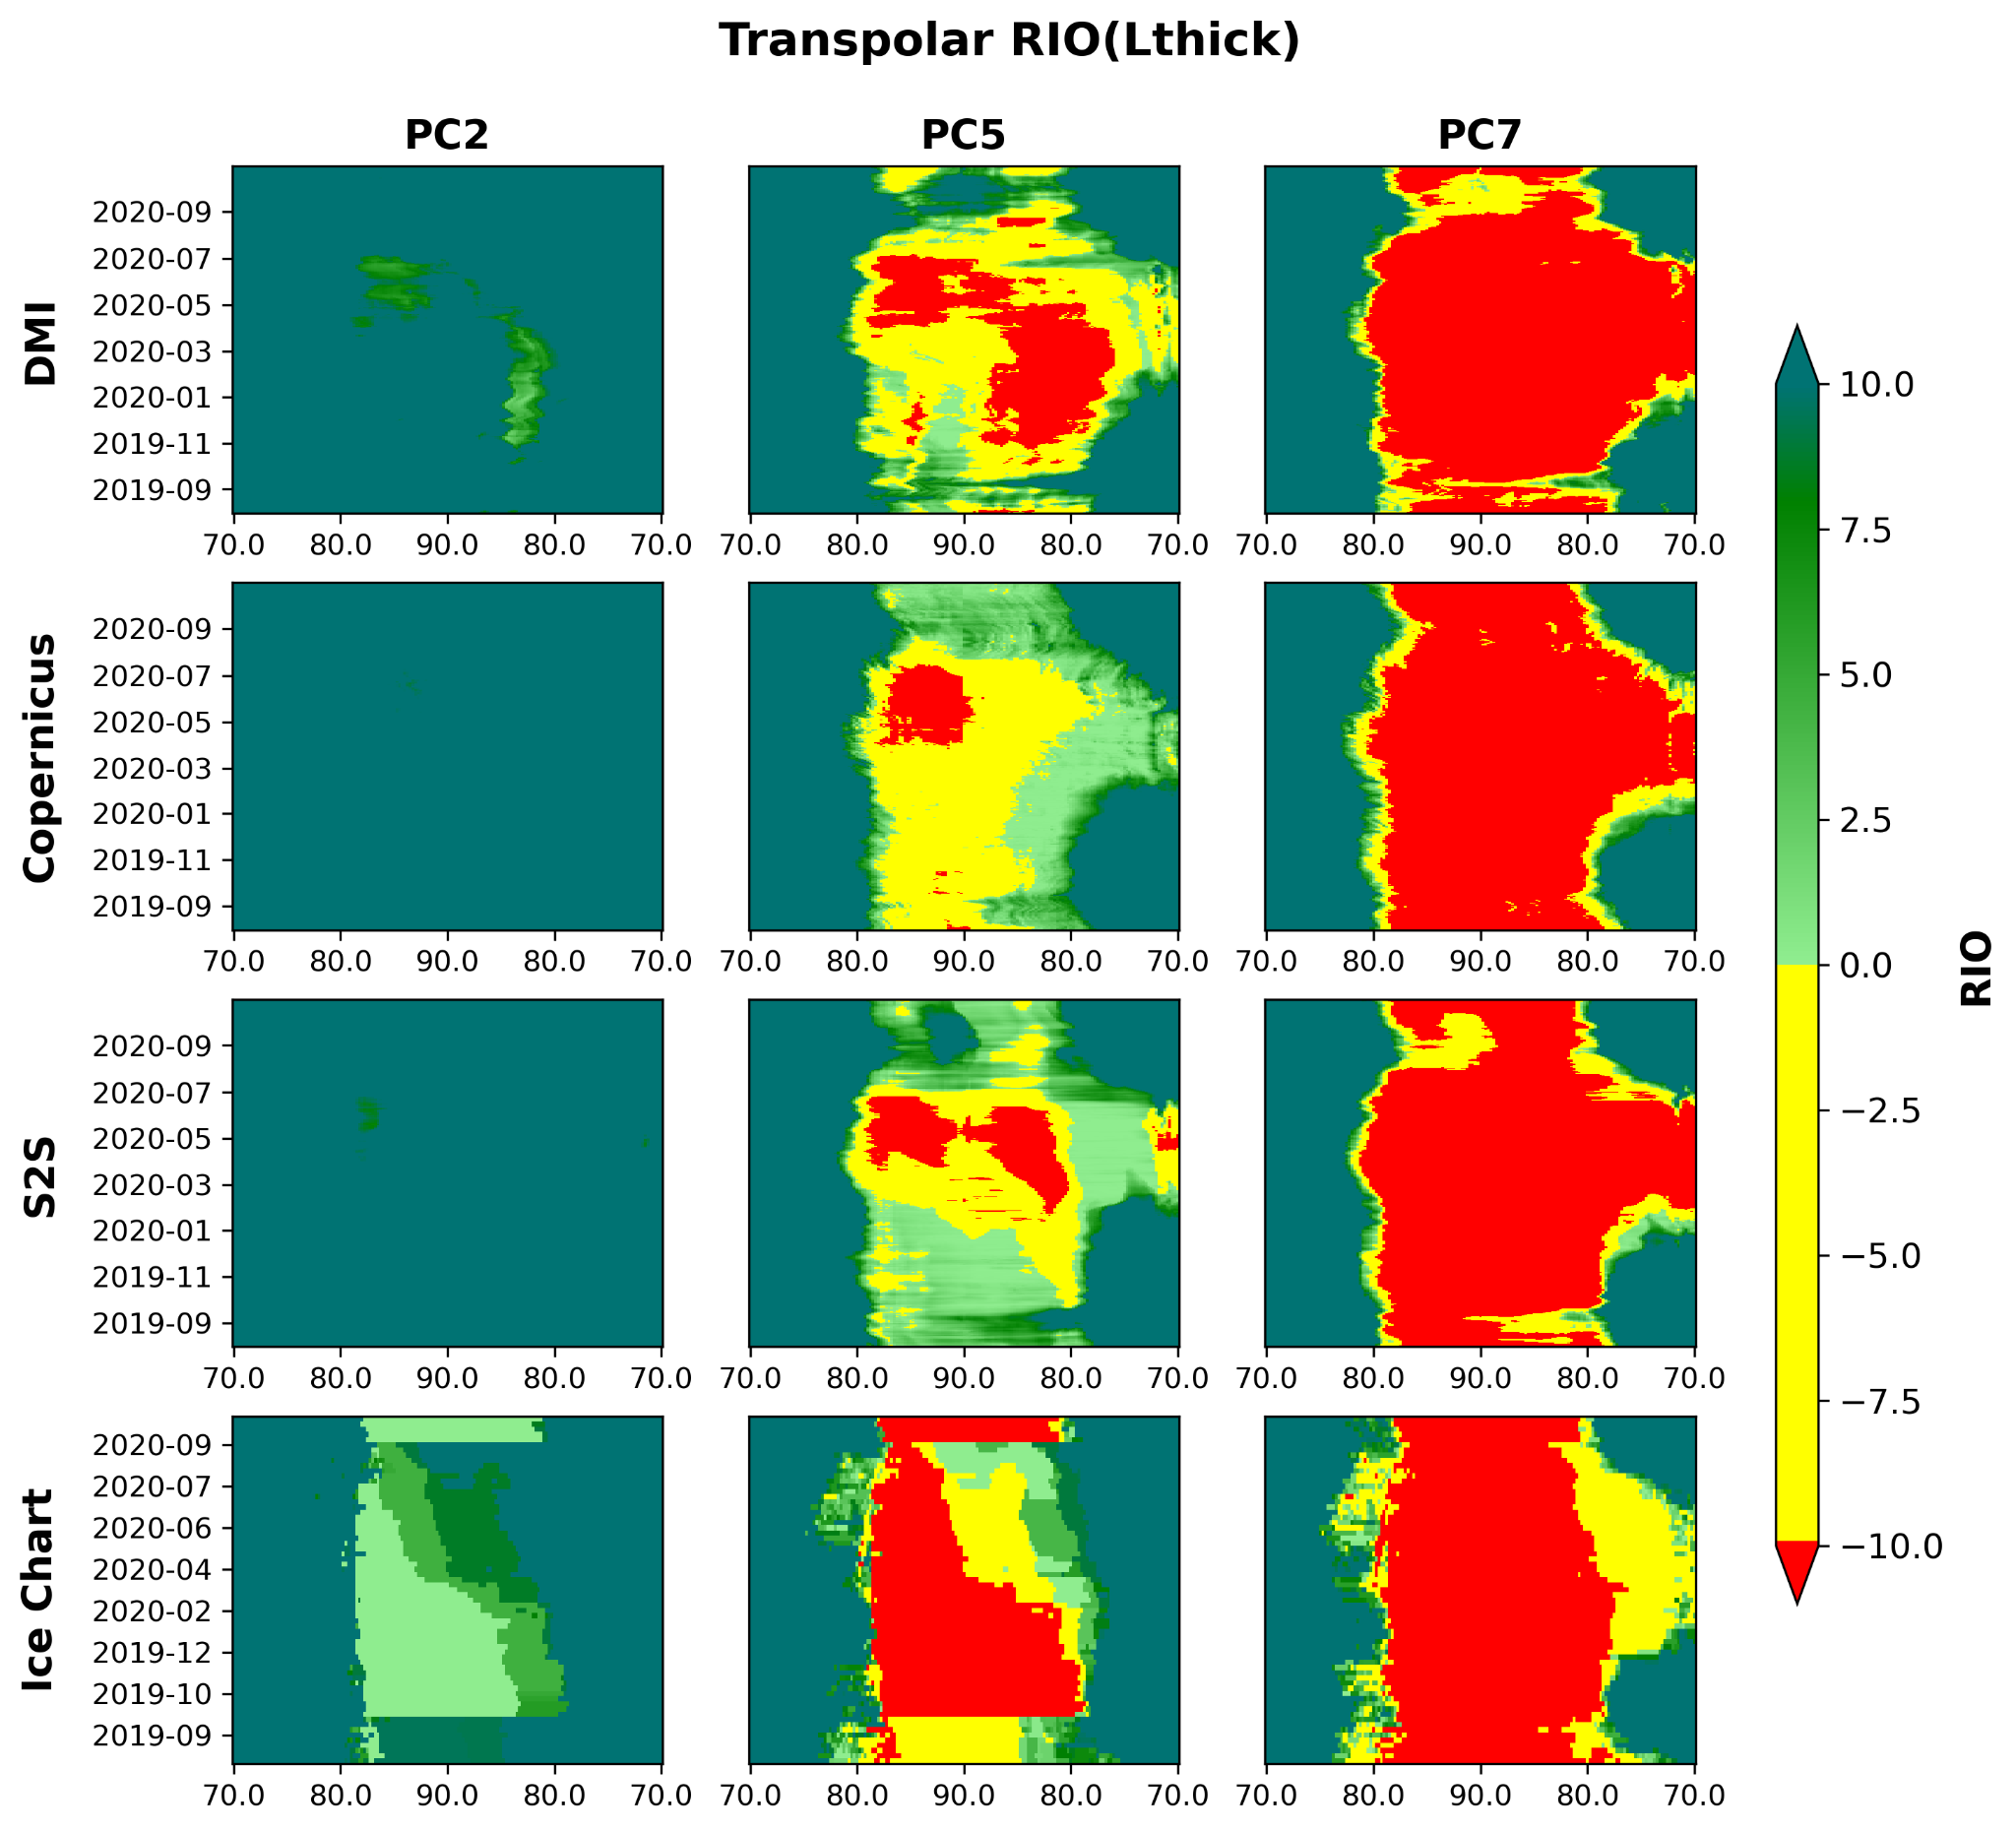
Figure 2 Arctic transpolar route RIO profile
© Finnish Meteorological Institute (FMI)
Landfast ice
Landfast sea ice refers to sea ice that is locked and does not move. This makes it a more stable and predictable area to work on when it is thick enough. Greenlandic people travel on the landfast sea ice and use it for hunting and fishing. This means that changes in landfast sea ice conditions will (and already do) affect their way of life. Landfast sea ice is also common in the Baltic in the winter, where it is used for winter roads and recreational activities such as skiing and ice fishing. Landfast ice starts to build up when ridges hit the sea floor or if icebergs or the coast locks the sea ice.
Goal
Create an analysis tool that diagnoses the period for landfast ice in present and future climate.
Users
- People travelling on sea ice
- Decision-makers who want to plan when it is feasible to travel on ice
- Decision-makers who want to install offshore constructions in ice-covered areas
- Cruises companies who want to know the length of the open water season.
Models and data
- DMI’s ocean-sea-ice model for the Arctic
- Climate DT model output
- Ice charts (for validation)
Key innovations
- Demonstration of data access to Climate DT data.
- First high resolution landfast ice product with future projections.
- Demonstrations of landfast sea ice methods on reanalysis/forecast products from DMI.
- Landfast ice analysis is easily transferable to other sea ice data sets available through the DestinE Data Lake
Impact and legacy
- A toolbox for diagnostics of the landfast sea ice.
- The landfast sea ice analysis is easily transferable to other sea ice data sets available through the DestinE platform including the Data Lake and other sources.
Landfast sea ice is important for the Greenlandic and other Arctic societies as they use it for infrastructure, fisheries and hunting. Therefore it is important to predict the stability of the landfast in a changing climate.

Keld Qvistgaard
The Greenlandic ice service
The Greenlandic ice service

Figure 3 Landfast ice climatology for March. The color indicates how frequently in March the coast of Greenland is covered by landfast ice. The inlet shows a zoom on the Inglefield Bredning in Northwest Greenland. (a): Climate DT simulation (model ICON) for March 2010–2019; (b): Future projection of the Climate DT simulation (model ICON) for March 2030–2039; (c) for reference: Observed landfast ice coverage in March 2010–2019 based on ice charts.
© Danish Meteorological Institute (DMI)
© Danish Meteorological Institute (DMI)
Ridged ice
Ridged ice can be hazardous for offshore and coastal construction, and it limits the servicing and maintenance of offshore facilities. It is important to consider the ridged ice related risks during the design of constructions to assure optimal maintenance and servicing costs of each facility. Ridged ice occurs in areas of high ice dynamics and especially close to the coastal zone, which often coincides with the interest area of coastal developers (e.g., wind farms, aquafarms, Floating Storage Regasification Units). Drift of deformed ice formed around offshore wind farms can further affect local communities and ship traffic, increasing the relevance of detailed studies. Knowledge about the probability of ridged ice occurrence is also beneficial for safe winter navigation and ice breaking. Knowledge of expected changes in ridged ice has a considerable social impact as it helps to increase safety of wintertime navigation as well as to prevent ice-related hazards for coastal structures.
Goal
The goal of the application is to enhance and innovate the methods for computing the ridged ice probability index and to assess its impacts on offshore and coastal activities.
Users
Additional potentially interested parties besides wind farms, aquafarms and floating storage regasification units include:
- Maritime authorities: agencies in Baltic Sea countries are interested in ridged ice data for safe navigation, ice advisories and icebreaker management.
- Shipping companies: vessel operators require information on ridged ice for assessing risks, planning routes, and ensuring maritime operations' safety.
- Fishing and aquaculture industry: developers and operators rely on accurate ice information to assess impacts, plan operations, and ensure safety for fishermen and vessels.
- Insurance companies: industry requires ridged ice data to assess risks, underwrite policies and set premiums for maritime assets in cold regions.
Models and data
The regional configuration of the ice model, supplemented with Copernicus reanalysis, is used to establish a climatology of ridged ice. The application of Climate DT data provides a scenario model database at 5 km resolution, capturing basin-scale ice dynamics in the Baltic Sea.
Key innovations
Although ice ridging is not a common ice DT output parameter, the availability of reliable proxies for ridged ice can greatly enhance navigation and safety in marine activities.
Impact and legacy
- Climate DT data services and the NOCOS ridged-ice toolbox will remain accessible, supporting evidence-based policy, risk management, and sustainable planning for marine and coastal activities in the Baltic region
The NOCOS case study on deformed sea-ice drift in the Gulf of Riga provided valuable input for the Saare-Liivi offshore wind farm environmental impact assessment, supporting evidence-based evaluation of ice-related risks.

Kristiina Nauts
Utilitas Wind
Utilitas Wind

Figure 5 Ten-year climatology of average ridged ice probability from the Climate DT Phase 1 IFS-NEMO historical simulation for 1990–1999 (left), the SSP370 scenario for 2030–2039 (right) over the Baltic Sea.
© Tallinn University of Technology (TalTech)
© Tallinn University of Technology (TalTech)
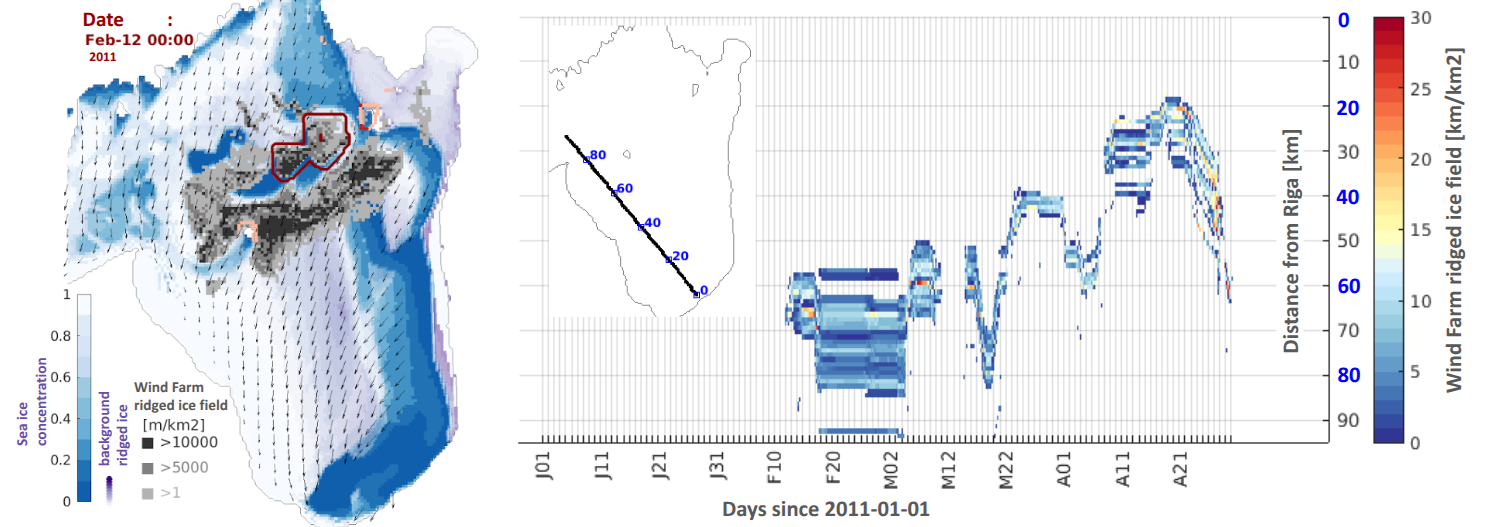
Figure 6 Deformed ice drift from the Saare wind farm development area during the severe winter of 2010/2011 on 12 February (left), and the distance–time plot of wind-farm ridge density along the main shipping route from Riga to the Irbe Strait (right).
© Tallinn University of Technology (TalTech)
© Tallinn University of Technology (TalTech)
Marginal ice zone
The marginal ice zone (MIZ) is defined as the region of an ice cover affected by waves and swell that penetrates into the sea ice from the open ocean. Typical MIZ conditions are found along the southern edges of the ice pack in the Bering Sea, Greenland Sea, and Barents Sea, in the Baffin Bay, and along the complete northern edge of the Antarctic ice cover. MIZ is a dynamic zone under strong interactions between the atmosphere, ocean, sea ice and waves, therefore playing a crucial role in the polar climate system. Due to the relatively low sea ice concentration and sea ice thickness, the MIZ is also an area much more navigable than the inner dense pack ice. Knowledge about the location and evolution of the MIZ is critically important for safe operations in the Nordic countries.
MIZ is a critical, dynamic region for polar ocean ecosystems. The extensive phytoplankton blooms form the base of the food web and provide a vital food source for a wide array of species. The MIZ is also a critical habitat for ice-dependent species, which use the patchy ice for hunting, breeding, and shelter. Due to the climate change, changes in the MIZ’s extent and physical properties could significantly impact the ecosystems by altering food webs, affecting breeding and hunting grounds for marine mammals, and shifting species distributions.
Goal
Improved knowledge and regular monitoring and prediction of the MIZ in the Nordic seas, providing locations, weekly evolution, and statistics.
Users
- Fisheries, offshore oil and gas industry, shipping and marine tourism companies who operate close to the sea ice edge
- Research vessels for MIZ biological and ecological studies
Models and data
- CMEMS operational reanalysis and forecast products including NEMO, TOPAZ5 and neXtSIM
- Norwegian high-resolution pan-Arctic coupled model NorHAPS
- Climate DT models IFS-NEMO, ICON
- Definition of criteria for the MIZ, and development of methods to derive MIZ properties from standard variables
- Calculation of spatial distribution of MIZ from existing data sources (e.g., Copernicus, Climate DT)
Key innovations
MIZ is a new parameter from sea ice and climate models.
Impact and legacy
- The definitions for different MIZs and their formulation will be useful for future studies
- The toolbox for MIZ calculation is useful for determining MIZ for short-term forecasts for tactical purposes such as fishing and navigation, and for climate impact evaluations.

Figure 7 Traditional MIZs on 15 March 2021: (a) simulated by ICON, (b) observations by US National Ice Center, and (c) simulated by IFS-NEMO. The figure shows an example of the traditional MIZs on 15 March 2021. The simulated MIZs are calculated from Climate DT simulations ICON (a) and IFS-NEMO (c) and are compared with the US National Ice Center sea ice chart (b). On the whole, the ICON MIZ significantly overestimates the sea ice extent, whereas the IFS-NENO generally has a much closer agreement with the observation. Due to the large difference in the sea ice extent, the location of MIZ is of large bias, particularly in the ICON simulation. Despite the relatively closer agreement of the sea ice extent between the IFS-NEMO simulation and the observation, the simulated MIZ also has marked differences with the observation. New simulations are currently being carried out in the Climate DT with optimizations, and further improvements are highly expected.
© Keguang Wang (MetNo)
Marine spatial planning
Traditionally, Marine Spatial Planning (MSP) databases and platforms include only static information on the seabed, marine infrastructures, habitats, and other environmental parameters. Climate change causes quickly changing environmental conditions that should be taken into account in MSP since they have large direct influence on cumulative ecosystem impacts (e.g., Wåhlström et al, 2022) as well as on new potential activities and pressures that become possible, e.g., when sea-ice conditions change. In order to provide information on ocean and sea changes for decision making, new high-resolution ocean and sea-ice model projections need to be made available in formats that can be integrated into MSP platforms.
Goal
Pilot how the climate models' data can be utilized in the MSP platforms.
Users
- Marine spatial planners and managers
- Policy and decision makers
Models and data
- Focus has been on data from climate projections with the Nemo – SCOBI model.
- There are existing CMIP 5 projections for the Gulf of Bothnia from the SmartSea project, and new CMIP 5 and CMIP 6 projections are presently being produced for the North Sea and the Baltic Sea
Key innovations
Climate data is very relevant to MSP, but yet not considered enough, and facilitating access to the data via the unprecedented capabilities of DestinE is a breakthrough into managing our seas better.
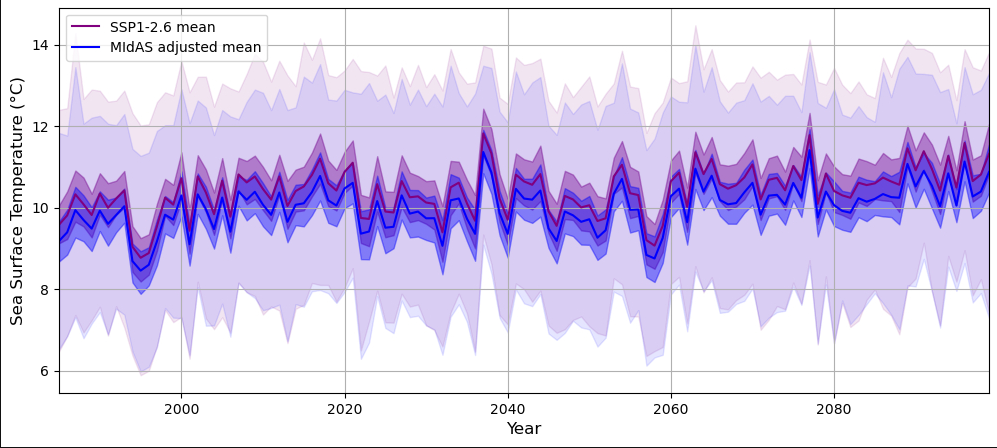
Figure 9 Example of bias adjusted and un-adjusted Baltic Sea mean temperatures for climate scenario SSP1-2.6.
© Swedish Meteorological and Hydrological Institute
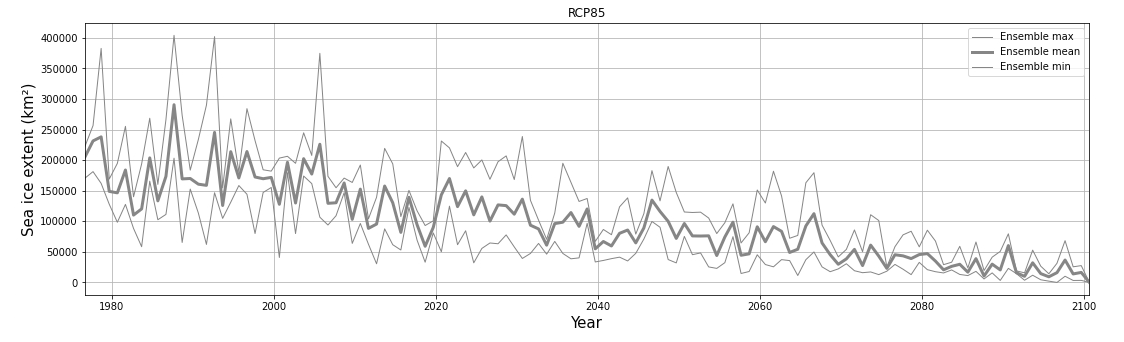
Figure 10 Time series of Baltic Sea sea ice extent for the CMIP5 RCP8.5 climate scenario.
© Swedish Meteorological and Hydrological Institute
DEM-based sea ice model development
Current sea ice models used in short-term forecasting and climate research are typically based on finite difference (FD) methods due to the fact that some other numerical methods have been computationally too demanding for sea ice applications. The finest useful resolution for the FD models is typically 1–10 kilometers. An alternative to FD models is discrete element models (DEM) which resolve sea ice physics on the scale of about a meter. DEMs are computationally very demanding and have mainly been used for process studies. However, the advent of exascale computing facilities will allow utilization of DEMs for geophysical applications. Better forecasts for sea ice break-up, including the formation of leads, and sea ice drift, are of crucial importance for shipping and infrastructure in the sub-Arctic and Arctic regions, like the Baltic and the Barents Sea, as well as the entire Arctic Ocean. Furthermore, the understanding of long- term changes in the behavior of drift ice in a warming climate is highly important for the research related to Arctic biodiversity changes, conservation policies and support measures for traditional hunting and fishing by indigenous people.
Goal
DEM-based computer code suitable for HPC that can be applied to sea ice simulations. Peer-reviewed papers based on model computations.
Users
- Scientists
- Forecast providers as a service to the public
Models and data
The Discrete Element Model HiDEM is modified for sea ice simulations. The code adapts boundary conditions, driving forces, and bathymetry according to user-provided input data.
Key innovations
- The HiDEM code for sea ice.
Impact and legacy
- The HiDEM code for sea ice simulations is available for science and other communities.
- New insight into sea ice dynamics, glacier and sea-ice interaction, offshore wind farms in polar environments, etc. are currently being produced.
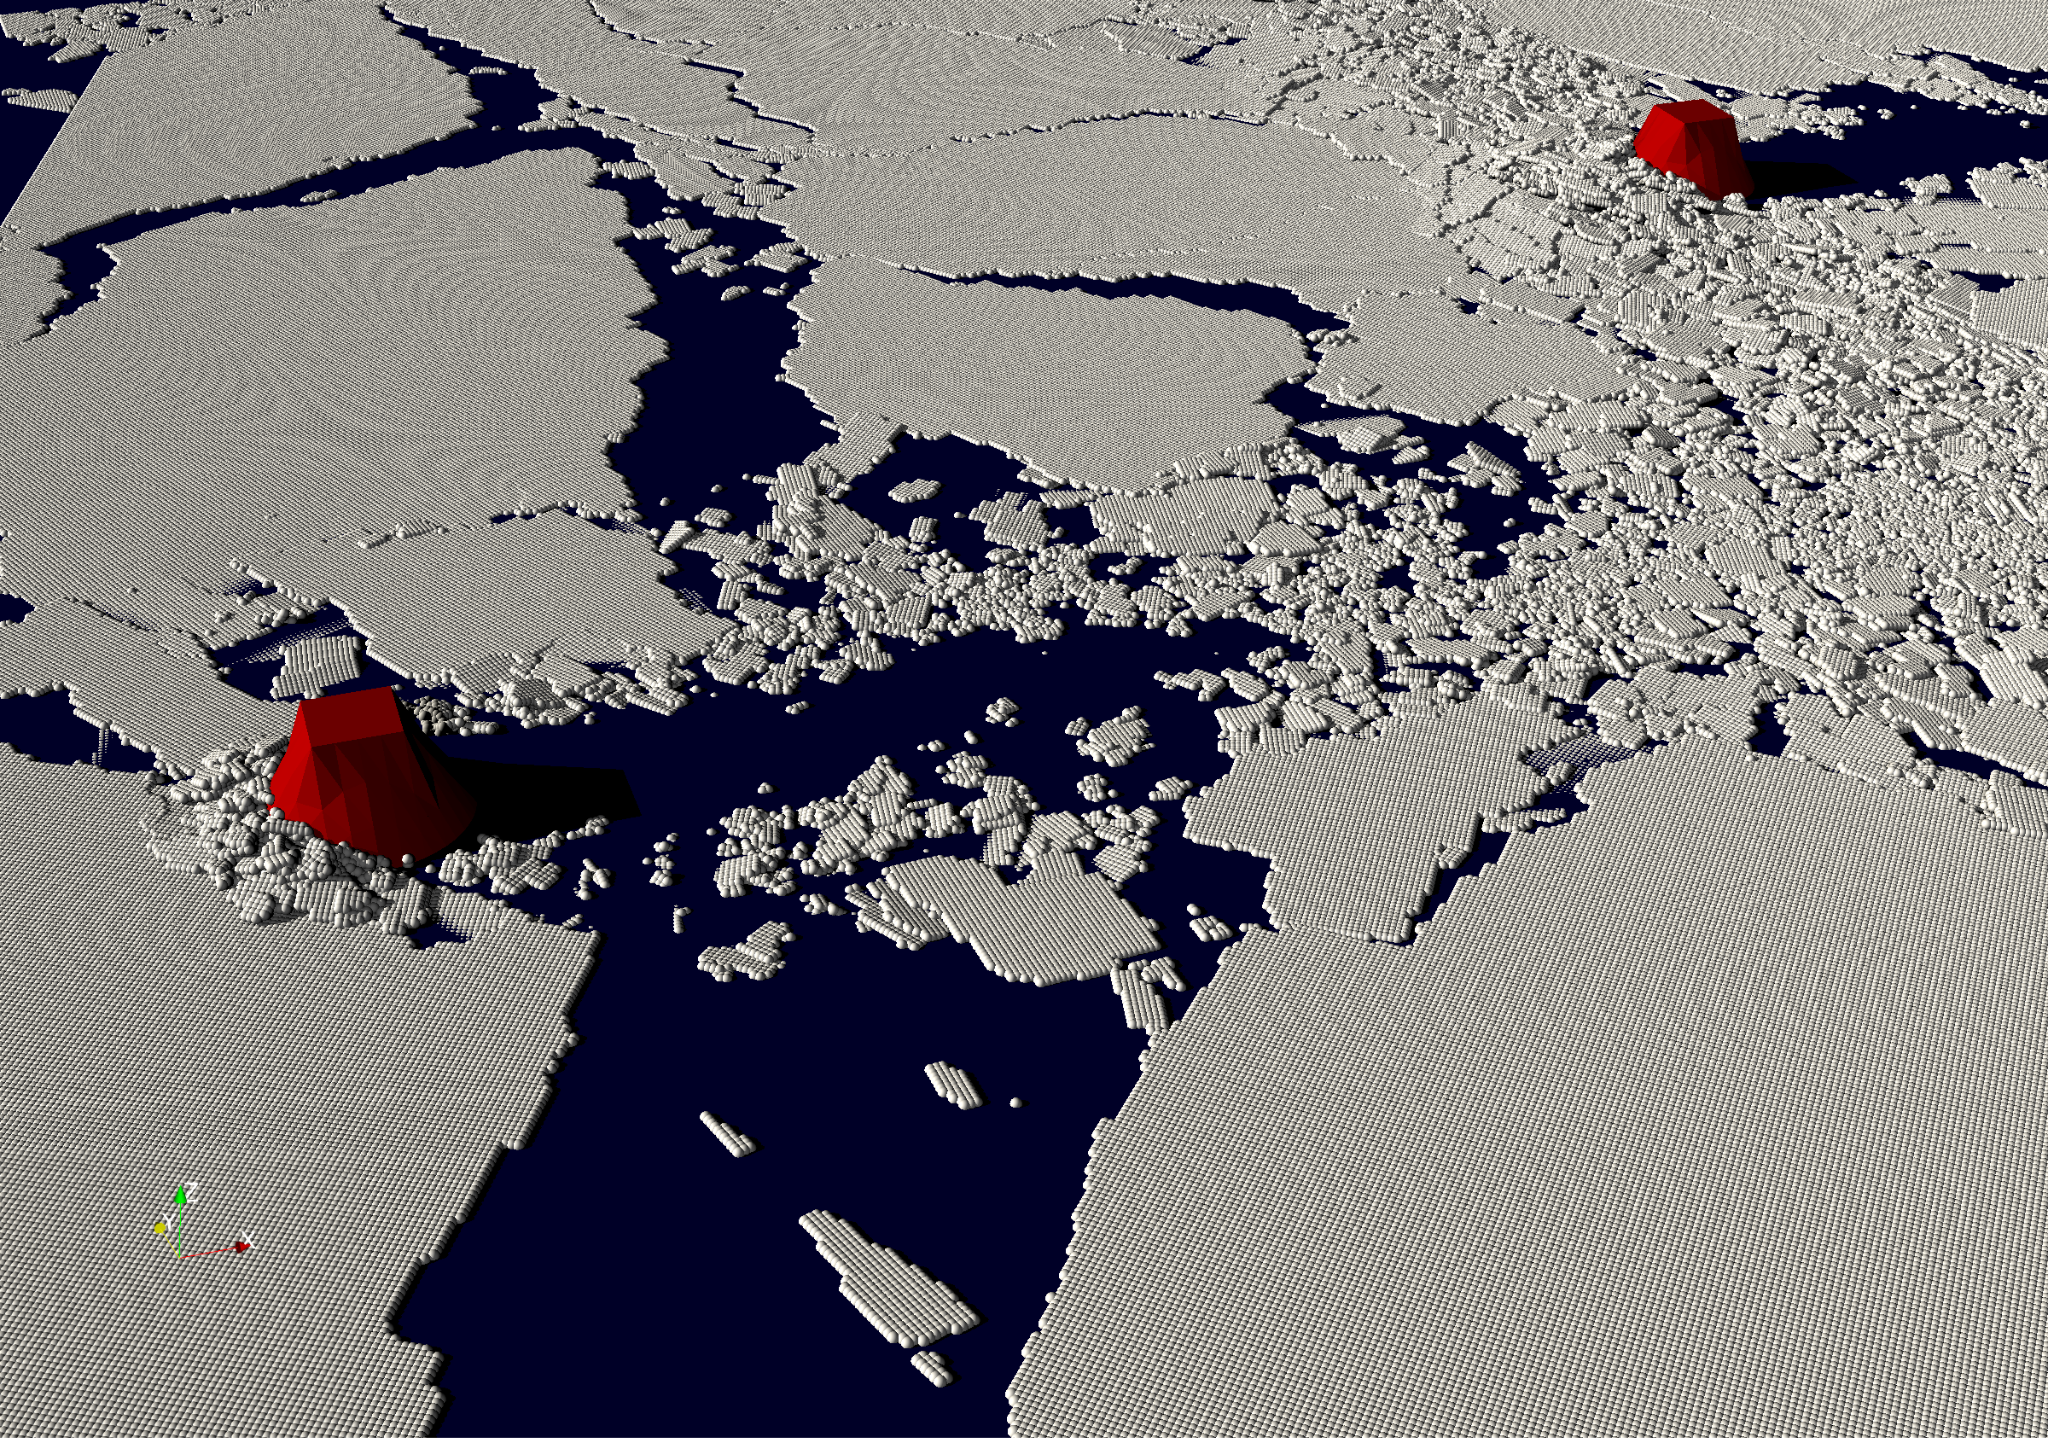
Figure 11 A HiDEM simulation, with 0.25 meter resolution, of drifting ice breaking around red-colored 10 meter diameter fixed pylons.
© Jan Åström (CSC)