Chapter 5.
Fish larvae dynamics and predation by pelagic fish
Petur Steingrund
Fish larvae dynamics
The introduction pointed to the importance of hydrographich features like the subpolar gyre and the East Icelandic Current on the productivity of shelf ecosystems. In the current section we focus on the ecosystem level of forage fish, more specifically on fish larvae and which factors may control their abundances. The motivation for this focus is the notion that both seabirds and demersal fish feed on forage fish, such as sandeels, that represent a crucial trophic link in the transfer of energy through the food chain from zooplankton to demersal fish and further up to top predators (Eliasen et al., 2011). There has been some focus on the negative relationship between temperature and sandeels (Deurs et al., 2011; Régnier et al., 2019), but during the project it was realised that sandeels are not the only important forage fish species and that a broader approach is needed to explain the variations in seabird numbers.
The impression of abundant seabirds (guillemots/puffins) in the past centuries (Nørrevang, 1977) may serve as an inspiration as to which factors govern seabird numbers and productivity. The factors could be grouped into natural factors such as the general productivity (primary or secondary production) of the ecosystems or antropogenic factors, such as exploitation of fish stocks and seabirds. There have probably not been major changes in ecosystem productivity over decades or centuries while it is apparent that exploitation of e.g. fish stocks has undergone dramatic changes over the last century where many fish stocks, e.g. Faroe Plateau cod have been reduced to low levels. Here, we present a novel approach to explain annual variations of demersal fish larvae in the pelagic phase on the Nordic shelves: Icelandic shelf, Faroe Plateau, Faroe Bank, Norwegian Shelf, that takes into account:
- ecosystem productivity,
- predation on fish larvae by pelagic fish and
- mitigation of the predation effect by demersal fish species.
In our modelling of the abundance of fish larvae it was not possible to use all three explanatory variables simultaneously in the same analysis, either due to lack of data or statistical power (too short time series). The stock assessment data are taken from the ICES website (www.ices.dk) under the relevant working groups NWWG (Iceland cod, Faroe haddock, Faroe saithe: ICES, 2023a and Faroe Plateau cod: local assessment), WGDEEP (Faroe ling: ICES, 2024a), AFWG (Norwegian coastal cod: ICES, 2024b) and WGWIDE (mackerel: ICES, 2023b). Other data are kindly provided by project members.
Faroe Plateau
Faroe Plateau is a good place to start since there has been conducted an 0-group survey since 1983 that can be compared with ecosystem productivity (primary production, zooplankton) since 1990 as well as fish stock assessments since 1960s and further back in time. The annual variations in the abundance and growth of larvae of different fish species has been been remarkably similar and is positively correlated with an index of primary production on Faroe Shelf (Eliasen et al., 2011; Jacobsen et al., 2019).
Although it has been recognised that predation on fish larvae is an important factor that governs their survival (Bailey and Houde, 1989) this has not been incorporated so far for Faroe Plateau. Many candidates for predatory fish on fish eggs and larvae can be proposed, including adult sandeels (Ammodytidae, Christensen, 2010), Norway pout (Trisopterus esmarkii, Albert, 1994), herring (Clupea harengus, Frederiksen et al., 2007) and mackerel (Scomber scombrus, Kvaavik et al., 2019). There is little data on stomach content of adult sandeels and Norway pout in Faroese waters and mackerel has been proposed to be of minor importance for cod larvae on Faroe Plateau, mainly because the spatiotemporal overlap is low, i.e. the cod larvae have settled to the bottom before mackerel enter the plateau in significant numbers during summer (project: “Makrelur á Landgrunninum”, MáL, Faroe Marine Research Institute).
Nevertheless, there are normally between 0 and 20 out of 100 stations where herring and/or mackerel are caught during the spring groundfish survey that is conducted annually in March on Faroe Plateau (Figure 5.1). Even though this seems like a low number, it is not unthinkable that they may excert a predation pressure on fish larvae because the catchabilty of pelagic fish, such as herring and mackerel, in the bottom survey gear may be very low. The annual variation in mackerel is only weakly correlated with the total stock of mackerel in NE Atlantic (Figure 5.2) and for herring there is no correlation with the size of the stock of the Norwegian spring spawning herring or herring in the North Sea (not shown).
Figure 5.1 The abundance of mackerel and herring in the spring groundfish survey that occupies 100 trawl stations each year. Proportion of stations where either mackerel or herring are caught is also shown.
Figure 5.2 Total age 1+ biomass of the mackerel stock in the NE Atlantic ocean compared with the abundance of mackerel in the Faroese groundfish survey in March.
Stomach content analyses of cod, haddock (Melanogrammus aeglefinus), saithe (Pollachius virens) and Greenland halibut (Reinhardtius hippoglossoides) on Faroe Plateau have shown that cod of age 3+, saithe of age 3+ and Greenland halibut prey on both mackerel and herring. It is, therefore, likely that these pelagic fish may reduce their own predation risk by staying away when abundances of demersal fish is high and vice versa. Since there is no stock assessment of Greenland halibut in Faroese waters this species was not included in the analyses, but other fish species, such as age 3+ haddock and age 3+ ling (Molva molva) were included in order to represent the total potential predation risk of pelagic fish on Faroe Plateau. Saithe biomass may be up to an order of magnitude larger than the other species and in order to avoid this dominance and to divide the predation threat for pelagic fish equally between truly benthic fish species (cod, haddock, ling) and benthopelagic fish (saithe), the geometric mean of the stock sizes of cod+haddock+ling and saithe was taken. This measure is negatively correlated with the abundance of pelagic fish on Faroe Plateau (Figure 5.3).

Figure 5.3 Abundance of mackerel and herring in the spring groundfish survey on Faroe Plateau in March compared with the biomass of demersal fish as observed in stock assessments. The logit transformation is used = log((x+0.01)/(1-x+0.01). In the scatterplot the years from 2021–23 are omitted due to higher uncertainties associated with the last years of stock assessments. The biomass of demersal fish is calculated as the geometric mean of cod+haddock+ling and saithe that are at least three years old.
When modelling the abundance of fish larvae on Faroe Shelf we took a geometric mean of cod, haddock, Norway pout and sandeels in order to avoid that the most abundant species (Norway pout) dominated the measure. Other attempts to combine larvae of different species has also been used by Eliasen et al. (2011) and Jacobsen et al. (2019). Since the annual variation in larval abundance was several orders of magnitude we log-transformed the values. As the first explanatory variable we used a measure of ecosystem productivity, i.e., an index of primary production (e.g. Steingrund and Gaard, 2005). The second explanatory variable was the aforementioned biomass of demersal fish. The model (multiple linear regression) was run from 1990 to 2020 when all the variables were available and the biomass estimates of demersal fish were considered accurate. The model explained 41% of the variance and both explanatory variables were significant (p-value < 0.05). Importantly, both explanatory variables showed positive signs (+) meaning that increasing the value of the variables increased the value of the dependent variable. Hence, both primary production and biomass of demersal fish had a beneficial effect on the abundance of fish larvae. To illustrate the influence of the explanatory variables on the dependent variable, we have compiled a sensitivity analysis (Table 5.2). Varying the primary production from lowest to highest values increases fish larvae abundance by a factor of 26 while doing the same with fish biomass increases fish larvae abundance by a factor of 13. According to this model there is a great potential to increase the survival of fish larvae by managing the demersal fish stocks in such a way that their biomasses are high.
Table 5.1 Model output from multiple regression statistics performed in Microsoft Excel.
Regression Statistics | ||||||
Multiple R | 0,6709 | |||||
R Square | 0,4502 | |||||
Adjusted R Square | 0,4109 | |||||
Standard Error | 0,5666 | |||||
Observations | 31 | |||||
ANOVA | ||||||
df | SS | MS | F | Significante F | ||
Regression | 2 | 7,3609 | 3,6804 | 11,4624 | 0,00023 | |
Residual | 28 | 8,9905 | 0,3211 | |||
Total | 30 | 16,3514 | ||||
Coefficients | Standard Error | t Stat | P-value | Lower 95% | Upper 95% | |
Intercept | 0,9742 | 0,3926 | 2,48 | 0,019371 | 0,16990 | 1,77847 |
Primary production index | 0,1209 | 0,0296 | 4,08 | 0,000339 | 0,06020 | 0,18157 |
Geomean cod+haddock+ling and saithe biomasses ('000 t) | 0,0054 | 0,0024 | 2,3 | 0,029359 | 0,00058 | 0,01025 |
Figure 5.4 Modelling fish 0-group abundance on Faroe shelf by a primary production index and demersal fish (cod, haddock, ling, saithe) biomass. The panel to the left shows all variables while the right panel shows observed and modelled 0-group abundances.
Table 5.2 Sensitivity analysis of the output of the multiple regression model. The effect on the dependent variable (log of 0-group abundance) of varying the primary production and biomass values from the lowest to highest observed values and the ratio between them. Also, the ratio of the highest and lowest value in the table is shown in bottom right part of the table. The upper panel shows log-values and the lower panel back-transformed (antilog) values.
Biomass ('000 t) | |||||||
Primary prod. | 50 | 100 | 150 | 200 | 250 | Max-min | |
Log-values | 3 | 1,42 | 1,91 | 2,19 | 2,39 | 2,55 | 1,13 |
6 | 1,78 | 2,26 | 2,55 | 2,75 | 2,91 | 1,13 | |
9 | 2,13 | 2,62 | 2,90 | 3,1 | 3,26 | 1,13 | |
12 | 2,49 | 2,97 | 3,26 | 3,46 | 3,62 | 1,13 | |
15 | 2,84 | 3,33 | 3,61 | 3,82 | 3,97 | 1,13 | |
Max-min | 1,42 | 1,42 | 1,42 | 1,42 | 1,42 | 2,55 | |
50 | 100 | 150 | 200 | 250 | Max/min | ||
Antilog | 3 | 26 | 81 | 156 | 248 | 355 | 13 |
6 | 60 | 184 | 353 | 561 | 805 | 13 | |
9 | 136 | 416 | 800 | 1273 | 1825 | 13 | |
12 | 308 | 944 | 1815 | 2887 | 4138 | 13 | |
15 | 699 | 2140 | 4116 | 6548 | 9385 | 13 | |
Max/min | 26 | 26 | 26 | 26 | 26 | 355 | |
Figure 5.5 Sensitivity analysis of the multiple regression model, see Table 5.2. The lines represent primary production indices of 3 to 15.
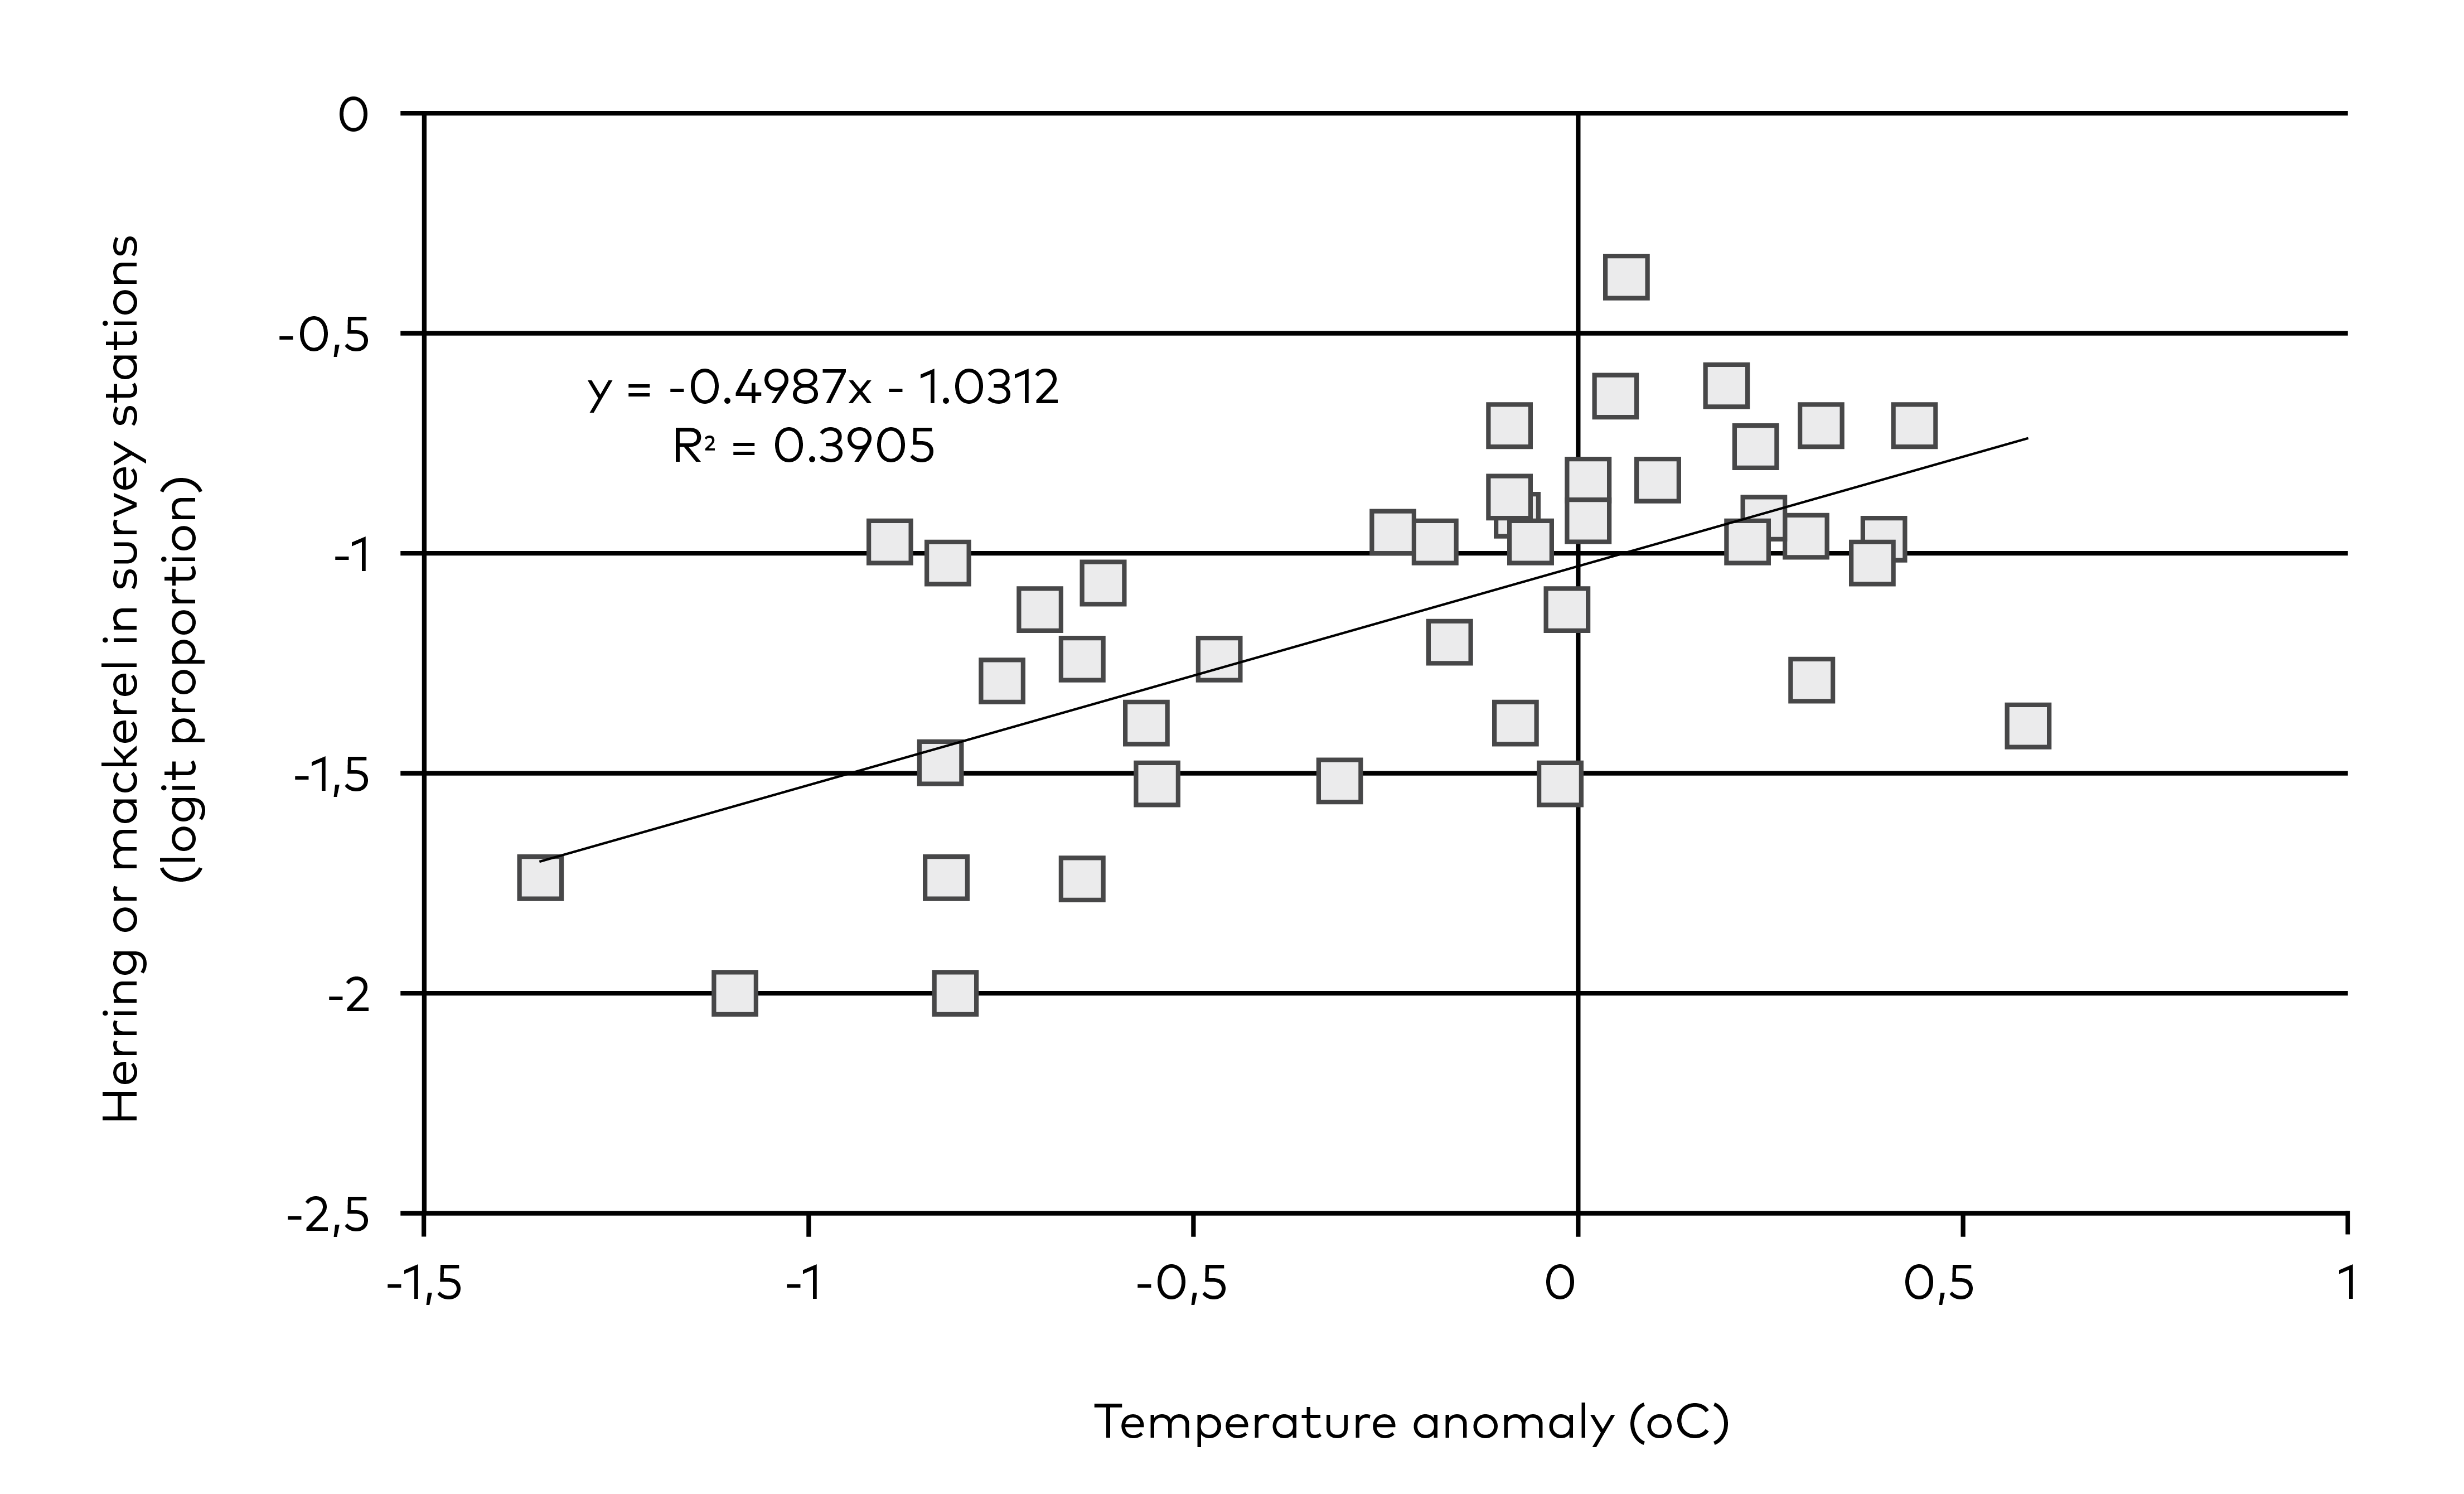
Figure 5.6 Abundance of mackerel and herring on Faroe Plateau in March and corresponding sea surface temperature in January-May (anomaly based on the 1992–2023 period).
Our model states that it is the productivity of the ecosystem and fishing mortality that drive the biomass of dermersal fish that in turn scare away pelagic fish or otherwise hamper the predation on fish larvae. This may represent a feedback loop where low biomasses of demersal fish are reinforced by high mortality on fish larvae. There are competing mechanisms, e.g. that temperature drives the abundance of pelagic fish on Faroe Plateu (Figure 5.6) or that temperature in combination with demersal fish determine the amount of pelagic fish and hence the predation on fish larvae. Even if our model is correct it is still possible that very high biomasses of demersal fish would reduce the abundance of fish larvae, e.g. by predation on sandeel larvae or other larvae.
Faroe Bank
Since no productivity index is available for Faroe Bank an index from Faroe Plateau is used that is based on the growth rate of the phytoplankton eating longlived shell A. Islandica, actually the difference between ‘shelf’ shells and ‘coastal’ shells (Matras et al., 2022). There is no stock assessment for demersal fish on Faroe Bank so a catch-per-unit effort measure is used instead. The model covered the years from 1996 to 2013, omitting years with missing data. The model explained 63% of the variance where the productivity index had a significant positive effect (p < 0.05) while the demersal fish index had a marginal positive effect (p = 0.17). The results therefore tend to support our hypothesis and also predicts that the sandeel abundances since 2017 should be high.
Figure 5.7 Modelling sandeel 0-group abundance on Faroe Bank by a productivity index (growth of A. islandica on Faroe Plateau) and a demersal fish index (cod+haddock catch per unit effort in the September groundfish survey).
Norwegian Shelf
Since there is no 0-group survey available along the Norwegian coast or time series of sandeels abundances, the breeding success of black-legged kittiwakes Rissa tridactyla was used as a proxy. The only available stock assessments of demersal fish in the area around Røst is the coastal cod stock (62–67 N) (providing a ratio between spawning stock biomass and sustainable biomass) and the coastal cod stock north of 67 N, where the spawning stock biomass in tons is available. Since Røst is situated just on the boundary of these two cod stocks we used a geometric average. The predation pressure on 0-group larvae was expressed as the biomass of age 1+ mackerel in the NE Atlantic, since no local time series of mackerel were available. The model was run for the years where data were available (1981–2020) even though a constant value for coastal cod was used prior to 1995. The model explained 49% of the variance and there was a significant positive effect of coastal cod biomass and a significant negative effect of mackerel biomass. Hence the model tends to support our hypothesis that demersal fish hamper pelagic fish in their predation of fish larvae.
Figure 5.8 Modelling kittiwake breeding success on the Norwegian shelf at Røst (62°11’N) as a function of coastal cod biomass and mackerel biomass in NE Atlantic. Coastal cod biomass was taken as the geometric mean of the biomass estimates of the two adjacend coastal cod stocks, i.e., southern stock (62o–67o N) and northern stock (north of 67o N).
Iceland shelf
Since the cod stock at Iceland dominates the biomass of demersal fish we only used cod as a measure of demersal fish on the Iceland shelf. We used the age 1+ biomass of mackerel in the NE Atlantic as a proxy for the predation on fish larvae by pelagic fish. The model covered the 1996–2023 period and explained 30% of the variance where cod had a significant positive effect on sandeels and mackerel a significant negative effect on sandeels (Figure 5.9). Hence, these results support our hypothesis that demersal fish hamper pelagic fish in their predation of fish larvae. However, the model expects high abundances of sandeels back in the 1950–60s, which contrasts the harvest of puffins in Vestmannaeyjar that was low during this period. Either puffins rely much on other food types than sandeels (krill) or a top-down effect of cod on sandeels has occurred at high cod stock sizes or that our model is wrong. Hence, our hypothesis is not so well established for the Iceland shelf.
Figure 5.9 Modelling sandeel abundance on the Icelandic shelf (at age ca. 2 years as observed in cod stomachs) as a function of cod age 3+ biomass (two years before to reflect age 0 sandeels) and 1+ mackerel biomass in NE Atlantic (two years before).
Investigating Norway pout as a potential predator on fish larvae
The models explored above were based on the assumption that pelagic fish, such as herring and mackerel are important predators on fish larvae. In order to use a broader approach, we also briefly explore the potential of Norway pout to be a predator on fish larvae on Faroe Plateau. As already noted, Norway pout prey on both fish eggs and fish larvae (Albert, 1994) and this is also observed by the current author on Faroe Plateau (Figure 5.10). There is probably a feedback loop between cod, Norway pout and sandeel larvae, that again affect cod recruitment (Figure 5.11):
- cod prey on Norway pout and hamper their abundance (Figure 5.12)
- large Norway pout (modelled as Norway pout biomass index two years later) hamper the year-class strength of sandeel larvae (Figure 5.13).
- Sandeel abundance has a positive effect on juvenile cod survival and recruitment to the cod stock, which affects the biomass of cod positively (Figure 5.14), although the cod age 3+ biomass (Steingrund et al., 2010) and the amount of Modified East Icelandic Water (MEIW) north of Faroe Islands also have a positive effect.
Sandeel larval abundance is also affected by the level of the primary production (Figure 5.15). Sandeel larval abundance can be modelled by primary production and Norway pout biomass two years before (Figure 5.16).
A preliminary modelling exercise was performed where the fishing mortality on cod was varied. Fishing mortality on cod reduces the age 3+ biomass of cod and hence cod recruitment that again reduces the predation rate on Norway pout that again increase the predation rate on larval sandeels that again decrease the recruitment of cod. The observed primary production as well as MEIW values 1990s to 2020 were projected into the future, i.e., to year 2149, while the cod and Norway pout biomasses and sandeel larval abundance were modelled. The average values from year 2050 to year 2149 were used as output.
The results (Figure 5.17) showed, as expected, that cod biomass decreased with increasing fishing mortality as well as cod recruitment (here shown as number of 2 year old cod, N2). Importantly, the catch was highest at F=0.2, i.e., at a much lower fishing mortality than experienced during the last decade where F has been around 0.6. If the values of Norway pout and sandeel larvae are standardized to the current F of 0.62, i.e. set to 1 at this fishing mortality, it is seen that the abundance of sandeel larvae is expected to increase by a factor of 2.3 if the fishing mortality is reduced to 0.2 while the biomass of Norway pout is expected to be orders of magnitude less compared with the F of 0.62. The amount of Norway pout is expected to increase by a factor of 2 if the fishing mortality is increased to 0.8. If it is assumed that seabirds would benefit from a diet of sandeels rather than Norway pout the modelling exercise shows that the optimization of cod catch and seabird food go hand in hand and that there is probably much to gain. More work should be done to validate that Norway pout actually are so important predators on sandeel larvae. More model settings could be explored, for example that cod actually are the causal agent of Norway pout biomass.
Future studies should explore in more details to which degree pelagic fish, such as herring and mackerel, affect fish larval survival and, if so, whether the effect of demersal fish biomass really decreases the predation by pelagic fish on fish larvae. Going one level down in the food chain, to zooplankton, and broadening the perspective much more, it should be investigated whether there are top-down effects of pelagic fish (herring and blue whiting) on the zooplanktonvorous amphipod Themisto in the Norwegian Sea, which is an important predator on Calanus finmarchicus (Skjoldal et al., 2004), and, if so, whether the effect is strong enough to increase the biomass of Calanus finmarchicus in the Norwegian Sea. If this holds true, it could affect the whole Norwegian Sea ecosystem a be an excellent case of ecosystem based management.
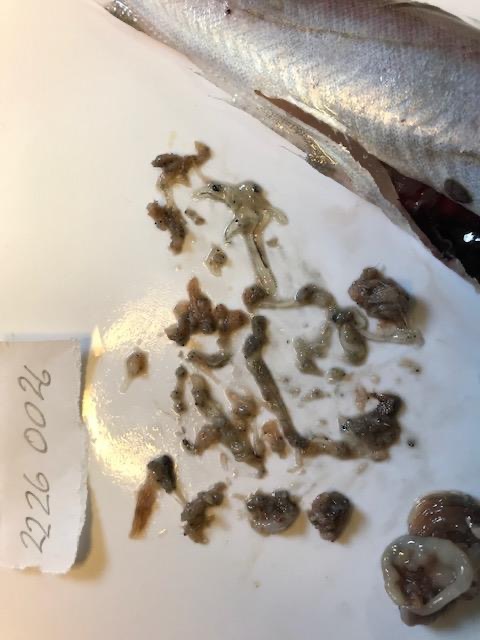
Figure 5.10 Gut content of Norway pout that was captured in the Faroese 0-group trawl survey in June 2022. In the upper part of the gut content, sandeel larvae can be observed.
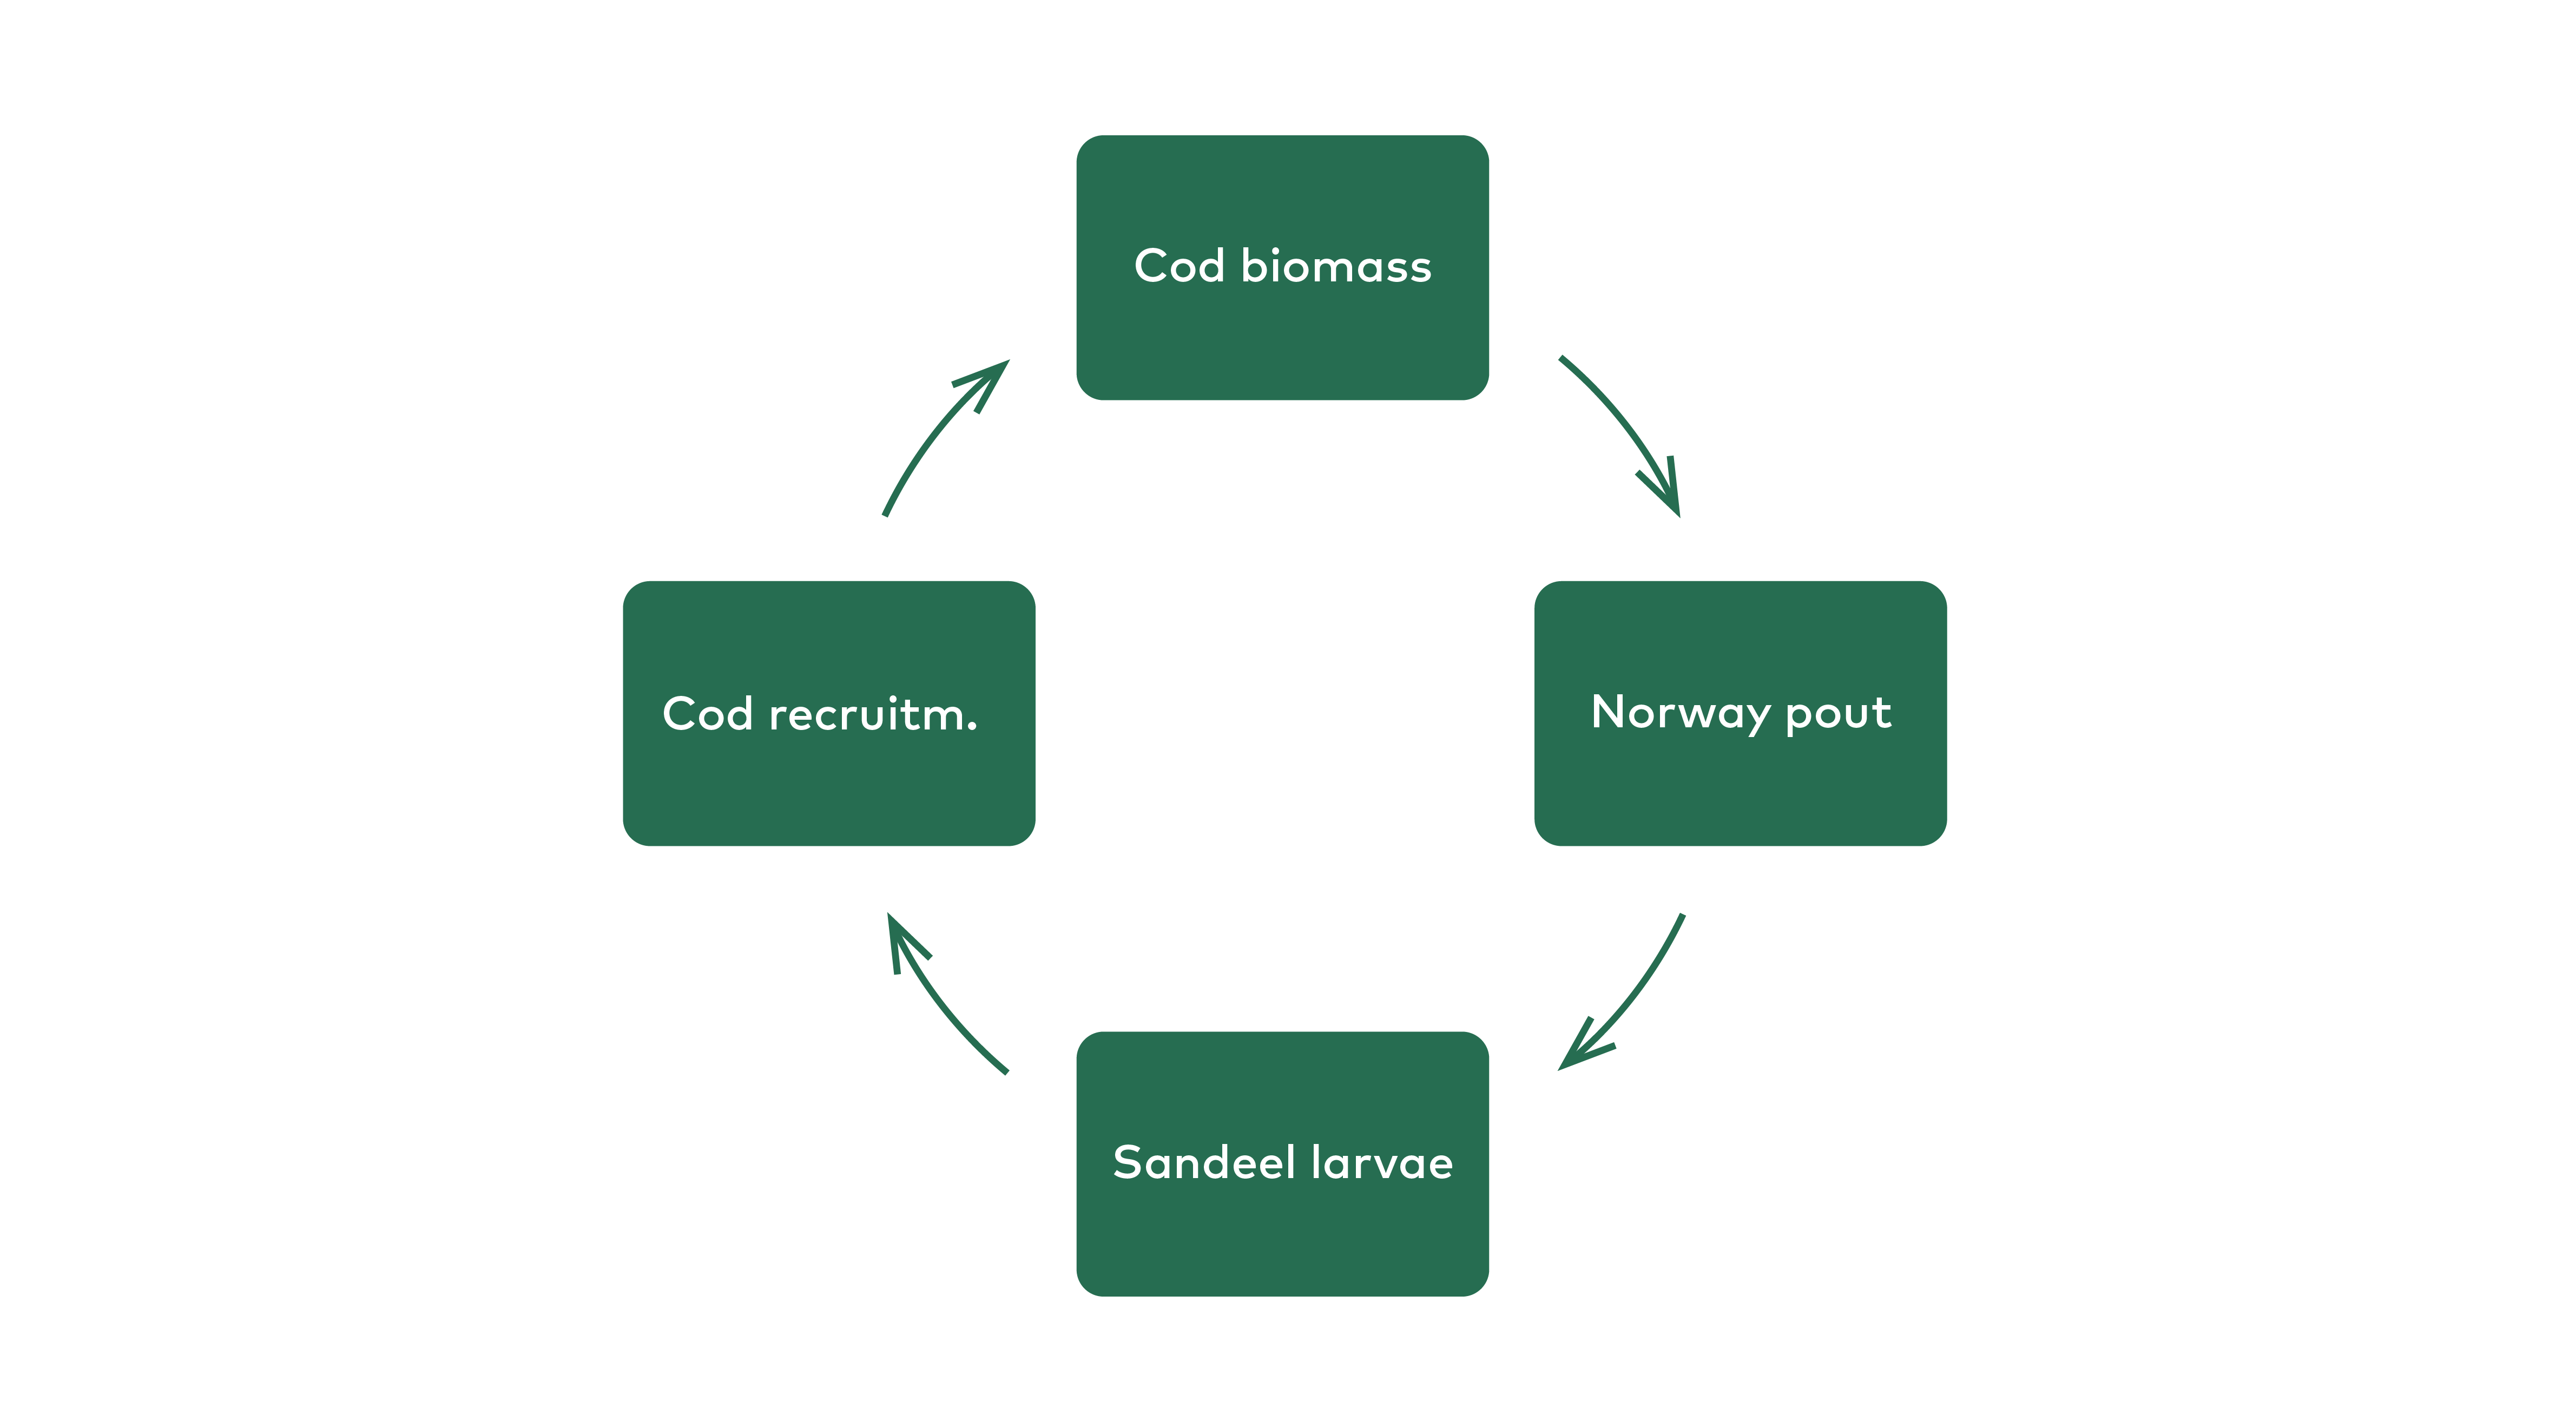
Figure 5.11 Feeback loop between cod, Norway pout and sandeel larvae. Cod have a negative effect on Norway pout abundance, that prey on sandeel larvae, that have a positive effect on cod juveniles (recruitment) that in turn has a positive effect on cod biomass.
Figure 5.12 Biomass index for Norway pout on Faroe Plateau in the August groundfish survey compared with cod biomass two years before (y-2) as obtained from the stock assessment.
Figure 5.13 Biomass index of Norway pout, two years before (y-2), and abundance index of sandeel larvae.
Figure 5.14 Sandeel larvae and cod recruitment at age 1.
Figure 5.15 Sandeel larvae and primary production on Faroe Plateau.
Figure 5.16 Abundance of sandeel larvae modeled by primary production and Norway pout two years before (y-2).
Figure 5.17 Upper: Simulations of cod recruitment, biomass and catch as a function of fishing mortality. Lower: Relative amounts of sandeels and Norway pout. The simulations are shown for medium amounts of MEIW. Results reflect the average values of the 2050–2149 period. N2: number of 2 year old cod. B2+: biomass of 2 year old fish and older. B3+: biomass of 3 year old fish and older.
Concluding remarks and future studies
Our hypothesis is that the abundance of fish larvae is regulated by ecosystem productivity, predation by pelagic fish (and probably Norway pout) and mitigation of the predatory effect by demersal fish. Our hypothesis seems to have some support in all four Nordic shelves although there were potential caveats in all four cases. To our knowledge our hypothesis is novel and should be substantiated with future studies. The hypothesis indicates the existence of a feedback loop between demersal fish, survival of fish larvae due to predation by pelagic fish that is mitigated by demersal fish and this closes the circle back to demersal fish. It is implied that once the demersal fish have reached a low biomass they might stay there for long periods and vice versa. If the hypothesis turns out to be correct it may be a means to restore not only demersal fish stocks but also seabirds in the NE Atlantic. An important finding might be that restoring demersal fish populations goes well along with restoring seabird populations. However, since juveniles of pelagic fish, such as herring, mackerel and blue whiting might be closely associated with the Nordic shelves during their first year of life it should be investigated whether it results in higher mortality from large restored demersal fish populations and whether it leads to smaller pelagic fish stocks. The case provided in this section of the report could provide a good basis of ecosystem based management.
References
Albert, O.T. 1994. Biology and ecology of Norway pout (Trisopterus esmarki Nilsson, 1855) in the Norwegian Deep. ICES Journal of Marine Science, Volume 51, Issue 1, 1994, Pages 45–61, https://doi.org/10.1006/jmsc.1994.1005
Bailey, K.M. and Houde, E.D. (1989) Predation on eggs and larvae of marine fishes and the recruitment problem. Advances in Marine Biology, 25, 1–83.
Christensen, V. 2010. Behavior of Sandeels Feeding on Herring Larvae. The Open Fish Science Journal, 2010, 3, 164-168.
Eliasen, K., Reinert, J., Gaard, E., Hansen, B., Jacobsen, J. A., Grønkjær, P., & Christensen, J. T. (2011). Sandeel as a link between primary production and higher trophic levels on the Faroe shelf. Marine Ecology Progress Series, 438, 185-194.
Frederiksen, M., Furness, R. W., and Wanless, S. 2007. Regional variation in the role of bottom-up and top-down processes in controlling sandeel abundance in the North Sea. Mar Ecol Prog Ser, Vol. 337: 279–286, 2007.
ICES. 2023a. Northwestern Working Group (NWWG). ICES Scientific Reports. 5:64. https://doi.org/10.17895/ices.pub.23267153
ICES. 2023b. Working Group on Widely Distributed Stocks (WGWIDE). ICES Scientific Reports. 5:82. https://doi.org/10.17895/ices.pub.24025482
ICES. 2024a. Working Group on the Biology and Assessment of Deep-sea Fisheries Resources (WGDEEP). ICES Scientific Reports. 6:56. http://doi.org/10.17895/ices.pub.25964749
ICES. 2024b. Arctic Fisheries Working Group (AFWG). ICES Scientific Reports. 6:61. https://doi.org/10.17895/ices.pub.25970272
Jacobsen, S., Gaard, E., Hátún, H., Steingrund, P., Larsen, K.M.H., Reinert, J., Ólavsdóttir, S.R., Poulsen, M., and Vang, H.B.M. 2019. Environmentally driven ecological fluctuations on the Faroe Shelf revealed by fish juvenile surveys. Front. Mar. Sci. 6:559. doi: 10.3389/fmars.2019.00559.
Kvaavik C, Óskarsson GJ, Daníelsdóttir AK, Marteinsdóttir G (2019). Diet and feeding strategy of Northeast Atlantic mackerel (Scombrus scomber) in Icelandic waters. PLoS ONE 14(12): e0225552. https://doi.org/10.1371/journal.pone.0225552
Matras, U., Salter, I., Larsen, K.M.H., Gaard, E. and Steingrund, P. (2022). Relationship between plankton dynamics and growth of the long-lived clam Arctica islandica on the Faroe shelf. Front. Mar. Sci. 9:822343. doi: 10.3389/fmars.2022.822343
Nørrevang, A. (1977). Fuglefangsten på Færøerne. Rhodos.
Régnier, T., Gibb, F. M. & Wright, P. J. 2019. Understanding terperture effects on recruitment in the context of tropic mismatch. Nature 9:15179
Skjoldal, H.-R., Dalpadado, P., and Dommasnes, A. 2004. Food webs and trophic interactions. In: The Norwegian Sea Ecosystem, edited by Skjoldal, H.-R., Sætre, R., Fernö, A., Misund, O.A. and Røttingen, I. p 447-506. Tapir Academic Press.
Steingrund, P. and Gaard, E. 2005. Relationship between phytoplankton production and cod production on the Faroe shelf. ICES Journal of Marine Science, 62: 163-176.
Steingrund, P., Mouritsen, R., Reinert, J., Gaard, E., and Hátún, H. 2010. Total stock size and cannibalism regulate recruitment in cod (Gadus morhua) on the Faroe Plateau. ICES Journal of Marine Science, 67: 111-124.
van Deurs M, Hartvig M, Steffensen JF (2011). Critical threshold size for overwintering sandeels (Ammodytes marinus). Mar Biol 158: 2755−2764.