2. NovasArc – background and step by step from data to management relevance
NovasArc is a long-term collaboration initiated in 2014 by the Institute of Marine Research in Norway and Marine and Freshwater Institute in Iceland to enhance research on cold-water corals in the N-Atlantic, shortly after the group published a paper focusing on distribution of nine coral species in the cold temperate North Atlantic (Buhl-Mortensen et al. 2015). In 2016, the Faroe Marine Research Institute joined the consortium, and the focus was broadened to consider diverse Vulnerable Marine Ecosystems (VMEs) in the Nordic Seas including all recorded corals in the region and sponge species indicating sponge aggregations. This was published in the TemaNord report series (Buhl-Mortensen et al. 2019) and see also Burgos et al. 2020.
A six-step workflow describing the project approach over time is listed in section 2 with updates from this phase we refer to as NovasArc II.
Figure 1. The six steps of the NovasArc workflow.

2.1. Step 1: Definition and selection of Vulnerable Marine Ecosystems for the Nordic seas.
The NovasArc project uses the FAO definition and criteria to identify VMEs, where “VMEs constitute areas that may be vulnerable to impacts from fishing activities” (www.fao.org). For selecting the relevant vulnerable marine ecosystems in the Arctic and sub-Arctic areas for this project, previous VME classifications for the North Atlantic were considered (OSPAR 2008, ICES 2016). As a result, eleven different types (Figure 2) were defined and selected. The inclusion of these generated models showed more realistic spatial distribution of habitat suitability compared to earlier model outputs (see Buhl-Mortensen et al. 2019).
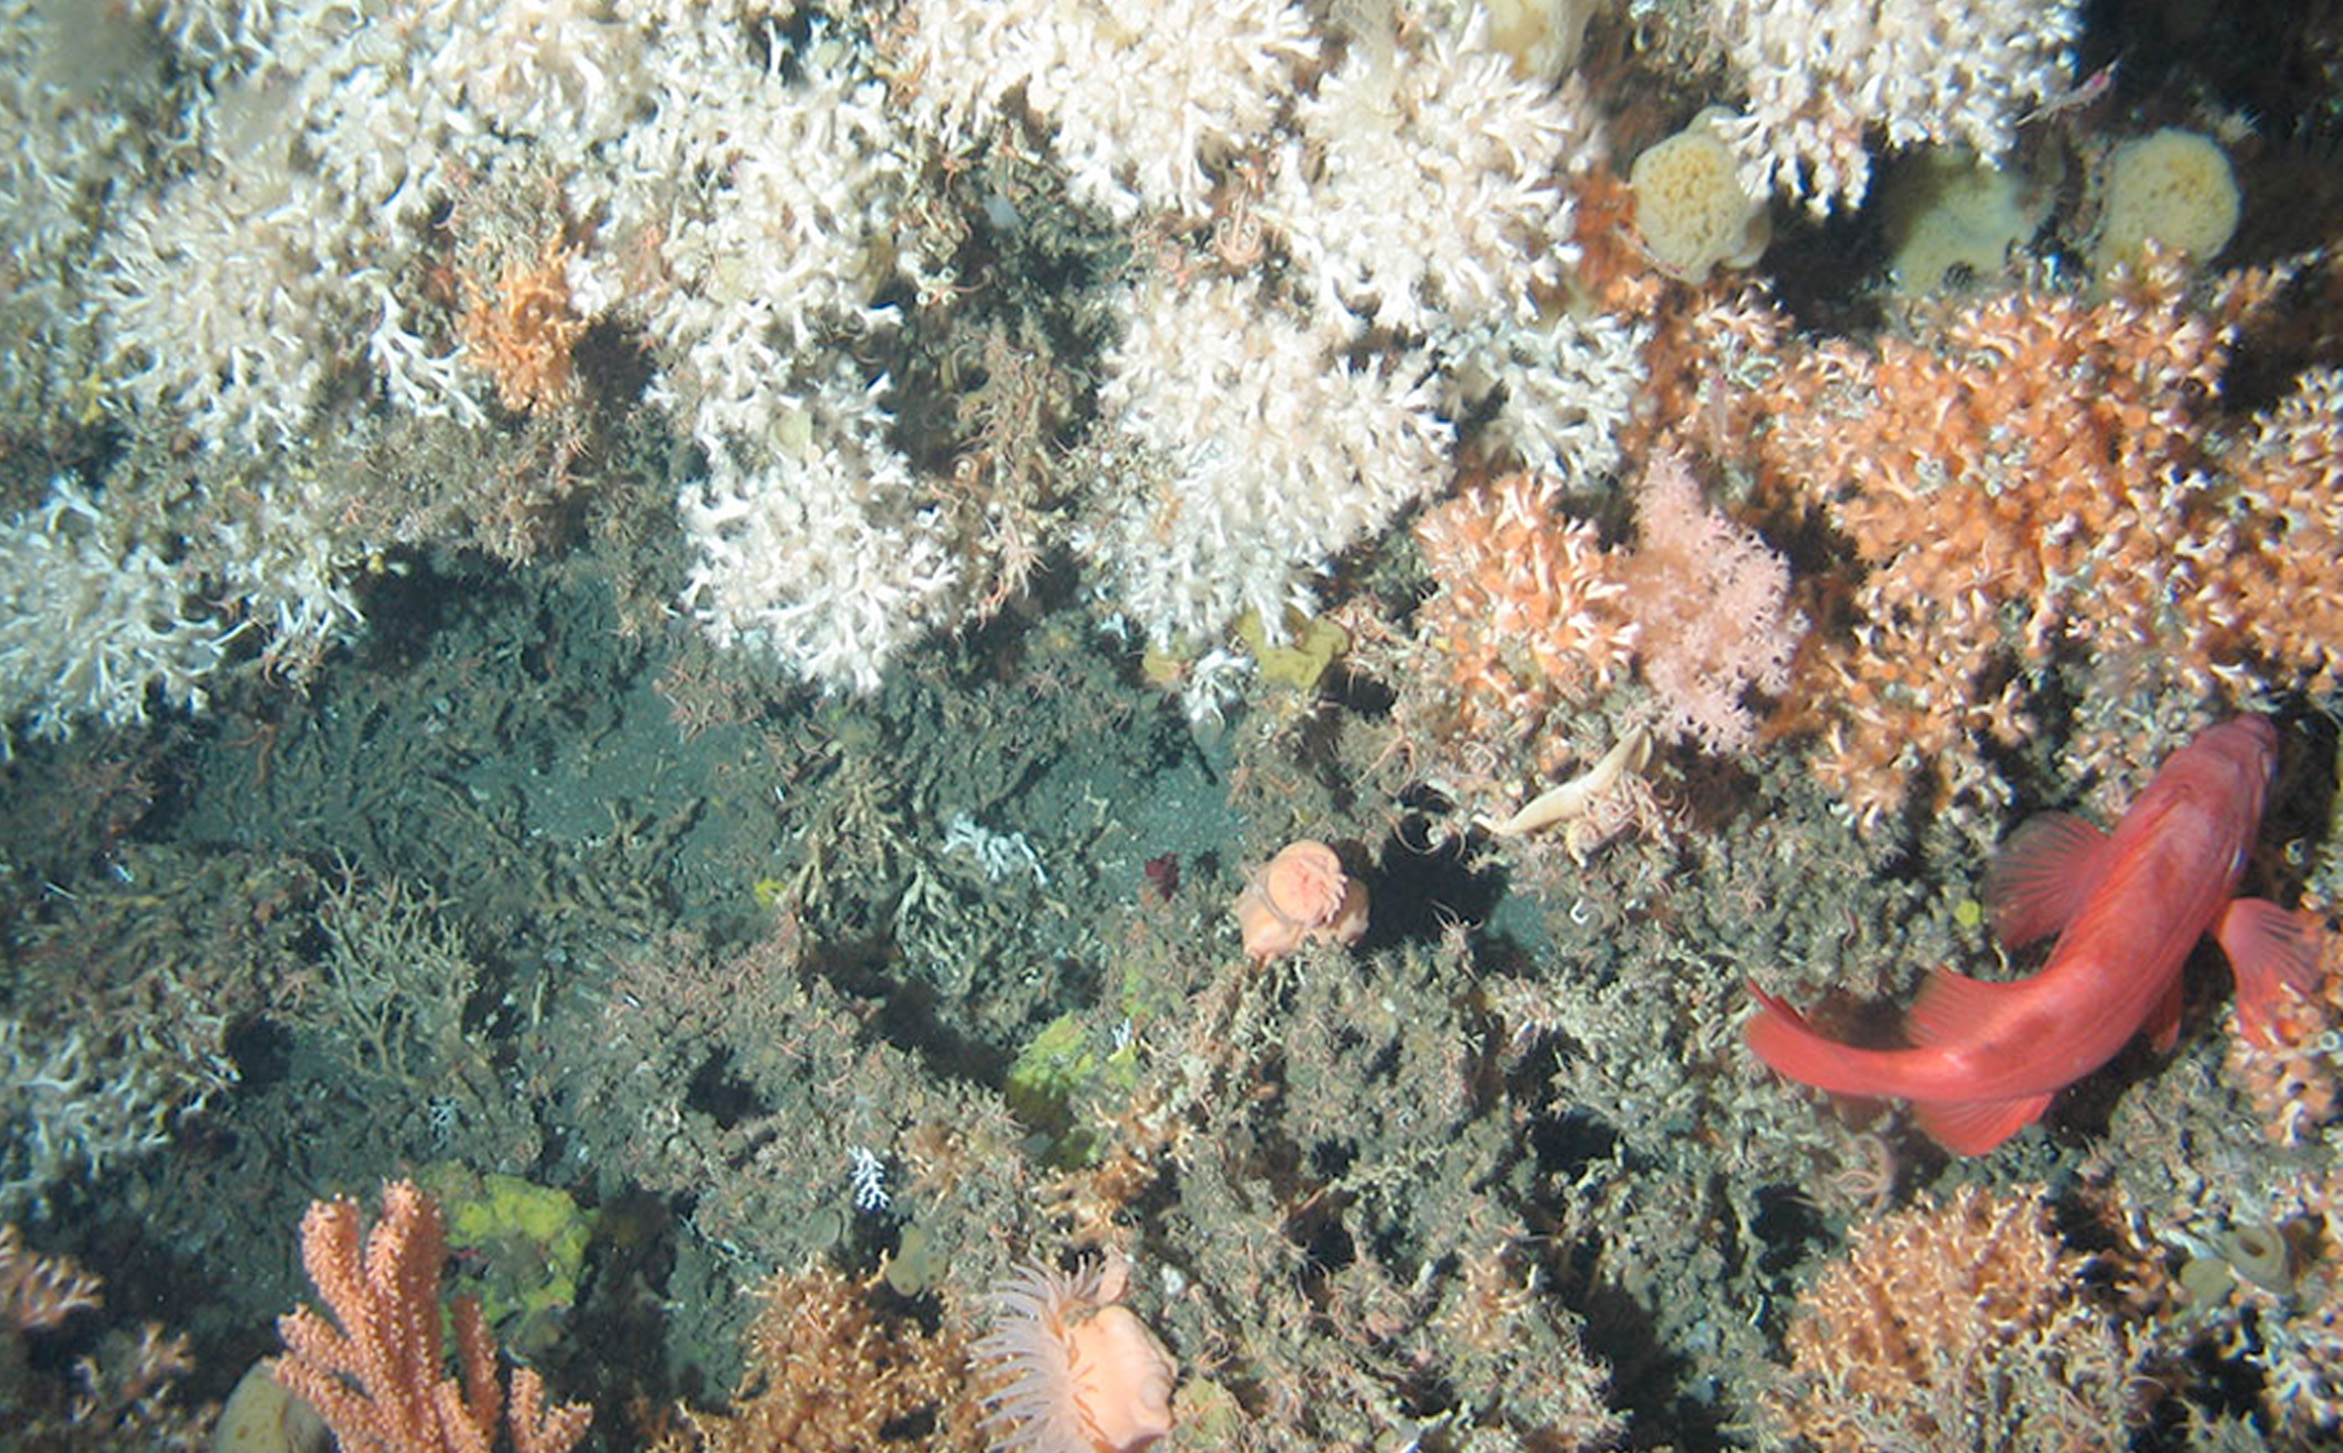
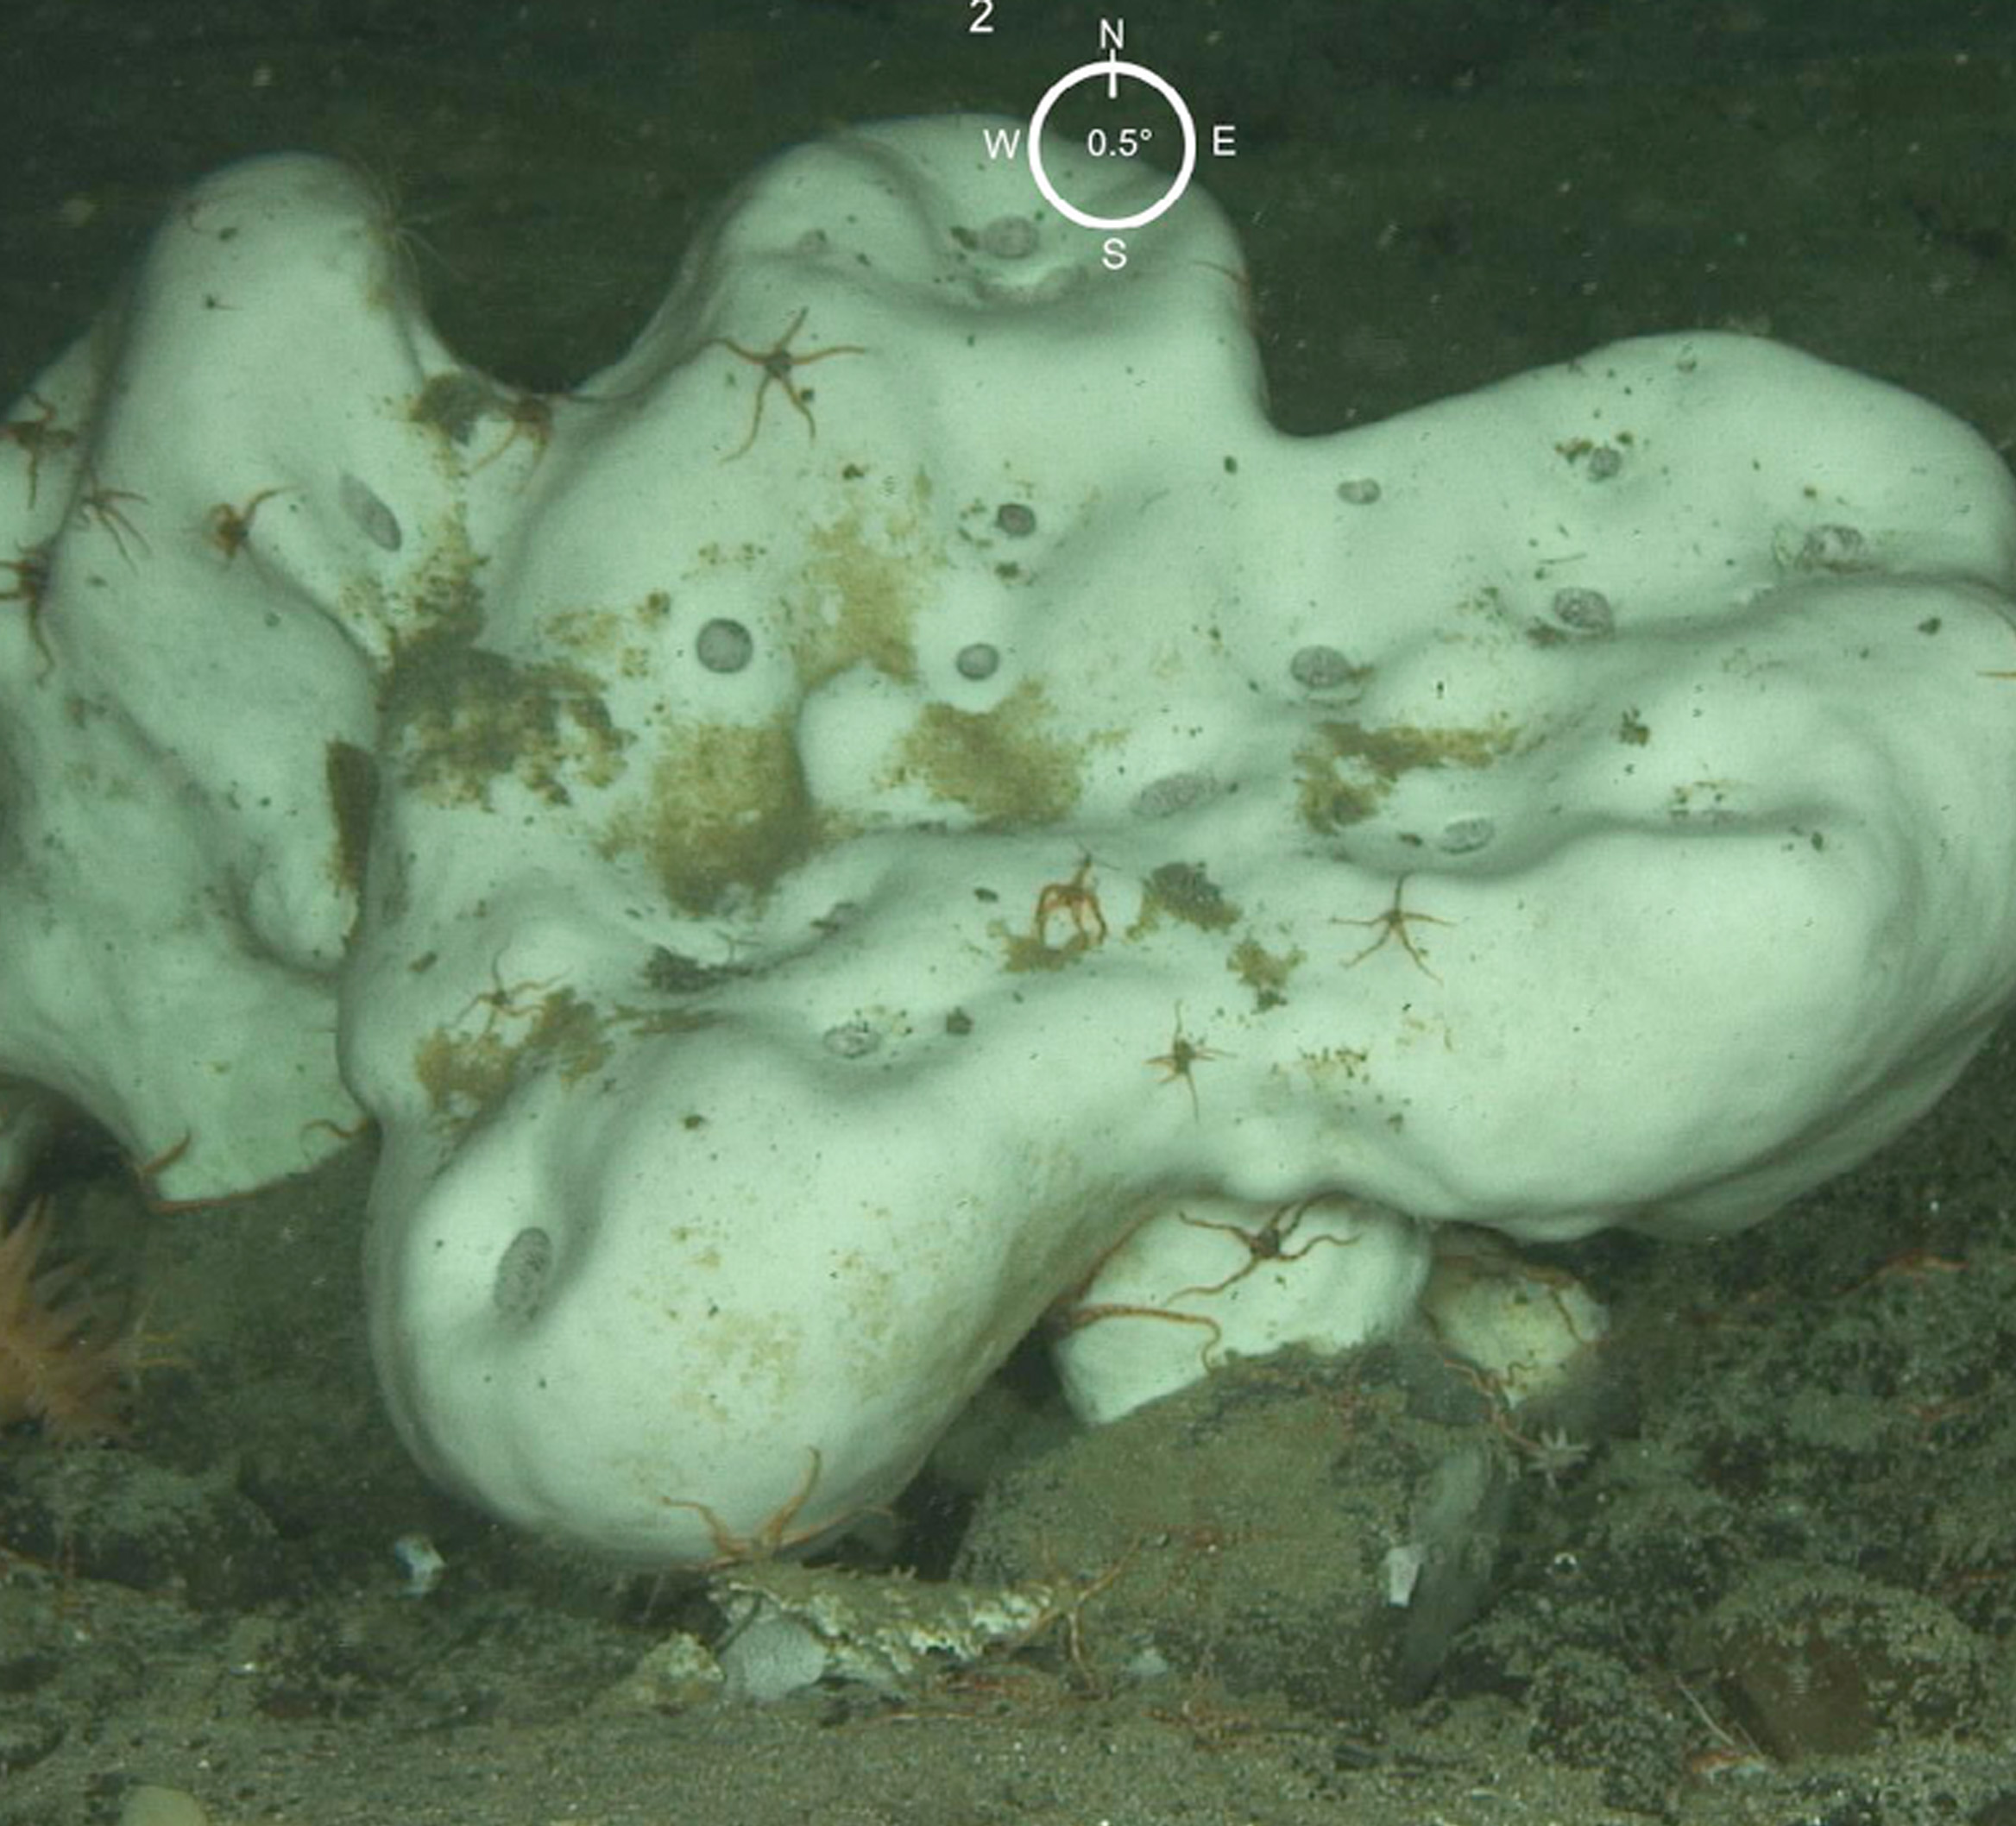
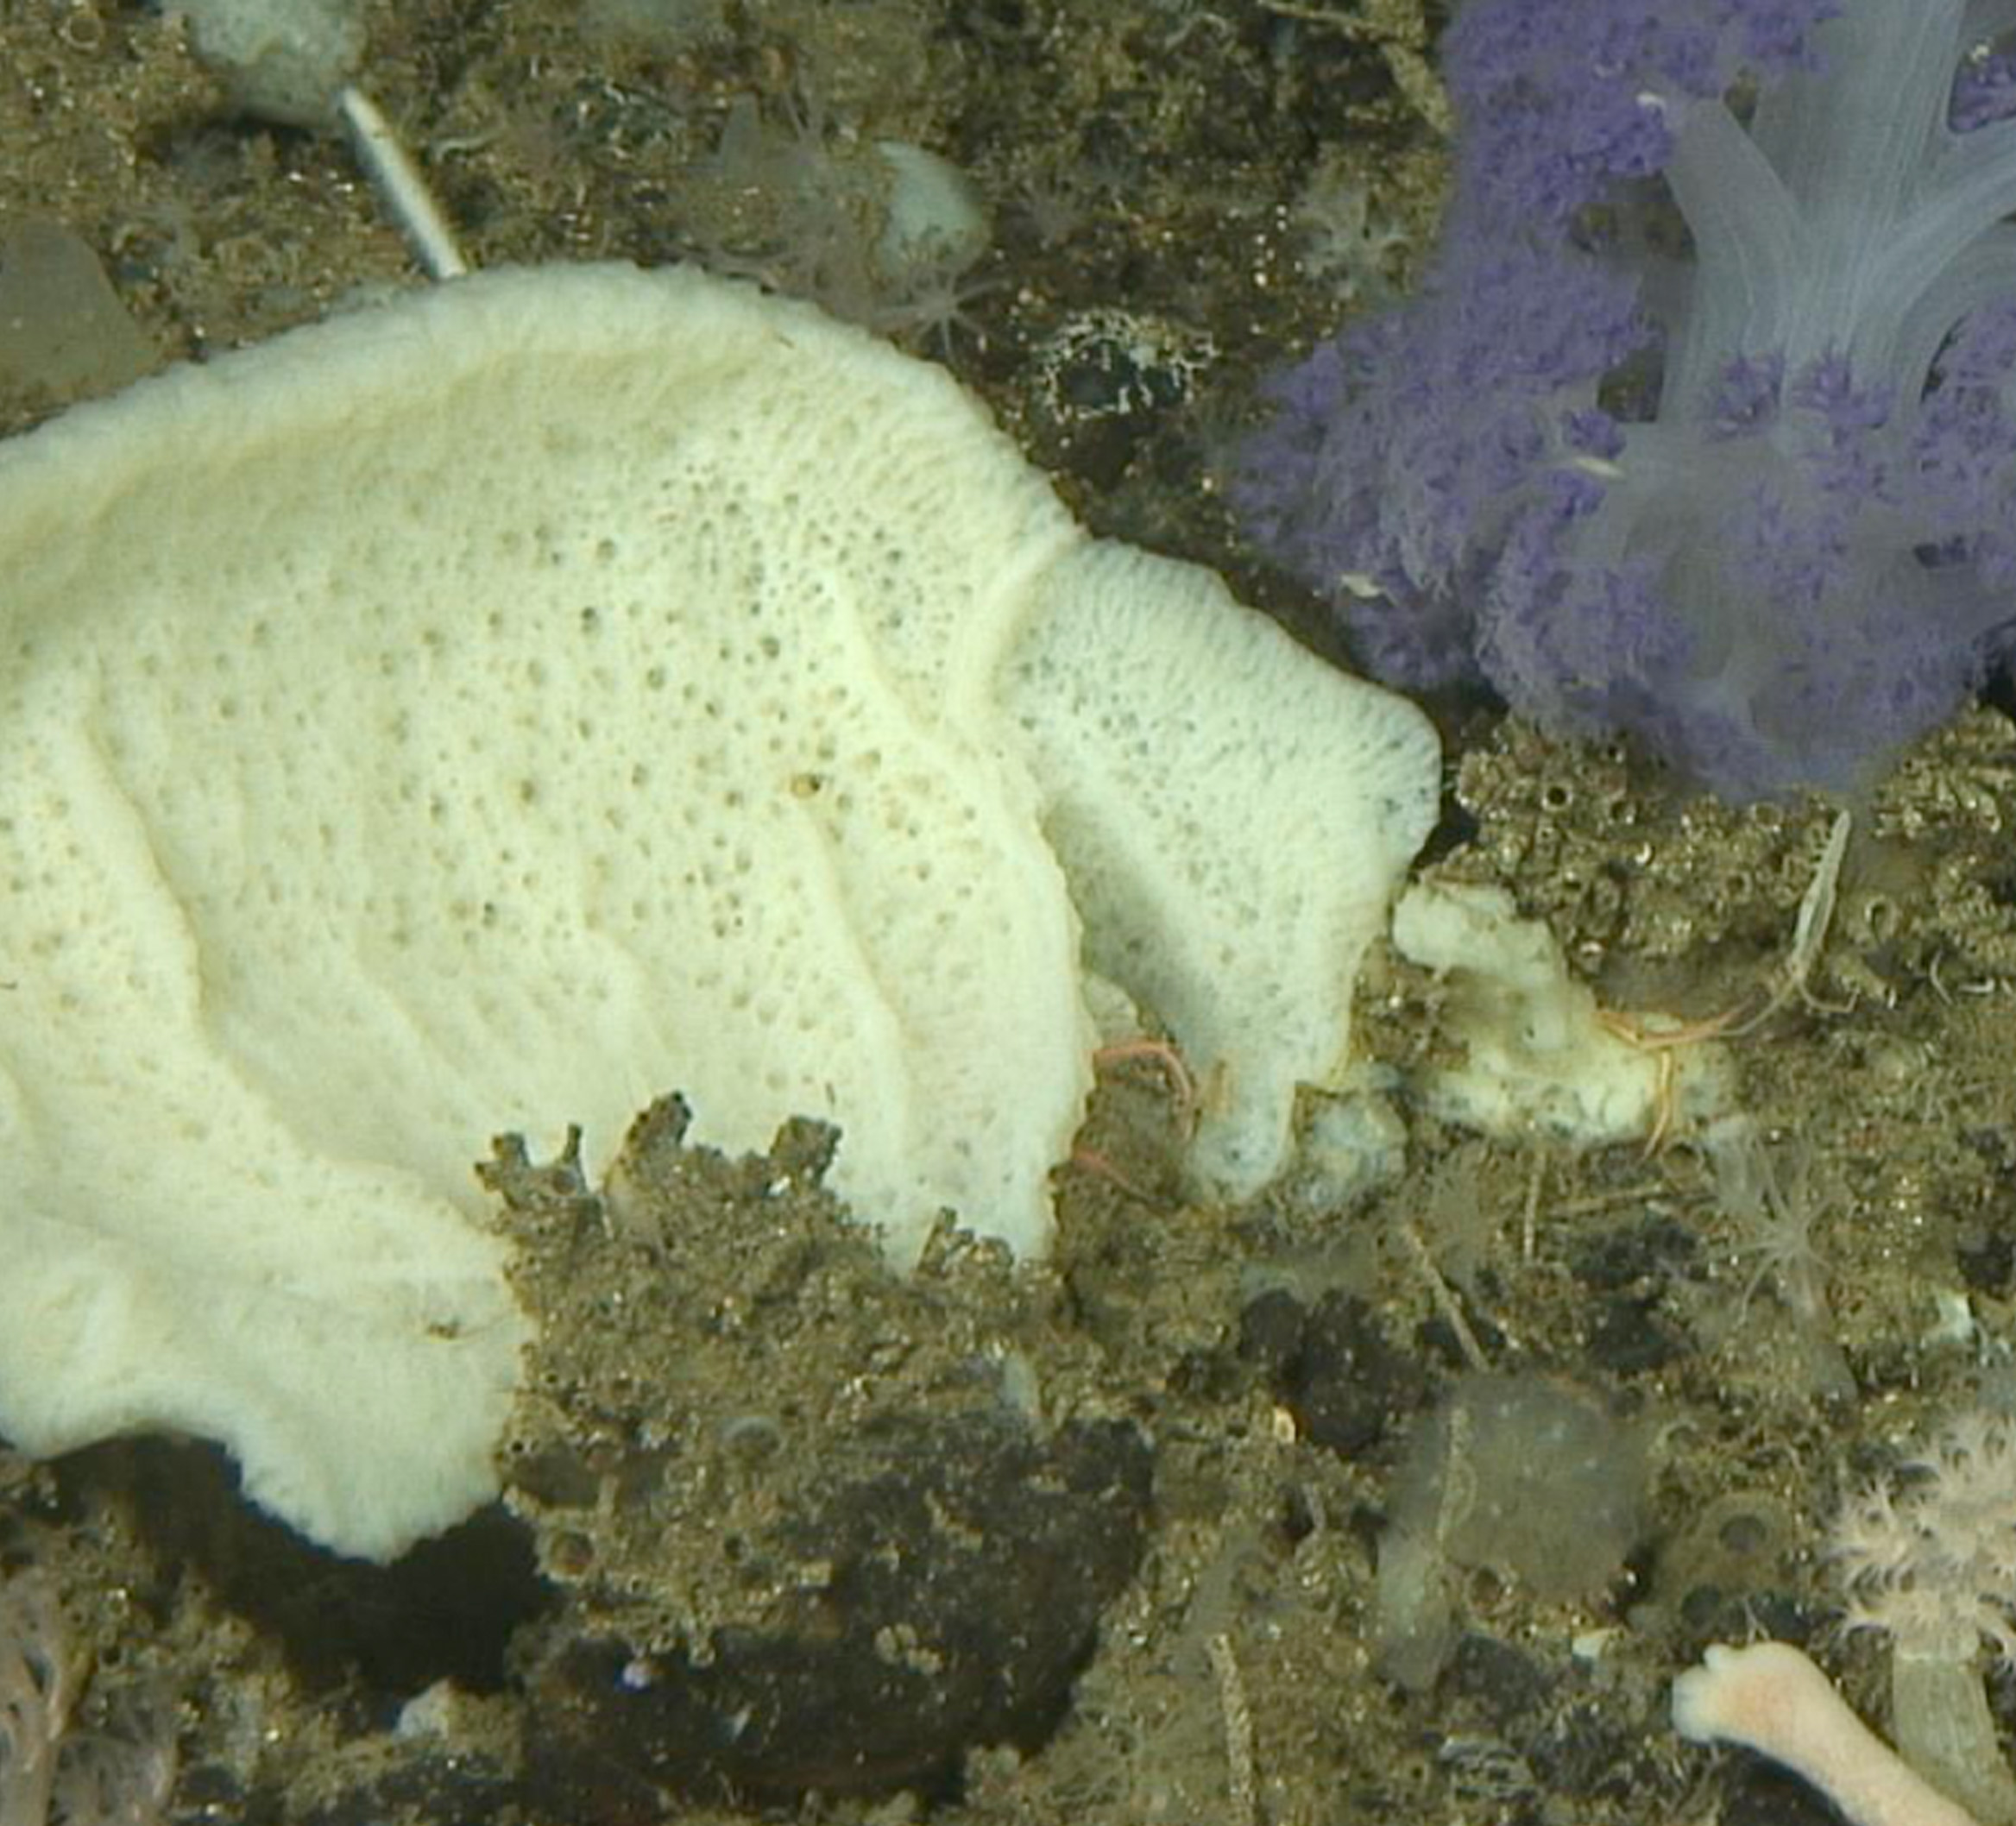
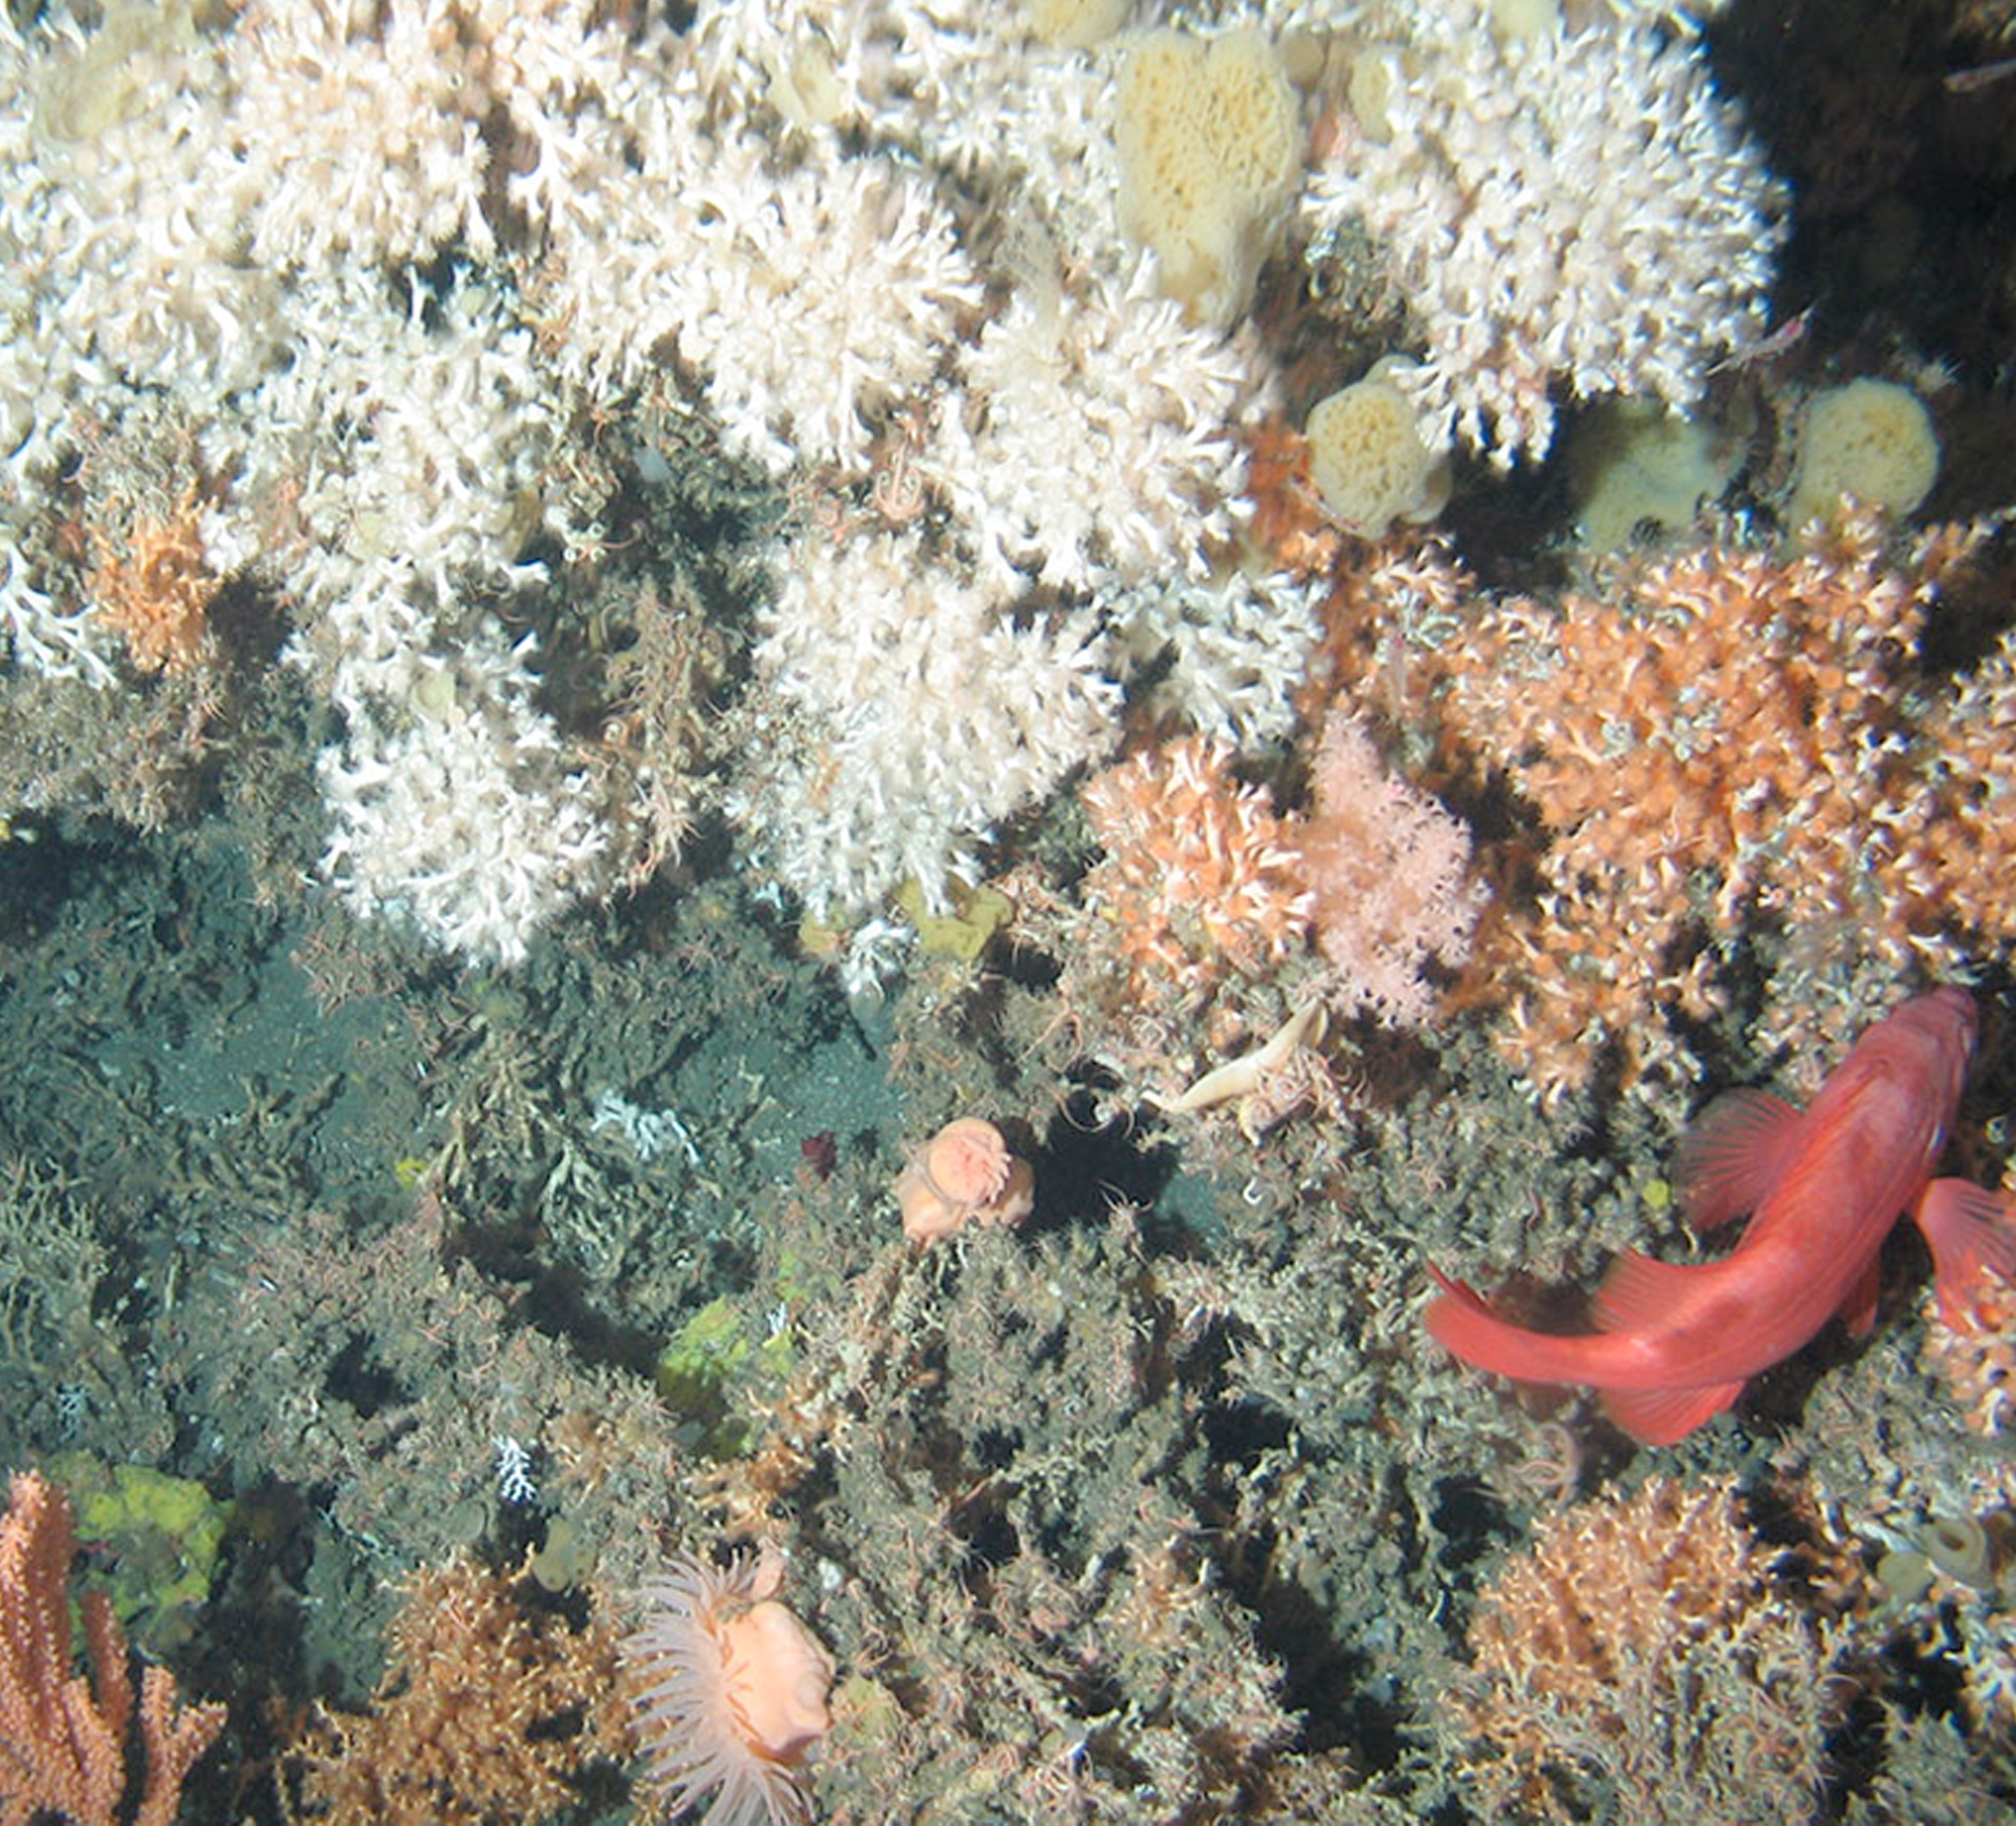
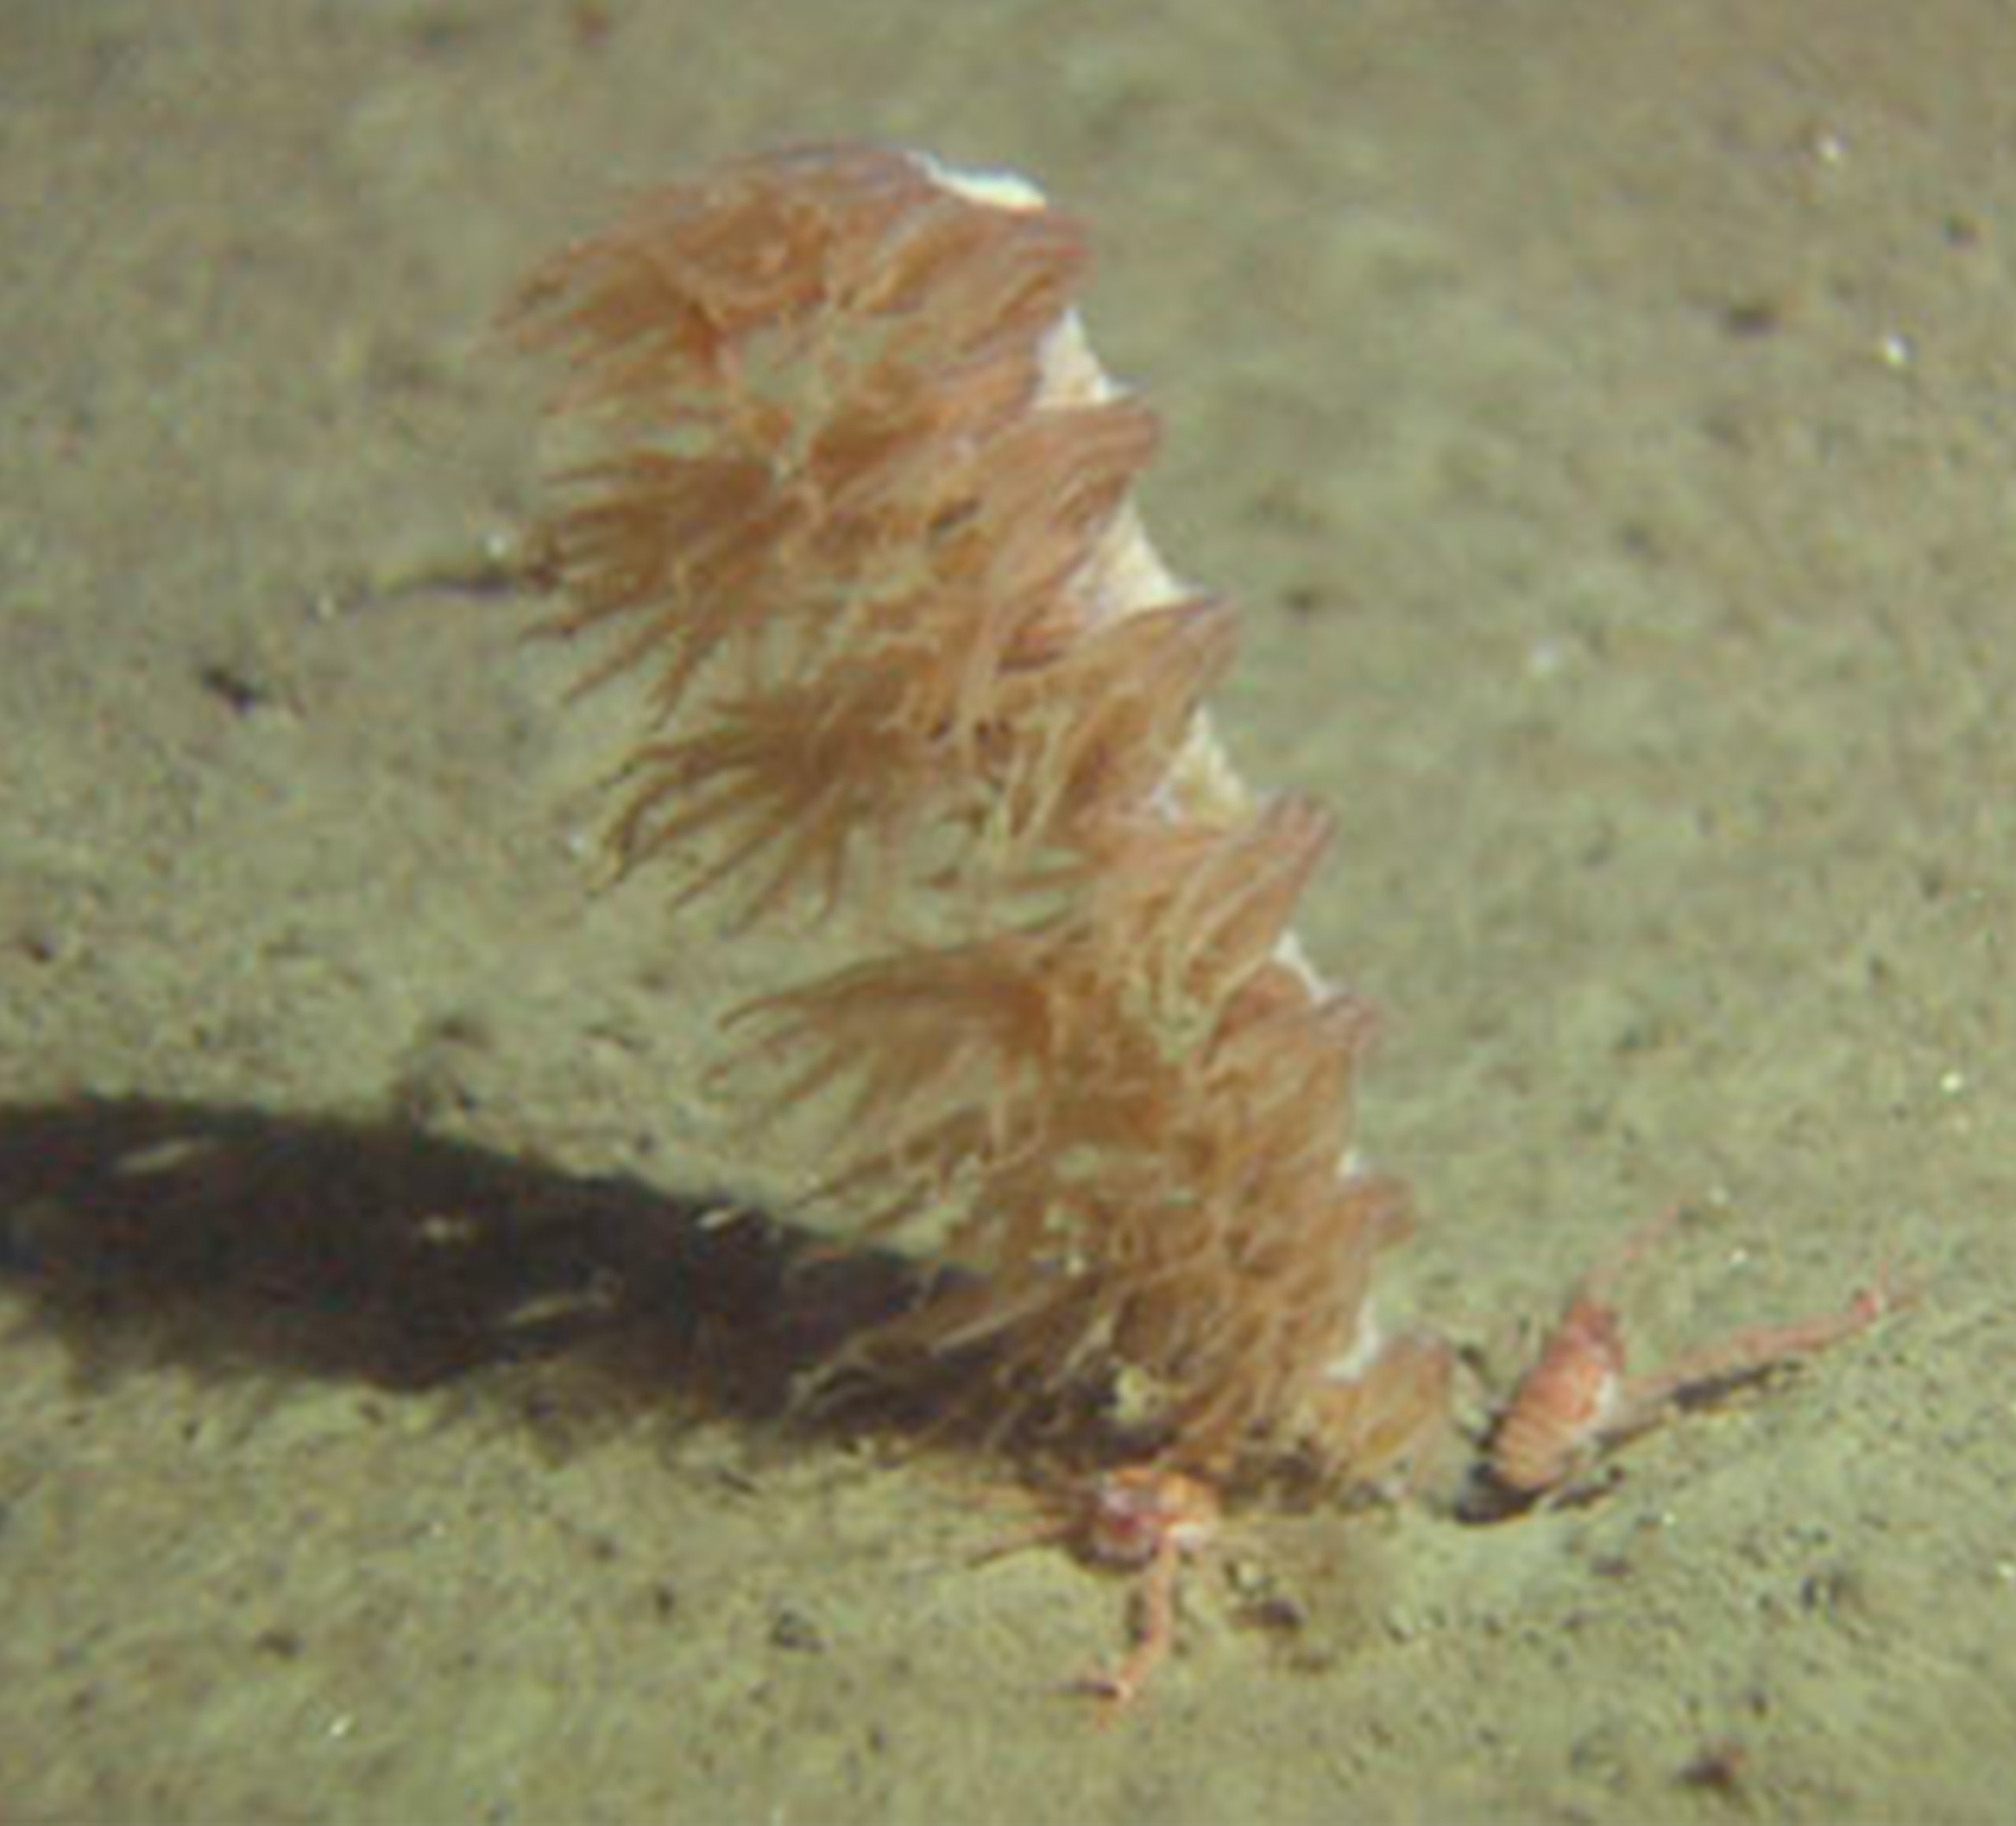
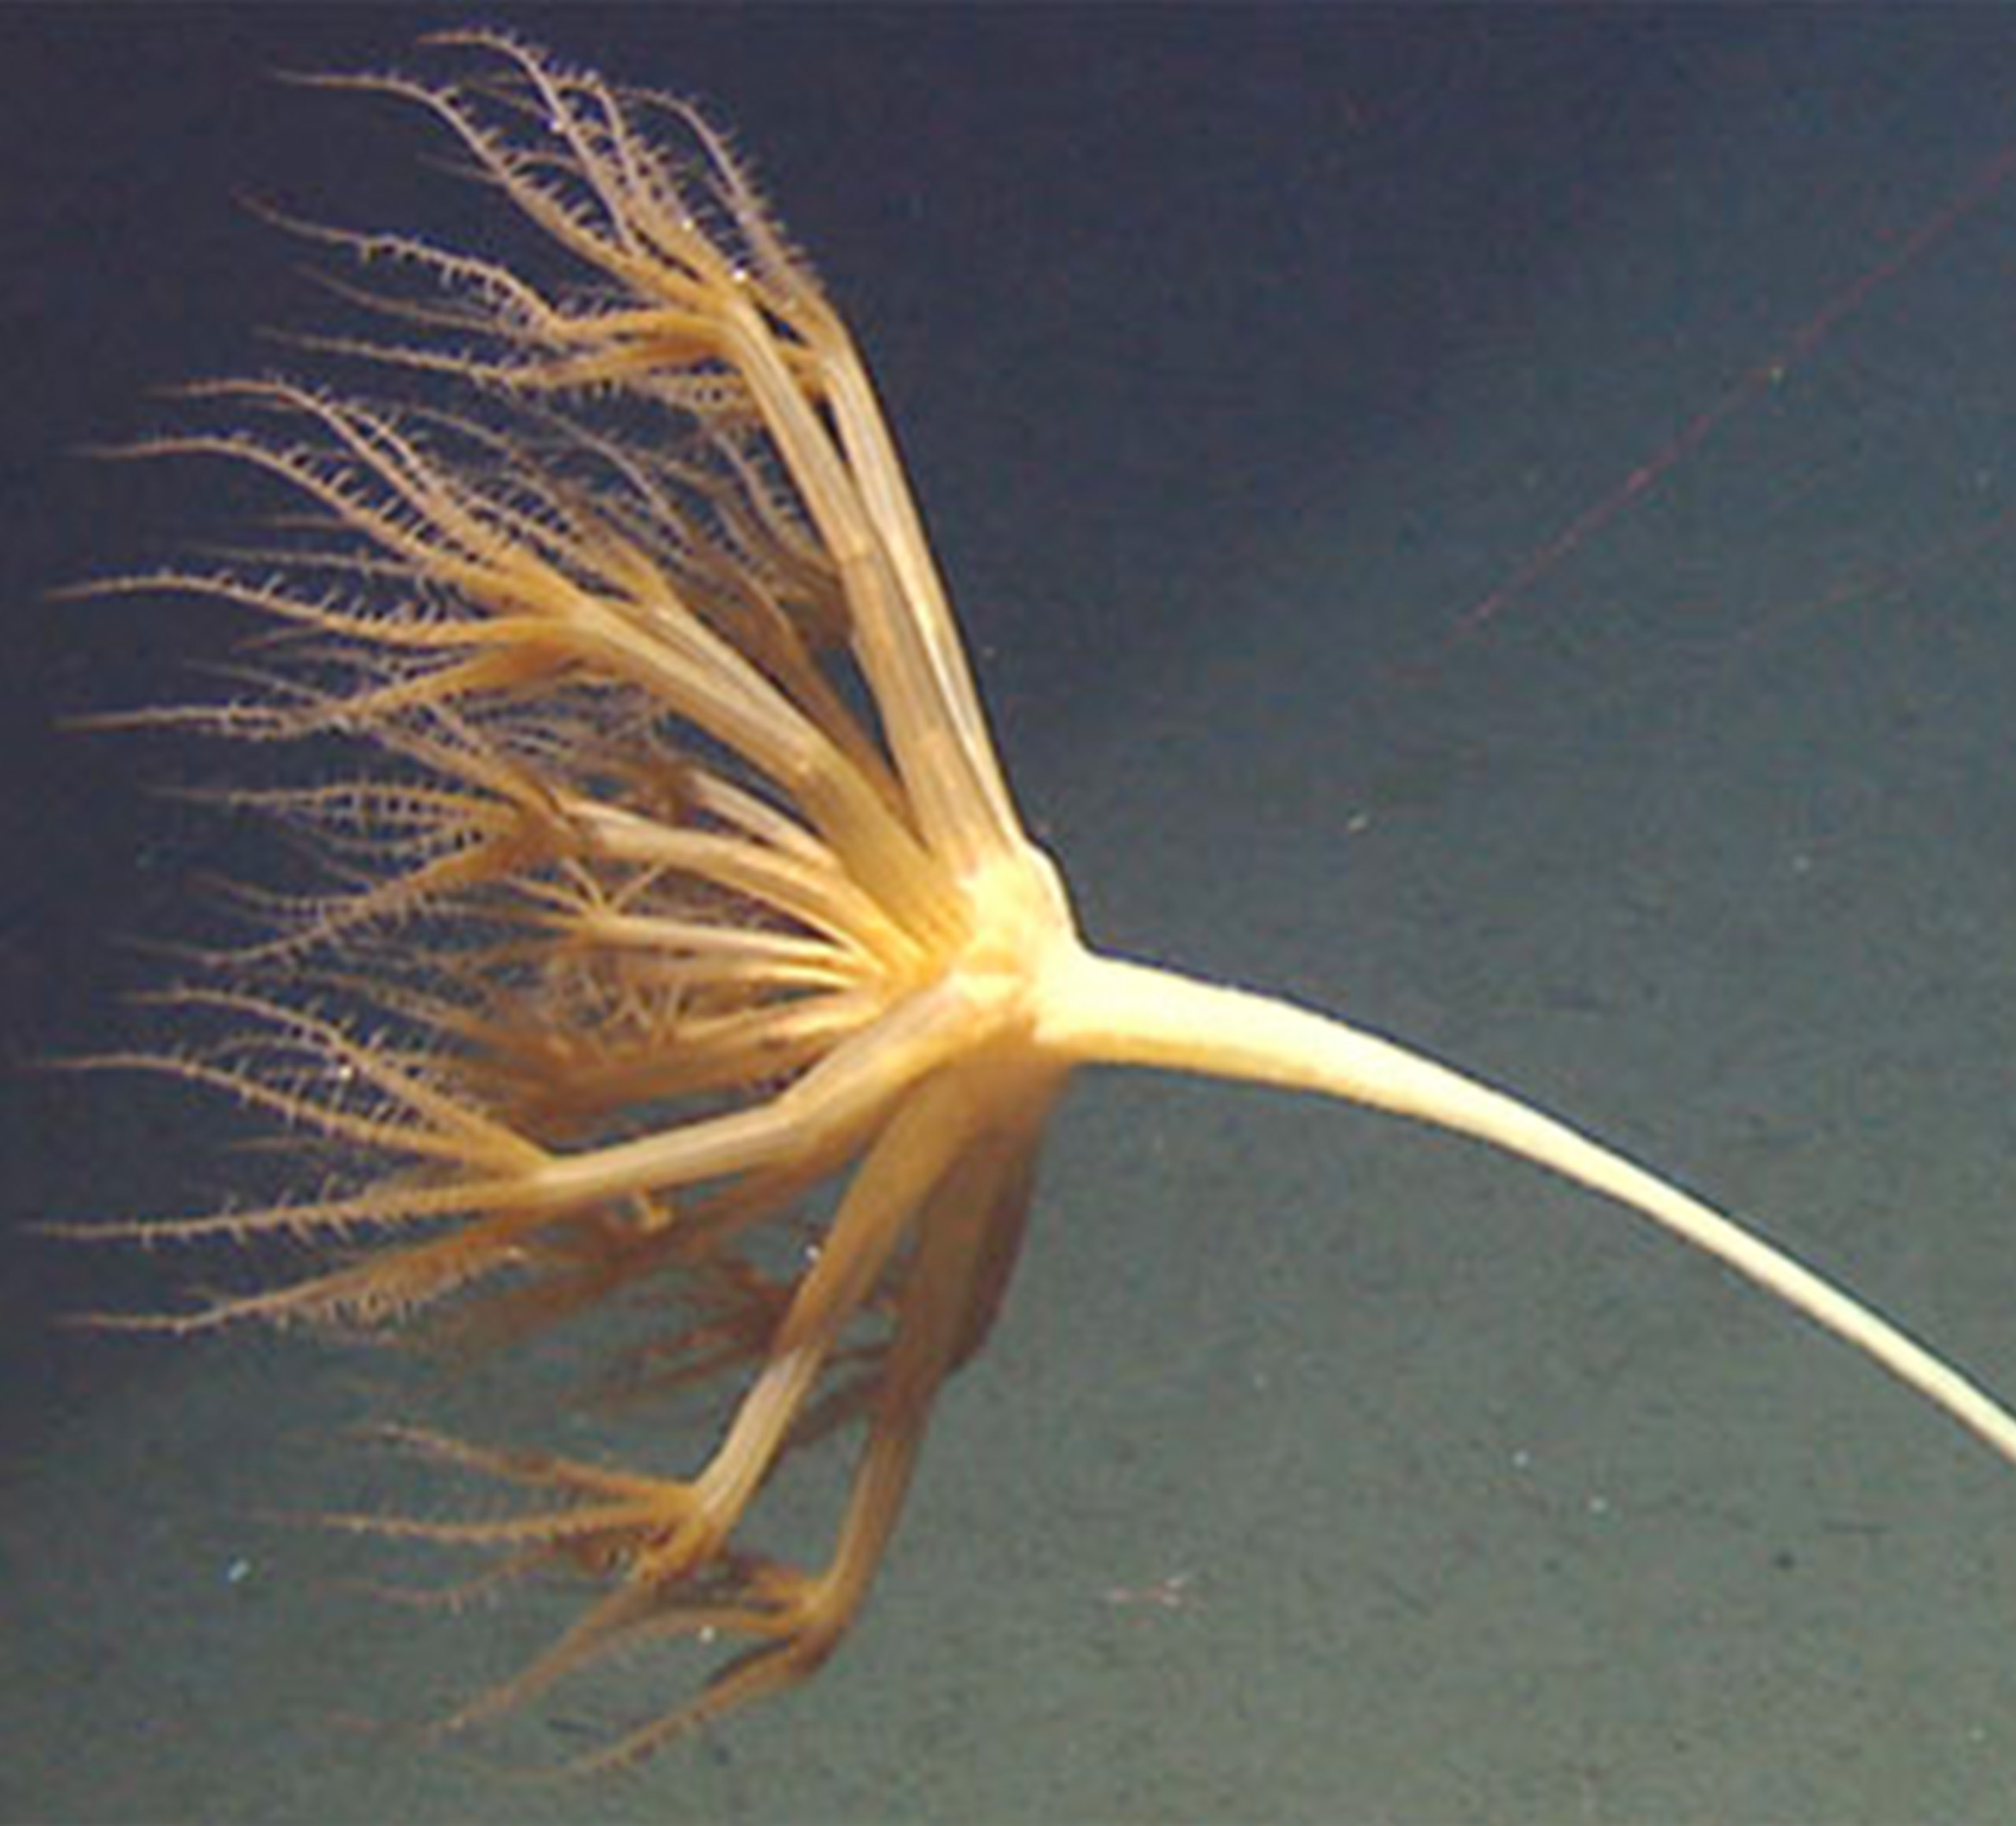
Figure 2. The VMEs that were selected in the NovasArc project with examples from underwater imagery provided by MFRI and IMR.


2.2 Step 2: Data compilation
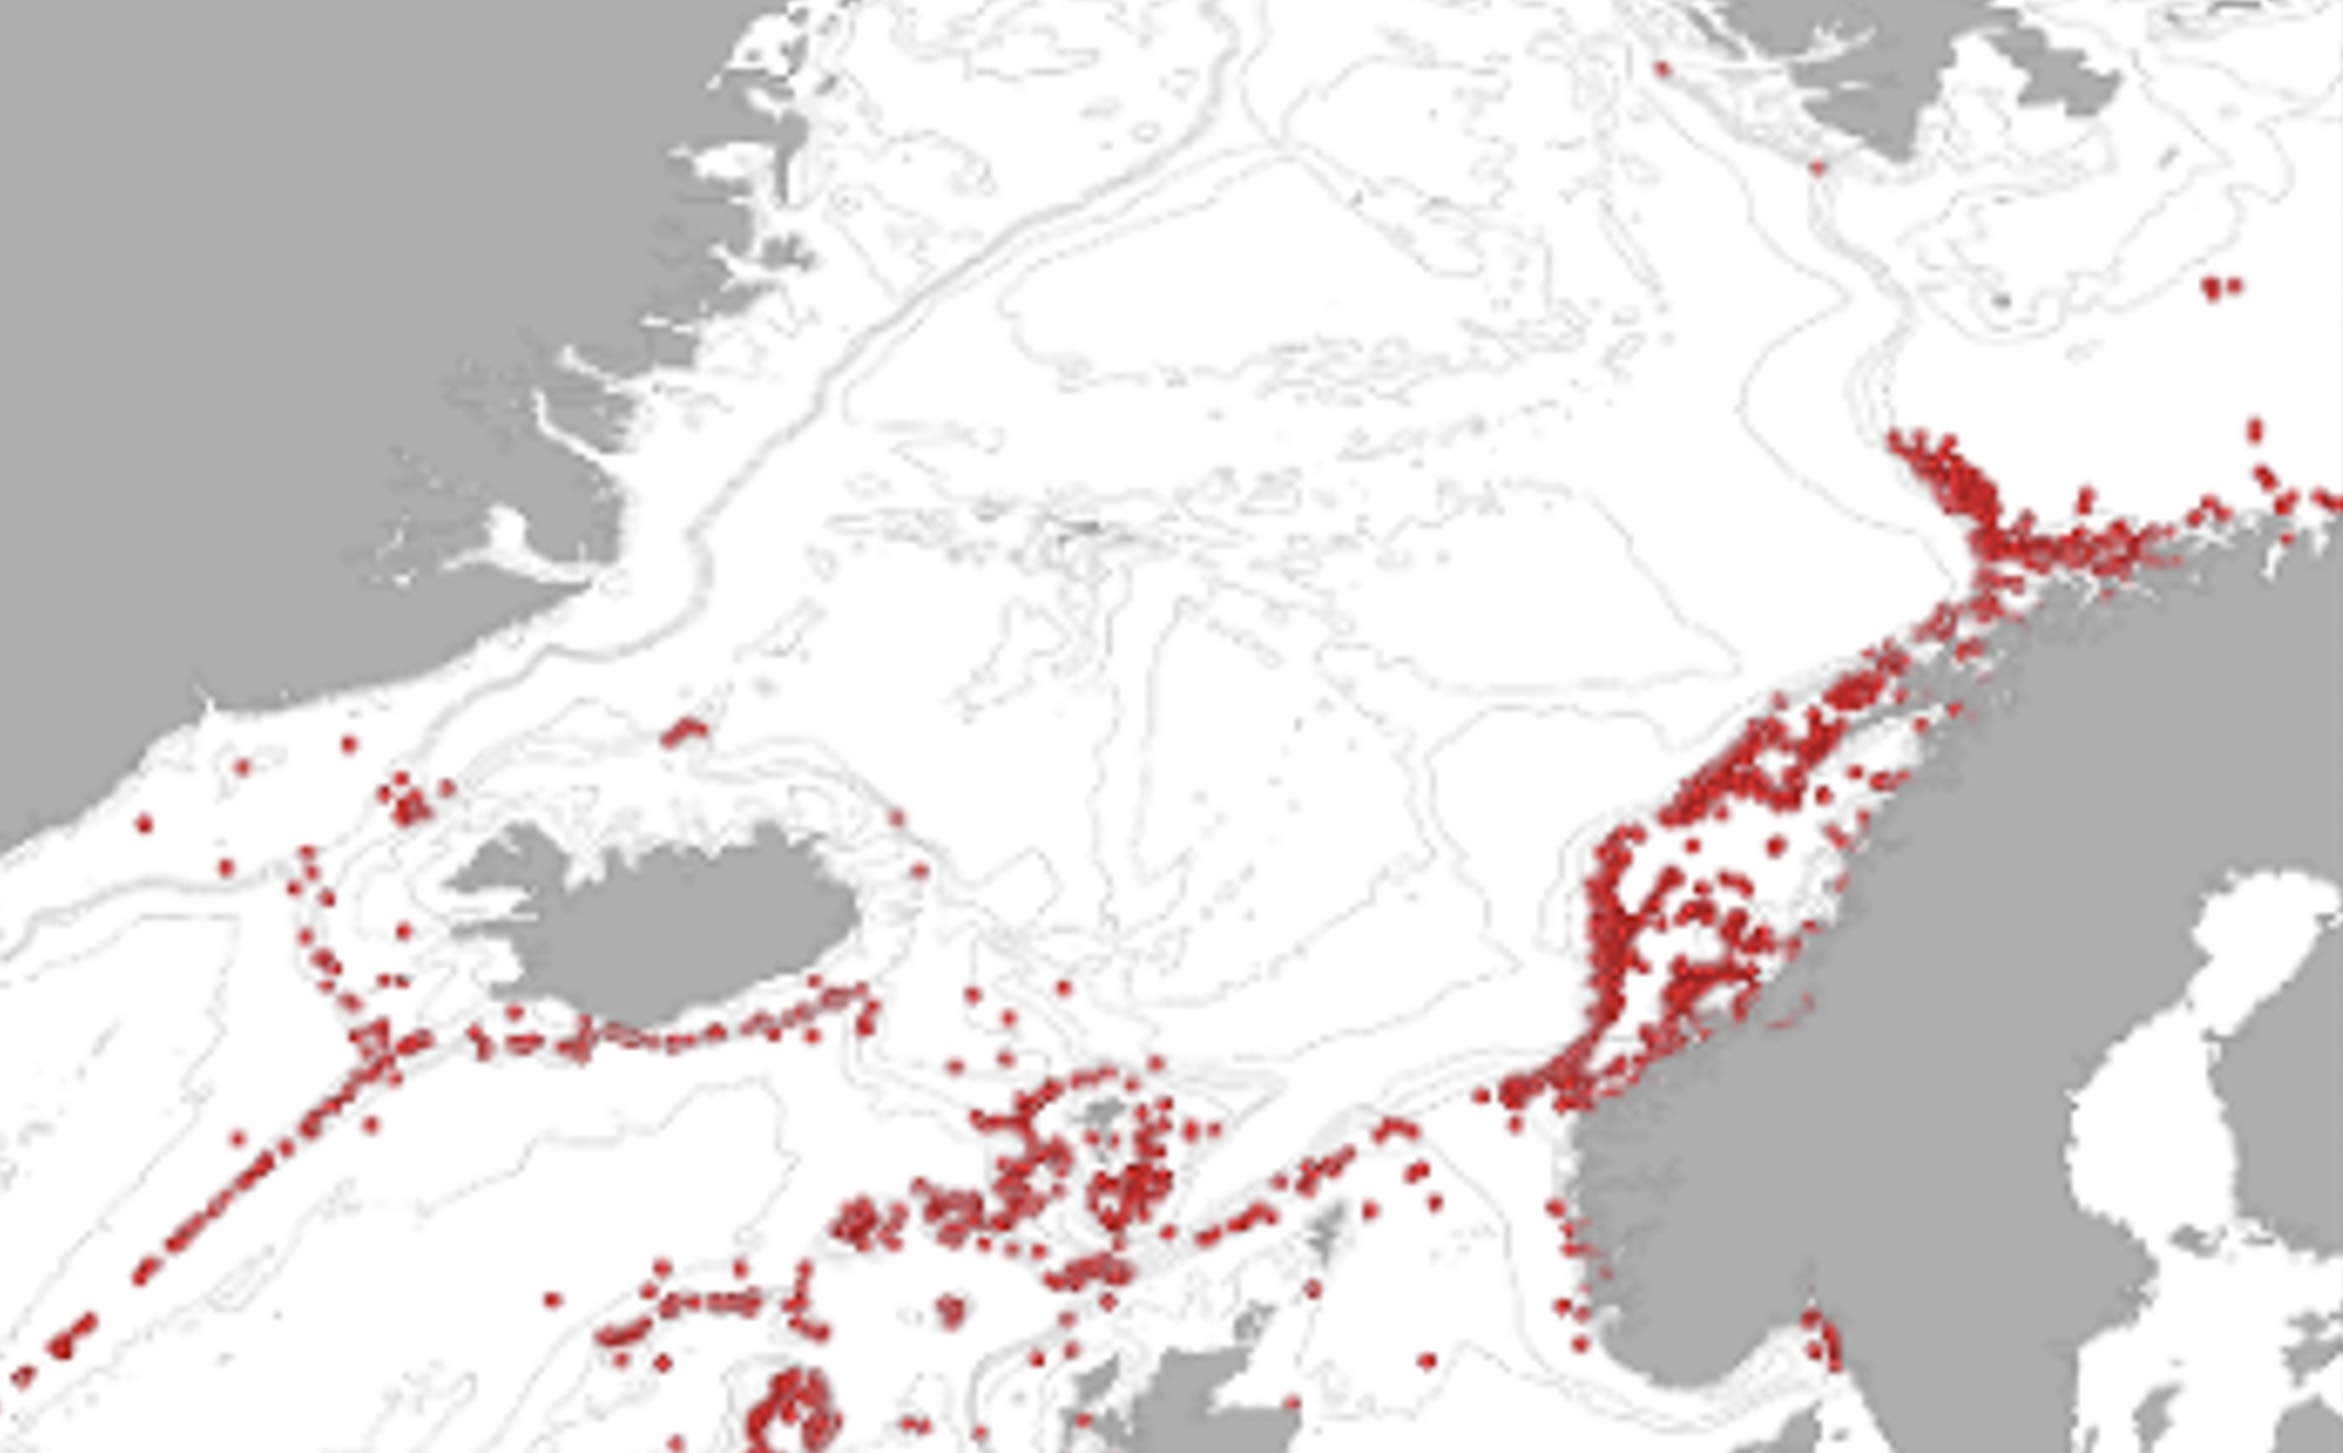
Data was collected for the Nordic seas from the late 19th century and up to present time from a vast range of published, historical, and more recent publications (Buhl-Mortensen et al. 2015, 2019, Figure 3). Additional data obtained in recent surveys in Iceland and Norway on VME indicators was added in 2022. The collated database has now over 5000 records of locations of VME indicator species (see list in Buhl-Mortensen et al. 2019).
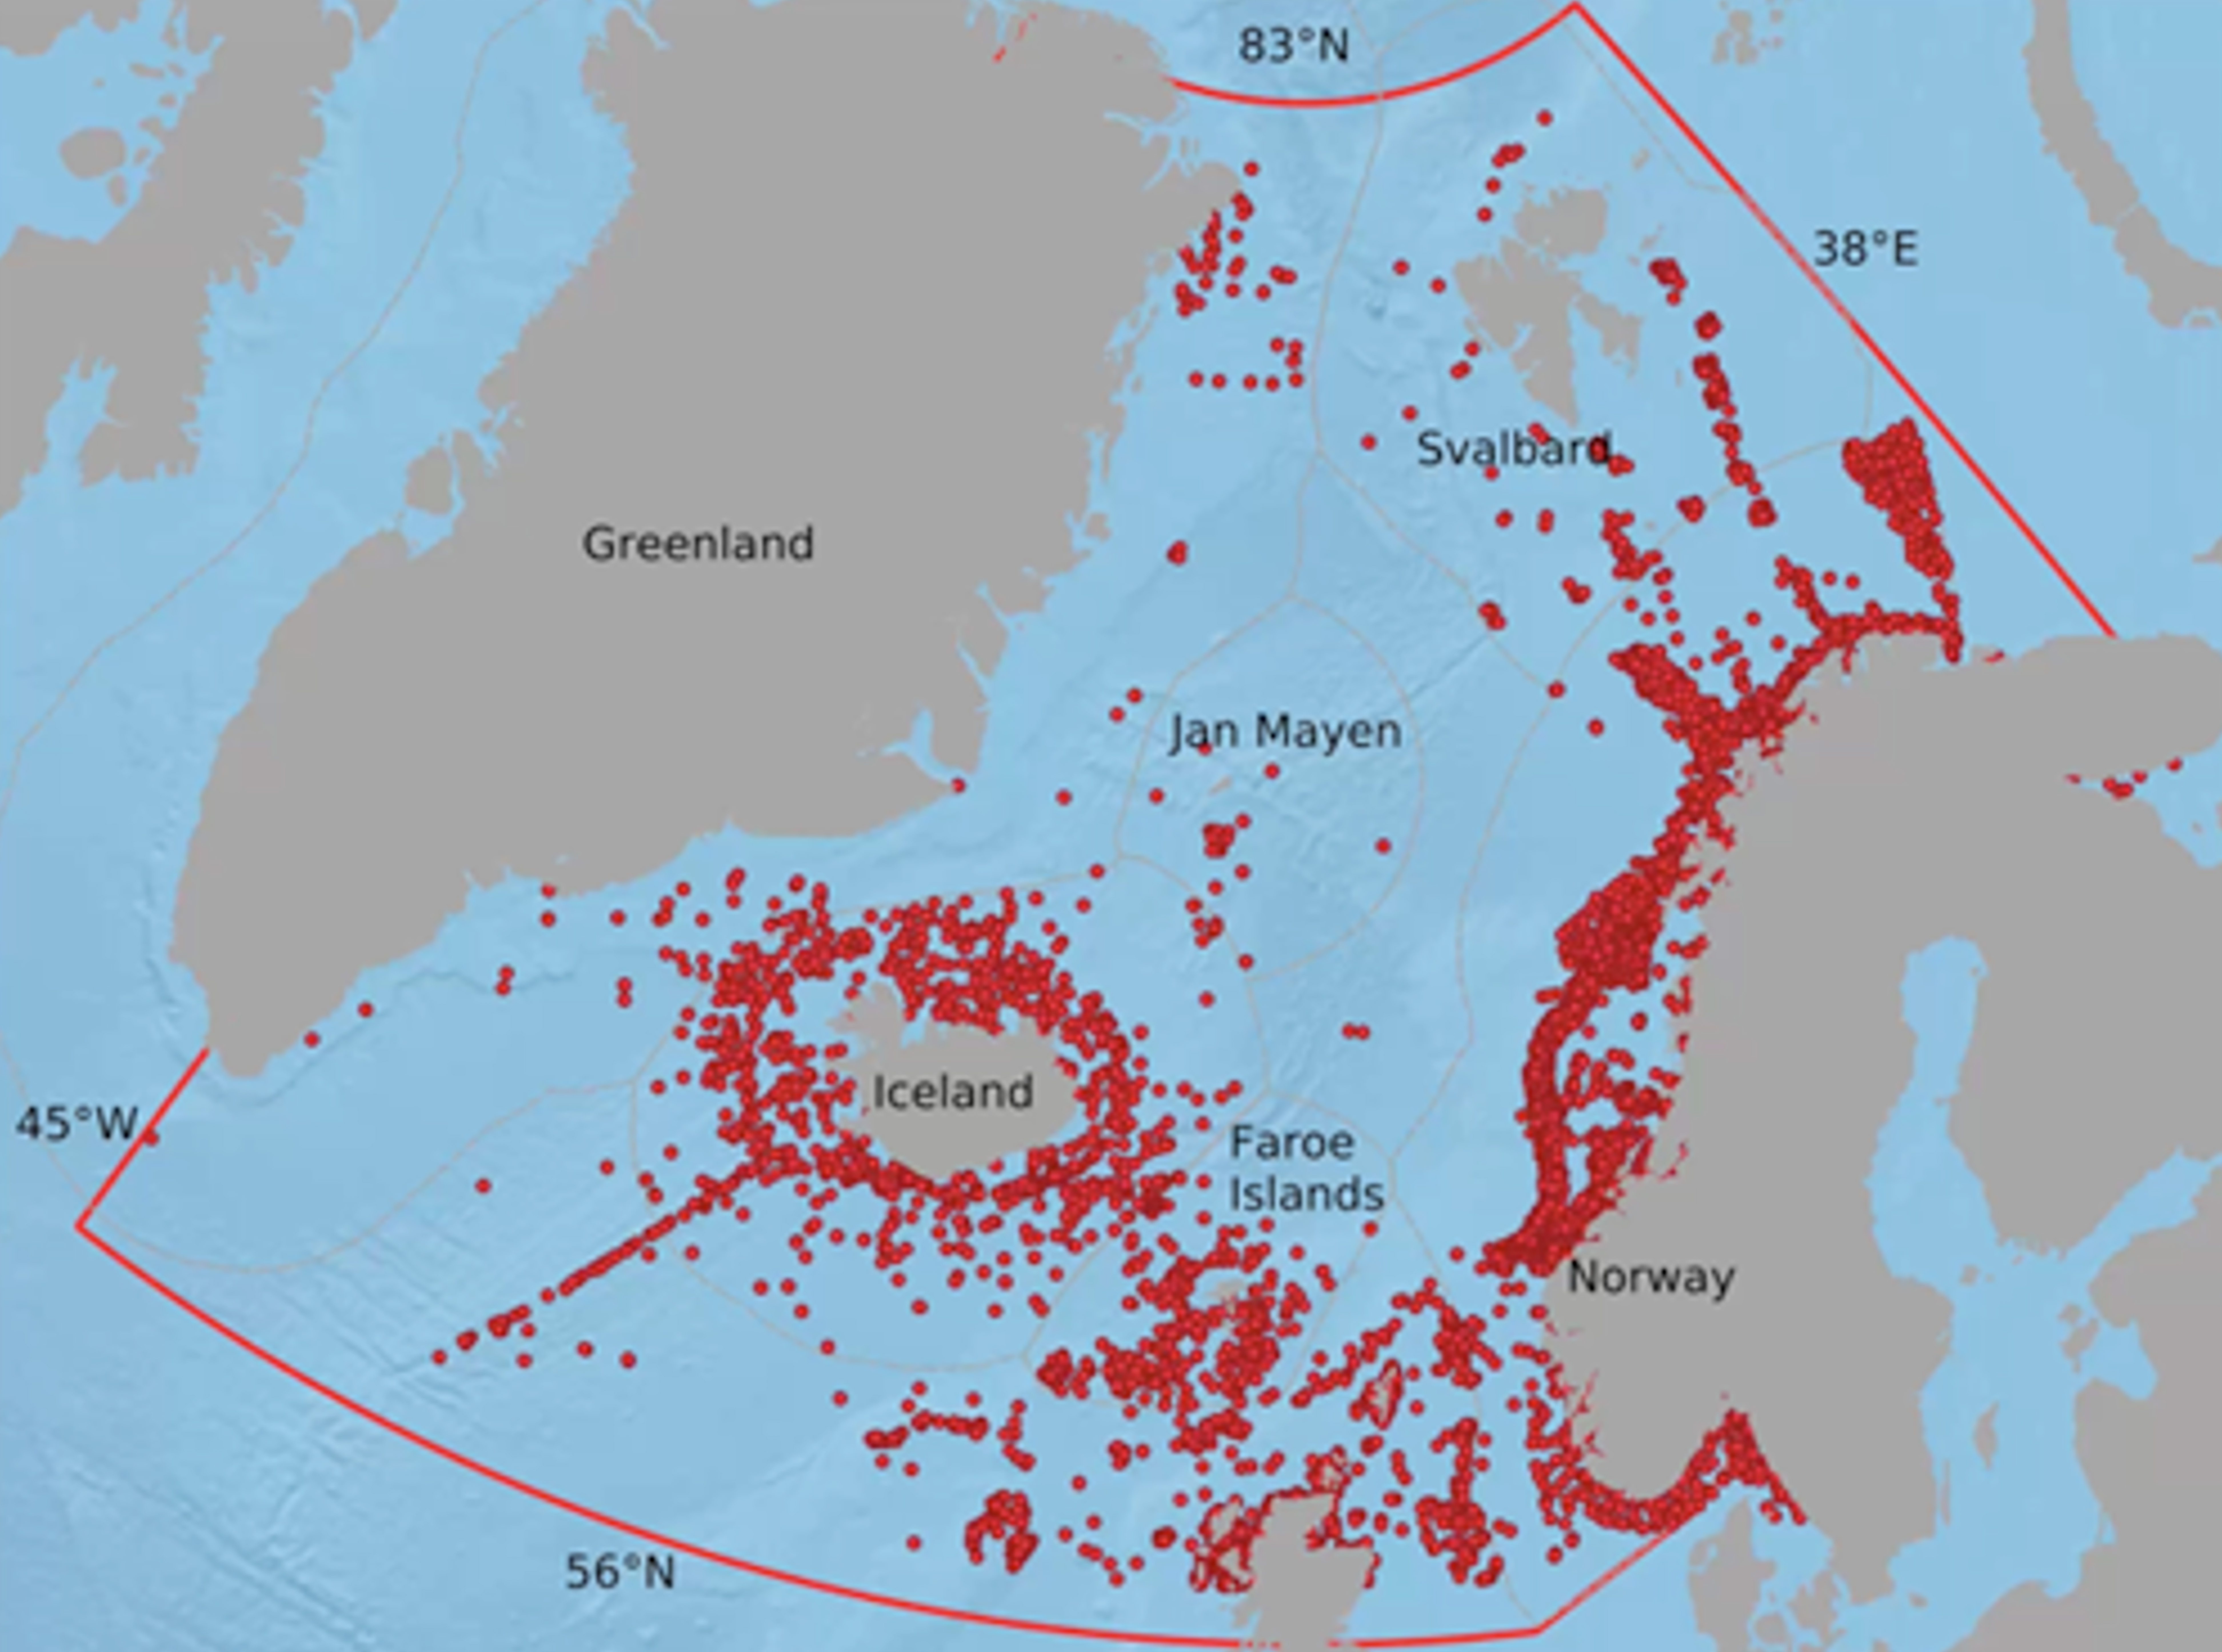
Figure 3. Location of data records on VME indicators compiled by NovasArc.
2.3 Step 3: Development of predictive models
During the NovasArc project (2016-2018), data on the presence of 44 taxa that were considered indicators of 11 Vulnerable Marine Ecosystems (VMEs) was collected. This dataset was utilised to model their distribution using Predictive Habitat Models (PHMs). A first set of models combined all observations from indicator taxa from each VMEs, resulting in 11 distribution models (Buhl-Mortensen et al. 2019). The main limitation of this approach is that some of the taxa considered as indicators of a VME include organisms with different environmental requirements (or ecological niche). For example, the coral taxa Isidella lofotensis and Radicipes sp. are both considered indicators of soft-bottom coral gardens, but both taxa have very different geographical distributions and are found in different environmental settings. A model that includes both taxa would tend to overestimate the distribution of this VME. To overcome this limitation, in the second round of model generation, each individual taxa was modelled separately, resulting in 44 distribution models (Burgos et al., 2020). The 44 taxa were clustered according to the similarity of their predicted distributions, resulting in ten groups of taxa with similar spatial patterns. The predictions from all taxa in each group were averaged to obtain a series of stacked species distributions (SSDMs). Some of the groups matched well with particular VMEs, indicating that the indicator taxa have similar spatial distributions and therefore could be modelled together without risk of overprediction (Burgos et al., 2020), but that was not always the case. For example, four of the taxa considered indicators of the VME shallow sea pen communities (Kophobelemnon sp., Pennatula sp., Halipteris sp. and Funiculina sp.) had similar distributions, but sea pens of the genus Virgularia (also considered indicator of this VME) should be modelled independently.
New models
During NovasArc II, we fitted a new set of 12 models combining the indicator taxa from each VME that had similar predicted distributions according to Burgos et al., (2020) (Appendix). In this way, we controlled overprediction but also produced more robust models that incorporated a larger number of samples. The environmental predictors were the same as used in the previous models. Distribution of suitable habitat for VME indicator taxa was predicted using the maximum entropy algorithm MaxEnt (Radosavljevic & Anderson 2014). Candidate models were fitted using multiple combinations of feature classes and regularization multiplier values. The optimal model was selected based on the AICc (Akaike Information Criterion corrected for small sample sizes, Burnham and Anderson 2002) values and omission rates (OR). The optimal model was used to predict the habitat suitability for each group of species in the entire study area. We utilised a maxSSS (maximum sum of sensitivity and specificity) threshold to convert the suitability values into presence/absence. In addition, areas of optimal suitability were defined as the areas within the presence area in which the suitability values were above the 75% percentile.
New data
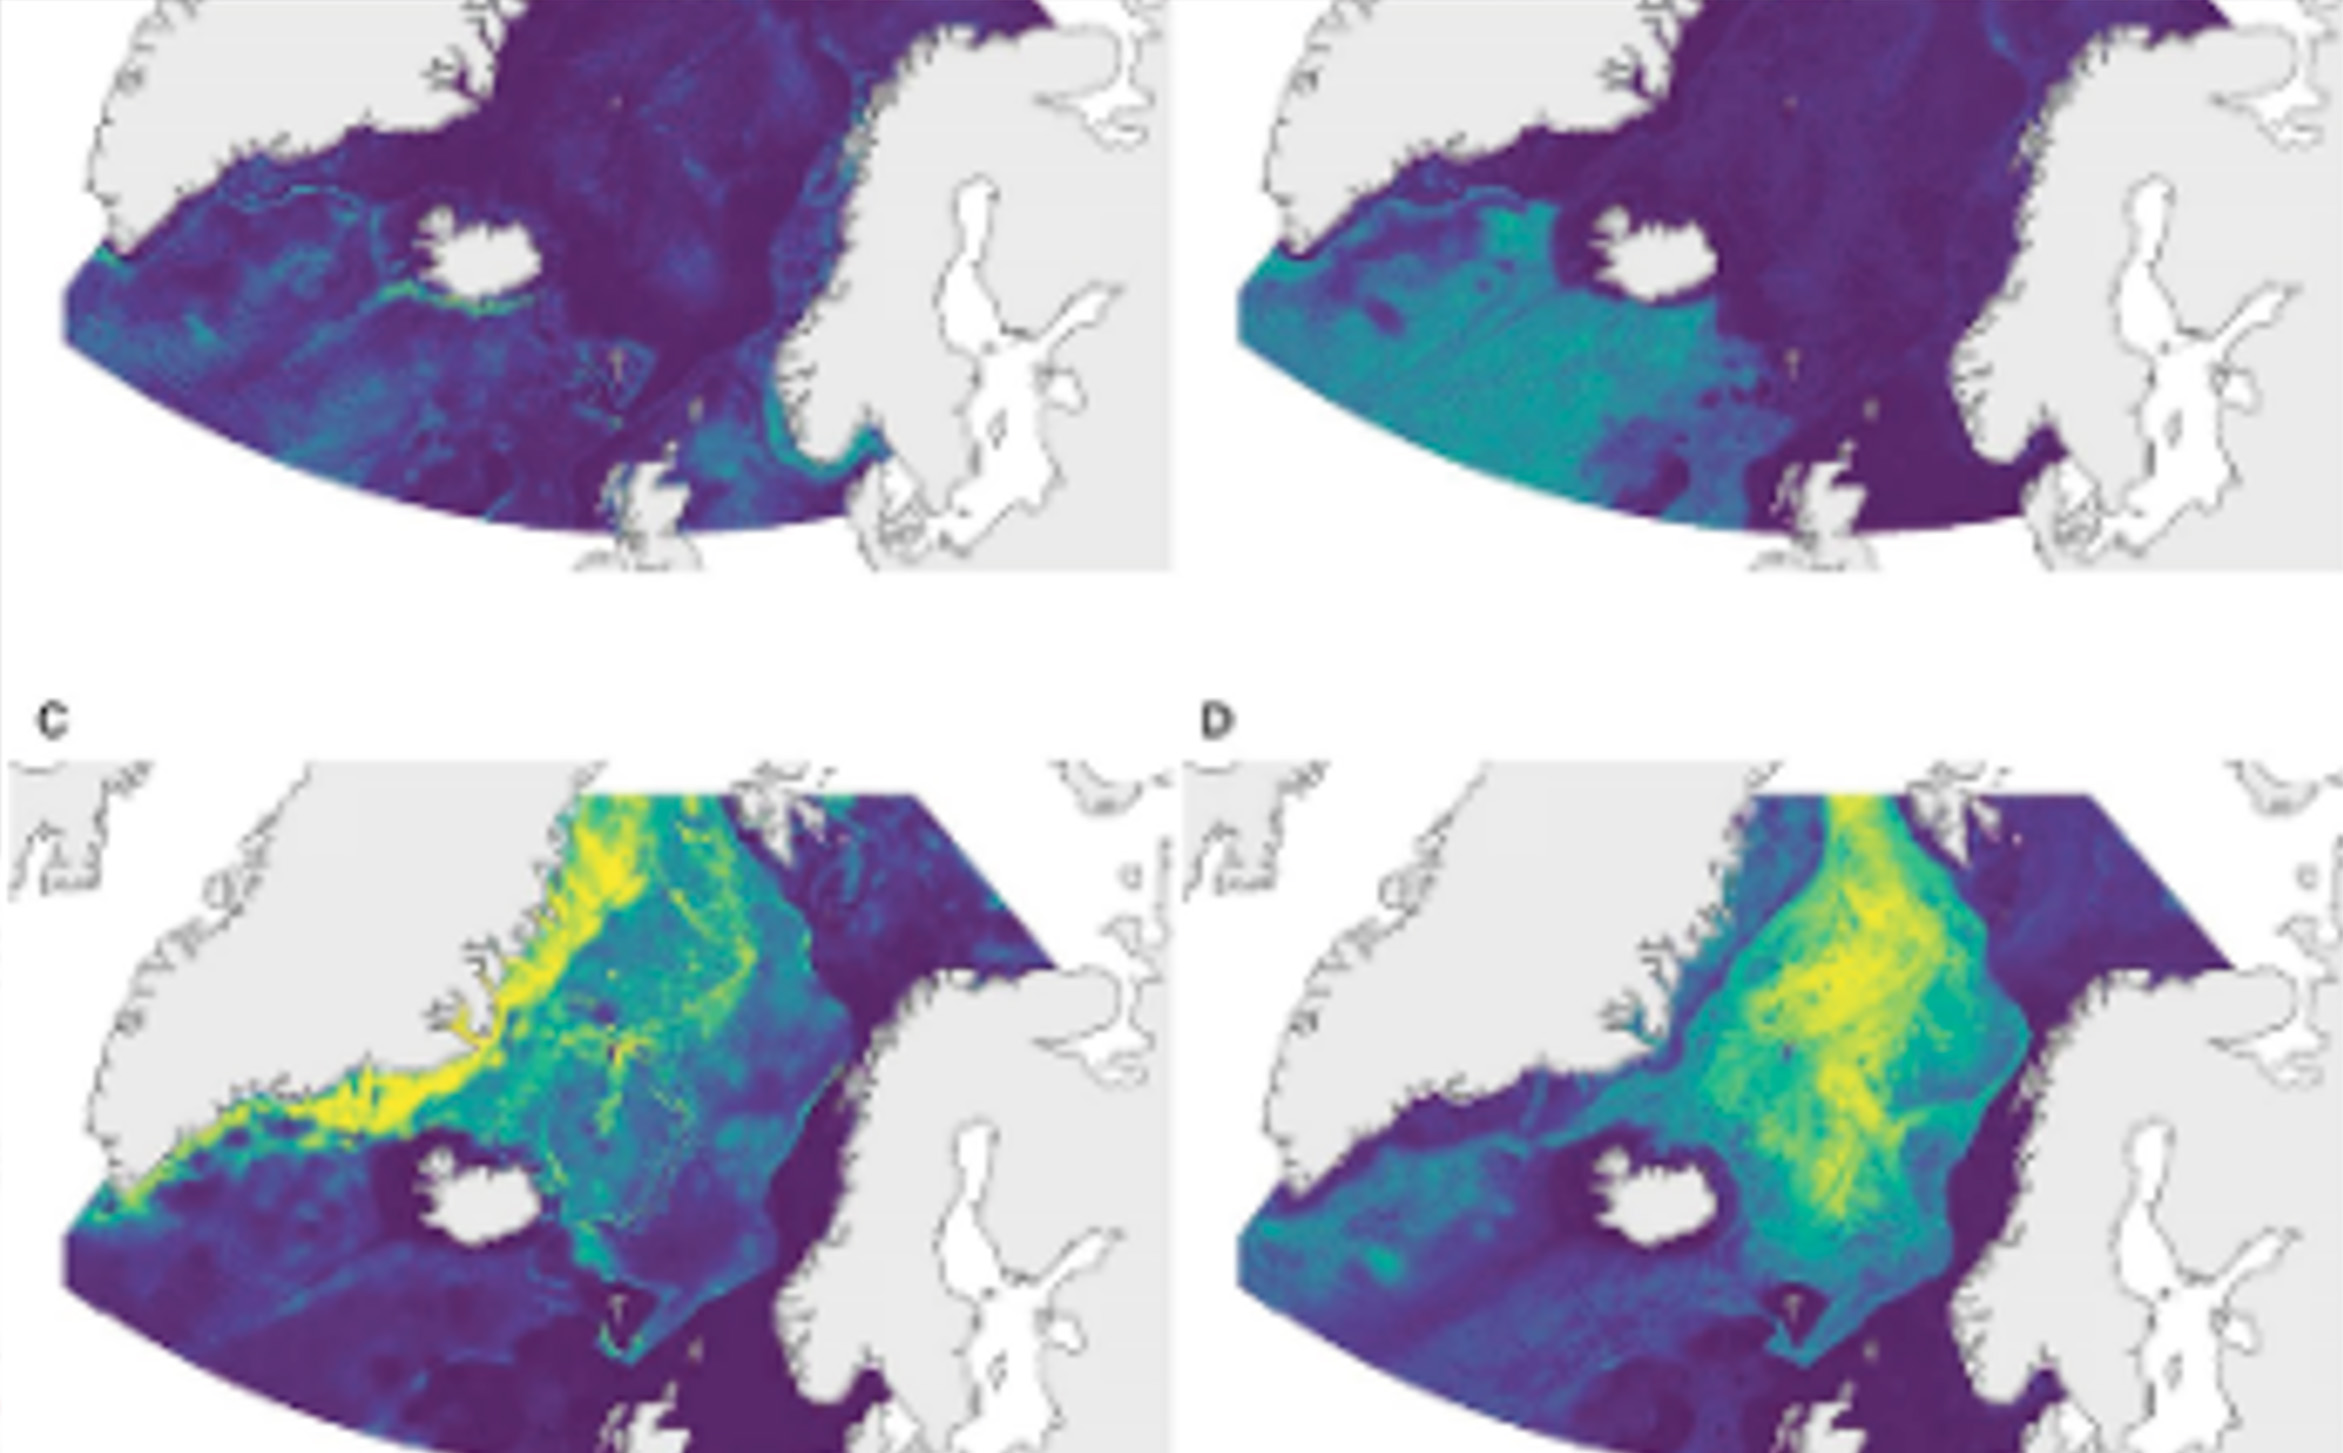
To validate the models, new data was obtained from surveys carried out in Iceland and Norway since the last data compilation. A total of 11322 records of VME indicator taxa were obtained by the MAREANO project in Norway, while 8055 new observations were obtained by MRFI in Icelandic waters within the 12 combined VME indicator groups for the modelling (Figure 4 and Table 1).
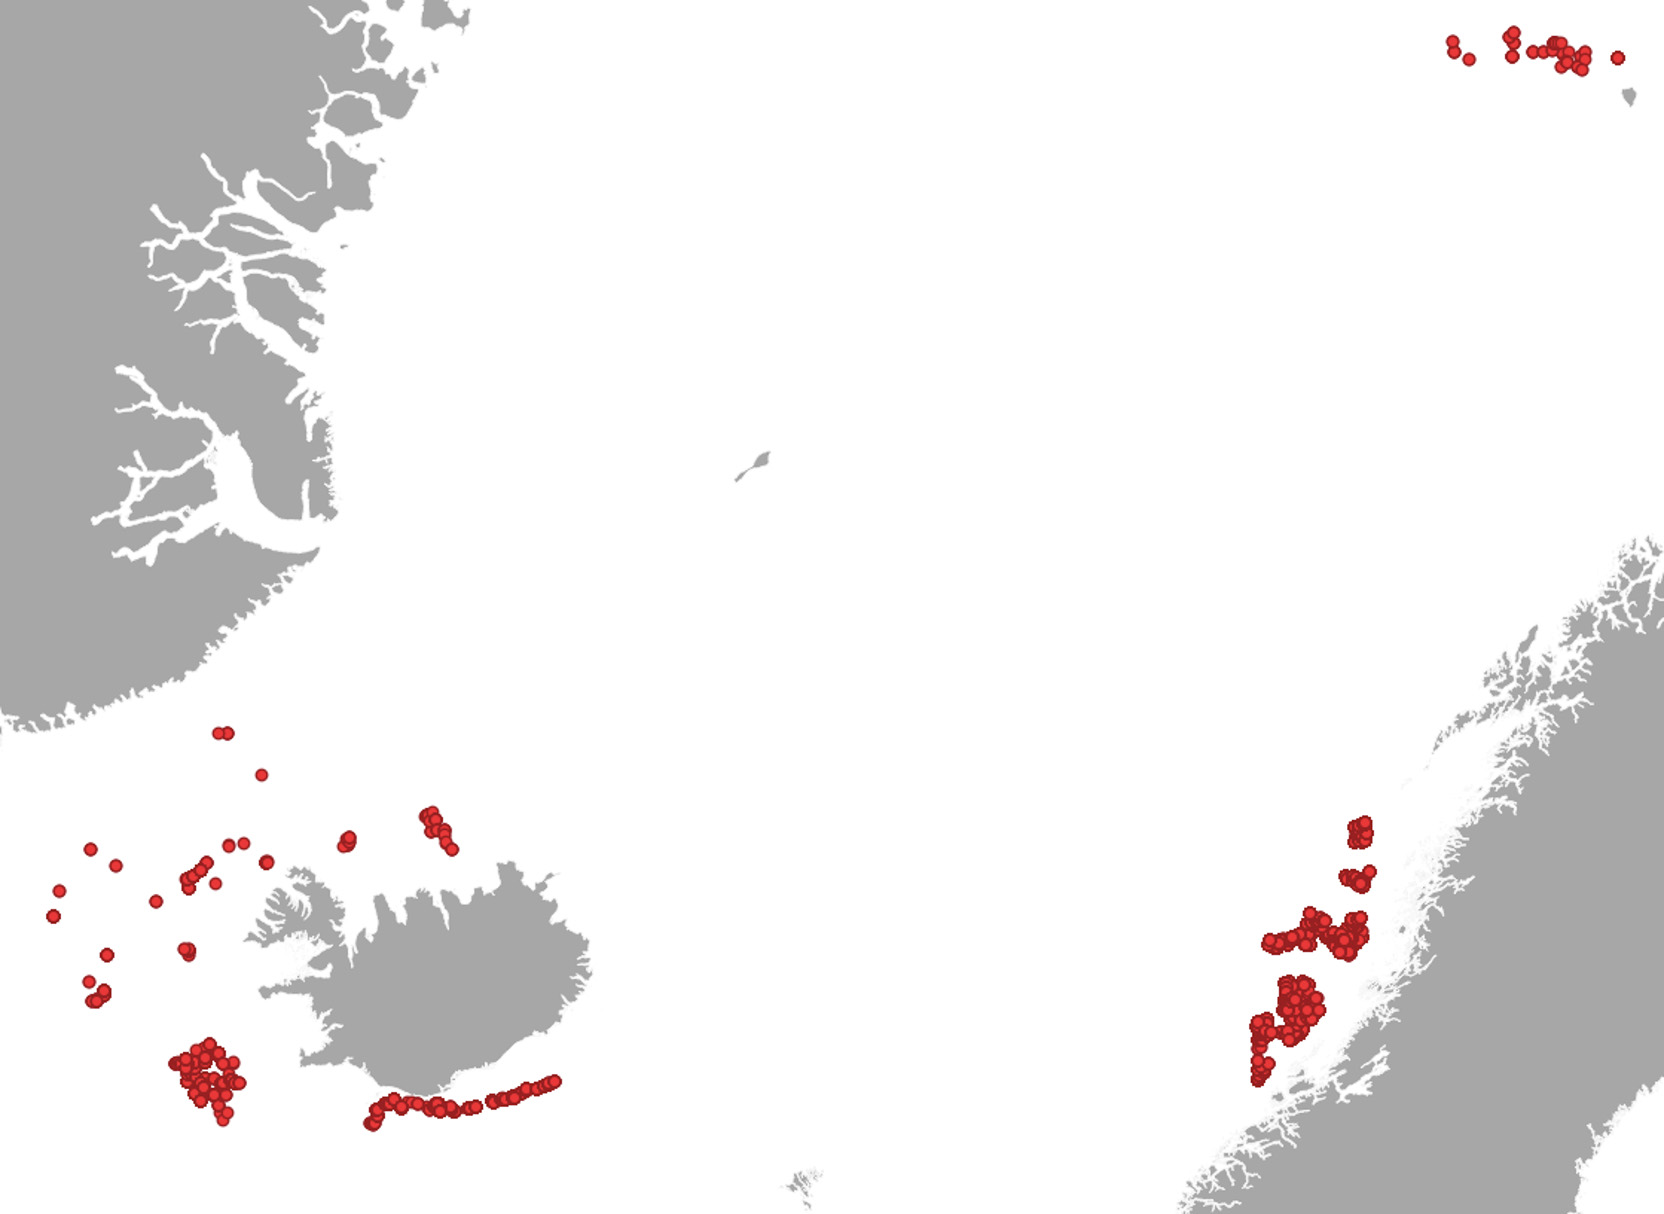
Figure 4. Distribution of new records of presence of VME indicator species added to refine spatial distribution models.
Model uncertainty
One of the objectives of NovasArc II was to obtain uncertainty estimates for the predicted VME distributions. To achieve this, the same model was fitted to ten bootstrapped samples of the input data after the optimal models were selected. The predicted distributions obtained with these samples were used to estimate the coefficient of variation (CV) of the predicted distribution. The CV values within the predicted area of presence provide a measure of the uncertainty of the predictions arising from the input data (Appendix).
Model validation
Model validation was carried out by comparing the new observations of VME indicators with model predictions. Locations where new data on VME indicator presence was collected but absence records were not included. The predictive capacity of each model was quantified by plotting receiver operating characteristic curves (ROCs) and calculating the area under the curve (AUC). Model validation was carried out only for models 1 to 9, because the number of new observations was insufficient for validation in the remaining models. Model validation was carried out by calculating the area under the receiver operating characteristic curve (AUC). AUC is considered threshold-independent and is calculated from a combination of the true positive rate and false positive rate. AUC values ranged between 0.52 to 0.99, which can be interpreted as ranging from poor to excellent (Fawcett, 2006) (Table 2).
Table 1. Combination of VME indicators that were used for spatial distribution modeling of 12 VMEs consisting of indicator species with similar environmental requirements.
Model # | Taxa | VME type | Number of new observations |
1 | Lophelia pertusa, Madrepora oculata | Scleractinean reefs and colonies | 408 |
2 | Geodia atlantica, G. macandrewi, G. phlegraei, Strypnhus sp., Stelleta sp. | Soft bottom sponge aggregations (boreal ostur) | 738 |
3 | Paragorgia arborea, Paramuricea sp., Primnoa resedaformis | Hard bottom gorgonian gardens | 805 |
4 | Axinella sp., Phakelia sp., Antho (Antho) dichotoma, Mycale (Mycale) lingua | Hard bottom sponge aggregations (1) | 5117 |
5 | Tethya sp. Polymastiida spp., Tetillidae | Hard bottom sponge aggregations (2) | 956 |
6 | Kophobelemnon sp., Pennatula sp., Halipteris sp. Funiculina sp. | Shallow sea pen communities | 8497 |
7 | Caulophacus (C.) arcticus, Cladorhiza sp., Lycopodina sp. | Deep-arctic sponge aggregations | 85 |
8 | Drifa glomerata, Duva florida, Gersemia sp. | Cauliflower coral fields | 218 |
9 | Radicipes sp., Acanella arbuscula | Soft bottom gorgonian gardens | 1395 |
10 | Geodia hentscheli, G. parva | Soft bottom sponge aggregations (cold ostur) | 0 |
11 | Chrondocladia (C.) grandis, Umbellula sp., Asconema sp. | Cold-water VMEs | 15 |
12 | Stylasteridae | Stylasterid corals on hard bottoms | 3 |
Table 2: AUC values for the 9 VME prediction models for which there was enough data for validation.
Model | VME type | AUC | Interpretation |
2 | Soft bottom sponge aggregations (boreal ostur) | 0.68 | Fair |
4 | Hard bottom sponge aggregations (1) | 0.63 | Fair |
5 | Hard bottom sponge aggregations (2) | 0.73 | Good |
7 | Deep-arctic sponge aggregations | 0.99 | Excellent |
1 | Scleractinean reefs and colonies | 0.79 | Good |
9 | Soft bottom gorgonian gardens | 0.87 | Very good |
3 | Hard bottom gorgonian gardens | 0.52 | Poor |
8 | Cauliflower coral fields | 0.84 | Very good |
6 | Shallow sea pen communities | 0.67 | Fair |
2.4 Step 4: Compilation of data on fishing effort intensity
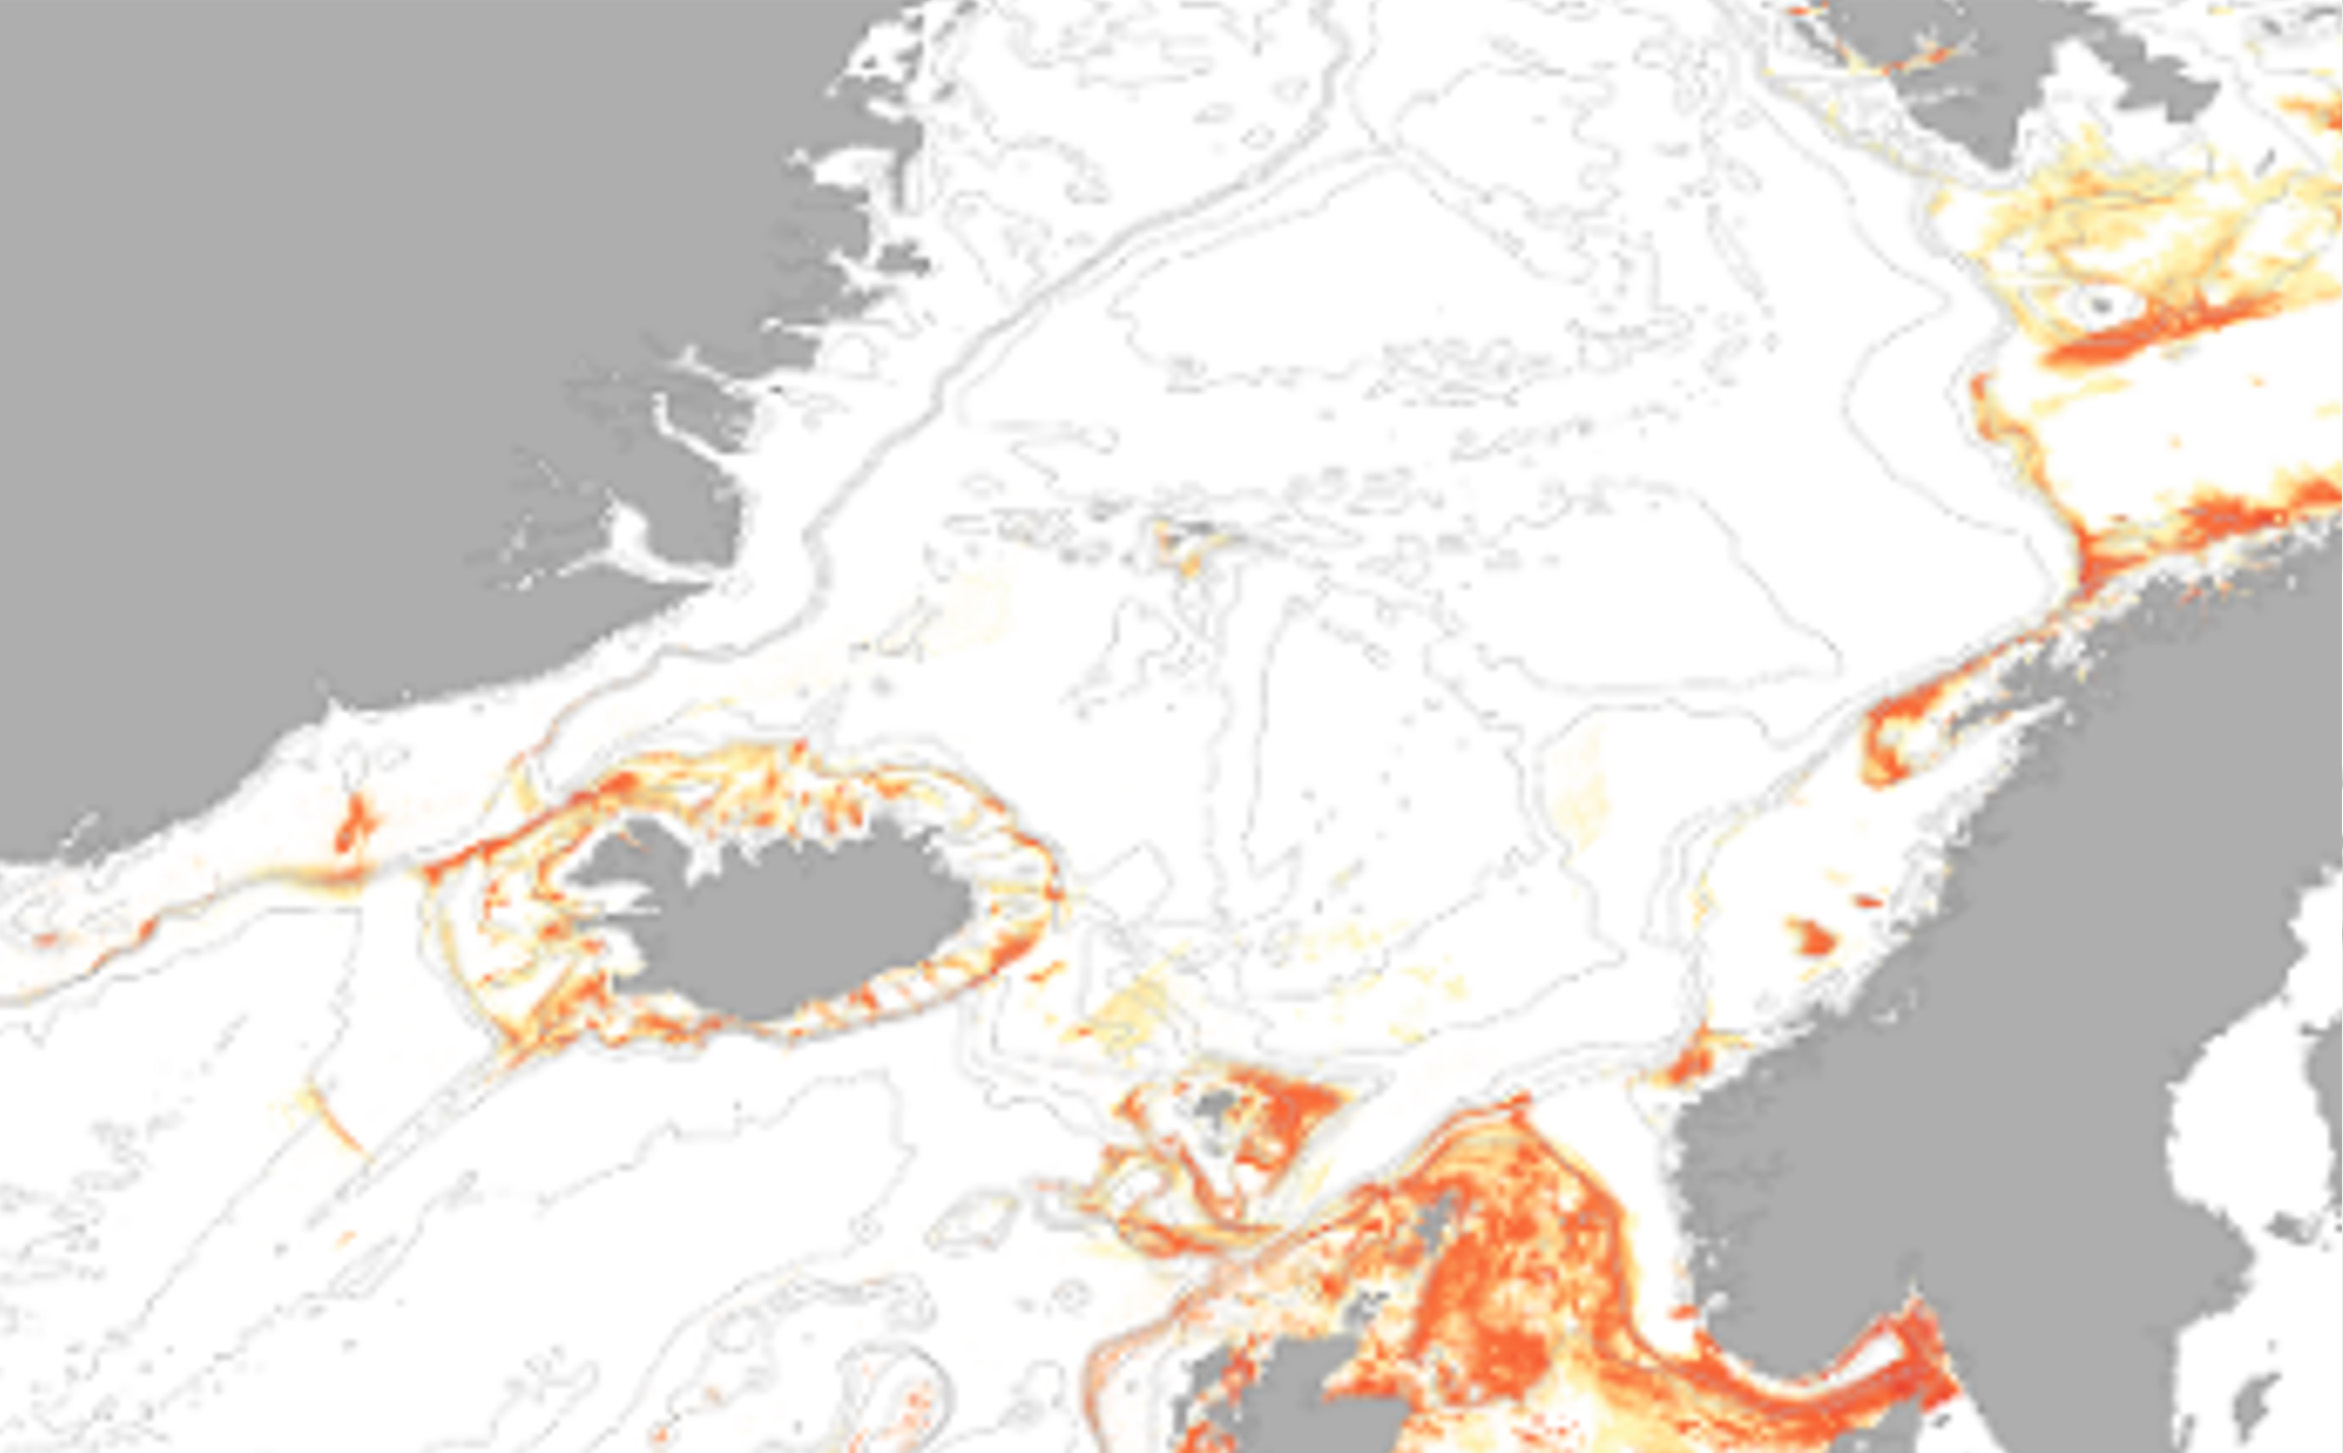
Fishing pressure map based on trawling data (VMS records) was produced for the study area. Fishing intensity estimates were derived from Vessel Monitoring System (VMS) and Automatic Identification System (AIS) data (see Buhl-Mortensen et al. 2019).
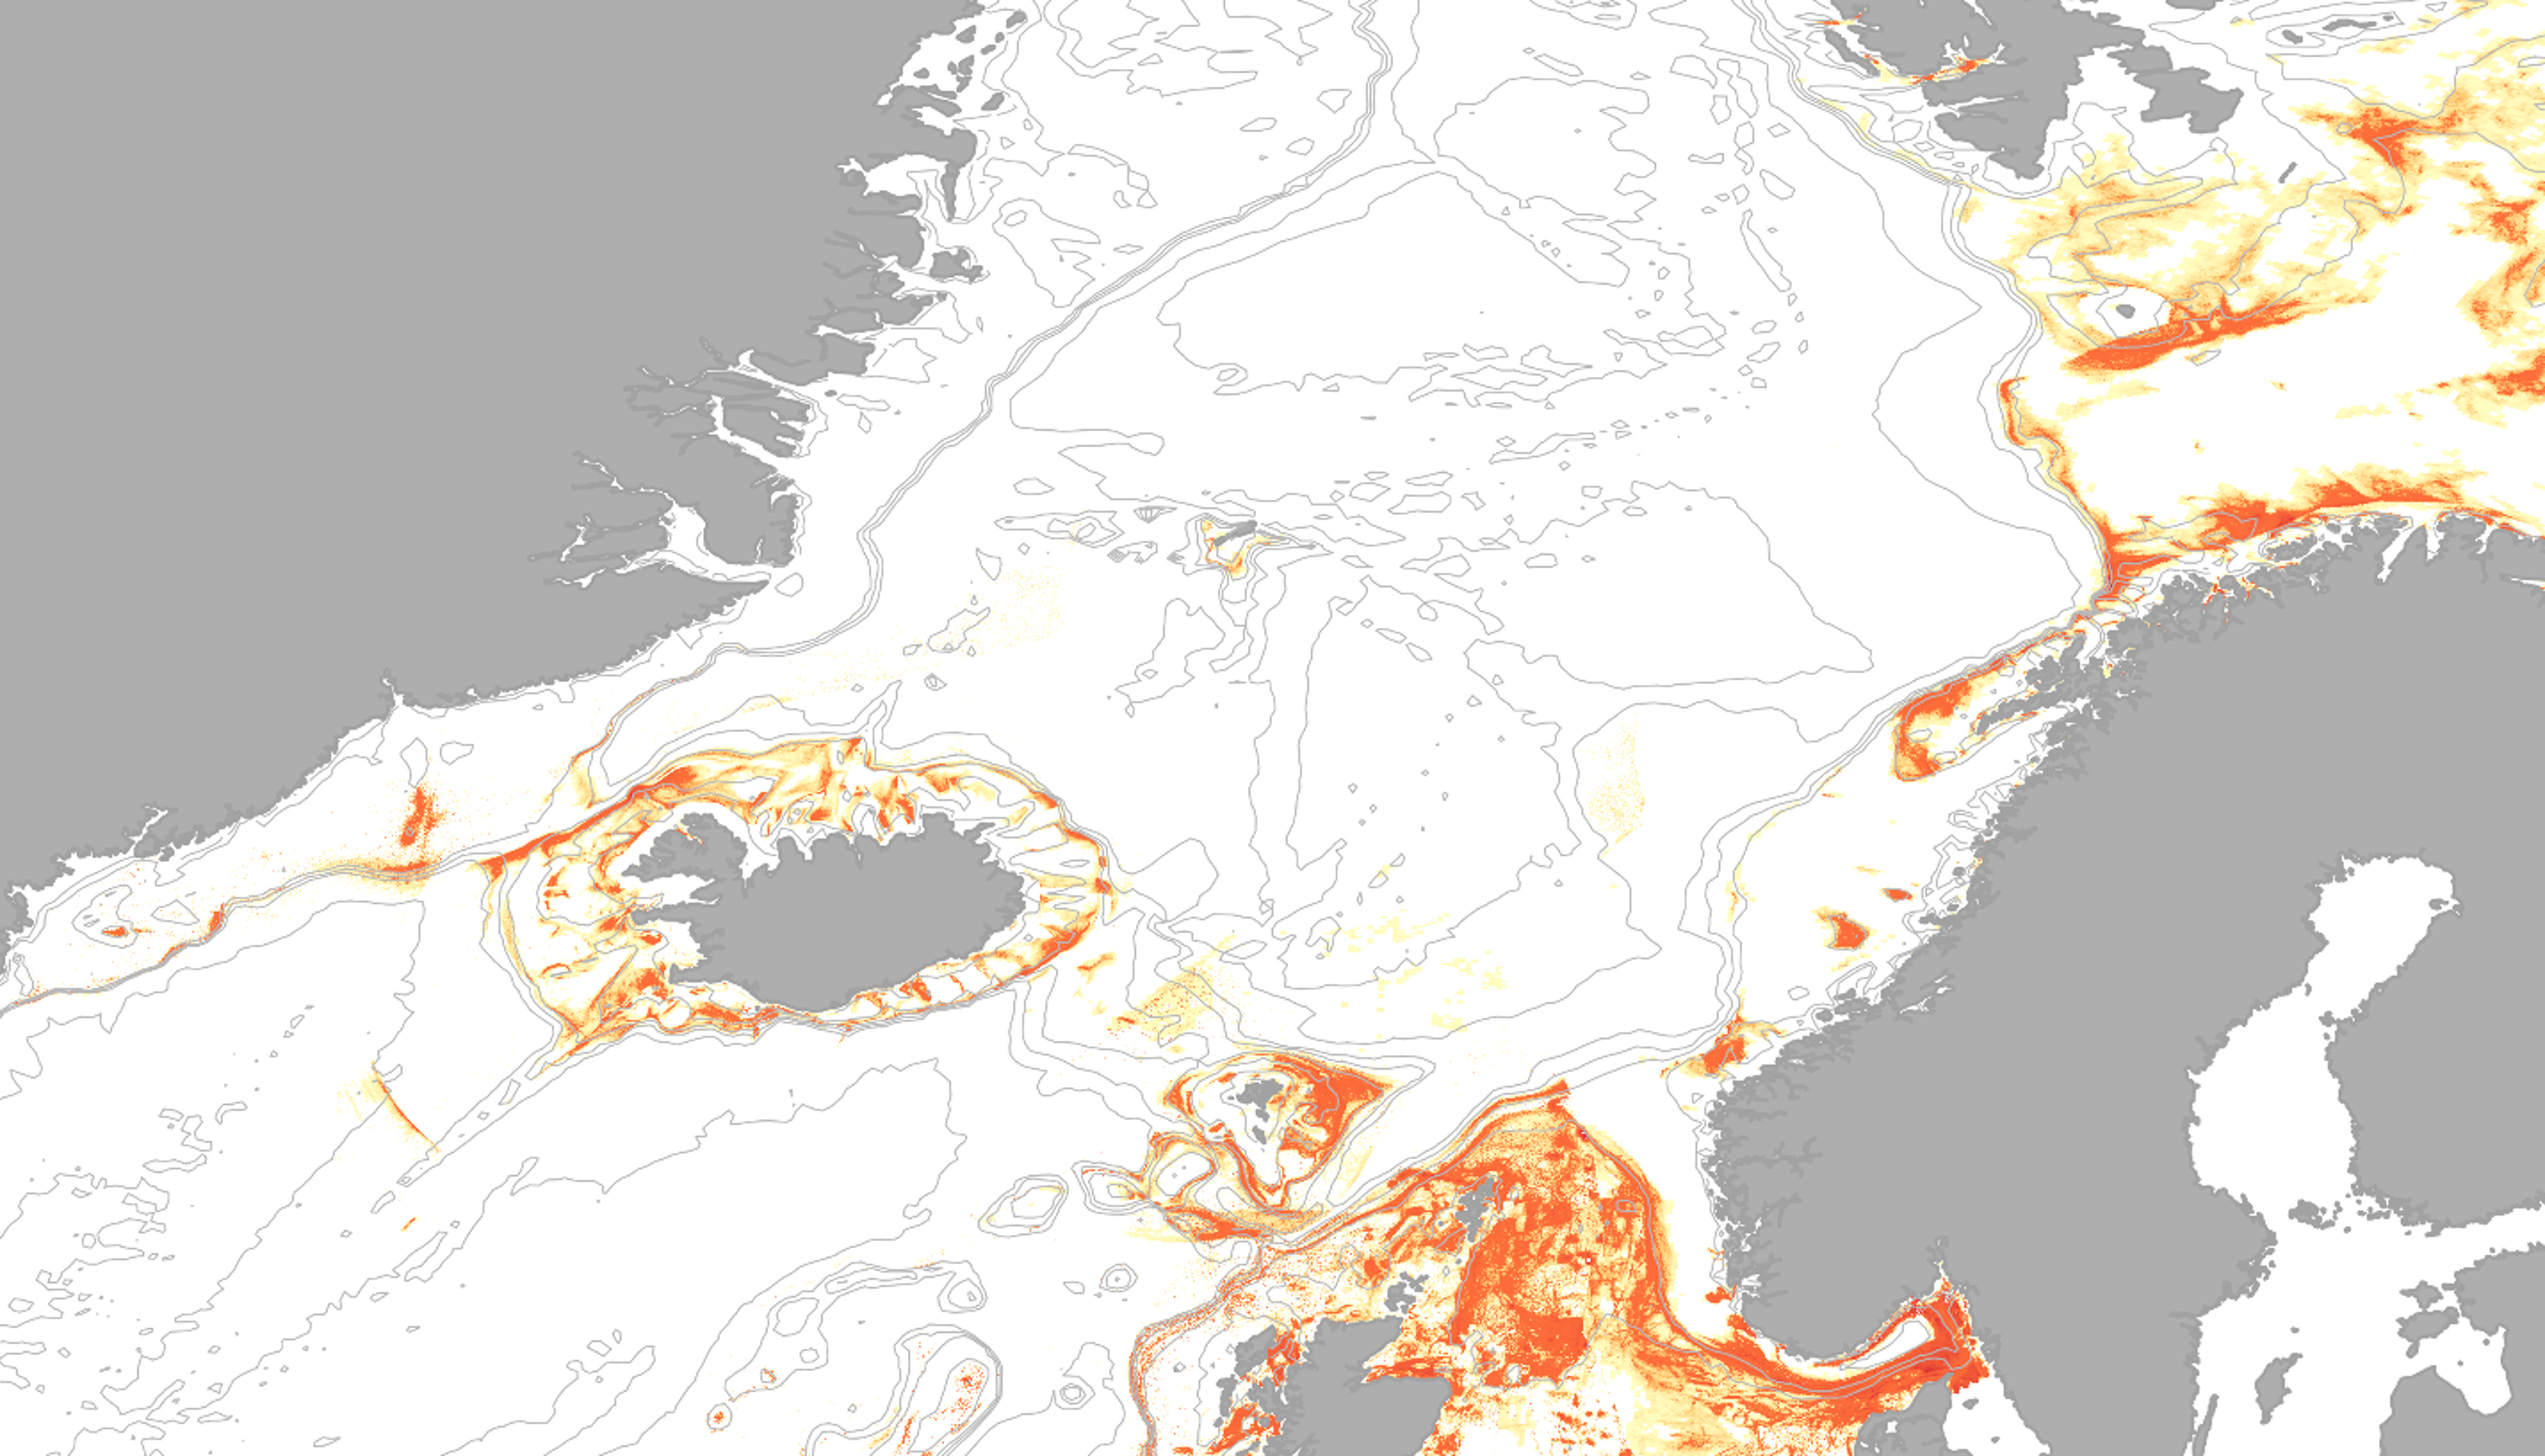
Figure 5. Fishing intensity in the Nordic Seas based on AIS, VMS and logbook data.
2.5 Step 5: Risk assessment / Indicators and criteria relevant to management of benthic habitats
Maintaining good status of seabed ecosystems, and sustainable use of resources is a general objective agreed among all the states within the OSPAR region. For the Nordic seas, fisheries are still the main pressure affecting sea bottom habitats with increasing risk of mining and increased shipping traffic. Bottom fishing can result in habitat destruction and biodiversity loss. Some habitats have been singled out as being more vulnerable to human impact than others, with most emphasis on sponge grounds, coral habitats and hydrothermal vents. Other habitats are also important but managemental enforcement has in general not been used for specific protection of these.
The NovasArc project has generated datasets and methods that contribute towards indicator and criteria development for ecosystem-based management support of a sustainable blue growth. The project will continue to aid the regional application of the MSFD criteria, including criteria elements, and methodological standard of indicators of the GES related to Benthic habitats.
NovasArc has considered several already developed methods to evaluate risk of fishing activities on VMEs (Table 3), two of which are highlighted in Box 1 and 2. The approaches being developed as part of OSPAR (by the OSPAR Benthic Habitat Expert Group) includes Common Indicators for assessing the Physical damage of predominant and special habitats (BH3) and Area of habitat loss (BH4). Similar to the approach by NovasArc, the BH3 indicator (Box 1) evaluates the overlap between fishing pressure and distribution of habitats of concern, and does that based on methodology developed in collaboration with ICES. NovasArc will in future work further explore the use of the BH3 indicator, and adapt it to make better use of the NovasArc data (more relevant VME definitions, higher spatial resolution). The results from NovasArc are also relevant to the Marine Stewardship Council evaluation process, and further strengthen the indicators used there relevant to VMEs (Box 2).
For the Good Environmental Status (GES) of the Marine Strategy Directorate Framework (MSDF), NovasArc addresses particularly descriptor 6, The sea floor integrity ensures functioning of the ecosystem. The descriptor has a set of criteria elements where Physical loss of seabed containing the criteria D6C1: Spatial extent and distribution of physical loss of the natural seabed and Physical disturbance containing the criteria D6C2: Spatial extent and distribution of physical disturbance pressure on the seabed are example of criteria where this method can be applied (see also Table 3). NovasArc has taken special note of the work carried out by ICES, such as that of the Working Group on Deep-water Ecology (WGDEC), and the special workshops such as WKBENTH2, a Workshop on assessment methods to set threshold and assess adverse effects on seabed habitats (ICES 2022) that provides guidance on how to assess adverse impacts. The suitability of the different methods and indicators could be evaluated, but the workshop was unable to assign specific thresholds to indicators, that could be used to support management aims (ICES Special Request, 6th of December 2022).
The UN Convention on Biological Diversity held in 2022, led to the international agreement to protect 30% of land and oceans by 2030 and the adoption of the Kunming-Montreal Global Biodiversity Framework. The framwork identified 23 targets aimed to reverse the degratding and destruction of natur and biodiversity loss. Extensive datasets, like provided in NovasArc, are particularly valuable for target 2 where the aim is to ensure that by 2030 at least 30 per cent of areas of degraded marine and coastal ecosystems are under effective restoration, in order to enhance biodiversity and ecosystem functions and services, ecological integrity and connectivity. Knowledge of the extent of these areas is essential. The dataset is also valuable for target 3 where the aim is to ensure that at least 30 per cent of marine and coastal areas, especially areas of particular importance for biodiversity and ecosystem functions and services, are effectively conserved and managed through ecologically representative, well-connected and equitably governed systems of protected areas and other effective area-based conservation measures.
Box 1 Assessing risk using BH3 indicator
OSPAR common indicator “Physical damage of predominant and special habitats” (BH3) assesses the extent and level of disturbance on benthic habitats caused by physical damage from anthropogenic pressures. The indicator focusses on impacts from bottom-trawling which are cited as one of the most important anthropogenic activities affecting the marine ecosystem (Jennings & Kaiser 1998, Halpern et al. 2008). BH3 is assessed by collecting data on both benthic habitat and anthropogenic activities. For the BH3 indicator, the distribution and intensity of mobile bottom gear fisheries (vessels of > 12 m) is estimated as swept area ratios (SAR), separated into surface and sub-surface (sediment penetration ≥ 2 cm) abrasion within 0.05° x 0.05° grids (also known as c-squares), (Eigaard et al. 2016, OSPAR, In Prep). The SAR is calculated as the width of fishing gear (in meters) multiplied by the average vessel speed (in knots) and the time fished (hours). The spatial distribution pattern of anthropogenic pressures is based on calculations of exposure within a year and in an MSFD cycle of six years (Anon, 2015, OSPAR. In Prep).
Indicator BH3 has been developed for the OSPAR and MSFD assessment of physical disturbance on seabed habitats, which is considered under MSFD criteria D6C3 (Descriptor 6 Criterion 3) ‘Adverse effects of physical disturbance on habitats. EU Member States shall establish threshold values for the adverse effects of physical disturbance through regional or sub-regional cooperation. D6C3 is considered a key criterion beside D6C4 ‘Extent of habitat loss’ and D6C5 ‘Condition of habitat’. Methodology and threshold values for D6C4 and D6C5 have not been sufficiently developed yet on regional or EU level. Criteria D6C3 is therefore crucial for the assessment of seabed habitats. BH3 as a OSPAR product should be designed to be used by Contracting Parties that are EU Member States as their regionally coordinated product for D6C3 in the implementation of the MSFD in the NEA region, in accordance with the Commission Decision on GES (2017/848).
Box 2. MSC-criteria for certification
Certification verifying that fisheries are practicing sustainable use of the natural resource has increased the awareness of the consumer that they have power to make positive impact on the environment. This has led to the closing of some markets to those fisheries that do not possess such a certificate. The largest organization providing comprehensive standards for evaluation and granting certificates is the Marine Stewardship Council (MSC). Over time the MSC has evolved their fisheries standard to include evaluation of impact on the environment under Principle 2 (see MSC Fisheries Standard v3.0, 2022). This means that certification requires that certain components (in-scope species, endangered, threatened, or protected (ETP) and out-of-scope (OOS) species, habitats and ecosystems) are evaluated and assigned to score that will influence the outcome of the fisheries evaluation. Principle 2: Environmental impact of fishing:
“Fishing operations should allow for the maintenance of the structure, productivity, function, and diversity of the ecosystem on which the fishery depends. The ecosystem includes habitat and associated dependent and ecologically related species.”
Under Principle 2, Performance Indicator for the component Habitats includes; 1. the habitat outcome (evaluation of sensitivity, prevent serious or irreversible harm to habitat structure and function), 2. management (strategy in place that is designed to ensure the UoA (unit of assessment) does not pose a risk of serious or irreversible harm to the habitats i.e., protection measures) and 3. information (determine the impact of the UoA on habitats, including changes in the risk posed by the UoA over time). The MSC requires that uncertainty of distribution of VMEs is taken into account for management use.
Table 3. Overview of criteria and indicators relevant to NovasArc.
Management framework | Tool | Criteria/Indicator | Assessment |
MSDF | GES Descriptor 6 | Criteria element: 1.Physical loss of seabed Criteria: Spatial extent and distribution of physical loss (permanent change) of the natural seabed. | Spatial estimates of the degree of risk from fishing, on the sea floor integrity. |
MSDF | Criteria element: 2. Physical disturbance to the seabed. Criteria: Spatial extent and distribution of physical disturbance pressures on the seabed. | Areas where there is high overlap between the spatial distribution of particular VME indicators (based on their predicted suitability) and fishing effort. | |
OSPAR | Common Indicator BH3: Extent of Physical Damage to Predominant and Species Habitats | Assessment method: 1. parameters and metrics, 2. criteria, 3. spatial and trend analysis. Underlying information: i) the distribution and sensitivity of habitats (resilience and resistance) ii) the distribution and intensity of human activities and pressures that cause physical damage. | |
OSPAR | BH4: Habitat loss | Four steps i. Identify activity and pressure causing irreversible habitat loss ii. identify the loss of potential habitat generated by each pressure type iii. Defining presence of the habitats using species distribution models iv. combining the loss of potential habitat and extrapolating the value of change across the region. | |
MSC | Principle 2 assessment | Component: Habitats PI 2.4.1, 2.4.2, 2.4.3 | Estimate of habitat sensitivity: Assessing the status of habitats and the impacts of fishing. Spatial estimate of degree of the risk from fishing. |
Communicating risk assessments (overlap between fishing pressure and VMEs) to managers
NovasArc has generated spatial estimates of the degree of risk from bottom fishing on seafloor integrity, e.g. areas where there is high overlap between the spatial distribution of VME indicators (based on their predicted suitability) and fishing effort.
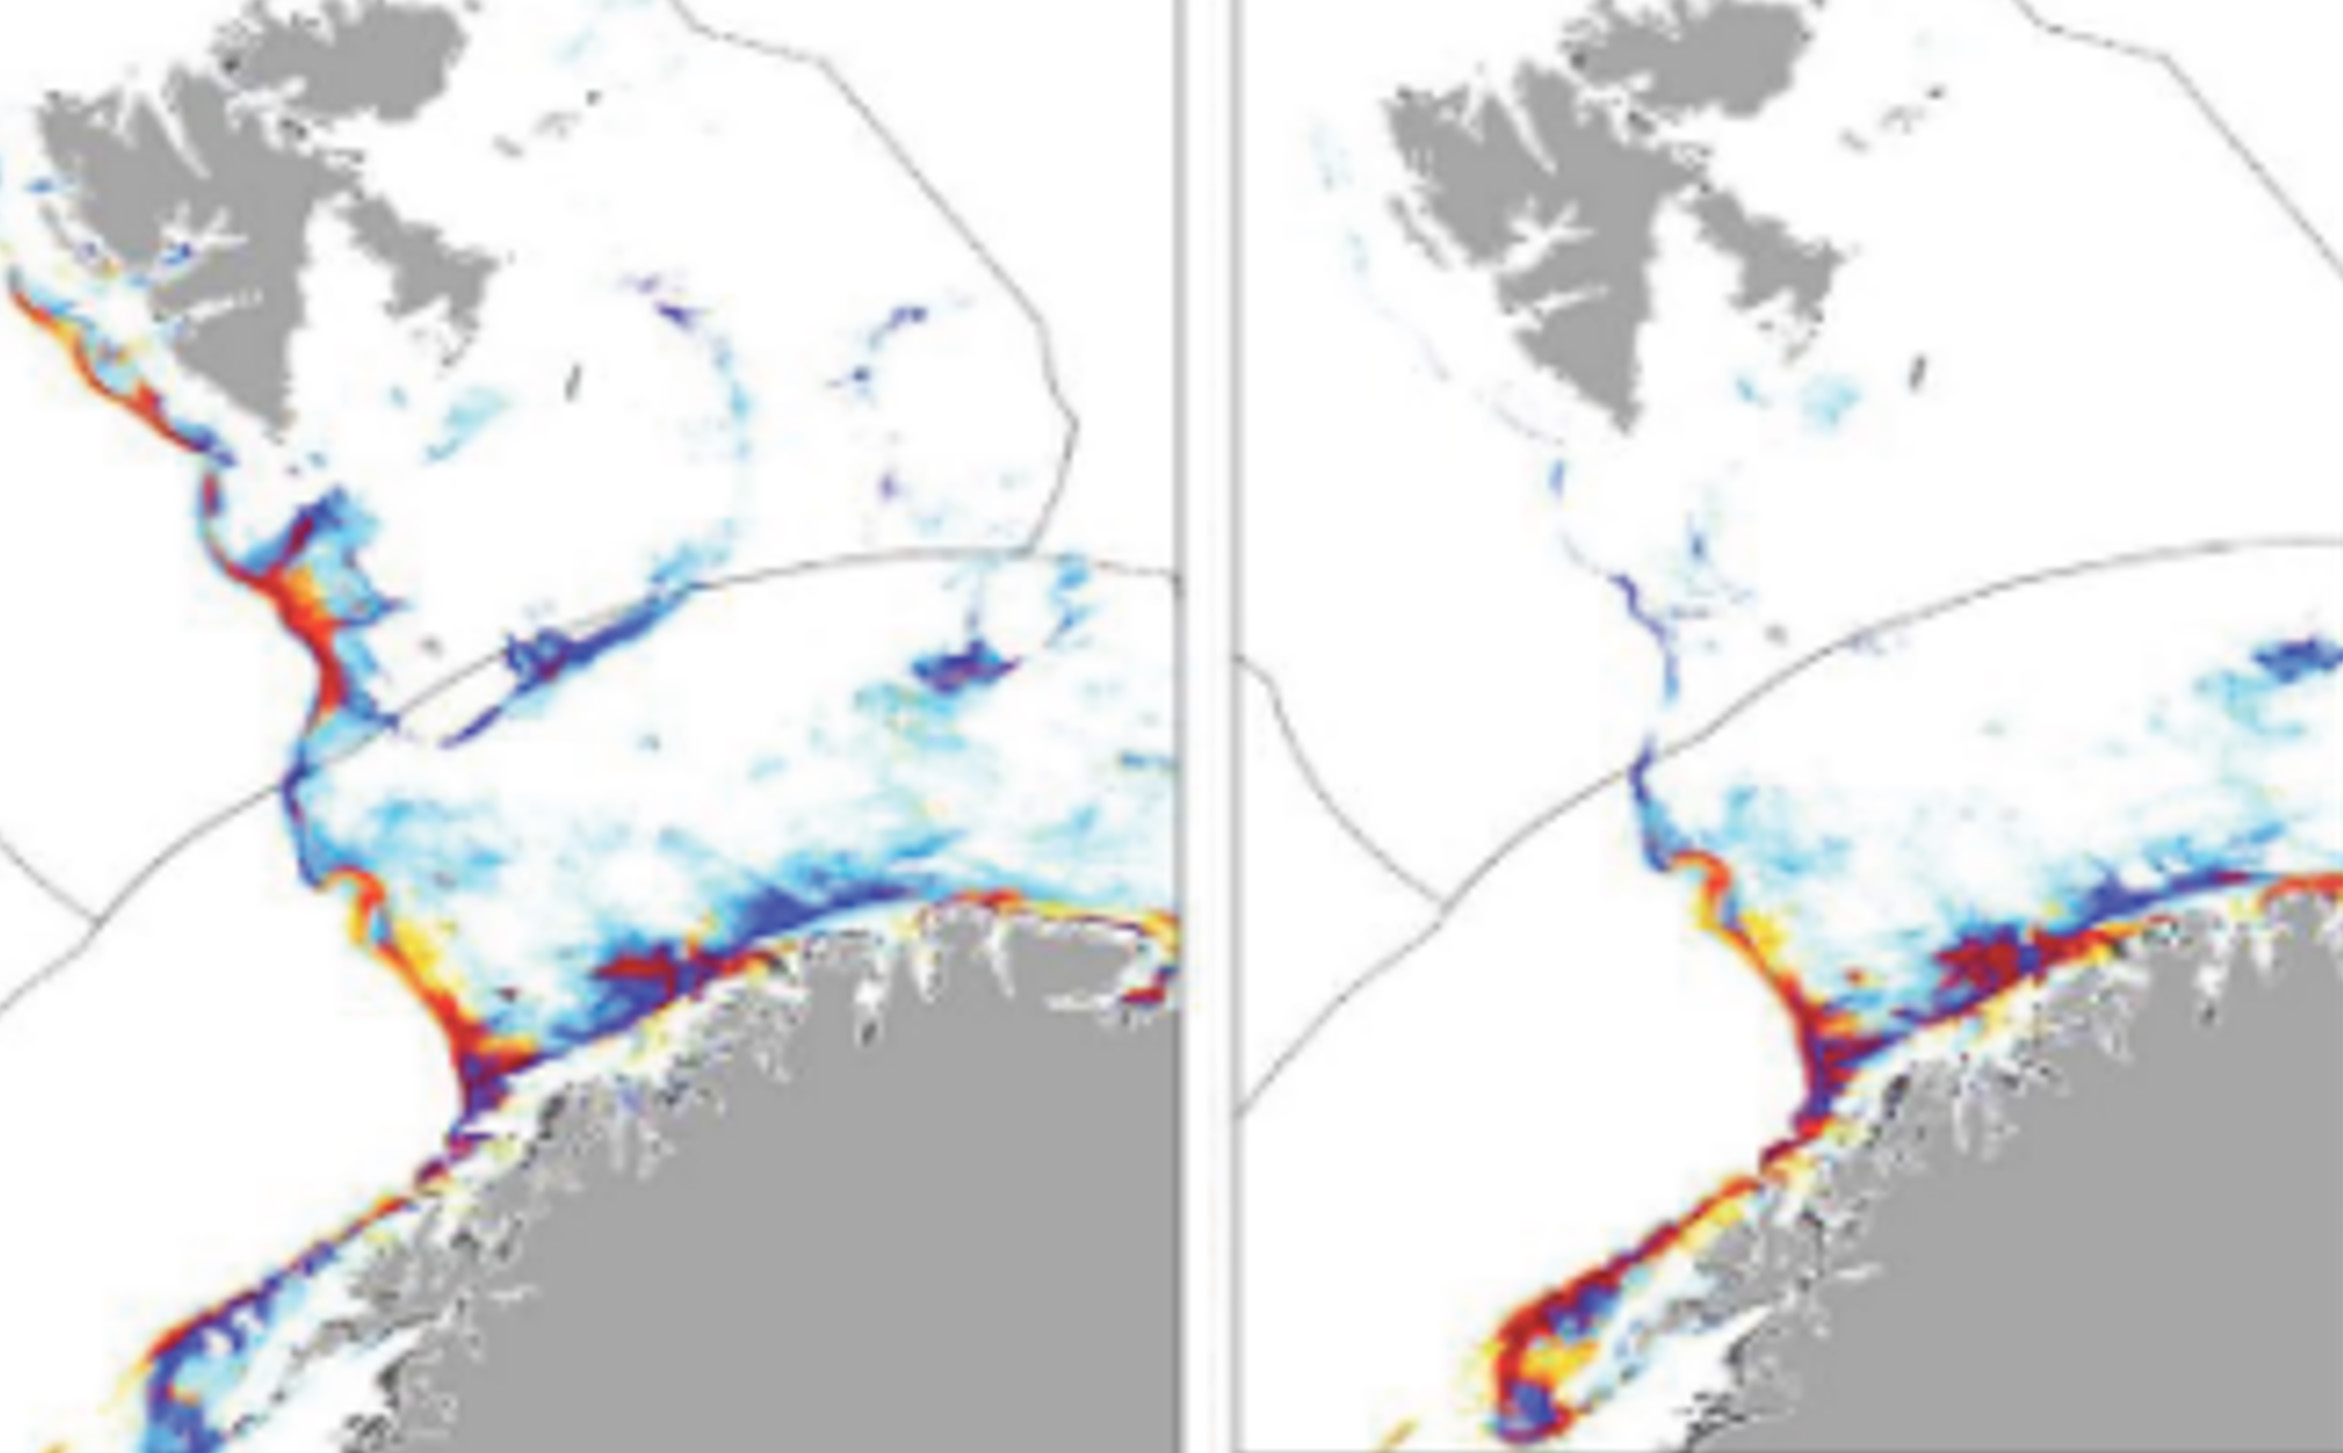
It is important that the results from analysis of the geographic overlap between the distribution of VMEs and fisheries can be related to management indicators. The results should be reported in a format that is readily perceived by managers and other stakeholders. The key output presented in the previous TemaNord report (Buhl-Mortensen et al 2019) is a detailed assessment of the degree of spatial overlap (%) in spatial distributions between bottom fishing and VME distributions. This was evaluated for each of the VMEs at five levels of fishing intensity, ranging from none to very high for each of the five regions (Norway, Svalbard, Jan Mayen, Iceland, Faroe Islands and Greenland). Overlap between fishing effort and predicted VME distribution were generated using two approaches with different model settings (Table 4, Figure 7 & 8): PRES “presence”: Area with predicted suitability higher than the model presence threshold) and OPT “optimal”: Area with predicted suitability higher than 0.8. with a focus on the area of each VME that co-occurs with intermediate to high fishing intensity.
An indicator of fishing pressure was calculated as the Swept-Area Ratio (SAR, the proportion of a grid cell (500 m x 500 m) swept by bottom trawl each year) and locations assigned to four effort levels; low: >0–0.1, intermediate: 0.1–0.2, high: 0.2–2, and very high: >2.
Table 4 presents an example of how results from this study can be presented, showing the estimated proportion of the different VMEs experiencing fishing pressure of different intensity for the whole study area.
Figures 6 and 7 present the same information with focus on percentage of the area of each VME that co-occur with intermediate to high fishing intensity, the last column in table 4. Figure 6 shows the proportion for the whole Nordic Seas area. The same results are available for each country separately. As an example, figure 7 shows the percentage of VMEs in Norwegian EEZ that overlap with intermediate to high fishing intensity.
Table 4. Estimated proportion (%) of VME area exposed to four different levels of fishing intensity.
PRES “presence” is VME area based on a predicted suitability higher than the model presence threshold. OPT “optimal” is VME area with predicted suitability higher than 0.8. Fishing intensity is expressed as “Swept-Area Ratio”: the proportion of a grid cell (500 m x 500 m) that is swept by trawl each year. Low: >0 - 0.1, Intermediate: 0.1-0.2, high: 0.2-2, and very high: >2.
PRES “presence” is VME area based on a predicted suitability higher than the model presence threshold. OPT “optimal” is VME area with predicted suitability higher than 0.8. Fishing intensity is expressed as “Swept-Area Ratio”: the proportion of a grid cell (500 m x 500 m) that is swept by trawl each year. Low: >0 - 0.1, Intermediate: 0.1-0.2, high: 0.2-2, and very high: >2.
Model setting | Pres | Opt | Pres | Opt | Pres | Opt | Pres | Opt | Pres | Opt | Pres | Opt | Pres | Opt |
Fishing intensity | No | Any fishing | Low | Inter-mediate | High | Very high | Interm – Very high | |||||||
Sublittoral sea pen communities | 53,0 | 31,4 | 47,0 | 68,6 | 13,0 | 14,2 | 11,4 | 13,8 | 11,0 | 14,8 | 11,7 | 25,8 | 34,1 | 54,4 |
Hard bottom sponge aggregations | 43,6 | 41,5 | 56,4 | 58,5 | 18,7 | 16,8 | 13,9 | 14,4 | 11,9 | 11,8 | 11,9 | 15,5 | 37,7 | 41,7 |
Stylasterid corals | 46,8 | 42,5 | 53,2 | 57,5 | 15,6 | 13,4 | 12,2 | 13,8 | 11,7 | 11,7 | 13,7 | 18,6 | 37,6 | 44,1 |
Cauliflower corals | 50,7 | 44,3 | 49,3 | 55,7 | 15,7 | 16,5 | 14,0 | 15,7 | 12,2 | 14,2 | 7,4 | 9,3 | 33,6 | 39,3 |
Soft bottom gorgonians | 76,5 | 48,2 | 23,6 | 51,8 | 9,1 | 20,9 | 6,1 | 14,0 | 4,5 | 9,6 | 3,9 | 7,3 | 14,5 | 30,9 |
Soft bottom sponge aggregations | 55,9 | 50,4 | 44,1 | 49,6 | 115,0 | 14,3 | 11,8 | 12,4 | 9,7 | 11,3 | 7,7 | 11,7 | 29,1 | 35,3 |
Hard bottom gorgonians | 50,3 | 54,6 | 49,7 | 45,4 | 16,9 | 14,5 | 12,0 | 11,9 | 10,5 | 8,8 | 10,3 | 10,2 | 32,8 | 30,9 |
Bathyal sea pen communities | 73,6 | 56,8 | 26,4 | 43,2 | 11,4 | 19,0 | 7,4 | 12,9 | 5,0 | 7,2 | 2,6 | 4,1 | 15,0 | 24,2 |
Cold-water coral reefs | 54,1 | 58,4 | 45,9 | 41,6 | 13,6 | 11,9 | 10,5 | 10,0 | 9,9 | 7,6 | 11,9 | 12,2 | 32,3 | 29,8 |
Cup coral fields | 68,2 | 67,9 | 31,8 | 32,2 | 8,7 | 5,9 | 7,8 | 8,9 | 7,9 | 9,9 | 7,4 | 7,5 | 23,2 | 26,3 |
Deep arctic sponge aggregations | 83,4 | 85,2 | 16,6 | 14,8 | 8,1 | 7,9 | 4,7 | 4,1 | 2,8 | 2,2 | 1,1 | 0,6 | 8,5 | 6,9 |
Figure 6. Percentage of modelled distribution area for VMEs in areas with intermediate to very high fishing intensity (see also table 4).
Figure 7. Percentage of modelled distribution area for VMEs in Norway with intermediate to very high fishing intensity.
2.6 Step 6: Better communication, topics, future steps
Increased knowledge and ecosystem-based management of the national fisheries resources and marine biodiversity will increase the value of the resources for the next generation. NovasArc will continue to aid the regional application of the MSFD criteria, including criteria elements, and methodological standard of indicators of the GES related to Benthic habitats. NovasArc held a Stakeholder symposium on Vulnerable Marine Ecosystems (VMEs): distribution threats and management challenges in 5-6. September 2022. It was attended by representatives of Fishermen organisations, the Marine Stewardship Council (MSC), Ministries and directorates of the environment and fisheries, OSPAR, and the World Wildlife Federation (WWF).
At the symposium, a wide range of issues were discussed, such as how to incorporate survey data in area-based management and evaluation of the feasibility of the various management options.
The main challenges towards a better management of VMEs identified at the symposium were:
- Conservation process: How to get from a survey to conservation? Translating science to management objectives. Operationalistion.
- What are feasible management actions?
- Do management plans lead to management actions? Challenge of operationalising management plans
- What are the management processes in Faroes, Iceland and Norway? Gain understanding of the conservation processes...
- A forum or a pathway for the scientists to report on areas that need protection/attention is generally missing.
The symposium produced the following summary statement to guide further work: “It was agreed that it is important to inform the political level of the need for new methods and processes for, sustainable fisheries management, ecosystem approach, and related certification.
This will demand a close collaboration between fishermen and scientists to improve certification criteria, management, and closures. “
“Based on this common understanding we suggest to start a collaboration between NovasArc, a “Sustainable network” of fishermen, and WWF in support of a well-informed management approach.”