↑ Images: iStock
↑ Image: iStock
4. Impact analysis of regulatory reforms on Nordic electricity markets
4.1 Description of the methodological approach and the baseline scenario
We use THEMA's fundamental electricity market model, TheMA, to simulate market outcomes for 2035 and run sensitivities to examine the effect of alternative regulatory developments on Nordic prices, trade flows, and welfare.
We use the model to calculate a baseline scenario and then systematically vary key input assumptions to assess how deviations from the baseline affect Nordic electricity prices, trade flows, and welfare. This allows us to isolate the price effect of specific policies and developments.
We use THe MA Base as our baseline scenario, which describes a credible development pathway for European electricity markets through 2035. The scenario assumes that gas-fired generation continues to play an important role as dispatchable firm capacity during the energy transition, providing flexibility as coal plants retire across Continental Europe. CO2 prices increase over the outlook horizon, strengthening the incentive to decarbonise, while gas prices remain relatively stable. Electricity demand grows moderately, driven mainly by gradual electrification of transport and heating, while conventional industrial demand remains subdued due to slow economic growth. The EU maintains its 2050 net zero ambition, and renewable generation expands substantially—though capacity build-out falls short of government targets in key European countries due to permitting constraints, supply chain limitations, and financing challenges. Hydrogen deployment is substantially delayed until 2035 relative to current targets. Some new interconnection capacity is installed, though not all planned projects are realised by 2035.
Figure 1 shows the development of the generation mix and total electricity demand in THEMA Base for 2035. More detailed assumptions for individual generation technologies or interconnector capacities are presented in the relevant sections below, alongside the sensitivity definitions for each regulatory trend.
Figure 1. Total electricity demand and generation mix in the Nordics and selected European countries in THEMA Base in 2035
The sensitivities we are simulating are described in the sections below, and focus on the following input variations:
- Changes in firm capacity to reflect effects of capacity mechanisms (Section 4.2)
- Changes in renewable capacities and battery developments, reflecting changes in renewable targets, support systems, and build-out trajectories (Section 4.3)
- Changes in interconnector availabilities and trade arrangements, reflecting policies or developments like internal bottlenecks, tariffs, or surcharges that could reduce trade opportunities (Section 4.4)
- Changes in bidding zone topologies (Section 4.5)
4.2 Capacity mechanisms and build-out of firm gas capacity in Germany and Poland
In this section, we investigate how Nordic electricity prices react to capacity mechanisms and firm capacity expansion in Germany and Poland. Both countries are planning substantial gas-fired capacity additions: Germany's Kraftwerksstrategie targets 12 GW of additional firm capacity by the early 2030s, while Poland's TSO PSE estimates that approximately 12 GW is required to compensate for coal plant retirements.
The implementation and scale of these mechanisms remain uncertain. Our sensitivities test what happens to Nordic prices if capacity mechanism implementation is delayed, if governments fully deliver on their plans, or if security of supply concerns drive additions beyond current expectations.
4.2.1 Germany and Poland plan substantial gas capacity additions through capacity mechanisms
Figure 2. Operating gas generation capacity, GW
Figure 2 illustrates the gas capacity assumptions underlying our sensitivity analysis. The analysis compares three sensitivities against the THEMA Base scenario. In THEMA Base, Germany reaches 50.2 GW of installed gas-fired capacity by 2035, an increase of roughly 15 GW from 2025 levels, broadly in line with the Kraftwerksstrategie, which targets 12 GW of additional firm capacity by the early 2030s (see hapter 3.1). Poland reaches a total of 14.8 GW of gas-fired capacity by 2035 in THEMA Base, up from 5.8 GW in 2025, consistent with TSO PSE's estimate that approximately 12 GW of new firm capacity is required to compensate for coal plant retirements.
Low sensitivity: Delays in implementing capacity mechanisms and fiscal constraints prevent both countries from delivering planned additions. Each realises only 50% of its targeted expansion. Germany reaches 41.5 GW (+6 GW), Poland reaches 12 GW (+6 GW).
Medium sensitivity: Both countries fully implement their government plans by 2035. Germany reaches 47.5 GW (+12 GW), Poland reaches 18 GW (+12 GW).
High sensitivity: Security of supply concerns and public resistance to price spikes drive capacity additions beyond current plans. Germany reaches 70 GW (+35 GW, the maximum need identified in Bundesnetzagentur's security of supply monitoring), Poland reaches 24 GW (+18 GW, 50% above PSE's baseline requirement).
We run each sensitivity for Germany and Poland separately to isolate individual country effects.
Figure 3. Base prices across bidding zones for the sensitivities on German gas capacities
4.2.2 Lower firm gas capacity in Germany leads to more price spikes in the Nordics
Figure 3 shows base prices in Germany and Nordic bidding zones under the sensitivities on German gas capacity. When gas-fired capacity in Germany remains low (DEU Low), Nordic power prices increase moderately by 1–7 EUR/MWh compared to THEMA Base. The effect is most pronounced in Denmark. Danish prices are in general more correlated and coupled with prices in Germany than the other Nordic bidding zones. Norwegian and Swedish zones show smaller but still tangible effects, though price levels in SE4 are notably higher than in other Swedish zones due to its stronger interconnection with the higher-priced Danish and German markets. Finland is least affected by the changes.
The Polish gas capacity sensitivities produce only negligible effects on Nordic prices as Figure 29 in the Appendix highlights. This is a result of the fact that the Nordic system is coupled more with Germany than with Poland. Hence, the Nordic market is less exposed to changes in Poland.
Figure 4. Hourly electricity prices in January in DK1, EUR/MWh
The reason that prices change is not because prices in all hours change, but that the number of price spikes changes between the firm capacity scenarios. Figure 4 illustrates hourly prices for January in DK1 under the THEMA Base and DEU Low scenarios. The increase in average prices under low German gas capacity stems almost entirely from a higher frequency of peak price events rather than from elevated prices during other hours. Prices in DK1 during non-peak hours remain similar across scenarios. This indicates that price spikes, which become more frequent in Germany with lower firm capacity, transmit into Nordic bidding zones.
Figure 5. Number of peak prices above 500 EUR/MWh
This is also indicated by Figure 5 which shows the number of hours with peak prices above 500 EUR/MWh for Germany and all Nordic bidding zones across the German gas capacity sensitivities. The analysis uses THEMA's standard 2016 weather year, selected because it represents a meteorologically typical year without extreme wind, solar, or hydrological anomalies. Danish zones show the highest sensitivity to German gas capacity levels among Nordic markets, reflecting Denmark's strong interconnection with Germany. Norwegian and Swedish zones display more moderate sensitivity to German gas capacity. Please note that in some cases, the number of price spikes in the Nordics exceeds the number of price spikes in Germany. This implies also that not all price spikes are “imported”, and that also local conditions contribute to the price spikes in Nordic bidding zones. This applies in particular to Finland, where scarcity events are driven primarily by domestic constraints or intra-Nordic transmission limitations rather than by continental factors.
4.2.3 The impact of reduced German gas capacity is more pronounced in a ‘normal’ weather year
To test the robustness of these findings, we have also analysed what happens under different weather conditions. As explained above, the results above are based on one particular weather pattern (2016), and do not reflect the full range of system stress that can occur under different meteorological conditions. However, in the Nordics, weather variability is a key driver of scarcity events: some years are characterised by prolonged periods of low wind and solar generation combined with high demand (so-called “Dunkelflaute” events), while others are milder with ample renewable output.
To assess the robustness of Nordic markets to reduced firm capacity in Germany, we run both the THEMA Base and DEU Low scenarios across 25 historical weather years (range of weather conditions from 2000-2024). This allows us to test whether the increase in peak price exposure under lower German gas capacity is systematic across weather conditions or concentrated in specific types of years.
In the simulations we differ renewable feed-in and hydrological inflow and demand according to observed historical weather conditions. This is done consistently across all European markets and bidding zones and technologies. For each weather year, the THEMA power market model then simulates dispatch and prices. This approach reveals how the same power system configuration responds to different weather patterns and captures the distribution of outcomes across historical weather variability.
Figure 6. Number of peak prices for different weather years in THEMA Base and DEU Low
Figure 6 above shows the number of peak price hours above 500 EUR/MWh for selected Nordic zones and Germany for THEMA Base and DEU Low.
Each grey line represents one weather year, connecting peak price counts in THEMA Base (left) to DEU Low (right). The red line shows the median across all years. Two representative years are highlighted: 2010 (yellow), an extreme weather year with high scarcity already in THEMA Base, and 2012 (blue), a more typical year with a roughly average number of peak price hours in THEMA Base.
To reduce the complexity of Figure 6, we focus on NO2 and SE3 since these are the zones with the highest electricity demand in Norway and Sweden.
Figure 6 shows that the overall conclusion remains valid: The lower the assumption on firm capacity in Germany, the higher the peak price count across weather years. At the same time, the magnitude of the effect is very different from weather condition to weather condition and differs from zone to zone.
The variations in results can be understood through the concept of tipping points in price formation.
In some weather years (like 2012), the system operates closer to the tipping point even under baseline capacity assumptions. While 2012 was meteorologically unremarkable in aggregate, it featured specific periods where moderate renewable shortfalls coincided with seasonal demand peaks — conditions that are not extreme individually but sufficient to push dispatch into the steep segment of the merit order. In this regime, even modest reductions in firm capacity can trigger disproportionate price responses, as the system tips from comfortable margins into scarcity pricing. By contrast, extreme years such as 2010 feature prolonged periods where the system is already deep in scarcity regardless of the capacity assumption. Reducing firm capacity further does not materially increase the peak price hour count — prices are already elevated, and the system has long passed the tipping point.
When demand is low or renewable output is high, the system clears on the left side of the merit order where cheap generation (renewables, nuclear) sets the price. When demand is high and renewable output is low, the system clears further to the right, where more expensive thermal plants set the price. The "tipping point" occurs when the system approaches the steep right-hand portion of the merit order, where small changes in available capacity can lead to large price changes. Beyond a certain threshold, prices rise sharply as the system exhausts lower-cost options and must rely on peaking units or demand response—or, in extreme cases, faces scarcity pricing.
Norwegian zones with high domestic flexibility, such as NO2, display lower exposure to peak prices, but also here the effect depends on the weather conditions. The Danish zones, DK1 and DK2, on the other hand, closely mirror German outcomes.
Overall, reduced German gas capacity increases Nordic peak price exposure, but the effect differs with weather conditions and with the bidding zone one examines.
Figure 7. Operating gas-fired generation capacity, GW
4.2.4 Additional Nordic firm capacity can offset lower German gas capacity and reduce regional peak prices
The previous analysis shows that lower German gas capacity increases peak price exposure in Nordic electricity markets, particularly in zones closely connected to Continental Europe. This raises a key policy question: Can Nordic countries mitigate this risk by deploying additional domestic firm capacity, thereby reducing dependence on continental capacity adequacy?
To examine this possibility, we run two additional sensitivities in which Nordic countries respond to lower German gas capacity by adding compensating firm capacity domestically. Figure 7 illustrates the gas capacity assumptions across scenarios.
DEU Low: Germany builds 8.7 GW less gas capacity than in THEMA Base, reaching 41.5 GW instead of 50.2 GW. No compensating capacity is added in the Nordics.
FIN High: Germany builds 8.7 GW less gas capacity, while Finland adds 8.7 GW of gas-fired capacity to offset the German shortfall.
DK High: Germany builds 8.7 GW less gas capacity, while Denmark adds 8.7 GW of gas-fired capacity, split evenly between DK1 and DK2 (4.35 GW each).
The sensitivities are not necessarily meant to reflect any realistic policy scenario or recommendation but are meant to inform about what happens to the number of price spikes if new capacity is domestically deployed instead of abroad. Figure 8 shows the number of peak prices hours above 500 EUR/MWh across Germany and the Nordic bidding zones under the four scenarios: THEMA Base, DEU Low, FIN High, and DK High.
Additional firm gas capacity in Denmark or Finland can in fact mitigate the impact of lower German gas capacity. In most bidding zones, the FIN High and DK High scenarios result in markedly fewer peak price hours than DEU Low. In several zones, peak price counts even fall below THEMA Base levels, despite Germany having 8.7 GW lower/reduced gas capacity. This demonstrates that strategically located Nordic firm capacity can more than offset German capacity shortfalls in terms of regional scarcity outcomes.
Figure 8. Number of peak prices above 500 EUR/MWh
Notably, Nordic gas capacity additions also reduce peak prices in Germany. Under DK High, German peak prices fall to 24 hours, nearly matching THEMA Base levels and almost fully compensating for the reduction in German gas capacity. During scarcity events, Danish gas-fired plants export power to Germany, effectively acting as backup generation when German supply is tight. Finnish gas capacity also lowers German peak prices, though the effect is smaller due to weaker direct market integration. These results highlight the strongly interconnected nature of European electricity markets: firm capacity located in well-connected neighbouring countries can contribute meaningfully to cross-border security of supply. Note, however, that we have not considered any internal grid constraints (e.g. within Germany) in this analysis.
4.3 Policy support schemes for renewable generation and battery storage
In addition to firm capacity, two other factors will shape power system development and can be highly influenced by policy measures and support schemes: renewable build-out and investments in batteries. The pace of renewable energy and battery expansion in continental Europe could vary significantly depending on how these policies evolve.
Several factors could slow expansion below current government targets. Offshore wind auctions have struggled in some countries due to high costs and supply chain constraints, while solar expansion faces grid access limitations. Battery deployment remains constrained by grid availability and uncertain market revenues. At the same time, conditions could also prove more favourable than expected. Falling technology costs, streamlined permitting procedures, or more generous support schemes could accelerate deployment beyond current plans. Given this uncertainty in both directions, we test sensitivities ranging from significant shortfalls to overachievement of government targets.
We investigate the following cases:
- Higher and lower offshore wind deployment, to isolate the price effect of more and less offshore deployment
- Higher and lower solar deployment, to isolate the effect of more and less solar deployment
- Higher and lower battery deployment, to isolate the effect of batteries
- Higher and lower battery deployment in combination with higher solar deployment
4.3.1 Offshore wind expansion could strongly impact Nordic prices
We run three sensitivities to test how changes in offshore wind capacity in Germany, Great Britain, and the Netherlands affect Nordic electricity prices, capture prices, and price structures. Figure 9 illustrates the offshore wind capacity assumptions across scenarios.
Figure 9. Operating offshore wind generation capacity, GW
Low sensitivity: Countries do not meet medium-term government targets due to unattractive subsidy schemes and high financing and equipment costs. Germany, Great Britain, and the Netherlands each achieve only 50% of the capacity aimed for by the government targets, reaching 20 GW in Germany, 25 GW in GB, and 13 GW in the Netherlands.
Medium sensitivity: Countries reach their medium-term offshore wind government targets by 2035. Germany meets its 2035 target of 40 GW. Great Britain reaches 46 GW, the midpoint of its 2030 target range of 43–50 GW. The Netherlands reaches 26 GW, on track toward its 2040 target of 30–40 GW.
High sensitivity: Countries overachieve government targets due to reduced financing and equipment costs and generous subsidy schemes. Germany reaches 50 GW, consistent with the government's Offshore Realisation Agreement. Great Britain reaches 75 GW (150% of its 2030 target). The Netherlands achieves 40 GW, meeting its 2040 target already by 2035.
We run each sensitivity for Germany, Great Britain, and the Netherlands simultaneously—that is, all three countries reach their respective Low, Medium, or High capacity levels in the same scenario. This approach reflects the fact that offshore wind build-out is correlated across countries. Beyond national regulatory support schemes, offshore expansion depends on equipment costs, capital availability, and supply chain capacity—factors that are largely shared across the North Sea region. If financing conditions or equipment costs prove more challenging than expected, this is likely to affect all countries; conversely, favourable conditions will benefit the entire region.
Figure 10 shows base prices across Nordic and continental bidding zones under the offshore wind capacity sensitivities. Offshore wind capacity expansion in Germany, Great Britain, and the Netherlands strongly reduces baseload prices across all Nordic zones. Norwegian zones react most strongly, with prices falling by more than 75% in the All High scenario compared to THEMA Base. Swedish, Finnish, and Danish prices decline as well, though less dramatically. Danish zones follow a pattern more similar to Germany than to Norway, reflecting Denmark's strong interconnection with continental markets.
Figure 10. Base prices for the offshore wind sensitivities
The strong impact of offshore wind on Norwegian prices is driven by water value dynamics. High offshore wind deployment creates substantial surplus generation in the North Sea region—the number of zero- and negative price hours in Germany almost doubles in the All High sensitivity relative to THEMA Base. When continental prices are depressed, export opportunities for Norwegian hydropower become less attractive, causing water values to fall. This translates directly into lower Norwegian wholesale prices, with the decline driven by a substantial increase in low-price hours.
However, price spikes persist even under very high offshore wind capacity. Nordic prices still reach up to 1,000 EUR/MWh during scarcity events, with the number of price spike hours declining only moderately. This pattern emerges because offshore wind cannot provide firm capacity during Dunkelflaute events—when wind generation drops across the North Sea region, the system remains exposed to scarcity regardless of installed offshore capacity.
The price dynamics caused by higher offshore capacity also reshape trade patterns and congestion rents. Table 6 and Table 7 in the appendix detail annual import and export volumes alongside congestion rents between Nordic and continental price zones. Nordic zones increase imports of cheap continental power during surplus offshore wind generation hours, with Denmark functioning as a transit hub that absorbs and redistributes surplus generation. Export congestion rents on links to Germany and Great Britain increase as price differentials during export hours widen—continental prices spike during low-wind periods while Nordic prices remain depressed due to lower water values. Conversely, import congestion rents decline as prices converge during high-wind hours.
Figure 11 shows that offshore wind capture prices decline strongly as continental offshore capacity increases, with Danish capture prices falling by around 40% in the All High scenario. Notably, offshore wind capture prices remain below LCOE even in THEMA Base across most zones, indicating that offshore wind investment will continue to depend on subsidies through 2035. Higher continental offshore capacity also puts significant downward pressure on Nordic solar capture prices, as shown in Figure 30 in the appendix. This effect occurs because increased offshore wind capacity depresses base electricity prices during hours with high solar generation.
It should be noted that the All High sensitivity represents an extreme scenario. The offshore capacity levels appear unrealistically high unless matched by a corresponding increase in electricity demand, which is not assumed in this sensitivity. Nevertheless, the analysis illustrates the directional impact of ambitious offshore wind deployment on Nordic markets when supply growth outpaces demand.
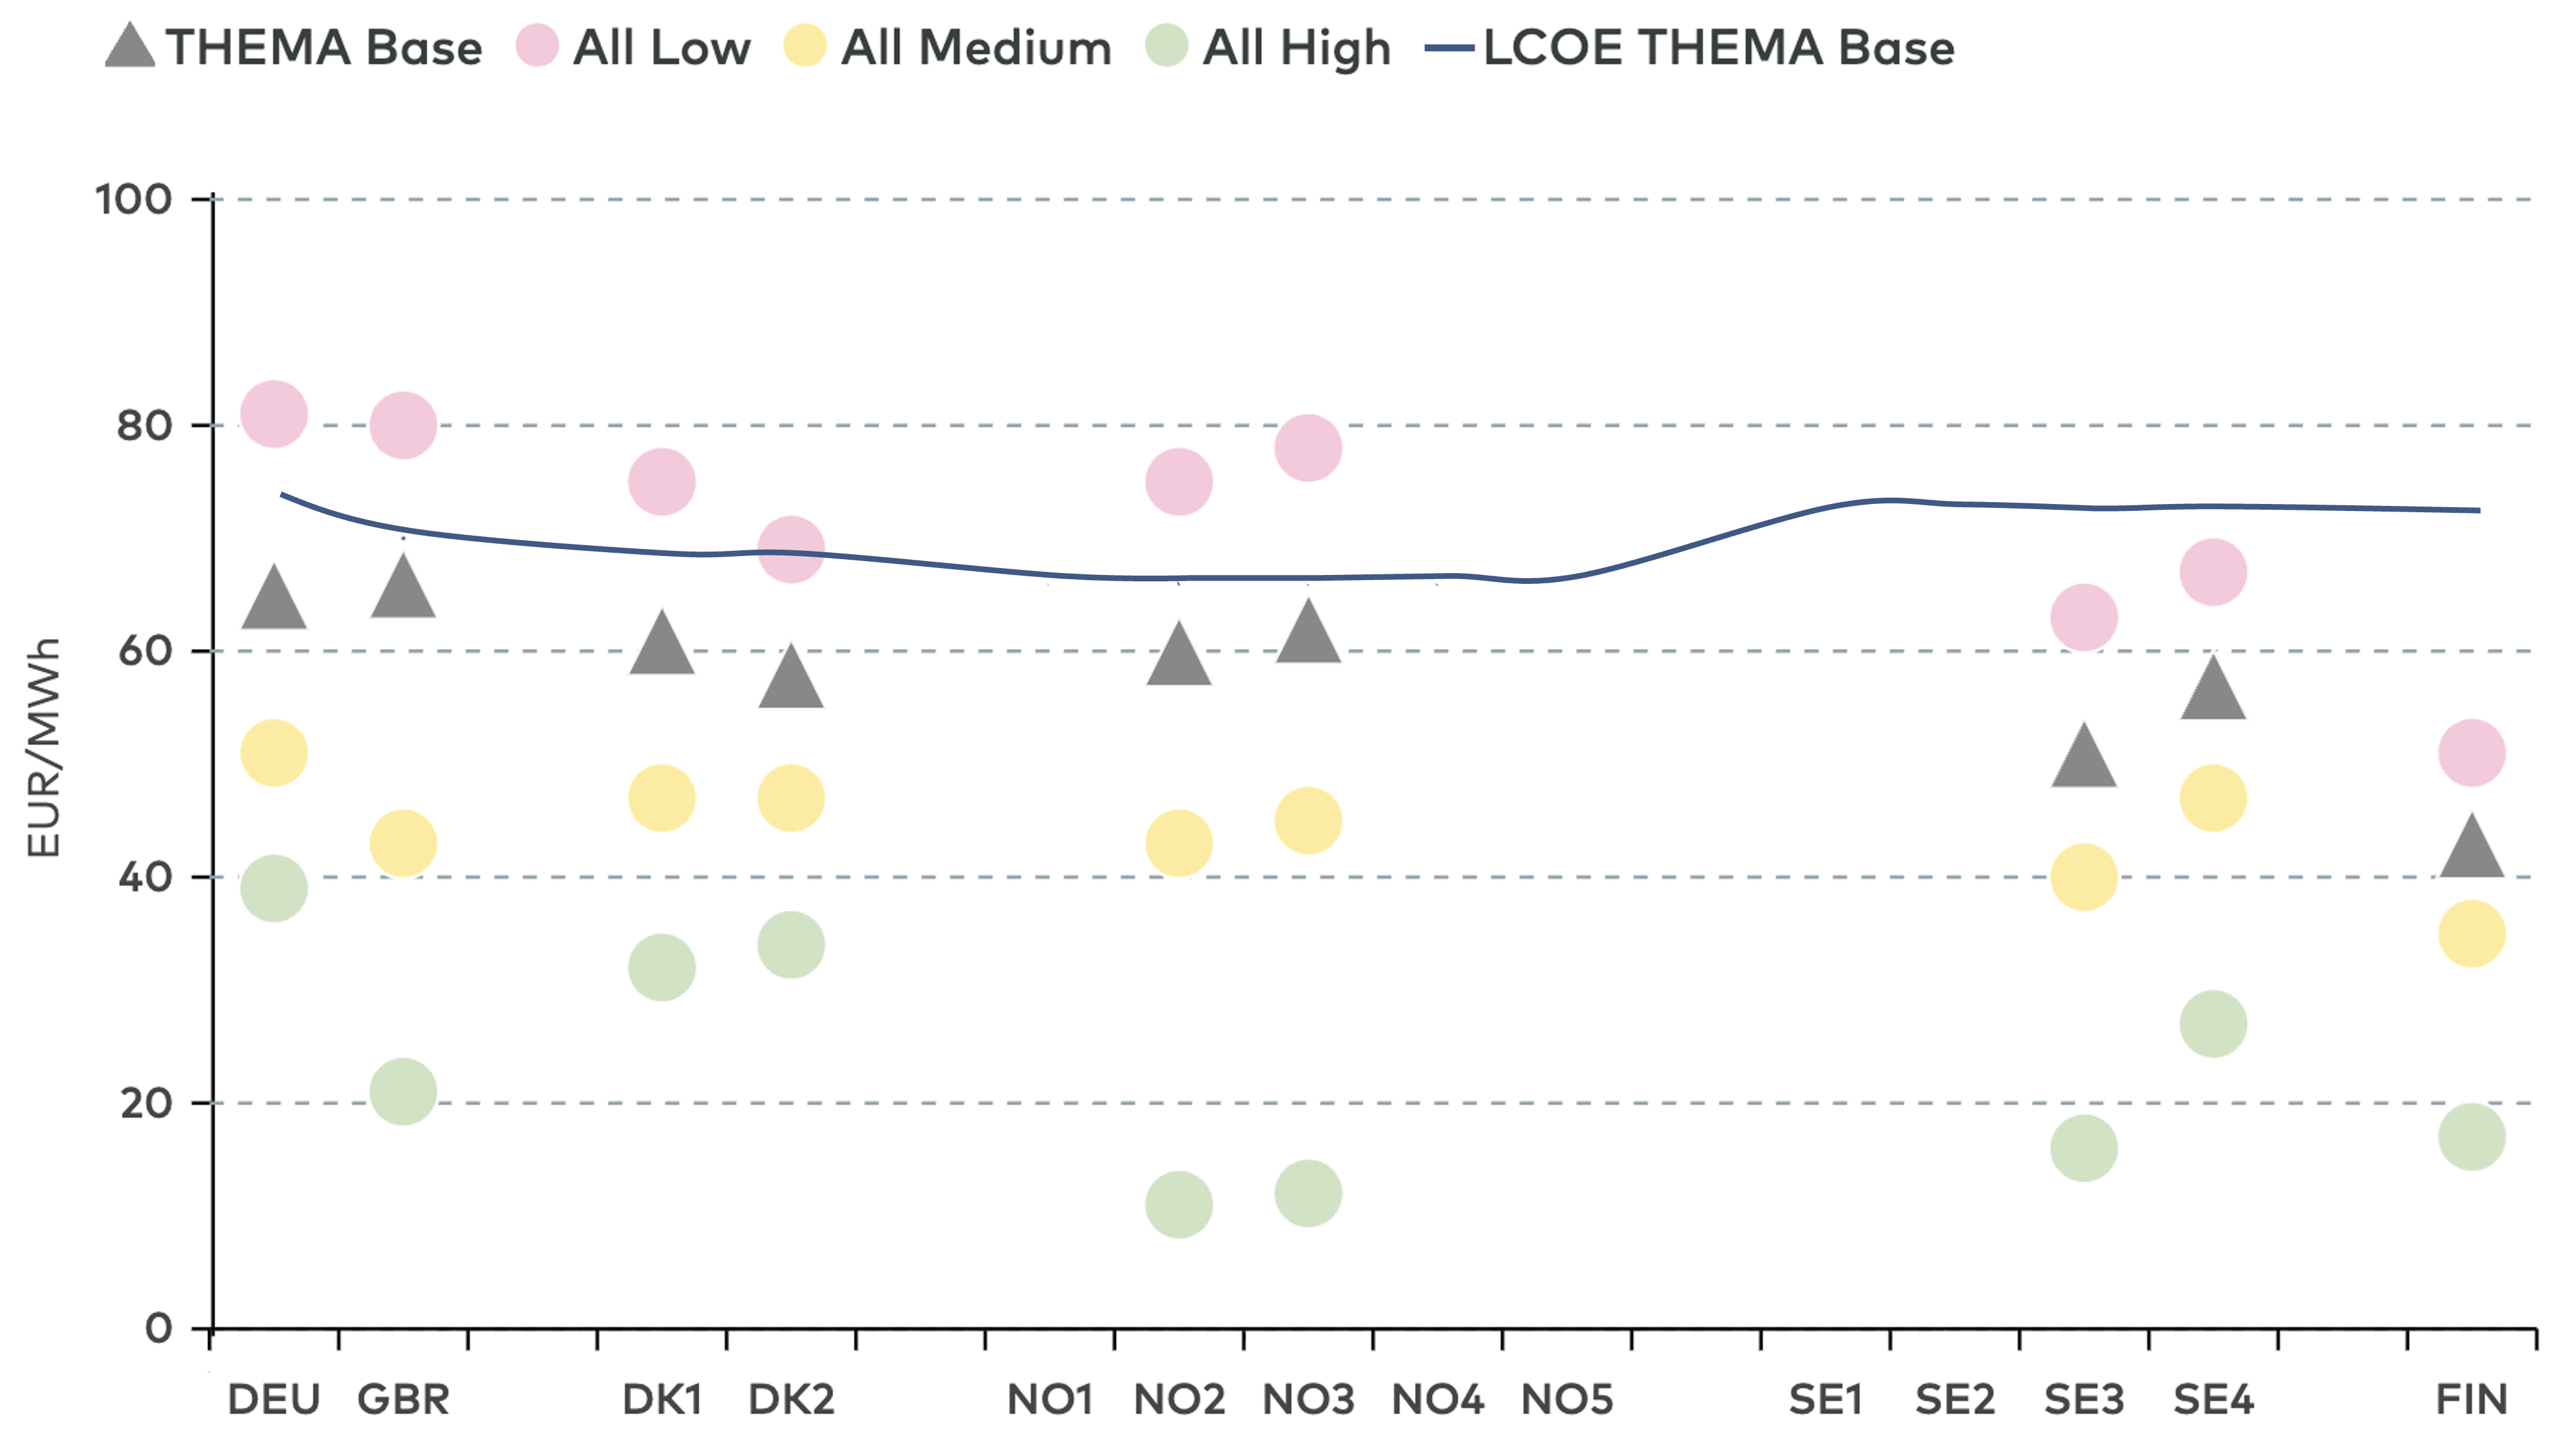
Figure 11. Offshore wind capture prices for the offshore wind sensitivities, EUR/MWh
4.3.2 Continental solar expansion reduces Nordic prices and depresses solar capture prices
We run three sensitivities to test how changes in solar PV capacity in Germany, Great Britain, and the Netherlands affect Nordic electricity prices, capture prices, and price structures. Figure 12 illustrates the solar capacity assumptions across sensitivities.
Low sensitivity: Countries do not meet medium-term government targets due to less generous solar support schemes and grid connection constraints. Germany achieves 160 GW in 2035, the lower bound of the scenario range in the government's monitoring report. Great Britain reaches 35 GW in 2035, only 75% of its 2030 target. The Netherlands reaches 30 GW, implying a build-out rate at only 50% of the pace required to meet the 2040 government target of 42.6 GW.
Medium sensitivity: Countries reach their medium-term government targets by 2035. Germany and Great Britain achieve their 2030 solar targets (215 GW and 46 GW respectively), while the Netherlands reaches its 2040 target of 42.6 GW already by 2035.
High sensitivity: Germany reaches its government target while Great Britain and the Netherlands overachieve their targets. Germany meets its 2035 target of 300 GW, Great Britain reaches 57 GW (125% of its 2030 target), and the Netherlands reaches 50 GW, building at twice the rate implied by its 2040 target.
Figure 12. Operating solar PV generation capacity, GW
We run each sensitivity for Germany, Great Britain, and the Netherlands. The Medium and High sensitivities are based on ambitious government targets that presuppose substantial electricity demand growth accompanying the solar expansion.
Figure 13 shows base prices across Nordic and continental bidding zones under the solar capacity sensitivities. In these sensitivities, all three countries (Germany, Great Britain, and the Netherlands) simultaneously reach their respective Low, Medium, or High capacity levels. Higher solar capacity in Continental Europe reduces baseload prices across all Nordic zones, though the effect is more moderate than for offshore wind expansion. Nordic prices decline by around 15–25% in the All High scenario compared to THEMA Base. German prices decline more sharply in both absolute and relative terms.
Figure 13. Base prices for the solar capacity sensitivities, EUR/MWh
The decline in baseload prices is partly driven by an increasing number of hours with zero or negative prices as Figure 31 in the appendix shows. Most Nordic zones experience only a significant increase in low-price hours as solar capacity expands, with Danish zones showing the strongest sensitivity due to their direct connection with Germany. The German market faces far more significant changes, with low-price hours rising by more than 50% from THEMA Base to All High reaching approximately 30% of all hours in 2035.
The rising frequency of zero and negative price hours directly depresses solar capture prices. Figure 14 shows that Nordic solar capture prices decline by around 25–40% from THEMA Base to All High, with a consistent pattern across all Nordic zones. Nordic capture prices remain substantially higher than German levels in all scenarios—German capture prices decline far more dramatically, turning even negative under All High.
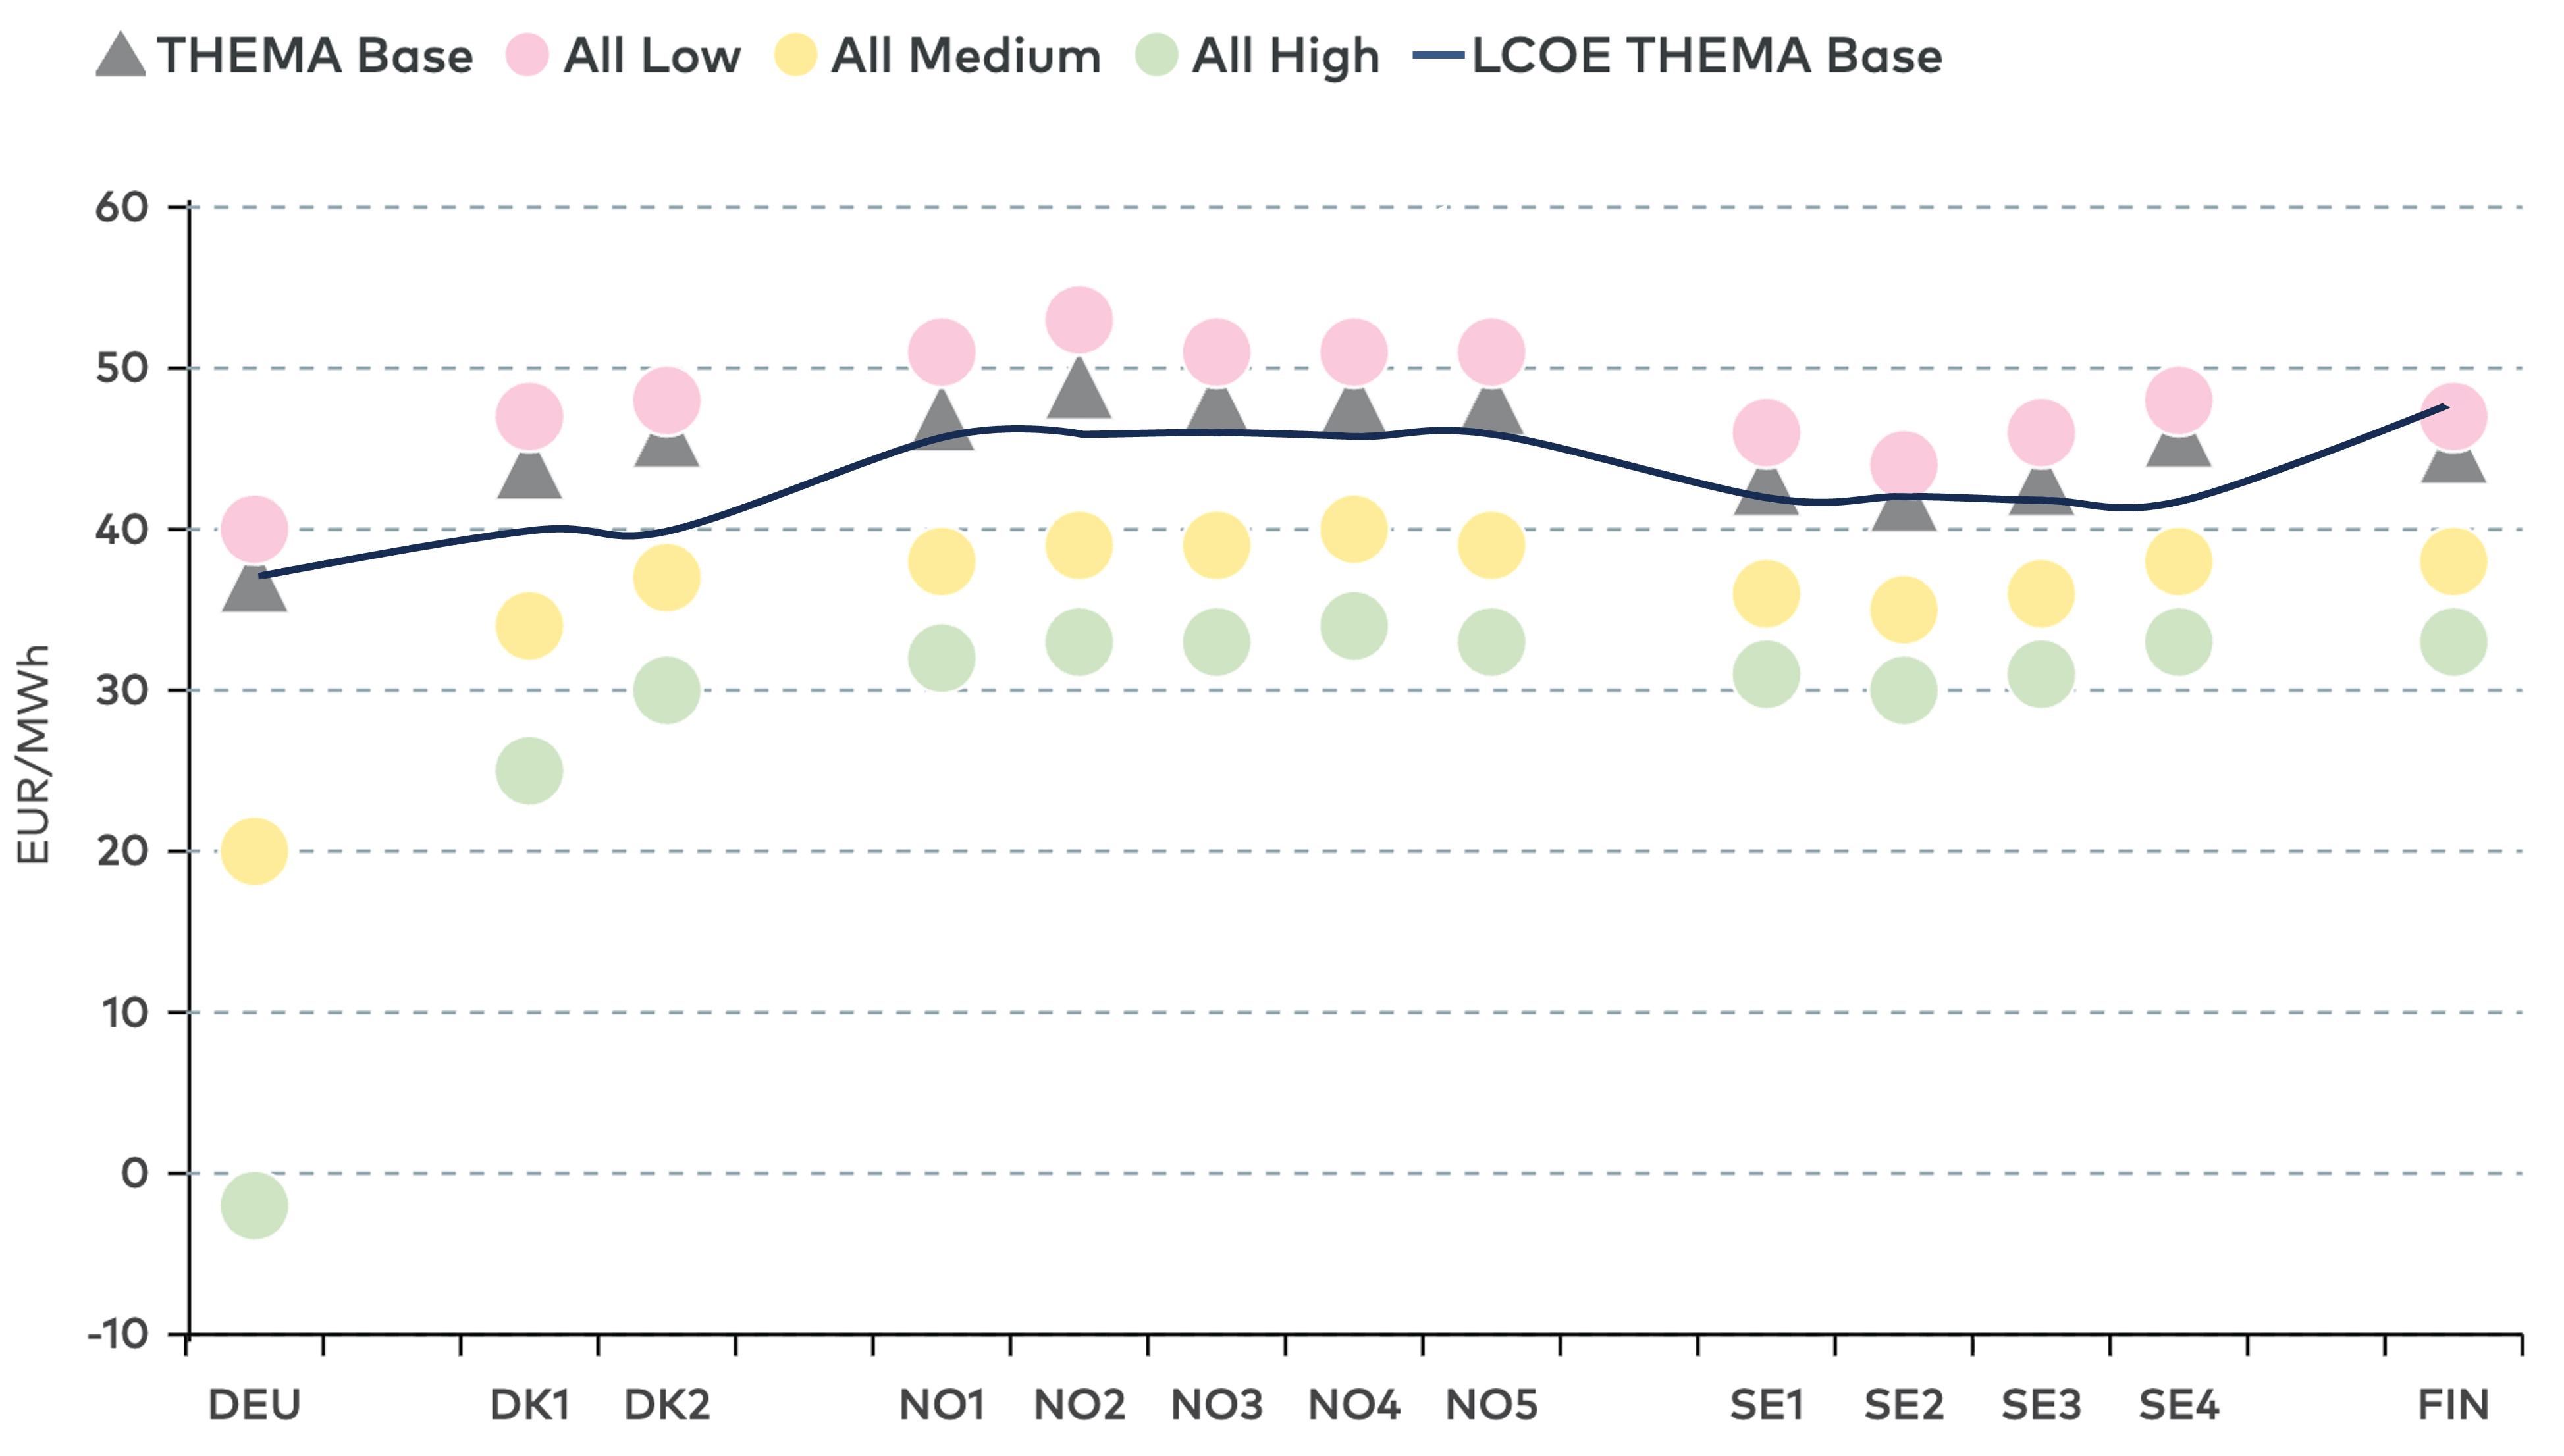
Figure 14. Solar capture prices and LCOEs for the solar PV capacity sensitivities
Comparing capture prices to solar LCOE reveals important implications for investment viability. In THEMA Base and All Low, capture prices in most Nordic zones remain above LCOE, allowing for market-driven solar investment in 2035. However, in the Medium and High sensitivities, capture prices fall below LCOE across all zones, making unsubsidised solar investment unprofitable in the Nordics.
It should be noted that while the All-High sensitivity reflects government targets for solar deployment, such capacity levels appear unrealistic unless matched by a corresponding increase in electricity demand. Solar curtailment in Germany rises dramatically under high solar penetration—increasing nearly tenfold from THEMA Base to All High. These results illustrate the market integration challenges associated with rapid solar expansion without corresponding demand growth: declining capture prices erode the business case for merchant investment, while rising curtailment represents lost renewable output. Although Norwegian hydropower flexibility provides some insulation, ambitious solar targets require corresponding growth in electricity demand and flexibility to avoid stranded renewable generation.
Figure 15. Operating battery capacity, GW
4.3.3 Battery capacity has limited impact on base prices but can reduce peak prices during Dunkelflaute events
We run three sensitivities for battery storage capacity in Germany, Great Britain, and the Netherlands. Figure 15 summarises the battery capacity assumptions. In all scenarios except High, batteries are assumed to have a 2-hour duration.
Low sensitivity: Deployment falls short of medium-term targets due to grid connection bottlenecks and insufficient subsidies as battery market revenues decline. Germany reaches 60 GW by 2035 (75% of the 80 GW expected in the government’s monitoring report). Great Britain reaches 25 GW by 2035, meeting its 2030 target of 23–27 GW with delay. The Netherlands installs 7.9 GW, around half of the 15.8 GW projected by TSO TenneT for 2030.
Medium sensitivity: Countries meet their medium-term targets by 2035. Germany installs 80 GW, Great Britain reaches 45 GW (a linear extrapolation of its 2030 target), and the Netherlands reaches 15.8 GW.
High sensitivity: Deployment exceeds current targets due to falling technology costs and generous subsidy schemes. Germany installs 120 GW, including an additional 46.1 GW of 4-hour duration batteries on top of the 2-hour capacity in THEMA Base. Great Britain reaches 60 GW (130% of its extrapolated 2030 target), and the Netherlands reaches 23.7 GW (150% of its 2030 target).
We run the battery sensitivities for Germany, Great Britain, and the Netherlands. In these sensitivities, all three countries simultaneously reach their respective Low, Medium, or High capacity levels. Figure 16 shows baseload prices across Nordic and continental bidding zones for the battery sensitivities.
Figure 16. Base prices for the battery sensitivities, EUR/MWh
Battery capacity has limited impact on baseload prices across Nordic bidding zones, as Figure 16 highlights. Prices show minimal variation between the All Low, THEMA Base, All Medium, and All High scenarios. German baseload prices similarly reveal little sensitivity to battery capacity.
The muted effect on baseload prices reflects the dual role of batteries in price formation. Batteries reduce prices during peak hours by discharging stored energy, while increasing prices during low-price hours by charging and absorbing surplus generation. These opposing effects largely offset when averaged across all hours, resulting in minimal net impact on annual baseload prices.
However, the effects on price extremes are more pronounced. The 4-hour duration batteries included in the All High scenario substantially reduce peak prices during Dunkelflaute events—in zones well connected to Germany, peak price hours above 500 EUR/MWh completely disappear (see Figure 32 in the appendix). Continental battery capacity also reduces the number of zero and negative price hours, with Germany and Danish zones seeing the largest reductions (see Figure 33 in the appendix). Norwegian, Swedish, and Finnish zones exhibit limited sensitivity to continental battery deployment for both peak and low-price hours.
Interestingly, while German baseload prices decline slightly with higher battery capacity, Norwegian prices increase marginally. This divergence reflects how batteries affect the terms of trade: by reducing German price extremes, batteries narrow the price differentials that drive Nordic-German exchange, making exports less profitable while reducing cheap import opportunities. This terms-of-trade effect partially offsets the direct price benefits of continental flexibility for Nordic markets.
As a measure of price volatility, Figure 17 shows the annual mean daily spread across bidding zones. Higher battery capacity reduces price volatility, with the largest reductions in Germany and Denmark. Norwegian, Swedish, and Finnish zones exhibit only small changes, as these markets already benefit from the flexibility provided by hydropower reservoirs.
Figure 17. Annual mean daily spread for the battery sensitivities, %
Annual mean daily spread is defined as the difference between daily maximum and minimum prices divided by the annual mean price
Annual mean daily spread is defined as the difference between daily maximum and minimum prices divided by the annual mean price
Figure 18 shows that higher continental battery capacity increases solar capture prices across Nordic markets by absorbing surplus solar generation during peak solar hours. Danish capture prices show the strongest response, followed by Norwegian and Finnish zones—reflecting the strength of interconnection with Germany. However, this improvement in capture prices comes at the cost of reduced revenue potential for the batteries themselves, as the price spreads they arbitrage decline with higher deployment.
Figure 18. Solar capture prices for the battery sensitivities, EUR/MWh
4.3.4 Batteries reduce solar curtailment but cannot fully offset solar integration challenges at high penetration
The solar sensitivities result in section 4.3.3 show that rapid solar expansion leads to declining capture prices, increasing low-price hours, and rising curtailment volumes, especially in Germany. Higher battery capacity could potentially mitigate these integration challenges by absorbing surplus solar generation during peak production hours. We therefore run additional sensitivities combining high solar and high battery capacity in Germany to assess whether batteries can effectively integrate larger volumes of solar generation.
Figure 19. Operating solar PV and battery capacity in Germany, GW
Figure 19 illustrates the capacity assumptions for the combined sensitivities. For the battery High sensitivity, we increased German battery capacity to 120 GW. The 120 GW comprises 73.9 GW of 2-hour duration batteries (as in THEMA Base) plus 46.1 GW of 4-hour duration batteries to further increase system flexibility.
We run two combined sensitivities for Germany:
Combined Solar Medium: Germany reaches 215 GW of solar capacity (the government's 2030 target) combined with 120 GW of battery capacity.
Combined Solar High: Germany reaches 300 GW of solar capacity (the government's 2035 target) combined with 120 GW of battery capacity.
Figure 20. Solar capture prices for the combined solar and battery sensitivities
Figure 20 shows solar capture prices across bidding zone for the sensitivities that combine higher solar and battery capacities. Nordic solar capture prices show a muted response to German battery deployment. Comparing DEU High and Combined Solar High reveals only modest improvements in Nordic capture prices, indicating that German battery expansion provides limited additional benefit for Nordic solar generators beyond what interconnection constraints and domestic flexibility already offer. Figure 34 in the appendix highlights that the number of zero- and negative price hours in the Nordics also hardly change when combining the solar and battery sensitivities.
German solar market conditions improve more visibly when high battery capacity is added. Capture prices shift from negative values under high solar penetration to positive levels, and solar curtailment falls by roughly half. However, capture prices remain well below THEMA Base and substantial solar curtailment volumes persist, indicating that batteries can partially mitigate solar cannibalisation effects but cannot fully resolve the integration challenges of very high solar penetration.
These results should be interpreted in light of the assumed battery-to-solar capacity ratio. In Combined Solar High, battery capacity (120 GW) remains well below solar capacity (300 GW). If battery capacity were increased further, curtailment would likely decrease and capture prices improve. However, such high battery deployment relative to peak load would substantially erode the price spreads that batteries rely on for revenues, undermining the business case for battery investment.
4.4 Policies affecting interconnector availability and cross-border trade
In this section, we investigate the impact of changes to interconnector capacity and trade-restrictive policies on Nordic electricity markets. Further market integration of the Nordic countries is under consideration through new or upgraded interconnections, including EstLink3, new links via Bornholm, and upgrades around Kriegers Flak. However, the timing and realisation of these projects remain uncertain. Furthermore, internal grid constraints in continental Europe can limit the effective availability of existing interconnectors, reducing trade opportunities even without changes to nominal capacity.
Trade arrangements between Great Britain and the EU—and consequently with the Nordic region—also remain unclear. The UK and EU are negotiating a potential link between their emissions trading systems; should these negotiations fail, electricity imports from Great Britain could face CBAM charges. Broader protectionist pressures, while currently not permitted under EU internal market rules, cannot be entirely ruled out in the longer term.
Our sensitivities test what happens to Nordic prices under different outcomes: if planned interconnector projects are delayed, if internal grid bottlenecks reduce effective interconnector availability, if CBAM is applied to EU-GB electricity trade, or if general trade fees are introduced on Nordic-European interconnectors.
4.4.1 We run sensitivities for individual interconnectors, trade restrictions and availability of interconnectors
We test seven sensitivities related to interconnector capacities and cross-border trade:
Individual interconnector projects:
- EstLink3: The 700 MW interconnector expansion between Estonia and Finland does not come online as planned in 2035 due to construction delays.
- Bornholm: The 1,600 MW connection between Germany and Bornholm comes online earlier in 2035 rather than in 2037 as assumed in THEMA Base.
- Kriegers Flak: The interconnector capacity between Germany and Kriegers Flak is increased by 700 MW from 400 MW to 1,100 MW.
Trade restrictions:
- CBAM: This sensitivity studies the potential application of a Carbon Border Adjustment Mechanism to electricity trade between the EU and the UK. CBAM is set to apply from 1 January 2027, but the UK and EU governments have announced their commitment to link their emissions trading systems. If this agreement is reached, electricity flows from Great Britain to EU markets would not be subject to CBAM. However, should negotiations fail, exports from the UK to EU markets could face CBAM charges. We model CBAM as an import tax of 7 EUR/MWh on electricity flows from the UK to the EU, based on an assumed average emission intensity of 0.05 tCO2/MWh and a carbon price of 134 EUR/tCO2 in 2035.
- Trade fee: The general trade fee sensitivity captures a broader scenario of economic protectionism affecting electricity trade between European countries. A trade fee of 10 EUR/MWh applies to all flows via interconnectors between the Nordics and other European countries in both directions. Such a trade fee is not allowed under current EU internal market rules. However, we run the trade fee sensitivity as a proxy for more protectionist trade policies that might be implemented in the future.
General availability reduction:
70% availability: The maximum availability of all interconnectors between the Nordics and the rest of Europe is reduced to 70% of nominal capacity to estimate the effect of internal grid bottlenecks in continental Europe.
4.4.2 Individual interconnector projects have limited price impact
Figure 21 shows baseload prices across Nordic and continental bidding zones under the individual interconnector sensitivities. Adding or removing individual interconnector projects has limited price impact—the Kriegers Flak, EstLink3, and Bornholm sensitivities produce only marginal changes. This reflects the relatively small capacity of these projects in the context of the overall Nordic-European transmission system: EstLink3 adds only 700 MW, while Bornholm and Kriegers Flak connect via offshore hubs rather than providing direct market-to-market capacity.
Figure 21. Base prices for the interconnector sensitivities, EUR/MWh
4.4.3 CBAM and trade fees have limited price effects, but reduced interconnector availability lowers Nordic prices
Figure 22 shows baseload prices under the CBAM, trade fee, and 70% availability sensitivities. The CBAM sensitivity produces virtually no price change across Nordic zones, as the mechanism only affects exports from Great Britain to the EU. The general trade fee sensitivity shows a more differentiated pattern. Most Nordic zones experience small price reductions as the trade fee makes imports more expensive, keeping more Nordic generation within the region and marginally depressing domestic prices. The 70% availability scenario has the most pronounced effect, reducing Nordic baseload prices by around 5–20% as constrained export capacity keeps more generation within the Nordic system.
Figure 22. Base prices for the trade and interconnector availability sensitivities, EUR/MWh
Figure 23. Annual trade volumes with Great Britain for the trade sensitivities and the THEMA Base scenario, TWh
Exports refer to trade flows from the Nordic zone to GB. Imports refer to trade flows from GB to the Nordic zone.
Exports refer to trade flows from the Nordic zone to GB. Imports refer to trade flows from GB to the Nordic zone.
Figure 24. Annual trade volumes with Germany for the trade sensitivities and the THEMA Base scenario, TWh
Exports refer to trade flows from the Nordic zone to Germany. Imports refer to trade flows from Germany to the Nordic zone.
Exports refer to trade flows from the Nordic zone to Germany. Imports refer to trade flows from Germany to the Nordic zone.
4.4.4 Trade restrictions reduce cross-border flows and congestion rents
While price effects are modest, trade restrictions have more pronounced effects on cross-border electricity flows. Reduced trade volumes affect generator revenues, TSO congestion income, and overall market efficiency—impacts not fully captured by price changes alone.
Figure 23 and Figure 24 illustrate trade volumes between Nordic zones and Great Britain and Germany under the CBAM and trade fee sensitivities, while Table 8 provides a comprehensive breakdown of import and export flows for all remaining Nordic and continental price zones. The two sensitivities produce markedly different effects. CBAM primarily affects Nordic-British trade flows while leaving Nordic-German exchange largely unchanged—as expected, since CBAM applies exclusively to electricity imports from Great Britain to the EU. For British trade, CBAM reduces imports to both DK1 and NO2, with a notably stronger effect on Denmark where imports fall by approximately 40%. The stronger Danish impact reflects underlying price spread differences: Danish prices are typically closer to British prices, meaning the surcharge more frequently tips the balance against importing.
The general trade fee produces substantially larger trade volume reductions across all interconnectors. For German trade, the effects are particularly pronounced—DK1 experiences reductions of over 40% in both export and import volumes. Other Nordic zones with German connections show smaller but still significant declines.
The general trade fee produces substantially larger trade volume reductions across all interconnectors. For German trade, the effects are particularly pronounced—DK1 experiences reductions of over 40% in both export and import volumes. Other Nordic zones with German connections show smaller but still significant declines.
Figure 25. Annual trade volumes with the Great Britain for the 70% availability sensitivity and THEMA Base
Exports refer to trade flows from the Nordic zone to Great Britain. Imports refer to trade flows from Great Britain to the Nordic zone.
Exports refer to trade flows from the Nordic zone to Great Britain. Imports refer to trade flows from Great Britain to the Nordic zone.
These trade volume changes translate directly into reduced congestion rents. CBAM modestly reduces congestion rents on British links while leaving German links almost unaffected. The general trade fee has a more substantial impact, with congestion revenues declining by at least 20% on key Nordic lines to both Great Britain and Germany. The divergence between the two sensitivities reflects their different scope: CBAM applies only to British exports to the EU with a lower surcharge, while the general trade fee applies symmetrically to all Nordic-European interconnectors with a higher surcharge.
4.4.5 Reduced interconnector availability benefits Nordic consumers but generates net regional welfare losses
The 70% availability scenario has the most far-reaching consequences, affecting not only prices but also trade patterns and overall welfare. Figure 25 and Figure 26 present annual trade volumes between selected Nordic zones and Germany and Great Britain, respectively, comparing THEMA Base with the 70% availability sensitivity. Table 8 in the appendix provides a full breakdown of import and export volumes across additional Nordic and continental price zones. Under 70% availability, total trade volumes between the Nordics and continental Europe decline as export capacity becomes constrained. DK1 captures a larger share of the remaining cross-border exchange with Germany due to its stronger direct connections, while other Nordic zones see declining volumes. Trade with Great Britain follows a simpler pattern—both DK1 and NO2 experience declining volumes in both directions, with no compensating increase on alternative routes.
Figure 26. Annual trade volumes with Germany for the 70% availability sensitivity and the THEMA Base scenario, TWh
Exports refer to trade flows from the Nordic zone to Germany. Imports refer to trade flows from Germany to the Nordic zone.
Exports refer to trade flows from the Nordic zone to Germany. Imports refer to trade flows from Germany to the Nordic zone.
The finding that reduced interconnector availability lowers Nordic prices while reducing trade raises an important question regarding overall distributional impacts. Lower prices benefit consumers but harm generators who lose access to higher-priced export markets. To assess these distributional consequences, we conduct a welfare analysis that accounts for consumer surplus, producer surplus, and congestion rents across all Nordic price zones.
Figure 27 shows the welfare impact by bidding zone and country under the 70% availability scenario compared to THEMA Base. Consumer surplus increases substantially across all Nordic zones, with the largest gains in zones with high consumption such as NO1 and SE3. These consumer benefits come directly at the expense of generators—producer surplus declines by a slightly larger amount than consumer gains, reflecting the Nordic region's position as a net exporter. Congestion rent changes are modest by comparison, with Denmark capturing the largest share of increased rents as reduced availability on links to Germany widens price differentials on remaining capacity.
Figure 27. Difference in surplus between the 70% availability sensitivity and THEMA Base by category, Million EUR
Aggregating all components reveals significant regional variation. Denmark is the only country with a positive overall outcome, as congestion rent gains on its transit links more than compensate for modest producer losses. Sweden bears the largest loss, followed by Norway—where losses concentrate in NO2 with its high hydropower export capacity. Finland's impact is nearly neutral as consumer and producer effects largely offset. Overall Nordic welfare across all zones declines.
Figure 28 extends the analysis to all of Europe. Non-Nordic countries experience a small net welfare gain under the 70% availability scenario—Continental consumers face slightly higher prices, but this is offset by producer gains and increased congestion rents as scarcity on Nordic links raises the value of remaining capacity. However, these Continental gains are insufficient to offset Nordic losses. Total European welfare declines, confirming that reduced interconnector availability generates deadweight losses that harm the European market as a whole. In summary, while reduced interconnector capacity lowers Nordic prices, this comes at the expense of a significant welfare loss that is distributed unevenly across regions and between producers and TSOs.
Figure 28. Difference in total European surplus between the 70% availability sensitivity and THEMA Base, Million EUR
4.5 Potential German bidding zone split
4.5.1 Internal bottlenecks are driver for the discussion on bidding zones
Germany has internal transmission bottlenecks between the North of Germany, where many wind resources are located and where demand is generally lower, and the South, where there is less wind, but higher demand. This imbalance has caused a number of issues, including loop flows, trade restrictions, and high redispatch costs. To mitigate these effects, the introduction of bidding zones is often mentioned as an appropriate measure. But there are also reservations around the introduction of bidding zones (e.g. transaction costs, market liquidity).
4.5.2 A German bidding zone split faces strong political opposition and is highly unlikely
The discussion about the pros and cons of a bidding split has flared up again and again for more than a decade. The EU and its institutions are key proponents of a split. However, the German government and German TSOs are adamantly against splitting the national bidding zone. Germany has never come close to splitting up its bidding zone, and since the ultimate decision lies with the national government, a split remains unlikely.
The EU, and many power market economists, argue that a split would greatly enhance the efficiency of the underlying power market. Germany faces a structural bottleneck between its north and its south. There is currently not enough transmission capacity to bring all of Germany’s northern wind power to its southern demand centres. The argument goes that splitting up the German bidding zone would make this bottleneck visible by inducing different prices in the north and south. Split power prices could reflect local production and demand and thereby help incentivise the more efficient placement and scheduling of demand and supply. A split would also reduce loop flows through neighbouring countries, lower redispatch costs, and improve price signals for dispatch decisions.
However, past and present German governments have been vehemently against a zonal split. They argue that it would be politically impossible to convince German industry to accept different power prices in the north and south. They also argue that a split risks compromising the liquidity of the German financial power market, undermining a trading hub used by a variety of European traders to manage power price risk.
In April 2025, the latest bidding zone review report was published, coordinated by ENTSO-E with the methodology and the alternative configurations decided by ACER. The Review found that splitting Germany into multiple bidding zones would increase social economic welfare. ACER, in a subsequent statement, argued that the study actually underestimates the welfare benefits of a split due to unrealistic assumptions in the underlying methodology. The German government and the four German TSOs, however, rejected the findings on different grounds—arguing that the study relied on outdated data, underestimated the costs of implementation, and failed to demonstrate sufficient efficiency gains to justify a split. Despite the study's positive welfare findings, strong political opposition means a split remains unlikely.
4.5.3 A German zonal split would reduce average Nordic power prices, but the effect depends on future grid developments within Germany
Given that a bidding zone split in Germany is highly unlikely until 2035, modelling it is technically complex, and the concrete definition of any future bidding zones remains highly uncertain, we have not conducted dedicated new simulations for this study. However, since such a split—however unlikely—could have significant implications for Nordic electricity markets, THEMA has modelled the impact of a German bidding zone split in detail in previous studies. The main findings from these earlier studies are:
- The price effect is subject to how the bidding zones are defined: Different layouts can have a different price effect
- The magnitude of price effect depends on the progress of internal grid developments. Germany is currently upgrading its internal infrastructure to address internal bottlenecks, with major HVDC transmission projects—SüdLink and SüdOstLink—scheduled for completion between 2027 and 2030. Should these investments come in time, the price effect of bidding zones may be small (hence questioning the purpose of bidding zones in this scenario); should the investments be delayed, the price effect could be significant (e.g. around 20% lower prices in Northern Germany compared to a Base line scenario)
- The price decline would be in particular driven by more frequent hours with zero or negative prices in hours where there is a lot of wind. This would also have an impact on capture prices for renewables, in particular wind.
- Some of the price effect may transmit into the Nordics. The pass-through, i.e. how much of the price decline in North Germany would transmit into Nordic bidding zones, could be between 40-70%, depending on scenario and other assumptions. That is, if prices in Northern Germany decline on average by say 10 EUR/MWh, the price decline in Nordic bidding zones can be between 4-7 EUR/MWh.
But all depends on the precise developments of internal grid upgrades, and how one would eventually define the bidding zones. And, last but not least, on what one assumes on how renewable capacities, demand and other factors impacting the power system in Germany will develop in the coming years.