Nordic Economic Policy Review 2026
Childhood and Adolescent Interventions in a Danish Setting: A Meta-Analysis of Evidence from TrygFonden’s Centre for Child Research
Stine Nyhus Larsen, Nikolaj Noer Poulsen, Michael Rosholm and Katrine Bønneland Tølbøll
Abstract
This review and meta-analysis synthesises experimental and quasi-experimental intervention evaluations conducted at TrygFonden’s Centre for Child Research (TFCCR) (updating and extending Rosholm et al., 2021). The objectives of the paper were to estimate pooled effects on children’s learning and to explain between-study variation using cost-standardised effect sizes and coded information on intervention content, delivery and context, collected by means of a principal investigator survey. The eligible studies were RCTs or quasi-experiments that estimated causal effects on cognitive or educational outcomes, provided sufficient data to compute standardised and cost-standardised mean differences, and were conducted in Denmark by researchers affiliated with the Centre between 2013 and 2024. The articles were retrieved from TFCCR’s website. We applied a four-level random-effects model, assessed heterogeneity and small-study bias, and conducted meta-regressions aimed at identifying mediators and moderators. The meta-analysis encompassed 32 studies (49 treatment arms; 63 effect sizes), yielding a pooled learning effect size of 0.10 SD (95% CI 0.07–0.14), which indicates positive but modest learning impacts, and a pooled cost-standardised effect of 0.04 per $100 (95% CI 0.02–0.06). Effects tended to be larger for preschool-age targets, daycare settings, educator-focused delivery, and interventions that emphasise process quality. On average, the results did not differ between RCTs and quasi-experiments. The limitations of the study include short-run outcomes, potential cost measurement errors, clustering and spillovers, and generalisability, primarily to a Scandinavian welfare context. Consequently, the findings indicate that education interventions in a Danish setting produce small gains on average, with meaningful design- and context-driven variation in terms of both effects and cost-effectiveness.
Note: This meta-analysis was not preregistered. The authors acknowledge funding from a grant from TrygFonden. TrygFonden was not involved in the production of this manuscript. The authors declare no competing interests. The data used in this study are available upon request from the authors.
1 Introduction
In recent years, there has been a growing interest in the effectiveness of interventions designed to improve educational outcomes. This research has mainly been motivated by the importance of education for income and wealth inequality, GDP, and growth (Barro, 2013; Hanushek & Woessmann, 2010), as well as by increasing inequality in income and wealth in many countries (Chancel & Piketty, 2021; OECD, 2024). In such situations, it has been suggested that improving the educational opportunities of disadvantaged children and youth will help to reduce inequality. For more than a decade, this line of research has been the focus of TrygFonden’s Centre for Child Research at Aarhus University, Denmark.
TFCCR is an interdisciplinary research centre comprising Danish researchers primarily from political science, economics, psychology, and child language. The centre focuses on studying the effectiveness of interventions aimed at improving the learning and wellbeing of children and adolescents. It has accumulated a large body of evidence and knowledge, including how to support language development, both in general (Hoff et al., 2024; Højen et al., 2023) and for bilingual children (Andersen et al., 2021; Højen et al., 2021), the effect of teacher’s aides in classrooms in a Danish context (Andersen et al., 2020, 2024), the effect of special camps for disadvantaged boys (Hvidman et al., 2020; Nielsen, 2023), the effects of interventions specifically targeting maths skills (Jensen & Sj¨o, 2024; Rosholm et al., 2025; Svane et al., 2023), evaluations of language tests (Bleses et al., 2022), and several other related topics.
Most of these evaluations have been conducted using randomised controlled trials (RCTs), which are considered the gold standard in causal inference (Imbens & Rubin, 2015a, 2015b; Schulz et al., 2010). In RCTs, identification depends on a relatively weak assumption of random assignment to treatment.
However, RCTs are not always feasible or timely, and the availability of rich administrative register data in Denmark makes quasi-experimental methods a valuable complement for estimating the effects of educational interventions.
Compared to RCTs, quasi-experimental methods are based on stronger and more fundamentally untestable assumptions, which are not solely reliant on statistical laws.
Quasi-experimental designs refer to designs that leverage naturally occurring variation to approximate random assignment, including difference-in-differences (DiD), regression discontinuity (RD), and instrumental variables (IV).
This study aims to summarise in a meta-analysis the accumulated body of research from both experimental and quasi-experimental studies conducted by TFCCR. One specific aim is to test the extent to which the use of experimental versus non-experimental methods influences average estimated effects. In addition, we investigate other potentially important moderators and mediators.
In the present paper, we update and extend previous work by Rosholm et al. (2021), who conducted a preliminary analysis on a set of interventions conducted by TrygFonden’s Centre for Child Research, using cost-standardised effect sizes to document evidence for the Heckman curve (i.e., earlier investments yield larger returns) in a Danish context. We update the study pool by including additional RCTs and all available non-RCT causal impact studies. We also assemble cost data (where available) and systematise information on what the interventions consisted of, how they were delivered, and in which contexts they operated. As such, this current study contributes to existing literature on intervention efficiency in several dimensions:
- The majority of previous childhood intervention studies have been conducted in the US. We present the in-depth results of interventions from a Scandinavian welfare state, which invests considerably larger resources in interventions aimed at children and youth (Rosholm et al., 2021).
- All studies were conducted by researchers at the same research institution, and focused on children in the same country (Denmark), which provided methodological, cultural, and contextual homogeneity and consequently a high degree of comparability between studies.
- Our study includes considerably more RCTs than the previous work by Rosholm et al. (2021), as well as all non-RCT causal impact studies conducted at the same research centre.
- We take the cost side into account by only including studies for which we have access to information on intervention costs per participating child, which enables comparison between cost-standardised effect sizes.
- We survey the principal investigators of the included studies to synthesise information on the content of the interventions, the characteristics of the deliveries, and the contexts, which allows for a detailed analysis of whether and how these potential features affect the cost-standardised effect sizes.
Note that while all of the studies adopt a methodological approach that identifies causal relationships, cross-study comparisons do not necessarily identify causal effects. Quasi-experimental studies are typically less generalisable than RCTs, and investigate effects among more narrowly defined populations. The differences in identification strategy mean that it is not feasible to directly compare causal implications between quasi-experimental studies and RCTs. Consequently, our study only asserts associations that may indicate interesting relationships between study characteristics and effect sizes.
The rest of the paper is structured as follows: Section 2 introduces existing literature on intervention studies. Section 3 presents the methods applied in the meta-analysis, including specifications of the four-level random effects model, and how heterogeneity and robustness of standard errors are assessed. It also presents specifications of the applied meta-regressions and assesses publication bias and influential papers. Section 4 presents the main results of the meta-analysis and meta-regressions. Section 5 discusses the results in the light of work in the field in general, and interprets the reported effect sizes. Section 6 addresses some of the limitations of the present study and how methodological choices affect the interpretability of the results. Section 7 presents conclusions.
2 Existing literature
Rosholm et al. (2021) surveyed in some detail the existing knowledge of the impact of early childhood education (ECE) programmes on children’s learning, school interventions, and parent and family programmes. Here, we briefly summarise and extend their review.
In the United States, the impacts of ECE programmes have been widely researched via evaluations of programmes such as Head Start, pre-kindergarten, and other centre-based programmes, which have demonstrated significant short- and long-term effects (Elango et al., 2016). This research can be divided into two main lines: The first examines how access to broadly focused ECE programmes affects children’s learning opportunities; while the second examines how the quality of children’s preschool experiences can be enriched by evaluating the effects of specific instructional practices carried out in ECE settings (Byrne & Fielding-Barnsley, 1991; Clements & Sarama, 2007; Justice et al., 2010). In both lines of research, studies have consistently found that positive outcomes are associated with the provision of higher quality interactions between teachers and children, appropriately targeted curricula, enriched learning environments and teachers’ professional development (Burchinal et al., 2010; Duncan & Magnuson, 2013; Fryer, 2017; Gardner et al., 2019).
Extensive research has been conducted on the factors that influence student achievement. Recent syntheses draw on more than 2,100 meta-analyses and over 130,000 individual studies (Hattie, 2023). However, there are relatively few studies with strong causal identification strategies, particularly in the context of school-based interventions with academic achievement as an outcome. The research within this area can be divided into two broad lines: The first focuses on structural factors, such as class size and school size; while the second studies what happens within the classroom in terms of teachers’ instruction (Hanushek et al., 2003; Kane & Staiger, 2012). In general, studies tend to find positive effects associated with structural factors such as smaller class size (Fredriksson et al., 2013; Jepsen & Rivkin, 2009) and smaller school size (Humlum & Smith, 2015). Within the research on early reading instruction, there is also considerable evidence of the positive effects of systematic and explicit phonics instruction, compared to programmes that utilise primarily whole-word or whole-language approaches (Ehri et al., 2001; P. et al., 2000).
Research on parent and family programmes has not grown to the same extent as research on ECE programmes or school factors. There have been only limited strong causal evaluations of parent and family programmes, and there is a need for more research in this area (White et al., 2015). Despite the limited research, studies show that parent and family programmes can have positive effects on children’s academic achievement, socioemotional development and long-term outcomes (Gardner et al., 2019; Lundahl et al., 2008; Reynolds et al., 2007). One example of a successful parent and family programme is the Abecedarian Project, which provided high-quality early care and education, parenting support, and health care to low-income children and their families, and has been shown to have long-lasting positive effects on children’s development (Campbell et al., 2002).
In summary, the research on ECE programmes, school interventions and parent and family programmes has revealed wide-ranging evidence of overall positive impacts. However, the literature is not very precise with regard to the types of interventions that are most effective, and more research is needed to determine the most effective interventions for different groups of children (Levitt, 2009; Phillips et al., 2017).
3 Methods
3.1 Data
To identify relevant studies, we reviewed the complete list of published literature associated with TFCCR from its opening in 2013 until May 2024.
We limited ourselves to studies from this research centre, as it ensures consistency with respect to the type of data collected. Most importantly, it enables us to consistently construct cost-standardised effect measures for all studies, and to survey the principal investigators with regard to active ingredients, etc., which would otherwise be practically infeasible. It also means that all of the effect sizes originate in the Danish welfare state context. The effect size calculations utilise high-quality individual-level register data from the same databases, and the effect sizes are based on a consistent approach to intervention development. This creates homogeneity in some dimensions, which ultimately makes it easier to search for possible moderators in the relatively small sample. The main drawbacks of this inclusion criterion are that it means omitting insights from a much larger sample of potentially relevant studies, e.g., across the Nordic countries, and it carries a risk of self-bias. To mitigate the latter, we conduct a risk-of-bias analysis.
3.1.1 Inclusion Criteria
The above considerations give rise to the following formal inclusion criteria:
- The included studies were carried out in Denmark by a researcher affiliated with TFCCR.
- The included studies have concluded, and short-term causal impacts on cognitive/educational outcomes are available and published in either a scientific journal or a publicly available report.
- The included studies either report or allow for the calculation of standardised effect sizes and intervention costs by treatment arms (i.e., the additional costs of the intervention, net of evaluation costs, compared to the treatment as usual administered to the control group).
The inclusion criteria follow those specified in Rosholm et al. (2021), except that we also include studies evaluated using non-RCT methods. We include more studies than Rosholm et al. (2021) for two reasons: a) considerably more studies have since been completed, which means that more RCT results are available; b) we include studies using non-RCT methods for causal analysis. In total, we include 32 studies, comprising 49 treatment arms and 63 reported effect sizes. These are summarised in section A in the supplementary material and in more detail in online SI.
The authors mutually agreed on both the inclusion of studies and the collection of data points. We focused on identifying causal (unbiased) studies to minimise self-bias, as the research could otherwise be considered somewhat self-congratulatory. To further mitigate this, we include a risk-of-bias analysis, which was conducted using the risk-of-bias tools for randomised trials (RoB2) and non-randomised studies of interventions (ROBINS-I) developed by Cochrane methods (Sterne et al., 2019). One author assessed risk of bias for all studies, and each treatment arm and outcome measure was assessed individually.
3.1.2 Outcomes
For all studies, the effect size is calculated based on the effect of a standardised test score or an indicator of some educational/cognitive outcome. These outcome categories include the results of vocabulary, language and math tests, and indicators for obtaining a certain level of education. For more details, see online SI.
For school-based interventions, learning outcomes are constructed using primarily register-based data for compulsory national test scores, which ensures a high degree of comparability across different interventions.
At present, there are no register-based outcome measures of cognitive skills for children in preschool-based interventions in Denmark. As such, the daycare teachers administered the language assessments, either through a published standardised assessment test, by employing a standard language test conducted by the municipality at the end of preschool, or by completing a standardised checklist. The study by Haghish et al. (2021) shows acceptable congruence between educators. Consequently, we do not believe that this has introduced any biases in the judgement of the children’s skill level.
For interventions targeting young adults, the outcomes are typically indicators of obtaining a certain level of education (as the targeted groups were individuals without qualifying education).
When a single primary effect is reported on an outcome category, we use that as our indicator. Otherwise, if multiple effects are reported on subcategories within that outcome, we calculate the average effect size within that category. We use the formula for the variance of a sum of random variables to aggregate the corresponding standard errors. If an estimate of the correlation between the random variables is available, we use it. Otherwise, we impute a conservative value of 1, which inflates the variance and assigns the lowest weights to that average effect. Generally, when individual standard errors are available, we use them directly. If there are no errors, we calculate them based on the test statistic or, in rare cases, request them from the principal investigator. The effect sizes are standardised by dividing the estimated effect by the standard deviation in the control group (Glass’ ∆).
If only the pooled standard deviation is available, we instead calculate Cohen’s d. We prefer Glass’ ∆ because the treatment effect might not only affect the mean, but also the variance of the treatment group.
For comparison between interventions, it is relevant to consider not only standardised effect sizes, but also the associated costs. This entails gathering information on the cost of the intervention, the number of participants in the treatment and control group and the timing of intervention, which allows us to construct a cost-standardised effect size measure. We calculate the costs by measuring the extra costs of the intervention (net of research and evaluation costs, which include costs of data collection) over and above the costs of the usual treatment. We adjust the costs in DKK to 2021 levels, according to the Net Price Index,
and convert the values to USD using the purchasing power parity (PPP) rate of 6.59 DKK per 1 USD. We assume a linear relation between costs and the number of participants. This means that we calculate the average cost of an intervention (or treatment arm) per participant, and divide the effect size and standard error by this cost to get an effect size per $100. Studies for which it is not possible to retrieve a meaningful cost measure are excluded from the cost-standardised effect analysis. The reported learning outcomes and costs for all studies are reported in Table A. For more details, see online SI.
3.1.3 Moderators and mediators
Meta-analysis has emerged as an important tool to synthesise findings from multiple studies, and summarise multiple findings. However, the overall effect size obtained from a meta-analysis can only provide limited insights into the underlying mechanisms that drive the results. A meta-regression analysis can help to identify the mediators (active ingredients) or moderators that explain the variability in effect sizes across studies.
To conduct the mediator-moderator analysis, for each study, we collect information on the average age of the treatment group, whether the effect was evaluated using an RCT (1/0), whether the intervention took place in preschool (1/0), and the type of learning outcome (vocabulary, language, maths, or other).
In addition to these potential moderators, we are also interested in the interventions’ mediators or active ingredients. Hence, we surveyed principal investigators on the content of the interventions, as well as other complementary aspects. Specifically, we include information on:
- Who designed the intervention (categories: Researchers, Practitioners, Administrators/Policy makers/Others, NA)
- Whether the intervention was aimed directly at a cognitive outcome or mediator, e.g., socio-emotional skills (categories: Directly at cognitive, Mediator, NA). We do not include a “both” category, and these cases are therefore modelled as 1 in both the cognitive and mediator columns.
- Whether the primary focus of the intervention was on quantity, e.g., more lectures, or quality, e.g., lecture contents (categories: Quality, Quantity, NA). “Both” and ”neither” are modelled as 1 in both columns and 0 in both columns, respectively.
- Active ingredients (categories: Structural quality, Process quality, Learning format, Therapeutical elements, NA)
- Whether the intervention was manualised (categories: Fully, To a medium extent, Not at all, NA)
- Whether the intervention was targeted at a disadvantaged group (categories: Low cognitive skills or learning difficulties, Immigrant homes, Low SES homes, No, Other, NA),
- The group targeted in the intervention (categories: Children, Parents, Educators, Other)
- The location of the intervention (categories: Home, Camp, Daycare, School or educational institution, NA)
- Whether and what type of support was provided during the intervention (categories: Course, Ongoing support, Written information, NA).
For details about individual studies, see online SI.
3.2 Model specification
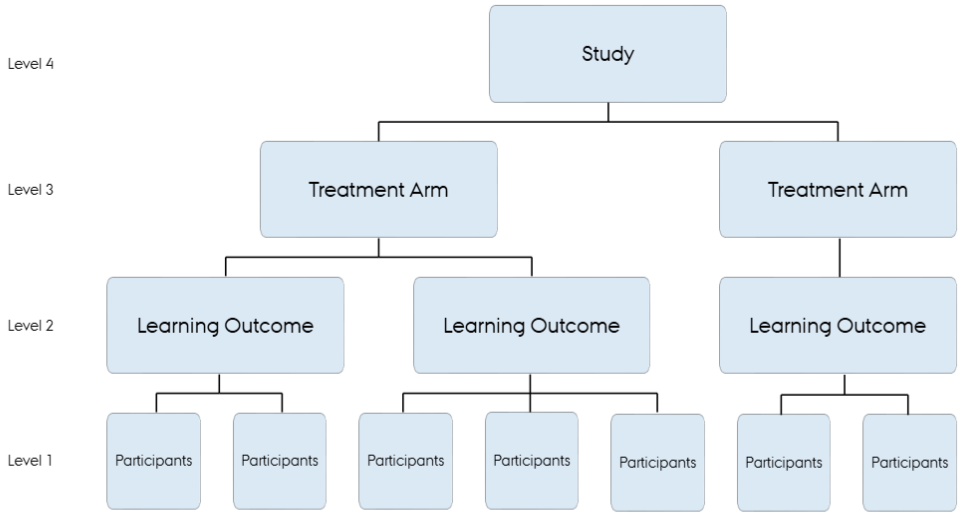
Our model specification considers the following two dynamics. First, the heterogeneity observed in our sample of studies may arise from the following three factors: i) the effect sizes reflect either vocabulary, language, or maths skill development; ii) the treatment is targeted to different subgroups of children aged 0–18; and iii) the content and implementation of the treatment vary significantly across studies within the same target age. Second, we account for the interdependencies in our sample, as the same control group is used multiple times in comparisons across different treatment arms within the same studies, and the same treatment and control groups are often used to assess different learning outcomes. Consequently, we assume that the data-generation process has the following nested structure (see Figure 1): Dependency between different studies, as they are conducted at the same centre (level 4); dependency between the different treatment arms within each study (level 3); dependency between the different learning outcomes within treatment arms (level 2); and finally, dependency within the different learning outcomes, i.e., effect sizes, caused by participants (level 1).
Based on the nested structure, we employ a four-level random-effect model (for a mathematical specification, see section B.1). The model estimates the true effect size of a given outcome in a given treatment arm within a given study based on the true population effect size, plus a random component for each of the levels described above.
We test for heterogeneity of the effect size using Cochran’s Q (Cochran, 1954) and quantify it using I2, which is independent of sample size and therefore easier to interpret. We follow the widely accepted guidelines, such that an I2 value of 0 indicates no heterogeneity, while values of 25, 50 and 75 correspond to low, moderate and high heterogeneity, respectively (Higgins & Thompson, 2002). Formal specifications of heterogeneity and variance estimates are found in section B.2.
Figure 1. Visualisation of the hierarchy of the four included levels.
Despite the hierarchical structure of the model, some effect sizes within each cluster are based on the same control group. For that reason, we impose a cluster-robust inference method (also known as robust variance estimation). This method constructs a cluster-robust sandwich estimate of the variance-covariance matrix of the model coefficients. This procedure follows the recommended general workflow for meta-analysis involving complex dependency structures (Viechtbauer, 2010).
We assume a correlation between language/reading and maths of 0.48, based on the average relationship magnitude found in Danish National Tests. Rho is used to model the correlation between sampling errors of two different outcome measures. This means that if two different learning outcomes are used to evaluate the same treatment arm, we assume a correlation between them of 0.48.
3.2.1 Meta-regressions
To test the association between outcomes and various potential moderators and mediators, we implement a mixed-effect meta-regression model. The model adds a vector of covariates containing the included mediators and moderators to the specification of the meta-analysis, but is otherwise the same. The mathematical notation is found in section B.3. The meta-regression model contains many variables. First, we remove those that are exact linear combinations (e.g., therapeutic elements as an active ingredient, which has a value of zero, as it is not used in any of the included studies). We then use a forward selection approach, based on Akaike’s Information Criterion (AIC), to select variables for inclusion in the final models.
We estimate the parameters in the various models using R (version 4.2.3) (R Core Team, 2023), the metafor package (version 3.8.1) (Viechtbauer, 2010) and the meta package (Balduzzi et al., 2019).
4 Results
4.1 Meta-analysis
We now present the results of the two meta-analyses. First, we present the results of the estimates of the raw effect sizes; and second, the results of the estimates of the cost-standardised effect sizes.
4.1.1 Effect sizes
In this subsection, we present comparable results from all studies and treatment arms. Table 1 below presents the results of the meta-analysis based on the raw standardised effect sizes. We report coefficients and cluster-robust standard errors from the sandwich estimation.
Table 1. Multivariate Meta-Analysis Results

The estimate of the true population effect size, µ, based on the four-level meta-analysis, is 0.104 (95% CI: 0.065 - 0.144) and is statistically significant (P<0.001). The three variance components (σ2’s) show that of the total variation net of sampling error variance, 20% can be attributed to between-study heterogeneity, and 27% attributed to between-treatment-arms- within-study heterogeneity, while the remaining 53% can be attributed to within-treatment-arm heterogeneity. The I2 statistic estimating heterogeneity was overall 95.0%, which suggests high heterogeneity. Calculating I2 by hierarchical level revealed that 18.9% of heterogeneity was explained by variation at level 2 (within treatment arms), 26.6% at level 3 (between arms within studies) and 49.6% at level 4 (between studies).
Figure 2 depicts a forest plot of all included effect sizes for the different treatment arms and studies. The analysis includes a total of i = 63 effect sizes within 49 treatment arms across 32 studies. The observed effect sizes ranged from -0.25 to 0.68, with 79% of the estimates being positive, 52% of those being significant. The most effective intervention is Play and Learn (taking place in nurseries) with an effect size of 0.68, followed by one of the TMTM treatment arms (individual maths training in grade 2 in public schools), with an effect size of 0.63. For details of the studies, see section 5 and online SI.
Figure 2. Forest plots of a random effects meta-analysis for different measures of effect size for the 32 studies, their 49 treatment arms and their 63 reported effect sizes. Whiskers on effect sizes represent confidence intervals, while the grey box represents weight as given by variance (more precise studies are given higher weight).

4.1.2 Effect sizes per $100
In Figure 3, we plot effect sizes against the average cost of the intervention per participant, split by type of intervention (RCT or observational) and by statistical significance. The figure shows that, in general, there is no strong association between effect size and costs. It also shows considerable variation in costs per participant. For example, the Mentoring intervention (aimed at youth on social assistance) cost $3,884 per participant, while the SPELL intervention (in kindergartens) cost $92 per participant.
If we zoom in on the studies conducted using randomised trials (marked by round dots), it becomes apparent that these tend to have lower costs than those evaluated using other methods. However, whether we look at randomised trials or other methods, there is no obvious strong relation between the costs of the intervention and its effectiveness. This is somewhat surprising – based on cost-effectiveness considerations, we would have hoped for a positive relationship, such that more expensive interventions were also more effective. This motivates a follow-up calculation of the meta-analysis, utilising cost-standardised effect sizes. The aims are to determine how this changes the ranking of interventions in the forest plot and to enable an investigation of whether other characteristics may lead to differences in cost-standardised effect sizes. In our calculation, the cost-standardised effect size is defined as the effect size per $100 per participant. The resulting estimates do not represent “real” effect sizes in the conventional sense, and the pooled effect size should therefore be interpreted with caution. However, as already stated, this approach makes it possible to measure the relative efficiency of the different interventions.
Not all of the studies involved a treatment associated with a measurable cost estimate (i.e. Class size). These studies were therefore excluded from the cost-effectiveness analysis. The analysis included a total of k = 61 effect sizes within 48 treatment arms across 31 studies. Table 2 shows the result of the meta-analysis of cost-standardised effect sizes. Again, we report cluster-robust coefficients and errors from a sandwich estimation. The pooled effect size, based on the four-level multivariate meta-analytic model and assuming correlation between learning outcomes, was ES = 0.037 (95% CI: 0.018 - 0.057).
The I2 statistic was 99.9% overall, which again suggests a high level of heterogeneity. The level-wise calculation showed that 73.6%, 0% and 26.3% were explained by variation within treatment arms, between arms within studies and between studies, respectively.
Figure 4 presents a forest plot of the results across all studies, treatment arms and learning outcomes. The observed effect sizes ranged from -0.04 to 1.24, 80% of the estimates were positive, and 53% of those were significant. The most cost-effective treatments are information treatments (Performance info and Feedback). These take place in public-sector schools and do not have very large raw effect sizes, but have very low costs. The third most effective intervention is LEAP-OPEN (which takes place in kindergarten), which has a standardised effect size of 0.43 per $100 invested. For more details on the most effective studies, see section 5 and online SI.
Figure 3. Relationship between average cost per participant (2021 prices) and effect size
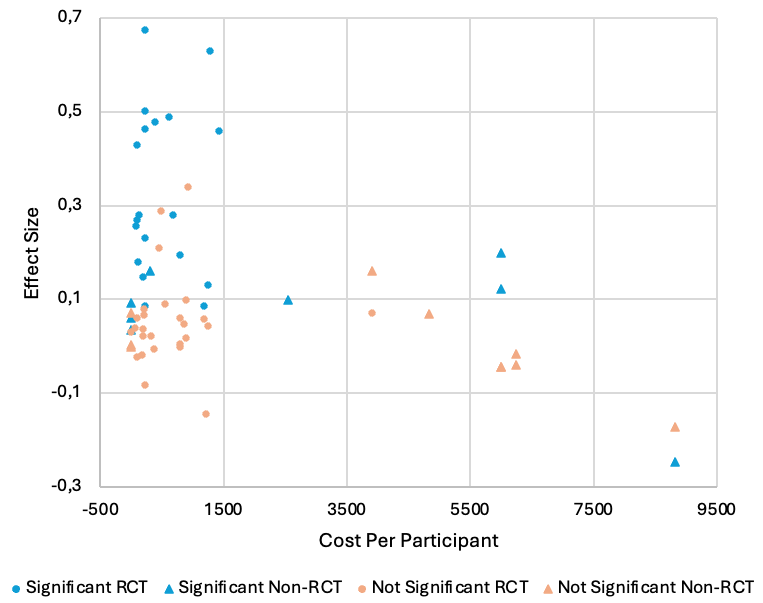
Table 2. Multivariate meta-analysis results: Cost-standardised effect size

Figure 4. Forest plots of a random effects meta-analysis for different measures of cost-standardised effect sizes for the 32 studies, their 49 treatment arms and their 63 reported effect sizes. Whiskers on effect sizes represent confidence intervals, while the grey box represents weight, as given by variance (more precise studies are given higher weight)

4.2 Meta-regressions
We conduct meta-regressions to investigate potentially important mediators and moderators in our model. We apply forward selection to statistically identify the mediators and moderators that best explain the variation in effect sizes. We code factor variables for various intervention and study-design choices presented as binary in section 3, and incorporate a continuous age measure. To avoid convergence problems and increase precision, we identify variables that are linear combinations in the mediator/moderator matrix. Variables identified as linear combinations of other variables are excluded prior to the forward selection procedure. We then choose the best model based on the AIC. Using BIC gives similar results, and the best-performing models are generally close in terms of information criteria. Table 3 presents an overview of the dummy variables included, their distribution of 0’s and 1’s, along with the variables selected in the procedure described below.
Table 4 presents the best model for the raw effect sizes, as determined by the forward selection procedure.
Table 3. Variables included in forward selection. Age is the only non-binary variable.
The mean age is 9.8 years. The column % 1 shows the percentage of interventions that include the mediator/moderator in question. The last two columns mark variables selected by forward selection (FS) for raw effect sizes and cost-standardised effect sizes, respectively.

Table 4. Multivariate meta-regression results: Raw effect

Interventions aimed at educators (teachers in preschool, school and daycare centres) are significantly more effective than those targeted directly at children or their parents (or others). Fully manualised interventions are less effective than those that are not manualised or only partially manualised. Language as a learning outcome (as opposed to maths) is associated with significantly lower effect sizes, while “other” outcomes (often vocabulary) have larger effects. Interventions targeted at kids below school age (preschool) are more effective than those targeting older children. With regard to the content of interventions, those intended to increase quality tend to have lower effects than those aimed at increasing quantity. However, interventions that focus on process quality rather than structural quality or learning formats are more effective.
Interestingly, the evaluation design (RCT vs other methods) does not matter for the effect size. This implies that, at least on average, non-experimental evaluation designs do not significantly over- or underestimate the true effect size (as measured by RCTs) in our sample of effects. However, this does not imply that individual non-RCT studies are free from bias, as there may be biases in different directions that cancel out on average.
Table 5 presents the results of the forward selection meta-regression for the cost-standardized effect sizes. Again, language as an outcome is significantly less cost-effective compared to maths or “other”. Interventions targeting preschoolers are more cost-effective than those targeting older children and young adults, especially if the intervention takes place in a daycare setting. Interventions targeting educators are also more cost-effective, whereas fully manualised interventions are less cost-effective. Interestingly, on average, it does not matter whether the cost- standardised effect size was estimated using an RCT or another evaluation design. As such, many of the results from the meta-regressions on raw effect sizes carry over to cost-standardised effect sizes.
Table 5. Multivariate Meta-Regression Results – cost-standardised effect sizes
4.2.1 Test for publication bias
Generally speaking, the prevalence of publication bias is a major concern in meta-analysis. If the probability of not identifying studies increases as their level of significance decreases, the result will be biased. We argue that the following three mechanisms diminish the likelihood of publication bias:
- We include not only studies published in journals, but also studies published in public reports aimed at making policy recommendations.
- Preregistration: To secure funding for interventions, TFCCR typically adheres to a preregistration process, which encourages publication regardless of whether the results are statistically significant.
- TrygFonden’s Centre for Child Research typically conducts an a priori power analysis to ensure that each intervention has a sufficient sample size to detect a statistically significant effect, based on the expected effect. Consequently, we expect relatively fewer non-rejections of a false null in our study population. This means that the proportion of studies that remain unpublished solely due to non-significant results should be smaller.
However, even though we argue that these mechanisms reduce publication bias in our study population, we still acknowledge that some bias may remain. Figure A.1 in the Appendix depicts the funnel plot for both raw and cost-standardised effect sizes. For the raw effect size, we see a relatively symmetric shape with higher precision, which is closer to the true effect size, and a symmetric distribution when standard errors become larger. If publication bias were present, we would expect small studies (with low precision) to be clustered on the right-hand side of the true effect size. For the effect size per $100, we actually see some right-hand side clustering in a few studies. However, studies with a relatively large effect size compared to the pooled effect size are downscaled to a much smaller extent as they are relatively cheaper.
We use rank correlation to formally test for publication bias (following the approach of Begg and Mazumdar). This method consists of testing the positive correlation between effect sizes and standard errors, the results of which are shown in Table 6.
Table 6. Test for publication bias
Kendall’s τ | p-value | |
Raw effect size | 0.058 | 0.5 |
Cost-standardised effect size | 0.251 | 0.004 |
Figure 5. LOO sensitivity analysis for raw effect sizes – no predictors

When it comes to the raw effect size, it is evident that we cannot reject the null hypothesis of no publication bias. On the contrary, we reject the null hypothesis for the effect size per $100 – but again, we argue that this is essentially a constructed estimate based on costs, which should not affect the probability of publishing.
4.2.2 Investigation of influential studies
To investigate whether the effects are driven by a few highly influential studies, we perform a Leave-One-Out (LOO) sensitivity analysis.
We exclude one study at a time and apply both the meta-analysis without predictors and the meta-regressions with predictors to see if the estimates change dramatically or are sensitive to the exclusion of a single study. Figure 5 visualises the results of the LOO analysis for the meta-analysis without predictors for raw effect sizes. The figure shows that the estimated overall effect size is both stable (approximately 0.1) and consistently statistically significant. The visualisation does not indicate the presence of any influential studies.
For information about the specific studies, see online SI.
Figure 6 visualises the result of the LOO analysis for the meta-regressions with predictors. While the number of selected predictors can vary considerably between regression fits, a clear picture emerges of predictors that are consistently chosen with a similar size of estimate. We therefore find no indication of the presence of influential studies in the meta-regressions.
Figure 6. LOO sensitivity analysis for raw effect sizes – meta-regression with predictors. Numbers above the graph indicate the number of selected predictors

Appendix D presents the results of a sensitivity analysis of cost-standardised effect sizes. These indicate no cause for general concern about the robustness of the cost-standardised effect sizes.
We also use Cook’s distance to explore potential outliers, as visualised in Figure 7. While these graphs indicate a few potentially influential results, the sensitivity analyses above suggest that the influences are negligible for the final estimates.
Figure 7. Cook’s distances
Panel A: Raw effect sizes
Panel B: Cost-standardised effect sizes
Figure 8. Risk of bias assessment for RCT studies
4.2.3 Risk-of-bias assessment
The risk-of-bias assessment determined that all of the studies that meet the inclusion criteria have an overall low risk of bias (see Figure 8 for visualisation of RCT studies).
The algorithm in the assessment tool concluded that several studies were of some concern in terms of risk of bias, due to a lack of preregistered analysis. However, as we are in a unique position to gather information about the study details from the authors concerned, we can safely conclude that the lack of preregistration (the most common cause of concern, especially in non-experimental studies) did not introduce particularly high risks of bias, since the analyses were carried out as planned and internally registered. Several studies present null findings, which supports the judgement that the studies did not change the analysis plan, nor did they select results to present, which would increase the risk of bias. Many studies use data from the national tests available at Statistics Denmark as outcome measures. Since these tests are mandatory for students in public-sector schools in Denmark and are taken electronically, this strengthens the assessment’s conclusion that there is a low risk of bias. Tables A.3 and A.4 in the appendix present an overview of risk of bias assessments for all studies (treatment arm/outcome measure), while the full assessments are available in the online SI.
5 Discussion
The meta-analysis of the raw effect sizes found a reliable positive population effect size estimate of 0.104 (95% CI: 0.065 - 0.144), with 79% of the estimates being positive and 52% of those being significant. The meta-analysis of the cost-standardised effect sizes also found a positive population effect size estimate (ES: 0.037, 95% CI: 0.018 - 0.057), with 80% of the estimates being positive and 53% of those being significant.
The fact that most interventions have a positive effect indicates the success of TrygFonden’s Centre for Child Research’s thorough, scientific approach to creating and identifying effective interventions. While the interventions may differ in terms of their specific characteristics, they share a certain methodological rigor. The meta-analyses suggest that carefully designed interventions have a generally positive impact on various learning outcomes for children at all ages.
When unravelling the overall pattern, the interventions vary to a large extent in terms of their content and effect size. The most effective intervention measured in raw effect size is Play and Learn. This intervention is a 20-week, low-cost curriculum that runs in Danish childcare centres and trains teachers to apply sequenced weekly language and maths targets, engage in rich “serve and return” interactions and incorporate self-designed activities into everyday routines. The content is supported by planners, posters, logs and a two-day workshop. The second-most effective intervention is a treatment arm within the TMTM study consisting of a 12-week programme in which a trained mathematics teacher provides structured, dialogue-based one-to-one instruction four times per week, supported by screening, ongoing diagnostic conversations and targeted tasks. The teaching is continually adapted to each pupil’s knowledge gaps, and the teacher receives three video-based supervision sessions from a school maths coach. This illustrates the significant differences between the two most effective interventions: i.e., aimed at language vs mathematics skills; and taking place in childcare vs school. All of the included interventions are described in more detail in the online SI.
We conducted meta-regressions to investigate whether key characteristics are systematically associated with higher or lower effect sizes. The regressions on the raw effect sizes show that interventions targeting educators and interventions targeting children at the preschool age are significantly more effective. This is consistent with similar findings in the literature that interventions targeted at younger children are more effective (see, e.g., Heckman (2006) and Rosholm et al. (2021)). Interventions with language as a targeted outcome, as well as fully manualised interventions, are found to be significantly less effective. While this latter finding is interesting, it should be interpreted in light of the fact that only 12.7% of studies include a fully manualised intervention. Lastly, while interventions that increase quality seem to be less effective than interventions that increase quantity, the meta-regression also indicates that a focus on process quality is significantly more effective than a focus on other aspects of quality.
When effect sizes are standardised by cost, the relative ranking changes. The most effective intervention then becomes Performance Information, which is evaluated for both maths and reading.
This is a quasi-experimental study that takes advantage of an unplanned IT breakdown during national tests to evaluate how students are affected by receiving information on their current performance. The theoretical basis for this is that knowledge of your own performance in itself has an impact on future performance. The second most effective cost-standardised intervention is the Feedback intervention. This is another quasi-experimental design, which takes advantage of the fact that the raw scores from national tests can be mapped mechanically onto five categories – from “considerably below average” to “considerably above average”. This means that students whose scores fall just below a given cutoff are seen as performing significantly worse than otherwise identical students whose scores are just above it. The study then investigates how this relatively negative feedback affects later achievements.
Common to these highly cost-effective interventions is that they were conducted in relation to national tests. In both cases, the active treatment is related to receiving feedback on performance, but the test is taken under all circumstances, which makes these interventions very cheap and therefore highly cost-effective. All of these interventions are described in the online SI.
Formally, the meta-regression of the cost-standardised effect sizes identified a pattern in terms of the effect of different mediators and moderators that was very similar to the pattern for raw effect sizes. Again, early interventions (which target children in preschool and take place at daycare) and interventions targeting educators are more effective, while fully manualised interventions and interventions in which language is the learning outcome are less effective.
We found no clear correlation between raw effect sizes and intervention costs. This is surprising, as we expected more expensive interventions to have a larger effect. Our assumption was that more expensive interventions would be associated with either higher quality or quantity, and in both cases, we would expect an increase in the treatment effect. The fact that this pattern was not found in the analysis may be partly explained by the fact that the most effective cost-standardised interventions were quasi-experimental studies, in which the treatment consisted of feedback on national test performance. However, the leave-one-out analysis indicated that no individual study was driving the effects. Further, significant findings in the meta-regressions identified other characteristics associated with higher effect sizes. For example, we found that interventions focusing on increasing quality were less effective. However, this does not necessarily imply that higher quality is not effective – it may also reflect more general difficulties associated with influencing and enhancing quality rather than quantity. This result also stands in contrast to the finding that increasing process quality as an active ingredient is associated with larger effects.
Interestingly, neither of the two meta-regressions found that an RCT design is a significant predictor of effect size. This finding indicates that non-RCT approaches are, on average, unbiased – at least in our sample. This is interesting, since it suggests that combining RCT studies with other carefully designed evaluations may provide insight into treatment effects in various settings. This finding may also reflect the high-quality of Danish register data, which allows researchers to take advantage of naturally occurring exogenous variation. A recent study by Imbens & Xu (2025) directly compares RCTs with quasi-experimental studies. It finds that while non-RCTs are sensitive to specification and only identify causal relationships when relatively strong assumptions hold, they can also, given the right circumstances, present an alternative to experimental designs. This specification sensitivity, along with the relatively low sample size of the present analysis, means we cannot conclude anything about the different methodological approaches. We can investigate treatment effects in types of interventions, for which only a small amount of data has been collected, as long as we make an effort to meet assumptions. However, due to restrictions and highly data-dependent assumptions, quasi-experimental methods cannot be used exclusively for evaluations of education-type interventions – and in cases where RCTs are feasible, these are always preferable.
The complex pattern of intervention characteristics
may also serve as a starting point for further intervention development. In general, carefully designed interventions have a positive effect on various learning outcomes, but their specific effect sizes vary. As the costs of interventions were found not to be important for treatment effects, it may be more fruitful to focus on content and structural parameters when designing new interventions.
For details of all studies, see the online SI.
6 Limitations
There are several limitations that influence the extent to which these conclusions can be generalised. As in Rosholm et al. (2021), the meta-analysis only includes short-term effects, which may not necessarily persist in the long term. The effect of an intervention may fade out over time (and the degree of fade-out can vary between studies), but it could also be reinforced if future investments become more efficient as a result.
The costs of the treatments are treated as fixed. In practice, however, some errors invariably arise when measuring intervention costs. This should be taken into consideration when interpreting the findings on cost-standardised effects. In order to minimise errors, all cost-standardised effects are reported in 2021 prices and, as such, take inflation into account.
We consider the internal validity of this study to be high, since all interventions were conducted in the same country, around the same time period (2013–2024). However, it is important to note that many interventions were implemented at the classroom (or group) level, and as such, capture not only the direct impact on individual children, but also potential spillover effects from other children within the treated classroom. It is possible that spillover effects within classrooms serve as a significant mechanism through which interventions operate. While this should be considered when interpreting the absolute size of treatment effects, it is less relevant for comparisons across studies, as most studies are implemented at the classroom level.
Regarding external validity, we believe the results are most applicable to other Scandinavian welfare states. In other countries with a lower level of spending on children, particularly in daycare settings, interventions of the type included here may in fact yield even larger effect sizes.
As stated, this study only includes studies from one research centre. Studies from all of the Nordic countries provide valuable insights into educational research and policy- making. However, the limitations of this meta-analysis – including a lack of cost information and data on mediators and moderators – make it impossible to include all Nordic intervention studies. This approach allows for a richer set of insights, but it also excludes potentially insightful studies, and as such may not accurately reflect the overall effectiveness of interventions in the region. By only including studies from one research centre, we may miss out on potential insights and a broader understanding of the overall effectiveness of interventions in Denmark and the Nordic countries. This may lead to a skewed perspective on the overall effectiveness of interventions, which may not accurately reflect all interventions in the Nordic Region.
7 Conclusion
This paper builds upon and extends the meta-analysis by Rosholm et al. (2021) by including more RCTs and non-RCTs conducted in Denmark in collaboration with TrygFonden’s Centre for Child Research. We use a four-level multivariate meta-model to investigate intervention treatment effects and find a positive overall estimated population effect. This is the case for both raw effect sizes and cost-standardised effect sizes. We use meta-regressions to investigate the impact of the interventions’ key characteristics, and this approach replicates findings in the literature that interventions are more effective when targeted at younger children, which supports the theoretical implications of the Heckman-curve theory.
Surprisingly, we see no correlation between the intervention cost and effect size, which may be caused by general difficulties associated with increasing quality in education-type interventions. We also find that evaluation design (RCT vs non-RCT) is not a significant predictor of effect size. This indicates that, in our sample of studies, non-RCT evaluation methods are unbiased on average and may function well as alternatives to RCT studies where the latter are not feasible.
Lastly, we discuss the limitations of our study, including measurement errors on costs of interventions, internal and external validity and regional limitations.
References
Andersen, S. C., Beuchert, L., & Nielsen, H. S. (2024, May). The effect of teacher’s aides on students with special needs. https://doi.org/10.2139/ssrn.4182253
Andersen, S. C., Beuchert, L., Nielsen, H. S., & Thomsen, M. K. (2020). The effect of teacher’s aides in the classroom: Evidence from a randomized trial. Journal of the European Economic Association, 18(1), 469–505. https://doi.org/10.1093/jeea/jvy048
Andersen, S. C., Guul, T. S., & Humlum, M. K. (2021). How first-language instruction transfers to majority-language skills. Nature Human Behaviour, 6(2), 229–235. https://doi.org/10.1038/s41562-021-01200-x
Balduzzi, S., Rücker, G., & Schwarzer, G. (2019). How to perform a meta-analysis with R: A practical tutorial. Evidence-Based Mental Health, 22(4), 153–160. https://doi.org/10.1136/ebmental-2019-300117
Barro, R. J. (2013). Education and economic growth. Annals of Economics and Finance, 14(2), 301–328.
Begg, C. B., & Mazumdar, M. (1994). Operating characteristics of a rank correlation test for publication bias. Biometrics, 50(4), 1088–1101. https://doi.org/10.2307/2533446
Bleses, D., Horn, N. T., Larsen, E. N. F., Larsen, N. S., Munkedal, S., Thingholm, P. R., & Wandall, J. (2022, September). Evaluering af obligatoriske sprogprøver (Technical report). Trygfondens Børneforskningscenter, Epinion, Aarhus University.
Burchinal, M., Vandergrift, N., Pianta, R., & Mashburn, A. (2010). Threshold analysis of association between child care quality and child outcomes for low-income children in pre-kindergarten programs. Early Childhood Research Quarterly, 25(2), 166–176. https://doi.org/10.1016/j.ecresq.2009.10.004
Byrne, B., & Fielding-Barnsley, R. (1991). Evaluation of a program to teach phonemic awareness to young children. Journal of Educational Psychology, 83(4), 451–457.
Campbell, F. A., Ramey, C. T., Pungello, E., Sparling, J., & Miller-Johnson, S. (2002). Early childhood education: Young adult outcomes from the Abecedarian Project. Applied Developmental Science, 6(1), 42–57. https://doi.org/10.1207/S1532480XADS060105
Chancel, L., & Piketty, T. (2021). Global income inequality 1820–2020: The persistence and mutation of extreme inequality. Journal of the European Economic Association, 19(6), 3025–3062. https://doi.org/10.1093/jeea/jvab047
Clements, D. H., & Sarama, J. (2007). Effects of a preschool mathematics curriculum: Summative research on the Building Blocks project. Journal for Research in Mathematics Education. https://doi.org/10.2307/30034954
Cochran, W. G. (1954). Some methods for strengthening the common χ² tests. Biometrics, 10, 417–451.
Duncan, G. J., & Magnuson, K. (2013). Investing in preschool programs. Journal of Economic Perspectives, 27(2), 109–132. https://doi.org/10.1257/jep.27.2.109
Ehri, L. C., Nunes, S. R., Stahl, S. A., & Willows, D. M. (2001). Systematic phonics instruction helps students learn to read: Evidence from the National Reading Panel’s meta-analysis. Review of Educational Research, 71(3), 393–447. https://doi.org/10.3102/00346543071003393
Elango, S., García, J. L., Heckman, J. J., & Hojman, A. (2016). Early childhood education. In E. A. Hanushek, S. Machin, & L. Woessmann (Eds.), Economics of means-tested transfer programs in the United States, volume II (pp. 235–298). University of Chicago Press. https://doi.org/10.7208/9780226392523-005
Fredriksson, P., Öckert, B., & Oosterbeek, H. (2013). Long-term effects of class size. Quarterly Journal of Economics, 128(1), 249–285. https://doi.org/10.1093/qje/qjs048
Fryer, R. G. (2017). The production of human capital in developed countries: Evidence from 196 randomized field experiments. In A. V. Banerjee & E. Duflo (Eds.), Handbook of economic field experiments (Vol. 2, pp. 95–322). North-Holland. https://doi.org/10.1016/bs.hefe.2016.08.006
Gardner, F., Leijten, P., Melendez-Torres, G., Landau, S., Harris, V., Mann, J., Beecham, J., Hutchings, J., & Scott, S. (2019). The earlier the better? Individual participant data and traditional meta-analysis of age effects of parenting interventions. Child Development, 90(1), 7–19. https://doi.org/10.1111/cdev.13138
Haghish, E., Vach, W., Højen, A., & Bleses, D. (2021). Estimating measurement error in child language assessments administered by daycare educators in large-scale intervention studies. PLOS ONE, 16(11). https://doi.org/10.1371/journal.pone.0304884
Hanushek, E. A., Kain, J. F., Markman, J. M., & Rivkin, S. G. (2003). Does peer ability affect student achievement? Journal of Applied Econometrics, 18(5), 527–544. https://doi.org/10.1002/jae.741
Hanushek, E. A., & Woessmann, L. (2010). Education and economic growth. Economics of Education, 60, 1–67.
Hattie, J. (2023). Visible learning: The sequel. Routledge.
Heckman, J. J. (2006). Skill formation and the economics of investing in disadvantaged children. Science, 312(5782), 1900–1902. https://doi.org/10.1126/science.1128898
Higgins, J. P. T., & Thompson, S. G. (2002). Quantifying heterogeneity in a meta-analysis. Statistics in Medicine, 21(11), 1539–1558. https://doi.org/10.1002/sim.1186
Hoff, E., Trecca, F., Højen, A., Laursen, B., & Bleses, D. (2024). Context and education affect the quality of parents’ speech to children. Journal of Applied Developmental Psychology, 91, 101632. https://doi.org/10.1016/j.appdev.2024.101632
Højen, A., Hoff, E., Bleses, D., & Dale, P. S. (2021). The relation of home literacy environments to language and preliteracy skills in single- and dual-language children in Danish childcare. Early Childhood Research Quarterly, 55, 312–325. https://doi.org/10.1016/j.ecresq.2020.12.007
Højen, A., Madsen, T. O., & Bleses, D. (2023). Danish 20-month-olds’ recognition of familiar words with and without consonant and vowel mispronunciations. Phonetica, 80(5), 309–328. https://doi.org/10.1515/phon-2023-2001
Humlum, M. K., & Smith, N. (2015). Long-term effects of school size on students’ outcomes. Economics of Education Review, 45, 28–43. https://doi.org/10.1016/j.econedurev.2015.01.003
Hvidman, C., Koch, A., Nafziger, J., Nielsen, S. A., & Rosholm, M. (2020). An intensive, school-based learning camp targeting academic and non-cognitive skills evaluated in a randomized trial. IZA Discussion Paper.
Imbens, G. W., & Rubin, D. B. (2015). Causal inference for statistics, social, and biomedical sciences. Cambridge University Press.
Imbens, G. W., & Xu, Y. (2025). Comparing experimental and non-experimental methods: What lessons have we learned four decades after Lalonde (1986)? Journal of Economic Perspectives, 39(4), 173–201.
Jensen, P., & Sjö, N. M. (2024). The effects of a large-scale school readiness intervention on Danish preschool children’s emergent mathematics skills. Scandinavian Journal of Educational Research, 68(3), 488–503. https://doi.org/10.1080/00313831.2022.2148281
Jepsen, C., & Rivkin, S. (2009). Class size reduction and student achievement. Journal of Human Resources, 44(1), 223–250. https://doi.org/10.3368/jhr.44.1.223
Justice, L. M., McGinty, A. S., Piasta, S. B., Kaderavek, J. N., & Fan, X. (2010). Print-focused read-alouds in preschool classrooms. Language, Speech, and Hearing Services in Schools, 41(4), 504–520. https://doi.org/10.1044/0161-1461(2010/09-0056)
Kane, T. J., & Staiger, D. O. (2012). Gathering feedback for teaching: Combining high-quality observations with student surveys and achievement gains. Bill & Melinda Gates Foundation.
Levitt, C. (2009). From best practices to breakthrough impacts: A science-based approach to building a more promising future for young children and families. Center on the Developing Child, Harvard University.
Lundahl, B. W., Tollefson, D., Risser, H., & Lovejoy, M. C. (2008). A meta-analysis of father involvement in parent training. Research on Social Work Practice, 18(2), 97–106. https://doi.org/10.1177/1049731507309828
Nielsen, S. A. (2023). Boys left behind: The effects of summer camp and follow-up strategies on academic, personal, and social competencies. Economics of Education Review, 93, 102370. https://doi.org/10.1016/j.econedurev.2023.102370
OECD. (2024). Society at a glance 2024: OECD social indicators. https://doi.org/10.1787/918d8db3-en
National Reading Panel. (2000). Teaching children to read: An evidence-based assessment of the scientific research literature on reading and its implications for reading instruction: Reports of the subgroups. National Institute of Child Health and Human Development.
Phillips, D. A., Lipsey, M. W., Dodge, K. A., Haskins, R., Bassok, D., Burchinal, M. R., & Weiland, C. (2017). Puzzling it out: The current state of scientific knowledge on pre-kindergarten effects. In The current state of scientific knowledge on pre-kindergarten effects (pp. 19–30).
R Core Team. (2023). R: A language and environment for statistical computing. R Foundation for Statistical Computing. https://www.r-project.org/
Reynolds, A. J., Temple, J. A., Ou, S.-R., Robertson, D. L., Mersky, J. P., Topitzes, J. W., & Niles, M. D. (2007). Effects of a school-based early childhood intervention on adult health and well-being: A 19-year follow-up of low-income families. Archives of Pediatrics & Adolescent Medicine, 161(8), 730–739. https://doi.org/10.1001/archpedi.161.8.730
Rosholm, M., Paul, A., Bleses, D., Højen, A., Dale, P. S., Jensen, P., Justice, L. M., Svarer, M., & Andersen, S. C. (2021). Are impacts of early interventions in the Scandinavian welfare state consistent with a Heckman curve? A meta-analysis. Journal of Economic Surveys, 35(1), 106–140. https://doi.org/10.1111/joes.12400
Rosholm, M., Tønnesen, P. B., Rasmussen, K., Overgaard, S., Færch, J. V., Malm, S. G., & Harder, J. (2025). A tailored small group instruction intervention in mathematics benefits low achievers. npj Science of Learning, 10(1), 18. https://doi.org/10.1038/s41539-025-00310-9
Schulz, K. F., Altman, D. G., & Moher, D. (2010). CONSORT 2010 statement: Updated guidelines for reporting parallel group randomized trials. BMJ, 340, c332. https://doi.org/10.1136/bmj.c332
Sterne, J. A. C., Savović, J., Page, M. J., Elbers, R. G., Blencowe, N. S., Boutron, I., Cates, C. J., Cheng, H.-Y., Corbett, M. S., Eldridge, S. M., et al. (2019). RoB 2: A revised tool for assessing risk of bias in randomized trials. BMJ, 366.
Svane, R. P., Willemsen, M. M., Bleses, D., Krøjgaard, P., Verner, M., & Nielsen, H. S. (2023). A systematic literature review of math interventions across educational settings from early childhood education to high school. Frontiers in Education, 8. https://doi.org/10.3389/feduc.2023.1229849
Viechtbauer, W. (2010). Conducting meta-analyses in R with the metafor package. Journal of Statistical Software, 36(3), 1–48. https://doi.org/10.18637/jss.v036.i03
White, L. A., Prentice, S., & Perlman, M. (2015). The evidence base for early childhood education and care programme investment: What we know, what we don’t know. Evidence & Policy.https://doi.org/10.1332/174426415X14210818992588
Appendix
A Table with data summary
Table A.2: Data Summary
Study Specification Attributes | ||||||
Study | Treatment | Domain | Effect Size | Standard Error | Cost | RCT |
Play and learn (Bleses, Jensen, et al, 2020 | VLS 1-2 Years –Centre Based | Math | 0.68 | 0.12 | 232 | X |
Play and learn (Bleses, Jensen, et al, 2020 | VLS 1-2 Years – Centre Based | Language | 0.23 | 0.07 | 232 | X |
SPELL (Bleses, Højen, et al., 2018b; Bleses et al., 2015) | SPELL (Baseline) | Language | 0.27 | 0.08 | 92 | X |
SPELL (Bleses, Højen, et al., 2018b; Bleses et al., 2015) | SPELL + PD | Language | 0.28 | 0.14 | 130 | X |
SPELL (Bleses, Højen, et al., 2018b; Bleses et al., 2015) | SPELL + HOME | Language | 0.18 | 0.05 | 110 | X |
LEAP (Bleses, Højen, et al., 2018a; Bleses et al., 2015) | LEAP LARGE | Language | 0.04 | 0.06 | 69 | X |
LEAP (Bleses, Højen, et al., 2018a; Bleses et al., 2015) | LEAP SMALL | Language | 0.06 | 0.07 | 96 | X |
LEAP (Bleses, Højen, et al., 2018a; Bleses et al., 2015) | LEAP OPEN | Language | 0.43 | 0.07 | 101 | X |
READ (S. C. Andersen & Nielsen, 2016) | READ | Read | 0.26 | 0.07 | 83 | X |
Suitcase (Jakobsen & Andersen, 2013) | Suitcase | Language | -0.08 | 0.21 | 234 | X |
Teacher’s Aide (S. Andersen et al., 2018) | With Degree | Read | 0.09 | 0.03 | 1181 | X |
Teacher’s Aide (S. Andersen et al., 2018) | Without Degree | Read | 0.13 | 0.04 | 1251 | X |
Teacher’s Aide (S. Andersen et al., 2018) | With Degree | Math | 0.06 | 0.05 | 1181 | X |
Teacher’s Aide (S. Andersen et al., 2018) | Without Degree | Math | 0.04 | 0.05 | 1251 | X |
Instr. Time (S. C. Andersen et al., 2016) | Without Teaching Programme | Read | 0.15 | 0.06 | 201 | X |
Instr. Time (S. C. Andersen et al., 2016) | With Teaching Programme | Read | 0.04 | 0.06 | 201 | X |
Chess (Rosholm et al., 2017) | Chess Instructions | Math | 0.16 | 0.08 | 301 | |
Mentoring (Svarer et al., 2014) | Mentors | Education | 0.07 | 0.04 | 3900 | X |
Bridging (Rosholm, Mikkelsen, & Svarer, 2019) | Bridging | Education | 0.10 | 0.01 | 2537 | |
TMTM (Rosholm et al., 2025) | Teacher to Group – Grade 2 | Math | 0.48 | 0.20 | 396 | X |
TMTM (Rosholm et al., 2025) | Teacher to Group – With Supervision – Grade 2 | Math | 0.09 | 0.21 | 552 | X |
TMTM (Rosholm et al., 2025) | Teacher to Student –With Supervision – Grade 2 | Math | 0.63 | 0.22 | 1284 | X |
TMTM (Rosholm et al., 2025) | Teacher to Group of High Achieving Students – Grade 2 | Math | 0.21 | 0.12 | 460 | X |
TMTM (Rosholm et al., 2025) | Teacher to Group of High Achieving Students – With Supervision – Grade 2 | Math | 0.28 | 0.13 | 674 | X |
TMTM (Rosholm et al., 2025) | Teacher to Group – Grade 8 | Math | 0.29 | 0.25 | 483 | X |
TMTM (Rosholm et al., 2025) | Teacher to Group – With Supervision- Grade 8 | Math | 0.49 | 0.24 | 616 | X |
TMTM (Rosholm et al., 2025) | Teacher to Student – With Supervision – Grade 8 | Math | 0.34 | 0.26 | 919 | X |
Turbo (Rosholm, Hvidman, et al., 2020) | Turbo | Read | 0.01 | 0.22 | 795 | X |
Turbo (Rosholm, Hvidman, et al., Turbo 2020) | Turbo | Math | 0.19 | 0.08 | 795 | X |
Turbo + (Hvidman et al., 2020) | Turbo+ | Read | 0.00 | 0.03 | 786 | X |
Turbo + (Hvidman et al., 2020) | Turbo+ | Math | 0.06 | 0.04 | 786 | X |
Perf. info (S. Andersen & Nielsen, 2020) | Performance information | Read | 0.09 | 0.02 | 7 | |
Perf. info (S. Andersen & Nielsen, 2020) | Performance information | Math | 0.07 | 0.05 | 7 | |
Instr. time + Feedback (S. Andersen et al., 2019) | Instr. Time and Feedback | Read | 0.02 | 0.04 | 199 | X |
Mother Tongue (S. C. Andersen et al., 2022) | Mother Tongue Instruction | Read | 0.46 | 0.18 | 1419 | X |
Feedback (Beuchert et al., 2020) | Feedback On Tests | Read | 0.03 | 0.01 | 7 | |
Feedback (Beuchert et al., 2020) | Feedback On Tests | Math | 0.06 | 0.02 | 7 | |
Camp Copenhagen (Rosholm, Nielsen, Hvidman, et al., 2020) | Camp | Read | -0.02 | 0.05 | 6234 | |
Camp Copenhagen (Rosholm, Nielsen, Hvidman, et al., 2020) | Camp | Math | -0.04 | 0.06 | 6234 | |
Boys Camp (Rosholm, Nielsen, Hvidman, et al., 2020) | Camp | Math | -0.04 | 0.04 | 5994 | |
Boys Camp (Rosholm, Nielsen, Hvidman, et al., 2020) | Camp | Read | -0.04 | 0.04 | 5994 | |
Plan T (Rosholm, Nielsen, Hvidman, et al., 2020) | Camp | Read | 0.07 | 0.06 | 4824 | |
VLS + (Bleses, Moos, & Boisen, 2020) (Bleses et al., 2025) | VLS 1-2 Years – Centre Based | Language | 0.50 | 0.12 | 228 | X |
VLS + (Bleses, Moos, & Boisen, 2020) (Bleses et al., 2025) | VLS And Leaders | Language | 0.02 | 0.04 | 325 | X |
VLS + (Bleses, Moos, & Boisen, 2020) (Bleses et al., 2025) | VLS And Leaders And Staff | Language | 0.00 | 0.04 | 379 | X |
Digital learning tool (Gissel & Andersen, 2021) | Digital learning tool | Read | 0.03 | 0.09 | 7 | X |
Class size (Nandrup, 2016) | Class size | Read | 0.00 | 0.01 | 0 | |
Class size (Nandrup, 2016) | Class size | Math | 0.00 | 0.01 | 0 | |
VLS (Bleses et al., 2021) Based | VLS 1-2 Years – Centre And Family Based | Language | 0.09 | 0.04 | 231 | X |
VLS (Bleses et al., 2021) | VLS 1-2 Years – Centre and Family Based | Math | 0.46 | 0.07 | 231 | X |
Busing (Damm et al., 2021) | Bussing | Read | -0.17 | 0.10 | 8815 | |
Busing (Damm et al., 2021) | Bussing | Math | -0.25 | 0.10 | 8815 | |
Gender matching (Guul, 2018) | Gender matching | Other | 0.16 | 0.09 | 3900 | |
Peer Tutoring (Rosholm, Vind, et al., 2019) | Peer Tutoring | Read | -0.02 | 0.05 | 175 | X |
Student Tutoring (Rosholm, Vind, et al., 2019) | Student Tutoring | Math | 0.08 | 0.27 | 210 | X |
Paired Reading (Rosholm, Vind, et al., 2019) | Paired Reading | Read | -0.14 | 0.15 | 1215 | X |
Letterbox Club (Rosholm, Vind, et al., 2019) | Club Pencil Case | Math | 0.02 | 0.14 | 895 | X |
Letterbox Club (Rosholm, Vind, et al., 2019) | Club Pencil Case | Read | 0.10 | 0.09 | 895 | X |
READ Foster Care (Bleses et al., 2022) | READ in Foster Care | Language | 0.05 | 0.39 | 866 | X |
Boys Camp (Nielsen, 2023) | Boys Camp – Individual Follow Up | Other | 0.12 | 0.05 | 5994 | |
Boys Camp (Nielsen, 2023) | Boys Camp – Group Follow Up | Other | 0.20 | 0.04 | 5994 | |
Play and Learn in Kindergarten (Bleses et al., 2024) | Play and Learn in Kindergarten | Language | -0.02 | 0.07 | 102 | X |
Play and Learn in Daycare (Bleses et al., 2024) | Play and Learn in Daycare | Language | 0.07 | 0.07 | 203 | X |
B Mathematical notation
B.1 4-level random-effects model
Following the notation in Harrer et al. (2021), the 4-level random-effects model is given by:
Where \hat{\theta}_{itk} is the estimate of the true effect size i nested in treatment arm t within the study k. The random effect components \zeta_{(2)itk} and \zeta_{(3)tk} reflect the within-cluster heterogeneity on levels 2 and 3, respectively. \zeta_{(4)k} reflects the between-cluster heterogeneity on level 4. µ is the parameter of interest, as it reflects the true population effect size. For \zeta_{(2)itk} = \zeta_{(3)tk} =\zeta_{(4)k} = 0, the model collapses to a fixed effect model, where all included effect sizes are drawn from the true population distribution of effect sizes. The sampling error \epsilon_{itk} reflects the sampling error of the effect size. This quantity is assumed to be independent of the random components.
B.2 Formal specifications of heterogeneity and variance
The total heterogeneity estimate \hat{\tau}^2 is given by the sum of the variances from the random components: \hat{\tau}^2 = \hat{\sigma}_4^2 + \hat{\sigma}_3^2 + \hat{\sigma}_2^2
The proportion of total variance in the nested structure accounted for by heterogeneity is given by: I^2 = \frac{\hat{\tau}^2}{\hat{\tau}^2 + \hat{\sigma}_\epsilon^2}
B.3 4-level mixed-effects model
The mixed-effects model applied at the meta-regressions is given by:
where xitk denotes the included mediators and moderators.
C Funnel plots for publication assessment
D Sensitivity analysis for cost-standardised effect sizes
Figures A.2 and A.3 below show the sensitivity analysis for the cost-standardised effect sizes. The moderator Learning outcome: other has an usually high estimate for the analysis in which “Paired reading” is omitted. This behaviour seems to be an outlier, as all other results seem to have robust methods of leaving out specific studies.
Figure A.1: Funnel plot for both effect sizes

Figure A.2: LOO sensitivity analysis for cost-standardised effect sizes – no predictors

Figure A.3: LOO sensitivity analysis for cost-standardised effect sizes – meta-regression with predictors. Numbers above the graph indicate number of selected predictors

E Risk of bias assessment
Table A.3: Overview of risk of bias assessment for RCT studies. Both algorithm and assessor judgment is presented for each of the five domains.
The last judgment (bold) is the overall judgment of risk of bias. L = Low risk of bias, SC = some concerns for risk of bias, H = high risk of bias. Full assessments of each individual study and outcome are available in online SI.
Risk of Bias ID | Study | Outcome | Algorithm judgment | Assessor’s judgment |
bleses2020lowVocab | Play and learn | Vocabulary | L L L L SC L | L L L L L L |
bleses2020lowMathskill | Play and learn | Math skills | L L L L SC L | L L L L L L |
bleses2018SPELL | SPELL | Language assessment | L L SC L L L | L L L L L L |
bleses2018SPELLHOME | SPELL + HOME | Language assessment | L L SC L L L | L L L L L L |
bleses2018SPELLPD | SPELL + PD | Language assessment | L L SC L L L | L L L L L L |
bleses2015LEAPSMALL | LEAP SMALL | Language overall | L L L L SC L | L L L L L L |
bleses2015LEAPLARGE | LEAP SMALL | Language overall | L L L L SC L | L L L L L L |
bleses2015LEAPOPEN | LEAP SMALL | Language overall | L L L L SC L | L L L L L L |
andersen2016- Readingtest | Growth mindset | Reading test | L L L L SC SC | L L SC L L L |
jakobsen2013- coproduction | Suitcase | Language overall | L L L L SC L | L L L L L L |
andersen2018TA- WdegreeRead | TA with degree | Reading overall | L L L L SC L | L L L L L L |
andersen2018TA- WdegreeMath | TA with degree | Math overall | L L L L SC L | L L L L L L |
andersen2018TA- WOdegreeRead | TA without degree | Reading overall | L L L L SC L | L L L L L L |
andersen2018TA- WOdegreeMath | TA without degree | Math overall | L L L L SC L | L L L L L L |
andersen2016instr- Wprogram | Instruction time w program | Reading overall | L L L L SC L | L L L L L L |
andersen2016instr- WOprogram | Instruction time w/o program | Reading overall | L L L L SC L | L L L L L L |
Risk of Bias ID | Study | Outcome | Algorithm judgment | Assessor’s judgment |
svarer2014- Mentoring | Mentoring | Average education | L L L L SC SC | L SC L L L L |
harder2020TMTM- TTG G2 | TMTM (grade 2) teacher to group | Mathema- tics test | L L L L L L | L L L L L L |
harder2020TMTM- TTG Wsuper G2 | TMTM (grade 2) teacher to group w supervision | Mathema- tics test | L L L L L L | L L L L L L |
harder2020TMTM- TTS Wsuper G2 | TMTM (grade 2) teacher to student w supervision | Mathema- tics test | L L L L L L | L L L L L L |
harder2020TMTM- TTG HighAch G2 | TMTM (grade 2) teacher to group high achievers | Mathema- tics test | L L L L L L | L L L L L L |
harder2020TMTM- TTG HighAch- W super G2 | TMTM (grade 2) teacher to group high achievers w supervision | Mathema- tics test | L L L L L L | L L L L L L |
harder2020TMTM- TTG G8 | TMTM (grade 8) teacher to group | Mathema- tics test | L L L L L L | L L L L L L |
harder2020TMTM- TTG Wsuper G8 | TMTM (grade 8) teacher to group w supervision | Mathema- tics test | L L L L L L | L L L L L L |
harder2020TMTM- TTS Wsuper G8 | TMTM (grade 8) teacher to student w supervision | Mathema- tics test | L L L L L L | L L L L L L |
rosholm2020- TurboReadingTest | Turbo | Reading overall | H L L L L SC | SC L L L L L |
rosholm2020- TurboMathTest | Turbo | Reading overall | H L L L L SC | SC L L L L L |
rosholm2020- Turbo+ReadingTest | Turbo+ | Reading overall | H L L L L SC | SC L L L L L |
andersen2022Mother- tongueReading | Mothertongue | Reading overall | L L L L SC L | L L L L L L |
bleses2020VLS+- Language | VLS+ | Language test | L L L SC SC L | L L L L L L |
Risk of Bias ID | Study | Outcome | Algorithm judgment | Assessor’s judgment |
bleses2020VLS+- LeadersLanguage | VLS+ leaders | Language test | L L L SC SC L | L L L L L L |
bleses2020VLS+- LeadersStaffLanguage | VLS+ leaders & staff | Language test | L L L SC SC L | L L L L L L |
andersen2021- digitalRead | Digital lear- ning tool | Reading average | L L L L SC L | L L L L L L |
bleses2021- VLSLanguage | VLS | Language average | L L L L SC L | L L L L L L |
bleses2021- VLSLanguage | VLS | Math average | L L L L SC L | L L L L L L |
rosholm2019- PeerReading | Peer tutoring | Reading overall | L L L L SC L | L L L L L L |
rosholm2019- StudentReading | Student tutoring | Reading overall | L L L L SC L | L L L L L L |
rosholm2019- ClubPencilReading | Club pencil case | Reading overall | L L L L SC L | L L L L L L |
rosholm2019- ClubPencilMath | Club pencil case | Math overall | L L L L SC L | L L L L L L |
bleses2022Read- FosterLanguage | READ in foster care | Language average | L L L L SC L | L L L L L L |
bleses2022play- learnLanguage | Play & learn | Language assessment | L L L L SC L | L L L L L L |
bleses2024play- learnLanguage | Play & learn | Language assessment | L L L L SC L | L L L L L L |
andersen2019- instrTimeFeed- | Instruction time feedback | Reading overall | L L L L SC L | L L L L L L |
Table A.4: Overview of risk of bias assessment for non-RCT studies. Both algorithm and assessor judgment is presented for each of the five domains. The last judgment (bold) is the overall judgment of risk of bias. L = Low risk of bias, SC = some concerns for risk of bias, H = high risk of bias. Full assessments of each individual study and outcome are available in online SI. File suffix specifies the file containing the full assessment. Filenames in the drive folder are on the form ”ROBINS-I-V2 suffix”
File suffix Study | Outcome Algorithm judgment | Assessor’s judgment |
boysCamp Boys camp | Reading overall L L L L L L L L | L L L L L L L L |
boysCamp Boys camp | Math overall L L L L L L L L | L L L L L L L L |
boysCampV2 Boys camp (w individual follow-up) | GPA L L L L L L L L | L L L L L L L L |
boysCampV2 Boys camp (w group follow-up) | GPA L L L L L L L L | L L L L L L L L |
busing School busing | Reading overall L L L L L L L L | L L L L L L L L |
busing School busing | Math overall L L L L L L L L | L L L L L L L L |
camp- Copenhagen Camp Copenhagen | Reading overall L L L L L L L L | L L L L L L L L |
camp- Copenhagen Camp Copenhagen | Math overall L L L L L L L L | L L L L L L L L |
bridging Bridging | Completion of track L L L L L L L L | L L L L L L L L |
chess Chess | Math test L L L L L L L L | L L L L L L L L |
classSize Class size | Reading overall L L L L L L L L | L L L L L L L L |
classSize Class size | Math overall L L L L L L L L | L L L L L L L L |
feedback Feedback | Reading average L L L L L L L L | L L L L L L L L |
feedback Feedback | Math overall L L L L L L L L | L L L L L L L L |
genderMatching Gender matching | Education enrollment L L L L L L L L | L L L L L L L L |
planT Plan T (camp) | Education enrollment L L L L L L L L | L L L L L L L L |
References on included studies
Andersen, S., Beuchert, L., Nielsen, H., & Thomsen, M. (2018). The effect of teacher’s aides in the classroom: Evidence from a randomized trial. Journal of the European Economic Association, 18. https://doi.org/10.1093/jeea/jvy048
Andersen, S., Guul, T., & Humlum, M. (2019, August). Instruction time, information, and student achievement: Evidence from a field experiment (Working paper).
Andersen, S. C., Guul, T. S., & Humlum, M. K. (2022). How first-language instruction transfers to majority-language skills. Nature Human Behaviour, 6(2), 229–235.
Andersen, S. C., Humlum, M. K., & Nandrup, A. B. (2016). Increasing instruction time in school does increase learning. Proceedings of the National Academy of Sciences, 113(27), 7481–7484. Retrieved from https://doi.org/10.1073/pnas.1516686113
Andersen, S. C., & Nielsen, H. S. (2016). Reading intervention with a growth mindset approach improves children’s skills. Proceedings of the National Academy of Sciences of the United States of America, 113(43), 12111–12113. Retrieved from https://www.jstor.org/stable/26472210
Andersen, S., & Nielsen, H. (2020). Learning from performance information. Journal of Public Administration Research and Theory, 30(3), 415–431. Retrieved from https://doi.org/10.1093/jopart/muz036
Beuchert, L., Eriksen, T. L. M., & Krægpøth, M. V. (2020). The impact of standardized test feedback in math: Exploiting a natural experiment in 3rd grade. Economics of Education Review, 77, 102017. Retrieved from https://doi.org/10.1016/j.econedurev.2020.102017
Bleses, D., Højen, A., Dale, P. S., Justice, L. M., Dybdal, L., Piasta, S., Markussen-Brown, J., Kjærbæk, L., & Haghish, E. (2018a). Effective language and literacy instruction: Evaluating the importance of scripting and group size components. Early Childhood Research Quarterly, 42, 256–269. Retrieved from https://doi.org/10.1016/j.ecresq.2017.10.002
Bleses, D., Højen, A., Justice, L., Dale, P., Dybdal, L., Piasta, S., Markussen-Brown, J., Clausen, M., & Ebad Fardzadeh, H. (2018b). The effectiveness of a large-scale early childhood language and pre-literacy intervention: The SPELL randomized controlled trial in Denmark. Child Development, 89(4), e342–e363. Retrieved from https://doi.org/10.1111/cdev.12859
Bleses, D., Højen, A., Kjær Faurskov, M., Line, D., & Sehested, K. (2015, April). Sproget kan styrkes!: Rapport om effekten af sprogindsatserne SPELL og Fart på sproget i danske dagtilbud. Syddansk Universitet.
Bleses, D., Jensen, P., Højen, A., Slot, P., & Justice, L. (2021). Implementing toddler interventions at scale: The case of “We learn together.” Early Childhood Research Quarterly, 57, 12–26. Retrieved from https://doi.org/10.1016/j.ecresq.2021.04.008
Bleses, D., Jensen, P., Slot, P., & Justice, L. (2020). Low-cost teacher-implemented intervention improves toddlers’ language and math skills. Early Childhood Research Quarterly, 53, 64–76. Retrieved from https://doi.org/10.1016/j.ecresq.2020.03.001
Bleses, D., Klyvø, L., Willemsen, M., & Boisen, L. (2022, February). Hovedresultater fra forskningsprojektet READ i plejefamilier. TrygFondens Børneforskningscenter.
Bleses, D., Moos, M., & Boisen, L. A. (2020). Hovedresultater fra forskningsprojektet VLS+. TrygFondens Børneforskningscenter.
Bleses, D., Trecca, F., Højen, A., Justice, L., Slot, P., & Purtell, K. (2025). Effects of an infant/toddler intervention at 1-year follow-up: Sustained impacts to preschool entry. Educational Researcher, 54(1), 21–33.
Bleses, D., Vind, B., & Jensen, A. (2024, January). Effekter af læseleg i vuggestuen og dagplejen.
Damm, A. P., Mattana, E., Nielsen, H. S., & Rouland, B. (2021). Academic achievement and wellbeing of dual language learners: Evidence from a busing program. Journal of Urban Economics, 126, 103358. Retrieved from https://doi.org/10.1016/j.jue.2021.103358
Gissel, S. T., & Andersen, S. C. (2021). A cluster-randomized trial measuring the effects of a digital learning tool supporting decoding and reading for meaning in grade 2. Journal of Computer Assisted Learning, 37(2), 287–304.
Guul, T. S. (2018). The individual-level effect of gender matching in representative bureaucracy. Public Administration Review, 78(3), 398–408. Retrieved from https://www.jstor.org/stable/26648896
Harrer, M., Cuijpers, P., Furukawa, T. A., & Ebert, D. D. (2021). Doing meta-analysis with R: A hands-on guide (1st ed.). Chapman & Hall/CRC Press.
Hvidman, C., Koch, A., Nafziger, J., Nielsen, S. A., & Rosholm, M. (2020). An intensive school-based learning camp targeting academic and non-cognitive skills evaluated in a randomized trial (Technical report). IZA – Institute of Labor Economics. Retrieved from https://www.jstor.org/stable/resrep61202
Jakobsen, M., & Andersen, S. C. (2013). Coproduction and equity in public service delivery. Public Administration Review, 73(5), 704–713. https://www.jstor.org/stable/42002998
Nandrup, A. B. (2016). Do class size effects differ across grades? Education Economics, 24(1), 83–95. Retrieved from https://doi.org/10.1080/09645292.2015.1099616
Nielsen, S. A. (2023). Boys left behind: The effects of summer camp and follow-up strategies on academic, personal, and social competencies. Economics of Education Review, 93, 102370. https://doi.org/10.1016/j.econedurev.2023.102370
Rosholm, M., Hvidman, C., Nielsen, S., Gumede, K., Nafziger, J., & Koch, A. (2020, March). Turboforløb til ikke-uddannelsesparate elever i 8. klasse: Afsluttende rapport. Trygfondens Børneforskningscenter.
Rosholm, M., Mikkelsen, M. B., & Gumede, K. (2017). Your move: The effect of chess on mathematics test scores. PLoS ONE, 12(5), e0177257.
Rosholm, M., Mikkelsen, M. B., & Svarer, M. (2019). Bridging the gap from welfare to education: Propensity score matching evaluation of a bridging intervention. PLoS ONE, 14(5), 1–20. https://doi.org/10.1371/journal.pone.0216200
Rosholm, M., Nielsen, S. A., Hvidman, C., et al. (2020). Effektevaluering af tre intensive læringsforløb. TrygFondens Børneforskningscenter.
Rosholm, M., Tonnesen, P. B., Rasmussen, K., Overgaard, S., Færch, J. V., Malm, S. G., & Harder, J. (2025). A tailored small group instruction intervention in mathematics benefits low achievers. npj Science of Learning, 10(1), 18. Retrieved from https://doi.org/10.1038/s41539-025-00310-9
Rosholm, M., Vind, B. D., Laursen, N. B., Lomholt, J. J., & Nielsen, S. A. (2019). Evaluering af skolerettede og skoleunderstøttende indsatser i projekt “Styrket faglighed blandt udsatte børn i folkeskolen”.
Svarer, M., Rosholm, M., Havn, L., & Høeberg, L. (2014). Evaluering af mentorindsats til unge uden uddannelse og job. Rambøll.