Annex 4: Carbon stock and sink data of trees in urban areas in the context of building climate reporting
Alam Ashraful
Natural Resources Institute Finland (Luke)
IVL Swedish Environmental Research Institute
IVL Swedish Environmental Research Institute
IVL Swedish Environmental Research Institute
Natural Resources Institute Finland (Luke)
Natural Resources Institute Finland (Luke)
Natural Resources Institute Finland (Luke)
Natural Resources Institute Finland (Luke)
Summary
There is a need to add vegetation data to Nordic construction databases, as the carbon sequestration capacity of trees and other vegetation may play an important role in urban area carbon balance estimates. This report aims to produce suitable and usable life cycle and carbon stock change estimates for urban trees for the greenhouse gas (GHG) emission databases used for construction. This report also assessed how different operational scenarios increase or decrease the carbon sink urban trees produce.
Carbon sequestration of trees and even commonly used tree species depends on local conditions. This report aims to produce an example of practice for a limited area. The data used in this report are urban tree data collected in the i-Tree projects in southern Finland and Sweden. The calculation method and results of the report can be used as an example to calculate results in other countries or regions.
An assessment for three scenarios was produced, considering the changes for an individual tree if it is planted, removed, or remained in the construction area. The estimates considered the biogenic carbon sequestration and the life cycle GHG emissions from nursery production, planting, maintenance, and tree removal over a 50-year time period, representing a default building service life.
The results show that over a 50-year period, the amount of carbon sequestered by trees is significantly higher than greenhouse gas (GHG) emissions from planting, maintaining, or removing a tree. Conversely, soil composition is the main determinant of life cycle GHG emissions.
The highest carbon sink is achieved when existing trees are not cut and remain in the area during construction. Removing trees results in the highest GHG emissions but can be partly compensated by planting new trees and creating a new carbon sink. However, the results in this report are gross simplifications based on assumptions and should be interpreted as indicative figures.
Introduction
The importance of green areas in an urban environment
Urban trees and vegetation offer crucial ecosystem services, including carbon storage. The changes in the carbon stocks in the biomass of living trees may constitute a significant number of the changes in the carbon stocks of urban areas, including living vegetation and changes in carbon stocks of dead biomass and soil. Therefore, information on carbon stock and greenhouse gas (GHG) data of the green areas of the built environment, such as yards, parks, and street trees, needs to be added to the Nordic construction databases used for building reporting and certification. These databases are based on the Life Cycle Assessment (LCA) methodology, where the contribution to climate impacts is transformed into a Global Warming Potential (GWP) indicator result.
The importance of urban green spaces as part of meeting the goals of carbon neutrality and carbon negativity encourages considering the role of green spaces in the context of the LCA of buildings. The effects of greenhouse gas (GHG) balance for land use from vegetation have significant implications for urban areas as a potential carbon sink. Assessments of the GHG balance from land use in urban areas enable the possibility of including the carbon sink in forests and soil in strategic climate work and the general planning process (Lindahl & Lundblad, 2022).
The carbon sequestration potential of green areas in an urban environment and their capacity of green spaces to offset fossil fuel emissions in cities can be significant. For example, in the Stockholm municipality, the carbon sink in forests and soil was estimated to be -35 kt CO2e per year, corresponding to slightly below 2 t CO2e per hectare per year (Lindahl & Lundblad, 2022). Compared to the carbon sequestration of approximately 23 million hectares of productive forests in Sweden, the forests sequester about 32 000 kt CO2 per year, i.e., about 1.4 t CO2e per hectare per year (Swedish Environmental Protection Agency, 2022). Absorption of carbon dioxide by the living biomass of trees accounted for most of the carbon sink compared to another type of planting and species (Erlandsson et al., 2022).
A modelling study (Havu et al., 2024) shows that urban green spaces sequester 5.9 t CO2 annually in Helsinki. However, the greatest sequestration potential was found in urban city forests, where the sequestration reached up to 11 t CO2 per year. Thus, urban green spaces can offset 7 % of the anthropogenic emissions of Helsinki (Havu et al., 2024). A few other studies in the United States and Southern Europe confirm the role of green spaces in offsetting emissions, with urban green spaces vegetation sequestering 2%–6% of fossil fuel emissions (Hardiman et al., 2017; Vaccari et al., 2013).
The high carbon sequestration capacity of urban green spaces encourages the inclusion of vegetation in climate planning. In the City of Malmö in Sweden, a carbon budget that includes vegetation is established (Råberg, 2022). This carbon budget is used to set goals for different GHG sources for 2030; in that context, different pathways are outlined to achieve these climate goals, as Figure 1 illustrates.
Figure 1 The various categories’ share of the total potential for increased carbon storage by 2030. The opportunities are highest in housing construction and crop cultivation in Malmö’s conditions (Råberg, 2022).
The work done in Malmö concludes that several possibilities exist to increase carbon storage and annual carbon sequestration and achieve several other benefits simultaneously. The main result of the analysis is that the greatest potential for increased carbon sequestration is in the construction sector and crop production by 2030. These two categories account for 85% of the increased potential from 2022 to 2030 (Figure 1).
The Nordic countries are working on regional carbon neutrality ahead of the European Union’s goals. For example, Finland aims to be carbon neutral by 2035 and is developing a set of policies, including legislation for low-carbon construction. Also, the Nordic declaration on low-carbon construction by Nordic ministers for construction and housing set a goal for the built environment. It is noticed that vegetation is not part of any regulated climate declaration for buildings in the Nordic countries, but it is likely that in accordance with the new Energy Performance of Buildings Directive (EPBD), reporting carbon sinks in the construction or on the building is possible.
Even if no climate declaration requires it, it can always be reported as supplementary information. Numerous challenges appear when urban green spaces are accounted for with a building’s LCA and its surrounding area. An example of vegetation’s contribution to a building and its surrounding vegetation is described in (webpage link the Fælledby project). In this case study, vegetation is compared to different parts of a building’s climate impact over the life cycle, as Figure 2 shows. The calculation is performed by Henning Larsen architectural firm and includes carbon sequestration for vegetation using the ClimatePositiveDesign database for “The North Growth Zone” (webpage link Urban Forestry Network). The proposed scenario has a carbon footprint for buildings and infrastructure of 8.9 kg CO2 m-2 year-1, but the carbon sequestration of trees and non-mowed lawns reduces it by 0.35 kg CO2 m-2 year-1, i.e., 4 % of the total life cycle impact.
Figure 2 Climate declaration of the Faelledby building where the impact is divided into building parts; hardscape and landscape. The landscape includes trees and roof sedum (Hermansdorfer et al., 2023).
The Fælledby project example calculation of the biogenic carbon sequestration potential of vegetation shows that trees are, by far, the biggest contributor to any carbon sink effect. All other urban vegetation is negligible or sometimes even increases the overall carbon footprint, e.g. intensive green roofs, due to maintenance-related emissions (Hermansdorfer, 2024).
Harmonisation of life cycle assessment methodology
In the declaration, Denmark, Finland, Iceland, Norway, and Sweden agreed to collaborate on a common life cycle assessment (LCA) approach to buildings. One challenge that is discussed more often is harmonising the LCA methodology since different regulations and standards have different rules for calculating the life cycle impact assessment. A survey conducted in the Nordic Climate Forum by the Swedish Life Cycle Center (2019) showed that over 90% of the respondents (100 participants) would like to have a harmonised methodology, including a common Nordic database for a built environment.
On the possibility of including a vegetation stock change in building a life cycle assessment
Biogenic carbon accounted for in Environmental Product Declarations
In the context of reporting the environmental performance of products are so-called Environmental Product Declarations (EPD), which are launched and commonly used. EPD are for business-to-business and business-to-costumer communication and internationally standardised in ISO 14025. Compared to a traditional life cycle assessment (LCA), EPDs are divided into different information modules that can be added to a full life cycle if such data are reported. In many applications, only the cradle-to-gate data (A1-3) is used from EPD in an LCA calculation; the other information modules are just illustrative examples of what a full life cycle can look like.
EPD for construction products is suggested to be mandatorily reported for any product that falls within the forthcoming constructing product regulation (CPR) and for new buildings, according to the new Energy Performance Declaration Directive (EPBD) to be launched in 2024. This kind of communication product is based on an attributional LCA, meaning the results, like statistics, shall, in theory, be able to add up the environmental impact from, e.g. all new buildings based on the LCA result A1-5; the sum will be the same as in national statistics for new buildings, i.e. if a life cycle approach was used in the statistics. The product category rules for building follow EN 15804 and adds regulations on all aspects needed for a building and its life cycle. Notably, the prEN15978 includes “Vegetation and soft landscaping” as a potential building element of external works.
The current impact assessment of climate impact in EPD used for construction products and buildings (EN 15804 and ISO 15978) is not strictly scientifically adopted. The impact assessment of the Global Warming Potential (GWP) is based on well-established scientific characterisation factors, which are based on radiative forcing that have been integrated for over 100 years. However, the problem in EPD is that this impact category, the GWP, is also complemented with a physical life cycle inventory flow of biogenic carbon that is added to the GWP indicator based on the so-called 1 kg biogenic CO2 that is equal to -/+1 kg CO2e, where the “e” transforms it to an impact assessment result. The photosynthesis and, thereby, the sequestration of carbon dioxide is accounted as -1 kg CO2e; when released as emission or recycled into a new product system at the end of its life, it is the same amount of carbon as in an emission of +1 kg CO2e.
According to EN 15804 and EN 15978, this GWP-biogenic indicator accounts for GHG gases arising from biogenic carbon and the carbon stored in the assessed product and its packaging material. However, the general calculation rule says that such inherent properties as biogenic carbon in a material cannot be allocated away. The calculation rule implies that the ‘real GWP indicators’ based on radiative forcing are added with the biogenic carbon stored in the product and its packaging. This -1/+1 kg CO2e calculation rule is in the calculation rules combined with the fact that the sum of biogenic carbon in the product and its packaging material shall always be zero when summed over the entire life cycle (from A to C). If not, an error was made in the calculation and needs to be corrected.
Altogether, this means the modular approach in EN 15804 and EN 15978, where the result can be compared module by module, is lost. A GWP indicator that includes an accounting of this physical flow of biogenic carbon can only be compared if a full life cycle is considered since this biogenic carbon is then balanced out. In EPD International and EPD Norway, an indicator referred to as GWP-GHG, respectively, GWP-IOBC, is introduced; all biogenic GHG emissions are accounted for except biogenic carbon stored in the product or its packaging material that is directly balanced out. GWP-GHG is used in Finland and Sweden, for example. In Sweden, this is required to make a limit value possible where the construction stage (A1-5) defines the current climate declaration and suggested future limit value.
Biogenic carbon accounted for forestry and vegetation in EPD
There is no explicit method for accounting for vegetation in an EPD, but specifications are given for forestry, which must be considered in this context. Complementary Product Category Rules (cPCR) for wood and wood-based products are defined in the standard (EN 16485) that complements the core PCR for all construction products and services, as established in EN 15804. The calculation rule is, in brief, that biogenic carbon from non-native sources/forests is accounted for based on the -1/+1 kg CO2e calculation rule and reported to the GWP-biogenic indicator, meaning the sum is always zero over the life cycle (i.e. carbon dioxide neutral), while harvest wood from native forests is considered fossil where the -1 kg CO2e from sequestration is unaccounted for and reported as an impact of 1 kg CO2 from non-sustainable sources and is equal to 1 kg CO2e in the GWP-luluc indicator. This means that wood from non-sustainable forests has no sequestration accounted for, so the CO2 emitted will be accounted for as if they were fossils.
Also, specifications concerning the accounting of LULUC (Land Use and Land-Use Change) can be found in the EN 15804 standard:
“Any biomass-based net increase in carbon stocks, including soil carbon uptake (accumulation), shall not be considered in GWP-luluc and is set to zero. Soil carbon storage may be included as additional environmental information when proof is provided.”
Altogether, it is recognised that carbon sink and stock changes from vegetation must be reported separately in an EPD. Therefore, the approach here is to report the biogenic carbon sink and stock changes to GWP-luluc as a separate indicator. Supporting processes for nursery, planting, and gardening are also accounted for separately and mostly contribute to GWP-fossil. The climate impact indicator that needs to be declared by the Energy Performance Directive is named ‘life-cycle GWP’ and is equal to the GWP-total, consisting of the sum of GWP-fossil, GWP-biogenic, and GWP-luluc.
Factors influencing carbon sequestration and storage in urban trees
Trees absorb carbon dioxide (CO2) from the atmosphere through photosynthesis and convert it into organic carbon. The carbon is then stored in tree components: the wood, leaves, bark, and roots (Thomas & Martin, 2012). This process of capturing carbon dioxide is known as carbon sequestration. Several factors influence the ability of urban trees to sequester and store carbon, each playing a role in determining the effectiveness of trees to act as carbon sinks. These factors include the species of the tree, age and size of the tree, and tree health and maintenance (Nowak et al., 2013). The local climate, length of the growing season, soil quality, and urban environmental stressors also affect the trees’ capability to absorb carbon (Toochi, 2018; Czaja et al., 2020).
Tree species affect carbon storage and sequestration due to variations in photosynthetic rate, growth rate, longevity, wood density, and other physiological characteristics (Tootchi, 2018). Among these factors, the photosynthetic rate directly affects a tree’s ability to produce energy for growth and development. Trees typically have different growth rates at different stages of their life cycle. Young trees often have a rapid growth rate – a phase of vigorous carbon absorption – which slows down as they reach maturity (Litvak et al., 2003; Toochi, 2018; Smith et al., 2019). The growth rate can also vary yearly depending on environmental conditions (Rossi et al., 2006).
The longer a tree lives, the more carbon it can store throughout its lifetime. An urban environment can be harsh for a tree to grow, leading to shorter life expectancies than those in a natural environment. The lifespan of street trees is often considerably shorter than that of trees in parks. The Finnish Tree Care Association has estimated the life expectancy of urban trees in Finland (personal communication). Common tree species known for their longevity include the Scots pine (Pinus sylvestris), English oak (Quercus robur), common lime (Tilia x europaea), and European ash (Fraxinus excelsior). In contrast, species with shorter lifespans, such as the grey alder (Alnus incana) and rowan (Sorbus aucuparia), generally accumulate less carbon during their lifetimes.
Local environmental conditions also influence trees’ effectiveness in absorbing carbon. Each tree species typically thrives within a specific range of these conditions. Specialist species often have narrow tolerance ranges and may struggle to compete effectively outside of these, especially in extreme conditions like deep shade or drought. In addition to light and water, the availability of nutrients can also constrain tree growth. Climate factors, such as temperature and rainfall, directly impact tree growth and carbon uptake. The most common environmental stressors for trees in an urban environment include limited soil volume, drought, compacted soil, air pollution, and lack of oxygen to the roots – all of which can adversely affect a tree’s health and its capacity for carbon absorption (Czaja et al., 2020). Urban trees are also prone to damage in connection with transportation and vandalism (Czaja et al., 2020).
Additionally, the maintenance of urban trees influences their ability to sequester and store carbon (Vogt et al., 2015). Healthy and well-maintained trees can absorb and store more carbon over their lifespan than neglected trees. Regular maintenance, especially adequate watering during the rooting phase and extended drought periods, as well as appropriate pruning, is critical to keep trees healthy and extend their lifespan.
Objectives of this report
This report aims to create a simplified life cycle carbon balance approach and provide example data to account for the carbon balance of the living biomass in individual trees in an LCA or EPD for a whole life cycle building climate declaration. Besides the carbon stock change, this article lists the GWP indicator results for the processes or activities needed for vegetation, with a special focus on large trees. Another objective is to use example data for urban trees based on the latest research from available reporting from ongoing i-Tree projects for selected cities from Finland (Helsinki, Turku, Tampere) and Sweden (Malmö, Gothenburg, Umeå). Besides LCA scenarios and data, two different approaches for urban tree carbon sink and stock calculation are presented: Approach 1 assesses the changes in the carbon stock resulting from the individual urban trees that are felled, retained, and planted in the construction area over a 50-year period and produces generalised values for the construction emission database combined with life cycle assessment results; 2) Approach 2 provides species-specific equations to support quantifying carbon sequestration of the living biomass by trees.
Materials and methods
i-Tree source data
Carbon sequestration and storage in urban trees were estimated using the i-Tree Eco software (v.6.0.32) and its Forecast model. I-Tree Eco uses peer-reviewed model equations based on long-term research to estimate the ecological benefits of urban trees, including carbon sequestration and carbon storage. It considers various factors such as species, size, local environmental conditions, and growth patterns to provide these estimates. Key outputs include estimations of the urban forest’s composition, biomass, and the ecosystem services it provides, such as air pollution removal, carbon storage, and carbon sequestration. The Forecast model, an extension of i-Tree Eco, enables long-term projections of these benefits. It simulates future growth and the development of urban trees under various management and environmental scenarios. Nowak (2021) described the methods for the calculations.
Biomass equations, combined with growth models, can predict how a tree’s biomass and carbon storage capacity will change over time. The biomass equations used in the i-Tree Eco software (Table 1) are similar to other commonly used biomass equations. Since no specific biomass equations exist for urban trees, i-Tree uses forest-derived equations as proxies. These equations from forest trees should provide reasonable estimates for urban trees, although some differences will likely exist. If no species-specific biomass equations are available, i-Tree uses an average from equations of the same genus. If genus-level equations are also unavailable, the software then uses the average from the next phylogenetic level. For a detailed explanation of the model, see Nowak (2021).
Species | Equation | A | B | C | D | E | F |
Picea abies | Y=A+Bx+C2X+D3x+E4x+F5x | 10 | -1.3638 | 0.4216 | 0.0041 | -3E-05 | 1E-07 |
Pinus sylvestris | Y=A+Bx+C2X+D3x+E4x+F5x | 1.5 | -0.8569 | 0.3074 | 0.003 | -3E-05 | 1E-07 |
Populus spp. | Y=e(A + B * Ln(X) + (C/2)) | -2.28909 | 2.44837 | 0.01442 | |||
Prunus serotina | Y=e(A + B * Ln(X) + (C/2)) | -2.00442 | 2.44771 | 0.03475 | |||
Quercus rubra | Y=e(A + B * Ln(X) + (C/2)) | -2.07550 | 2.42949 | 0.07839 |
Table 1 Example equations for calculating the total dry weight biomass of individual trees of different species. x = DBH in cm; Y= total tree dry weight biomass in kg
Parameters for forecasting change in carbon stocks
In Approach 1, the Forecast model from the i-Tree Eco software was used to predict how carbon sequestration and stock for urban trees would develop over time in Finland. The modelling was restricted to Southern Finland, as no weather data were available in the i-Tree Eco for any cities in Northern or Eastern Finland. In the analysis comparing the same set of tree species and conditions in Helsinki, Turku, and Tampere, no significant differences were found in the carbon sequestration and storage capabilities of urban trees across these cities. Notably, the species selection for Northern Finland would be much more limited, and there would be differences in the trees’ abilities for storage and sequestration as they would sequester and store somewhat less carbon than trees in Southern Finland. For the final results, data from Turku was chosen for this study as it represented a median between Helsinki and Tampere.
The 30 most common urban tree species identified from the tree databases of the cities of Helsinki and Turku were selected for the simulation. Different health and light conditions were used to more accurately model the actual conditions (see examples in Figure 3). For each species, three health conditions were defined: excellent, good, and fair. According to i-Tree, ‘excellent’ means no dieback, ‘good’ indicates a 1%–10% dieback, and ‘fair’ indicates a 10%–25% dieback in the crown. The simulation also included the growth of these species under various lighting conditions, ranging from complete shade, where the crown receives no direct sunlight, to fully open spaces, where the crown is exposed to direct sunlight from all sides. Altogether, 18 individual trees grown under different environmental conditions were modelled for each species. The carbon storage and sequestration values for each species are averages of these results.
Figure 3 Examples of how varying health and light conditions affect the annual growth and carbon sequestration of Norway maple trees over their lifetime as modeled with i-Tree. Tree1, in excellent canopy health, receives light from all directions. Tree2, with fair canopy health, also receives light from all directions. Tree3 has good canopy health and receives light from three directions. Tree4, despite being in excellent health, is in complete shade. Tree5, with fair canopy health, is similarly in complete shade.
The Forecast model in i-Tree Eco is limited to predicting tree growth up to 100 years. Since some trees live longer, running two consecutive simulations was necessary. The first simulation predicted the growth for the initial 100 years after planting. The second simulation continued from where the first one ended, covering the following 100 years. This approach helped calculate carbon storage accumulation for trees older than 100 years. The maximum age estimate for each species considers the expected lifespan of a tree planted in appropriate urban environments. This approach aims to provide a realistic average lifespan, excluding exceptionally short or long lifespans.
One objective was to create a simplified life cycle carbon balance for individual trees for the Finnish Emissions database. This data was expected to be represented as a single, generalised value. However, grouping tree species into very general but representative and as similar groups as possible proved challenging due to the inherent diversity and variability among different species. One seemingly straightforward method for grouping could have been based on tree species’ potential maximum height. This approach would have been easily understood by, distinguishing tall tree species from low ones. However, a comparison between the carbon stock and the height of the trees showed that carbon storage is not necessarily dependent on height. Therefore, using height as a criterion for grouping tree species was neither viable nor effective. Other factors considered were growth rate, maximum carbon storage capacity, and botanical groups (broadleaf/conifer). Ultimately, only the botanical groups were used as the criterion for grouping, and the carbon-cycle balance was calculated individually for each of the 30 species.
In Approach 2, the original data for the species-specific equations was obtained from the project i-Tree Sverige (Deak Sjöman & Östberg, 2020) and were sampled in 2018 in three cities in Sweden: Umeå, Malmö, and Gothenburg. Values for tree growth and tree carbon sinks were obtained using the program i-Tree Eco.
The i-Tree tool reports carbon sequestration and storage in kilograms of carbon (kg C). A standard conversion factor of 3.6663 was used to convert this into the weight of carbon dioxide (CO2). This ratio represents the molecular weight relationship between CO2 and carbon, allowing for translating sequestered carbon into the corresponding amount of CO2. Translating i-Tree results from C to CO2 aligns with global standards for climate reporting.
Possible operational tree scenarios on the construction site
When construction starts on a plot, the trees onsite can be removed or retained; new trees might also be planted. Trees were categorised into three distinct groups – planted trees, remaining trees, and removed trees – to reflect an estimated average potential change in tree cover to facilitate decision-making based on a simplified approach regarding trees on construction sites. This classification helps calculate their net carbon balance at different stages, which is essential for understanding their total contribution to carbon sequestration and storage.
Planted Trees. This category includes all new trees that were planted on a plot after construction work has been completed. Strategic planting of new trees is essential for maintaining and increasing the carbon storage potential of urban areas, especially if any trees were removed during construction. This category focuses on the carbon sequestration potential from the planting until age 50.
Urban tree planting sizes vary depending on the species and purpose of planting. Based on information from Finnish cities for this study, broadleaf yard trees have a trunk circumference of 10–12 cm (DBH: 3.2–3.8 cm) at the breast height, park trees 14–20 cm (DBH: 4.5–6.4 cm), and street trees 18–24 cm (DBH: 5.7–7.6 cm) when planted. In exceptional cases, street trees can be even larger. Conifers, which are usually planted smaller than broadleaf trees, are sized by height rather than circumference. Typical planting sizes for conifers are 120–150 cm for yard trees and 175–300 cm for park and street trees. Since most of the planted trees are broadleaf, the initial planting size for the model was set to a diameter of 5 cm at breast height, reflecting the average size used in urban tree planting in Finland.
First, the current carbon storage and sequestration rates of planted trees were modelled. To determine how much carbon, on average, each species is expected to sequester, the increase in carbon storage over the 50-year period was calculated. This total increase was then divided by 50, giving the average annual rate of carbon sequestration for each species.
Remaining trees. The category consists of trees that were on a plot before construction started and were not removed during construction. The ages and sizes of the remaining trees can vary greatly, leading to large variations in the trees’ carbon stocks. The trees were divided into several size classes based on their diameter at breast height (DBH), with the average carbon storage calculated for each class to achieve more precise estimates of carbon storage and sequestration for database end-users. The remaining trees were expected to grow for the next 50 years or until they reached their species-specific maximum lifespan. A tree’s maximum DBH, and, consequently, its carbon storage capacity, was linked to its lifespan. Thus, if the DBH indicated a tree had reached its full size and maximum carbon storage capacity, the carbon storage size was not projected to increase further. The difference between the projected carbon storage in 50 years and the current carbon storage was determined and then divided by 50 to calculate the average annual gain in carbon sequestration over 50 years.
Removed Trees. The category includes trees that were cut down during construction. Removing trees for construction projects can significantly impact carbon stock and sequestration potential in urban areas. When felled, the stored carbon might be released back into the atmosphere, either quickly when used for energy or over a longer period through wood product usage or natural decomposition. The emission from the decay of below-ground parts after removal has not been quantified in this study. Also, its potential to sequester carbon in the future is lost, meaning the beneficial impact the tree would have had on reducing atmospheric carbon levels over its remaining lifespan is missed.
Like the trees that remain on site, removed trees can vary greatly in age and size, leading to different amounts of carbon stored in biomass. For more accurate estimates of carbon storage, these trees were categorised into several size classes based on their DBH, and the average carbon storage for each size class was calculated. For the database, the current carbon stock of trees was projected to be what it would be in 50 years. This total carbon stock was then used to calculate the annual loss in carbon stock by dividing it over the 50-year period.
Data collection for the life cycle assessment
For the life cycle inventory (LCI), extensive data were collected from a variety of sources. Information on the composition of the commonly used soil substrate and tree maintenance measures was collected from the authorities in Helsinki, Turku, and Tampere (personal communication). Secondary sources, e.g. published literature, were also used where appropriate. Tree data were needed to calculate volumes and the dry matter of tree trunks and other biomass components. These data were obtained from the i-Tree model simulation for the most typical urban tree species grown in Southern Finland. Various background data, e.g. energy, waste disposal, and transport, were included in the calculation and taken from the Ecoinvent 3.7 LCI database, which contains regional energy and material mix data.
Global warming potential process data based on life cycle assessment
The calculation was based on various assumptions about typical urban tree-related patterns.
Seeding production in nursery. Seeding production in the nursery includes seedlings grown in a greenhouse gas chamber, use of fertilisers (e.g. lime, peat, ammonium, potassium, phosphorus), and a polypropylene pot for seedlings. Electricity and heat needed for the activity are included. Table 2 details the use of fertilisers, electricity, and heat needed.
Substrate and soil preparation for planting. The planting of urban trees was assumed to be carried out by an excavator, digging a so-called planting pit with dimensions of 2 m x 2 m x 0.8 m, or 3.2 m3, and using a spacing lane with a width of 3 m and the planting of large trees 10 m distance apart. For the growth base, a minimum substrate required is 25 m3 of soil for the street tree, including 1 m3 of peat for the park and street trees. The growth base is a mixture that uses 100–200 mm excavated local granite (ca. 70 volume %) as a support structure and 25% of soil substrate comprised of 15% biocarbon and 10% infrasoil. Ready-made growth bases are used. The most common brands used are Inframulta or Puutarhamulta from TerraWise. Bark or wood chips are spread around the planted seedling in a 10 cm layer; after planting, 1 m2 of wood chips are added once every five years. The growth base mix used in this study fulfils the requirements of the Finnish Association of Landscape Industries (VYL) and General Quality Requirements for Construction (InfraRYL).
Planting and maintenance. Fertilising and liming are done when the area is founded with the growth base mix. Fertilising (e.g. lime and dolomite-lime) and maintenance (e.g. pruning and trimming) are done during a tree’s development. Pruning is done every 3–5 years, and work includes 30–45 minutes per young tree to 90 minutes per mature tree.
Harvesting. Trees are harvested at year 50, and harvesting is done by a typical harvester used in Finland. The harvested wood is transported to a factory about 50 km away. The harvested wood is dried (naturally), chipped using a wood chipper, and is used for energy; the amount of avoided emission generated is also calculated, but no option for long-lasting wood products is included in this study.
Leaf treatment. Leaf treatment is done to produce compost using the windrow composting process. The fuel and electricity needed for the process is 3 L diesel and 0.2 kWh of electricity per mg (or tonne) of fresh leaf (Andersen et al., 2010). The estimated average weight of fresh leaf is 25 kg dry matter for a broad-leaved tree and 21 kg dry matter for coniferous trees (data from i-Tree modelling). In the calculation, the moisture content is assumed to be 70% (Andersen et al., 2010), and the emission factor is 50 kg CO2e per mg of fresh leaves (Amlinger & Peyr, 2008). The system boundaries do not include the collection and transportation of waste leaves to downstream processes nor the substitution benefit of other composting materials.
Calculation of Global Warming Potential (GWP)
The life cycle impact assessment (GWP100) calculation is done separately for street trees and park trees in urban areas in Finland. For the modelling and calculating of the Global Warming Potential (GWP), the LCA software SimaPro version 9.2 was used by using the method GWP100 v1.02 (IPCC, 2021).
The GWP, commonly called the ‘carbon footprint’ (CF), assesses the potential impact of different gaseous emissions on climate change (IPCC, 2021). In this method, the potential impact of one kilogram of greenhouse gas is compared to the potential impact of one kilogram of CO2, resulting in kg CO2-equivalents (kg CO2e). This prediction uses a multiplier based on heat-trapping capability and atmospheric reactivity of various contributing gases over time. The International Panel on Climate Change (IPCC) uses several time horizons (20, 100, 500), but the most widely used is a 100-year, as we did in our calculation. An example of the CO2 equivalence index can be seen below, where 1 kg CO2, 1 kg CH4, and 1 kg N2O is:
CO2 equivalent kg = CO2 kg + (CH4 kg x 27) + (N2O kg x 273) = 301 kg CO2e
System boundary and functional unit
A single park or street tree is used as a functional unit. The average volume of a tree is estimated to be ca. 1 m3. The schematic diagram (Figure 4) shows the system boundary and the time horizon is 50 years. The calculation starts from seedling production in the nursery and proceeds through transporting, planting, and maintenance measures, and finally, harvesting and transportation to the yard of the power plant for energy generation. Freshly harvested wood is transported, dried naturally, and chipped at the plant. In addition, leaves in harvested trees are utilised to produce compost using the windrow composing process. The carbon and other greenhouse gases (kg CO2e) emitted during the life cycle are included in the calculation by consuming fuel, electricity, and other necessary means. Ultimately, heat generated from the harvested wood is credited.
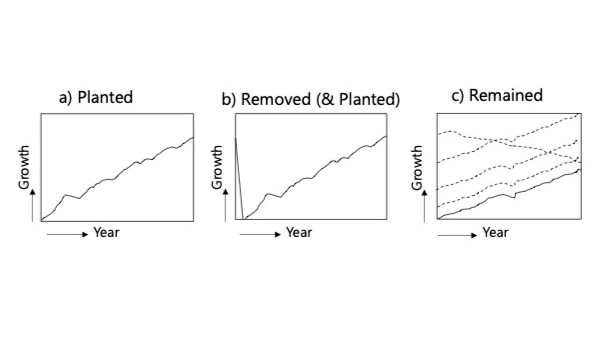
Figure 4 Diagram of system boundary showing tree growth over a 50-year time period for three used scenarios in this study: a) Newly planted trees, b) Trees removed from the site, and new seedlings are planted, c) Remaining trees on site
The calculation was carried out for three different scenarios, which were considered when calculating the carbon sink of trees for a 50-year time period according to Approach 1 (Chapter 3.1.). These scenarios are 1) planting a new seedling in the construction area, 2) removing trees from the construction area, or 3) leaving the trees in the construction area without cutting them during construction (Figure 4; also look at Chapter 2.3.). From the life-cycle assessment (LCA) perspective, the calculation for a newly planted tree (Figure 4a) is done, including the end-of-life phase of harvested trees. These results can be utilised in scenarios where trees are harvested and a new seedling is planted the same year, as Figure 4b shows. However, the emissions value for the remaining trees may vary considerably since trees are at various ages of their life. Estimating a single value is challenging from a life cycle methodological perspective if the age and dimension of each tree are unknown, because remaining trees may need specific maintenance measures depending on their life phase. In this calculation, we assumed the remaining tree is age 20 and was harvested at the end of the calculation period.
Results
Life cycle assessment for different scenarios
Seedling production
Table 2 shows the total carbon footprint of seedling production in the nursery, corresponding to 5 kg CO2e per seedling. The major emissions (4.3 kg CO2e) are sourced from using peat, heating of infrastructure, and electricity. Fertilisation emitted is 0.45 kg CO2e per seedling (Table 2).
Nursery seedling- 1 unit | Amount | Unit | GWP, kg CO2e |
Polypropylene pot for seedling | 1 | pc | 0.1440 |
Lime | 0.06 | kg | 0.0292 |
Peat | 7 | l | 1.2110 |
Ammonium nitrate, as N | 0.007 | kg | 0.0540 |
Potassium chloride, as K2O | 0.116 | kg | 0.0430 |
Dolomite lime | O.0158 | kg | 0.0075 |
Dolomite, at plant | 0.0158 | kg | 0.0004 |
Nitrogen fertilisation (direct emission) as N2O | 0.007 | kg | 0.0300 |
Nitrogen fertilisation (indirect emission) as N2O | 0.007 | kg | 0.0068 |
Single superphosphate, as P2O5 | O.0732 | kg | 0.1547 |
Potassium chloride, as K2O | 0.0943 | kg | 0.0348 |
Tree seedling production, in unheated greenhouse | 1 | p | 0.0341 |
Electricity, medium voltage | 3 | kWh | 1.3476 |
Heat energy | 21.3 | MJ | 1.8178 |
Total | 5.0021 |
Table 2 Global warming potential (kg CO2e) of nursery seedlings
Park and street tree
Total emissions over the 50-year are estimated at 237 kg CO2e for a park tree and 298 kg CO2e for a street tree (Table 3). This value corresponds to the life of the tree from seedling production until final harvest at year 50. The process emissions for energy generated from the harvested tree was 33 kg CO2e with a volume of 1 m3 (equal to the dry mass 500 kg m-3). If this value is assumed to be avoiding heat from fossil energy sources, the total emission is reduced to 204 kg CO2e for the park tree and 264 kg CO2e for the street tree (Table 3). It should be noted that neither the PCR rules EN 15804 nor EN 159768 accept attributional LCA, where substitution effects are accounted for during the life cycle of the assessed product or system. These figures are only given for additional information.
Table 3 also shows the emission values separately for different tree scenarios at the construction site. The values ranged 224-285 kg CO2e for the planted, 13 kg CO2e for the removed, and 197-199 kg CO2e for the remaining trees. These are indicative values, and careful consideration should be taken using the data since they are based on various assumptions and Finnish conditions. In addition, a comparison between the different scenarios may be incorrect due to differences in the time horizon. For example, in the case of removed trees, the emissions happen during the one year, while emissions for planted trees are considered in the 50-year time period.
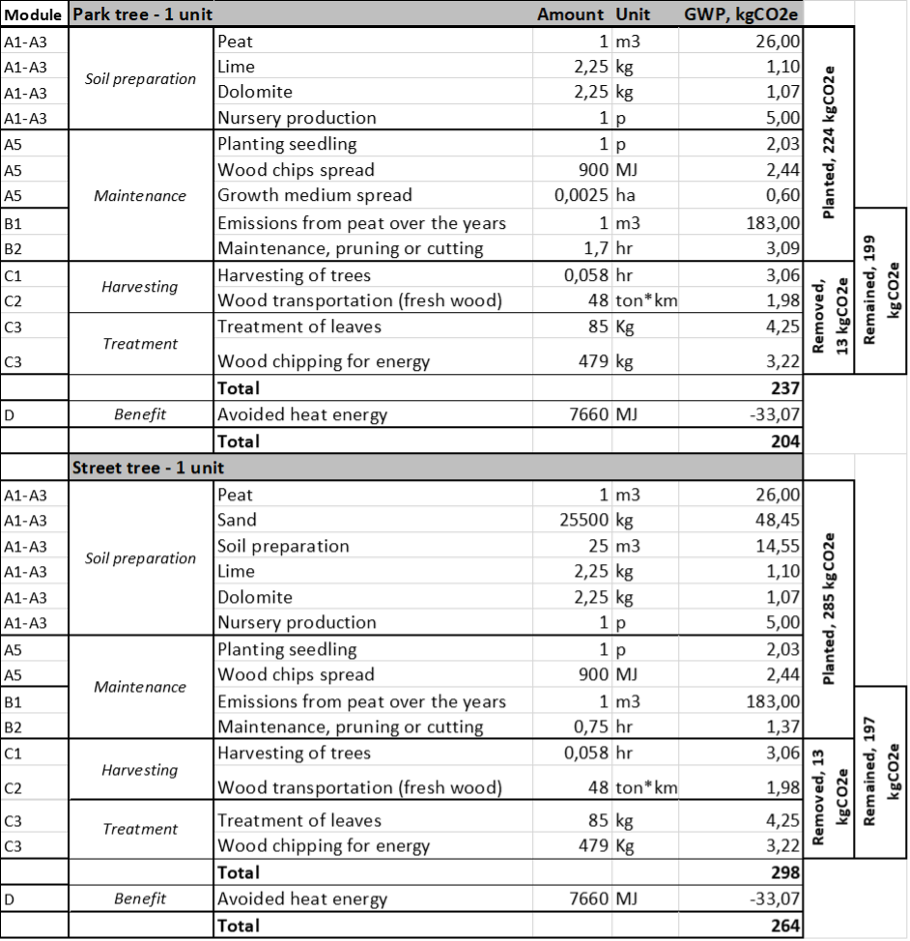
Table 3 Global warming potential (kg CO2e) of a park tree (A) and a street tree (B) over the 50-year lifespan. The values are added for planted, remained and removed trees, and allocated for modules according to EN 15804 and ISO 14025. Transportation of raw materials to the site (A5) is excluded due to low emissions values.
Carbon stock change estimates for different scenarios
Approach 1. Carbon stock change estimates for different scenarios
Planted trees
Planted trees showed significant variations in carbon sequestration and storage capabilities across different species over a period of 50 years after planting (Figure 5). Species-specific characteristics such as life expectancy and growth rate are key factors affecting how much carbon trees can sequester in 50 years.
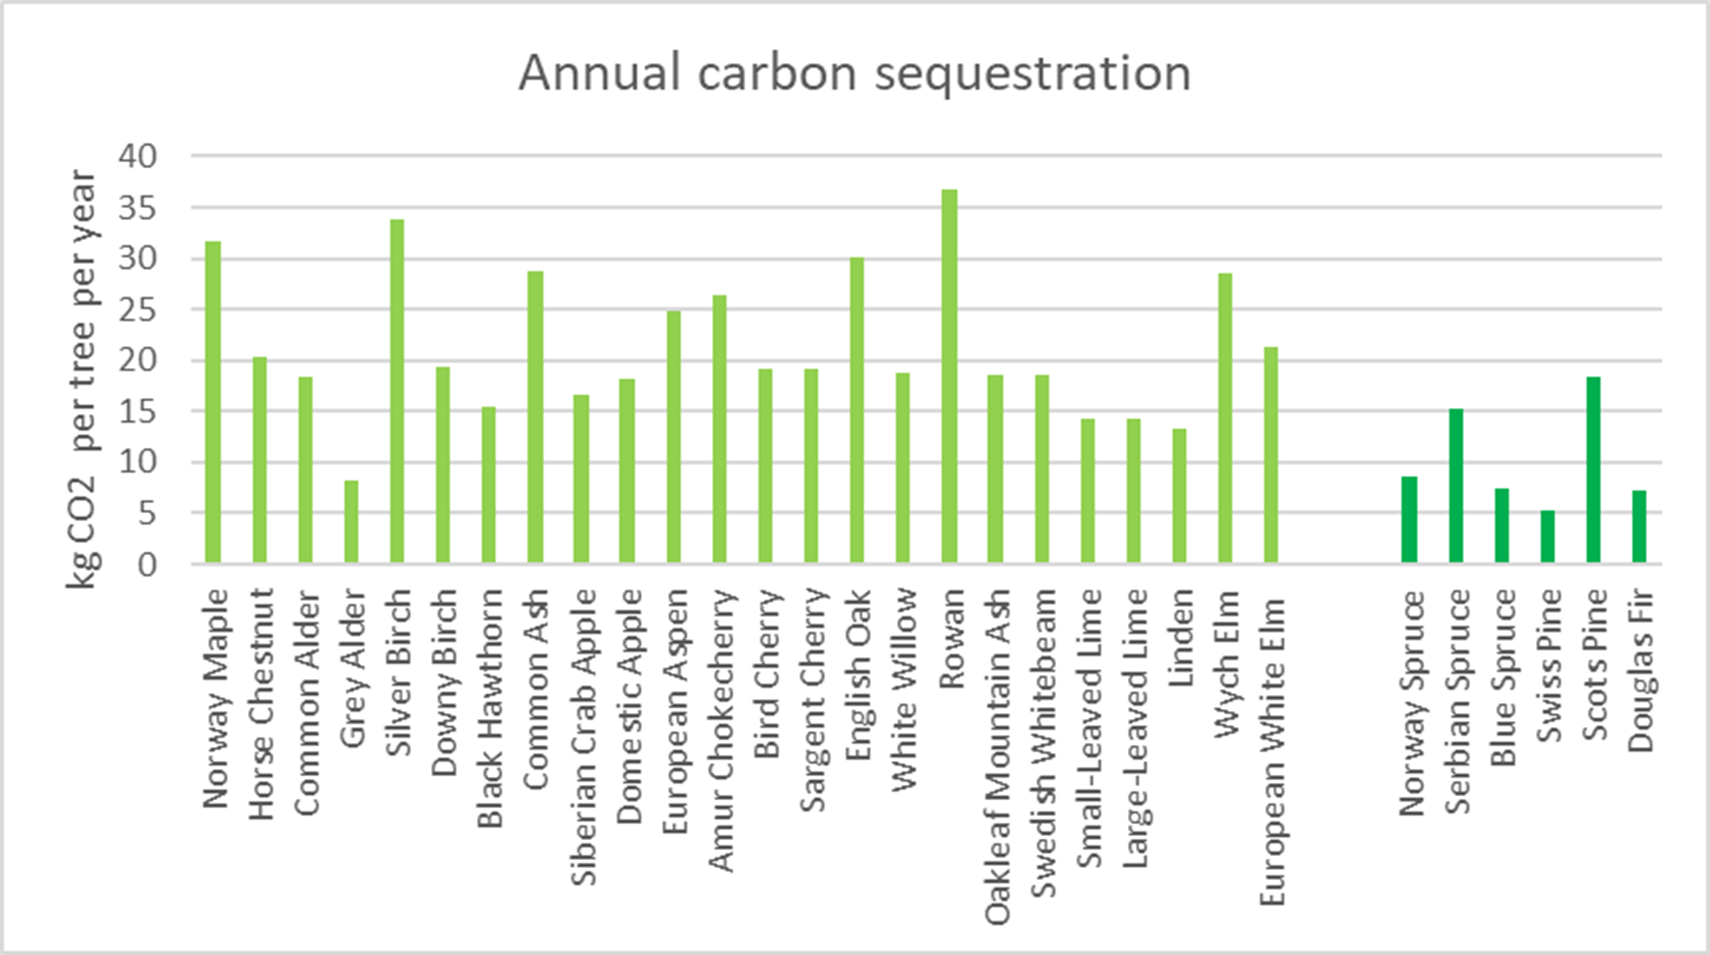
Figure 5 Annual CO2 sequestration (kg CO2) for individual trees varies widely across species. Light green indicates broadleaf trees; dark green indicates conifer trees
Some of the most efficient species in carbon sequestration during the first 50 years after planting were the Norway maple (Acer platanoides), silver birch (Betula pendula), and rowan (Sorbus aucuparia) (Table 4). These species stored an average of 430–500 kg of carbon over 50 years, giving an average annual carbon sequestration of around 9–10 kg C. In contrast, the grey alder, which has one of the lowest sequestration capacities, sequestered only about 110 kg C over 50 years, with an average annual carbon sequestration of only 2 kg C.
Broadleaf species | Scientific name | Life expectancy in years | Predicted carbon storage in kg of C | Average annual carbon sequestration in kg of C | Predicted carbon storage in kg of CO2 | Average annual carbon sequestration in kg CO2 |
Norway Maple | Acer platanoides | 100 | 432 | 9 | 1584 | 32 |
Horse Chestnut | Aesculus hippocastanum | 80 | 278 | 6 | 1018 | 20 |
Common Alder | Alnus glutinosa | 90 | 250 | 5 | 918 | 18 |
Grey Alder | Alnus incana | 40 | 113 | 2 | 415 | 8 |
Silver Birch | Betula pendula | 90 | 462 | 9 | 1695 | 34 |
Downy Birch | Betula pubescens | 80 | 263 | 5 | 964 | 19 |
Black Hawthorn | Crataegus douglasii | 70 | 210 | 4 | 771 | 15 |
European Ash | Fraxinus excelsior | 150 | 391 | 8 | 1434 | 29 |
Siberian Crab Apple | Malus baccata | 80 | 227 | 5 | 831 | 17 |
Domestic Apple | Malus domestica | 80 | 247 | 5 | 905 | 18 |
European Aspen | Populus tremula | 70 | 340 | 7 | 1245 | 25 |
Amur Chokecherry | Prunus maackii | 60 | 359 | 7 | 1317 | 26 |
Bird Cherry | Prunus padus | 60 | 262 | 5 | 962 | 19 |
Sargent Cherry | Prunus sargentii | 60 | 262 | 5 | 962 | 19 |
English Oak | Quercus robur | 200 | 411 | 8 | 1506 | 30 |
White Willow | Salix alba | 70 | 257 | 5 | 942 | 19 |
Rowan | Sorbus aucuparia | 50 | 502 | 10 | 1841 | 37 |
Oakleaf Mountain Ash | Hedlundia hybrida | 70 | 254 | 5 | 930 | 19 |
Swedish Whitebeam | Scandosorbus intermedia | 70 | 254 | 5 | 930 | 19 |
Small-Leaved Lime | Tilia cordata | 170 | 194 | 4 | 710 | 14 |
Large-Leaved Lime | Tilia platyphyllos | 170 | 194 | 4 | 710 | 14 |
Linden | Tilia x europaea | 170 | 181 | 4 | 662 | 13 |
Wych Elm | Ulmus glabra | 140 | 389 | 8 | 1428 | 29 |
European White Elm | Ulmus laevis | 140 | 290 | 6 | 1062 | 21 |
Conifer species | ||||||
Norway Spruce | Picea abies | 100 | 118 | 2 | 434 | 9 |
Serbian Spruce | Picea omorika | 100 | 208 | 4 | 762 | 15 |
Blue Spruce | Picea pungens | 70 | 102 | 2 | 375 | 8 |
Swiss Pine | Pinus cembra | 80 | 72 | 1 | 265 | 5 |
Scots Pine | Pinus sylvestris | 250 | 251 | 5 | 919 | 18 |
Douglas Fir | Pseudotsuga menziesii | 100 | 99 | 2 | 363 | 7 |
Average broadleaf species | 98 | 293 | 6 | 1073 | 21 | |
Average conifer species | 117 | 142 | 3 | 519 | 10 | |
Average all species | 102 | 262 | 5 | 962 | 19 | |
Table 4 Projected increase in carbon stock for various tree species over a 50-year period starting from planting. Figures are given per tree.
Broadleaf species generally showed a higher capacity to store and sequester carbon than conifer species (Figure 5). Scots Pine (Pinus sylvestris) was the most efficient among the conifers, achieving a carbon storage of 251 kg by year 50, with an annual uptake of 5 kg – equivalent to 18 kg of CO2. In contrast, Swiss pine (Pinus cembra) had the lowest carbon storage among conifers, totalling 72 kg, and sequestered an average of 1 kg of carbon (equivalent to 5 kg of CO2) annually.
Planting new trees can help offset the carbon loss from removed trees. Adding new trees ensures the urban area’s overall carbon sequestration and storage capacity are maintained or increased. Notably, however, to maintain the carbon stock, more new trees need to be planted than trees need to be removed because some of these new trees may die or be removed before they mature. Also, the carbon sequestration potential of young trees (e.g. 0–20 years) is rather low compared to maturing trees (e.g. age 30–40).
Remaining trees
The results for the remaining trees reflected their carbon stock and sequestration potential, considering their current size, as indicated by diameter at breast height (DBH), and projected growth over the next 50 years. These trees are spared from being cut down during construction, allowing them to continue growing and contributing to carbon storage for the duration of their natural life cycle or until their removal. With remaining trees, a life cycle’s impact on carbon storage became evident.
Typically, younger, vigorously growing trees have higher carbon sequestration rates because they rapidly build biomass as they grow. However, older trees have more biomass, meaning they have a larger structure (trunk, branches, leaves, roots) to store carbon. Even if the growth rate, relative to their size and age, slows down, the overall amount of carbon they sequester annually can still be substantial because of their size. For instance, the English oak demonstrated a significant carbon storage capacity, largely due to its long lifespan. It showed a robust increase in carbon storage when it grows larger, with mature trees (60–80 cm DBH) predicted to store, on average, up to 2612 kg of carbon by the 50th year for now, with the annual sequestration rate being 22 kg of carbon or 81 kg of CO2.
Broadleaf | Current DBH class | Current carbon storage | Predicted carbon storage in kg C | Average annual carbon sequestration in kg of C | Predicted carbon storage in kg CO2 | Average annual carbon sequestration in kg CO2 |
Norway Maple | 1-20 | 43 | 680 | 13 | 2492 | 47 |
Acer platanoides | 20-40 | 292 | 1242 | 19 | 4555 | 70 |
40-60 | 929 | 1460 | 11 | 5354 | 39 | |
60-80 | 1398 | 1460 | 1 | 5354 | 5 | |
Horse Chestnut | 1-20 | 40 | 495 | 9 | 1814 | 33 |
Aesculus hippocastanum | 20-40 | 309 | 758 | 9 | 2778 | 33 |
40-60 | 668 | 758 | 2 | 2778 | 7 | |
Common Alder | 1-20 | 31 | 358 | 7 | 1314 | 24 |
Alnus glutinosa | 20-40 | 170 | 587 | 8 | 2153 | 31 |
40-60 | 458 | 628 | 3 | 2303 | 12 | |
Grey Alder | 1-20 | 32 | 113 | 2 | 415 | 6 |
Alnus incana | 20-40 | 104 | 113 | 0,2 | 415 | 1 |
Silver Birch | 1-20 | 36 | 742 | 14 | 2722 | 52 |
Betula pendula | 20-40 | 291 | 1545 | 25 | 5663 | 92 |
40-60 | 1015 | 1719 | 14 | 6303 | 52 | |
60-80 | 1636 | 1719 | 2 | 6303 | 6 | |
Downy Birch | 1-20 | 36 | 472 | 9 | 1729 | 32 |
Betula pubescens | 20-40 | 293 | 706 | 8 | 2589 | 30 |
40-60 | 639 | 706 | 1 | 2589 | 5 | |
Black Hawthorn | 1-20 | 33 | 294 | 5 | 1076 | 19 |
Crataegus douglasii | 20-40 | 210 | 335 | 3 | 1230 | 9 |
European Ash | 1-20 | 37 | 603 | 11 | 2212 | 42 |
Fraxinus excelsior | 20-40 | 253 | 1279 | 21 | 4688 | 75 |
40-60 | 804 | 2171 | 27 | 7960 | 100 | |
60-80 | 1738 | 2949 | 24 | 10815 | 89 | |
80+ | 2664 | 3007 | 7 | 11026 | 25 | |
Siberian Crab Apple | 1-20 | 36 | 327 | 6 | 1199 | 21 |
Malus baccata | 20-40 | 260 | 417 | 3 | 1528 | 12 |
Domestic Apple | 1-20 | 39 | 356 | 6 | 1306 | 23 |
Malus domestica | 20-40 | 283 | 454 | 3 | 1664 | 13 |
European Aspen | 1-20 | 26 | 536 | 10 | 1967 | 37 |
Populus tremula | 20-40 | 213 | 694 | 10 | 2544 | 35 |
40-60 | 550 | 694 | 3 | 2544 | 11 | |
Amur Chokecherry | 1-20 | 51 | 482 | 9 | 1769 | 32 |
Prunus maackii | 20-40 | 302 | 507 | 4 | 1859 | 15 |
Bird Cherry | 1-20 | 42 | 322 | 6 | 1181 | 21 |
Prunus padus | 20-40 | 223 | 334 | 2 | 1223 | 8 |
Sargent Cherry | 1-20 | 51 | 834 | 16 | 3056 | 57 |
Prunus sargentii | 20-40 | 396 | 890 | 10 | 3262 | 36 |
40-60 | 828 | 890 | 1 | 3262 | 4 | |
English Oak | 1-20 | 53 | 597 | 11 | 2189 | 40 |
Quercus robur | 20-40 | 279 | 1150 | 17 | 4218 | 64 |
40-60 | 766 | 1836 | 21 | 6731 | 78 | |
60-80 | 1507 | 2612 | 22 | 9578 | 81 | |
80+ | 2442 | 2930 | 10 | 10742 | 36 | |
White Willow | 1-20 | 20 | 406 | 8 | 1488 | 28 |
Salix alba | 20-40 | 161 | 525 | 7 | 1925 | 27 |
40-60 | 416 | 525 | 2 | 1925 | 8 | |
Rowan | 1-20 | 40 | 481 | 9 | 1762 | 32 |
Sorbus aucuparia | 20-40 | 273 | 481 | 4 | 1762 | 15 |
Oakleaf Mountain Ash | 1-20 | 40 | 351 | 6 | 1288 | 23 |
Hedlundia hybrida | 20-40 | 254 | 397 | 3 | 1456 | 11 |
Swedish Whitebeam | 1-20 | 40 | 351 | 6 | 1288 | 23 |
Scandosorbus intermedia | 20-40 | 254 | 397 | 3 | 1456 | 11 |
Small-Leaved Lime | 1-20 | 29 | 337 | 6 | 1236 | 23 |
Tilia cordata | 20-40 | 214 | 832 | 12 | 3050 | 45 |
40-60 | 705 | 1654 | 19 | 6066 | 70 | |
60-80 | 1538 | 2206 | 13 | 8089 | 49 | |
80+ | 2125 | 2211 | 2 | 8106 | 6 | |
Large-Leaved Lime | 1-20 | 29 | 337 | 6 | 1236 | 23 |
Tilia platyphyllos | 20-40 | 214 | 832 | 12 | 3050 | 45 |
40-60 | 705 | 1654 | 19 | 6066 | 70 | |
60-80 | 1538 | 2206 | 13 | 8089 | 49 | |
80+ | 2125 | 2211 | 2 | 8106 | 6 | |
Linden | 1-20 | 27 | 314 | 6 | 1153 | 21 |
Tilia x europaea | 20-40 | 199 | 778 | 12 | 2853 | 42 |
40-60 | 660 | 1543 | 18 | 5657 | 65 | |
60-80 | 1434 | 2057 | 12 | 7543 | 46 | |
80+ | 1982 | 2062 | 2 | 7559 | 6 | |
Wych Elm | 1-20 | 33 | 615 | 12 | 2256 | 43 |
Ulmus glabra | 20-40 | 248 | 1357 | 22 | 4976 | 81 |
40-60 | 833 | 2387 | 31 | 8753 | 114 | |
60-80 | 1870 | 2986 | 22 | 10948 | 82 | |
80+ | 2747 | 2987 | 5 | 10952 | 18 | |
European White Elm | 1-20 | 33 | 368 | 7 | 1348 | 25 |
Ulmus laevis | 20-40 | 266 | 527 | 5 | 1933 | 19 |
40-60 | 543 | 611 | 1 | 2241 | 5 | |
Conifer | ||||||
Norway Spruce | 1-20 | 39 | 231 | 4 | 849 | 14 |
Picea abies | 20-40 | 236 | 415 | 4 | 1521 | 13 |
Serbian Spruce | 1-20 | 35 | 347 | 6 | 1273 | 23 |
Picea omorika | 20-40 | 226 | 714 | 10 | 2618 | 36 |
40-60 | 585 | 774 | 4 | 2839 | 14 | |
Blue Spruce | 1-20 | 33 | 164 | 3 | 601 | 10 |
Picea pungens | 20-40 | 129 | 183 | 1 | 672 | 4 |
Swiss Pine | 1-20 | 21 | 139 | 2 | 509 | 9 |
Pinus cembra | 20-40 | 111 | 178 | 1 | 651 | 5 |
Scots Pine | 1-20 | 26 | 374 | 7 | 1372 | 26 |
Pinus sylvestris | 20-40 | 165 | 741 | 12 | 2716 | 42 |
40-60 | 486 | 1186 | 14 | 4350 | 51 | |
60-80 | 973 | 1698 | 15 | 6228 | 53 | |
80+ | 1569 | 2202 | 13 | 8074 | 46 | |
Douglas Fir | 1-20 | 12 | 178 | 3 | 652 | 12 |
Pseudotsuge menziesii | 20-40 | 110 | 378 | 5 | 1386 | 20 |
40-60 | 309 | 410 | 2 | 1503 | 7 | |
Average broadleaf species | 445 | 848 | 8 | 3111 | 30 | |
Average conifer species | 226 | 471 | 5 | 1729 | 18 | |
Average all species | 401 | 773 | 7 | 2834 | 27 |
Table 5 The results for remaining trees reflected their carbon storage and sequestration potential
Removed trees
The results highlight the impact of tree removal on carbon stock and sequestration across various stages of tree maturity. Initially, the immediate impact was assessed based on the direct loss of carbon stored within the trees at the time of removal. For example, for young trees (classified within a diameter at breast height [DBH] range of 1–20 cm), the immediate carbon stock losses were quantified as 43 kg for the Norway maple, 37 kg for European ash, and 53 kg for English oak. When losses are distributed over a 50-year time period, the annual losses are around 1 kg of carbon for each species. The impact is much larger for older, larger trees within a DBH class of 60–80 cm, where the carbon stock losses are substantially higher, recorded at 929 kg for Norway maple, 1738 kg for European ash, and 1507 kg for English oak. The annual losses would be 19 kg for Norway maple, 35 kg for European ash, and 30 kg for English oak. These figures underscore the considerable amount of carbon stored in mature trees and the significant impact their removal has on the carbon balance.
Expanding the analysis to include the long-term effects, which account for the potential carbon sequestration these trees would have contributed had they not been removed, reveals even bigger losses. The example trees show expected decreases in current carbon storage and future carbon capture potential for the young trees, totalling 680 kg for Norway maple, 603 kg for European ash, and 597 kg for English oak. That is, annually, 14 kg of carbon for Norway maple, 12 kg for European ash, and 12 kg for English oak. The impact is more significant for mature trees, with anticipated sequestration losses of 1460 kg for Norway maple, 2949 kg for European ash, and 2612 kg for English oak. Annually, this would mean a loss of 29 kg of carbon for Norway maple, 59 kg for European ash, and 52 kg for English oak. These figures underscore the considerable amount of carbon stored in mature trees and the significant impact their removal could have on the carbon balance.
Loss based on current storage | Loss based on future storage | ||||||||||
Broadleaf | Current DBH class | Current carbon storage | Predicted carbon storage in 50 years | Carbon storage lost in kg C | Annual carbon sequestration lost kg C | Annual carbon sequestration lost kg CO2 | Annual carbon sequestration lost kg CO2 | Carbon storage lost in kg C | Average carbon storage during 50 years in kg C | Carbon storage lost in kg of CO2 | Average carbon storage during 50 years in kg CO2 |
Norway Maple | 1-20 | 43 | 680 | -43 | -1 | -158 | -3 | -680 | -14 | -2492 | -50 |
Acer platanoides | 20-40 | 292 | 1242 | -292 | -6 | -1072 | -21 | -1242 | -25 | -4555 | -91 |
40-60 | 929 | 1460 | -929 | -19 | -3406 | -68 | -1460 | -29 | -5354 | -107 | |
60-80 | 1398 | 1460 | -1398 | -28 | -5126 | -103 | -1460 | -29 | -5354 | -107 | |
Horse Chestnut | 1-20 | 40 | 495 | -40 | -1 | -146 | -3 | -495 | -10 | -1814 | -36 |
Aesculus hippocastanum | 20-40 | 309 | 758 | -309 | -6 | -1133 | -23 | -758 | -15 | -2778 | -56 |
40-60 | 668 | 758 | -668 | -13 | -2449 | -49 | -758 | -15 | -2778 | -56 | |
Common Alder | 1-20 | 31 | 358 | -31 | -1 | -114 | -2 | -358 | -7 | -1314 | -26 |
Alnus glutinosa | 20-40 | 170 | 587 | -170 | -3 | -622 | -12 | -587 | -12 | -2153 | -43 |
40-60 | 458 | 628 | -458 | -9 | -1680 | -34 | -628 | -13 | -2303 | -46 | |
Grey Alder | 1-20 | 32 | 113 | -32 | -1 | -119 | -2 | -113 | -2 | -415 | -8 |
Alnus incana | 20-40 | 104 | 113 | -104 | -2 | -381 | -8 | -113 | -2 | -415 | -8 |
Silver Birch | 1-20 | 36 | 742 | -36 | -1 | -133 | -3 | -742 | -15 | -2722 | -54 |
Betula pendula | 20-40 | 291 | 1545 | -291 | -6 | -1066 | -21 | -1545 | -31 | -5663 | -113 |
40-60 | 1015 | 1719 | -1015 | -20 | -3723 | -74 | -1719 | -34 | -6303 | -126 | |
60-80 | 1636 | 1719 | -1636 | -33 | -5999 | -120 | -1719 | -34 | -6303 | -126 | |
Downy Birch | 1-20 | 36 | 472 | -36 | -1 | -133 | -3 | -472 | -9 | -1729 | -35 |
Betula pubescens | 20-40 | 293 | 706 | -293 | -6 | -1076 | -22 | -706 | -14 | -2589 | -52 |
40-60 | 639 | 706 | -639 | -13 | -2345 | -47 | -706 | -14 | -2589 | -52 | |
Black Hawthorn | 1-20 | 33 | 294 | -33 | -1 | -122 | -2 | -294 | -6 | -1076 | -22 |
Crataegus douglasii | 20-40 | 210 | 335 | -210 | -4 | -771 | -15 | -335 | -7 | -1230 | -25 |
European Ash | 1-20 | 37 | 603 | -37 | -1 | -135 | -3 | -603 | -12 | -2212 | -44 |
Fraxinus excelsior | 20-40 | 253 | 1279 | -253 | -5 | -928 | -19 | -1279 | -26 | -4688 | -94 |
40-60 | 804 | 2171 | -804 | -16 | -2947 | -59 | -2171 | -43 | -7960 | -159 | |
60-80 | 1738 | 2949 | -1738 | -35 | -6372 | -127 | -2949 | -59 | -10815 | -216 | |
80+ | 2664 | 3007 | -2664 | -53 | -9769 | -195 | -3007 | -60 | -11026 | -221 | |
Siberian Crab Apple | 1-20 | 36 | 327 | -36 | -1 | -131 | -3 | -327 | -7 | -1199 | -24 |
Malus baccata | 20-40 | 260 | 417 | -260 | -5 | -952 | -19 | -417 | -8 | -1528 | -31 |
Domestic Apple | 1-20 | 39 | 356 | -39 | -1 | -143 | -3 | -356 | -7 | -1306 | -26 |
Malus domestica | 20-40 | 283 | 454 | -283 | -6 | -1038 | -21 | -454 | -9 | -1664 | -33 |
European Aspen | 1-20 | 26 | 536 | -26 | -1 | -97 | -2 | -536 | -11 | -1967 | -39 |
Populus tremula | 20-40 | 213 | 694 | -213 | -4 | -782 | -16 | -694 | -14 | -2544 | -51 |
40-60 | 550 | 694 | -550 | -11 | -2016 | -40 | -694 | -14 | -2544 | -51 | |
Amur Chokecherry | 1-20 | 51 | 482 | -51 | -1 | -186 | -4 | -482 | -10 | -1769 | -35 |
Prunus maackii | 20-40 | 302 | 507 | -302 | -6 | -1107 | -22 | -507 | -10 | -1859 | -37 |
Bird Cherry | 1-20 | 42 | 322 | -42 | -1 | -153 | -3 | -322 | -6 | -1181 | -24 |
Prunus padus | 20-40 | 223 | 334 | -223 | -4 | -818 | -16 | -334 | -7 | -1223 | -24 |
Sargent Cherry | 1-20 | 51 | 834 | -51 | -1 | -187 | -4 | -834 | -17 | -3056 | -61 |
Prunus sargentii | 20-40 | 396 | 890 | -396 | -8 | -1451 | -29 | -890 | -18 | -3262 | -65 |
40-60 | 828 | 890 | -828 | -17 | -3038 | -61 | -890 | -18 | -3262 | -65 | |
English Oak | 1-20 | 53 | 597 | -53 | -1 | -193 | -4 | -597 | -12 | -2189 | -44 |
Quercus robur | 20-40 | 279 | 1150 | -279 | -6 | -1023 | -20 | -1150 | -23 | -4218 | -84 |
40-60 | 766 | 1836 | -766 | -15 | -2808 | -56 | -1836 | -37 | -6731 | -135 | |
60-80 | 1507 | 2612 | -1507 | -30 | -5524 | -110 | -2612 | -52 | -9578 | -192 | |
80+ | 2442 | 2930 | -2442 | -49 | -8953 | -179 | -2930 | -59 | -10742 | -215 | |
White Willow | 1-20 | 20 | 406 | -20 | 0 | -73 | -1 | -406 | -8 | -1488 | -30 |
Salix alba | 20-40 | 161 | 525 | -161 | -3 | -592 | -12 | -525 | -11 | -1925 | -39 |
40-60 | 416 | 525 | -416 | -8 | -1525 | -31 | -525 | -11 | -1925 | -39 | |
Rowan | 1-20 | 40 | 481 | -40 | -1 | -148 | -3 | -481 | -10 | -1762 | -35 |
Sorbus aucuparia | 20-40 | 273 | 481 | -273 | -5 | -999 | -20 | -481 | -10 | -1762 | -35 |
Oakleaf Mountain Ash | 1-20 | 40 | 351 | -40 | -1 | -146 | -3 | -351 | -7 | -1288 | -26 |
Hedlundia hybrida | 20-40 | 254 | 397 | -254 | -5 | -930 | -19 | -397 | -8 | -1456 | -29 |
Swedish Whitebeam | 1-20 | 40 | 351 | -40 | -1 | -146 | -3 | -351 | -7 | -1288 | -26 |
Scandosorbus intermedia | 20-40 | 254 | 397 | -254 | -5 | -930 | -19 | -397 | -8 | -1456 | -29 |
Small-Leaved Lime | 1-20 | 29 | 337 | -29 | -1 | -106 | -2 | -337 | -7 | -1236 | -25 |
Tilia cordata | 20-40 | 214 | 832 | -214 | -4 | -784 | -16 | -832 | -17 | -3050 | -61 |
40-60 | 705 | 1654 | -705 | -14 | -2585 | -52 | -1654 | -33 | -6066 | -121 | |
60-80 | 1538 | 2206 | -1538 | -31 | -5640 | -113 | -2206 | -44 | -8089 | -162 | |
80+ | 2125 | 2211 | -2125 | -43 | -7793 | -156 | -2211 | -44 | -8106 | -162 | |
Large-Leaved Lime | 1-20 | 29 | 337 | -29 | -1 | -106 | -2 | -337 | -7 | -1236 | -25 |
Tilia platyphyllos | 20-40 | 214 | 832 | -214 | -4 | -784 | -16 | -832 | -17 | -3050 | -61 |
40-60 | 705 | 1654 | -705 | -14 | -2585 | -52 | -1654 | -33 | -6066 | -121 | |
60-80 | 1538 | 2206 | -1538 | -31 | -5640 | -113 | -2206 | -44 | -8089 | -162 | |
80+ | 2125 | 2211 | -2125 | -43 | -7793 | -156 | -2211 | -44 | -8106 | -162 | |
Linden | 1-20 | 27 | 314 | -27 | -1 | -99 | -2 | -314 | -6 | -1153 | -23 |
Tilia x europaea | 20-40 | 199 | 778 | -199 | -4 | -731 | -15 | -778 | -16 | -2853 | -57 |
40-60 | 660 | 1543 | -660 | -13 | -2419 | -48 | -1543 | -31 | -5657 | -113 | |
60-80 | 1434 | 2057 | -1434 | -29 | -5259 | -105 | -2057 | -41 | -7543 | -151 | |
80+ | 1982 | 2062 | -1982 | -40 | -7267 | -145 | -2062 | -41 | -7559 | -151 | |
Wych Elm | 1-20 | 33 | 615 | -33 | -1 | -120 | -2 | -615 | -12 | -2256 | -45 |
Ulmus glabra | 20-40 | 248 | 1357 | -248 | -5 | -908 | -18 | -1357 | -27 | -4976 | -100 |
40-60 | 833 | 2387 | -833 | -17 | -3053 | -61 | -2387 | -48 | -8753 | -175 | |
60-80 | 1870 | 2986 | -1870 | -37 | -6857 | -137 | -2986 | -60 | -10948 | -219 | |
80+ | 2747 | 2987 | -2747 | -55 | -10074 | -201 | -2987 | -60 | -10952 | -219 | |
European White Elm | 1-20 | 33 | 368 | -33 | -1 | -120 | -2 | -368 | -7 | -1348 | -27 |
Ulmus laevis | 20-40 | 266 | 527 | -266 | -5 | -976 | -20 | -527 | -11 | -1933 | -39 |
40-60 | 543 | 611 | -543 | -11 | -1993 | -40 | -611 | -12 | -2241 | -45 | |
Conifer | |||||||||||
Norway Spruce | 1-20 | 39 | 231 | -39 | -1 | -144 | -3 | -231 | -5 | -849 | -17 |
Picea abies | 20-40 | 236 | 415 | -236 | -5 | -864 | -17 | -415 | -8 | -1521 | -30 |
Serbian Spruce | 1-20 | 35 | 347 | -35 | -1 | -128 | -3 | -347 | -7 | -1273 | -25 |
Picea omorika | 20-40 | 226 | 714 | -226 | -5 | -830 | -17 | -714 | -14 | -2618 | -52 |
40-60 | 585 | 774 | -585 | -12 | -2146 | -43 | -774 | -15 | -2839 | -57 | |
Blue Spruce | 1-20 | 33 | 164 | -33 | -1 | -121 | -2 | -164 | -3 | -601 | -12 |
Picea pungens | 20-40 | 129 | 183 | -129 | -3 | -473 | -9 | -183 | -4 | -672 | -13 |
Swiss Pine | 1-20 | 21 | 139 | -21 | 0 | -78 | -2 | -139 | -3 | -509 | -10 |
Pinus cembra | 20-40 | 111 | 178 | -111 | -2 | -407 | -8 | -178 | -4 | -651 | -13 |
Scots Pine | 1-20 | 26 | 374 | -26 | -1 | -94 | -2 | -374 | -7 | -1372 | -27 |
Pinus sylvestris | 20-40 | 165 | 741 | -165 | -3 | -605 | -12 | -741 | -15 | -2716 | -54 |
40-60 | 486 | 1186 | -486 | -10 | -1783 | -36 | -1186 | -24 | -4350 | -87 | |
60-80 | 973 | 1698 | -973 | -19 | -3567 | -71 | -1698 | -34 | -6228 | -125 | |
80+ | 1569 | 2202 | -1569 | -31 | -5753 | -115 | -2202 | -44 | -8074 | -161 | |
Douglas Fir | 1-20 | 12 | 178 | -12 | 0 | -43 | -1 | -178 | -4 | -652 | -13 |
Pseudotsuge menziesii | 20-40 | 110 | 378 | -110 | -2 | -404 | -8 | -378 | -8 | -1386 | -28 |
40-60 | 309 | 410 | -309 | -6 | -1133 | -23 | -410 | -8 | -1503 | -30 | |
Average broadleaf species | 445 | 848 | -445 | -9 | -1631 | -33 | -848 | -17 | -3111 | -62 | |
Average conifer species | 226 | 471 | -226 | -5 | -828 | -17 | -471 | -9 | -1729 | -35 | |
Average all species | 401 | 773 | -401 | -8 | -1470 | -29 | -773 | -15 | -2834 | -57 | |
Table 6 The results for removed trees reflected their carbon storage and lost sequestration potential
Implications of the results
Incorporating carbon data related to green areas within the built environment into the ‘Emission Database for Construction’ is important for evaluating the environmental impacts of urban construction. This database facilitates the use of standardised or comparable values to assess the carbon footprint. By providing access to essential data, such as the emissions associated with tree maintenance practices and the carbon-storing and sequestration capabilities of various tree species, the database supports a more consistent and accurate evaluation of trees’ contributions to construction’s carbon footprint. However, the challenge is in accurately measuring the dynamic nature of trees’ carbon absorption and storage capabilities, considering their growth, health, species diversity, lifecycle changes, etc. As methodologies evolve to better capture these complexities, integrating trees into climate impact calculations could provide a more holistic view of buildings’ environmental footprints.
Enhanced data leads to a deeper understanding of construction projects’ environmental impact by accounting not only for the emissions associated with building materials and construction processes but for the negative emissions of trees on yards, streets, and parks. This would enable more informed decision-making in urban planning and construction, encouraging the preservation of trees and incorporating green infrastructure in new developments to enhance carbon capture and contribute to climate change mitigation.
The results presented here have significant implications for management and planning in construction and development projects. Planners should consider a tree’s carbon sequestration potential over time when making decisions. Older trees with larger biomass can continue sequestering substantial carbon even as their growth rate decreases. Trees with longer lifespans may provide more carbon storage over their lifetimes compared to shorter-lived species. This long-term storage can support a city’s carbon reduction goals. Given the carbon sequestration capabilities of mature trees, development plans should prioritise retaining existing trees and incorporating planting new ones as part of the sustainability strategy (Figure 6). When removal is unavoidable, these insights can inform replacement strategies. In replacing removed trees, considering various factors is important, including the tree’s growth rate and carbon sequestration potential, to maintain or enhance the urban forest’s carbon storage.
Figure 6 The average annual carbon sequestration data for individual trees of broadleaf (dark blue bars), conifer (light blue bars), and the average of all species (yellow bars) in different scenarios (planted, remaining, removed current, and removed predicted). Here, the negative values refer to carbon sink, and positive values refer to carbon emission.
Choosing species that match the specific site conditions is also essential. Factors like soil type, space, climate, and pest resistance are important. Biodiversity is key to creating a resilient urban forest. Diverse species can better withstand various environmental stresses and contribute to a healthier ecosystem. If a tree is unsuited to its environment, it may die prematurely, and the potential carbon sequestration for the rest of its intended lifespan is lost. Dead trees not only stop sequestering carbon but can start releasing stored carbon back into the atmosphere. Successful tree planting for carbon management depends on selecting the right tree for each location, ensuring health, longevity, effective carbon sequestration, and overall ecosystem resilience.
Approach 2. Species-specific equations
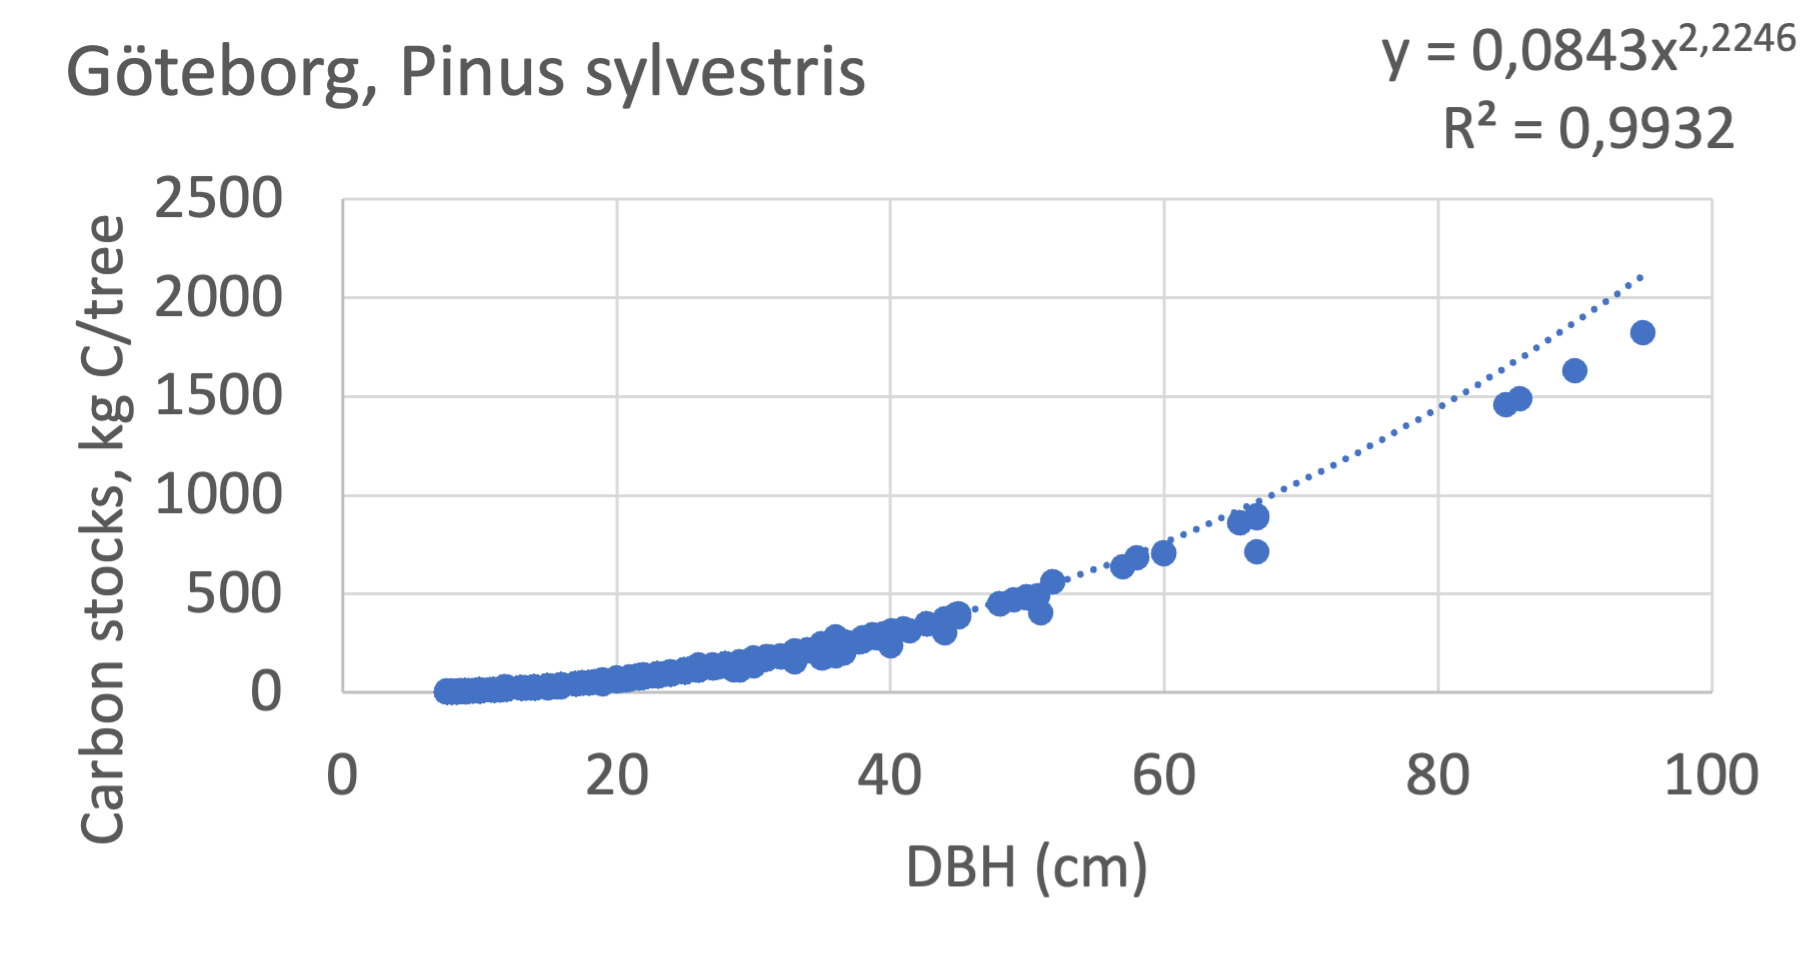
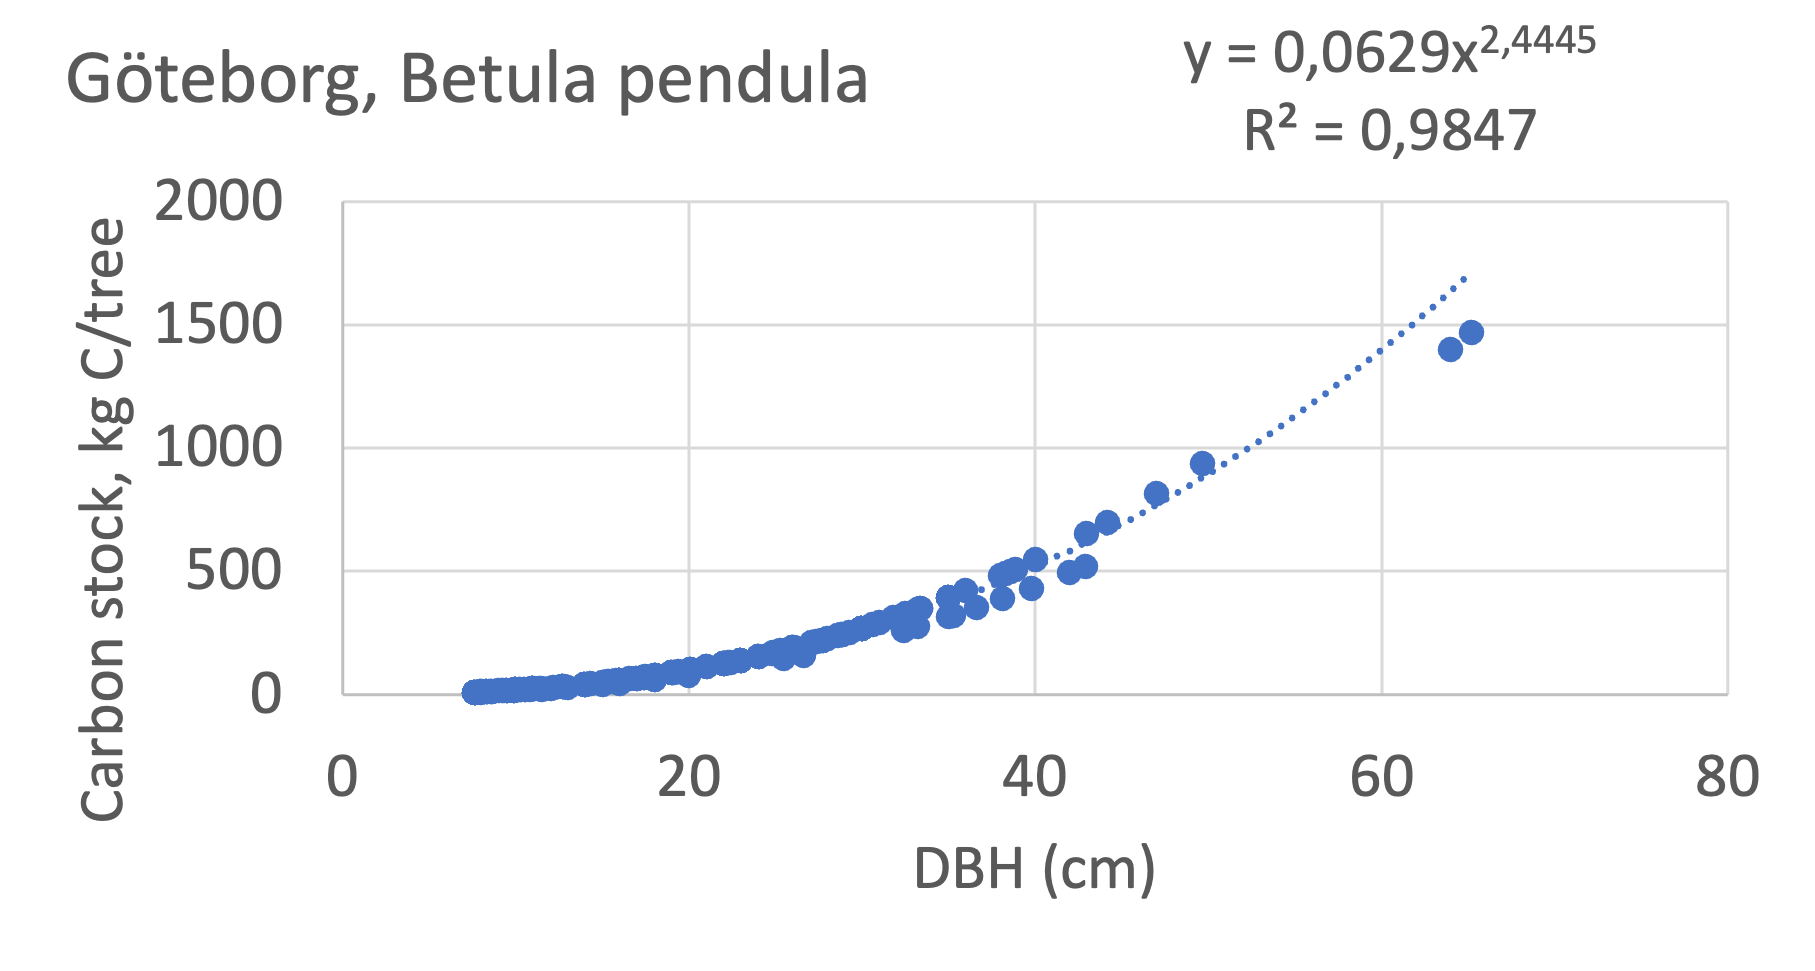
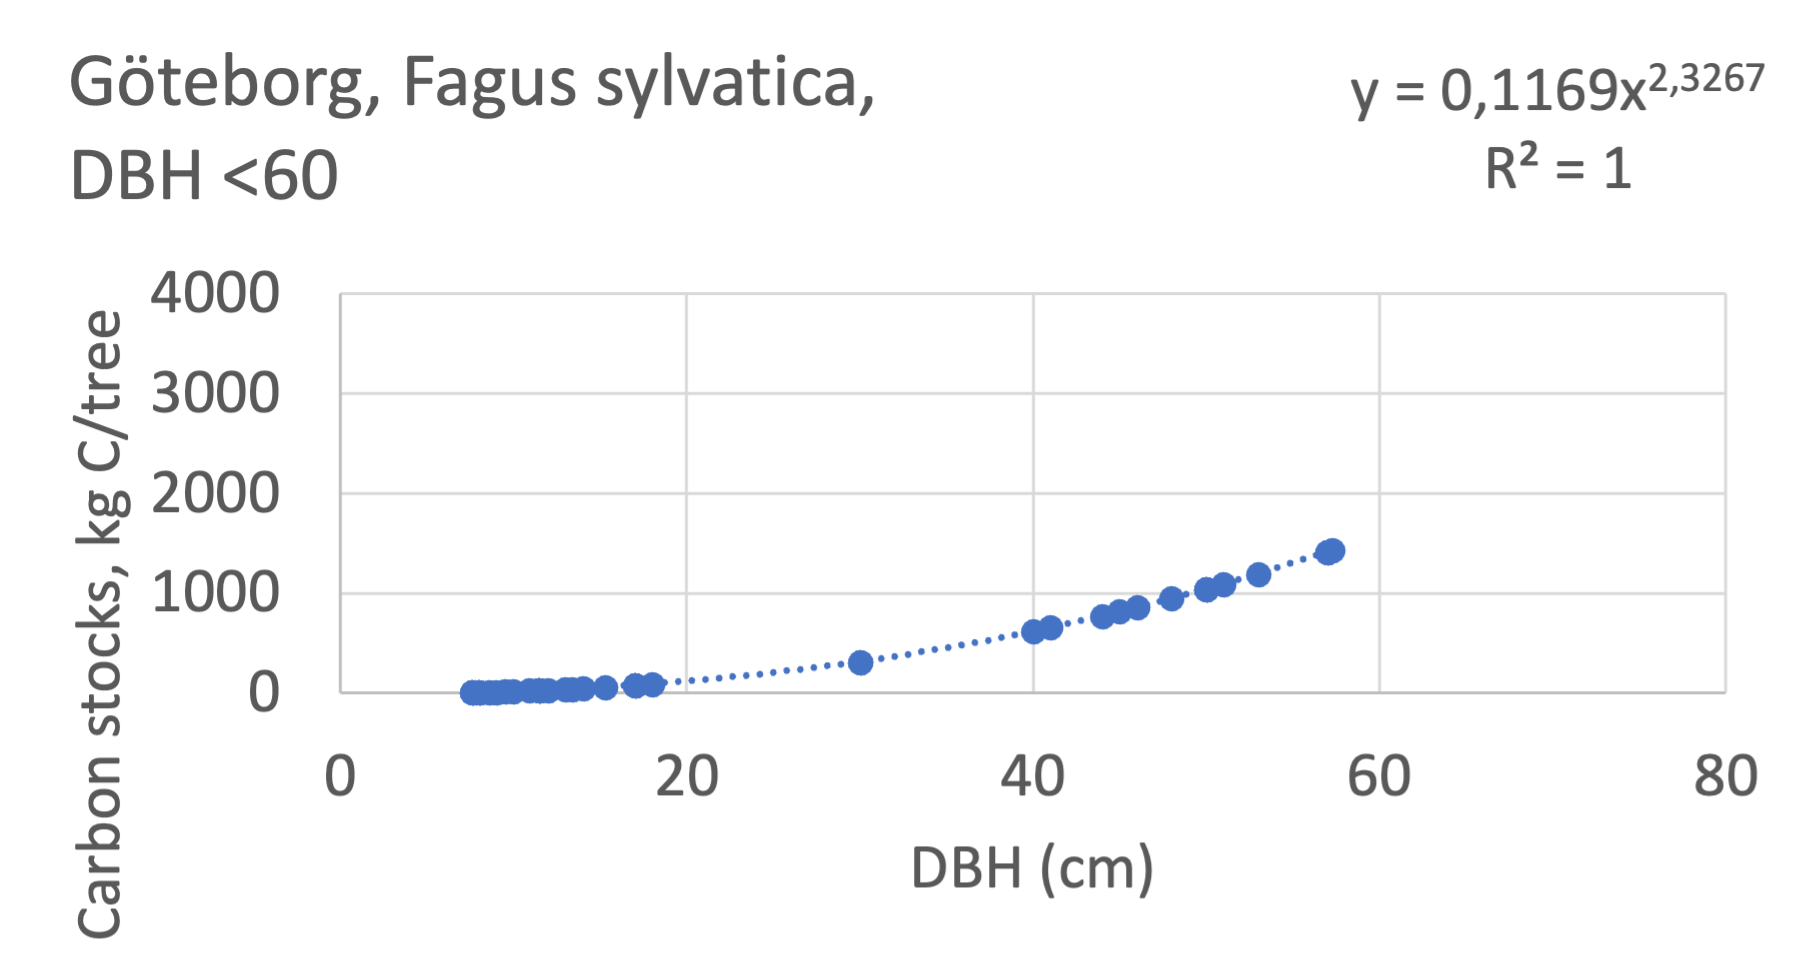
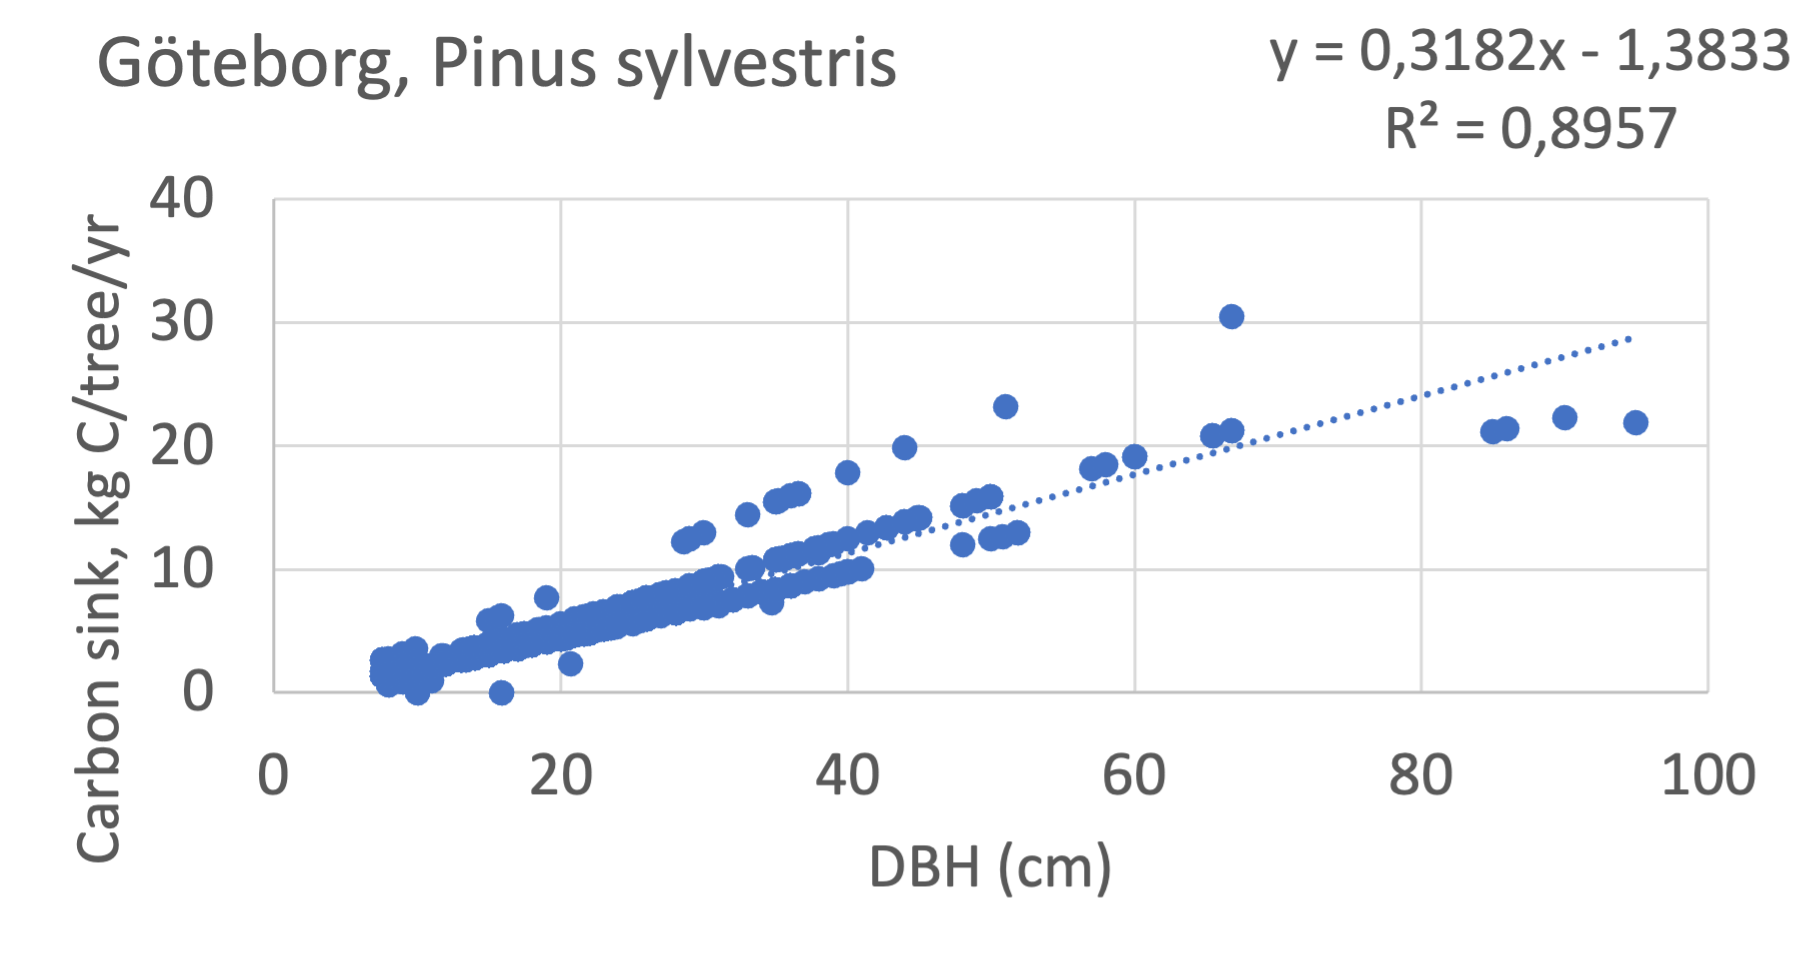
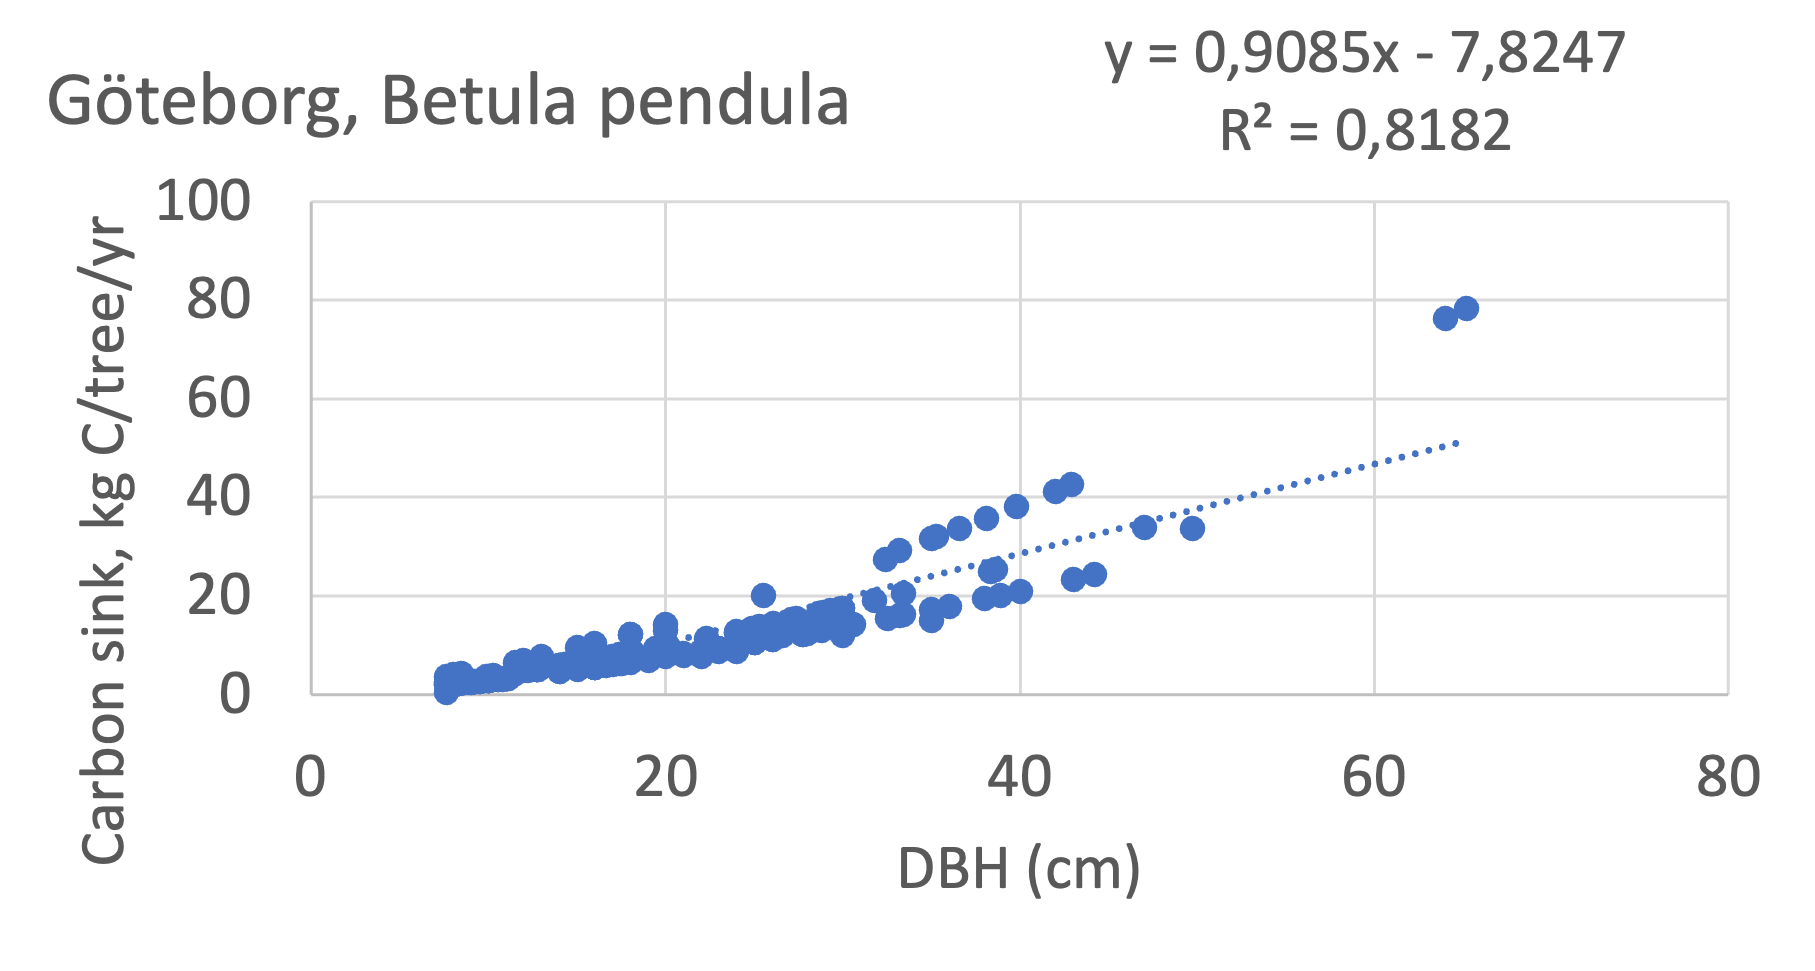
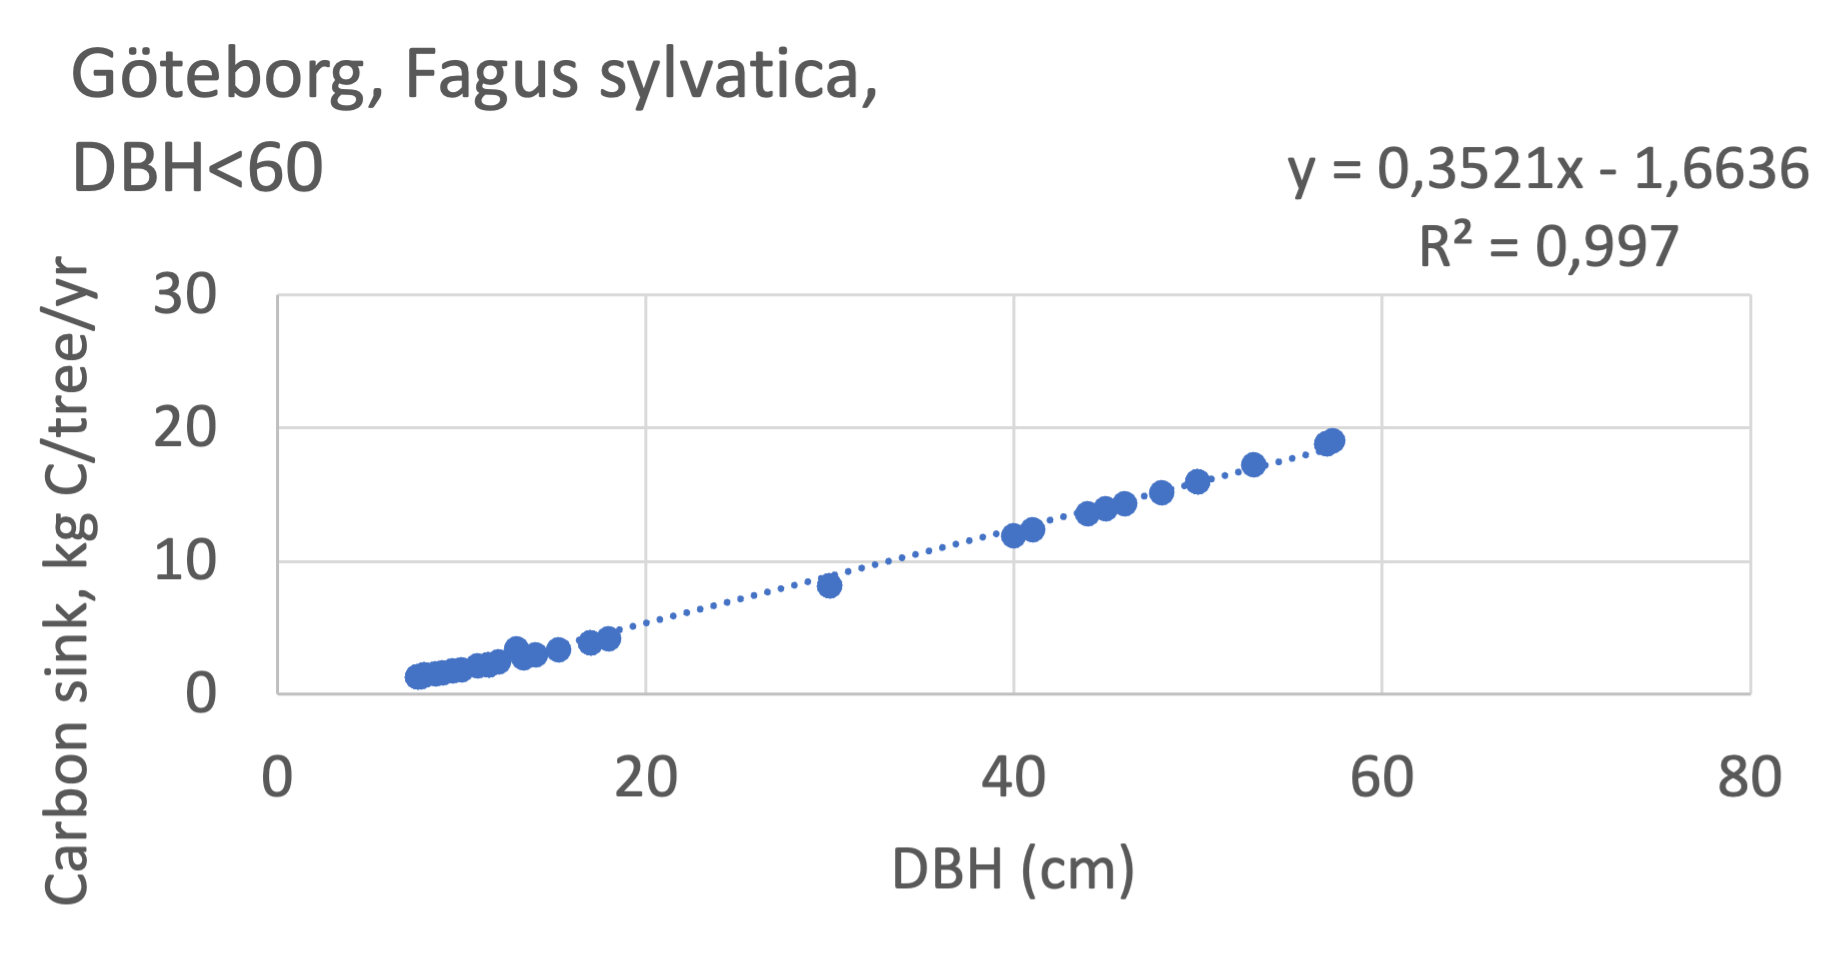
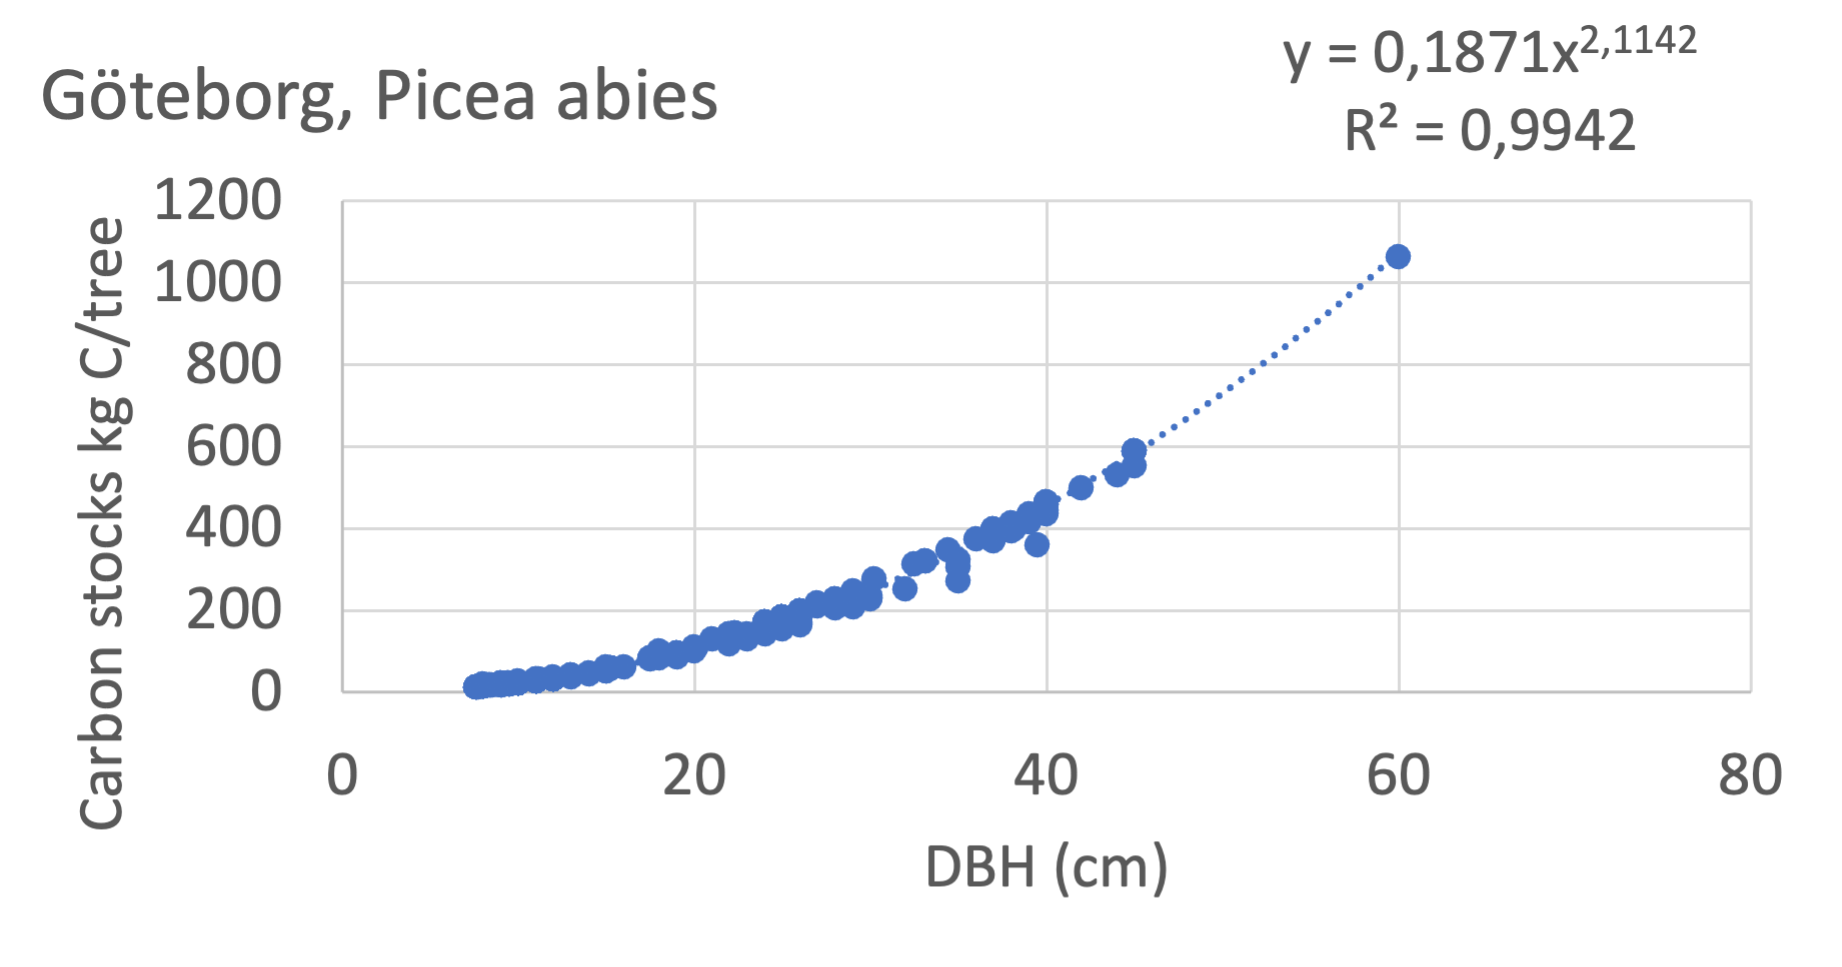
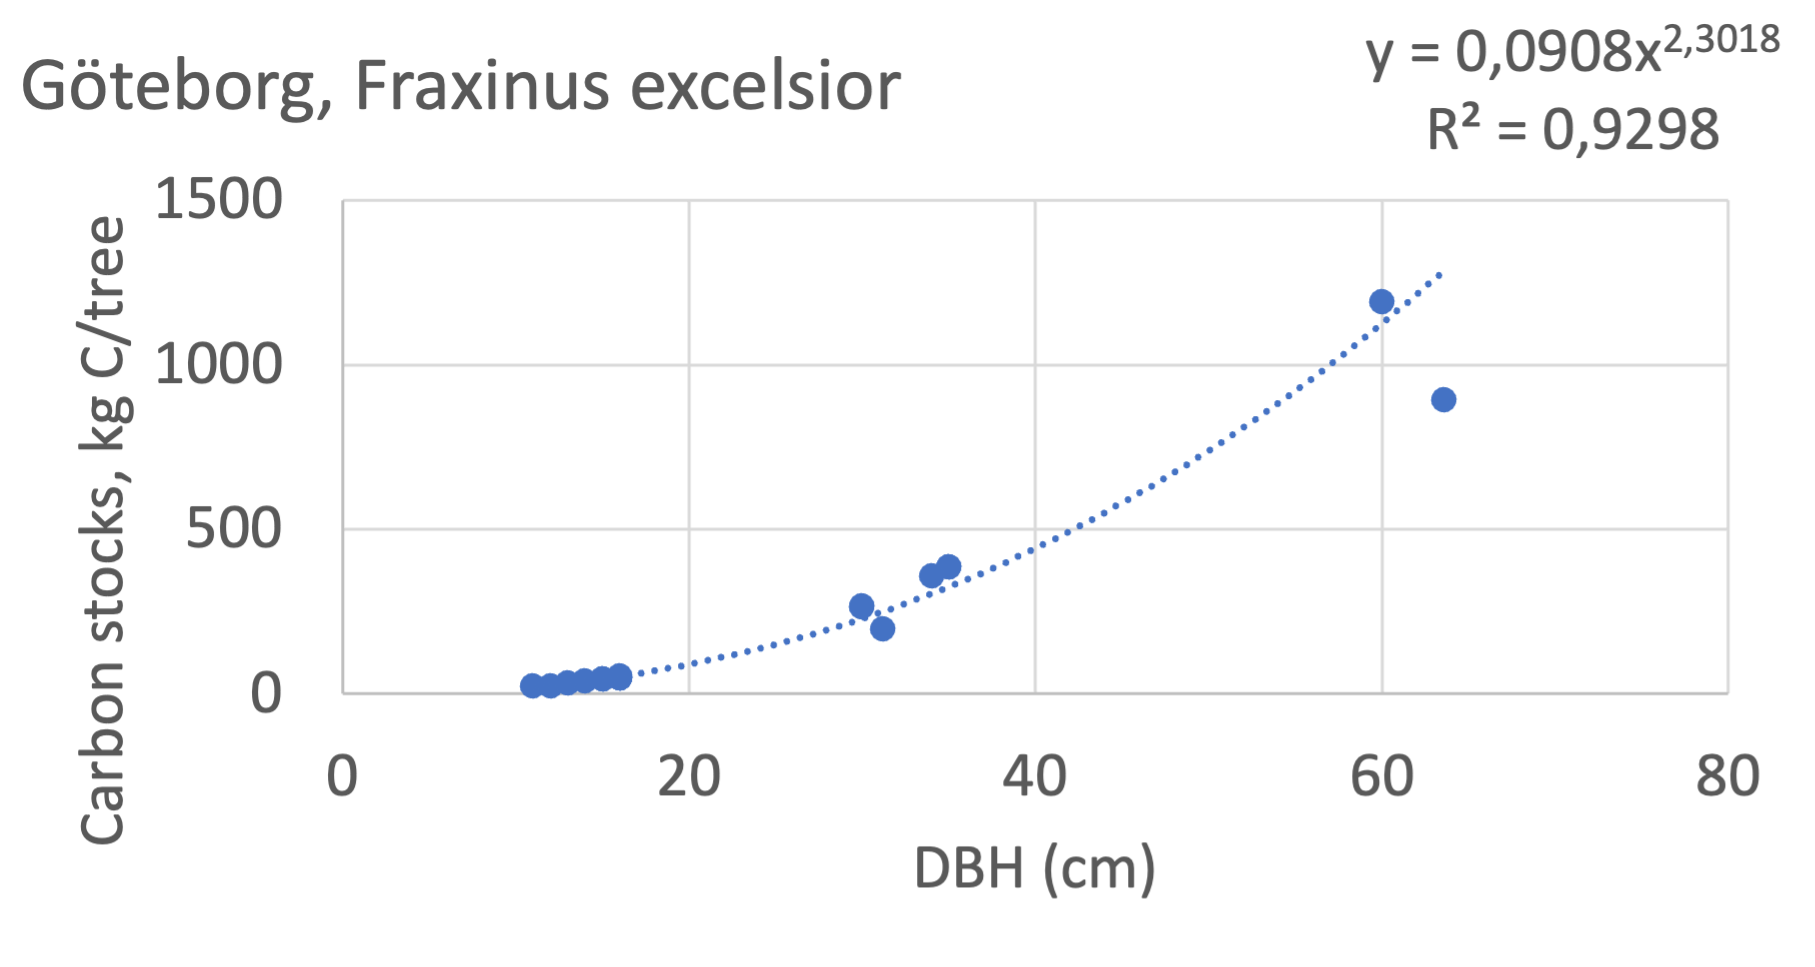
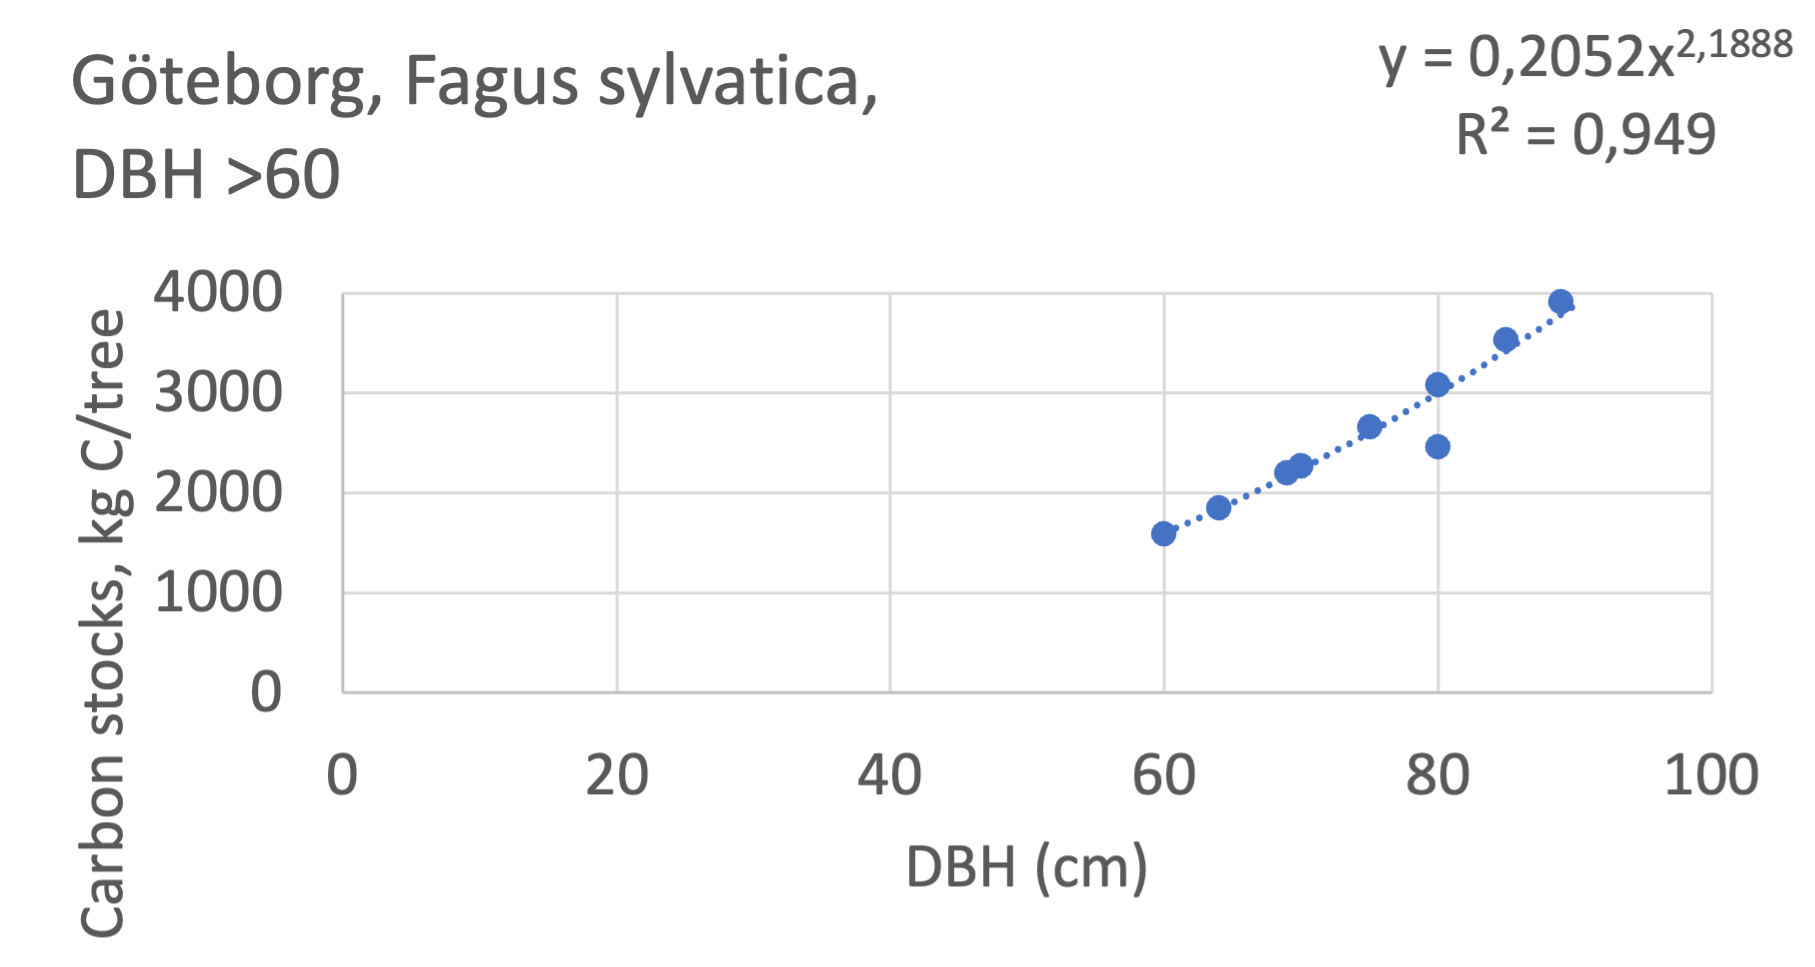
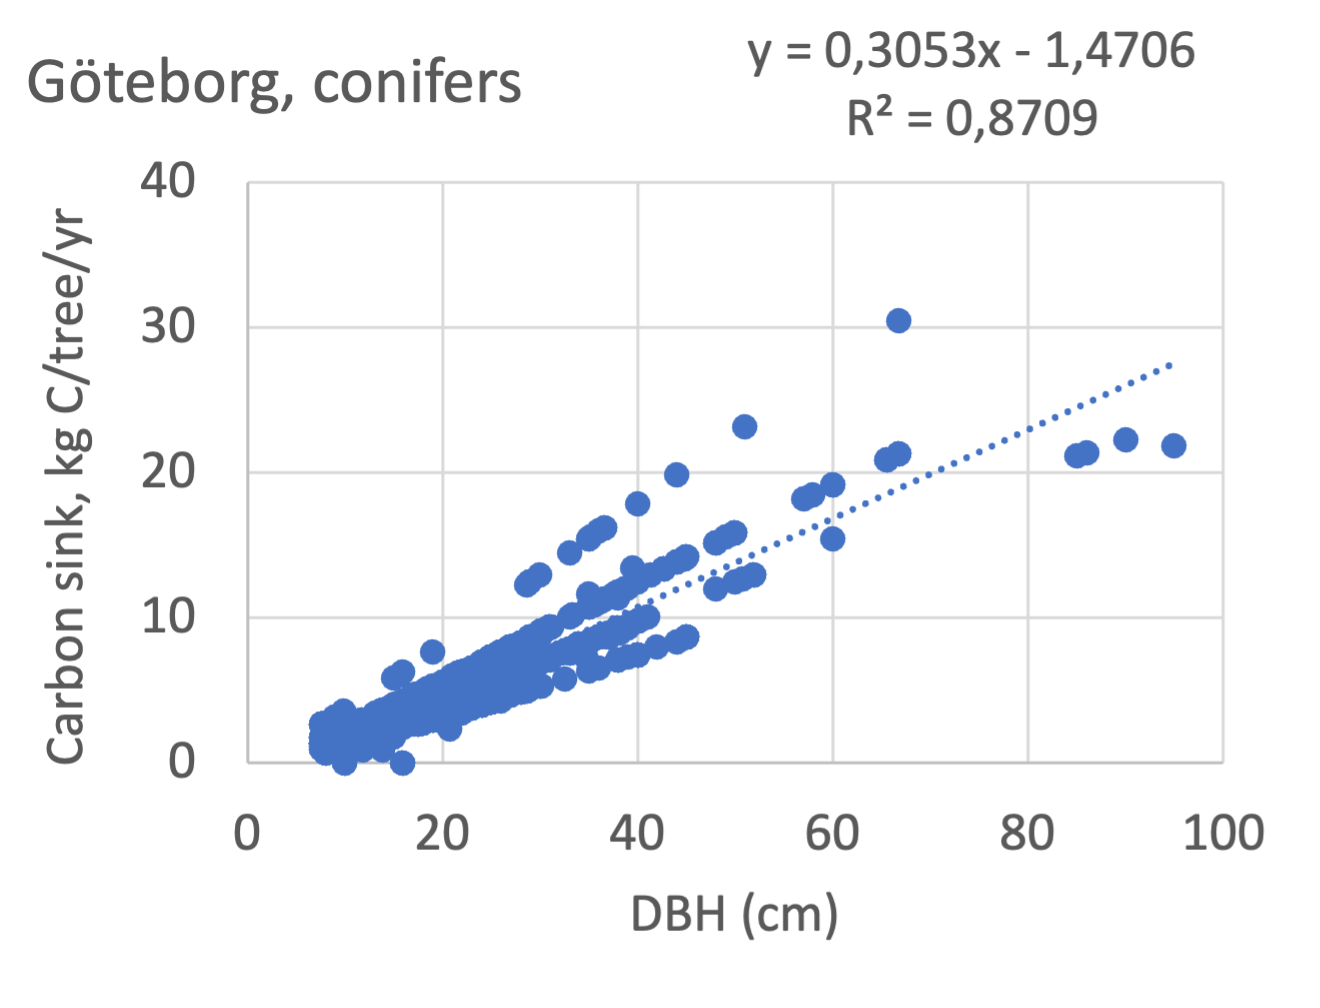
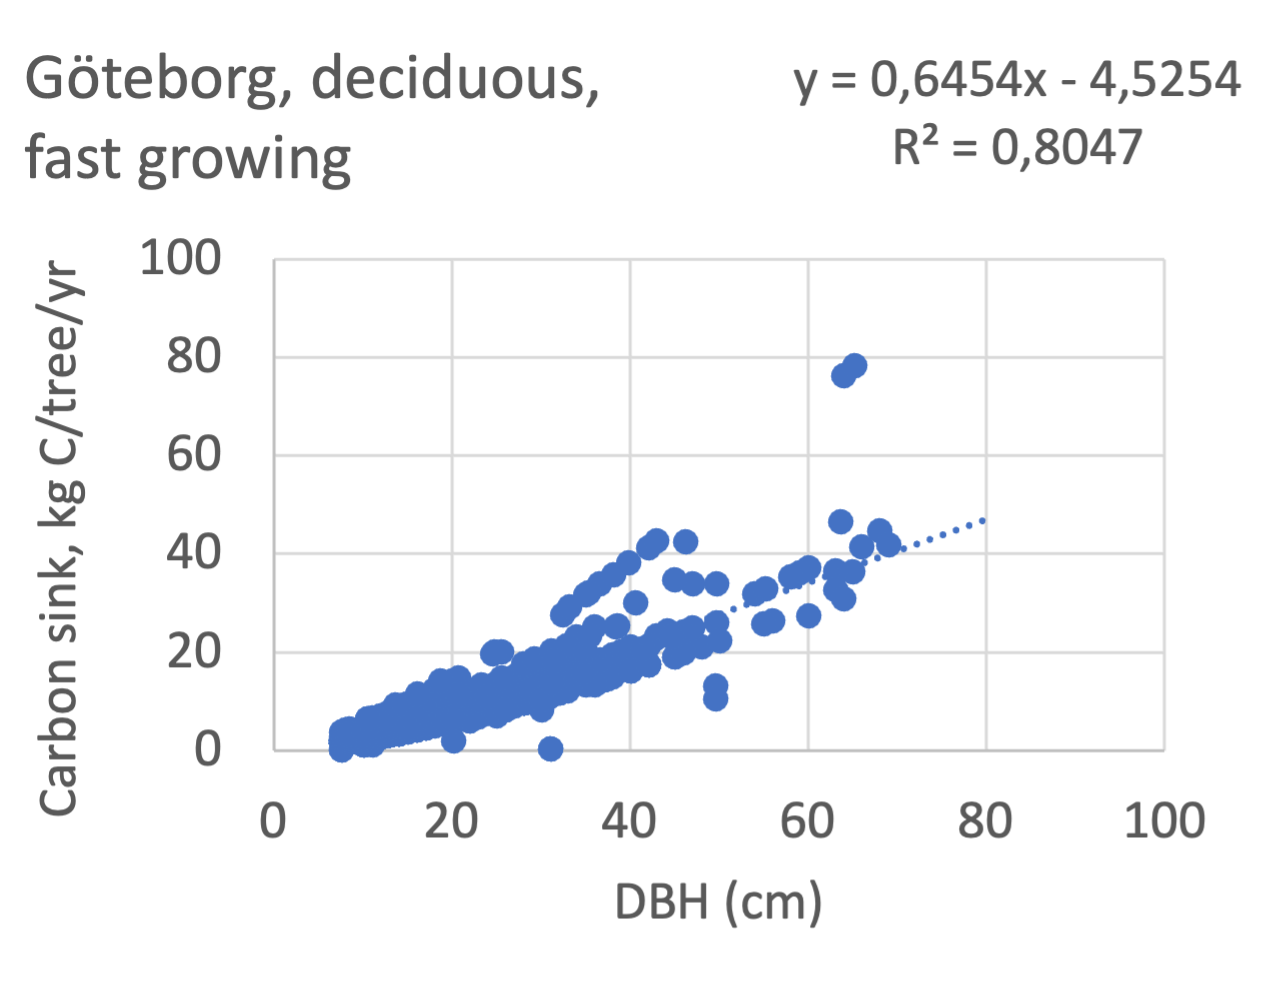
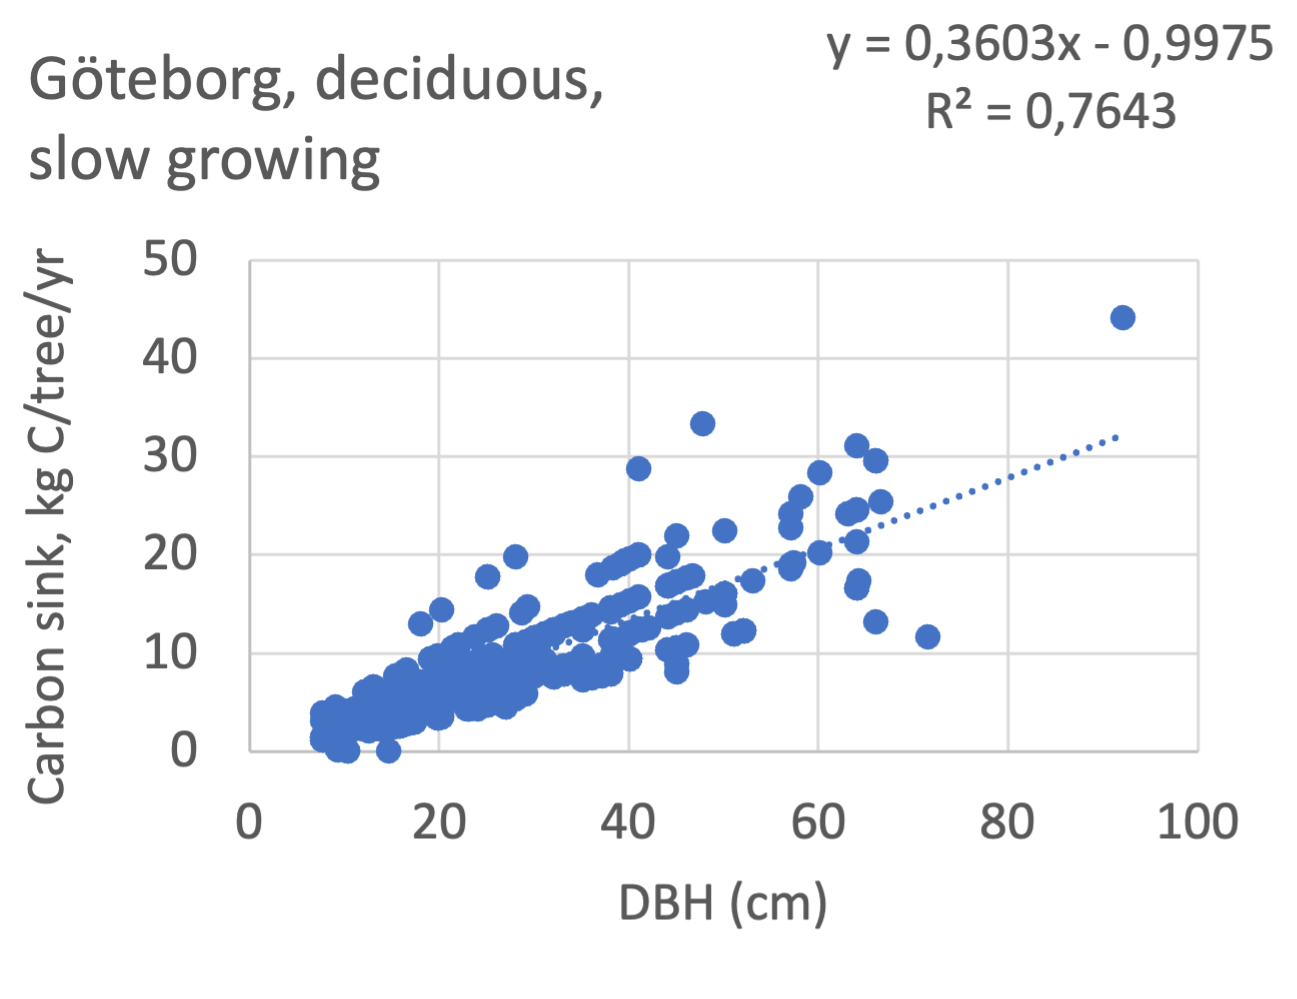
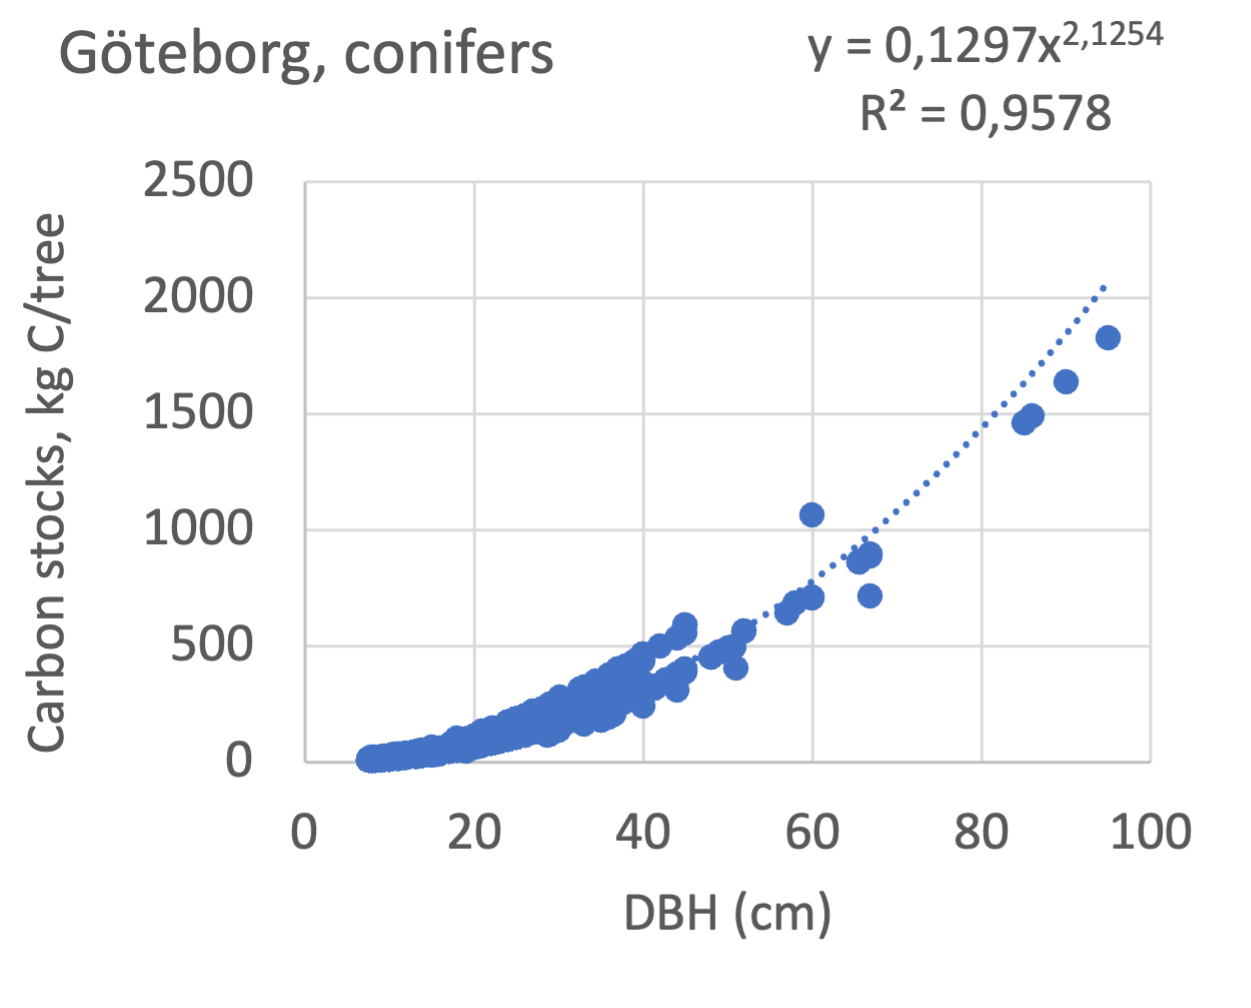
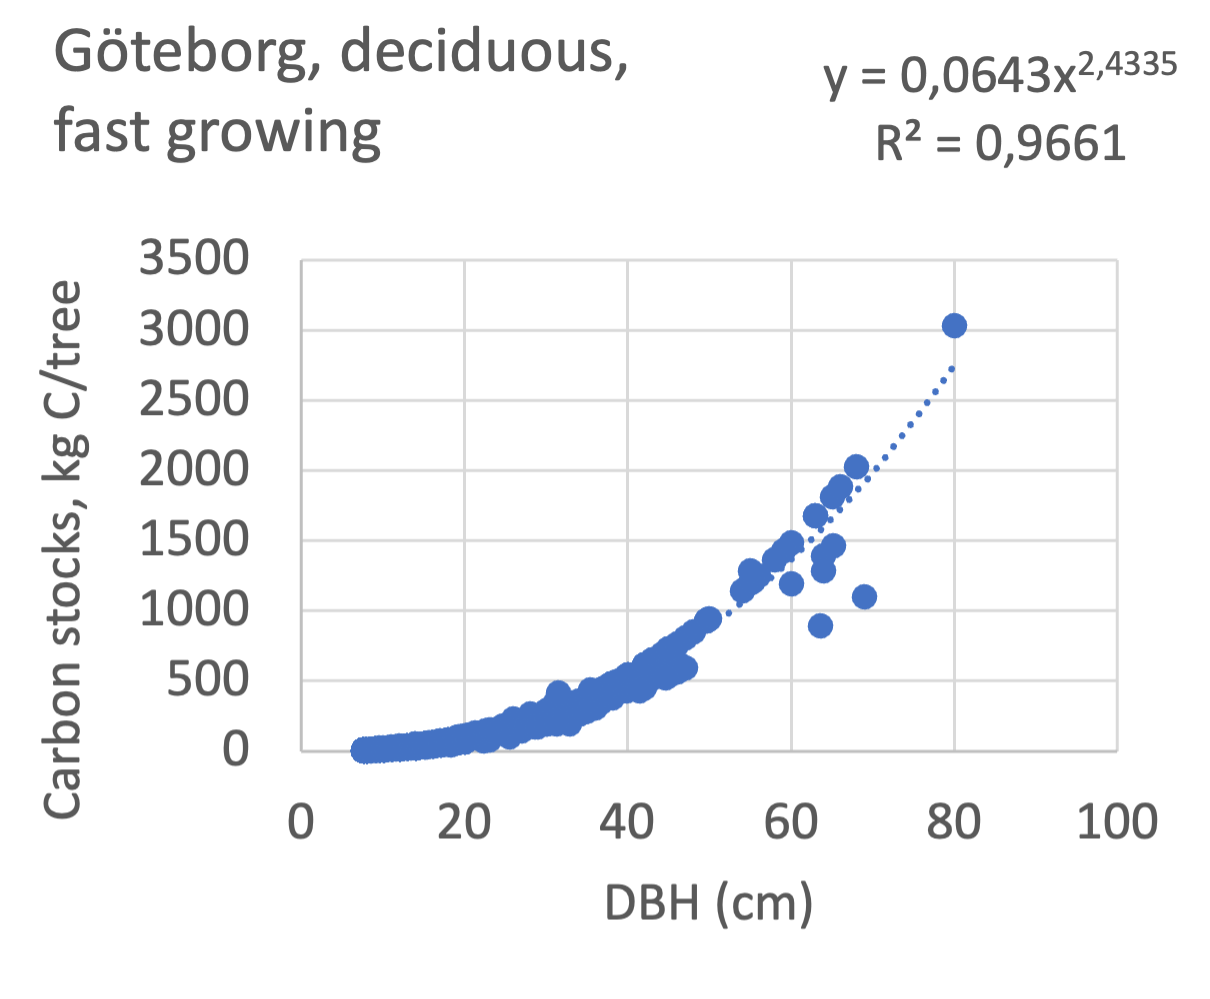
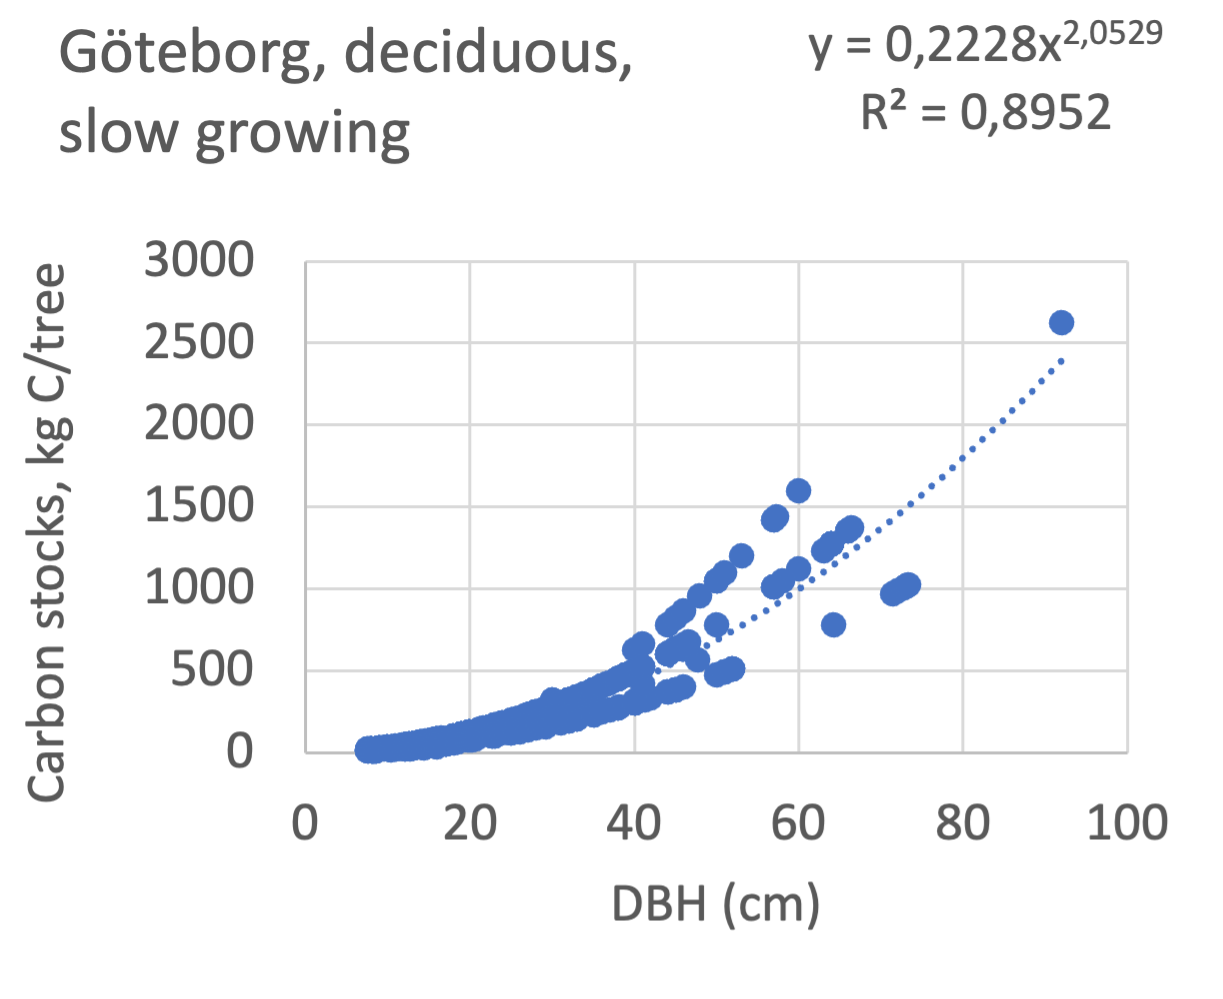
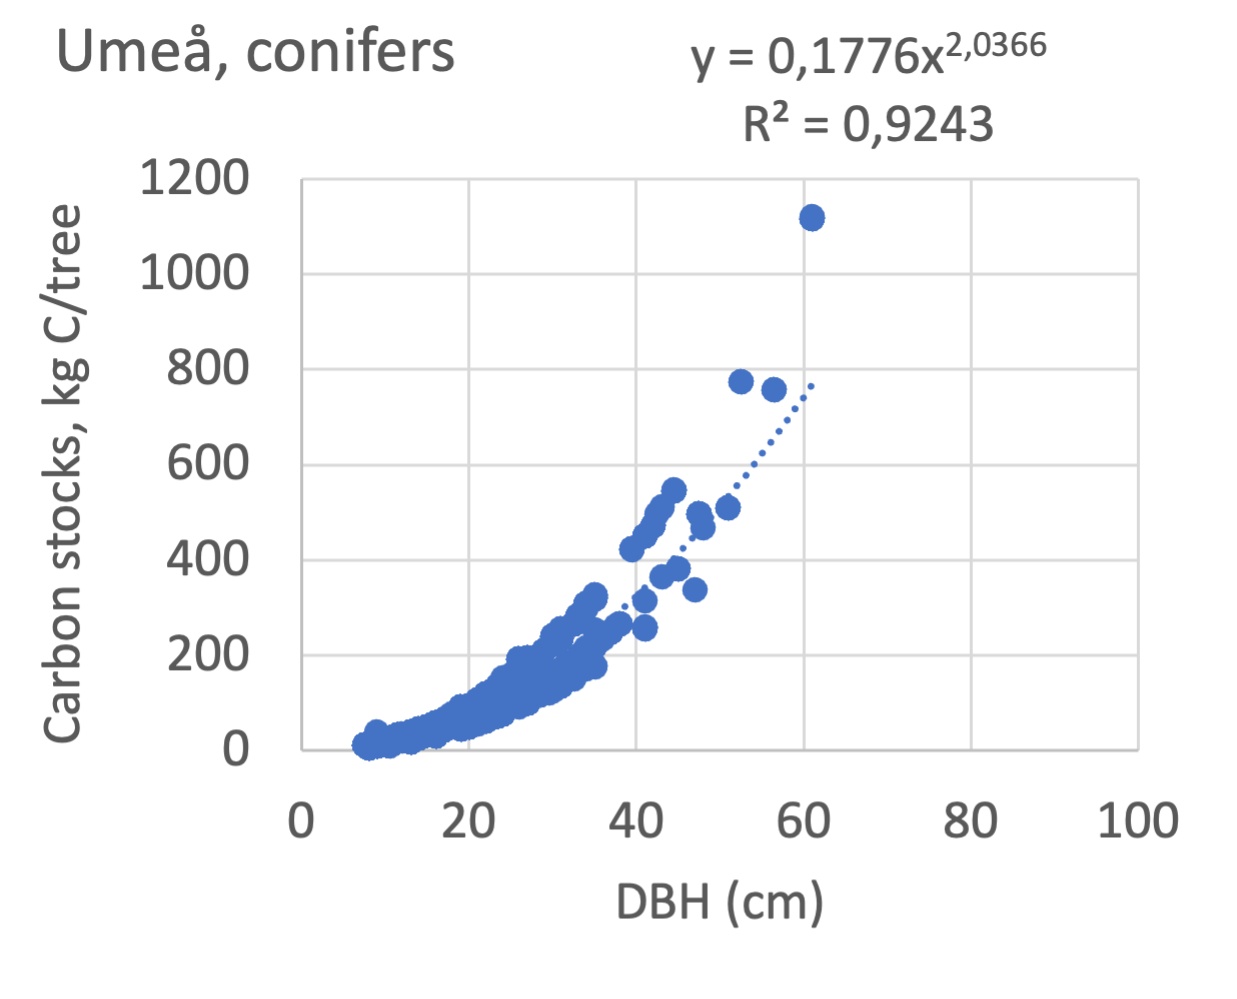
We also explored whether making a more detailed calculation of changes in tree carbon stocks was possible based on the i-Tree data using variables of diameter breast height (DBH), carbon stocks, and carbon sinks. Examples of the plotted relations between DBH and the carbon stocks and carbon sinks are shown for individual tree data for some different common species in Göteborg (Figure 7). It should be noted that the relations between DBH and carbon sinks/stocks should be used only within the DBH limits presented in each figure.
The relationships between DBH and the carbon sinks were relatively linear. However, the estimated intercepts were often negative, indicating a slight tendency for exponential relations. The relationships between DBH and the carbon stocks were clearly exponential, which is to be expected since the stem basal area correlates with the stem radius squared.
The analysis for Fagus sylvatica and Salix caprea in Göteborg had to be made separately for small and large trees, separated into DBH <60 cm and DBH >60 cm (Fagus sylvatica shown in Figure 7). Tree growth rates are sometimes expected to increase with age up to an optimum, after which the growth starts decreasing with age.
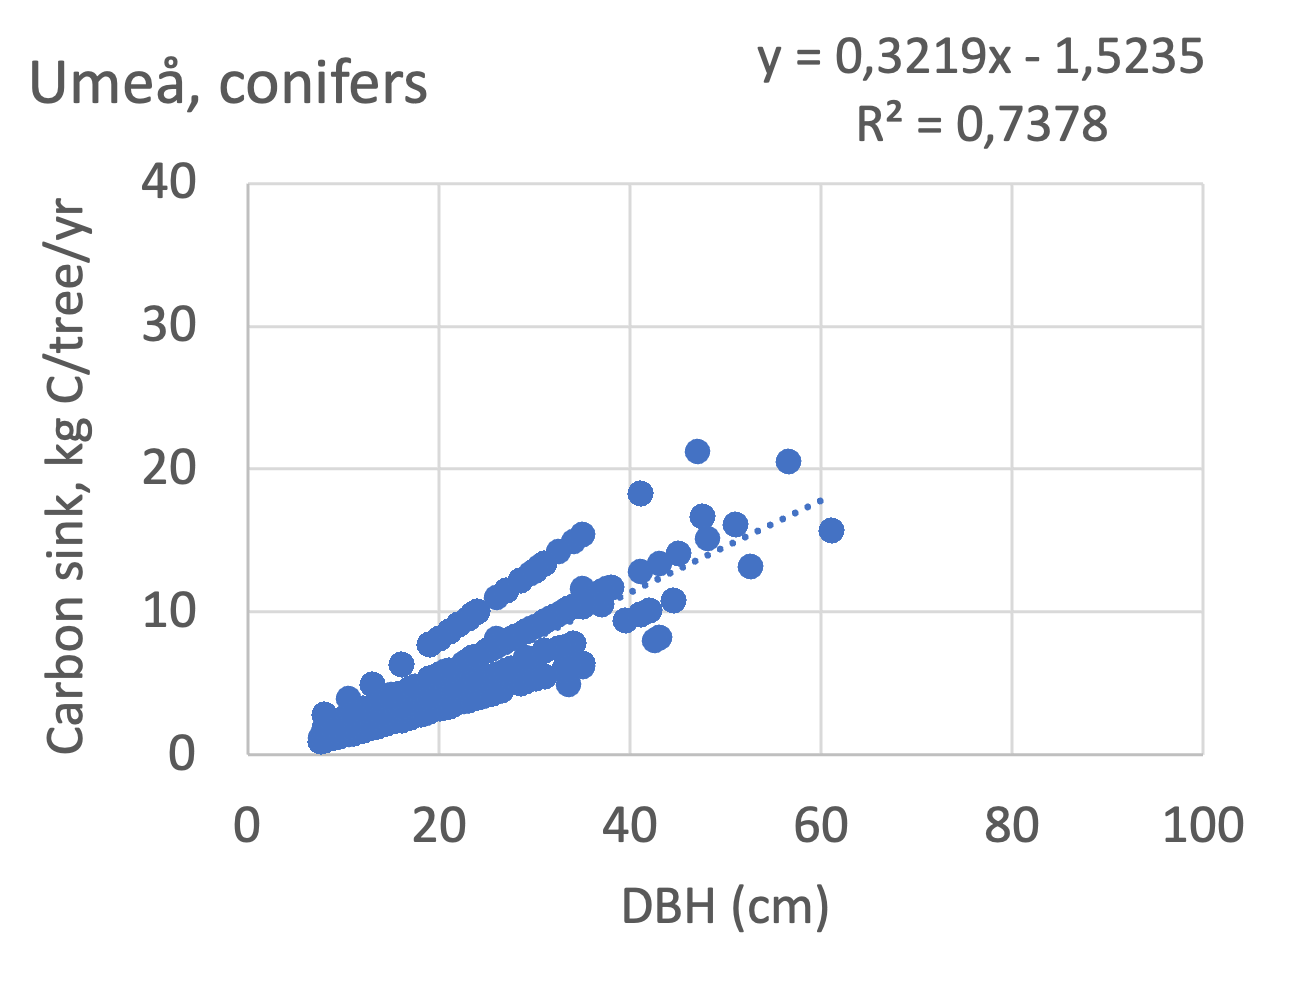
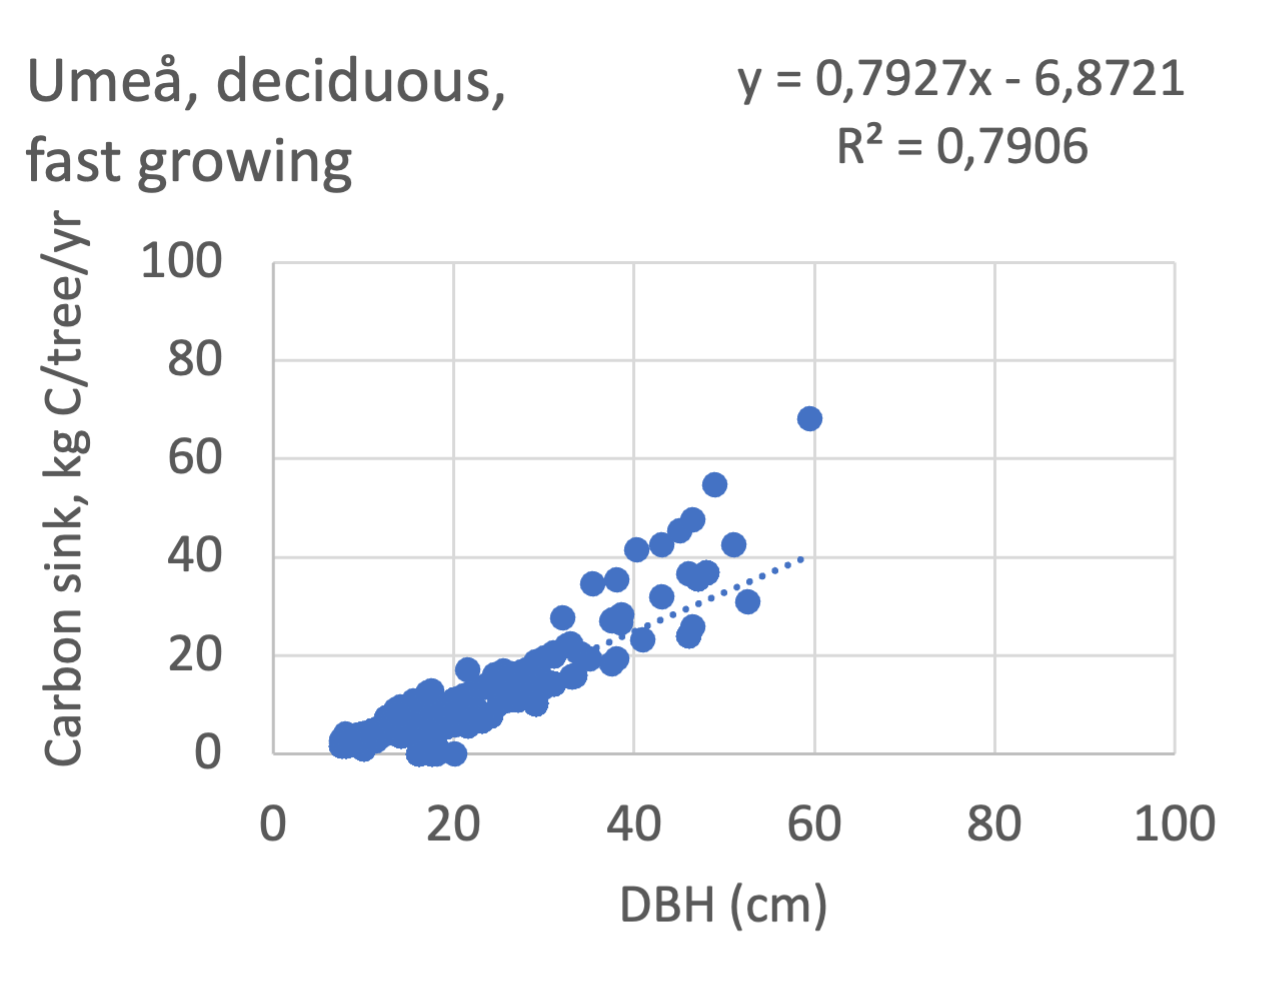
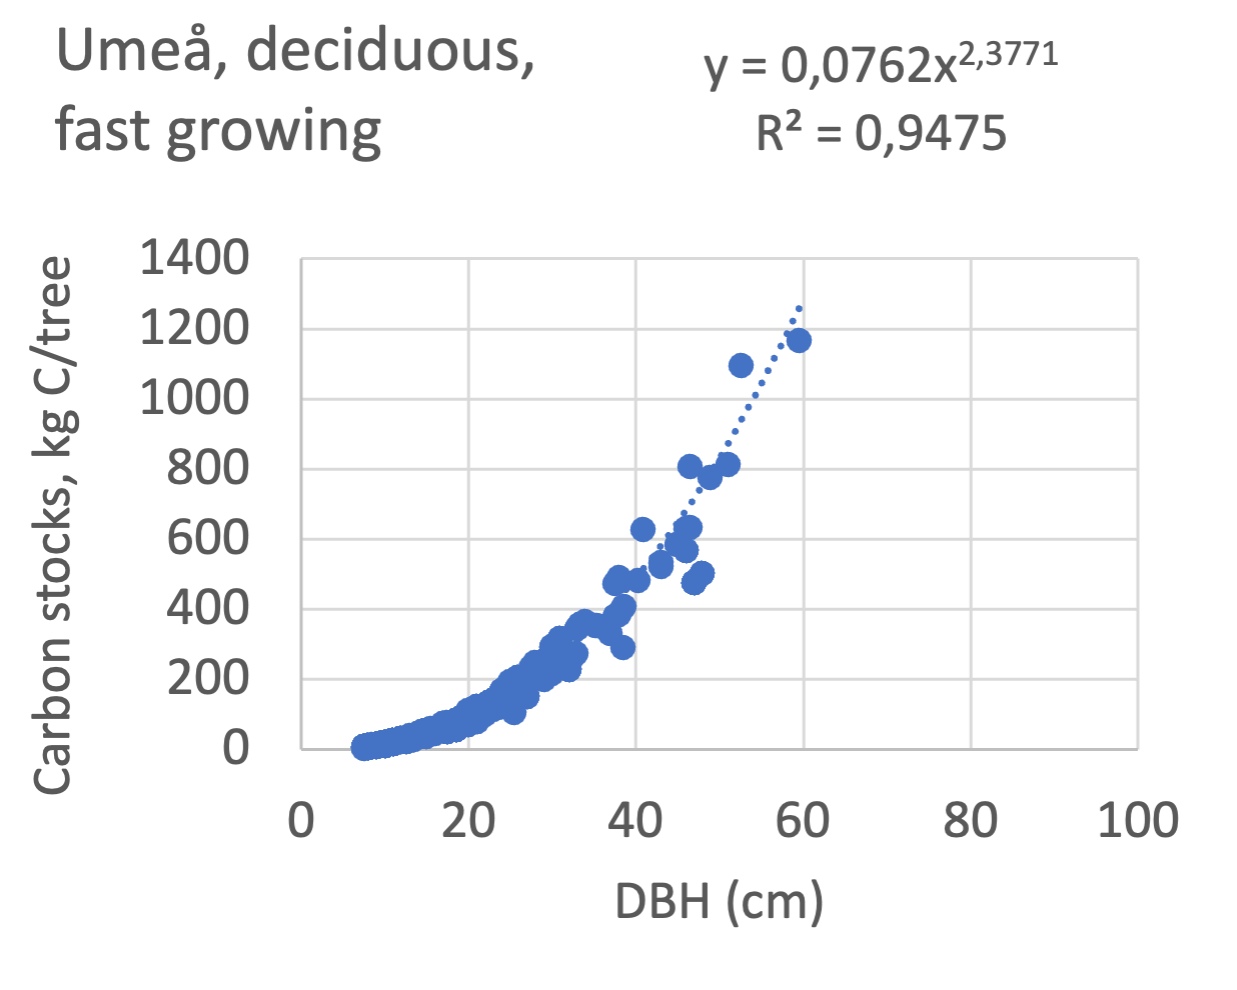
The results presented for the inventoried tree species were relatively similar between Göteborg, Umeå, and Malmö. Table 7 shows that broadleaf tree species were differentiated into slow- and fast-growing species. Figure 8 shows the relations between DBH, and the carbon sinks are shown for individual tree data for different tree species categories in the urban areas of Göteborg, Umeå, and Malmö. Similarly, Figure 9 shows the relationship between DBH and the carbon stocks.
Carbon stocks, kg C/tree
Carbon sinks, kg C/yr/tree
Carbon stocks, kg C/tree
Carbon sinks, kg C/yr/tree
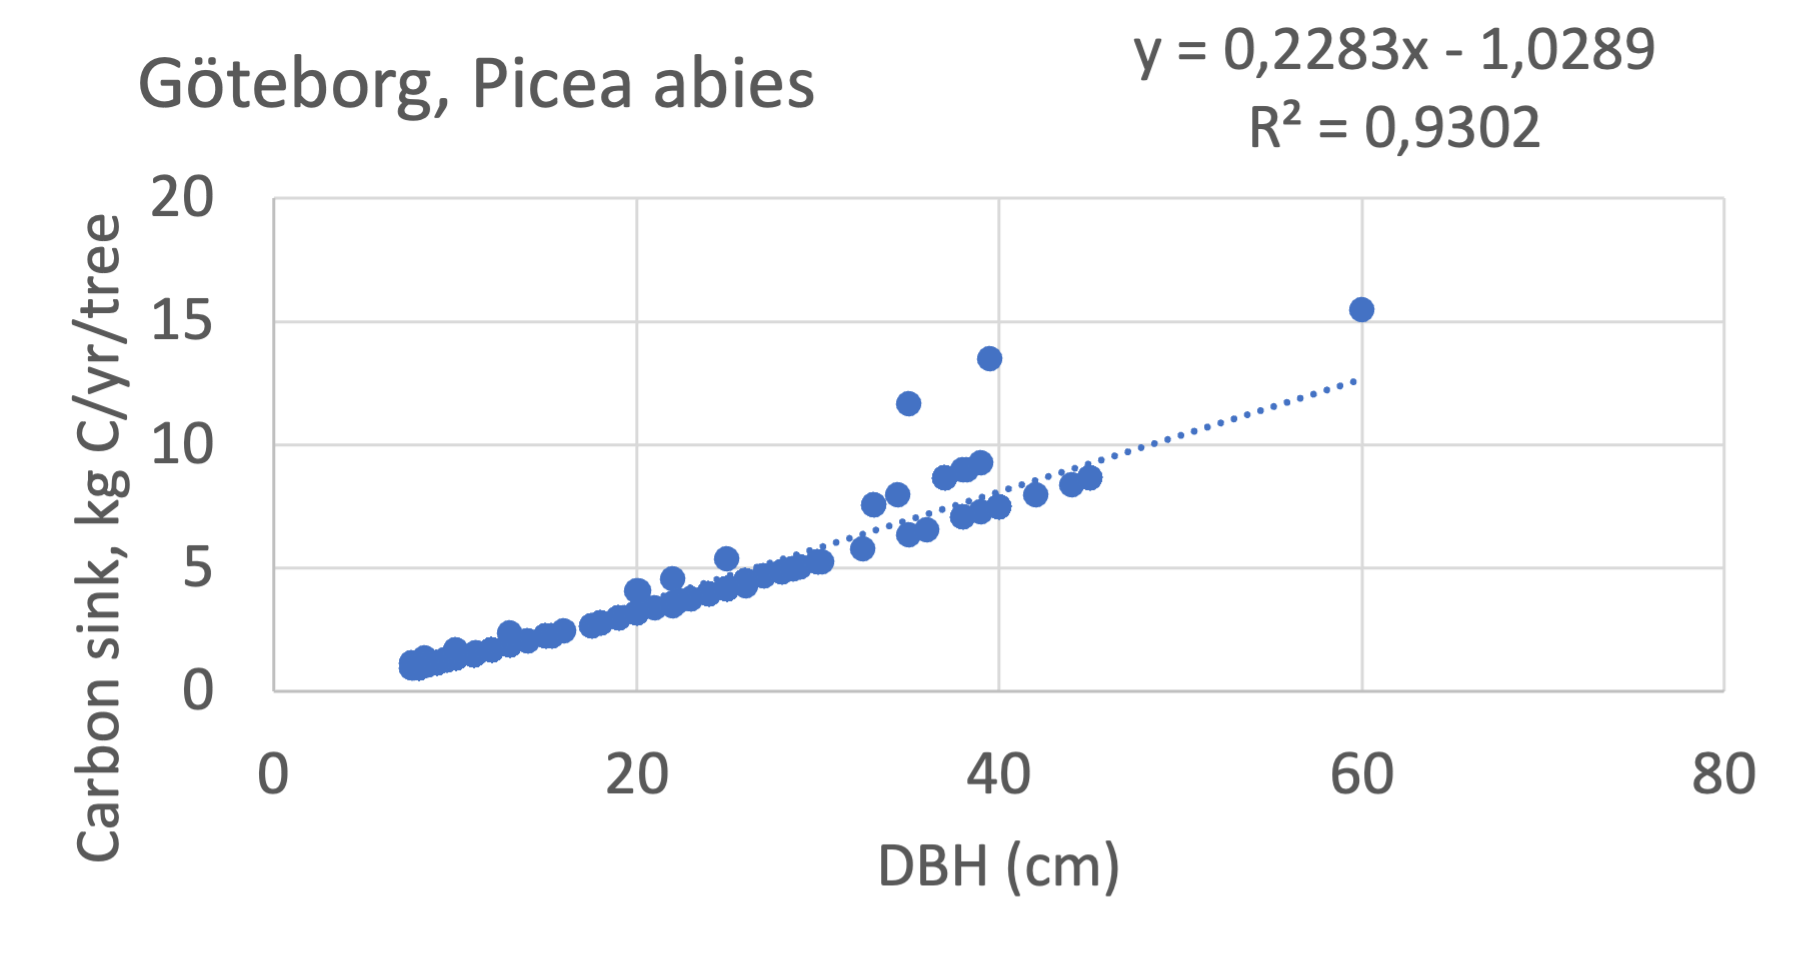
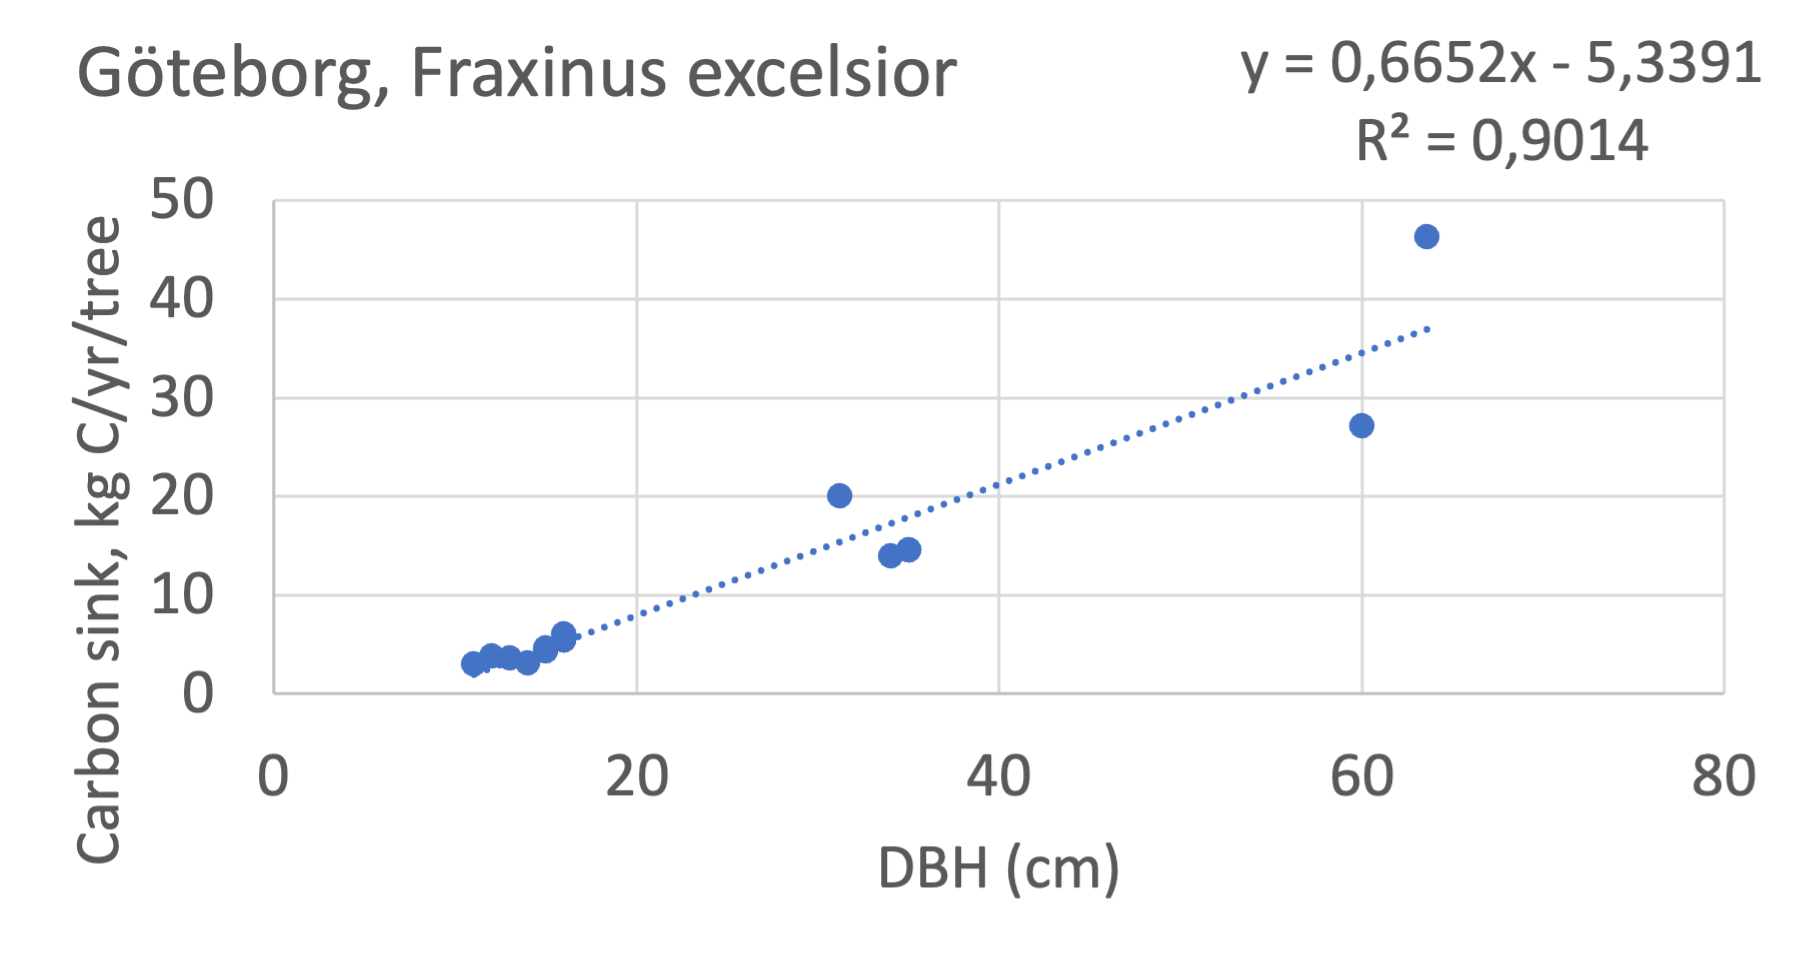
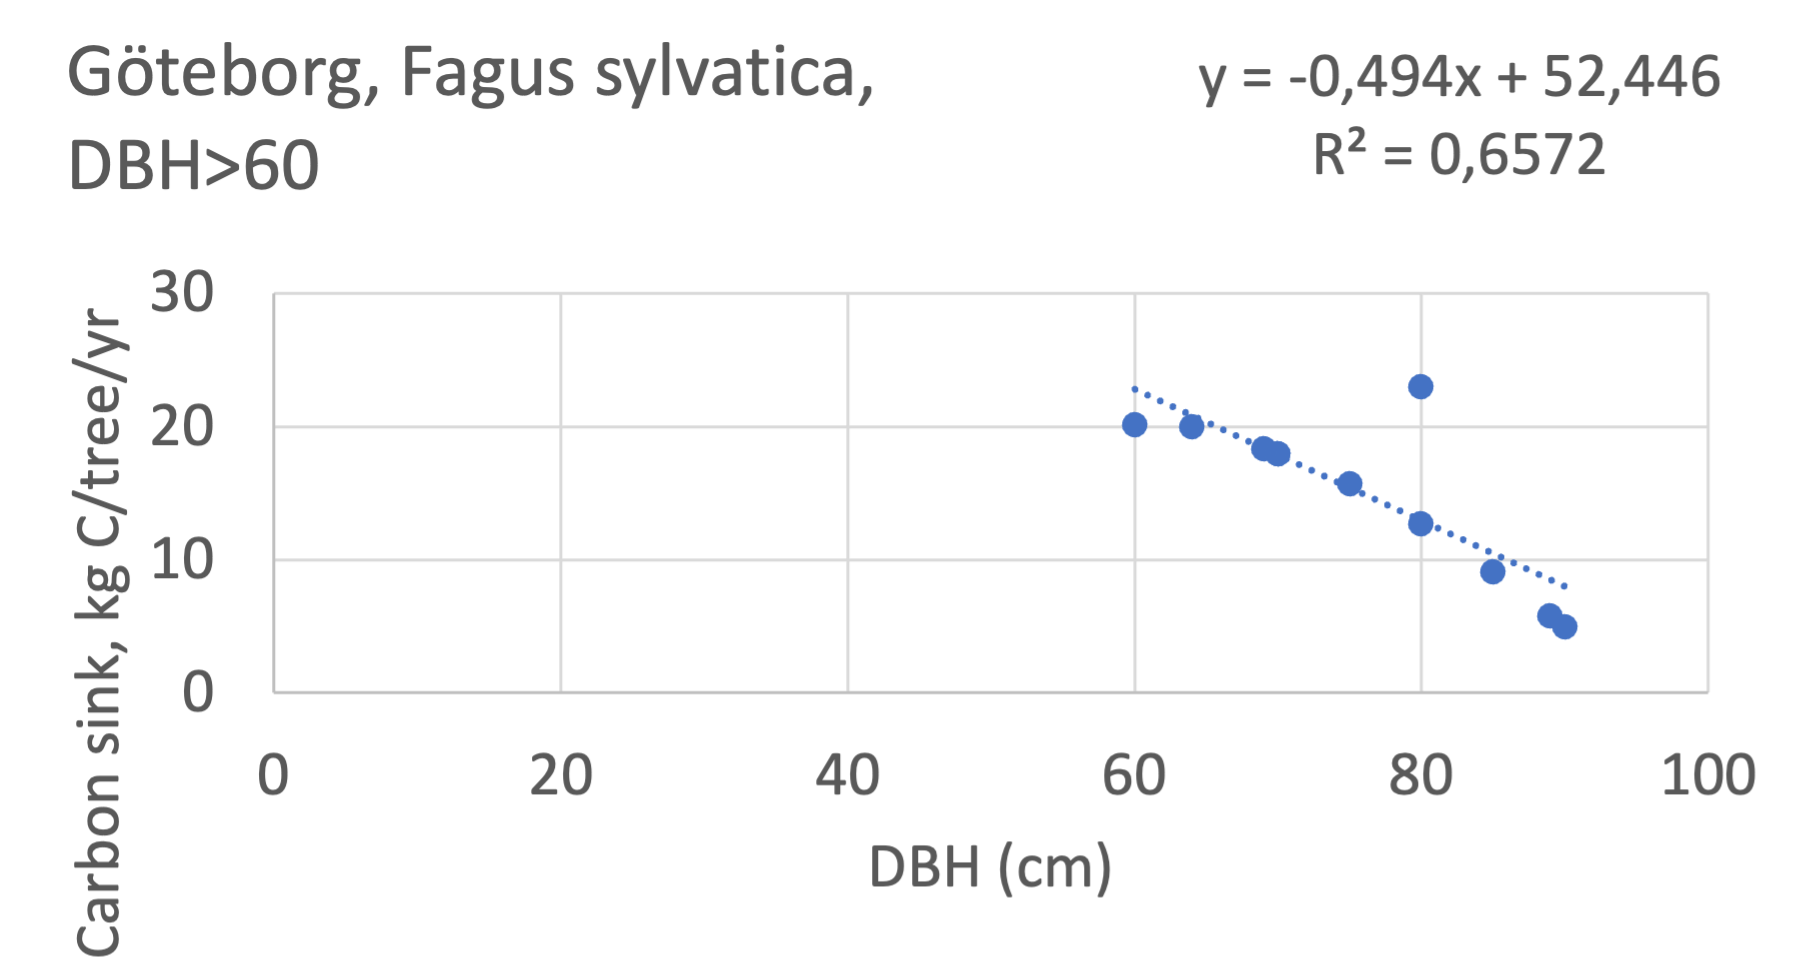
Figure 7 Examples of the calculated relations between DBH and the carbon stocks and carbon sinks are shown for individual tree data for some different common species in the Göteborg region. Upper row, conifers; middle row, broadleaf, fast-growing species; lower row, broadleaf, slow-growing species. The analysis for Fagus sylvatica was separated into one, including DBH <60 cm and another, including DBH >60 cm.
Göteborg | Umeå | Malmö | ||||||||
Tree species | Carbon sink vs DBH, linear regression | Carbon sink vs DBH, linear regression | Carbon sink vs DBH, linear regression | Growth classification | ||||||
Slope, kg C/ yr/ cm DBH | Intercept, kg C/ yr | R2 | Slope, kg C/ yr/ cm DBH | Intercept, kg C/ yr | R2 | Slope, kg C/ yr/ cm DBH | Intercept, kg C/ yr | R2 | fast = > max sink/2** | |
Conifers | ||||||||||
Juniperus communis | 0.22 | -0.6 | 0.54 | - | - | - | - | - | - | slow |
Picea abies | 0.23 | -1.0 | 0.93 | 0.26 | -1.4 | 0.90 | - | - | - | slow |
Pinus sylvestris | 0.32 | -1.4 | 0.90 | 0.38 | -1.4 | 0.81 | - | - | - | slow |
Broadleaf | ||||||||||
Acer campestre | - | - | - | - | - | - | 1.14 | -16 | 0.58 | fast |
Acer platanoides | 0.86 | -6.4 | 0.88 | - | - | - | - | - | - | fast |
Aesculus hippocastanum | - | - | - | - | - | - | 0.75 | -5.1 | 0.99 | fast |
Alnus glutinosa | 0.23 | 0.43 | 0.89 | - | - | - | - | - | - | slow |
Alnus incana | 0.10 | 0.05 | 0.64 | - | - | - | - | - | - | slow |
Betula pendula | 0.91 | -7.8 | 0.82 | - | - | - | - | - | - | fast |
Betula pubescens | 0.57 | -4.4 | 0.89 | 0.83* | -8.6 | 0.88 | - | - | - | fast |
Corylus avellana | 0.21 | -0.6 | 0.71 | - | - | - | - | - | - | slow |
Fagus sylvatica, DBH<60 | 0.32 | -1.7 | 0.84 | - | - | - | 0.64 | -5.7 | 0.99 | slow |
Fagus sylvatica, DBH>60 | -0.49 | 52.4 | 0.65 | - | - | - | - | - | - | slow |
Fraxinus excelsior | 0.67 | -5.4 | 0.90 | - | - | - | - | - | - | fast |
Malus sp | 0.79 | -4.3 | 0.99 | - | - | - | 0.67 | -3.1 | 0.99 | Fast*** |
Populus tremula | 0.56 | -3.8 | 0.95 | 0.82 | -6.9 | 0.94 | - | - | - | fast |
Prunus sp | 0.74 | -4.5 | 0.91 | 0.67 | -3.9 | 0.92 | 0.88 | -4.6 | 0.75 | fast |
Quercus petraea | 0.24 | -0.3 | 0.92 | - | - | - | - | - | - | slow |
Quercus robur | 0.43 | -0.3 | 0.90 | - | - | - | 0.71 | -2.1 | 0.91 | slow |
Salix alba | - | - | - | - | - | - | 0.57 | -4.6 | 0.99 | slow |
Salix caprea, DBH<30 | 0.41 | -2.4 | 0.84 | - | - | - | - | - | - | slow |
Salix caprea, DBH>30 | -0.28 | 17.1 | 0.48 | - | - | - | - | - | - | slow |
Sorbus aucuparia | 0.59 | -2.5 | 0.84 | 0.90 | -6.1 | 0.85 | 0.76 | -2.2 | 0.99 | fast |
Tilia cordata | - | - | - | - | - | - | 0.53 | -3.6 | 0.99 | slow |
Tilia europea | - | - | - | - | - | - | 0.67 | -10.8 | 0.99 | slow |
Ulmus glabra | 0.58 | -4.3 | 0.81 | - | - | - | - | - | - | fast |
* All Betula in Umeå were assumed to be Betula pubescences. ** This criterion was assessed separately for each city. This criterion must be valid for all cities where this tree species was present and inventoried to be characterised as fast-growing. *** Assessed as slow-growing in Malmö. | ||||||||||
Table 7 The relationships between stem diameter at breast height (DBH) and the carbon sink rates of different tree species in Göteborg, Umeå, and Malmö. Tree carbon sink rates are classified into conifers and fast- and slow-growing broadleaf species, respectively. Fast-growing broadleaf species are marked with a grey background. For Fagus sylvatica and Salix caprea in Göteborg, separate calculations were made for trees above and below a DBH threshold of 60 cm. Species were classified as fast-growing when the carbon sink rates exceeded the maximum sink rates at the specific city divided by 2. The maximum sink rates for any tree species were 0.90 kg C/ yr/ cm DBH for Umeå, 0.91 kg C/ yr/ cm DBH for Göteborg, and 1.44 kg C/ yr/ cm DBH for Malmö.
Göteborg
Umeå
Malmö
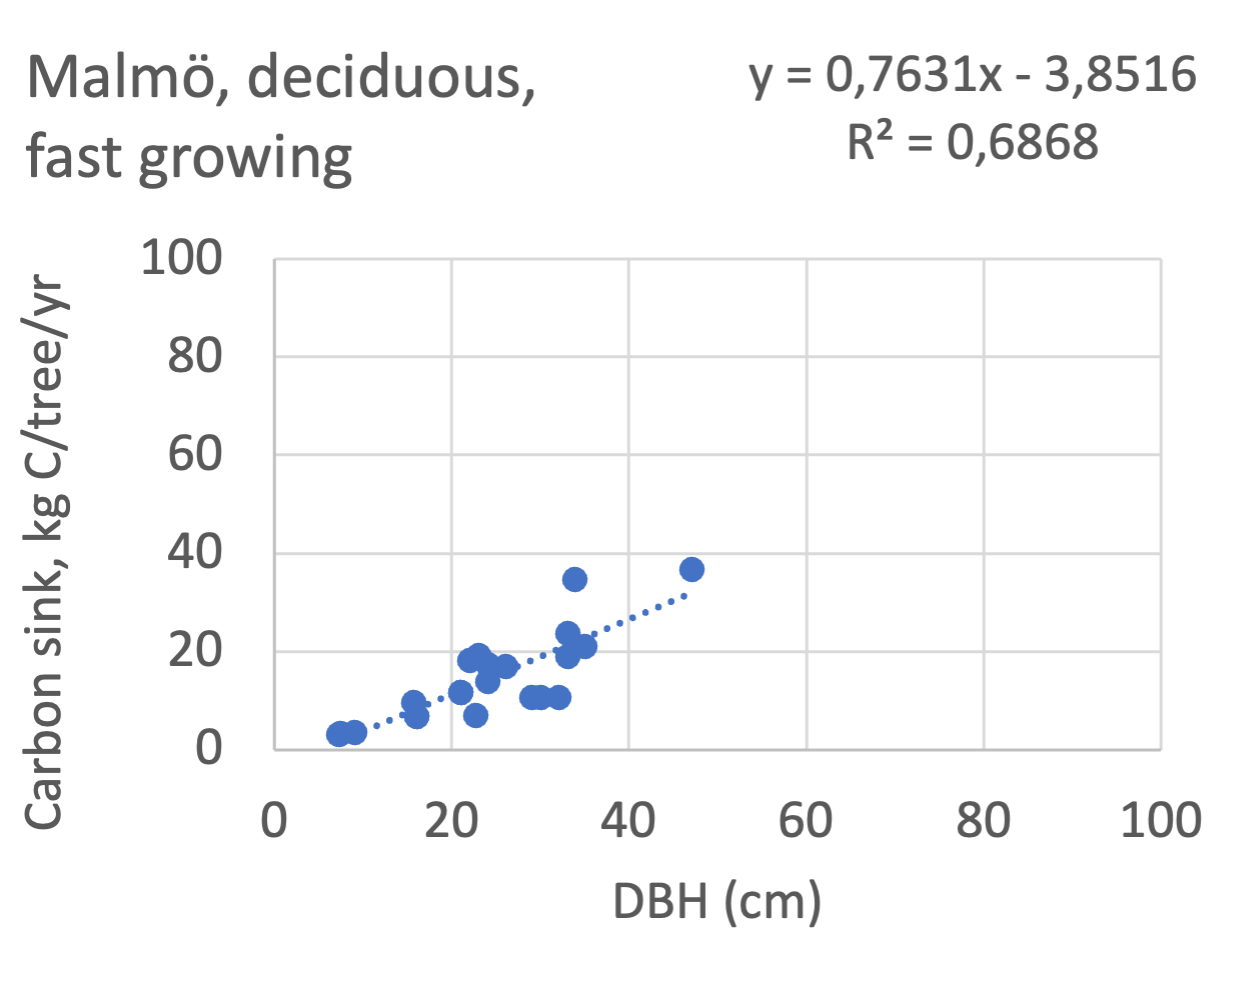
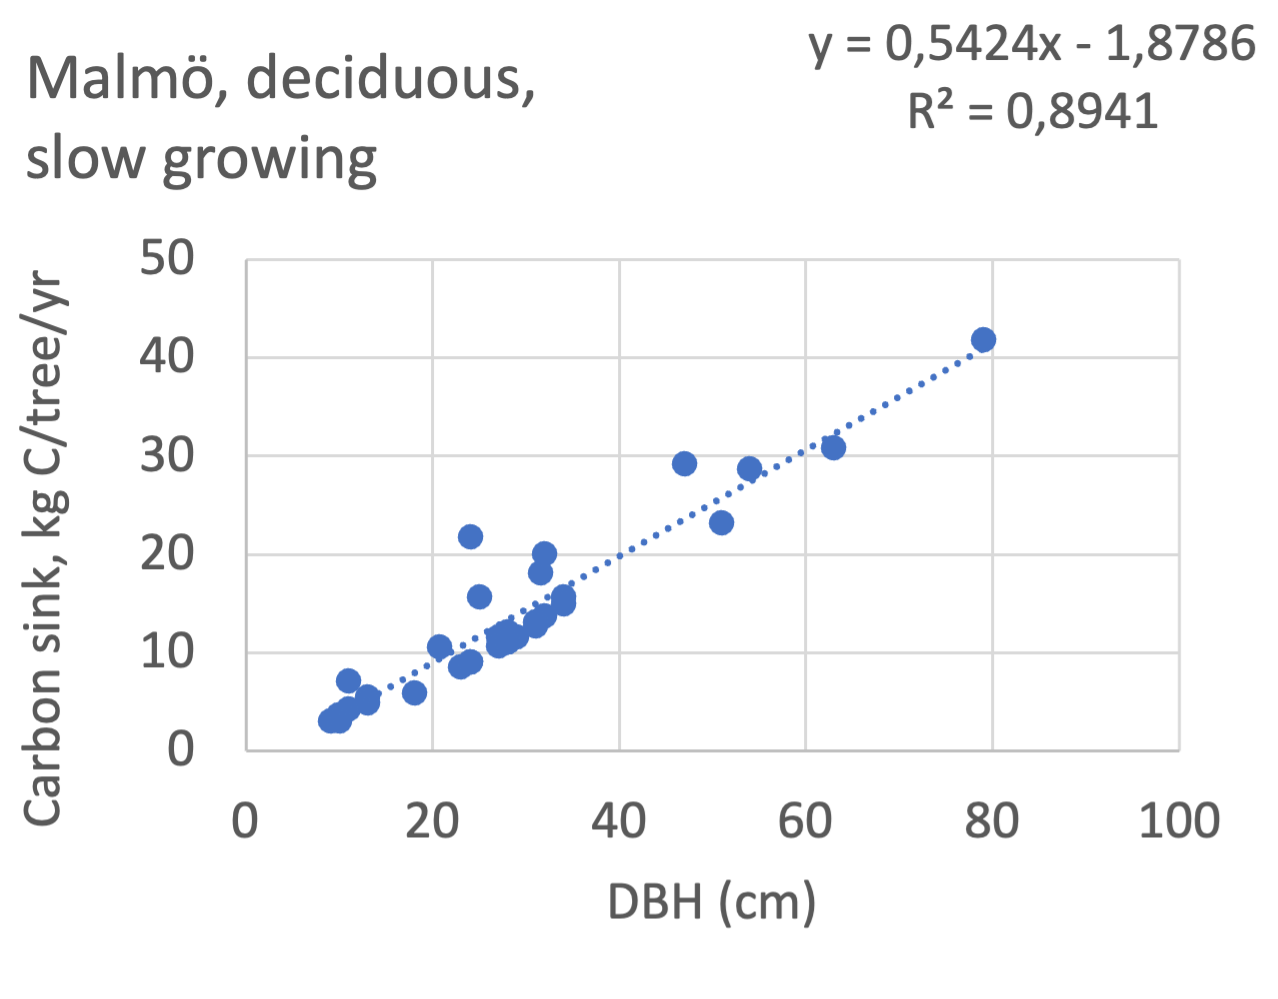
Figure 8 Relations between diameter at breast height (DBH) and the carbon sinks (kg C tree-1 year-1) are shown for individual tree data for different tree species categories in Göteborg, Umeå, and Malmö’s urban areas. Upper row, coniferous tree species; middle row broadleaf, fast-growing species; lower row, broadleaf, fast-growing species. Table 7 shows the category for each tree species. There were no inventories of slow-growing deciduous species in Umeå and no coniferous species in Malmö.
Göteborg
Umeå
Malmö
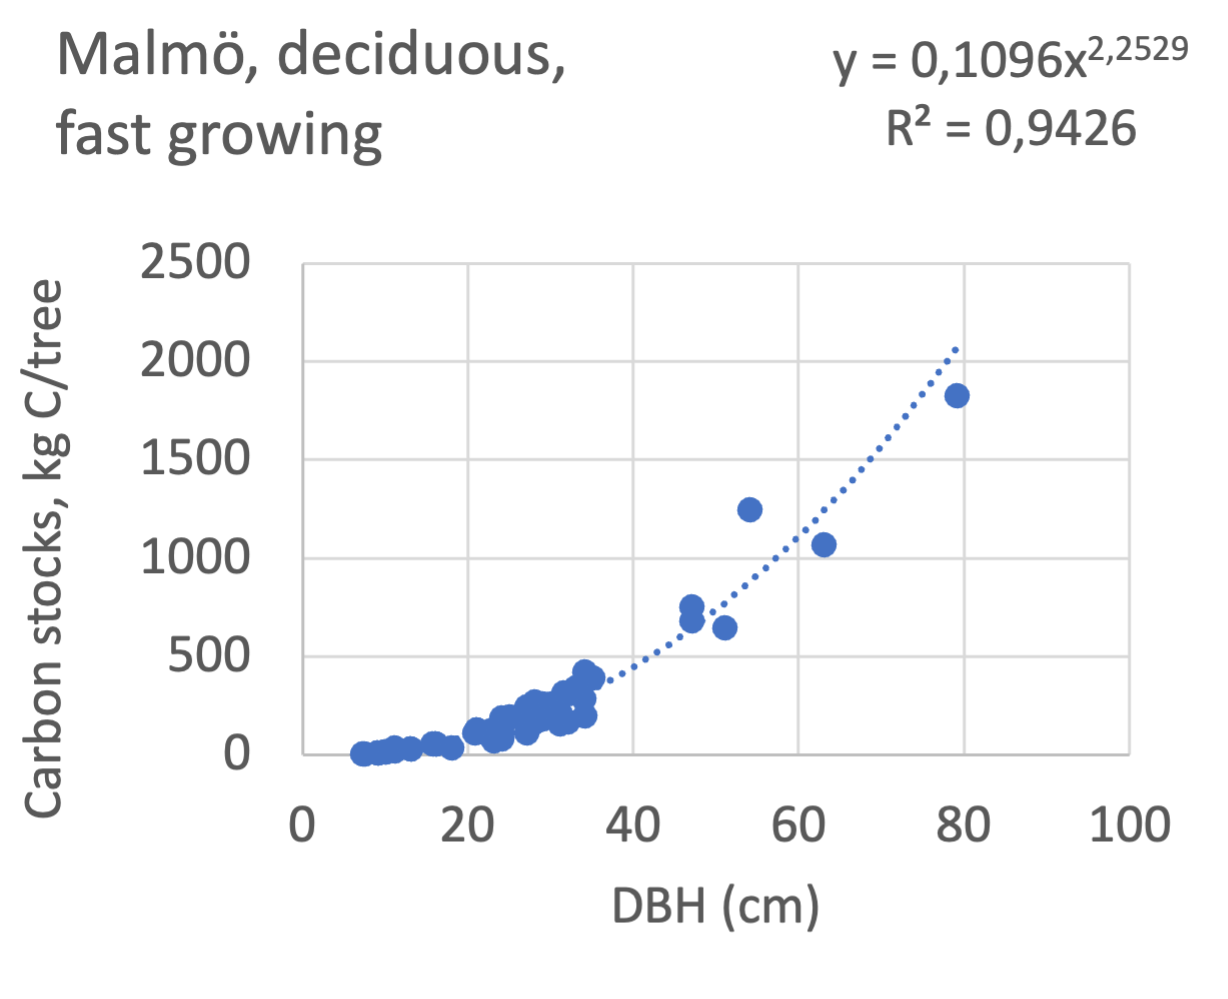
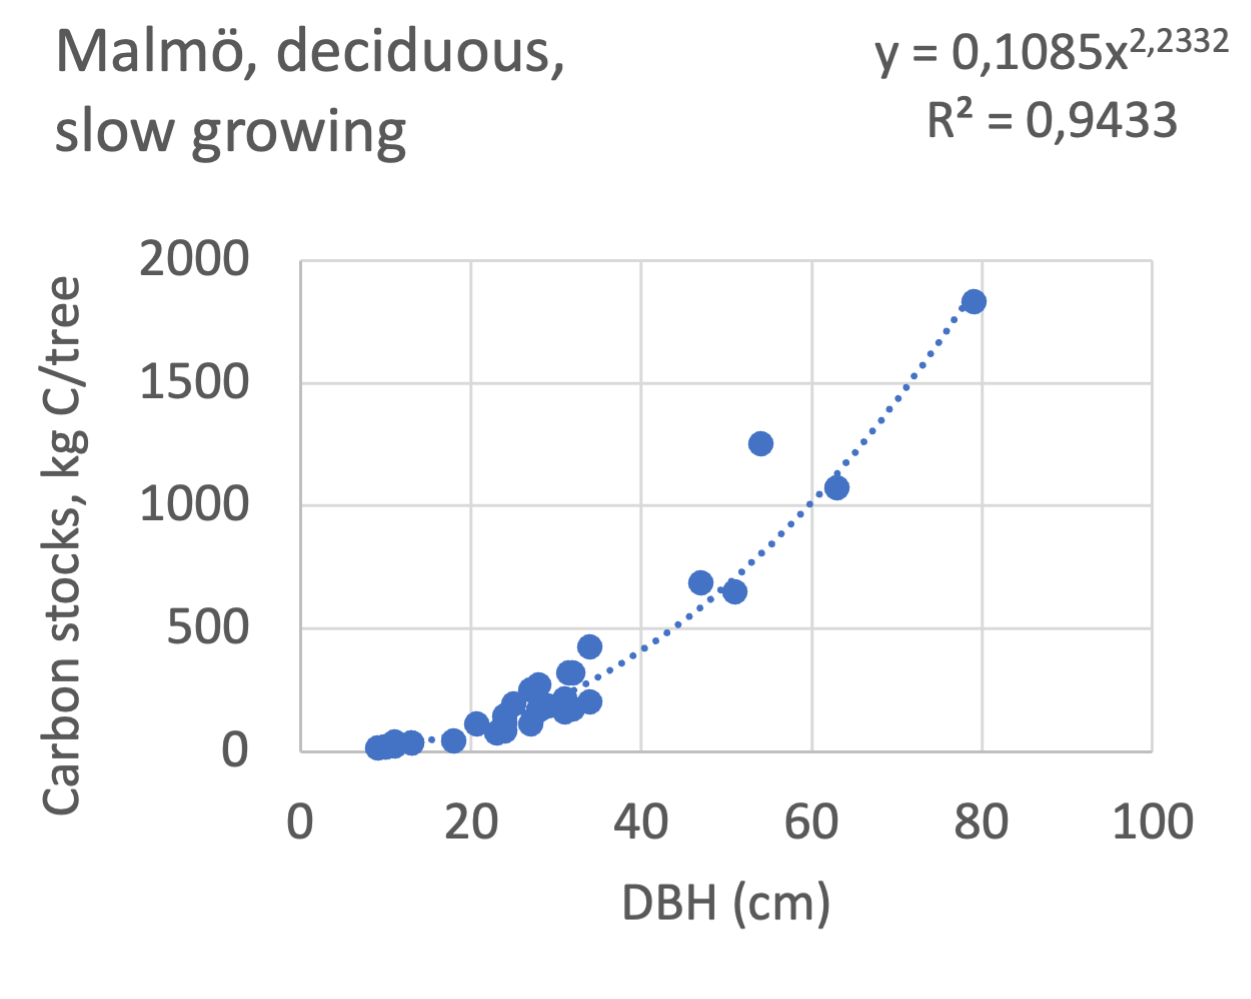
Figure 9 Relations between diameter at breast height (DBH) and the carbon stocks (kg C tree-1) are shown for individual tree data for different tree species categories in Göteborg, Umeå, and Malmö’s urban areas. Upper row, coniferous tree species; middle row broadleaf, fast-growing species; lower row, broadleaf, fast-growing species. Table 7 shows the category for each tree species. There were no inventories for slow-growing deciduous species in Umeå and no coniferous species in Malmö.
Values for emission database for construction
Trees or other living vegetation are not included in construction emission databases, and no obligation exists to include them. This report aimed to provide estimates of the types of activities in urban green spaces that contribute to the carbon sink of green spaces and information on the quantitative size of the carbon sink of trees.
The estimates for the emission database for construction (Table 8) shown here are separate mean values for park and street trees and grouped by tree type into broadleaf and conifer tree groups. An assessment for three scenarios was conducted, considering the changes for an individual tree if the tree is planted, removed, or retained in the construction area. Estimates considered the biogenic carbon sequestration and the life cycle emissions from nursery production, planting, maintenance, and tree removal (see table 3 for detailed information).
The results show that over a 50-year period, the amount of carbon sequestered by trees is significantly higher than emissions from nursery, maintenance, or removal, which are included in information of life cycle assessment in Table 8. In addition, the planting of street and park trees and their maintenance differ, resulting in slightly higher GHG emissions for street trees. However, the difference is slight and, in the overall picture, does not greatly impact final estimates. A comparison between groups shows that typically, faster-growing broadleaf types sequester carbon more efficiently than conifers. Notably, the results are rough simplifications and do not consider, e.g. actual growing conditions, actual tree size or tree species, and factors that significantly affect the growth and actual carbon sequestration capacity of an individual tree.
Tree scenario | Broadleaf/ Conifer | Park tree/ Street tree | Biogenic carbon sink | Life cycle assessment | CO2 sink/emission | |
CO2 - 50 years | CO2 - 50 years | Total 50 years | per year | |||
Planted | Broadleaf | Park | -1073 | 224 | -849 | -17 |
Street | -1073 | 285 | -788 | -16 | ||
Conifer | Park | -519 | 224 | -295 | -6 | |
Street | -519 | 285 | -234 | -5 | ||
Removed - Current | Broadleaf | Park | 1631 | 13 | 1644 | 33 |
Street | 1631 | 13 | 1644 | 33 | ||
Conifer | Park | 828 | 13 | 841 | 17 | |
Street | 828 | 13 | 841 | 17 | ||
Remained | Broadleaf | Park | -1479 | 199 | -1280 | -26 |
Street | -1479 | 197 | -1282 | -26 | ||
Conifer | Park | -901 | 199 | -702 | -14 | |
street | -901 | 197 | -704 | -14 | ||
Table 8 Combined results for life cycle GHG emissions and biogenic carbon sink by tree for scenarios (Planted, Removed, Removed current and Remained) and are grouped by broadleaf and conifer type trees and park and street trees. Here, negative values refer to the carbon sink and positive values to the carbon source.
Conversely, soil composition is the primary determinant of GHG emissions produced during a tree’s life cycle, and soil composition is included here in the scenarios of planted and remained trees (Table 8). This report has not compared different compositions of soil, but results showed that the highest emissions occur when peat is used. Thus, the peat fraction in soil composition is important when considering GHG emissions.
The scenario comparison shows that the highest carbon sink is achieved when trees are retained in the area. Tree removal results in the highest emissions; however, these emissions can be partly compensated for by planting new trees. It is important to remember that the figures are generalisations based on several assumptions about Finnish conditions and most typical practices; therefore, applicability is important to assess on a case-by-case basis.
The results in this report were calculated using i-Tree data from Sweden and Finland. The results may apply to a geographically similar region but cannot be generalised as such to, e.g. all Northern European countries. Tree growth depends on local conditions and the tree species used, which vary significantly along the north-south axis as one moves from one vegetation zone to another. Differences were visible when comparing carbon sequestration between Swedish cities, although a thorough statistical comparison was not the aim of this study and, therefore, was not carried out. However, the methods used to calculate the results in this report can be used to carry out calculations at the local level in other countries.
Acknowledgements
Source data from the Swedish i-Tree project was kindly provided by Johanna Deak Sjöman, and we are grateful for providing the data that made these calculations possible.
References
Amlinger, F. & Peyr, S. (2008). Green house gas emissions from composting and mechanical biological treatment. Waste Management & Research 2008: 26: 47–60. DOI: 10.1177/0734242X07088432
Andersen, J.K., Boldrin, A., Christensen, T.H., & Scheutz, C. (2010). Mass balances and life-cycle inventory for a garden waste windrow composting plant (Aarhus, Denmark) Waste Management & Research. 28(11) 1010–1020. DOI: 10.1177/0734242X10360216
Czaja, M., Kołton, A., & Muras, P. (2020). The Complex Issue of Urban Trees—Stress Factor Accumulation and Ecological Service Possibilities. Forests11, 932. https://doi.org/10.3390/f11090932
Deak Sjöman, J. & Östberg, J. (2020). i-Tree Sweden – Strategic work with ecosystem services provided by urban trees. Swedish University of Agricultural Science, Institutionen för landskapsarkitektur, planering och förvaltning, ISBN 78-91-576-9769-1
Erlandsson, M., Mattsson E., & Nilsson J. (2022). Negativa klimatutsläpp genom användning av biogena kolsänkor. IVL Svenska Miljöinstitutet rapport C 689, juli 2022.
Hardiman, B.S., Wang, J.A., Hutyra, L.R., Gately, C.K., Getson, J.M., & Friedl, M.A. Accounting for urban biogenic fluxes in regional carbon budgets, Science of The Total Environment, Volume 592, 2017, pp. 366–372, ISSN 0048-9697, doi.org/10.1016/j.scitotenv.2017.03.028.
Havu, M., Kulmala, L., Kolari, P., Vesala, T., Riikonen, A., & Järvi, L. Carbon sequestration potential of street tree plantings in Helsinki, Biogeosciences, 19, 2121–2143, https://doi.org/10.5194/bg-19-2121-2022, 2022
Havu, M., Kulmala, L., Shing Lee, H., Saranko, O., Soininen, J., Ahongshangbam, J., & Järvi, L. CO2 uptake of urban vegetation in a warming Nordic city. Urban Forestry & Urban Greening, 2024, https://doi.org/10.1016/j.ufug.2024.128261
Hermansdorfer M: Personal communication January 2024 with Mariusz Hermansdorfer, Head of Computational Design, Henning Larsen, Vesterbrogade 76, 4. DK1620 Copenhagen V Denmark.
Hermansdorfer M et al: Manuscript submitted 2023 to: Journal of Digital Landscape Architecture (JoDLA) e-ISSN 2511-624X.
IPCC. (2021): Summary for Policymakers. In: Climate Change 2021: The Physical Science Basis. Contribution of Working Group I to the Sixth Assessment Report of the Intergovernmental Panel on Climate Change [Masson-Delmotte, V., P. Zhai, A. Pirani, S.L. Connors, C. Péan, S. Berger, N. Caud, Y. Chen, L. Goldfarb, M.I. Gomis, M. Huang, K. Leitzell, E. Lonnoy, J.B.R. Matthews, T.K. Maycock, T. Waterfield, O. Yelekçi, R. Yu, & B. Zhou (eds.)]. Cambridge University Press, Cambridge, United Kingdom and New York, NY, USA, pp. 3−32, doi:10.1017/9781009157896.001
Karlsson P.E., Pleijel, H., Fowler, P., Farahat, E.A., Hans W. Linderholm, H.W., Engardt, M., & Andersson, C. (2023). Stem growth of Norway spruce in south Sweden in relation to soil moisture, nitrogen deposition, ozone exposure and meteorological variables. Forest Ecology and Management 549, 121455.
Lindahl, A. & Lundblad, M. (2022). Kolförråd och kolsänka i skog och mark inom Stockholms stad. Rapport Skog 2022:2. Sveriges lantbruksuniversitet, Umeå. 68 pages.
Litvak, M., Miller, S., Wofsy, S.C., & Goulden, M. (2003). Effect of stand age on whole ecosystem CO2 exchange in the Canadian boreal forest, J. Geophys. Res., 108, 8225, doi:10.1029/2001JD000854, D3.
Swedish Environmental Protection Agency. (2022). National Inventory Report Sweden 2022. Submitted under the United Nations Framework Convention on Climate Change and the Kyoto Protocol.
Nowak, D. (2021). Understanding i-Tree: 2021 Summary of Programs and Methods. NRS-200-2021. Madison, WI: USDA Forest Service One Gifford Pinchot Drive.
Nowak, D.J., Greenfield, E.J., Hoehn, R.E., & Lapoint, E. (2013). Carbon storage and sequestration by trees in urban and community areas of the United States. Environmental Pollution, 178, pp. 229–236. https://doi.org/10.1016/j.envpol.2013.03.019
Rossi, S., Deslauriers, A., Anfodillo, T., Morin, H., Saracino, A., Motta, R., & Borghetti, M. (2006). Conifers in cold environments synchronize maximum growth rate of tree-ring formation with day length. New Phytologist, 170: 301–310. doi.org/10.1111/j.1469-8137.2006.01660.x
Råberg, Tora (ed): Potentiella kolsänkor i Malmö stad. Miljöförvaltningen, Malmö stad, 2022-04-27.
Smith, I.A., Dearborn V.K., & Hutyra L.R. (2019). Live fast, die young: Accelerated growth, mortality, and turnover in street trees PLOS ONE 14(5): e0215846. https://doi.org/10.1371/journal.pone.0215846
Thomas, S.C. & Martin, A.R. (2012). Carbon Content of Tree Tissues: A Synthesis. Forests 3, 332-352. doi.org/10.3390/f3020332
Toochi, E.C. (2018). Carbon sequestration: how much can forestry sequester CO2? Forest Res Eng Int J. 2(3):148–150. DOI: 10.15406/freij.2018.02.00040
Vaccari, F.P., Gioli, B., Toscano, P., & Perrone, C. Carbon dioxide balance assessment of the city of Florence (Italy), and implications for urban planning, Landscape and Urban Planning, Volume 120, 2013, pp. 138–146, https://doi.org/10.1016/j.landurbplan.2013.08.004
Vogt, J., Hauer, R.J., & Fischer, B.C. (2015). The costs of maintaining and not maintaining the urban forest: A review of the urban forestry and arboriculture literature. Arboriculture & Urban Forestry, 41(6), pp. 293–323.
The Fælledby project: https://henninglarsen.com/en/projects/featured/1915-faelledby/
Urban Forestry network http://urbanforestrynetwork.org/benefits/air%20quality.htm
Stichnothe 2022. Life cycle assessment of peat for growing media and evaluation of the suitability of using the Product Environmental Footprint methodology for peat. The International Journal of Life Cycle Assessment (2022) 27:1270–1282. https://doi.org/10.1007/s11367-022-02106-0