2. Methodology
In this chapter, we present the overall methodology we use to investigate the prevalence and combination of employment barriers that individuals with no or weak labour market attachment face, as well as how we group these individuals based on the employment barriers they face. First, we describe the data we have used. Second, we describe how we have used the data to form the population of interest. Third, we briefly use our developed framework over employment barriers in the Nordic countries as a point of departure to describe how we understand employment barriers and how we operationalise them in data
2.1 Data
In this study, we aim to assess the potential effectiveness of shifting the focus in employment policies within the Nordic countries from traditional demographic target groups to more directly addressing employment barriers. To examine this, we utilise microdata from Eurostat, specifically Eurostat's Statistics on Income and Living Conditions (SILC). EU-SILC provides a comprehensive data set containing variables related to various household information, such as income, labour market attachment, and number of children in the household. By analysing this rich data set, we aim to assess the viability of emphasising employment barriers as a fruitful approach in shaping employment policies.
Statistics on Income and Living Conditions (SILC)
The EU statistics on income and living conditions (SILC) is a household and individual data collection, and its aim is to collect timely and comparable cross-sectional and longitudinal data on income, poverty, social exclusion, and living conditions, among other things.
We use the most recent available EU-SILC from the Nordic countries. Unfortunately, there is some discrepancy as to which years are the most recent across the Nordic countries. The latest available data on Sweden, Finland, and Denmark are from 2021, the latest data on Norway are from 2020, and the latest data on Iceland are from 2018.
The EU-SILC in the Nordic countries uses a selected respondent model and interviews only one person per household. The selected respondent is asked personal questions, along with questions related to the household and labour market status for all household members. However, some questions are of such a sensitive nature that we cannot expect the selected respondent to answer on behalf of someone else; therefore, certain data on the other members of the household are missing. For example, questions related to health issues are only answered by the selected respondent. As a result, we use only the selected respondent in this analysis.
In the data, a distinction is made between the reference year and the moment of the interview. The former captures the labour market status in each month during the year, whereas the latter captures the labour market status at the moment of the interview, which is typically conducted 1–2 months after the survey year. Information regarding the reference year and the moment of the interview is used when we define the population of interest as well as employment barriers.
Data limitations
EU-SILC provides a rich data source that allows for cross-country comparison. There are, however, some issues regarding data limitations that deserve to be mentioned. First, EU-SILC is mainly a survey-based data source, which is enriched with administrative register data regarding, e.g., highest attained education among the members in the household. That it is survey-based means that it contains information about individuals’ own perception of their health and their current economic status. This should be kept in mind throughout the report. Further, a common issue regarding survey data relates to how many households that are randomly selected and which decide to participate. For example, in Denmark, the response rate is about 40 pct. This leaves a risk of bias, as certain groups have lower response rates than others. The survey is calibrated to match the population on age and income, but there may still be an underrepresentation among some groups. For example, this report mainly concerns persons with no or weak labour market attachment. If the weakest individuals in this group either are not able to or decide not to participate to the same extent as stronger individuals in the group, the latter will be overrepresented, which can create a bias towards stronger individuals with no or weak labour market attachment. That said, it is important to stress that the data are calibrated to avoid these issues, and EU-SILC is a widely recognised data source used in the whole EU.
Second, we have been provided with the most recent EU-SILC from Eurostat. Unfortunately, the most recent EU-SILC data from Iceland are from 2018, and the most recent data from Norway are from 2020. In comparison, the data from Sweden, Denmark, and Finland are from 2021. This temporal disparity is a crucial factor to consider when making comparisons across countries, particularly when assessing variables sensitive to economic cycles (e.g., the number of individuals with no or weak labour market attachment). On the other hand, as we demonstrated in the first report in this project, the five countries are seldom on the same path regarding these economic cycles, meaning that comparisons of the fractions of individuals with no or weak labour market attachment across the five countries in 2021 will also be affected by economic cycles (Højbjerre et al., 2022). Additionally, it is worth noting that the Nordic countries experienced varying economic impacts during the Covid-19 pandemic, including repatriations and layoffs. These external factors should be considered when analysing labour market attachment. However, it is also important to recognise that the most vulnerable individuals, such as the long-term unemployed, may be less affected by the Covid-19 pandemic in terms of labour market attachment.
2.2 Individuals with no or weak labour market attachment
The population of interest in this study is individuals with potential labour market difficulties. This population can be divided into two subgroups. The first group consists of individuals in the working-age population (aged 18–64 and not enrolled in education or compulsory military service) who report no employment activity.
The second group consists of individuals who report employment activity but have a weak labour market attachment (also referred to as precarious employment). This group consists of individuals who report employment activity but are employed in a) unstable jobs, b) work few hours, or c) have a relatively low labour income (see the box below for further description).
Notice that we do not distinguish between voluntary and involuntary unemployment/underemployment even though some EU-SILC surveys ask respondents who report no employment activity whether they want to work. However, the respondents saying that they do not want employment or prefer to work part-time may do so because they face a specific employment barrier. For example, individuals with care obligations may report that they do not want to work because they have to take care of their child (and public arrangement may not suffice). Similarly, individuals with health issues may report that they do not want to work since they experience difficulties accessing jobs in the regular workplace. Common for these two examples is that policies, to some degree, can address both issues. Therefore, excluding these individuals would create a blind spot in this analysis, potentially also in future employment-oriented policies.
Definition of individuals with no or weak labour market attachment
Individuals who are out of work:
Individuals who do not report any employment activity at the moment of the interview and who have neither worked full-time nor part-time in any month in the reference year.
Individuals with weak labour market attachment:
- Individuals in unstable employmentTo define individuals in unstable employment, we follow Fernandez et al. (2016) and use the number of months worked during the year as an indicator of the individuals’ work intensity. Individuals who have a work intensity above zero but not more than 45 pct. are considered to be in unstable employment. To exploit the richness of EU-SILC, we also characterise individuals with a work intensity equal to zero but who report employment activity at the moment of the interview as individuals in unstable employment.
- Individuals working few hoursIndividuals who spent most or all of the year working not more than 20 hours a week are considered individuals working few hours.
- Individuals who report that they work but have a relatively low labour incomeThe reason for including these individuals in the weak labour market attachment group is two-fold. First, such situations can signal potential labour market difficulties (e.g., underpayment and/or informal activities). Second, identifying individuals with no or weak labour market attachment on the basis of self-reported activity status can be subject to errors of measurement or classification. Therefore, we follow OECD (2016) and include individuals whose income from the labour market is below the 5th percentile in the respective country in the group of individuals with weak labour market attachment. In other words, these individuals belong to the 5 pct. with the lowest salary in the respective country.
2.3 Indicators of employment barriers
Working-age individuals with no or weak labour market attachment may face a number of employment barriers that prevent them from participating in the Nordic labour markets. Fully understanding these barriers is an important first step in designing and implementing effective policy interventions.
Previously in this project, we developed a framework over employment barriers in the Nordic countries containing 24 specific employment barriers relating to either individual characteristics (BIC), economic incentives and motivation (BIM), the employer and labour market structures (BEL), or public services (BPS). The framework is presented in Figure 2.1.
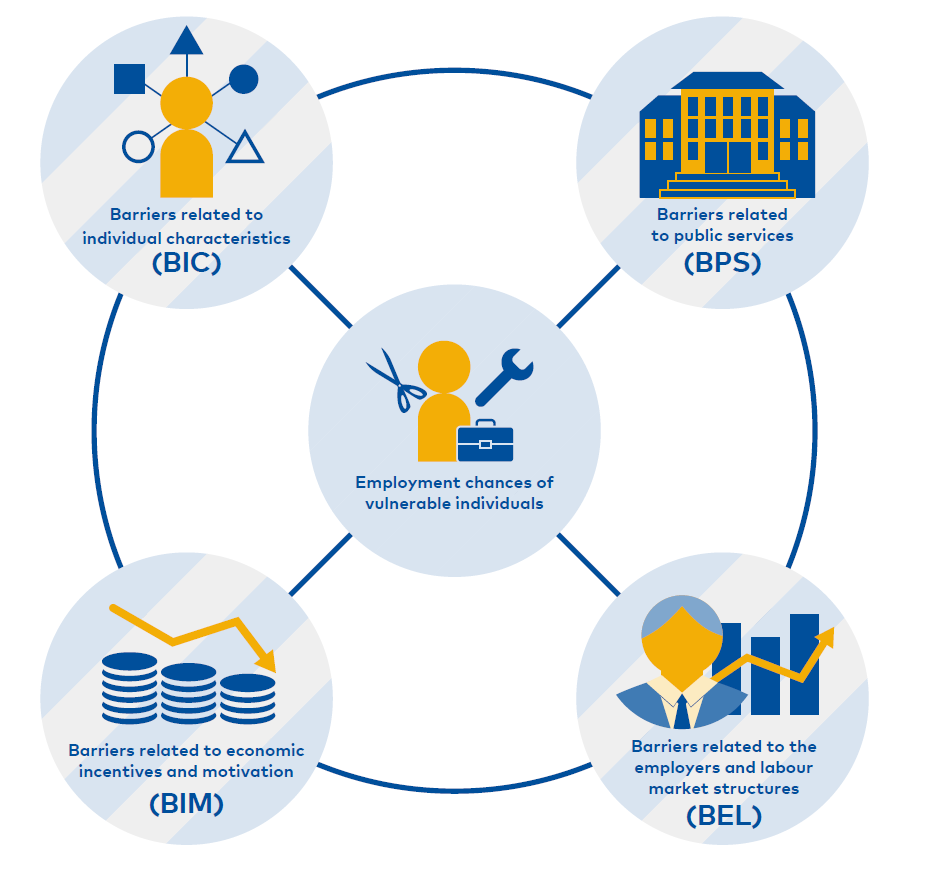
Figure 2.1 Framework over employment barriers for vulnerable groups in the Nordic countries.
Note: This framework over employment barriers for vulnerable groups in the Nordic countries is based on an extensive literature review conducted by a panel of Nordic experts who all possess extensive knowledge on vulnerable groups and the barriers that these groups face.
Source: Højbjerre et al. (2023).
BIC
BIC1: Mental health issues
BIC2: Physical health issues
BIC3: Lack of relevant education
BIC4: Joint retirement
BIC5: Lack of language skills
BIC6: Lack of knowledge about the labour market
BIC7: Lack of work experience and skills
BIC8: Care responsibilities
BIC2: Physical health issues
BIC3: Lack of relevant education
BIC4: Joint retirement
BIC5: Lack of language skills
BIC6: Lack of knowledge about the labour market
BIC7: Lack of work experience and skills
BIC8: Care responsibilities
BPS
BPS1: Low effectiveness of public services
BPS2: Collision between public services
BPS3: Lack of participation in public employment services
BPS4: Insufficient support for groups to overcome other barriers
BPS5: Lack of resources
BPS6: Regional differences in service provision and access to services
BPS2: Collision between public services
BPS3: Lack of participation in public employment services
BPS4: Insufficient support for groups to overcome other barriers
BPS5: Lack of resources
BPS6: Regional differences in service provision and access to services
BIM
BIM1: Insufficient economic incentive to find education/ employment
BIM2: Retirement and pension benefits, incl. early retirement and sick pay
BIM3: Mismatch between job content and personal values
BIM4: Lack of motivation
BIM2: Retirement and pension benefits, incl. early retirement and sick pay
BIM3: Mismatch between job content and personal values
BIM4: Lack of motivation
BEL
BEL1: Costs associated with low productivity
BEL2: Information gaps and risks related to hiring employees
BEL3: Discrimination
BEL4: Working econditions
BEL5: Lack of local employment opportunitites
BEL6: State of the economy
BEL2: Information gaps and risks related to hiring employees
BEL3: Discrimination
BEL4: Working econditions
BEL5: Lack of local employment opportunitites
BEL6: State of the economy
We use EU-SILC to construct a set of empirical indicators of the employment barriers. As we present the indicators, one issue will quickly be apparent: the fact that it is not possible to construct empirical indicators for all the employment barriers in the framework. In fact, we have been able to identify 10 employment barriers which relate to 9 out of the 24 employment barriers. The operationalisation of the employment barriers is briefly described in the box below. For further description, see Appendix A.
Indicators of employment barriers
To facilitate the clustering of jobless individuals into groups that share similar sets of employment barriers, the analysis of this report defines indicators for a range of different employment barriers. To ease presentation, the indicators are binary and express whether or not an individual circumstance constitutes an employment barrier.
Several of the barriers depend on underlying categorical variables. In this paper, we define the barriers in line with the cut-offs established in previous Faces of Joblessness projects (Fernandez et al., 2016; Fernandez et al., 2020; Farchy, Immervoll & Pacifico, 2020).
Barriers related to individual characteristics (BIC):
- Physical/mental health issues: Some or severe limitations in performing everyday activities due to long-lasting physical or mental health conditions
- Lack of education: Lower than upper secondary education
- Never worked: No past work experience
- No recent work experience: No work experience during the reference year
- Lack of skills: The most recent job was in a low-skilled occupation (one of the two lowest ISCO-08 occupation categories)
- Care responsibilities: Having a young child who requires care not covered by purchased or publicly available care services, while stating that the reasons for not working are care responsibilities or being the only person in the household who can provide these
Barriers related to economic incentives and motivation (BIM):
- High partner or non-labour income: A high share of income in the household unrelated to own work effort
- High earnings replacement (benefits): Out-of-work benefits are high relative to the individual’s potential earnings
Barriers related to the employer and labour market structures (BEL):
- Low job opportunities: Lack of employment opportunities in the respective labour market area described by age, gender, and education
Barriers related to public services (BPS):
- Low contact with PES: Lack of participation in the public employment services described by age, gender, and education.
The fact that we have been able to identify only 10 employment barriers, relating to 9 of the identified barriers, is important to highlight. The results presented later in this report might be affected by this. For example, the EU-SILC, unfortunately, does not allow us to identify any barriers related to the individual’s language skills. Further, it does not allow us to distinguish between mental and physical health issues. Including barriers related to, e.g., lack of language skills can potentially affect the results which will be presented later in this report. Therefore, it is strongly encouraged that future research test the results in this report by utilising other data sources, thus allowing to include more barriers from our framework (another data source could be national administrative data).
We understand employment barriers as obstacles that hinder individuals from participating in the labour market. These barriers are constructed independently of an individual's demographic group. However, certain groups of individuals may be more susceptible to specific barriers than others. A special case is individuals with health issues, constituting both an employment barrier and a traditional target group in this report.
2.4 Latent class analysis
This section describes the statistical method for segmenting individuals with no or weak labour market attachment into groups that are meaningful for designing, tailoring, and targeting activation and employment support policies (AESPs). The underlying premise is that individuals with no or weak labour market attachment face a number of possible employment obstacles, and each of them may call for different policy responses. Building on the operationalised employment barriers developed in the previous section, the objective is to obtain groups of individuals with combinations of employment barriers that are as similar as possible within groups and as different as possible between groups.
The segmentation approach focuses explicitly on employment barriers rather than other characteristics commonly used when breaking down labour market statistics (e.g., age). As highlighted in the introduction, the reason is that subgroups which policy debates commonly consider at risk of labour market marginalisation (e.g., young people, seniors, immigrants, persons with disabilities), are in fact highly heterogeneous in terms of their employment obstacles. Thus, tailoring policies to only the most prominent real or assumed barriers facing these groups may not be sufficient for increasing their employment chances.
We use the statistical segmentation method called latent class analysis. This method exploits the interrelations of the employment barriers to identify population subgroups sharing the same employment barriers, e.g., lack of education and health issues for Group 1; no recent experience and lack of local employment opportunities for Group 2, etc. The approach in the present study adapts the LCA model described in Fernandez et al. (2016) to the structure and content of the Nordic EU-SILC.
Appendix B provides further technical details on the model selection procedure. To briefly summarise, the model selection process starts with the definition of a baseline model, which is repeatedly estimated with an increasing number of latent classes. The baseline model includes the set of indicators derived in Section 3 and takes the form of a standard latent class model. The choice of the optimal number of classes is based on goodness-of-fit statistics as well as theoretical considerations.