1. Background
In 2019, NILU together with NIVA performed a screening study of CPs, dechloranes and UV-filter in different environmental matrices from the Nordic countries, on behalf of the Joint Nordic Screening Group (Schlabach, 2022). That study included air samples from three remote sites in Finland, Iceland and Norway and one urban site in Iceland. The results showed that the urban site had higher concentrations of S/M/LCCPs in air than the remote sites. The higher concentrations in urban air were suggested to be caused by tire wear particles (TWP) based on findings of CPs in car tires and products containing recycled rubber granulates (Brandsma et al. 2019).
In 2022, NILU proposed for the Joint Nordic screening group to perform a follow-up assessment on CPs in urban air in a wider range of Nordic countries.
1.1 Selected compounds
1.1.1 Chlorinated paraffins
Chlorinated paraffins (CPs) are used and added to a wide range of applications as plasticizers or flame retardants; e.g. rubbers, paints, plastics, coatings, sealants and adhesives, or as high-pressure additives in metal working fluids. CPs are mixtures of congeners with different carbon chain lengths and number of chlorine atoms. Based on chain length, CPs can be divided into three groups: short chain (SCCPs: C10–C13), medium chain (MCCPs: C14–C17) and long chain (LCCPs: C18–C28). CPs are manufactured by radical chlorination of n-alkanes by treatment with ultraviolet (UV) light and/or high temperatures in the presence of chlorine gas. These reactions have low positional selectivity, and the different technical products are made up by innumerable individual congeners (Tomy et al., 1998).
CPs can be released into the environment during all life-stages from production to storage, transportation, use and finally disposal of products by runoff, leaching and/or volatilization from landfills, sludge and waste burning. CPs are of emerging concern due to their high production volumes (up to 600–1000 ktons/year in China), high persistency (half-life >1 year in sediment and >0.5 d in air), high bioaccumulation potential, and toxicity. Among CPs, short-chain CPs (SCCPs) have until now received the greatest attention.
SCCPs are classified as substances of very high concern and are included on the list of the European water framework directive to be monitored in water (van Mourik et al., 2015). SCCPs are also restricted under the Stockholm Convention in Annex A (Elimination). UK has recently submitted a proposal to list chlorinated paraffins with carbon chain lengths in the range C14-17 and chlorination levels ≥45% chlorine by weight as persistent organic pollutant (POP).
Due to the complex mixture of innumerable congeners in each technical product, environmental trace analysis of chlorinated paraffins is challenging. For the majority of POPs, a compound specific analysis can be used as they are analytically separated into single congeners/compounds and have isolated and purified standards for the single congeners/compounds (Figure 1).
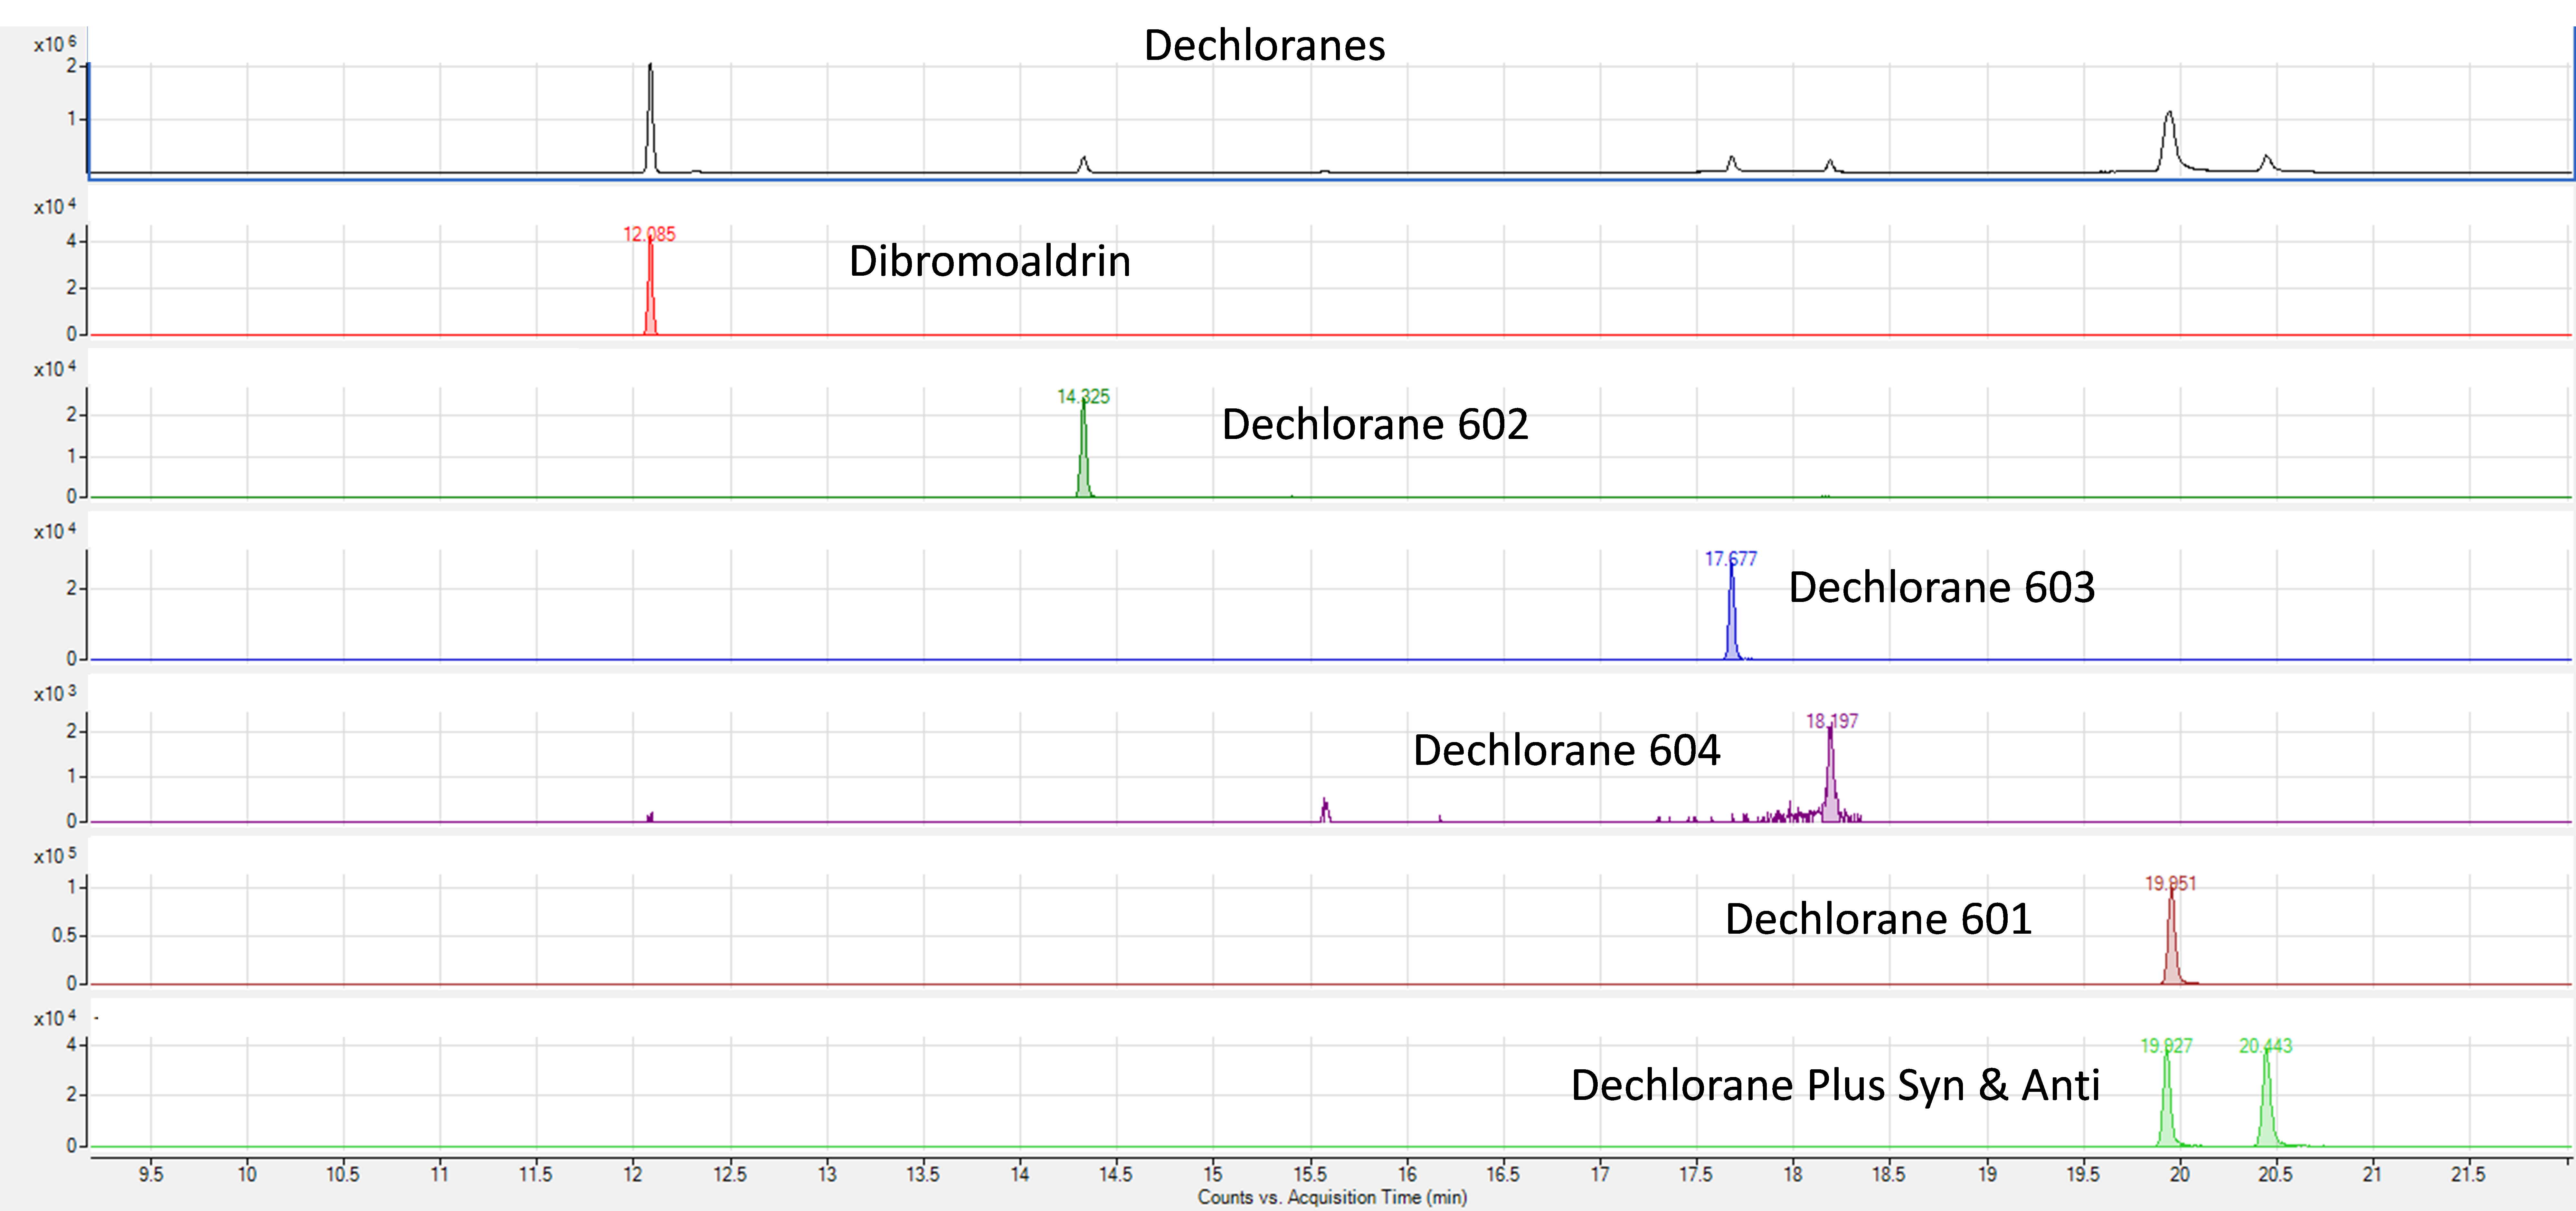
Figure 1: Total ion chromatogram of dechloranes, together with chromatograms of all dechloranes completely separated. The complete separation and the existence of isolated C12 standard material for each compound allows for a compound specific analysis.
Figure 2: Total ion chromatogram of SCCPs and MCCPs, together with chromatograms of the congener groups C11-Cl5 to C11-Cl10. None of the possibly thousands of congeners could be isolated as single peaks. Limited separation and the non-existence of isolated C12 standard material for each congener allows only for a mixture analysis.
In contrast, CPs can only be separated into congener groups with the same chain length and number of chlorine atoms, and thereof the different individual congeners remain unresolved (Figure 2). In addition, there are only very few and little representative isolated single congener standards available, which can be used for identification and quantification. Thus, only a mixture analysis is possible and an accurate quantification is challenging. Different methods of highly variable quality have been developed during the last couple of decades (van Mourik et al., 2015). The method of Tomy (Tomy et al., 1997), has shown to be the most accurate but also most expensive for determination of CPs. It is based on the use of different technical CP mixtures and the application of GC-HRMS in ECNI-mode, and has been used by NILU for nearly 20 years. Due to the use of high mass resolution in GC/ECNI-HRMS little self-interferences between CPs and other POPs such as chlordanes, toxaphenes and PCBs occur, which otherwise is a common problem for GC/ECNI-LRMS.
Recently, an alternative technique based on APCI-qToF-HRMS and a deconvolution algorithm have shown promising results (Bogdal et al., 2015). Quantification using the deconvolution procedure has since been applied to other instrument techniques. However, this quantification method is highly complex, time consuming and the outcome is dependent on the availability and further selection of the right combination of technical mixtures used for calibration.
A worldwide intercalibration and certification study for SCCPs was conducted by the European Commission in 2019 with NILU participating as one of the leading expert labs. NILU was one of only five labs performing well within the accuracy and precision of the different methods.
1.2 Selected sampling sites
Chlorinated paraffins have previously been measured in various matrices in the Nordic environment, but a targeted study on urban air concentrations in winter and summertime has previously not been performed.
The main research questions justifying this study were collection of empirical data to improve the understanding of: (1) spatial variability of chlorinated paraffins in urban air in the Nordic countries, and (2) the importance of car tire wear for chlorinated paraffins in air. All countries were invited to participate in the sampling campaign, but the need for active air samplers in urban settings limited the participation to Finland (Helsinki), Iceland (Reykjavik and Reykjanesbær), and Norway (Oslo) (Table 2). Two sites were selected in Iceland (Reykjavik and Reykjanesbær) while one site was selected in Oslo and Helsinki (Figure 3). For comparison also one background site in Norway (Birkenes) and one car tire testing facility in Sweden (VTI) were included. The samples from Birkenes are a part of the Norwegian Monitoring programme for Atmospheric Contaminants, conducted by NILU on behalf of the Norwegian Environment Agency.
Table 2: Sampling sites and sample matrices for all participating countries.
Country | Matrix acronym | Location type | Location | Air sample type | Latitude | Longitude | Nr of samples in wintertime | Nr of samples in summertime |
|---|---|---|---|---|---|---|---|---|
FIN | AIR | URB | Helsinki | Active air – Particle phase | 60.19654 | 24.95179 | 3 | 4 |
ICE | AIR | URB | Reykjavík | Active air – Particle phase | 64.130115 | -21.874738 | 2 | 3 |
ICE | AIR | URB | Reykjanesbær | Active air – Particle phase | 64.01466 | -22.57065 | 4 | 3 |
NO | AIR | URB | Oslo | Active air – Particle phase | 59.923 | 10.765 | 5 | 6 |
NO | AIR | REM | Birkenes | Active air – Particle + gas phase | 58.38375 | 8.24997 | 3 | 3 |
SWE | AIR | IND | VTI | Active air – Particle phase | 1 | 0 |
Figure 3: Photos of the four sampling sites; Helsinki (top left), Oslo (top right), Reykjavik Urban (Bottom left) and Reykjanesbær Urban (bottom right).