
- Full page image w/ text
- Table of contents
- Preface
- Extended summary
- 1 Introduction
- 1.1 Terms and abbreviations used in this document
- 1.2 What is the challenge, why focus on this topic?
- 1.3 What would be the ideal situation?
- 1.4 What is the aim of this report?
- 2 How this report developed?
- 3 Why coordinate climate measurement of procurement?
- 3.1 Why measure the climate effect of procurement?
- 3.2 Why do we need to coordinate?
- 3.3 Three major challenges
- 3.4 A Nordic approach is relevant
- 4 Market demand for climate data
- 4.1 What do we mean by market demand? Why is market demand important? What are the goals?
- 4.2 International /EU/Nordic status regarding climate policies and greener public procurement
- 4.3 Status in the individual Nordic countries regarding climate policies and public procurement
- 4.3.1 Denmark
- 4.3.2 Finland
- 4.3.3 Norway
- 4.3.4 Sweden
- 4.4 Summary of experiences and challenges
- 5 How to quantify climate emissions of PP reliably and transparently
- 5.1 Why should measurement be harmonised?
- 5.2 Nordic/EU/international status
- 5.2.1 Product-specific greenhouse gas emissions (carbon footprint of a product)
- 5.2.2 Greenhouse-gas emissions of public procurement of a country by EIO models
- 5.2.3 Company-specific greenhouse gas emissions (carbon footprint of a company)
- 5.3 Status in the Nordic countries
- 5.3.1 Denmark
- 5.3.2 Finland
- 5.3.3 Norway
- 5.3.4 Sweden
- 5.3.5 Nordic Swan eco-label requirements
- 5.4 Summary of experiences and challenges relating to measurement techniques
- 6 Data availability, flow and ownership
- 6.1 When and how does the CA need the climate data?
- 6.2 What are the possible sources for the climate data?
- 6.3 How can climate data be made available to CAs?
- 6.4 EU/Global status
- 6.5 Status in the Nordic countries
- 6.5.1 Denmark
- 6.5.2 Finland
- 6.5.3 Norway
- 6.5.4 Sweden
- 6.6 What needs to be done?
- 7 References (other than footnotes)
- About this publication
MENU
Contents
This publication is also available online in a web-accessible version at https://pub.norden.org/temanord2022-544.
Preface
Climate change is probably mankind’s most serious challenge. Public procurement represents about 16% of gross national product in the Nordic countries and must therefore take an active role in meeting the challenge. Unfortunately, decision making is hampered because the data on the climate effect of products is often unclear, not comparable, or unavailable.
The EK-MK Committee of the Nordic Council of Ministers has therefore funded a project which looks at how to make public procurement more circular and climate friendly. One of the goals of this project is to improve the quality, consistency, and availability of product related carbon footprint information.
In the first phase of this project an expert group from Norway, Sweden, Finland, and Denmark has mapped the state of the art in these countries, as well as relevant international activities. The main conclusions were that there was a significant need for harmonising carbon footprint data and that a Nordic perspective was relevant.
The preliminary report was presented and discussed during a workshop (23/3-2022) with wide representation from different relevant organisations from the countries. The response was positive, regarding both contents and timing, expressing the need for moving this topic forward quickly.
We have therefore the pleasure of publishing this report as a basis for further work. The next phase of the project will establish pilot projects where contracting authorities, suppliers, and data management suppliers can collaborate to get the harmonised carbon footprint data efficiently into procurement processes and thereby help in decreasing the climate emissions related to the public procurement.
Oslo, 23.06.2022
Helene Hoggen
Senior Advisor at The Norwegian Agency for Public and Financial Management (DFØ) and Project Manager, “Circular and Climate Friendly Public Procurements”
Extended summary
Needs that are being addressed
Public procurement is increasingly being used to implement political goals, often related to sustainability. A prioritised goal at present is reducing the climate emissions caused by our consumption of goods and services.
For contracting authorities (CA), taking climate aspects into account when procuring requires effort and can increase costs. They need data to be able to select which procurements, products and suppliers can give most climate effect. At present relevant, comparable climate data is not readily available.
This report analyses the needs for CAs and the current status in the Nordic countries as a basis for planning actions to better the availability of product-related climate data.
A draft version of this report was distributed to 35 representatives[1]Participation was «by invitation only” to facilitate good discussions in the parallel sessions. from the four participating countries at a workshop 23rd. March. Participants supported the conclusions of the report in general and emphasised that this was an area that needs to be coordinated soon to avoid unnecessary parallel work.
Footnotes
- ^ Participation was «by invitation only” to facilitate good discussions in the parallel sessions.
Findings
The main findings are:
- CAs need harmonised climate data about products at various stages in the procurement process. Harmonisation is important to ensure the level playing ground that public procurement requires.
- Methods and data exist in varying degrees for different product categories but are not harmonised. Availability, quality, and consistency of climate data varies strongly between product categories.
- The Nordic market is often perceived as one market by suppliers and procurement maturity is comparable so harmonisation at the Nordic level is appropriate. There was consensus during discussions at the workshop on all points except for how climate data should be integrated with procurement data.
- The transmission of climate data from supplier to CAs is a technological challenge that is being addressed in many fora. CAs need help in finding how they can specify data requirements in their dialogue with suppliers, gather the relevant data and use it actively in their procurement activities from prioritisation of categories to measuring effects and climate reporting.
Proposal for actions
- Establish contact with EU and Nordic activities connected with data sharing/transmission:
- Digital product passport
- GPP expert committee
- Choose a few categories to run pilot. Choice of categories should depend on finding good pilots but following categories have been named as particularly interesting:
- Building materials (availability of climate data for materials)
- Office furniture (strong Nordic supplier market and many EPDs)
- Electric vehicles (market sensitivity to climate effects from battery production)
- Construction sites (existing demand for climate data from major contracting authorities)
- Duty travel (mature market but lacking harmonisation and data integration)
- More detailed analysis of the existing technical infrastructures that can support climate data (e.g. EPD/LCA databases) as well as EUs medium term plans for sharing sustainability data on products (“digital product passports”) and proposal as to pilot short term solutions towards the medium-term infrastructure that is planned by the EU.
- Conference spring 2023 for potential pilot categories where we have already found interested Contracting Authorities (CA) and present requirements to interested suppliers.
1 Introduction
1.1 Terms and abbreviations used in this document
| Term (Abbreviation) | Definition |
| API | Application programming interface. In this document, we use the term to define a network-based service that allows other programs to fetch product-specific climate data over the internet. |
| CF | Carbon footprint: ‘The total set of greenhouse gas emissions caused directly and indirectly by an [individual, event, organisation, product] expressed as CO2e.’2 – in this document we relate mainly to products (i.e. goods and services). We also use the term climate emissions for carbon footprint. (Carbon Trust Definition) |
| Climate data | In this document we use the term climate data as synonymous with climate footprint (see above) |
| Climate intensity | Climate emissions per unit of spend, often divided up into spend categories with varying level of detail |
| CA | Contracting Authority: Public procuring organisation |
| CR | Category Rules |
| DPP | Digital product passports: Product related data as proposed by the EU in COM(2022) 142 article 8. |
| EIO | Economic Input-output |
| DFØ | Norwegian Agency for Public and Financial Management |
| EPD | Environmental product declaration: Description of a product’s most significant environmental based on a given PCR (see own definition). See also international standards for product environmental declarations, such as ISO 14025 and EN 15804 |
| EC | The European Commission |
| ESA | Environment Spend Analysis |
| GPP | Green public procurement |
| GHG | Greenhouse gas protocol: Standard for measurement of climate emissions at the organisational level or geographical3. Defines “scope” concept that is widely used. |
| GWP | Global warming potential |
| LCA | Life cycle analysis: Methods for assessing the environmental impact of products (goods and services) |
| LULUC | Land use and land-use changes: E.g., use of forest areas for soya production |
| MRIO | Multi-Regional Input Output assessments: Method for estimating climate emissions using economic trade data in connection with branch and region-specific climate emission data |
| PEPPOL | The purpose of OpenPeppol is to enable European businesses to easily deal electronically with any European public sector buyers in their procurement processes, thereby increasing opportunities for greater competition for government contracts and providing better value for taxpayers’ money4. |
| PCR | Product category rules: Standardised method for producing an EPD for a specific product category based on identifying the most important environmental aspects using an LCA |
| Product environmental footprint (PEF) and Organisational environmental footprint (OEF) | The Product Environmental Footprint (PEF) and the Organisation Environmental Footprint (OEF) are life cycle assessment (LCA) based methods to measure and communicate the potential life cycle environmental impact of products (goods or services) and organisations, respectively. Together they form the basis for the EU Environmental Footprint5. |
| Spend | CA’s payments to suppliers usually grouped by similar products (categories). |
| SPP | Sustainable public procurement |
| Supplier | Private sector organisation selling goods and services to the public sector |
| System provider | Organisation providing IT services that support contracting authorities/suppliers in managing their interactions |
| SIS (Statens innkjøpssenter) | The National Procurement Body of Norway |
Note: [1]https://web.archive.org20090511102744/http://www.carbontrust.co.uk/solutions/CarbonFootprinting/what_is_a_carbon_footprint.htm [2]https://ghgprotocol.org/ [3]https://peppol.eu/about-openpeppol/what-is-openpeppol/ [4]https://ec.europa.eu/environment/eussd/smgptemanord2022-544.pdfEF%20simple%20guide_v7_clen.pdf
Footnotes
- ^ https://web.archive.org20090511102744/http://www.carbontrust.co.uk/solutions/CarbonFootprinting/what_is_a_carbon_footprint.htm
- ^ https://ghgprotocol.org/
- ^ https://peppol.eu/about-openpeppol/what-is-openpeppol/
- ^ https://ec.europa.eu/environment/eussd/smgptemanord2022-544.pdfEF%20simple%20guide_v7_clen.pdf
1.2 What is the challenge, why focus on this topic?
Climate change is one of mankind’s greatest challenges. Many organisations are now reacting. One method that is being used is to implement climate accounting. The GHG-protocol model, which is often used as basis, divides the climate footprint of an organisation into 3 “scopes”[1]E.g. https://ghgprotocol.org/sites/default/files/standards/Corporate-Value-Chain-Accounting-ReporingStandard_041613_2.pdf:
- the organisation’s direct climate emissions,
- emissions due to production of the energy that the organisation uses and
- the climate emissions from other products that the organisation purchases, (or causes by the products that they sell, but this is less relevant for public authorities).
For many public sector organisations, scope 3 emissions dominate, as these figures from Asplan Viak's analysis of the climate emissions for public procurement[2]https://anskaffelser.no/nyhetsarkiv/2019/04/stabilt-klimafotavtrykk-fra-offentlige-anskaffelser in Norway indicate:
Footnotes
However, these figures are based on rough measurements and the availability of detailed climate data related to specific products is weak, partly due to lack of standardised methods. Some attempts have been made at coordinating standards, putting the responsibility for producing data on suppliers, but, so far, little standardisation has been achieved and even less taken into active use.
This makes it difficult to:
- use climate data actively in selecting suppliers and products or
- measure the effect of implementation of climate reduction measures as basis for evaluation and climate reporting.
The sheer volume of public procurement, and the potential for coordinating market requirements, provides both the potential, and moral responsibility, for defining how climate data should flow from supplier to CA.
1.3 What would be the ideal situation?
The central goal for public procurement is to satisfy the public sector’s needs most effectively using market competition to achieve this. The understanding of “effectiveness” has changed over time and depending on context, but the general tendency has moved from pure price awareness and supporting national suppliers to increasingly including other societal concerns, in particular the environment and working conditions and human rights.
To make optimal procurement decisions, procuring institutions need to weigh these concerns against each other, and be able to explain why they have made these decisions.
As the scope for this project is limited to climate emissions, we will refer to climate relevant data in the following.
Ideally, relevant climate data should support different decision points in the procurement process:
- Category management: When deciding which procurement categories should be prioritised for environmental aspects, and which aspects should be emphasised for prioritised categories, there is a need for generic environmental information at the category level. Rough estimates of climate intensity (emissions/unit of spend) can be calculated using economic input output models and climate emission data or other (accounting/process based) life cycle data (see more details below in chapter 5). By linking these climate intensity figures with spend data from contracting authorities, scope 3 emissions can be estimated. These estimates can be used for prioritisation, but input/output models will not give any indication as to changes in the organisation’s procurement requirements (other than spend per category), and in models with indicators built on accounting –LCA data, the indicators must be adjusted so they describe undertaken efforts to reduce the footprint of the category
- Planning of specific procurements: When planning a specific procurement, one needs to decide which climate aspects should be included and how these should be incorporated into the procurement process. This is also usually based on the category averages mentioned above.
- Evaluating offers: When analysing offers and weighting these against each other, the CA needs hard numbers. These may be based on subjective evaluation of textual input in the offers, numerical data on the suppliers’ environmental performances, or, ideally, climate footprints connected to the specific products that are being offered. When used to evaluate offers, it is essential that the data that is being provided by the suppliers satisfies the requirements of the procurement regulations (neutrality, documentability, etc.)
- Ordering products: after the contract is signed, the procuring organisation will often be able to order items based on catalogues. Environmental footprints for the alternatives should be available together with other product information so that those choosing the products can make informed decisions.
- Following up orders, contracts and environmental reporting: when products have been supplied, the procuring agency should be given information about the environmental footprint so that this can be used in climate reporting and as a basis for future decision making (e.g., next round of competitive procurement).
1.4 What is the aim of this report?
The aim of this report is to document status and activities related to climate data that are relevant to the Nordic public procurement market to:
- Learn from each other as to the state of the art concerning product and supplier specific climate data in the context of public procurement
- Establish a platform for dialogue between Nordic public procurement agencies to plan Nordic activities that will advance the availability and use of climate data in procurement
- Reduce the number of parallel activities and standards that will confuse the Nordic market, place unnecessary administrative burdens on suppliers and thereby slow implementation of climate data in public procurement.
- Stimulate the market for management support systems that will ensure a competitive advantage for greener suppliers and products.
2 How this report developed?
This report is the result of a collaborative effort financed by the Nordic Council of Ministers and involving experts from:
- Denmark: The Danish Energy Agency (Energistyrelsen) (Mette Engelbrechtsen Østerby Carlsen)
- Finland: The Finnish Environment Institute (SYKE) (Ari Nissinen)
- Norway: The Norwegian Agency for Public and Financial Management (DFØ) (Martin Standley)
- Sweden: The National Agency for Public Procurement (Upphandlingsmyndigheten) (Maria Cosnier, Jens Johansson, and Joakim Thornéus)
A structure for the report with introductory text was first developed in October 2021 by Norway and Finland, after which the representatives from the four countries then filled in information from their respective countries with deadline 31st. January 2022. About seven e-meetings were held to coordinate this process.
In February, the working paper was edited to a) use common terms, b) avoid repetitions and c) identify areas and issues that could be worked on in the workshop planned for late March. The edited version was then sent for approval by the national experts.
On the 23rd. March 2022 a webinar was held with invited experts from the four participating countries. The webinar consisted of two parts:
- A presentation of the report
- Three breakout sessions, each with 3 participants from each country:
- How to integrate climate data into the procurement process (CA perspective)
- How to measure climate effects efficiently and comparatively (LCA experts)
- How to move climate data from supplier to CA (ICT/procurement system experts)
The tasks for the breakout sessions were to give feedback on the background paper and then discuss concrete actions to move on. The groups consensus was that the report gave a good picture of the current situation. Their recommendations have been incorporated into this final report.
Some additions have been made after the workshop, particularly related to mention the EU work on “Digital Product Passports”.
3 Why coordinate climate measurement of procurement?
3.1 Why measure the climate effect of procurement?
Climate emissions need to be reduced quickly, but reducing emissions requires time, effort, and (often) costs. To maximise effect, organisations need to select procurement categories and mitigation measures that give high cost-effectiveness.
This has led to greater use of climate accounting and reporting to identify the cause of the climate emissions and then monitor the effect of measures. In the private sector this is driven mainly by the financial sector’s increasing sensitivity to the potential climate risk connected in investing in sectors and companies with large carbon footprints.
For the public sector, the driving force here is more often political, so there is greater variation as to penetration, between countries and between sectors within countries. The country specific sections below go further into details on this.
As mentioned above, scope 3 emissions dominate the public sector’s carbon footprint, and any climate reporting/-budgeting measures need good climate data from procurements.
In addition, public procurement is an interesting area in which to promote reduced climate emissions by placing appropriate requirements on suppliers:
- Market volume: Public procurement represents about 15% of GDP in many countries.
- Innovation potential[1]OECD: Public Procurement for Innovation: https://www.oecd.org/gov/public-procurement/innovation/: if public procurements can coordinate, either through standardised requirements and/or common agreements, they represent formidable market forces that can drive effective innovation.
- Cost distribution: the extra costs (if any) of requiring high carbon-efficiency lie spread across many public sector budgets so that climate reduction through public procurement can be enacted without budget allocations
- Potential cost reductions: in some cases, climate arguments can be used to reduce costs (e.g., by reducing duty travel).
However, public procurement covers a wide range of products and services and associated suppliers. They need to select which procurement categories to prioritise, which suppliers to buy from and what to buy and to report back on the effect of their choices.
To do this, they need to answer questions of the following types:
- Which procurement categories should we prioritise? What climate effects can we expect to achieve and at what cost/benefit?
- What concrete procurement plans should we define?
- Which suppliers/offers/products should we select?
- What climate reduction have we achieved and at what cost?
The kind of data that is required to answer these questions is basically the same: greenhouse gas emissions in a life cycle perspective and costs for alternatives, but the level of detail differs. The following figure illustrates the increasing precision requirements when going from rough strategic decisions to selecting and reporting on individual purchases. At each level of detail, the calculation requires multiplying information about the purchases performed with information about the climate effect of the purchase. The resulting precision of the data will limit its usage.
Footnotes
- ^ OECD: Public Procurement for Innovation: https://www.oecd.org/gov/public-procurement/innovation/
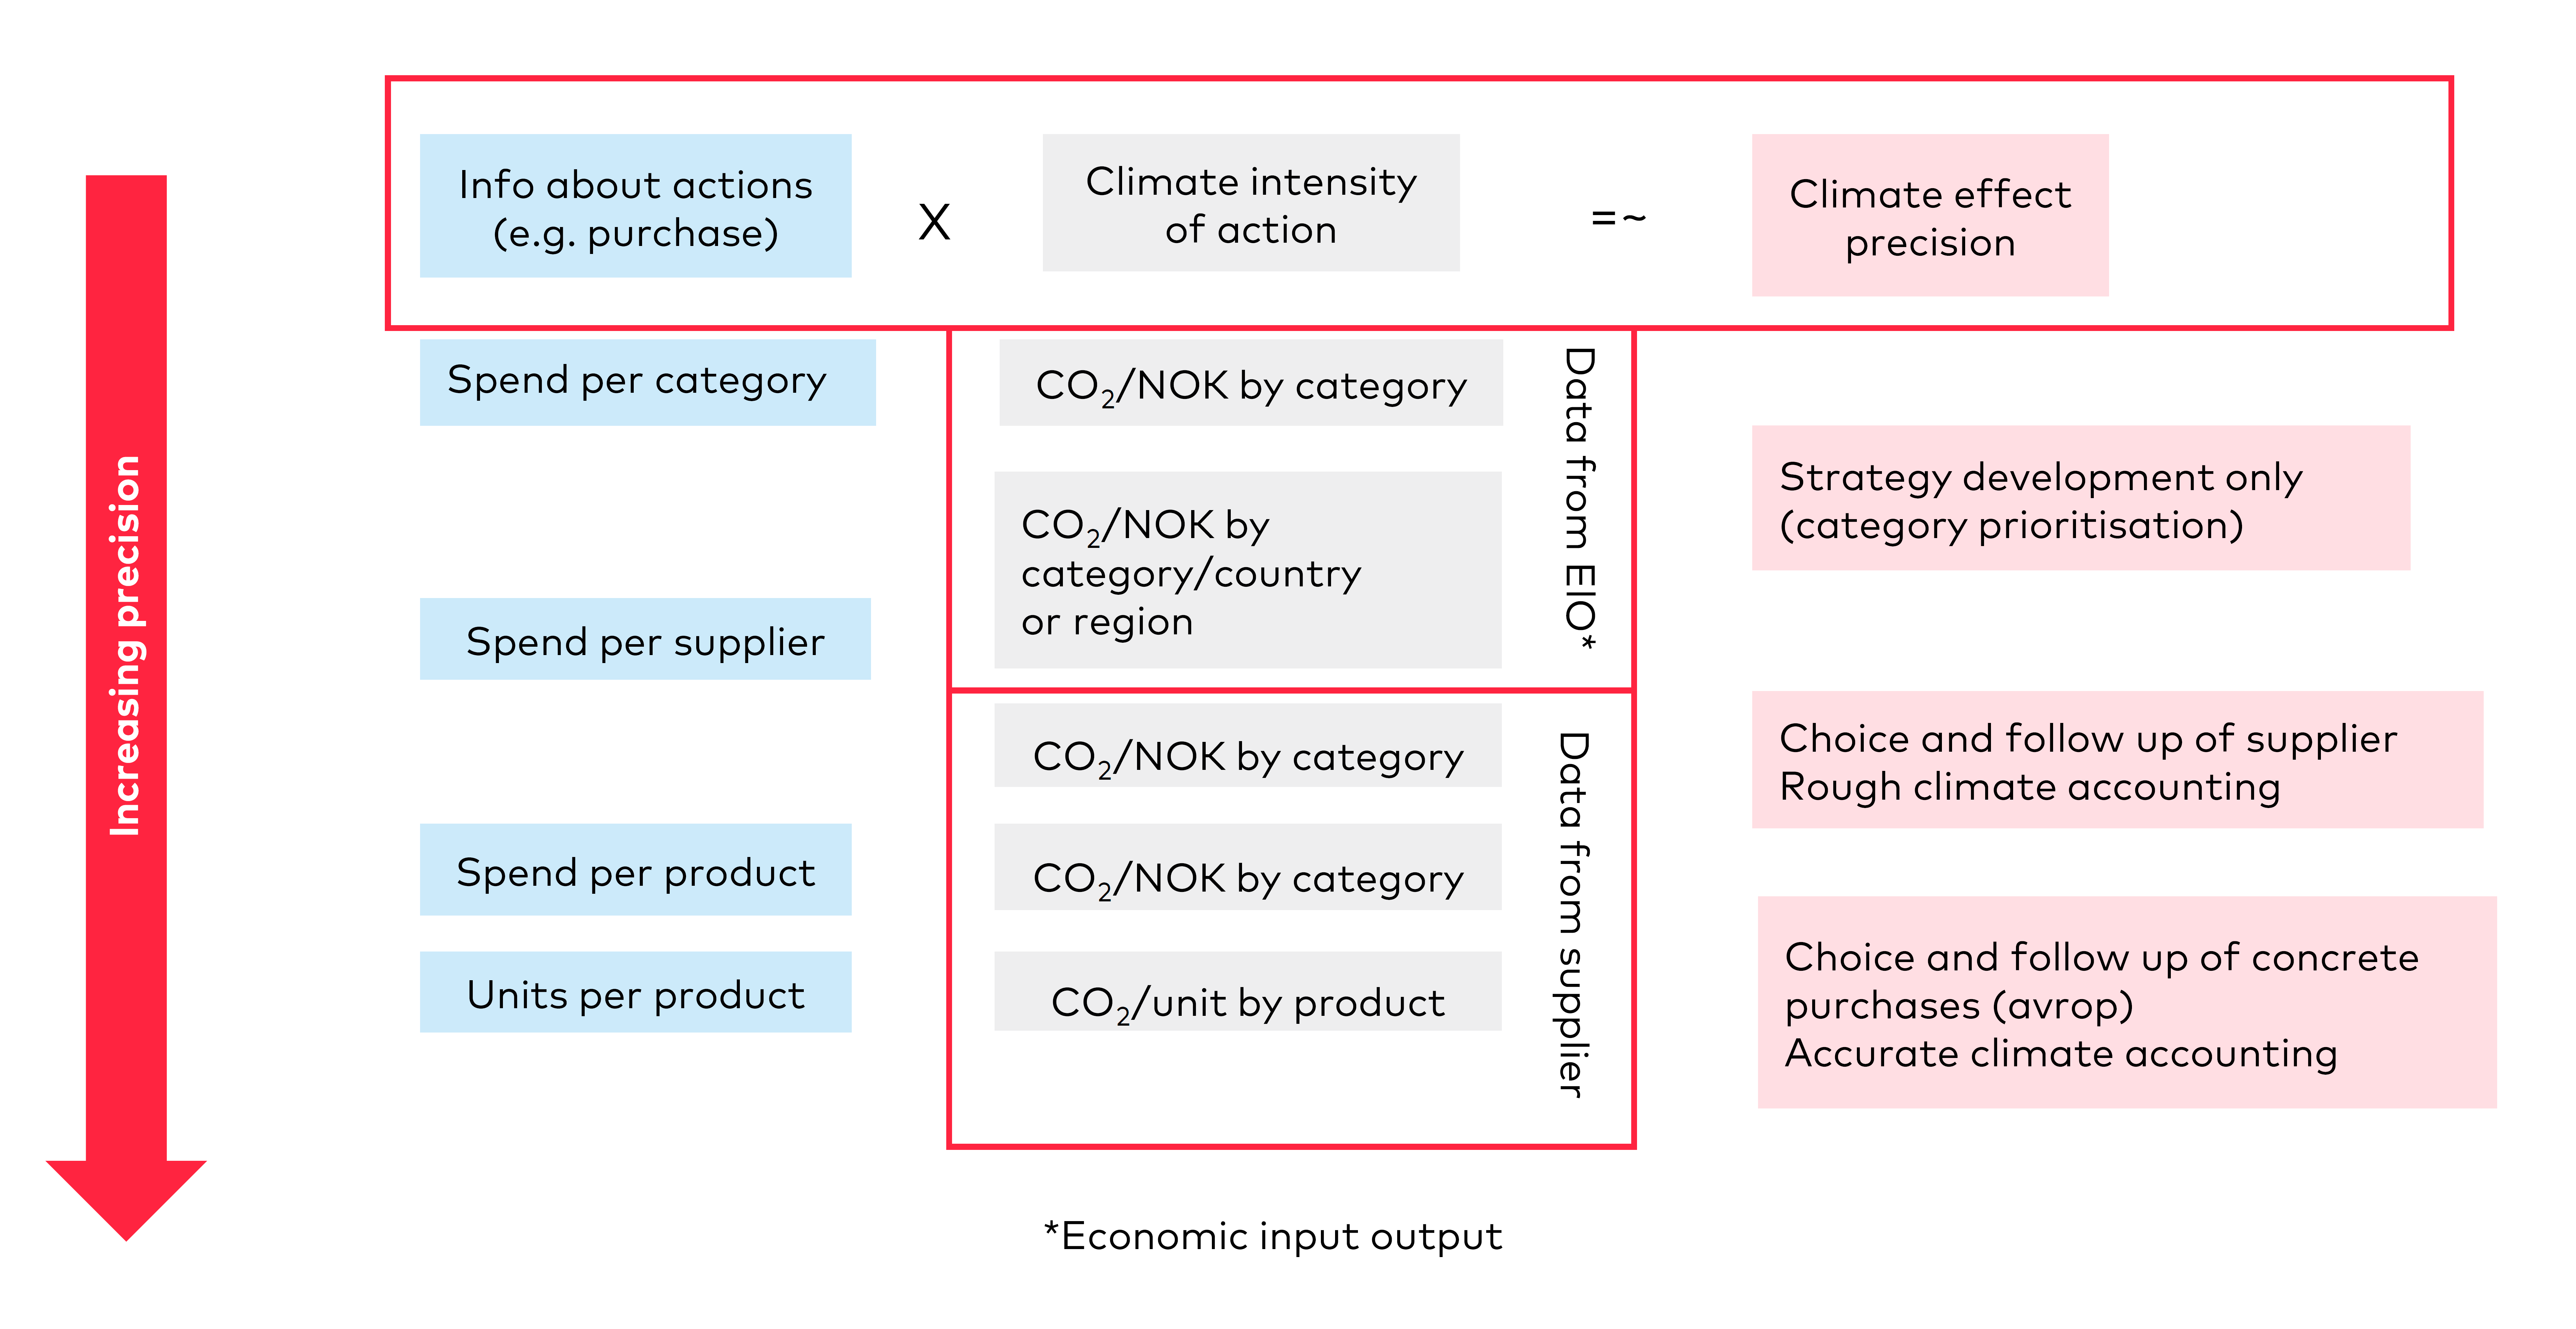
At the roughest (top) level in the figure, data about the climate effect of the purchase can be estimated using various economic output models (economic cash flow of the value chain though business sectors and then connected to the climate emissions from these business sectors). An example of this could be that on average one kroner used on the travel budget will generate x kg of CO2 equivalents footprint. Figures calculated by such a method will not be influenced by procurement measures aimed at prioritising “green” suppliers and products but can be used to prioritise which procurement categories to target for climate reduction measures.
However, this level of accuracy is not enough to be able to select suppliers, products or measure the effect of green measures (except those that lead to reduced consumption). For that, we need data that is more specific for the supplier or the product itself. Examples, in increasing precision, could be a) average CO2 equivalents emissions per passenger kilometre, b) the average emissions for a given airline’s flights between Oslo and Trondheim or c) the emissions for their 1620 flight on the 3rd. of November 2020.
Access to data about the goods and services supplied that is detailed and standardised enough to be used to calculated climate emissions is often difficult to collect unless relevant requirements have been explicitly specified in contract conditions.
3.2 Why do we need to coordinate?
Many CAs are implementing climate reporting and budgeting and trying to implement more detailed climate measurement, but since there is no accepted standard for doing this, there is a risk that:
- Development projects will happen in parallel (waste of resources in CAs).
- Implementation will be delayed.
- Figures from different methods will not match (loss of credibility).
- Suppliers will be confronted with different requirements for data (unnecessarily high transaction costs and market restrictions).
- The data/methods/systems for climate measurement can be monopolised by a systems supplier (result: loss of transparency, high costs for CAs/suppliers).
Better coordinating will therefore hasten implementation of climate measures in procurement, help prioritise the most effective measures, reduce transaction costs, increase supplier awareness of climate efficiency in products and improve competition by standardising measurement techniques.
3.3 Three major challenges
To get suppliers producing this climate data and making it available to CAs and their climate accounting departments, three major challenges need to be met:
- Increase market pressure: developing and communicating climate data will require willingness and investment from the supplier side. Suppliers respond to demands from their customers, owners and to legal pressure. The public sector is an important customer segment for many of these. What can be done to do to get Contracting Authorities (CAs) to give clear and consistent signals to their supplier markets? This Nordic initiative aims to increase market pressure by getting the Nordic procurement markets to pull in the same direction at the same time.
- ‘Standardise’ measurement: all measurement is based on definitions/methods for measurement. If data is provided based on different methods, its value for comparisons, benchmarking and aggregation is limited. Diversity of methods also burdens suppliers unnecessarily. Many climate measurement standards/methods do exist, but we need to a) ‘standardise’ or make commonly accepted and used calculation rules to reduce unnecessary burden on suppliers and CAs and b) ensure that relevant standards are defined for the most important product categories.
- Share data efficiently whilst respecting confidentiality needs: as climate data becomes more granular/detailed, the amount of data to be shared will increase. We need to define how climate data will flow securely and efficiently from supplier to CAs. Some questions that will need to be answered are where climate data should be stored, who should have access (if not open) and how data should be moved.
3.4 A Nordic approach is relevant
Getting acceptance for better climate data will take time and require market pressure. The main reasons for collaborating at the Nordic level are:
- Many suppliers see the Nordic market as one market: dialogue with them will be easier and more effective if we coordinate and synchronise our requirements to them.
- The workload in developing standards will be significant: we can share this load between by for example allocating lead responsibility to specific categories to different countries.
- The Nordic countries share many values needed to underpin this work: highly digitised societies, heavy use of national registers and quality data for decision making, a tradition for open and transparent processes, and collaboration between the private and public sector.
The Nordic countries have similar levels as to digitalisation of procurement processes: a key factor in enabling the smooth and efficient flow of climate information from suppliers to CAs.
4 Market demand for climate data
4.1 What do we mean by market demand? Why is market demand important? What are the goals?
In this report, the focus is on public procurement. The ‘market’ is, of course, a very wide concept. The OECD offers the definition: “where buyers and sellers transact business for the exchange of particular goods and services and where the prices for these goods and services tend towards equality”[1]OECD Glossary of Statistical Terms - Market Definition.
In this chapter, we are drafting the motivation that CAs have for requesting climate data for procurements, the driving forces behind that interest and the areas (government sectors and/or procurement categories) where this interest is most developed.
The public sector CAs are in turn driven by a combination of drivers – some top down and others bottom up. It is these mechanisms and the status of these that we draft in this chapter.
Footnotes
4.2 International /EU/Nordic status regarding climate policies and greener public procurement
We summarise here some of the major international driving forces at the political level that push for stronger focus on climate measurement of public procurement:
- United Nations (UN) in its Sustainable Development Goal (SDG) 12.7 mentions the need for sustainable public procurement, but indicator 12.7.1 refers only to the number of countries implementing appropriate strategies (i.e. no measurement of effect).
- EU – procurement: In 2014, the EU revised the public procurement directives to open for more “strategic” procurement that includes political goals outside the most cost-effective satisfaction of the CA’s needs and has developed a wide range of handbooks and tools to support green procurement[1]https://ec.europa.eu/environment/gpp/index_en.htm. Monitoring has mainly focused on the proportion of competitions that include environmental criteria, rather than the environmental effect achieved. However, the EU report “Study on the implementation of Life Cycle Assessment and Environmental Footprint methods in the context of Public Procurement” (April 2021)[2]European Commission, Directorate-General for Environment, Hofbauer, B., Tisch, A., Schreiber, H., Study on the implementation of life cycle assessment and environmental footprint methods in the context of public procurement : final report, Publications Office, 2021, https://data.europa.eu/doi/10.2779/74025, addresses the challenge of getting “LCA-based information in public procurement procedures”, thereby putting this on the agenda. Work by the OECD on Life-Cycle Costing (LCC) in the context of an EU-funded project with Hungary further supports the conclusion that evidence on LCC is scarcely available[3]Promoting green public procurement in Hungary - OECD. Finally, on 16.12.2021, the commission adopted recommendation EC (2021) 9332 promoting the use of the PEF and OEF methods to measure and communicate the life cycle environmental performance of products and organisations in member states’ policies in general[4]https://eur-lex.europa.eu/legal-content/EN/TXT/?uri=PI_COM%3AC%282021%299332, signalling the importance of standard measurement, but without mentioning public procurement explicitly as usage area.
- Regarding the common green public procurement (GPP) criteria of the EU and LCA, a breakthrough has been seen in the criteria sets of buildings and roads, in which the use of LCA has been described (EC 2018).
- EU – circular economy: In connection with the Circular Economy Action Plan (COM(2020) 98), the need for better data on products is being addressed, a.o. with the “Digital Product Passport” proposal which plays a central role in COM(2022) 142: “Establishing a framework for setting eco-design requirements for sustainable products …”.
- The Organisation for Economic Co-operation and Development (OECD) encourages member countries to adopt green public procurement and points out that about 2/3 OECD countries now monitor results[5]https://www.oecd.org/gov/public-procurement/green/. Beyond that, the OECD also hosts the Secretariat for the Methodology for Assessing Procurement (MAPS), which manages the MAPS international standard to evaluate public procurement systems. As part of the MAPS methodology, the MAPS Sustainable Public Procurement module focuses specifically on the assessment of sustainable public procurement. The OECD carried out a MAPS sustainability assessment for Norway (2020) identifying several key barriers and recommendations, including the need to “Establish a performance management framework that allows for data-driven / evidence-based monitoring of SPP”[6]https://www.mapsinitiative.org/assessments/country-cases/norway/. As part of an EU-funded project, the OECD is also currently developing a Key Performance Indicators (KPI) framework that would support contracting authorities and procurement authorities in monitoring the performance of the procurement, including GPP use and impact.
- The Nordic Council of Ministers emphasises the importance of public procurement in achieving the SDGs[7]https://www.norden.org/en/news/sustainable-public-procurement-effective-way-achieve-global-goals and has published two reports. The first substantiates the relevance through concrete case studies whilst the second made a framework for linking SPP measures to SDG effects at a macro level:
- Sustainable Public Procurement and the Sustainable Development Goals[8]https://www.norden.org/en/publication/sustainable-public-procurement-and-sustainable-development-goals
- Methodology for mapping Sustainable Public Procurement and the Sustainable Development Goals[9]https://norden.diva-portal.org/smash/get/diva2:1554603/FULLTEXT01.pdf
- Many initiatives around the globe include programs for sustainable and green public procurement that emphasise the importance of measuring climate emissions. Two examples:
- Korea has been working on SPP since the 1990’s and is one of relatively few countries to convert an understanding of the importance of impact measurement (economic and environmental) into an implementation of real monitoring[10]https://www.oneplanetnetwork.org/sites/default/files/from-crm/green_public_procurement_in_the_republic_of_korea-_a_decade_of_progress_and_lessons_learned.pdf
- In the USA, the Sustainable Purchasing Leadership Council[11]https://www.sustainablepurchasing.org/ offers members a toolkit for measuring scope 3 emissions[12]https://www.sustainablepurchasing.org/scope-3-ghg-emissions/
Footnotes
- ^ https://ec.europa.eu/environment/gpp/index_en.htm
- ^ European Commission, Directorate-General for Environment, Hofbauer, B., Tisch, A., Schreiber, H., Study on the implementation of life cycle assessment and environmental footprint methods in the context of public procurement : final report, Publications Office, 2021, https://data.europa.eu/doi/10.2779/74025
- ^ Promoting green public procurement in Hungary - OECD
- ^ https://eur-lex.europa.eu/legal-content/EN/TXT/?uri=PI_COM%3AC%282021%299332
- ^ https://www.oecd.org/gov/public-procurement/green/
- ^ https://www.mapsinitiative.org/assessments/country-cases/norway/
- ^ https://www.norden.org/en/news/sustainable-public-procurement-effective-way-achieve-global-goals
- ^ https://www.norden.org/en/publication/sustainable-public-procurement-and-sustainable-development-goals
- ^ https://norden.diva-portal.org/smash/get/diva2:1554603/FULLTEXT01.pdf
- ^ https://www.oneplanetnetwork.org/sites/default/files/from-crm/green_public_procurement_in_the_republic_of_korea-_a_decade_of_progress_and_lessons_learned.pdf
- ^ https://www.sustainablepurchasing.org/
- ^ https://www.sustainablepurchasing.org/scope-3-ghg-emissions/
4.3 Status in the individual Nordic countries regarding climate policies and public procurement
4.3.1 Denmark
The Danish climate policy is largely driven by the national greenhouse gas reduction targets set out in the Danish Climate Act from 2020. In addition, the fulfilment of Denmark's international climate obligations and the fulfilment of national targets in the energy field, which have a large effect on greenhouse gas emissions from Denmark. In this climate law, Denmark must reduce greenhouse gas emissions by 70 percent in 2030 compared to 1990, and further by 2050, Denmark must not emit more greenhouse gases than are absorbed.
In October 2020, a new strategy on public procurement was launched: “Green Procurement for a Green Future – strategy for green public procurement»[1]https://oes.dk/media/39012/strategi-for-groenne-indkoeb-engelsk.pdf, including several initiatives urging for a greener public procurement system. First and foremost, the government will set a target for public procurement, which will serve as a driver for the efforts towards the reduction of Denmark's emissions by 70 per cent in 2030 and towards full climate neutrality by 2050. The reduction target will be supplemented and supported by initiatives aimed at specific procurement areas and at making it easier to buy green. When setting a reduction target, this must be done based on a thorough projection of the public sector's climate footprint related to procurement in 2030.
Denmark is divided into five regions, with the main responsibility for healthcare. In 2020, The representative organisation ‘Danske Regioner’ published a new proposal in which they suggest the CO2 emissions from the Danish hospitals to be reduced by as much as 75 percent by 2030[2]http://www.e-pages.dk/regioner/188/.
Municipalities are also looking into carbon accounting. In the DK2020 Network, over 90 local authorities have committed to making climate plans with concrete goals and achieving climate neutrality in 2050[3]https://realdania.dk/projekter/dk2020.
Footnotes
4.3.2 Finland
The new Finnish Climate Law came into force 1 July 2022. State authorities must promote its goals and plans. Another link of the Climate law to the public procurement comes from its reference to the Medium-term Climate Change Policy Plan[1]Kohti hiilineutraalia Suomea – hallitus hyväksyi keskipitkän aikavälin ilmastopolitiikan suunnitelman - Ympäristöministeriö. The Plan states that the climate work done in municipalities will be strengthened. Legislation is being drafted to obligate local governments to draw up climate plans, either alone or together. The legislative amendment related to the obligations of local governments is to be given to Parliament in autumn 2022. In addition, the Plan says that the public procurement plays an important role in reducing emissions. According to the plan, a Government Resolution will be adopted concerning domestic and low-carbon procurement operations. The Resolution will set an emissions reduction target for public procurement operations, and the achievement of this target will also be monitored. Nearly 80% of GHG emissions associated with public procurement originate from purchases made by local governments and joint municipal authorities and about 20% from those made by the central government.
Public procurement directives (2014/24/EU, 2014/25/EU and 2014/23/EU) were implemented into the national legislation in Finland in 2017. The Finnish public procurement law sets the framework for the process of public procurement offering many possibilities for green and low-carbon approaches (Kalimo et al. 2021, Berg et al. 2022). For the promotion of sustainable and innovative public procurement, a new Competence Centre for Sustainable and Innovative Public Procurement (KEINO) was launched in 2018 (Finnish government 2018). KEINO is network-based, and it combines the expertise of several types of organisations (e.g. expert organisations, research organisations, municipalities and the Association of Finnish municipalities). KEINO is financed by the Finnish Ministry of Employment and Economy. The approach of KEINO includes the traditional informative elements such as advisory services, guidance and criteria setting for SPP. It has also developed new services, procedures and tools for promoting the strategic leadership and management of SPP in public organisations. Furthermore, it aims to accelerate co-operation among CAs and market players, through services ranging from the coordination of buyer groups to a regional network of change agents. One of the services is the KEINO Academy, which is a special development program that brings public procurement leaders and experts together to learn and develop. (KEINO Competence Centre 2021, Berg et al. 2022.)
Alongside the work with KEINO, the Finnish Ministry of Finance (2020) has launched a national public procurement strategy (Procurement Finland), one of its eight themes being ecological sustainability. In the theme, the first goal is to support the climate policy “carbon-neutral Finland 2035” and to support the transition to a circular economy.
Footnotes
4.3.3 Norway
4.3.3.1 Requirements in the Public Procurement Act
Historically, the major driver for climate awareness in procurement has been article 5[1]https://lovdata.no/lov/2016-06-17-73/§5 of the Public Procurement Act (implementing directive 2014/24) that requires public authorities to adjust their procurement practices to reduce harmful environmental impact and promote climate-friendly solutions, when relevant. The definition of what this implies in practice is somewhat open and places responsibility for defining the level of ambition on CAs. DFØ gives recommendations in the form of advice and texts (requirements, criteria and contract clauses) that can be used in the procurement process. In the case of vehicles, a specific regulation[2]https://lovdata.no/dokument/SF/forskrift/2021-12-21-3840 enforces the clean vehicle directive but uptake in procurement activities was initially relatively slow.[3]nye-utslippskrav-ved-offentlige-anskaffelser-av-kjoretoy-19.12.19.pdf (regjeringen.no) (Oslo Economics 2019) This regulation has been updated to require procurement of zero emissions cars (for procurements published after 1.1.2022) and light vans (from 1.1.2023). Data acquisition systems have been implemented using the vehicle register to give public sector CAs an overview of their vehicles and central authorities the possibility of monitoring conformance.
Monitoring whether CAs follow the §5 requirements (and associated regulations) in practice has been challenging:
- It is unclear as to what “when relevant” means in practise.
- What part of the procurement process needs to be monitored? The law itself is usually interpreted as steering the competition phase itself (i.e. from a defined set of needs to signing the contract). However, much procurement is based on framework agreements, and although some environmental requirements can be implemented in the competition itself (through award criteria, contract clauses, etc.), many of the decisions that have environmental effect will be taken when placing orders: e.g., whether to buy or not, aggregating orders to reduce number of deliveries, repair or replace, which pen or paper to order, whether to take the train or plane, or even whether to buy an electric or fossil vehicle.
- Responsibility for verification is unclear. Who is responsible for checking whether environmental concerns have been implemented and how?
In their report on Green Public Procurement, The Norwegian Office of the Auditor General highlighted the lack of statistics and management data on green public procurement[4]https://www.riksrevisjonen.no/globalassets/rapporter/no-2021-2022/gronne-offentlige-anskaffelser.pdf.
Footnotes
- ^ https://lovdata.no/lov/2016-06-17-73/§5
- ^ https://lovdata.no/dokument/SF/forskrift/2021-12-21-3840
- ^ nye-utslippskrav-ved-offentlige-anskaffelser-av-kjoretoy-19.12.19.pdf (regjeringen.no) (Oslo Economics 2019)
- ^ https://www.riksrevisjonen.no/globalassets/rapporter/no-2021-2022/gronne-offentlige-anskaffelser.pdf
4.3.3.2 Climate accounting and budgeting as a driver
More recently, the interest in measuring climate emissions has increased, and the use of climate accounts and budgets is becoming widespread in the private sector and local authorities, but not yet in central government other than defence.
The following driving forces have been particularly important:
- political interest at the local level, often combining climate and environmental awareness with looking for opportunities for local business development,
- the Eco-Lighthouse[1]http://www.eco-lighthouse.org/ certification organisation that includes a requirement for climate accounting, although scope 3 is not emphasised there
- clear signals and tools for climate budgeting from the Association of Local and Regional Authorities (KS)[2]https://www.ks.no/fagomrader/samfunnsutvikling/klima/veileder-for-klimabudsjett/ in collaboration with some of the largest local authorities,
- market availability of the Klimakost tool[3]www.klimakost.no marketed by Asplan Viak (private consultancy) for calculating local authorities’ climate emissions, including scope 1, 2 and 3 at the category level (based on average climate intensities). This tool has become a de-facto standard and the method used is published[4]https://www.klimakost.no/public/Docs/Documentation%20of%20Klimakost.pdf, but the underlying data and code is proprietary.
- increased awareness of climate gas scope 3 emissions (climate footprint) in environmental collaborations like Klimapartner[5]https://klimapartnere.no/about-klimapartnere/ , where 300 organisations that have pledged to a.o. have climate accounts.
As of October 2021, the role of central government in relation to climate accounting and budgeting for government organisations has been limited, except for the military and the county governors (the latter due to their close contact with the local authorities), but the recent government “Action Plan for increased proportion of climate and environment friendly public procurement and green innovation”[6]https://anskaffelser.no/om-oss/handlingsplan-gronne-og-innovative-anskaffelser (English version being prepared) includes measures to increase climate reporting in central government and is being actively followed up. The effect of this is already being noticed as requirements for climate reporting are being placed on central government agencies, and some of these specify that scope 3 emissions should be included, but how this should be done in detail is not yet clarified.
Two challenges that have already been identified by implementation projects are:
- Getting high quality, detailed data on the procuring agencies procurements out of the relevant IT systems
- Handling the varying grades of detail of the available climate data on the specific products that have been delivered: For some products, very detailed climate data may be available, whilst for others one may have to base accounting on rough category averages using value rather than physical units as input factors.
4.3.3.3 Concrete examples of use of climate emission data for procurement
Some organisations are actively using climate data in their reporting, but inclusion of scope 3 (procurement related) climate data is at an early stage.
Oslo City has for many years had yearly climate accounts for its own operations[1]https://www.oslo.kommune.no/getfile.php/13396523-1614084149/Tjenester%20og%20tilbud/Politikk%20og%20administrasjon/Statistikk/Milj%C3%B8status/Klimastatistikk/Klimagassutslipp%20Oslos%20virksomhet%202012%20til%202020.pdf but this has not included scope 3 emissions. They are now working together with KMD (IT solutions company in Denmark[2]https://www.kmd.net/) to develop scope 3 data based on procurement data.
Norad - Norwegian Agency for Development Cooperation has an ambitious goal on reducing its climate footprint. Air travel is an important contributor, so they are planning to develop a tool to help prioritise, plan and follow up their flights to ensure effective use of their climate budgets. In order to ensure compatibility with data from the travel agents, an approach based on UK/DEFRA methodology[3]Greenhouse gas reporting: conversion factors 2021 - GOV.UK (www.gov.uk) will probably be used.
The procurement collaboration for the Kongsvinger region (RIIK.no) is buying (innovative procurement) a system for acquiring climate data related to purchasing. The aim is to have an MVP ready in February 2022. A challenge that they have identified is getting specific enough data out of the accounting systems. The preliminary process model that they based their project on was:
Footnotes
- ^ https://www.oslo.kommune.no/getfile.php/13396523-1614084149/Tjenester%20og%20tilbud/Politikk%20og%20administrasjon/Statistikk/Milj%C3%B8status/Klimastatistikk/Klimagassutslipp%20Oslos%20virksomhet%202012%20til%202020.pdf
- ^ https://www.kmd.net/
- ^ Greenhouse gas reporting: conversion factors 2021 - GOV.UK (www.gov.uk)

A collaboration of four local authorities (Gjøvik, Hamar, Løten and Stange) have developed a tool in collaboration with Sweco for reducing the threshold for taking environmental aspects into the procurement process.
The need for better climate reporting is particularly noticeable in the construction field. Two examples: a) four of the CAs that purchase construction (lead: BaneNor, the railway infrastructure authority) have requested DFØs assistance in standardising climate reporting from construction activities and b) a major climate NGO, Zero, has pointed out that current climate accounting for motorway construction in the national budget excludes the most significant climate emissions, particularly “indirect emissions” (see figure)[1]https://www.nrk.no/klima/nye-motorveier_-vei-utslippene-mye-hoyere-enn-statsbudsjettet-forteller-1.15754552. The government response places responsibility for handling the scope 3 emissions on CAs.
4.3.4 Sweden
The climate law in Sweden (Klimatlag 2017:720) requires the government to set goals and take actions that is in line with the Paris agreement. There is a growing understanding in society that all sectors need to contribute to minimising their emissions. There is also a legislative proposal from the government that all procurement will be obliged to take climate and other aspects of sustainability into account, if relevant[1]https://www.upphandlingsmyndigheten.se/nyheter/2021/skarpta-krav-pa-hallbarhet-vid-offentlig-upphandling/. There is an increasing understanding and focus on the climate impact from the public consumption. There is not yet any law limiting climate impact but from 2022-01-01 a law was implemented which makes carbon calculation and declaration mandatory for new houses.[2]https://www.boverket.se/sv/klimatdeklaration/
Many regions and municipalities want to include climate aspects in their purchase and procurements, but also want more support and tools to make the “right” decisions. The association of cities and regions in Sweden for transition towards a fossil free future e is an organisation, that cooperate to find methods and tools for municipalities[3]Klimatkommunerna, https://klimatkommunerna.se/in-english/. There are also a lot of other publicly funded projects working to find ways to mitigate climate impact in different areas, often including purchasing or procurement criteria. One major initiative is the Fossil free Sweden[4]https://fossilfrittsverige.se/en/start-english/. The initiative is making companies, industries, municipalities and regions work together to identify obstacles and opportunities and producing roadmaps for de-fossilising different sectors in the market often resulting in increasing demand for procurement criteria.
There is a growing need for support, such as criteria and other tools for municipalities and regions to take climate aspects into consideration in their procurement. The Agency for Public Procurement has developed support for the building- and construction sector, with a guide and criteria for climate mitigation in procurement. There is also an increasing demand for similar support when it comes to procurement of food, transport and all other goods and services that the public sector procures. The Agency for Public Procurement has also published support on the environmental spend analysis (se section 5.3.4 and 6.5.4 below)
Calculating carbon footprint of products and climate reporting is more and more frequently occurring, at least amongst medium and larger companies. In many cases it is seen as a necessity in order to gain trust and “license to operate”.
Footnotes
4.4 Summary of experiences and challenges
- “Green” procurement is increasingly being driven/pushed/followed up by climate politics and goals
- Climate politics are quantitative (concrete, measurable goals). Procurement must produce underlying figures
- Cost effectiveness is important: how to reduce climate emissions as cheaply as possible - preferably with negative costs
- Some CAs are at present using ecolabels (type 1) as basis for selection and then estimating climate effects based on proportion of eco-labelled products purchased.
- CAs have some experience in the use of EPDs already, and some challenges have been identified, e.g.: how to handle product offers with no EPD, how to compare when the EPDs are based on different PCRs or even based on the same PCR but from different suppliers, how to manage the flow of EPDs, checking whether the EPD matches the product.
- Important for CAs to see the big picture when satisfying their organisation’s needs and not just the traditional competition phase from supplier dialogue to contract award (i.e. look at radically alternative solutions for need satisfaction).
5 How to quantify climate emissions of PP reliably and transparently
5.1 Why should measurement be harmonised?
The motivation for measuring climate emissions related to procurement has been drafted in the previous chapter. This chapter will draft the question as to how to measure these climate emissions in such a way that it can be used in procurement processes.
Climate measurement in the context of this report bears similarities to LCA but restricted to a) the climate emissions dimension and b) focusing upstream (suppliers) rather than taking a life cycle perspective. LCA experience shows that full LCAs are expensive and that defining system boundaries is challenging, so that results can be inconsistent, and thereby losing legitimacy.
Standardisation of methods for measurement:
- Reduces costs for suppliers: They only need to carry out measurements once for each product for all CAs instead of each CA placing individual measurement requirements.
- Reduces costs for CAs: They can base their procurement requirements on standards rather than having to develop their own requirements.
- Increases acceptance: Results will be comparable across suppliers and therefore satisfying procurement regulations.
- Reduces probability of legal challenge: Chances of making mistakes in defining and using climate figures in public procurement is reduced by CA in the standardisation process.
However, procurement regulations place demands on the methods that can be used by requiring, for example, openness, proportionality, relevance to the subject matter of the contract and non-discrimination in requirements to suppliers. These need to be considered when defining the standards.
The current lack of standards is leading to frustration and some CAs are looking at alternative, simpler ways of taking climate into account in the procurement, e.g., by requiring suppliers to take part in the Science Based Targets initiative[1]https://sciencebasedtargets.org/ or equivalents, but questions have been posed as to whether this is good public procurement practise.
It is unlikely that one will find one standard method for all procurement situations without being so generic that it needs reinterpretation in each situation. So, one of the issues will probably be as to define how many standards will be needed and which standards/categories to begin with.
Footnotes
5.2 Nordic/EU/international status
5.2.1 Product-specific greenhouse gas emissions (carbon footprint of a product)
There are several methods to determine the carbon footprint (CF) for a specific product or for a product group (Nissinen et al 2021). Which method has been used affects the reliability and comparability of the CF value. The CF standard (ISO 14067:2018) is a reasonable starting point for CF measurement. However, even if the standard is followed, there are many possibilities to make subjective choices in CF assessments (like in Life Cycle Assessments (LCAs) (Galatola and Pant, 2014)). There can be differences in terms of e.g. data sources, allocation and cut‐off criteria.
Category‐ specific rules – such as those in the Product Environmental Footprint (PEF) and the Environmental Product Declaration (EPD) schemes (European Commission, 2020; EPD, 2021) – improve the comparability of different CFs. However, such schemes are only available for a few product categories. On the other hand, there are also CF assessments based on LCA rules, but instead of doggedly following the rules, they try to get appropriate results in cost‐effective ways. They can be hybrid analyses using data from both product‐specific CF assessments and EIO (Economic input-output) analyses, or they can focus on the most important stages of the product life cycle.

After a relatively quiet period, there now seems to be more life in the European Commission’s (EC) PEF activities.
A recommendation on the use of Environmental Footprint methods was published on 16th December 2021[1]https://ec.europa.eu/environment/publications/recommendation-use-environmental-footprint-methods_en.
The EC has been arranging a set of training seminars[2]https://ec.europa.eu/environment/eussd/smgp/ef_trainings.htm (Including category rules - PEFCR) in 2021 and 2022. A 2-hour recorded seminar for SMEs gives a good introduction[3]https://ec.europa.eu/environment/eussd/videos/PEF%20-%20Product%20Environmental%20Footprint%20-%20What%20it%20is%20and%20benefits%20for%20SMEs.mp4.
An international hub for EPD data, the EPD portal[4]https://data.environdec.com/, has been established by EPD International AB[5]https://environdec.com/about-us/epd-international-ab-about-the-company-behind-the-system to allow easier access to EPD data.
Footnotes
- ^ https://ec.europa.eu/environment/publications/recommendation-use-environmental-footprint-methods_en
- ^ https://ec.europa.eu/environment/eussd/smgp/ef_trainings.htm
- ^ https://ec.europa.eu/environment/eussd/videos/PEF%20-%20Product%20Environmental%20Footprint%20-%20What%20it%20is%20and%20benefits%20for%20SMEs.mp4
- ^ https://data.environdec.com/
- ^ https://environdec.com/about-us/epd-international-ab-about-the-company-behind-the-system

In summary, we can identify several different methods for assessing the CF of products: (1) a product‐specific CF value, based on PEFCRs (the category rules of a PEF); (2) a product‐specific CF value, based on the EPD scheme and product category rules (PCRs); (3) a product‐specific CF value, based on the CF standard (ISO 14067:2018); (4) a simplified CF; and (5) a CF value for the product group, resulting from EIO analysis. (Nissinen et al. 2021.)
It is worth noting that most of the results about CF of PP mentioned in this report have been produced by the method 5, called EIO analysis or input-output method.
Climate footprint/KWh for electricity not covered by certificates of origin has to be published nationally in all EU/EEA countries[1]https://eur-lex.europa.eu/legal-content/EN/TXTtemanord2022-544.pdf?uri=CELEX:32019L0944&from=EN Annex 1 §5 b).. In Norway this is done by NVE[2]https://www.nve.no/energy-supply/electricity-disclosure/.
The EU has published a report in 2021: “Study on the implementation of life cycle assessment and environmental footprint methods in the context of public procurement”[3]https://data.europa.eu/doi/10.2779/74025, which is also mentioned in 4.2.
Footnotes
5.2.2 Greenhouse-gas emissions of public procurement of a country by EIO models
The environmentally extended input-output models of an economy (EIO-models, like ENVIMAT in Finland, see Nissinen & Savolainen 2019, and international EXIOBASE, see Stadler et al. 2021) have been widely used to assess greenhouse gas emissions by both production and consumption activities. Regarding public sector, the main result is the magnitude and distribution of the greenhouse gas emissions caused by the procurement expenditure groups and investments. In other words, the emissions represent the average emissions of the products in each product group on the market of a country. For each product group, they cover the life-cycle from the raw material production to the purchase by the public organisation. The accuracy of the model is not sufficient to examine different products within groups of goods or services. For instance, it is usually not possible to compare different ‘environmentally friendly’ products to ‘ordinary’ products using the model.
5.2.3 Company-specific greenhouse gas emissions (carbon footprint of a company)
CAs cannot generally use the information about company-specific greenhouse gas emissions in procurement, as this information is not specific for the products they are procuring. Companies usually produce and/or sell multiple products and the emissions of the company need to be allocated to the products. And the emissions of a company don’t always include the emissions in the upstream production chain in a proper way (so-called scope 3 emissions), whereas in the carbon footprint of a product the whole production chain needs to be accounted for. And the emissions of a company don’t usually include the emissions from the products in the use phase and waste phase (i.e., so-called downstream emissions).
However, many companies are active in delivering climate information at the company level which stimulates public debate. Some of the following global initiatives may be relevant as sources for data and/or measurement methods for climate data (se also 5.1):
- GHG protocol: offers free tools for calculating climate emissions at the company level[1]https://ghgprotocol.org/ghg-emissions-calculation-tool.
- Global reporting initiative (GRI): voluntary system to help companies report their sustainability performance based on open standards[2]https://www.globalreporting.org/media/wtaf14tw/a-short-introduction-to-the-gri-standards.pdf. List of verified reports last updated December 2020[3]https://www.globalreporting.org/reportregistration/verifiedreports.
- Carbon disclosure project[4]https://www.cdp.net/en/info/about-us/what-we-do (CDP): like GRI but more quantitative with emphasis on climate change, water security and deforestation: “We believe that data lies at the heart of the sustainable transition”. Datasets available online[5]https://data.cdp.net/browse?sortBy=newest&utf8=%E2%9C%93.
- Science Based Targets initiative (SBTi)[6]https://sciencebasedtargets.org/companies-taking-action ; private sector initiative to measure and set targets for emissions.
- Task Force on Climate-related Financial Disclosures (TCFD)[7]https://www.fsb-tcfd.org/: established by the financial community “to develop recommendations for more effective climate-related disclosures that could promote more informed investment, credit, and insurance underwriting decisions….”
- Corporate Knights: ranking system: ranking for2022[8]https://www.corporateknights.com/rankings/global-100-rankings/2022-global-100-rankings/.
- The “DEFRA” conversion factors[9]https://www.gov.uk/government/publications/greenhouse-gas-reporting-conversion-factors-2021 are used by many organisations and reporting systems to provide the key multipliers for climate reporting.
- In the context of Joint Nordic Vision 2030, Nordic Innovation has financed the development of a standard for environmental accounting, the Nordic Sustainability Reporting Framework[10]https://www.nsrs.eu/, https://www.jottacloud.com/s/279c68a24f0eaf14b24be3e5e0946cfb1e8 (NSRS) particularly aimed at SMEs in the Nordic region:
Footnotes
- ^ https://ghgprotocol.org/ghg-emissions-calculation-tool
- ^ https://www.globalreporting.org/media/wtaf14tw/a-short-introduction-to-the-gri-standards.pdf
- ^ https://www.globalreporting.org/reportregistration/verifiedreports
- ^ https://www.cdp.net/en/info/about-us/what-we-do
- ^ https://data.cdp.net/browse?sortBy=newest&utf8=%E2%9C%93
- ^ https://sciencebasedtargets.org/companies-taking-action
- ^ https://www.fsb-tcfd.org/
- ^ https://www.corporateknights.com/rankings/global-100-rankings/2022-global-100-rankings/
- ^ https://www.gov.uk/government/publications/greenhouse-gas-reporting-conversion-factors-2021
- ^ https://www.nsrs.eu/, https://www.jottacloud.com/s/279c68a24f0eaf14b24be3e5e0946cfb1e8
5.3 Status in the Nordic countries
5.3.1 Denmark
The climate footprint of public procurement will be calculated annually as a part of the strategy “Green Procurement for a Green Future – strategy for green public procurement». In 2020 the total climate footprint of public procurement in Denmark was calculated, which amounted to DKK 12 million tonnes of CO2 equivalents for 2019. The largest climate footprint comes from the procurement area 'Construction’, which contains both new construction and new facilities as well as repair and maintenance of existing buildings and facilities. The second largest climate footprint comes from procurement areas covering the procurement of goods and services from a vast number of different industries, the procurement area which covers the public consumption of electricity, district heating and natural gas as well as other utilities such as water and waste management. The climate footprint has been calculated using the calculation model EXIOBASE, which is an Environmentally Extended Multi-Regional Input/Output table (EE-MRIO table).
Among other alternatives, EXIOBASE was selected as the model as it also includes the emissions abroad, and because extensive use was made of additional statistical data in the model for further processing of the underlying MRIO tables into an actual calculation model, from which the results can be linked directly to procurement data.
Furthermore, the Danish Energy Agency calculates the annual Danish consumption-based climate footprint. In 2021, the total consumption-based carbon footprint was calculated to around 61 million tonnes CO2e in 2019.
In December 2021 a web-based greenhouse gas calculator ’Klimakompasset’[1]https://klimakompasset.dk/klimakompasset/ (but requires Danish ID for use) (the Climate Compass) was made available to Danish companies. The Climate Compass is a web-based CO2 calculator based on the Greenhouse Gas protocol, and which includes around 500 emission factors related to direct and indirect greenhouse emissions (scope 1, 2 and 3). It replaces the former version of the calculator, which is an excel-based version of the CO2 calculator. It is launched to make it easier for especially small and medium-sized enterprises (SMEs) to calculate their climate footprint and gain insight into how they can reduce their CO2e-footprint.
Footnotes
- ^ https://klimakompasset.dk/klimakompasset/ (but requires Danish ID for use)
5.3.2 Finland
5.3.2.1 The carbon footprint of public procurement
The carbon footprint (i.e. life-cycle greenhouse gas emissions) of public procurement in Finland was measured for the first time in 2019 (Nissinen & Savolainen 2019), for 2015. The main method used was the environmentally extended input-output model ENVIMAT, supplemented with statistics on public procurement. The carbon footprint of Finnish public procurement was 8.3 million tonnes CO2e in 2015 and the carbon footprint of investments made by public organisations amounted to 2.7 Mt CO2e.
Government procurement accounted for 21%, municipal procurement accounted for 57% and joint municipal authority procurement accounted for 22% of the total carbon footprint of public procurement. Looking at state administration, the administrative branch with the highest greenhouse gas emissions was the administrative branch of the Ministry of Defence (43% of emissions), followed by those of the Ministry of Transport and Communications (21%) and Ministry of the Interior (10%).
Urban municipalities caused 3.33 Mt of emissions, and semi-urban municipalities caused 0.69 Mt and rural municipalities 0.71 Mt. Among the federations of municipalities, it was the hospital districts that had the largest emissions (1.03 Mt).
The types of procurement expenditure with the highest emissions were heating and electricity, construction and maintenance services for buildings and areas, building services, land and water structure repair and maintenance services and travel and transport services. Food, cleaning and laundry services, fuels and lubricants, and drugs and treatment supplies also generated a significant proportion of emissions.
In state procurement, 42% of the emissions were caused by buying services, 38% from goods, 12% from rents, and 8% were due to other costs. Buying goods caused the largest emission share in the defence administration (55%), whereas services caused the largest share (81%) in the traffic and communications sector. In the procurement made by municipalities and federations of municipalities 42–43% of emissions were caused by the procurement of services and 52% from goods.
5.3.2.2 Carbon footprint of state procurement by procurement expense type
The state had 67 procurement expense types (i.e. LKP accounts). Among these, ten procurement expense types caused more than 50 million kilograms (Mkg) of greenhouse gas emissions each. The largest state emissions were generated by the Heating, electricity and water category, 236 Mkg (i.e. 0.236 Mt). The most significant administrative branches for this category were the Ministry of Defence (121 Mkg) and the Ministry of Transport and Communications (47 Mkg). The Repair and maintenance services for earthworks and water structures category resulted in emissions nearly as large, 231 Mkg, and in this respect, the Ministry of Transport and Communications held first place with 228 Mkg in procurement emissions. The emissions of the Fuel and lubricants category were 207 Mkg, and the largest emissions were generated in the Ministry of Defence (146 Mkg) and the Ministry of the Interior (36 Mkg) administrative branches. The category of Rent from other buildings also generated substantial emissions, 189 Mkg, and among the administrative branches, the Ministry of Defence (42 Mkg), the Ministry of Justice (29 Mkg) and the Ministry of the Interior (29 Mkg) were highlighted. The category of Other external services caused 151 Mkg of emissions, and the Ministry of Transport and Communications caused 54 Mkg, the Ministry of the Interior 44 Mkg, and the Ministry of Defence 31 Mkg of emissions. The second ‘dumping category’ of Other substances, supplies and goods caused 136 Mkg of emissions, of which 97 Mkg were caused by the administrative branch of the Ministry of Defence, and 14 Mkg were caused by the administrative branch of the Ministry of Social Affairs and Health. The Expert and Research Services category caused 125 Mkg of emissions, which was more evenly distributed among administrative branches than most other types of procurement expenses, as the largest emissions were generated in the administrative branch of the Ministry of Finance (27 Mkg) and the administrative branch of the Ministry of Defence (26 Mkg). The National Defence Equipment category caused 74 Mkg of emissions, and it was created entirely in the field of the Ministry of Defence. The emissions caused by the Repair and maintenance services of other machines and equipment category were 58 Mkg, of which 53 Mkg were caused by the administrative branch of the Ministry of Defence.
5.3.2.3 Carbon footprint of procurement made by municipalities and associations of municipalities by procurement expense type
There were 34 types of procurement expenses in municipalities. Among these, twelve procurement expense types caused more than 100 million kilograms (Mkg) of greenhouse gas emissions each. In municipalities, the largest emissions were generated by the Heating (799 Mkg) and Electricity and gas (745 Mkg) categories. The other larger categories included the following: Construction and maintenance services for buildings and areas (427 Mkg), Travel and transport services (374 Mkg), Foodstuffs (334 Mkg), Cleaning and laundry services (285 Mkg), Rent for buildings and apartments (272 Mkg), Accommodation and catering services (244 Mkg), dumping category Other services (166 Mkg), Other joint operations shares (151 Mkg), and Fuel and lubricants (144 Mkg). The emissions for the Office and expert services category were 125 Mkg.
There were also 34 types of procurement expense types in associations of municipalities. Among these, six procurement expense types caused more than 100 million kilograms (Mkg) of greenhouse gas emissions each. The largest emissions were generated in the Travel and transport services (292 Mkg) and Medicines and medical supplies (269 Mkg) categories. The next largest emissions came from the Heating (180 Mkg), Electricity and gas (157 Mkg), Cleaning and laundry services (114 Mkg) and dumping category “Other services” (105 Mkg).
Hansel has applied the emission factors for public procurement expenditure categories produced by the ENVIMAT-study (Nissinen & Savolainen 2019). They developed a tool, ‘Hankintapulssi’, which they can use for producing the yearly carbon footprint of purchases of each public organisation, divided to the expense categories.
5.3.2.4 Hankintapulssi by the central purchasing body Hansel
Hansel Ltd is a non-profit limited company, and act as a central purchasing body for central and local governments in Finland. The Association of Finnish Local and Regional Authorities is a shareholder in Hansel Ltd with a 35% stake and the state’s ownership is 65%.
Hansel has applied the emission factors for public procurement expenditure categories produced by the ENVIMAT-study (Nissinen & Savolainen 2019). They developed a tool, ‘Hankintapulssi’, which they can use for producing the yearly carbon footprint of purchases of each public organisation, divided to the expense categories. Now all state organisations can use Hankintapulssi, and in addition there are over 60 municipal and education organisations using it.
5.3.2.5 State Treasury of Finland
The State Treasury of Finland published in September 2021 guidance on sustainability reporting for organisations within the central government. Carbon footprint is one part of this sustainability reporting and as a primary step the State Treasury will produce estimates of carbon footprint for years 2020 and 2021 for the central government as a whole. State Treasury started the development of a database for this footprint assessment in 2021, covering financial procurement information of each state organisation and carbon footprint coefficients of the procurement expenditure categories. (State Treasury of Finland 2022)
5.3.2.6 Requiring carbon footprint in procurement cases
There have been a few cases in which LCA or the carbon footprint has been documented in real procurement cases (i.e. in the comparison of tenders) (see, e.g. Mattinen and Nissinen 2012 for lap-tops, Nissinen et al. 2012 for office buildings, and Parikka-Alhola and Nissinen 2012 for roads). (Nissinen et al. 2019.)
Suikkanen and Nissinen (2020) described the use of the PEF method for carbon footprint calculation in connection with public procurement. In addition, their report described the materials and databases made available to the public by the European Commission to support the calculation process. Possible applications to the procurement of milk and IT-products were outlined in the report, and the City of Helsinki later studied the possible application in the procurement of milk further.
Suikkanen and Nissinen (2020) further concluded that in order to be able to use PEF information as part of tendering processes, product category-specific rules (PEFCRs) must be applied, but currently, such rules have been drawn up only for 17 product categories. In addition, PEFCRs for another five product categories are being developed. The European Commission published in December 2021 a recommendation on the use of the Environmental Footprint methods to measure and communicate the life cycle environmental performance of products and organisations[1]https://ec.europa.eu/environment/publications/recommendation-use-environmental-footprint-methods_en.
The City of Helsinki has recently published experiences about eight procurement cases from years 2020–2022, in which carbon footprint information was required. For example, for work clothes the Contract terms and conditions requite the following: During the contract period, Service Centre Helsinki shall have the opportunity to use a calculation tool developed during the review of lifecycle impacts and to assess the carbon dioxide emissions, water consumption and costs of the procurement’s lifecycle. (City of Helsinki 2022)
Footnotes
5.3.3 Norway
The dominant measurement system for climate emissions for local authorities (as organisations, rather than as geographic areas) is the “Klimakost” method[1]https://www.klimakost.no/public/Docs/Documentation%20of%20Klimakost.pdf developed by MiSA 10 years ago now marketed by Asplan Viak[2]https://www.klimakost.no/. In short, the Klimakost method is based on using Economic Input/Output data to map the value chains of procurement through different business sectors where climate emissions are known. This allows one to calculate climate intensities (in CO2e/kroner) for different consumption categories. By mapping spend figures onto these consumption categories, one can then calculate emission intensities by spend categories, and thereby the upstream scope 3 emissions for a given organisation (given access to their spend in kroner per category). This data gives a good overview, which can then be used as input to a planning/prioritising process for reducing scope 3 emissions. However, many actions in such plans (e.g., new requirements to products) will not affect the climate figures and may even show an increase in climate emissions if prices increase as the climate emission figures are based on averages that do not consider the climate characteristics of the specific products bought. There is therefore widespread interest for tools/data that are more specific/granulated.
DFØ is piloting a climate spend analysis tool[3]https://public.tableau.com/app/profile/df.3699/viz/Klimaspendverkty_16522652846120/Forsiden (And associated climate intensity table) similar to Klimakost but matching the accounting system for central government, based on climate intensity data developed in collaboration with NIRAS[4]www.niras.com - Danish Engineering Consultancy. The methods (incl. assumptions and approximation) used will, of course, be publicly available.
Regnskap Norway (Accounting Norway) has been an active promoter for the Nordic NSRS tools mentioned above.
The Central procurement agency (SIS)[5]https://anskaffelser.no/statens-innkjopssenter is basing its climate reporting for public sector travel on using the travel agencies to collect climate data based on DEFRA greenhouse gas conversion factors[6]https://www.gov.uk/government/collections/government-conversion-factors-for-company-reporting.
Interest for EPDs is noticeable, particularly in buildings/construction and furniture[7]https://www.epd-norge.no/epder/. There is at present no machine-readable database for the Norwegian EPDs.
The Norwegian Association of Local and Regional Authorities (KS) has published, in collaboration with Oslo, Hamar and Trondheim a handbook for using climate budgeting as a management tool[8]https://www.ks.no/fagomrader/samfunnsutvikling/klima/veileder-for-klimabudsjett/.
To follow up climate performance of light vehicles owned/leased by public sector organisations, DFØ has developed a data tool[9]www.anskaffelser.no/bilparkdata based on WLTP[10]https://www.wltpfacts.eu/what-is-wltp-how-will-it-work/ data (CO2 gm/km) from the central vehicle register. However, an unofficial calculation in one local authority indicated that actual emissions were twice the estimate based on WLTP.
Footnotes
- ^ https://www.klimakost.no/public/Docs/Documentation%20of%20Klimakost.pdf
- ^ https://www.klimakost.no/
- ^ https://public.tableau.com/app/profile/df.3699/viz/Klimaspendverkty_16522652846120/Forsiden
- ^ www.niras.com - Danish Engineering Consultancy
- ^ https://anskaffelser.no/statens-innkjopssenter
- ^ https://www.gov.uk/government/collections/government-conversion-factors-for-company-reporting
- ^ https://www.epd-norge.no/epder/
- ^ https://www.ks.no/fagomrader/samfunnsutvikling/klima/veileder-for-klimabudsjett/
- ^ www.anskaffelser.no/bilparkdata
- ^ https://www.wltpfacts.eu/what-is-wltp-how-will-it-work/
5.3.4 Sweden
The National Agency for public procurement (Upphandlingsmyndigheten) has published support on the Environmental spend analysis (ESA)[1]https://www.upphandlingsmyndigheten.se/om-hallbar-upphandling/miljomassigt-hallbar-upphandling/analysera-inkopen-med-miljospendanalys/. ESA are methods for indicating the environmental and/or climate impact of purchasing. An environmental spend analysis integrates various environmental parameters into cost-based methods of spend analysis. A spend analysis is based on a structure with different types of purchases called categories or purchase categories. In the Environmental spend analysis each category is given one or several environmental indicators, like climate impact per Swedish krona (SEK) i.e., CO2-equvivalents/SEK. The indicators make it possible to investigate the environmental and/or climate impact of purchases by using only the monetary value of purchases. It also indicates the environmental impact of categories in relation to other categories. The ESA was developed by Jens Johansson at The National Agency for public procurement.
The ESA consists of two main methods for calculating the environmental impact resulting from public procurement. The first method is more suited for analysing public purchases in several organisations at the same time, for example, groups of municipalities or regions. The second method is based on so called accounting-based or process-based life cycle assessment (LCA) data and is promoted as the method for organisations to use when analysing purchases.
Emission factors and calculations cover "cradle" to buyer's gate but concerning fuels, emission factors also cover the use (the incineration) otherwise misrepresenting the environmental impact.
The first method is based on input/output modelling. The environmental parameters in this method are extracted from Exiobase[2]https://www.exiobase.eu/ and flows modelled in SimaPro[3]https://simapro.com/ Parameters include climate change drivers, land use or land use change (LULUC) and other. Statistics on payments is based on data from municipalities, regions, municipal housing and real estate companies, and government agencies. The statistics were analysed and categorised. Environmental indicators where calculated and attributed to categories and the result of the ESAs were published on the web site of The National Agency for public procurement. The ESA-results are indications of the environmental impact of the 2019 public purchasing in Sweden[4]https://www.upphandlingsmyndigheten.se/om-hallbar-upphandling/miljomassigt-hallbar-upphandling/analysera-inkopen-med-miljospendanalys/de-offentliga-inkopens-klimat--och-miljopaverkan/.
The second method is based on accounting or process LCA. An accounting LCA examines the environmental impact of goods, services, or contracts during its life cycle. The environmental impact, including climate impact, from the product or service is tracked and recorded throughout the value chain[5]https://www.upphandlingsmyndigheten.se/om-hallbar-upphandling/miljomassigt-hallbar-upphandling/analysera-inkopen-med-miljospendanalys/verktyg-for-miljospendanalys-av-enskilda-organisationer/.
The climate impact from biogenic sources is not yet included in the analysis. Biogenic sources can be emissions from deforestation or burning biomass. There is also climate impact from when remaining biomass is degraded at cutting areas in forestry or from depletion of wetlands or moist forest land. Further investigative work may be needed here.
One weakness with the ESA indicators is that when prices fluctuate this will affect the outcome of the analysis. For indicators that show the environmental impact per ton or litre etcetera, prize fluctuations are not a problem, their weakness though has been that it is an impossible amount of work needed for a single buyer to quantitatively analyse the environmental impact of the buyers total purchasing using only accounting LCA data. The ESA indicators solves this problem.
The idea of the ESA indicators in the process-LCA ESA is that they also work as a bridge into future ESA-models. Future ESA-models are supposedly fit for handling environmental parameters in digital EPD’s which successively will replace the indicators at category level with data of environmental impact per kg or litre etcetera at product level. The EPD’s to use in these ESAs are thus the EPD’s of actual purchased gods and services. A development of this kind will connect information in and methods of overall analysis like the ESA, to criteria in call for tenders, to EPDs or product passports, to digital purchasing systems and to follow ups of procurements and back to the overall environmental spend analysis.
As today there are several organisations that have used the ESA methods. The latest being the City of Göteborg, performing an ESA on the total purchasing volume[6]https://www.mynewsdesk.com/se/goteborgsstad/pressreleases/ny-metod-maeter-klimatavtryck-foer-goeteborg-stads-inkoep-3185364.
Footnotes
- ^ https://www.upphandlingsmyndigheten.se/om-hallbar-upphandling/miljomassigt-hallbar-upphandling/analysera-inkopen-med-miljospendanalys/
- ^ https://www.exiobase.eu/
- ^ https://simapro.com/
- ^ https://www.upphandlingsmyndigheten.se/om-hallbar-upphandling/miljomassigt-hallbar-upphandling/analysera-inkopen-med-miljospendanalys/de-offentliga-inkopens-klimat--och-miljopaverkan/
- ^ https://www.upphandlingsmyndigheten.se/om-hallbar-upphandling/miljomassigt-hallbar-upphandling/analysera-inkopen-med-miljospendanalys/verktyg-for-miljospendanalys-av-enskilda-organisationer/
- ^ https://www.mynewsdesk.com/se/goteborgsstad/pressreleases/ny-metod-maeter-klimatavtryck-foer-goeteborg-stads-inkoep-3185364
5.3.5 Nordic Swan eco-label requirements
Product-group-specific criteria sets of the Nordic Swan eco-label include requirements that have relevance for the greenhouse gas emissions of products and services. The requirements can be divided into three categories, reflecting how directly they affect the GHG emissions and how precise information they can give about the GHG emissions. First, there are requirements for measuring the GHG emissions of certain phases of a life cycle (production of pulp and further production of paper) or the whole (or major phases of) life cycle (buildings) (type A). Second, there are requirements for the type and used amount of energy (in the production and/or use phase of many products and services), that will evidently lead to a lower carbon footprint than the prevailing typical energy use (type B). Third, there are requirements like the use of renewable materials, recycled materials, and eco-labelled products in services, that will evidently lead to a lower carbon footprint than the typical products and services in the market (type C).
An analysis made by the Nordic Ecolabel (Tanskanen & Bergbom 2021) showed that the product-group-specific criteria sets included the types of criteria in the following way:
- A-type, product-groups 16 and service-groups 4 criteria sets
- B-type, product-groups 25 and service-groups 9 criteria sets
- C-type, product-groups 43 and service-groups 8 criteria sets.
The total number of criteria sets were 45 for products and 10 for services.
However, when the CA asks for the carbon footprint of the product, it is only the A-type that can directly give some answers, and the Swan-label requires the value of the emissions only for the product group. But in practice also the B-type and C-type can offer beneficial information.
5.4 Summary of experiences and challenges relating to measurement techniques
- All participating countries have developed calculations based on calculating climate intensities for different categories based on economic input output models (EIO models). This gives one a general overview of climate performance at the organisational level which gives a basis for priorities but is not granular enough for use in the procurement processes or for monitoring of effects.
- There is a large number of LCAs in the Nordic countries, but unclear as to whether these satisfy the PP needs due to problems with comparability, quality and availability. They have been required and used in the award in a few cases.
- There are different approaches to calculating more precise climate emissions related to specific suppliers and/or products (e.g., PEFs, EPDs, DEFRA conversion factors, vehicle WLTP data). A harmonised approach across all categories would be ideal, but these harmonised environmental footprints seem to be very complicated so that category rules have been developed for different products and services. It remains unclear as to whether the approach of e.g., PEF with PEFCRs is realistic in a short/medium term timescale if one wants to cover many product categories. It may be necessary to fill the gap with ad-hoc category specific alternatives.
- There is a problem with parallel PCRs (for the same product category) that needs to be addressed in order to get a level playing field.
- Tools are now available for relatively automated production of EPDs given that one has access to production/material data[1]https://lca.no/en/epd-generator/.
- The EC has been working actively in this area (PEF) for many years: we have established contact with their EF team[2]Michele Galatola, An De Schryver, Imola Bedo: https://ec.europa.eu/environment/eussd/smgptemanord2022-544.pdfWhats%20in%20it%20for%20me_070319_Context.pdf and there seems to be mutual interest in more dialogue.
Footnotes
- ^ https://lca.no/en/epd-generator/
- ^ Michele Galatola, An De Schryver, Imola Bedo: https://ec.europa.eu/environment/eussd/smgptemanord2022-544.pdfWhats%20in%20it%20for%20me_070319_Context.pdf
6 Data availability, flow and ownership
In this chapter we assume that suppliers have product specific climate data that satisfies the needs of CAs (see chapters 4 and 5) and now consider the challenge of making this data available to CAs in an efficient manner.
Issues that need to be addressed are, for example:
- The location of the climate data (internal to the supplier, public API, in procurement data flow – e.g. Peppol[1]About OpenPeppol - Peppol - Peppol elements).
- The form of the climate data (structured elements, text).
- The rights to the data (what mechanisms handle access rights, if not completely open).
Footnotes
6.1 When and how does the CA need the climate data?
In chapter 4, we identified the following use cases for climate data at the product level:
- Pre-award - in offer evaluation: in this case the climate data must be provided by the supplier as part of the offer.
- Post-award: To follow up contracts and monitor achieved performance. In this case the data could be transmitted either:
- Pre-order: In the catalogues used to do the ordering (allowing the purchaser access to product climate data when selecting items to order) – e.g., to select flights based on climate efficiency
- Post-order: As part of the order confirmation/billing communications
- Contract monitoring: as regular reports (monthly, quarterly, annually) as basis for verifying commitments and/or reporting for climate accounting at the organisational or departmental level.
6.2 What are the possible sources for the climate data?
Only suppliers have the necessary data to calculate climate data. They may do this themselves or use consultants to do the actual calculation.
As mentioned in chapter 5, EPDs are the most common source of climate data for products, often (always) providing a value for GWP (global warming potential). EPDs are relatively structured documents usually published as pdfs and therefore not easily machine readable, but hubs for machine readable EPDs are being established to allow easier access to EPD data, e.g., the EPD portal[1]https://data.environdec.com/, run by EPD International AB[2]https://environdec.com/about-us/epd-international-ab-about-the-company-behind-the-system.
Footnotes
6.3 How can climate data be made available to CAs?
Some possibilities for transfer mechanisms are:
- Ad hoc communication between supplier and CA. This is the most common practise at present and can take the form of Excel sheets sent over at intervals. Challenges arise due to a) formatting problems and b) handling costs due to manual handling.
- Open access: Climate data is publicly available in open databases and can be retrieved using an API with a product id as key.
- Limited network access: API access but with some authorisation element.
- Public sector central solution: An institution in the public sector collects and provides climate data to government organisations
- Integration with procurement data flow: Peppol etc.
- In product catalogues as additional information fields connected with each product entry. Product catalogues can be used both pre-award (as part of the offers) and post-award (as items to select from when ordering). Including climate data in catalogues is now being looked at as part of the Nordic Smart Government and Business project[1]https://nordicsmartgovernment.org/.
- As part of standardised “punch out” systems where CAs place orders directly in the suppliers online “shop”. This is similar to the example above, but the catalogue resides with the supplier rather than in the CA’s procurement system. A typical example is travel agencies.
- As part of the billing information, but this approach has not been recommended by the Peppol experts as a) changing the format of billing messages is difficult and b) the climate information would not be available in pre-award and ordering situations. Billing information must include references to other data sources (see above) in order to calculate climate accounts.
Nissinen et al. (2022) outlined databases which would have a commonly used product identifier like barcode and several indicators for the quality of the carbon footprint information, helping to find the footprint assessments that fulfil the requirements of e.g., tender competitions in public procurement.
Footnotes
6.4 EU/Global status
The EU Circular Economy Action Plan (COM(2020) 98) aims at reducing emissions and use of non-renewable resources through more sustainable products. One key measure is the proposed replacement of the eco-design directive 2009/125/EC with regulation COM(2022) 142 ‘establishing a framework for setting eco-design requirements for sustainable products’[1]https://ec.europa.eu/environment/publications/proposal-ecodesign-sustainable-products-regulation_en.
A key measure in the proposed regulation is the introduction (article 8) of digital product passports (DPPs) including a technical infrastructure for managing these.
The annex I[2]https://www.regeringen.se/496fd3/contentassets/8d0bbe73982e4986b48dd556148bb4ad/com-2022-142-annexes-to-the-proposal.pdf specifies relevant product characteristics and includes climate footprint.
An international machine-readable database for EPDs is available (https://data.environdec.com/).
Footnotes
6.5 Status in the Nordic countries
The Nordic Smart Government programme includes two relevant projects:
- Standards for digital business documents[1]Digital business documents | Nordic Smart Government, in particular in relation to procurement. The project leader is Jan Mærøe in DFØ and we are now in a dialog related to inclusion of environmental information in these formats using office tables, paint and gravel as three cases (different product categories that have PCRs).
- Infrastructure for product information[2]https://nordicsmartgovernment.org/product-information-0, where they specifically mention that “SMEs can move from paper based, manual product and service information to a sustainable data driven, automated processes to reduce costs in reporting and accounting and the environmental footprint.”. The project leader is Anna Elverheim in Bolagsverket.
Footnotes
6.5.1 Denmark
SKIs (Central Procurement Body of Denmark) strategy for 2020–2023 includes a goal (#9[1]https://www.ski.dk/media/5trhumti/ski_strategi-2020-2023.pdf page. 8–9.) for the provision of green tools for their contracts (on behalf of the public sector) that provide their users with climate data for the products in their portfolio. Implementation will start with the most relevant contracts.
Footnotes
6.5.2 Finland
6.5.2.1 Transfer of GHG data between central service organisations and CAs
The State Treasury is developing a database for the carbon footprint assessment of state organisations in Finland, so that they could get the relevant footprint information to their sustainability reports from this database. The aim is to use information about travelling directly from The Finnish Government Shared Services Centre for Finance and HR (Palkeet), and about energy use and greenhouse gas emissions of buildings directly from the Senate Properties. (State Treasury of Finland 2022)
6.5.2.2 Requiring carbon footprint information in procurement cases
In Finland there have been procurement cases in which carbon footprint information has been required in tender competitions, see chapter 5.3.2.4. So far they have used the option described above, ‘Ad hoc communication between supplier and CA’, using e.g. pre-determined excel-sheets for delivering the required information.
6.5.2.3 Emission database for construction products
In Finland, the renewed Land Use and Building Act provides for regulations promoting low-carbon construction, such as on the climate assessment of buildings and design based on digital information models. The legislative control of the whole life-cycle carbon footprint of buildings will be in place by 2025. Therefore, a national database was set up to calculate the carbon footprint and carbon handprint of buildings. The database has been compiled by the Finnish Environment Institute SYKE in close cooperation with experts in the construction industry. The client is the Ministry of the Environment.
The database contains the main construction products but does not cover every possible product, i.e., data for individual products is not stored in the database. The database has sought to cover the most important generic products, services, and processes for calculating. Access to the database via the user interface and the use of the information via the interfaces provided is free of charge: https://co2data.fi/
The data in the database has been compiled in collaboration with environmental experts and construction professionals. More than 100 experts and professionals have participated in the creation of the database. The database is based on existing public information and has been compiled from various sources, mainly environmental statements (including RTS EPD, EPD Norge, Environdec, IBU, and other generic data, when necessary, e.g., ÖkobauDat, ICE, VTT, IVL). Based on this, comparisons, selection, and calculation of averages have been made. Industry expert groups from different product categories have been involved. Data on construction, transport, demolition, and waste management are mainly based on Finnish statistics and surveys.
The database also has a Nordic background: the Nordic ministers responsible for the construction industry have agreed to work to harmonize future legislation on low-carbon construction and related development work to facilitate the construction business between the Nordic countries. Finland and Sweden have jointly designed the data structure and user interface and will be the first to publish them. Feedback has been sought from other Nordic countries and information has been provided on the various stages of the work. The objective is a common format at the application developer interface, open information exchange and comparison, and the sharing of best practices.
6.5.3 Norway
Norway has been a driving force behind the Peppol[1]Peppol digitisation of procurements and as such has been an active participant in international standardisation.
The Norwegian Central Procurement Agency (Statens Innkjøpssenter (SIS)) is basing its climate reporting for travel related emissions (incl. hotels, events, etc.) on using the travel agencies as datahubs: hotels, airlines, etc. Currently the travel agencies estimate climate emissions for air travel (based on Defra/ICAO intensities) and report these to CAs and SIS. A new framework agreement is now being negotiated and will include a requirement to collaborate on getting more detailed climate figures from the airlines themselves.
The interest for quantitative procurement analysis seems to be increasing rapidly and specialist companies are establishing themselves. Some of these see climate footprint analysis as an interesting product development area, as long as climate data is available for analysis.
Footnotes
6.5.4 Sweden
In Sweden, the Agency for public procurement have in the environmental spend analysis work (ESA) developed indicators based on GHG-data and other emission factors, for goods that are often procured by the public sector, (se section 5.3.4 above). The categorised indicators are published on the website[1]https://www.upphandlingsmyndigheten.se/om-hallbar-upphandling/miljomassigt-hallbar-upphandling/analysera-inkopen-med-miljospendanalys/ accessible to CAs and for purchasing analysts. The indicators are per SEK, a spend-factor, that can be used to calculate the environmental impact of purchases not per weight, but per spent SEK. These indicators are generic and are to be used in environmental spend analysis. For CAs to be able to make informed choices about specific tenders or specific products, data from producers and suppliers on environmental and/or carbon footprints on their specific products are needed.
To reduce the climate impact from public procurement, the CAs need information and knowledge about the environmental impact of different categories or products before making the call for tenders. Information like in the ESA makes well informed prioritising between different requirements and for different categories possible. Help whit developing criteria to cover products in the categories making most impact is then necessary to implement this knowledge in procurements. The National Agency for public procurement and other initiatives are working to deliver more criteria that addresses climate change.
It is also important to acknowledge that there are other ways to mitigate environmental impact of purchases than by choosing products that have a lower footprint. Working to change processes, routines, and habits in one’s organisation can make a purchase unneeded or change what is needed and thus reduce the footprint. In Sweden, circular procurement is gaining more and more interest as means to reduce the footprint from goods. The National Agency for public procurement was commissioned by the government 2022 to produce support on circular procurement.
One challenge is that even though the CAs use criteria I procurements and choose a supplier that can deliver products and/or services with a lower CO2-e footprint, the actual purchase is sometimes done by someone else in the organisation. That person doesn’t always choose to order the goods and/or service that was procured. This is a challenge both when it comes to the calculations and follow-ups, and when it comes to reducing the climate impact from public procurement. Management of purchasing and ordering activities in combination whit EPD’s or product passport of actual ordered products might be one of the solutions. This is also an area of interest to the National Agency for public procurement.
Footnotes
6.6 What needs to be done?
Of the three thematic areas in this report, this is the one that seems to be most open. Many actors are active, from procurement system operators to the European Commission. Some base themselves on piggybacking data on the procurement data, whilst others are basing themselves on more-or-less open registries. Individual CAs establish ad hoc data transfer mechanisms for each framework agreement.
The breakout session group reported on this creative, but confusing diversity and reported:
- Nordic collaboration was positive, but the international perspective is important
- EPD databases can be a good starting point, PEF could grow to be the default system if the plans presented by the EU Commission will fly.
- Need for better mapping of available schemes and systems.
- Peppol was mentioned as an alternative.
- Unambiguous product identification is important and challenging.
However, the active role that EU is now taking by proposing the digital product passport platform can indicate a strategic direction and way of thinking that we should be aligning on and collaborating with.
The first step here should be more detailed analysis, including in particular the EU/DPP/PEF proposal, and then developing a plan that can use existing data in the short term at the same time as fitting in with EU plans in the medium term.
References
(other than footnotes)
Asplan Viak 2019 – Project report: Climate footprint of public procurement 2008–2017 (Norwegian). https://anskaffelser.no/sites/default/files/2022-06/klimafotavtrykk_for_offentlig_virksomhet.pdf
Berg A, Alhola K, Peltomaa J & Tietari S 2022. Developing together - The Finnish way of promoting sustainable public procurement. Journal of Public Procurement (in print).
COM 2020. Communication from the Commission to the European Parliament, the Council, the European Economic and Social Committee and the Committee of the Regions. A new Circular Economy Action Plan. For a cleaner and more competitive Europe. COM(2020)98 final. https://eur-lex.europa.eu/legal-content/EN/TXT/?uri=CELEX%3A52020DC0098 [Visited 6.5.2022]
COM 2022. Proposal for a regulation of the European parliament and of the council establishing a framework for setting ecodesign requirements for sustainable products and repealing Directive 2009/125/EC. COM(2022)142. https://eur-lex.europa.eu/legal-content/EN/ALL/?uri=COM:2022:142:FIN [Visited 14.6.2022]
City of Helsinki 2022. Using carbon footprint criteria to promote sustainable public procurement. https://hiilineutraalisuomi.fi/en-US/Canemure/Subprojects/Helsinki [Visited 7.6.2022]
EC (European Commission) 2018. EU GPP criteria. http://ec.europa.eu/environment/gpp/eu_gpp_criteria_en.htm [Visited 27.8.2018]
EC (European Commission) 2020. Results and deliverables of the Environmental Footprint pilot phase. https://ec.europa.eu/environment/eussd/smgp/PEFCR_OEFSR_en.htm#final [Visited 2.6.2021]
EPD (EPD International AB) 2021. Product category rules. https://www.environdec.com/product[1]category-rules-pcr/the-pcr [Visited 3.8.2021]
European Commission, Directorate-General for Environment, Hofbauer B, Tisch A, Schreiber H 2021. Study on the implementation of life cycle assessment and environmental footprint methods in the context of public procurement: final report. Publications Office. https://data.europa.eu/doi/10.2779/74025 [Visited 14.6.2022]
Finnish government 2018. Competence Centre to boost sustainable and innovative public procurement. https://valtioneuvosto.fi/en/-/1410877/osaamiskeskus-vauhdittamaan-kestavia-ja-innovatiivisia-julkisia-hankintoja [Visited 14.6.2022]
Finnish Ministry of Finance 2020. Public Procurement Finland -strategy. https://valtioneuvosto.fi/en/-/10623/national-public-procurement-strategy-identifies-concrete-ways-in-which-public-procurement-can-help-achieve-wider-goals-in-society [Visited 14.6.2022]
Galatola M & Pant R 2014. Reply to the editorial ‘Product environmental footprint – breakthrough or breakdown for policy implementation of life cycle assessment?’ written by Prof. Finkbeiner (Int J Life Cycle Assess 19(2):266-271). International Journal of Life Cycle Assessment 19(6): 1356–1360.
Kalimo H, Miettinen M, Pesu J, Alhola K, Nissinen A, Heinonen T, Suikkanen J, Virolainen V-M, Soukka R, Kivistö T, Kasurinen H, Jansson M, Mateo E & Ünekbas S 2021. Carbon and environmental footprint in procurement - legislation and measuring (HILMI). In Finnish, abstract in English. Publications of the Government´s analysis, assessment and research activities 2021:2, Helsinki. https://julkaisut.valtioneuvosto.fi/bitstream/handle/10024/162672/VNTEAS_2021_2.pdf?sequence=1&isAllowed=y [Visited 8.11.2021]
KEINO Competence Centre 2021. Competence Center for Sustainable and Innovative Public Procurement. https://www.hankintakeino.fi/en [Visited 8.11.2021]
Mattinen M & Nissinen A 2012. Carbon Footprint Calculators for Public Procurement of Six Product Groups. In: Proceedings of the 5th International Public Procurement Conference, pp. 1175–1188. [Online]. Available at www.ippa.org/ippc5_proceedings5.html [Visited 7.6.2022]
Nissinen A, Mattinen M & Alhola K 2012. User-driven innovations to decrease climate impacts - Finnish procurement cases. In: Proceedings of 2012 International Public Procurement Conference, pp. 1189–1206. [Online]. Available at www.ippa.org/ippc5_proceedings5.html [Visited 7.6.2022]
Nissinen A & Savolainen H 2019 (eds.). Carbon footprint and raw material requirement of public procurement and household consumption in Finland – Results obtained using the ENVIMAT-model. 66 p. Reports of the Finnish Environment Institute 15en/2019. https://helda.helsinki.fi/bitstream/handle/10138/312377/SYKEre_15en_2019.pdf?sequence=1&isAl%20lowed=y
Nissinen A, Suikkanen J & Salo H 2019. Product Environmental Information and Product Policies. How Product Environmental Footprint (PEF) changes the situation? TemaNord 2019:549, 73 p.
Nissinen A, Seppälä J & Heinonen T 2021. Make carbon footprints available – And it is not just one value. Cleaner Logistics and Supply Chain 3: 100023. https://doi.org/10.1016/j.clscn.2021.100023
Parikka-Alhola K & Nissinen A 2012. Environmental impacts of transport as award criteria in public road construction procurement. International Journal of Construction Management 12: 35–49. https://doi.org/10.1080/15623599.2012.10773189
Stadler K, Wood R, Bulavskaya T, et al. 2021. EXIOBASE 3. Developing a Time Series of Detailed Environmentally Extended Multi-Regional Input-Output Tables. Journal of Industrial Ecology 22(3): 502–515.
State Treasury of Finland 2022. Sustainability reporting within the central government.nt. https://www.valtiokonttori.fi/en/service/responsibility-reporting-within-the-central-government/#general
Suikkanen J & Nissinen A 2020. Product Environmental Footprint (PEF) method. Use for evaluating the climate impacts of public procurement. Reports of the Finnish Environment Institute 15en/2020. https://helda.helsinki.fi/handle/10138/314111
Tanskanen N & Bergbom K 2021. The Nordic Swan ecolabel climate related requirements. Unpublished excel-file. Ecolabelling Finland.
About this publication
Climate Accounting in Public Procurement
Status in the Nordic Countries
Martin Standley, Ari Nissinen, Mette Engelbrechtsen Østerby Carlsen, Maria Cosnier, Jens Johansson, and Joakim Thornèus
ISBN 978-92-893-7363-0 (PDF)
ISBN 978-92-893-7364-7 (ONLINE)
http://dx.doi.org/10.6027/temanord2022-544
TemaNord 2022:544
ISSN 0908-6692
© Nordic Council of Ministers 2022
Cover photo: Anders Vestergaard Jensen / Unsplash
Published: 9/9/2022
Disclaimer
This publication was funded by the Nordic Council of Ministers. However, the content does not necessarily reflect the Nordic Council of Ministers’ views, opinions, attitudes or recommendations.
Rights and permissions
This work is made available under the Creative Commons Attribution 4.0 International license (CC BY 4.0) https://creativecommons.org/licenses/by/4.0.
Translations: If you translate this work, please include the following disclaimer: This translation was not produced by the Nordic Council of Ministers and should not be construed as official. The Nordic Council of Ministers cannot be held responsible for the translation or any errors in it.
Adaptations: If you adapt this work, please include the following disclaimer along with the attribution: This is an adaptation of an original work by the Nordic Council of Ministers. Responsibility for the views and opinions expressed in the adaptation rests solely with its author(s). The views and opinions in this adaptation have not been approved by the Nordic Council of Ministers.
Third-party content: The Nordic Council of Ministers does not necessarily own every single part of this work. The Nordic Council of Ministers cannot, therefore, guarantee that the reuse of third-party content does not infringe the copyright of the third party. If you wish to reuse any third-party content, you bear the risks associated with any such rights violations. You are responsible for determining whether there is a need to obtain permission for the use of third-party content, and if so, for obtaining the relevant permission from the copyright holder. Examples of third-party content may include, but are not limited to, tables, figures or images.
Photo rights (further permission required for reuse):
Any queries regarding rights and licences should be addressed to:
Nordic Council of Ministers/Publication Unit
Ved Stranden 18
DK-1061 Copenhagen
Denmark
pub@norden.org
Nordic co-operation
Nordic co-operation is one of the world’s most extensive forms of regional collaboration, involving Denmark, Finland, Iceland, Norway, Sweden, and the Faroe Islands, Greenland and Åland.
Nordic co-operation has firm traditions in politics, economics and culture and plays an important role in European and international forums. The Nordic community strives for a strong Nordic Region in a strong Europe.
Nordic co-operation promotes regional interests and values in a global world. The values shared by the Nordic countries help make the region one of the most innovative and competitive in the world.
The Nordic Council of Ministers
Nordens Hus
Ved Stranden 18
DK-1061 Copenhagen
pub@norden.org
Read more Nordic publications on www.norden.org/publications