
- Full page image w/ text
- Table of contents
- Executive Summary
- Summary in Swedish
- Acronyms and Initialisms Used
- 1 Introduction
- 1.1 Wood products and climate change mitigation
- 1.2 Carbon sequestration
- 1.3 Use and reuse of wood products and wood waste
- 1.4 The substitution effect
- 1.5 Wood use and other aspects of sustainability
- 1.6 Wood waste in the Nordics
- 1.6.1 Finland
- 1.6.2 Norway
- 1.6.3 Denmark
- 1.6.4 Sweden
- 1.6.5 Iceland
- 1.6.6 Conclusion
- 2 Methodology
- 3 Goal and Scope
- 3.1 Functional unit
- 3.2 System boundaries and scenarios
- 3.3. Impact-assessment categories
- 4 Scenarios and Sub-scenarios Studied
- 4.1 Wood-waste markets
- 4.2 Marginal energy
- 4.3 S1: Particle board
- 4.4 S2: Composite
- 4.5 S3: Insulation
- 4.6 S4: Bioethanol
- 4.7 S5: Biochar
- 4.8 S6: Textile fibre
- 4.9 S7: Incineration
- 4.8 S6: Textile fibre
- 5 The Life Cycle Inventory and Modelling
- 5.1 Wood-waste markets: Transport and sorting
- 5.2 The attributional life cycle inventory
- 5.2.1 S1: Particle board
- 5.2.2 S2: Composite
- 5.2.3 S3: Insulation
- 5.2.4 S4: Bioethanol
- 5.2.5 S5: Biochar
- 5.2.6 S6: Textile fibre
- 5.2.7 S7: Incineration
- 5.3 Consequential LCI
- 5.3.1 Marginal energy
- 5.3.2 Substituting products
- 6 The Life Cycle Impact Assessment and Its Interpretation
- 6.1 Attributional LCIA results
- 6.1.1 Wood-waste markets: Transportation and sorting
- 6.1.2 S1: Particle board
- 6.1.3 S2: Composite
- 6.1.4 S3: Insulation
- 6.1.5 S4: Bioethanol
- 6.1.6 S5: Biochar
- 6.1.7 S6: Textile fibre
- 6.1.8 S7: Incineration
- 6.1.9 Marginal energy
- 6.2 Consequential LCIA results
- 6.2.1 Global warming potential
- 6.2.2 Biogenic global warming potential
- 6.2.3 Acidification
- 6.2.4 Freshwater eutrophication
- 6.2.5 Abiotic depletion
- 6.2.6 Damage to ecosystems
- 6.2.7 Water use
- 6.3 The most important environmental impacts in summary
- 6.4 Sensitivity analyses
- 6.4.1 Sensitivity analysis 1: Additional transportation of wood waste
- 6.4.2 Sensitivity analysis 2: Average vs. residual energy
- 6.4.3 Sensitivity analysis 3: The PEF B factor
- 7 Discussion and Conclusions
- Annex 1: Detailed results
- Annex 2: Critical review of Phase 1
- Annex 3: Response to critical review of Phase 1
- About this publication
MENU
Contents
This publication is also available online in a web-accessible version at https://pub.norden.org/temanord2022-539.
Executive Summary
This report is aimed at increasing understanding of the environmental impacts of alternative scenarios for wood waste’s treatment to produce recycled products and at providing support for informed decision-making on wood-waste treatment options in a form that is applicable and genuinely useful both for the national Nordic authorities and for the wider audience in the public and private sector alike.
The environmental impacts of several scenarios for wood waste’s treatment were studied via life cycle assessment (LCA). The first phase of the work included establishing the scope and boundaries for the LCA work. A preliminary desk study to assess the availability of relevant wood-waste-related statistics and data on different methods of treating wood waste enabled tuning the scope and boundaries, thereby ensuring the LCA study’s production of the indicative results sought as a basis for decision-making. The second phase involved inventory analysis (LCI), impact assessment (LCIA), and interpretation of the results.
The scenarios considered were modelled via both attributional and consequential approaches to LCA. In the former (ALCA), the system boundary begins with the generation of wood waste and includes its transport, industrial sorting, and processing, and it is bounded at the end by various treatment methods’ production of the system outputs: the recycled products examined here. Use of those products and the end-of-life treatment after the second lifecycle lay outside the system boundaries. The ALCA covered the following recycled products: particle board, composite, insulation, bioethanol, biochar, and textile fibre. Incineration of the wood waste with energy recovery was studied as a reference scenario. The system boundaries for the consequential life cycle assessment (CLCA), in turn, included the same processes, but it expanded the consideration to address substitution too: both the products that would be substituted in consequence of the manufacture from wood waste and the marginal energy, displacing the energy production otherwise handled via incineration of wood waste. Natural gas and wood-based biomass were the sources of marginal heat and electricity in the scenarios considered. The methods employed the standards ISO 14040 and 14044 as applicable, while the study overall did not follow the procedure set forth in those standards. Generic data from the ecoinvent database was used in combination with other literature, for filling in the gaps in data and enabling the required assumptions.
The ALCA results indicate that producing insulation from wood waste appears to be a good alternative to incineration, whereas incineration outperforms the production of all the other recycled products in almost all impact categories studied. When the substituting products and marginal energy are taken into account in the CLCA, other recycled products too seem to show good environmental performance relative to incineration. The results from CLCA scenarios suggest that, in addition to insulation, the production of textile fibre from wood waste is a solid alternative to producing viscose and cotton. Also, wood‑waste‑based composite outperforms composite from virgin wood in many of the impact categories studied, depending on the marginal-energy source. As for particle board from wood waste, the environmental performance is better in relation to abiotic depletion and ecosystem impacts when compared to plasterboard. For bioethanol and biochar, the substitute production seems to promise better environmental performance than production from wood waste, especially with biomass for marginal energy. In general, the choice for marginal energy has a significant impact on the results, especially in terms of biogenic global warming potential, and if marginal energy with even smaller environmental impacts than biomass was used, other products could well become compelling alternatives.
Summary in Swedish
Studiens målsättning var att öka kunskapen om miljökonsekvenserna av olika scenarier för återvinning av träavfall. Målsättningen var vidare att erbjuda ett kunskapsunderlag för beslutsfattande gällande olika behandlingsalternativ för träavfall i ett format som är användbart för de nationella myndigheterna i Norden och också för bredare målgrupper inom offentlig och privat sektor.
Miljökonsekvenserna av olika behandlingsalternativ för träavfall analyserades med hjälp av en livscykelanalys (LCA). I den första fasen av arbetet fastställdes LCA-studiens omfattning och avgränsningar. En inledande skrivbordsstudie genomfördes för att bedöma tillgången på relevant träavfallsstatistik och data om olika behandlingsmetoder för träavfall. Baserat på skrivbordsstudiens resultat justerades LCA-studiens omfattning och avgränsningar för att säkerställa resultatens användbarhet som vägledning och beslutsunderlag. Studiens andra fas inkluderade en inventeringsanalys (LCI), en konsekvensbedömning (LCIA) och tolkning av resultaten.
De studerade scenarierna modellerades med hjälp av både bokföringsinriktade (ALCA) och förändringsorienterade metoder (CLCA). I ALCA-analysen utgick systemgränsen från genereringen av träavfall och inkluderade transport, industriell sortering och bearbetning av avfallet såväl som olika behandlingsmetoder för att framställa systemets slutprodukter – de studerade återvinningsprodukterna. Produkterna som inkluderades i studien vas spånskiva, komposit, isolering, bioetanol, bioträkol och textilfiber. Som referensscenario studerades förbränning av träavfall för energiåtervinning. Systemgränsen i CLCA-analysen omfattade samma processer som i ALCA. I tillägg utbyggdes systemet med substitution, där man tog hänsyn till de produkter som ersätts av de träavfallsbaserade återvinningsprodukterna samt den marginalenergi som behövs för att ersätta energiåtervinningen som går förlorad då träavfallet inte förbränns. De använda scenarierna för källor till marginalvärme och -el var naturgas och träbaserad biomassa. ISO-standarderna 14040 och 14044 följdes där det var tillämpligt, men studien som helhet genomfördes inte i enlighet med standarderna. Analysen baserades främst på generiska data från ecoinvent-databasen kompletterat med andra litteraturkällor som behövdes för att fylla i dataluckorna för nödvändiga antaganden.
Resultaten av ALCA-analysen tyder på att användningen av träavfall för produktion av isolering är ett gynnsamt alternativ jämfört med förbränning. Miljökonsekvenserna av de övriga återvinningsprodukterna var inom nästan alla analyserade konsekvenskategorier större än vid förbränning av träavfall. När konsekvenserna av de ersatta produkterna samt marginalenergin beaktades, visar även andra återvunna produkter på god miljöprestanda jämfört med förbränning. CLCA-scenarierna indikerar att förutom isolering även tillverkning av textilfiber från träavfall är ett bra alternativ om den ersätter produktionen av viskos och bomull. Komposit gjord av träavfall överträffar komposit gjord av jungfruligt trä i de flesta konsekvenskategorierna, beroende på använd marginalenergi. Spånskivor gjorda av träavfall har bättre miljöprestanda än gipsskivor i förhållande till abiotisk utarmning och ekosystempåverkan. För bioetanol och bioträkol verkar den ersatta produktionen ha bättre miljöprestanda än användningen av träavfall, speciellt om man använder biomassa som marginalenergi. Generellt sett har den använda marginalenergin en betydande inverkan på resultaten, speciellt i relation till global uppvärmningspotential, och om marginalenergi med ännu lägre miljöpåverkan än biomassa användes kunde även andra träavfallsbaserade produkter utgöra attraktiva alternativ.
Acronyms and Initialisms Used
| ALCA | Attributional life cycle assessment |
| BtL | Biomass-to-liquid |
| CAGR | Compound annual growth rate |
| CCA | Chromated copper arsenate |
| CFF | Circular Footprint Formula |
| CH | Switzerland |
| CHP | Combined heat and power |
| CLCA | Consequential life cycle assessment |
| DEPA | Danish Environmental Protection Agency |
| EoL | End of life |
| EPD | Environmental Product Declaration |
| GLO | Global |
| GWP | Global warming potential |
| IPCC | Intergovernmental Panel on Climate Change |
| ISO | International Organization for Standardization |
| LCA | Life cycle assessment |
| LCI | Life cycle inventory |
| LCIA | Life cycle impact assessment |
| NFC | Natural-fibre composites |
| NMVOC | Non-methane volatile organic compound |
| PAH | Polycyclic aromatic hydrocarbon |
| PEF | Product environmental footprint |
| PM10 | Particulate matter |
| RER | Europe |
| RoW | Rest of the world |
| SE | Sweden |
| SSB | Statistics Norway (Statistisk sentralbyrå) |
| TAR | Third assessment report |
| TH | Time horizon |
| TTW | Tank-to-wheel |
| WPC | Wood–plastic composite materials |
| WTT | Well-to-tank |
| WTW | Well-to-wheel |
1 Introduction
The report begins with the necessary introduction to wood products and climate-change mitigation (Section 1.1), carbon sequestration (Section 1.2), use and reuse of wood products and wood waste (Section 1.3), the substitution effect (Section 0), sustainability aspects of wood use and related issues (Section 0), and statistical data on wood waste in the Nordic countries (Section 1.6).
1.1 Wood products and climate change mitigation
Historically, wood was the most important natural resource, as a fuel for cooking, heating, and industry as well as a material for construction, crafts, shipbuilding, etc.[1]Perlin, J. (1989). A Forest Journey: The role of Wood in the Development of Civilization. Harvard University Press, Cambridge. About 50% of the dry weight of wood is carbon[2]Björheden, R. (2019). Det Svenska skogsbrukets klimatpåverkan – upptag och utsläpp av växthusgasen koldioxid. Skogforsk., but if forests are managed sustainably, wood use does not disturb the stability of the climate system. Forests bind CO2 from the atmosphere in the trees and in the soil as they grow, through the process of photosynthesis; then, when the biomass later decomposes (or wood is burned after material use), the captured carbon is released back into the atmosphere. Hence, forests are a significant part of the biospheric carbon cycle. In many cases and in many places over the course of history, however, forests have not been managed sustainably, and local scarcity of wood drove the development of technologies utilising coal.[3]Clow, A. and Clow, NL. (1956). The timber famine and the development of technology. Annals of science, 12(2):85-102. In the last century, large economies have become fossil‑dependent, replacing their wood use with such fossil fuels as coal, oil, and natural gas and with materials such as concrete, aluminium, and plastics.
Today, wood use is subject to intense discussion, foremost for climate reasons and because of the renewable nature of wood. A sustainably managed forest can alleviate the impacts of CO2 emissions to the atmosphere in several ways: 1) through carbon sequestration in the forest biomass and soil, 2) via storage of carbon in long-lived products made of harvested wood, and 3) through the use of wood as a substitute for fossil fuels and energy-intensive materials. These three ways of contributing and their effects are briefly discussed in the sections of the chapter that follow.
Clearly, the temporal variation of carbon emissions makes this constellation of matters difficult to analyse, thereby leading studies with different system boundaries to arrive at any of various conclusions as to the mitigation effects of forests. However, there is consensus that forests and wood products have an important role to play nonetheless, and the discussion homing in on forests’ use for climate-change mitigation is illustrated well by the series of reports from the Intergovernmental Panel on Climate Change (IPCC)[4]See https://www.ipcc.ch/reports/., which record the evolving interest and knowledge related to wood products’ potential role in mitigating climate change. The reports address topics from the general recognition of the potential of wood materials’ use in 1991 to an evaluation of strategies in 1996 wherein substituting wood biomass for fossil-based resources is cited as having greater potential than conservation of existing stocks or storage in forests and wood products. The 2002 IPCC Assessment Report (the TAR, a ‘synthesis report’ on climate change) compiled LCAs and estimates of the global stock of wood products and the substitution impact, while the fourth IPCC Assessment Report, from 2007 (the ‘AR4 Climate Change 2007’ synthesis report), focused on policy measures to encourage sustainable forest management, since the significance of wood products had become so well established.
Potential for conducting solid forestry and utilising wood products is especially great in the Nordic countries. Nearly 30% of the forests in Europe (excluding Russia) are in Finland, Norway, and Sweden, and the Nordic countries together account for approximately 20% of the lumber available in Europe[5]Lundmark, T., Hannerz, M. (2017). Den nordiska skogens klimatnytta. Nordiska ministerrådet.. Furthermore, Nordic industry has the knowledge at its disposal and the means for making a wide range of materials and products from wood‑based materials. The demand for wood, as an increasingly valued resource, is expected to rise, and, though it might be possible to increase forests’ production rates through more intensive management, wood resources remain finite. Therefore, it is necessary that the available wood resources be used wisely and efficiently.
After the products have served their purpose, they should be reused, recycled, or used for energy recovery, in line with the ‘waste hierarchy’. Indeed, the Nordic countries strive for a zero-waste society[6]Neel Jakobson, K. (2019). How do we turn waste to wealth? Nordic Innovation.. Such optimisation of wood-based waste and residues is becoming increasingly important in the pursuit of additional value from wood as a material and for making the so-called cascade chains[7]The term ‘cascade’ in this context refers to increasing the lifetime of a product/resource by recycling it (and avoiding downcycling) in many cycles before end of life. before the wood is burned (to recover feedstock energy) as long as possible. The longer any particular wood fibre is used (or reused) in a cascade, the longer its carbon atoms stay out of the atmosphere. Ultimately, the carbon atoms get released to the atmosphere in any case, and the carbon cycle has been regarded as climate‑neutral, but there has been much discussion lately about the significance of the time at which carbon is sequestered or released. One thing on which there is consensus is that reusing wood residues as opposed to creating virgin products, fossil-based products, or products whose production demands high energy expenditure contributes to efficient resource use.
In the harvesting of wood and in its use to build houses or make other products, wood-based residues arise in several processes, from forestry and harvesting operations to factory processing, creating everything from industrial by-products to demolition wood. The wood residues from wood-related production chains can already be used for several distinct purposes – for example, wooden particle board, insulation, textiles, biofuel of various types, and for producing heat and electricity via incineration. How wood-waste streams are managed at the moment within the Nordic countries is enmeshed with national regulations and the national systems for waste classification. As with all waste, the classification itself brings a certain level of complexity to the reuse possibilities, and currently wood waste is not efficiently circulated back into industry or forest ecosystems[8]Economic Commission for Europe Food and Agriculture Organization. (2021). Forests and the Circular Economy, DRAFT Catalogue of wood waste classifications in the UNECE Region. Retrieved from https://unece.org/sites/default/files/2021-03/ece-tim-efc-wp2-2021-inf-5.pdf.; for the most part, it is incinerated for energy purposes and the use of wood waste for purposes other than incineration could probably increase. Still, incineration of wood waste represents an important source of renewable fuel, and the entire system should be optimised to put the wood waste to the purposes that reap the most from the resources and give the largest climate benefits. More knowledge is needed of the diverse benefits of various treatment methods and the effects of replacing other products/systems with use of wood waste. Creating that knowledge is the purpose behind the work described in this report.
Footnotes
- ^ Perlin, J. (1989). A Forest Journey: The role of Wood in the Development of Civilization. Harvard University Press, Cambridge.
- ^ Björheden, R. (2019). Det Svenska skogsbrukets klimatpåverkan – upptag och utsläpp av växthusgasen koldioxid. Skogforsk.
- ^ Clow, A. and Clow, NL. (1956). The timber famine and the development of technology. Annals of science, 12(2):85-102.
- ^ See https://www.ipcc.ch/reports/.
- ^ Lundmark, T., Hannerz, M. (2017). Den nordiska skogens klimatnytta. Nordiska ministerrådet.
- ^ Neel Jakobson, K. (2019). How do we turn waste to wealth? Nordic Innovation.
- ^ The term ‘cascade’ in this context refers to increasing the lifetime of a product/resource by recycling it (and avoiding downcycling) in many cycles before end of life.
- ^ Economic Commission for Europe Food and Agriculture Organization. (2021). Forests and the Circular Economy, DRAFT Catalogue of wood waste classifications in the UNECE Region. Retrieved from https://unece.org/sites/default/files/2021-03/ece-tim-efc-wp2-2021-inf-5.pdf.
1.2 Carbon sequestration
Carbon sequestration is the process of capturing and storing atmospheric carbon dioxide. Forests can be viewed as carbon sinks, able to lock up large amounts of carbon. However, carbon’s sequestration in forest biomass can reduce net CO2 emissions only as long as the forests’ carbon stock is increasing. The capacity of forests to store carbon is limited, as they eventually reach equilibrium when the amount of carbon taken up by new growth is balanced by what is released by respiration of living trees and decay of dead ones. Furthermore, the carbon in forests can be released to the atmosphere by fire, storms, disease, etc. Therefore, relying only on biological carbon sequestration is not a long-term option for mitigating the carbon emissions from use of fossil fuels.
In addition, life cycle analyses of individual forest stands cast doubt on the validity of considering forests ‘climate-neutral’. These suggest that intensive wood use will result in a decrease of forests’ stock and, thereby, net reduction in the carbon captured in forests.[1]Cherubini, F., Peters, G.P., Berntsen, T., StrØMman, A.H., Hertwich, E. (2011). CO2 emissions from biomass combustion for bioenergy: Atmospheric decay and contribution to global warming. Glob Change Biol. Bioenergy 2011, 3, 413–426., [2]Kirschbaum, M.F. (2003). Can trees buy time? An assessment of the role of vegetation sinks as part of the global carbon cycle. Clim. Change 2003, 58, 47–71., [3]Manomet Center for Conservation Sciences. (2010). Massachusetts Biomass Sustainability and Carbon Policy Study: Report to the Commonwealth of Massachusetts Department of Energy Resources; Manomet Center for Conservation Sciences: Brunswick, ME, USA, p. 182. Available online: http://www.mass.gov/eea/docs/doer/renewables/biomass/manomet-biomass-report-full-hirez.pdf (accessed on 8 April 2022). In contrast, however, Poudel et al.[4]Poudel, B.C., Sathre, R., Bergh, J., Gustavsson, L., Lundström, A., Hyvönen, R. (2012). Potential effects of intensive forestry on biomass production and total carbon balance in north-central Sweden. Environ. Sci. Policy, 15, 106–124. showed both short- and long-term carbon-balance benefits due to forestry practices aimed at increasing forest growth at landscape level. The contrast in views on the climate-change mitigation effects of forestry and the related use of forest-based products seems to stem from differences in the system boundaries researchers choose, with temporal and spatial scales varying vastly between analyses.
Temporal scale is especially relevant in that one key source of disagreement over the most efficient climate mitigation strategy is how to treat the trade-off between short- and long-term effects. Tree growth stagnates after about 60–90 years, so in the medium-term time frame (60–90 years, depending on the rotation period) net growth is optimised by using the forest such that new trees can start strong growth again and take up CO2 from the atmosphere. Since the harvested wood can also be used for substitution, to replace fossil fuels, and since substitution effect is repeatable in every rotation period (see Section 0), forestry and harvesting should yield a net climate benefit in the long term.
Still, the vegetation’s carbon stock in the forest is reduced after harvesting, and the total sequestration then depends on the length of the cascade chains of the wood products. On a time horizon of less than 60 years, the carbon stock in the soil too will decrease after clearcutting, especially in cases of fertile soil[5]Stendahl, J. (2017). Skogsmarkens kolförråd. I: Anon., 2017. SKOGSDATA 2017, Tema: Skogsmarkens kolförråd, Sveriges officiella statistik, Institutionen för skoglig resurshushållning, SLU, Umeå 2017.. This reduction is due to the low amount of litter in a young forest.[6]Stendahl, J. (2017). Skogsmarkens kolförråd. I: Anon., 2017. SKOGSDATA 2017, Tema: Skogsmarkens kolförråd, Sveriges officiella statistik, Institutionen för skoglig resurshushållning, SLU, Umeå 2017. Once a new forest has had a little time to grow, 20–30 years by some accounts,[7]Poudel, B.C., Sathre, R., Bergh, J., Gustavsson, L., Lundström, A., Hyvönen, R. (2012). Potential effects of intensive forestry on biomass production and total carbon balance in north-central Sweden. Environ. Sci. Policy, 15, 106–124. the carbon stock in the ground should have been restored, it is believed. Swedish researchers report an approximation of 7 kg of carbon per year getting sequestered per hectare of Swedish forest soil.[8]Stendahl, J. (2017). Skogsmarkens kolförråd. I: Anon., 2017. SKOGSDATA 2017, Tema: Skogsmarkens kolförråd, Sveriges officiella statistik, Institutionen för skoglig resurshushållning, SLU, Umeå 2017. The estimated sequestration in the vegetation of a growing typical Nordic forest is 4 tonnes of CO2/ha per year.[9]Lundmark, T., Hannerz, M. (2017). Den nordiska skogens klimatnytta. Nordiska ministerrådet.
Hence, in the shorter term, less than 50–80 years,[10]Lundmark, T. et al. (2014). Potential roles of Swedish forestry in the context of climate change mitigation. Forests 5.4: 557-578. reducing the harvesting and letting the forests grow more might benefit the climate, but the effect is highly dependent on what kinds of products we use in place of wood products. Also, it does not hold at forest-stand level if preserving that stand leads to trees somewhere else being cut down[11]Lundmark, T. et al. (2014). Potential roles of Swedish forestry in the context of climate change mitigation. Forests 5.4: 557-578.: from a system perspective, nothing has changed.
In the long run, the climate-change mitigation of Nordic forests is stronger when they are used, especially since Nordic forests are growing more rapidly than they are harvested, whereby the carbon sink increases in tandem with the substitution effect (see Section 0)[12]Braun, M. et al. (2016). A holistic assessment of greenhouse gas dynamics from forests to the effects of wood products use in Austria. Carbon Management 7.5–6: 271–283.. This is the case already today where both a substitution effect from harvesting/thinnings and net growth (increased sequestration) occur. The sum of carbon that gets sequestered (net growth) and what is being used constitutes the total climate benefit. The total climate benefit increases over time, as can be seen from Figure 1, and for Sweden, Norway, and Finland together it is almost twice as large as 50 years ago, on account of the forests’ growth. In Sweden and Finland, the greatest climate benefit arises from substitution while in Norway it is due to increased sequestration in biomass (trees and soil).[13]Lundmark, T., Hannerz, M. (2017). Den nordiska skogens klimatnytta. Nordiska ministerrådet.
Footnotes
- ^ Cherubini, F., Peters, G.P., Berntsen, T., StrØMman, A.H., Hertwich, E. (2011). CO2 emissions from biomass combustion for bioenergy: Atmospheric decay and contribution to global warming. Glob Change Biol. Bioenergy 2011, 3, 413–426.
- ^ Kirschbaum, M.F. (2003). Can trees buy time? An assessment of the role of vegetation sinks as part of the global carbon cycle. Clim. Change 2003, 58, 47–71.
- ^ Manomet Center for Conservation Sciences. (2010). Massachusetts Biomass Sustainability and Carbon Policy Study: Report to the Commonwealth of Massachusetts Department of Energy Resources; Manomet Center for Conservation Sciences: Brunswick, ME, USA, p. 182. Available online: http://www.mass.gov/eea/docs/doer/renewables/biomass/manomet-biomass-report-full-hirez.pdf (accessed on 8 April 2022).
- ^ Poudel, B.C., Sathre, R., Bergh, J., Gustavsson, L., Lundström, A., Hyvönen, R. (2012). Potential effects of intensive forestry on biomass production and total carbon balance in north-central Sweden. Environ. Sci. Policy, 15, 106–124.
- ^ Stendahl, J. (2017). Skogsmarkens kolförråd. I: Anon., 2017. SKOGSDATA 2017, Tema: Skogsmarkens kolförråd, Sveriges officiella statistik, Institutionen för skoglig resurshushållning, SLU, Umeå 2017.
- ^ Stendahl, J. (2017). Skogsmarkens kolförråd. I: Anon., 2017. SKOGSDATA 2017, Tema: Skogsmarkens kolförråd, Sveriges officiella statistik, Institutionen för skoglig resurshushållning, SLU, Umeå 2017.
- ^ Poudel, B.C., Sathre, R., Bergh, J., Gustavsson, L., Lundström, A., Hyvönen, R. (2012). Potential effects of intensive forestry on biomass production and total carbon balance in north-central Sweden. Environ. Sci. Policy, 15, 106–124.
- ^ Stendahl, J. (2017). Skogsmarkens kolförråd. I: Anon., 2017. SKOGSDATA 2017, Tema: Skogsmarkens kolförråd, Sveriges officiella statistik, Institutionen för skoglig resurshushållning, SLU, Umeå 2017.
- ^ Lundmark, T., Hannerz, M. (2017). Den nordiska skogens klimatnytta. Nordiska ministerrådet.
- ^ Lundmark, T. et al. (2014). Potential roles of Swedish forestry in the context of climate change mitigation. Forests 5.4: 557-578.
- ^ Lundmark, T. et al. (2014). Potential roles of Swedish forestry in the context of climate change mitigation. Forests 5.4: 557-578.
- ^ Braun, M. et al. (2016). A holistic assessment of greenhouse gas dynamics from forests to the effects of wood products use in Austria. Carbon Management 7.5–6: 271–283.
- ^ Lundmark, T., Hannerz, M. (2017). Den nordiska skogens klimatnytta. Nordiska ministerrådet.


Figure 1. The climate benefit of increased wood stock (sequestration in trees and soil) and substitution over the past 55 years in Finland, Sweden, and Norway, in millions of tonnes of CO2[1]Lundmark, T., Hannerz, M. (2017). Den nordiska skogens klimatnytta. Nordiska ministerrådet. The climate benefit of greater sequestration in the forest (more growth than cutting) is shown in blue, and yellow denotes the climate benefit from substitution effects.
Footnotes
- ^ Lundmark, T., Hannerz, M. (2017). Den nordiska skogens klimatnytta. Nordiska ministerrådet.
Likewise, analysis of data reported to the UN climate organ UNFCCC showed that in managed boreal forests (typically in the Nordic countries) carbon storage is increasing while that in unmanaged forests (typically in Russia and Canada) it has been quite stable[1]Högberg, P et al. (2021). Sustainable boreal forest management. Report 2021/11 Swedish Forest Agency.. The team believed an important reason to be that the managed forests have a high growth rate, since they are younger, on average. Another reason cited is that there are up to 50 times more forest fires in the unmanaged forests. One factor behind the effective protection against fire in the Nordic countries is the forests’ high economic value since they are managed.
Biogenic CO2 emissions and fossil CO2 emissions (GWP) are hard to disentangle, since there is no chemical difference between them, but their time in the atmosphere does differ (depending on the rotation time of the biomass). Changing the carbon stock changes the atmospheric CO2 level. During periods when the carbon stock increases, there is net annual uptake of CO2. The net uptake stops when the carbon stock stabilises at a higher level. Cherubini et al.[2]Cherubini, F., Bright, R.M., Guest, G., Strømman, A.H. (2015). Climate impact of forest bioenergy: contributions from biogenic CO2 and albedo. Retrieved from: https://www.ieabioenergy.com/wp-content/uploads/2015/02/VIII3-Cherubini-Biogenic-CO2-and-albedo.pdf., [3]https://www.ieabioenergy.com/wp-content/uploads/2020/08/The-use-of-biomass-for-climate-change-mitigation-dispelling-some-misconceptions-August-2020.pdf have analysed the relationship between biogenic and fossil (anthropogenic) CO2 emissions, and they have explained it as a function of rotation time, the lifetime of the product in which CO2 is sequestered, and the timeframe. Table 1 describes the GWP factors for bioenergy (immediate emissions), and
Table 2 presents the GWP100 factor for bio-based products with a certain lifetime. This overview demonstrates that biogenic emissions affect anthropogenic GWP and that there is typically a beneficial effect if the product’s lifetime is longer than 50% of the rotation period of the biomass it came from. The GWP is greater the shorter the timeframe (GWP20 vs GWP100 or GWP500).
Footnotes
- ^ Högberg, P et al. (2021). Sustainable boreal forest management. Report 2021/11 Swedish Forest Agency.
- ^ Cherubini, F., Bright, R.M., Guest, G., Strømman, A.H. (2015). Climate impact of forest bioenergy: contributions from biogenic CO2 and albedo. Retrieved from: https://www.ieabioenergy.com/wp-content/uploads/2015/02/VIII3-Cherubini-Biogenic-CO2-and-albedo.pdf.
- ^ https://www.ieabioenergy.com/wp-content/uploads/2020/08/The-use-of-biomass-for-climate-change-mitigation-dispelling-some-misconceptions-August-2020.pdf
| Rotation | GWP | GWP | GWP |
| (years) | TH=20 | TH=100 | TH=500 |
| 1 | 0.02 | 0.00 | 0.00 |
| 10 | 0.22 | 0.04 | 0.01 |
| 20 | 0.47 | 0.08 | 0.02 |
| 30 | 0.68 | 0.12 | 0.02 |
| 40 | 0.80 | 0.16 | 0.03 |
| 50 | 0.87 | 0.21 | 0.04 |
| 60 | 0.90 | 0.25 | 0.05 |
| 70 | 0.93 | 0.30 | 0.05 |
| 80 | 0.94 | 0.34 | 0.06 |
| 90 | 0.95 | 0.39 | 0.07 |
| 100 | 0.96 | 0.43 | 0.08 |
Table 1. Characterisation factors for biogenic CO2 emissions from bioenergy obtained from regenerative biomass[1]Cherubini, F., Bright, R.M., Guest, G., Strømman, A.H. (2015). Climate impact of forest bioenergy: contributions from biogenic CO2 and albedo. Retrieved from: https://www.ieabioenergy.com/wp-content/uploads/2015/02/VIII3-Cherubini-Biogenic-CO2-and-albedo.pdf.
Footnotes
- ^ Cherubini, F., Bright, R.M., Guest, G., Strømman, A.H. (2015). Climate impact of forest bioenergy: contributions from biogenic CO2 and albedo. Retrieved from: https://www.ieabioenergy.com/wp-content/uploads/2015/02/VIII3-Cherubini-Biogenic-CO2-and-albedo.pdf.
| Rotation | Storage period in the anthroposphere (years) | ||||||||||
| (years) | 0 | 10 | 20 | 30 | 40 | 50 | 60 | 70 | 80 | 90 | 100 |
| 1 | 0.00 | -0.07 | -0,15 | -0,23 | -0,32 | -0,40 | -0,50 | -0,60 | -0,71 | -0,84 | -0,99 |
| 10 | 0.04 | -0.04 | -0,01 | -0,20 | -0,28 | -0,37 | -0,46 | -0,57 | -0,68 | -0,80 | -0,96 |
| 20 | 0.08 | 0.00 | -0,08 | -0,16 | -0,24 | -0,33 | -0,42 | -0,53 | -0,64 | -0,76 | -0,92 |
| 30 | 0.12 | 0.04 | -0,04 | -0,12 | -0,20 | -0,29 | -0,38 | -0,48 | -0,60 | -0,72 | -0,88 |
| 40 | 0.16 | 0.09 | 0,01 | -0,08 | -0,16 | -0,25 | -0,34 | -0,44 | -0,55 | -0,68 | -0,84 |
| 50 | 0.2 | 0.13 | 0,05 | -0,03 | -0,12 | -0,21 | -0,30 | -0,40 | -0,51 | -0,64 | -0,80 |
| 60 | 0.25 | 0.17 | 0,09 | 0,01 | -0,07 | -0,16 | -0,26 | -0,36 | -0,47 | -0,59 | -0,75 |
| 70 | 0.29 | 0.22 | 0,14 | 0,06 | -0,03 | -0,12 | -0,21 | -0,31 | -0,42 | -0,55 | -0,71 |
| 80 | 0.34 | 0.26 | 0,18 | 0,10 | 0,02 | -0,07 | -0,17 | -0,27 | -0,38 | -0,50 | -0,66 |
| 90 | 0.38 | 0.31 | 0,23 | 0,15 | 0,06 | -0,03 | -0,12 | -0,22 | -0,33 | -0,46 | -0,62 |
| 100 | 0.44 | 0.37 | 0,29 | 0,21 | 0,12 | 0,03 | -0,06 | -0,16 | -0,27 | -0,40 | -0,56 |
Table 2. GWP factors for biogenic CO2 emissions tabulated for several rotation–storage-period combinations on a 100-year horizon[1]Cherubini, F., Bright, R.M., Guest, G., Strømman, A.H. (2015). Climate impact of forest bioenergy: contributions from biogenic CO2 and albedo. Retrieved from: https://www.ieabioenergy.com/wp-content/uploads/2015/02/VIII3-Cherubini-Biogenic-CO2-and-albedo.pdf.
Footnotes
- ^ Cherubini, F., Bright, R.M., Guest, G., Strømman, A.H. (2015). Climate impact of forest bioenergy: contributions from biogenic CO2 and albedo. Retrieved from: https://www.ieabioenergy.com/wp-content/uploads/2015/02/VIII3-Cherubini-Biogenic-CO2-and-albedo.pdf.
One important lesson here lies in the opportunity to quantify the GWP effect of a longer‑life product. For instance, with a 10-year longer lifetime (i.e., storage period), one can estimate that the GWP effect of the CO2 emissions at the product’s end of life (EoL), calculated from the total biogenic CO2 sequestered in the product, gets reduced by 7–12%. Note that the effect is not linear and increases with longer lifetimes.
When comparing material recycling with incineration, we face a situation wherein the lifetime of a product that has now become wood waste increases as the estimated lifetime of the new product grows. One can differentiate among several scenarios of wood‑waste treatment accordingly (e.g., scenarios related to incineration or production of biofuel that is used for combustion or scenarios that entail material recycling or biochar production).
The above-mentioned study represents just one view of what this relationship looks like. This method has not been adopted as a general standard or practice for LCA studies. The obvious reason for this situation is that each LCA is unique in goal and scope, and which method for incorporating the carbon sequestration or biogenic emissions into it is the most appropriate entirely depends on the goal and scope. In the case of Environmental Product Declarations (EPDs), for instance, general practice excludes the biogenic storage in the product under study because uptake during biomass growth normally is released at EoL (depending on the EPD scenario for the technique’s module C) and is otherwise accounted for in the method’s module D.
The crucial point is that the method needs to be properly developed as an integral element of the LCA technique. The problem is that such development can be very complex, and one cannot rely only on the studies cited above; a broad-based look at the subject is required. Regrettably, insufficient time has been allocated to this separate method development; therefore, the main presentation of results from even our study does not address the relevant effect.
1.3 Use and reuse of wood products and wood waste
For the reasons discussed above, it is vital to consider wood-based products’ carbon sequestration, particularly the difference in the temporary carbon storage associated with the product’s life cycle. The longer the lifetime of the product, the larger the sequestration effect that may be achieved.
A carbon-sequestration effect could occur should the total stock of wood products increase. Were this to occur, carbon storage in products could contribute to reducing atmospheric CO2 concentrations. For example, replacing concrete buildings slated for demolition with timber buildings rather than new concrete ones should result in a step change in the carbon stock and hence net carbon sequestration relative to the baseline. Eventually, as the stock of wood products stabilises, the rate at which newly harvested wood enters the wood‑products reservoir will come to balance that of used wood’s decomposition or incineration (oxidising) and, hence, of releasing its stored carbon. At that, the storage of carbon in wood products will have no net effect on the atmospheric CO2 concentration. A Swedish Government Committee Review document[1]SOU2020:4, Vägen till en klimatpositiv framtid, Betänkande av Klimatpolitiska vägvalsutredningen. extensively discusses various forest‑management-related mitigation measures intended for increasing the carbon stock and increasing the amount of carbon sequestration per year.
In this context, the preferred approach is to increase products’ and materials’ service life so as to sequester the carbon rapidly, simultaneously reducing the need for virgin material and cutting emissions from waste-handling. The EU’s five-level waste hierarchy expresses an order of preference for application in managing and disposing of waste in EU countries. This waste-management hierarchy describes actions to reduce and manage waste, in priority order. The aim behind the hierarchy, which is usually presented diagrammatically in the form of a pyramid, as in Figure 2, is to extract the maximum practical benefit from products and generate minimal waste quantities[2]See the EU Waste Framework Directive, https://zerowasteeurope.eu/2019/05/a-zero-waste-hierarchy-for-europe/.. Accordingly, it articulates reuse as a high-priority option for waste management, before recycling. Reused wood products should be treated as wood waste only in the long run, becoming input to the various associated treatment processes.
Footnotes
- ^ SOU2020:4, Vägen till en klimatpositiv framtid, Betänkande av Klimatpolitiska vägvalsutredningen.
- ^ See the EU Waste Framework Directive, https://zerowasteeurope.eu/2019/05/a-zero-waste-hierarchy-for-europe/.

Figure 2. The five-level EU waste hierarchy[1]https://ec.europa.eu/environment/topics/waste-and-recycling/waste-framework-directive_en.
While this report focuses on the treatment of wood waste, reuse is preferable under the waste hierarchy as illustrated in Figure 2. Reuse is defined a s giving a product a second life cycle before it becomes waste. Direct reuse – e.g., putting an old steel beam directly into use in a new structure – prevents downcycling of the material and can reduce the need for virgin materials. This is important also with renewable materials because, while they are renewable, they are not infinite. Direct reuse of materials is to be favoured since less energy and additional raw material is needed for the product to function as required: the emissions and other environmental impacts from reuse are less extensive than those with recycling.
Hardwood floors are a good example. They can be reused directly in a new building because of their long service life.[1]https://www.junckers.dk/traegulve/inspiration/projekter/cases-varekort/rockvilla. Researchers are looking into the potential of directly reusing wooden beams and pillars from demolition projects also; for instance, Deák et al. found that 200-year-old wooden beams from a demolition project were still functionally suited to direct reuse.[2]Deák, A., Cionca, M., Timar, M. C., & Porojan, M. (2015). Arguments for reusing old oak wood recovered from demolition. Pro Ligno, 11(3), 38–47.
It is difficult to quantify the advantages of wood-based materials’ direct reuse, however, because of the way reuse and carbon sequestration is handled under EPD methodology. Figure 3 shows an example of the distribution of carbon emissions for 1 m3 of Danish construction wood across various stages in the life cycle (A1–C4) and module D for effects outside the individual product’s system boundaries. Carbon sequestration is accounted for as negative emissions in modules A1–A3, with re-emission when the wood is incinerated at EoL in phase C3.
Modelling of materials’ reuse can omit the production phases from modules A1–A3, since they are connected with the previous life cycle. However, this leads to an increase in the emission figure calculated for a product that contains sequestered carbon, because the second lifecycle is not assigned the benefit of sequestration, only the disadvantage of emissions from EoL incineration. This makes it appear as if reuse of wood products has a larger problematic emission balance than using virgin material, though that is not the case.
Footnotes
- ^ https://www.junckers.dk/traegulve/inspiration/projekter/cases-varekort/rockvilla.
- ^ Deák, A., Cionca, M., Timar, M. C., & Porojan, M. (2015). Arguments for reusing old oak wood recovered from demolition. Pro Ligno, 11(3), 38–47.
Figure 3. An example of GWP distributed over the phases in wood’s life cycle, based on industry EPDs for Danish construction wood[1]EPD no. MD-20003-EN., where A1–A3 constitute production; C3 is waste-processing; C4 is disposal; and D is recovery, reuse, and recycling potential.
Footnotes
- ^ EPD no. MD-20003-EN.
1.4 The substitution effect
There is also the issue of effects beyond the boundaries of the relevant product itself, expressed via module D in Figure 5. If the system boundaries are not wide enough and do not include all the pertinent consequences, the substitution effect from using biomass is not visible. Using biomass instead of other materials can have a substantial effect; however, efforts to quantify that effect must consider which products it replaces.
In a study analysing the effect of using 1 MJ of biomass, the climate-change mitigation effect varied greatly, depending on what the biomass was used for and, accordingly, what product systems it replaced[1]Joelsson, J. M. and L. Gustavsson. (2010). Reduction of CO2 emission and oil dependency with biomass-based polygeneration. Biomass and bioenergy 34(7):967–984.. While there is potential to steer biomass use to the areas wherein the substitution effect is the largest (i.e., to replace those fossil fuels/products with the highest carbon content, such as coal), an approximation based on actual use of biomass products from Nordic forests today puts the substitution effect of 1 ha of forest at 500–800 kg of avoided CO2 per cubic metre of wood[2]Lundmark, T., Hannerz, M. (2017). Den nordiska skogens klimatnytta. Nordiska ministerrådet., and Figure 1 presents the size of the climate benefit from substitution over the last 55 years in Finland, Sweden, and Norway.
1.5 Wood use and other aspects of sustainability
The use of wood products is inherently linked to the issue of land use and the various forestry methods available. Using land for forestry purposes has diverse effects, including repercussions for the biodiversity of flora and fauna, the hydrologic cycle, and the aesthetic and recreation value of the land.[1]Lindeijer, E. (2000). Review of land use impact methodologies. Journal of Cleaner production, 8(4):273–281., [2]Wessman, H, et.al. (2003). Land use in eco balance and LCA of forest Products. Report, Nordic Industrial Fund. These effects have a bearing on both the ecological sustainability of the production processes related to wood and the overall net benefit for society. Therefore, land-use decisions should be rooted in comprehensive evaluation of the land-use options[3]Swan, G. (1998). Evaluation of land-use in Life-cycle assessment. Report 1998:2, Centre for Environmental Assessment of Product and Material Systems, Chalmers University of Technology, Sweden. and the physical availability of forests is not the only limiting factor in this regard. Note that the study described here could not include all possible land-use-related sustainability issues; accordingly, this report does not supply comprehensive guidance.
Footnotes
- ^ Lindeijer, E. (2000). Review of land use impact methodologies. Journal of Cleaner production, 8(4):273–281.
- ^ Wessman, H, et.al. (2003). Land use in eco balance and LCA of forest Products. Report, Nordic Industrial Fund.
- ^ Swan, G. (1998). Evaluation of land-use in Life-cycle assessment. Report 1998:2, Centre for Environmental Assessment of Product and Material Systems, Chalmers University of Technology, Sweden.
1.6 Wood waste in the Nordics
To ensure that the LCA study yielded indicative results of the nature desired as a basis for decisions, a desk study of data availability was conducted early in Phase 1. The purpose for the desk study was to assess the relevant statistics and data available on particular treatment methods/processes for wood waste and adjust the scope, boundaries, and methodology accordingly.
Wood waste exists in relative abundance in the Nordics, where, for example, the proportion of wood waste created in construction is higher than in many other EU/EEA countries.
All EU member states are required to report statistics for their waste generation and treatment twice per year, according to the Waste Statistics Regulation.[1]Regulation (EC) No 2150/2002 of the European Parliament and of the Council of 25 November 2002 on waste statistics (OJ L 332, 9.12.2002, p. 1–36). https://eur-lex.europa.eu/legal-content/en/ALL/?uri=CELEX:32002R2150. However, waste‑categorisation practices and sources of statistical data differ, even among the Nordic countries. For example, Denmark has data for waste received at recycling centres and reporting by businesses that handle waste; Finland’s statistics come from monitoring-based data from industry, sector-specific reports, or models; the statistics in Sweden represent a combination of data from companies and model-derived figures; and Norway’s statistics are based on mandatory reporting by municipalities and industry players to national databases and semi-automated systems. Another complicating factor is that little or no information is available on what is actually counted as ‘wood waste’ for the individual countries’ statistics.
Per Europe-wide waste statistics, non-hazardous wood waste originates mainly from manufacturing, construction, and households; however, large differences between the Nordic countries are apparent, as Table 3 attests. In Finland and Iceland, around 80% of the wood waste comes from manufacturing, while the majority in Sweden, Denmark, and Norway, at roughly 60%, is from construction and household use.
The total amount of wood waste is significantly higher in Finland than in other countries even though the statistical methods were changed there to no longer include sawmill industries’ forest residues or their side streams as of 2013[2]Myller, E. (2015). Testing of Mixed Wood Waste in the Production of Various End-products: Final Report of the Project Working Group. Reports of the Ministry of the Environment 28 / 2015. (in Finnish) (before the change in statistical method, approx. 8,300,000 tonnes of wood waste was generated in Finland annually). The main sources of wood waste from manufacturing activity in Finland are manufacture of wood / wooden products and of paper / paper products. In 2018, these activities together generated 82% of the country’s total wood waste, or 3,500,000 tonnes of waste. The reason for the massive difference in comparison to Nordic countries with similar or even higher forest-industry production volumes (especially Sweden)[3]Nordic Forest Statistics. (2020). Nordic Forest Research (SNS). https://nordicforestresearch.org/wp-content/uploads/2021/03/Nordisk-skogsstatistik.pdf. even after the above‑mentioned change in statistical method, must lie in the combined effect of the differing practices of waste categorisation and the types of data sources (e.g., models vs monitoring).
Footnotes
- ^ Regulation (EC) No 2150/2002 of the European Parliament and of the Council of 25 November 2002 on waste statistics (OJ L 332, 9.12.2002, p. 1–36). https://eur-lex.europa.eu/legal-content/en/ALL/?uri=CELEX:32002R2150.
- ^ Myller, E. (2015). Testing of Mixed Wood Waste in the Production of Various End-products: Final Report of the Project Working Group. Reports of the Ministry of the Environment 28 / 2015. (in Finnish)
- ^ Nordic Forest Statistics. (2020). Nordic Forest Research (SNS). https://nordicforestresearch.org/wp-content/uploads/2021/03/Nordisk-skogsstatistik.pdf.
Table 3. Generation of non-hazardous wood waste in tonnes in the Nordic countries, by activity (2018)[1]Eurostat. (2021). Generation of waste by waste category, hazardousness and NACE Rev. 2 activity. Extracted 22.11.2021. Last updated 26.10.2021. https://ec.europa.eu/eurostat/databrowser/view/env_wasgen/default/table?lang=en.
Footnotes
- ^ Eurostat. (2021). Generation of waste by waste category, hazardousness and NACE Rev. 2 activity. Extracted 22.11.2021. Last updated 26.10.2021. https://ec.europa.eu/eurostat/databrowser/view/env_wasgen/default/table?lang=en.
| Agriculture, forestry, and fishing | Mining and quarrying | Manufactu|ring | Electricity, gas, and steam | Water supply | Construction | Services | Wholesale of waste and scrap | Households | Total | |
| Denmark | 27,359 | 308 | 49,538 | 1,977 | 96,051 | 161,608 | 46,069 | 0 | 188,497 | 571,406 |
| Finland | 0 | 0 | 3,558,848 | 144,164 | 126,629 | 400,187 | 26,659 | 1,411 | 62,734 | 4,320,632 |
| Sweden | 0 | 551 | 318,971 | 871 | 279,922 | 636,691 | 113,441 | 12,075 | 412,870 | 1,775,392 |
| Iceland | 0 | 0 | 22,008 | 0 | 0 | 0 | 0 | 2,174 | 2,989 | 27,171 |
| Norway | 766 | 1,952 | 73,852 | 624 | 4,965 | 244,058 | 168,320 | 4 | 274,929 | 769,470 |
Table 4, below, presents the ways of treating non-hazardous wood waste. In Finland, Sweden, and Norway, over 90% of wood waste is used for energy recovery and less than 10% is recycled. In Denmark, in contrast, only 18% of wood waste goes toward energy recovery while 82% is recycled, with most of the latter being used for chipboard or particle‑board production. The figures for Iceland are 63% entering recycling, 24% going to landfill, and 13% being incinerated without energy recovery.
Table 4. Types of treatment for non-hazardous wood waste in the Nordic countries, in tonnes (2018)[1]Eurostat. (2021). Treatment of waste by waste category, hazardousness and waste management operations. Extracted 22.11.2021. Last updated 01.05.2021. https://ec.europa.eu/eurostat/databrowser/view/env_wastrt/default/table?lang=en.
Footnotes
- ^ Eurostat. (2021). Treatment of waste by waste category, hazardousness and waste management operations. Extracted 22.11.2021. Last updated 01.05.2021. https://ec.europa.eu/eurostat/databrowser/view/env_wastrt/default/table?lang=en.
| Waste treatment | Disposal to landfill (D1, D5, and D12) | Disposal by incineration (D10) | Other disposal (D2–D4 and D6–D7) | Recovery for energy (R1) | Recovery via recycling and backfilling (R2–R11) | |
| Denmark | 373,952 | 525 | 0 | 0 | 67,094 | 306,334 |
| Finland | 3,261,207 | 1,056 | 0 | 0 | 3,135,542 | 124,609 |
| Sweden | 2,138,880 | 719 | 65 | 0 | 2,101,846 | 36,250 |
| Iceland | 27,170 | 6,598 | 3,538 | 0 | 0 | 17,034 |
| Norway | 769,472 | 436 | 180 | 0 | 709,711 | 59,144 |
Table 5 presents the amounts of wooden packaging waste and ways of treating it (the total from the various waste-treatment methods is not equal to the waste generated because the total for the waste generated does not include repaired wooden packaging[1]See the guidance for the compilation and reporting of data on packaging and packaging waste under decision 2005/270/EC (version of 21 May 2021), p. 19: https://ec.europa.eu/eurostat/documents/342366/351811/PPW+-+Guidance+for+the+compilation+and+reporting+of+data+on+packaging+and+packaging+waste.pdf/297d0cda-e5ff-41e5-855b-5d0abe425673?t=1621978014507. and the packaging waste generated can be reported as equal to the amount of packaging entering the market). Per these statistics, Finland, Norway, and Iceland have the highest recovery rates, with energy recovery being the main treatment method in Finland and Iceland. While Sweden and Denmark have lower recovery rates, they use more wooden packaging again as material (via recycling).
Footnotes
- ^ See the guidance for the compilation and reporting of data on packaging and packaging waste under decision 2005/270/EC (version of 21 May 2021), p. 19: https://ec.europa.eu/eurostat/documents/342366/351811/PPW+-+Guidance+for+the+compilation+and+reporting+of+data+on+packaging+and+packaging+waste.pdf/297d0cda-e5ff-41e5-855b-5d0abe425673?t=1621978014507.
| Waste generated | Total energy recovery + recycling | Energy recovery from packaging waste | Recycling | Repair | |
| Denmark | 137,763 | 74,378 | 10,000 | 64,378 | 34,645 |
| Finland | 199,612 | 194,704 | 178,000 | 16,704 | 51,613 |
| Sweden | 242,001 | 22,443 | 11,585 | 10,858 | 87,408 |
| Iceland | 2,170 | 1,670 | 0 | 356 | |
| Norway | 209,242 | 179,768 | 173,246 | 6,522 | 28,744 |
Table 5. Wood-based packaging waste, by treatment method, in the Nordic countries, in tonnes (2019)[1]Eurostat. (2021). Packaging waste by waste management operations. Extracted 3.5.2022. Last updated 25.3.2022. https://ec.europa.eu/eurostat/databrowser/view/env_waspac/default/table?lang=en.
Footnotes
- ^ Eurostat. (2021). Packaging waste by waste management operations. Extracted 3.5.2022. Last updated 25.3.2022. https://ec.europa.eu/eurostat/databrowser/view/env_waspac/default/table?lang=en.
National sources serve as an additional source of statistics for wood waste and its management. The sections below summarise these in brief for Finland, Sweden, Norway, Denmark, and Iceland, in turn. It should be noted that the data shown from national sources are primarily from 2019; accordingly, the values correspondingly differ from the Eurostat figures presented above, which are from 2018.[1]Eurostat statistics equivalent to those presented in tables 1 and 2 are not available for 2019.
Footnotes
- ^ Eurostat statistics equivalent to those presented in tables 1 and 2 are not available for 2019.
1.6.1 Finland
In Finland, the official waste statistics are prepared by Statistics Finland. The overall waste volumes are reported by sector and waste type on the basis of data reported by companies with environmental permits.[1]Statistics Finland. (2021). Laatuseloste: Jätetilasto 2019. https://www.stat.fi/til/jate/2019/jate_2019_2021-06-16_laa_001_fi.html. The main sources of wood waste are paper production, production of sawn-timber products, and construction. Finland’s national waste statistics cover wooden packaging waste too, but the official packaging-waste statistics are reported separately and are based on reporting from producer-responsibility organisations.[2]Pirkanmaan ELY-keskus. (2020). Pakkausjätetilastot. Extracted 20.11.2021. https://www.ymparisto.fi/fi-fi/kartat_ja_tilastot/jatetilastot/tuottajavastuun_tilastot/pakkausjatetilastot.
Treatment methods are not reported by sector or by wood-waste type; they are available only for sum-total wood waste, from all sectors. In 2019, the amount of wood waste treated came to 2.7 million tonnes, with 93% of this amount getting incinerated with energy recovery and 7% being recycled at the level of material, while less than 0.5% was either incinerated without energy recovery or landfilled (see Table 6).
Footnotes
- ^ Statistics Finland. (2021). Laatuseloste: Jätetilasto 2019. https://www.stat.fi/til/jate/2019/jate_2019_2021-06-16_laa_001_fi.html.
- ^ Pirkanmaan ELY-keskus. (2020). Pakkausjätetilastot. Extracted 20.11.2021. https://www.ymparisto.fi/fi-fi/kartat_ja_tilastot/jatetilastot/tuottajavastuun_tilastot/pakkausjatetilastot.
| Total | Energy recovery | Incineration without energy recovery | Material recovery | Landfilling and other disposal | |
| Tonnes | 2,722,000 | 2,535,000 | 3,000 | 181,000 | 3,000 |
| Percentage | 93% | 0.1% | 7% | 0.1% |
Table 6. Treatment of wood-based waste in Finland, in tonnes (2019)[1]Statistics Finland. (2019). Jätetilasto [verkkojulkaisu]. ISSN=1798–3339. 2019, Liitetaulukko 2. Jätteiden käsittely 2019, 1 000 tonnia. Extracted 20.11.2021. http://www.stat.fi/til/jate/2019/jate_2019_2021-06-16_tau_002_fi.html.
Footnotes
- ^ Statistics Finland. (2019). Jätetilasto [verkkojulkaisu]. ISSN=1798–3339. 2019, Liitetaulukko 2. Jätteiden käsittely 2019, 1 000 tonnia. Extracted 20.11.2021. http://www.stat.fi/til/jate/2019/jate_2019_2021-06-16_tau_002_fi.html.
According to the extended producer-responsibility statistics, shown in Table 7, 250,686 tonnes of wooden packaging waste was generated in Finland in 2019, with 98% of wooden packaging waste being recovered, 27% recycled as material, and 71% recovered as energy.
| Waste generated | Total energy recovery + recycling | Energy recovery from packaging waste | Recycling | Reuse* | |
| Finland | 250,686 | 246,317 | 177,946 | 68,371 | 378,866 |
| * Reuse: When the packaging is first placed on the market, it is included in the amount of waste generated. After that, each reuse iteration is calculated and reported as reuse. | |||||
Table 7. Wood-based packaging waste in Finland, in tonnes (2019)[1]Pirkanmaan ELY-keskus. (2020). Pakkausjätetilastot. Extracted 20.11.2021. https://www.ymparisto.fi/fi-fi/kartat_ja_tilastot/jatetilastot/tuottajavastuun_tilastot/pakkausjatetilastot.
Footnotes
- ^ Pirkanmaan ELY-keskus. (2020). Pakkausjätetilastot. Extracted 20.11.2021. https://www.ymparisto.fi/fi-fi/kartat_ja_tilastot/jatetilastot/tuottajavastuun_tilastot/pakkausjatetilastot.
1.6.2 Norway
In Norway, it is the body Statistics Norway (SSB) that is responsible for the compilation of all waste statistics. Most data are collected by means of automated registration in the various sectors for which responsibility for collecting and compiling the raw data is assigned to the individual industry actors and municipalities. For the construction sector, it is mandatory to report waste generation from all construction activities of a certain scale (sites larger than 300 m2 for new construction and larger than 100 m2 for demolition) to the relevant SSB register. The data presented here for waste from industry are based on survey forms filled in by a representative selection of about 1,600 companies (most recently in 2015). These questionnaire-based figures are complemented by statistics from waste-data reporting to the Norwegian Environment Agency. For sectors not covered well by the latter reporting, we have applied extrapolation based on company revenue. Finally, waste data for the service sector have been obtained from private waste-collection companies. A general law on statistics obliges the various actors to report and handle the data in accordance with specific standards/methods. Table 8 presents the waste-generation statistics in detail.
| Waste-generation source | Paper and cardboard | Garden and park waste | Wood waste | Total |
| Industry | 98 | 0 | 124 | 222 |
| Agriculture and fishing | 5 | 8 | 1 | 14 |
| Private households | 232 | 161 | 291 | 684 |
| Service business | 371 | 16 | 137 | 524 |
| Water- and waste related activities | 0 | 0 | 5 | 5 |
| Mining and quarrying | 1 | 0 | 2 | 3 |
| Electricity and heat production | 0 | 0 | 1 | 1 |
| Construction | 22 | 0 | 254 | 276 |
| Unspecified activities | 0 | 1 | 0 | 1 |
| 729 | 186 | 815 | 1,730 |
Table 8. Waste-generation statistics for Norway, in thousands of tonnes (2019)[1]SSB, Avfallsregnskapet table 10514 (2021). Data collected December 2021, for the year 2019. https://www.ssb.no/statbank/table/10514/.
Footnotes
- ^ SSB, Avfallsregnskapet table 10514 (2021). Data collected December 2021, for the year 2019. https://www.ssb.no/statbank/table/10514/.
The treatment methods’ breakdown by waste type is presented in Table 9 (cardboard is included here but was not assessed further in our study).
| Paper and cardboard | Garden and park waste | Wood waste | Total | |
| Other treatment | 2 | 2 | 2 | 6 |
| Biogas production | 0 | 1 | 1 | 2 |
| Filling compound and cover material | 0 | 1 | 0 | 1 |
| Landfill | 0 | 0 | 0 | 0 |
| Incineration | 13 | 5 | 756 | 774 |
| Composting | 0 | 153 | 3 | 156 |
| Recycling of materials | 715 | 25 | 52 | 792 |
| Total | 730 | 187 | 814 | 1,731 |
Table 9. Treatment methods in Norway, by waste type, in thousands of tonnes (2019[1]SSB, Avfallsregnskapet table 10514 (2021). Data collected December 2021, for the year 2019. https://www.ssb.no/statbank/table/10514/., [2]SSB, Avfallsregnskapet table 10513 (2021). Data collected December 2021, for the year 2019. https://www.ssb.no/statbank/table/10513/)
Footnotes
- ^ SSB, Avfallsregnskapet table 10514 (2021). Data collected December 2021, for the year 2019. https://www.ssb.no/statbank/table/10514/.
- ^ SSB, Avfallsregnskapet table 10513 (2021). Data collected December 2021, for the year 2019. https://www.ssb.no/statbank/table/10513/
It should be noted that this dataset does not specify whether the incineration includes energy recovery. In contrast, the more detailed statistics for industry, households, and construction waste indicate that all incineration is with energy recovery[1]SSB Table 09781 (Construction waste), Table 08604 (Industry waste), Table 13136 (Household waste), https://www.ssb.no/statbank/table/09781/, https://www.ssb.no/statbank/table/13136/, https://www.ssb.no/statbank/table/08604/.. The only major wood-waste stream without such specification is the service sector’s. Another dataset, from 2020, states the total incineration amount (1,593,000 tonnes), of which 79% has been subject to energy recovery[2]Per data from the SSB Web site, extracted on 2.5.2022; see https://www.ssb.no/natur-og-miljo/avfall/statistikk/avfallsregnskapet/artikler/avfallsmengdene-redusert-i-2020..
As for the classification of waste, with by-products’ removal from the industry-waste statistics in the 2015 survey, there was a decrease in total industry waste from 2.3 million to 0.9 million tonnes (one can assume most of this difference to be due to the reclassification of by-products).
Footnotes
- ^ SSB Table 09781 (Construction waste), Table 08604 (Industry waste), Table 13136 (Household waste), https://www.ssb.no/statbank/table/09781/, https://www.ssb.no/statbank/table/13136/, https://www.ssb.no/statbank/table/08604/.
- ^ Per data from the SSB Web site, extracted on 2.5.2022; see https://www.ssb.no/natur-og-miljo/avfall/statistikk/avfallsregnskapet/artikler/avfallsmengdene-redusert-i-2020.
1.6.3 Denmark
In Denmark, the official waste statistics are provided by the Danish Environmental Protection Agency (DEPA). Businesses handling waste are required to report its origin, type, amounts, and treatment methods to the national waste database (affaldsdatasystemet).[1]Miljøstyrelsen. Affaldsdata & affaldsdatasystemet. https://mst.dk/affald-jord/affald/affaldsdatasystemet/. Recyclable and non-recyclable wood are reported separately, and the DEPA has published a report documenting both types of wood waste. Non-recyclable wood waste in Denmark consists mainly of such material with wood preservatives as pressure-treated wood or wood treated with CCA (chromated copper arsenate).[2]Miljøstyrelsen (2017). Kortlægning af CCA imprægneret træaffald i Danmark. Retrieved from https://www2.mst.dk/Udgiv/publikationer/2017/05/978-87-93529-97-7.pdf. Recyclable wood is collected from recycling stations and construction-industry actors. The DEPA reporting on recyclable wood waste, in turn, indicates that 395,000 tonnes of recyclable wood waste and 50,000 tonnes of non-recyclable (CCA-impregnated) wood waste were produced in Denmark in 2012[3]Högberg, P et al. (2021). Sustainable boreal forest management. Report 2021/11 Swedish Forest Agency.. The report indicates also that half of the former was incinerated for energy recovery and the other half was recycled for chipboard production in Denmark and northern Germany. In contrast, the CCA-impregnated wood is incinerated, with energy recovery, at special facilities, after which the residuals are landfilled.
Table 10 covers the production of wood waste in Denmark in 2019 per Statistics Denmark data. In that year, 75% of the country’s clean wood waste was used for chipboard production within Denmark.[4]Teknologisk Institut (2019). Materialer i den cirkulære økonomi: træ.
Footnotes
- ^ Miljøstyrelsen. Affaldsdata & affaldsdatasystemet. https://mst.dk/affald-jord/affald/affaldsdatasystemet/.
- ^ Miljøstyrelsen (2017). Kortlægning af CCA imprægneret træaffald i Danmark. Retrieved from https://www2.mst.dk/Udgiv/publikationer/2017/05/978-87-93529-97-7.pdf.
- ^ Högberg, P et al. (2021). Sustainable boreal forest management. Report 2021/11 Swedish Forest Agency.
- ^ Teknologisk Institut (2019). Materialer i den cirkulære økonomi: træ.
1.6.4 Sweden
Under the Swedish Environmental Code, each municipality is responsible for ensuring that household waste within the municipality is transported and either recycled or otherwise disposed of in line with producer responsibility.
Waste of the types covered by the producer-responsibility scheme is monitored by Avfall Sverige, whose reporting includes most wood waste under ‘bulky waste’, which accounted for 1,909,360 tonnes in 2020. The paper packaging collected in 2020 amounted to 190,860 tonnes. From households, 172,990 tonnes of construction material was collected.
Every other year, Statistics Sweden gathers information on distinct waste categories and their treatment methods. The collection and treatment of non-hazardous wood waste in 2018 is characterised in Table 11.[1]Statistiska centralbyrån SCB. Statistikdatabasen. Extracted 6.11.2021. https://www.statistikdatabasen.scb.se/pxweb/sv/ssd/START__MI__MI0305/MI0305T003/.
Footnotes
- ^ Statistiska centralbyrån SCB. Statistikdatabasen. Extracted 6.11.2021. https://www.statistikdatabasen.scb.se/pxweb/sv/ssd/START__MI__MI0305/MI0305T003/.
| Treatment method | Total amount of wood waste treated |
| Incineration with energy recovery | 2,102,000 |
| Incineration without energy recovery | 60 |
| Conventional recovery of materials | 1,270 |
| Biological treatment | 23,800 |
| Pre-treatment and sorting | 219,000 |
| Other recycling | 11,200 |
| Landfill | 720 |
| Total wood waste | 2,358,050 |
Table 11. Non-hazardous wood waste in Sweden, in tonnes (2018)[1]Statistiska centralbyrån SCB. Statistikdatabasen. Extracted 6.11.2021. https://www.statistikdatabasen.scb.se/pxweb/sv/ssd/START__MI__MI0305/MI0305T003/.
Footnotes
- ^ Statistiska centralbyrån SCB. Statistikdatabasen. Extracted 6.11.2021. https://www.statistikdatabasen.scb.se/pxweb/sv/ssd/START__MI__MI0305/MI0305T003/.
1.6.5 Iceland
The Environment Agency of Iceland collects data on the amount, types, and disposal of waste generated in Iceland, from companies, municipalities, and other parties that have an operation licence to treat waste. The data collection is performed yearly via a portal.[1]The Environment Agency of Iceland. (2021). Data portal for waste statistics. https://ust.is/atvinnulif/urgangsmal/gagnagatt-fyrir-urgangstolur/. Waste statistics for wood-based packaging waste and the treatment of wood waste are available through Statistics Iceland.[2]Statistics Iceland (2021). Waste statistics. Extracted 7.12.2021 https://www.statice.is/statistics/environment/material-flow/waste/.
In 2019, non-hazardous wood waste was collected and treated as Table 12 specifies. The total mass of the wood waste handled was 41,454 tonnes, of which 53% was recovered, 37% went to landfill, and 10% was incinerated without energy recovery. In comparison to 2018 totals, the amount of landfilled waste showed an increase of roughly 8,500 tonnes and that of total recovered waste an increase of approx. 5,000 tonnes for 2019. Incineration with energy recovery was not used at all for wood waste.
Footnotes
- ^ The Environment Agency of Iceland. (2021). Data portal for waste statistics. https://ust.is/atvinnulif/urgangsmal/gagnagatt-fyrir-urgangstolur/.
- ^ Statistics Iceland (2021). Waste statistics. Extracted 7.12.2021 https://www.statice.is/statistics/environment/material-flow/waste/.
| Non-hazardous wood waste treatment | Total amount of wood waste treated |
| Recovery-total | 22,221 |
| Recovery-soil recovery | 2,930 |
| Recovery-other | 0 |
| Recovery-incineration with energy recovery | 0 |
| Recovery-backfilling | 326 |
| Recovery-other recycling | 18,965 |
| Disposal-total | 19,234 |
| Disposal-landfill | 15,179 |
| Disposal-incineration without energy recovery | 4,055 |
| Total handled waste | 41,454 |
Table 12. Non-hazardous wood waste treatment in Iceland, in tonnes (2019)[1]Statistics Iceland (2021). Waste handling 2014-2019. Extracted 7.12.2021. Last updated 9.3.2021. http://px.hagstofa.is/pxen/pxweb/en/?rxid=f95925e1-75d6-4fc8-a243-11db96155cc0.
Footnotes
- ^ Statistics Iceland (2021). Waste handling 2014-2019. Extracted 7.12.2021. Last updated 9.3.2021. http://px.hagstofa.is/pxen/pxweb/en/?rxid=f95925e1-75d6-4fc8-a243-11db96155cc0.
Table 13 presents the amounts specific to wooden packaging. Per the statistics, 2,170 tonnes of wooden packaging waste was generated in Iceland in 2019, of which 61% was recovered and 16% was recycled.
| Method of treating wood-based packaging waste | Amount of wood waste treated |
| Recovery, ‘other’ | 1,314 |
| Recycling | 356 |
| Recycling in other member states of the EU | 0 |
| Recycling within this Member State | 356 |
| Recycling outside the EU | 0 |
| Total mass of waste generated | 2,170 |
Table 13. Treatment of wood-based packaging waste in Iceland, in tonnes (2019)[1]Statistics Iceland (2021). Packaging waste 2010-2019. Extracted 7.12.2021. Last updated 27.9.2021. http://px.hagstofa.is/pxen/pxweb/en/?rxid=f95925e1-75d6-4fc8-a243-11db96155cc0.
Footnotes
- ^ Statistics Iceland (2021). Packaging waste 2010-2019. Extracted 7.12.2021. Last updated 27.9.2021. http://px.hagstofa.is/pxen/pxweb/en/?rxid=f95925e1-75d6-4fc8-a243-11db96155cc0.
1.6.6 Conclusion
Overall, the statistical data on wood waste and wood waste treatment is not very reliable and comparable due to different practices in both measuring and categorisation. In addition, detailed statistical data on the volumes of different qualities of wood waste is not available for the Nordic countries. This might be partly because historically it has been deemed unnecessary, as wood waste is mainly incinerated, but also because economically feasible methods for reuse and recycling are still scarce, and thus more detailed data on waste streams and their quality has not yet been needed. The lack of detailed data hinders the comparison and analysis of the possibilities for recycling in and between the different countries, which is an apparent disadvantage also for this study.
2 Methodology
The project was conducted in two phases, using the well-established process for LCA[1]Lee, K.M., Inaba, A. (2004). Life Cycle Assessment Best Practices of ISO 14040 Series. Retrieved from: https://www.apec.org/docs/default-source/Publications/2004/2/Life-Cycle-Assessment-Best-Practices-of-International-Organization-for-Standardization-ISO-14040-Ser/04_cti_scsc_lca_rev.pdf depicted in Figure 4. The LCA process consists of four components:
- Goal definition and scoping: Defining and describing the products, processes, or activities to be studied; identifying the system boundaries and approaches, and choosing the impact categories to be reviewed for the assessment (Phase 1)
- Inventory analysis (LCI): Compiling data for energy and resource use and on emissions to the environment throughout the system (Phase 2)
- Impact assessment (LCIA): Assessing the potential impacts associated with the forms of energy use, resource use, and emissions to the environment identified (Phase 2)
- Interpretation: Evaluating the results of the inventory analysis and impact assessment and the results’ limitations and uncertainties in relation to the objectives for the study (Phase 2)
Footnotes
- ^ Lee, K.M., Inaba, A. (2004). Life Cycle Assessment Best Practices of ISO 14040 Series. Retrieved from: https://www.apec.org/docs/default-source/Publications/2004/2/Life-Cycle-Assessment-Best-Practices-of-International-Organization-for-Standardization-ISO-14040-Ser/04_cti_scsc_lca_rev.pdf

Figure 4. Life Cycle Assessment process[1]Lee, K.M., Inaba, A. (2004). Life Cycle Assessment Best Practices of ISO 14040 Series. Retrieved from: https://www.apec.org/docs/default-source/Publications/2004/2/Life-Cycle-Assessment-Best-Practices-of-International-Organization-for-Standardization-ISO-14040-Ser/04_cti_scsc_lca_rev.pdf and study phases
Footnotes
- ^ Lee, K.M., Inaba, A. (2004). Life Cycle Assessment Best Practices of ISO 14040 Series. Retrieved from: https://www.apec.org/docs/default-source/Publications/2004/2/Life-Cycle-Assessment-Best-Practices-of-International-Organization-for-Standardization-ISO-14040-Ser/04_cti_scsc_lca_rev.pdf
The main objective for Phase 1 was to set the goal, scope, and system boundary for the LCA study. This included deciding which stages of the life cycle should be included and the types and sources of wood waste for analysis, selecting the wood-waste treatment solutions for inclusion, and specifying which materials/products produced through these solutions will (in effect) replace some other materials or products.
Data availability is of key importance for meaningful LCA results. To ensure an LCA design that can focus on optimising the balance between detail and robustness of data while at the same time guaranteeing that the scope and method yield the desired sort of indicative results as a basis for decision-making, desk study of data availability was performed in Phase 1 (again, for purposes of assessing the availability of relevant statistics and data on particular processes for treatment of wood waste and for adjusting the scope and method accordingly). Publicly available literature and other online data sources informed the Phase 1 desk study.
Conducting LCA is an iterative process, as Figure 4 illustrates. The quality and completeness of the data collected in the LCI can be continuously refined as more knowledge is gained, and some changes are likely to occur as the study progresses, changes that may influence other stages in the study. As was foreseen from the study’s outset, the data exhibited shortcomings in terms of both availability and direct comparability of statistical and process data alike.
Accordingly, we did not utilise statistical data on wood-waste types in choosing and prioritising the treatment methods and products for this study during Phase 1. Instead, the selection of methods and products was influenced by the availability of LCI data for the treatment processes in question and the apparent current relevance and market demand for the related recycled products in the Nordics. The objective was to include products with a wide range of processing requirements and uses, from construction products with very little need for processing (e.g., wood chips for insulation) to more value-added products (such as bioethanol and textile fibre) that require several pre-treatment and processing steps for altering the physical and/or chemical structure of the lignocellulosic biomass. The Phase 1 report was critically reviewed by a third party (Annex 2 and 3), but as described below the study’s scope and methodology was further modified in Phase 2 from what was preliminary defined in Phase 1.
Phase 2 included the inventory analysis (i.e., LCI), impact assessment (i.e., LCIA), and interpretation of the results. This phase started with a detailed life cycle inventory examining the inputs and outputs of the life cycle’s various stages. The objective was to gather primary LCI data from all five Nordic countries by using both the literature and statistics but also by interviewing municipal and private operators involved in waste-sorting and treatment. It became apparent, however, that such data were exceedingly difficult to obtain and not consistently available across all treatment methods and all Nordic countries. For example, the municipal sorting operators had not gathered any detailed data revealing the quality of the incoming wood-waste volumes and could not provide process input–output data. Such data might have been available from the private sorting operators, but the impression gained from the interviews was that, for reason of the current increase in interest in wood-waste utilisation and the competitive environment, those operators were reluctant to provide any detailed information. Similar problems were encountered with regard to private treatment-solution operators, and the recent adoption of most of the processes for treating wood waste rendered specific – and even generic – data hard to find.
Because of the paucity of data, it became evident that the study could not provide a reliable foundation for comparing the wood-waste treatment options at national level. Therefore, instead of studying the treatment methods in the setting of each of the five countries, we established a scope of Nordic-level scenarios. In addition, greater focus was placed on the consequential LCA (described in more detail below), wherein multiple scenarios, for several substituting products and marginal-energy options, were studied. This approach enabled more coherent, informed analysis of the results at Nordic level.
In the main, generic data from the ecoinvent database provided the details for the sorting and treatment processes, and, as noted above, we referred to the literature to fill the data gaps and enable the required assumptions. SimaPro software was employed for modelling the inventory data and for assessment in the chosen impact categories (see Section 3.3).
We applied both attributional and consequential approaches for modelling the treatment methods studied. Attributional LCA is used to allocate environmental impacts to a certain product, with the allocation performed through sharing the impacts across the life cycle’s stages. Consequential LCA is used to estimate how changes within a given system affect the environmental impacts.[1]See for example Ekvall 2019. Attributional and Consequential Life Cycle Assessment https://www.intechopen.com/chapters/69212 With CLCA (in contrast against ALCA), all the effects that are expected as consequences of using or changing the system studied were evaluated. When compared to other approaches applied for LCA, the consequential approach yields more detailed information on the environmental impacts that are expected to bring change to surrounding systems and society in the course of producing, consuming, and disposing of the product. This approach proves especially useful for supporting decision-making when one is comparing product systems. The rationale behind it is that the choice of products should be based on the consequences of the choice, not the product’s historical impact. Also, if ALCA pinpoints environmental-impact hotspots, a consequential assessment is still necessary, to assess the effects of possible improvements and to explain the likely consequences of future actions.
The study was carried out to compare several wood-waste treatment scenarios by relying on only generic data sources and limiting the scope of the ALCA to wood-waste markets (transportation and sorting of wood waste) and the treatment processes considered to the manufacture of recycled products (details are presented below, in Section 3.2). For the attributional LCA work, ISO standards 14040 and 14044 were followed as applicable, though the study was not framed in conformance with said standards.
No international standardised method exists for carrying out consequential LCA. A CLCA framework originally suggested by Weidema[2]Weidema, B. (2003). Market information in life cycle assessment, Danish Environmental Protection Agency Environmental Project, 863(863), p. 147. and adapted by Fauzi[3]Fauzi, R. T. et al. (2021). Life cycle assessment and life cycle costing of multistorey building: Attributional and consequential perspectives, Building and Environment, Vol 197. doi: 10.1016/j.buildenv.2021.107836. (Figure 5) was applied, with some simplifications. The framework articulates the procedure for recognising so-called marginal impacts on the system under study. Firstly, the framework points to determining a time horizon for the study that enables examining differences in product durability. Secondly, one should identify any processes, markets, or by-products that are affected by changes to the system studied. Thirdly, the trend in the given market should be assessed, inclusive of sector forecasts. Also, any constraints in production or supply – such as minimum or maximum limits set, other regulatory or political constraints, or inherent limits to the raw-material supply – should be ascertained. Finally, one should consider the most flexible and competitive technology. Weidema suggests that, in general, the newest technology can be assumed to be the most competitive and the oldest one the least competitive. The study reported upon here applied the CLCA framework to determine the substituting products for all scenarios considered.
Footnotes
- ^ See for example Ekvall 2019. Attributional and Consequential Life Cycle Assessment https://www.intechopen.com/chapters/69212
- ^ Weidema, B. (2003). Market information in life cycle assessment, Danish Environmental Protection Agency Environmental Project, 863(863), p. 147.
- ^ Fauzi, R. T. et al. (2021). Life cycle assessment and life cycle costing of multistorey building: Attributional and consequential perspectives, Building and Environment, Vol 197. doi: 10.1016/j.buildenv.2021.107836.
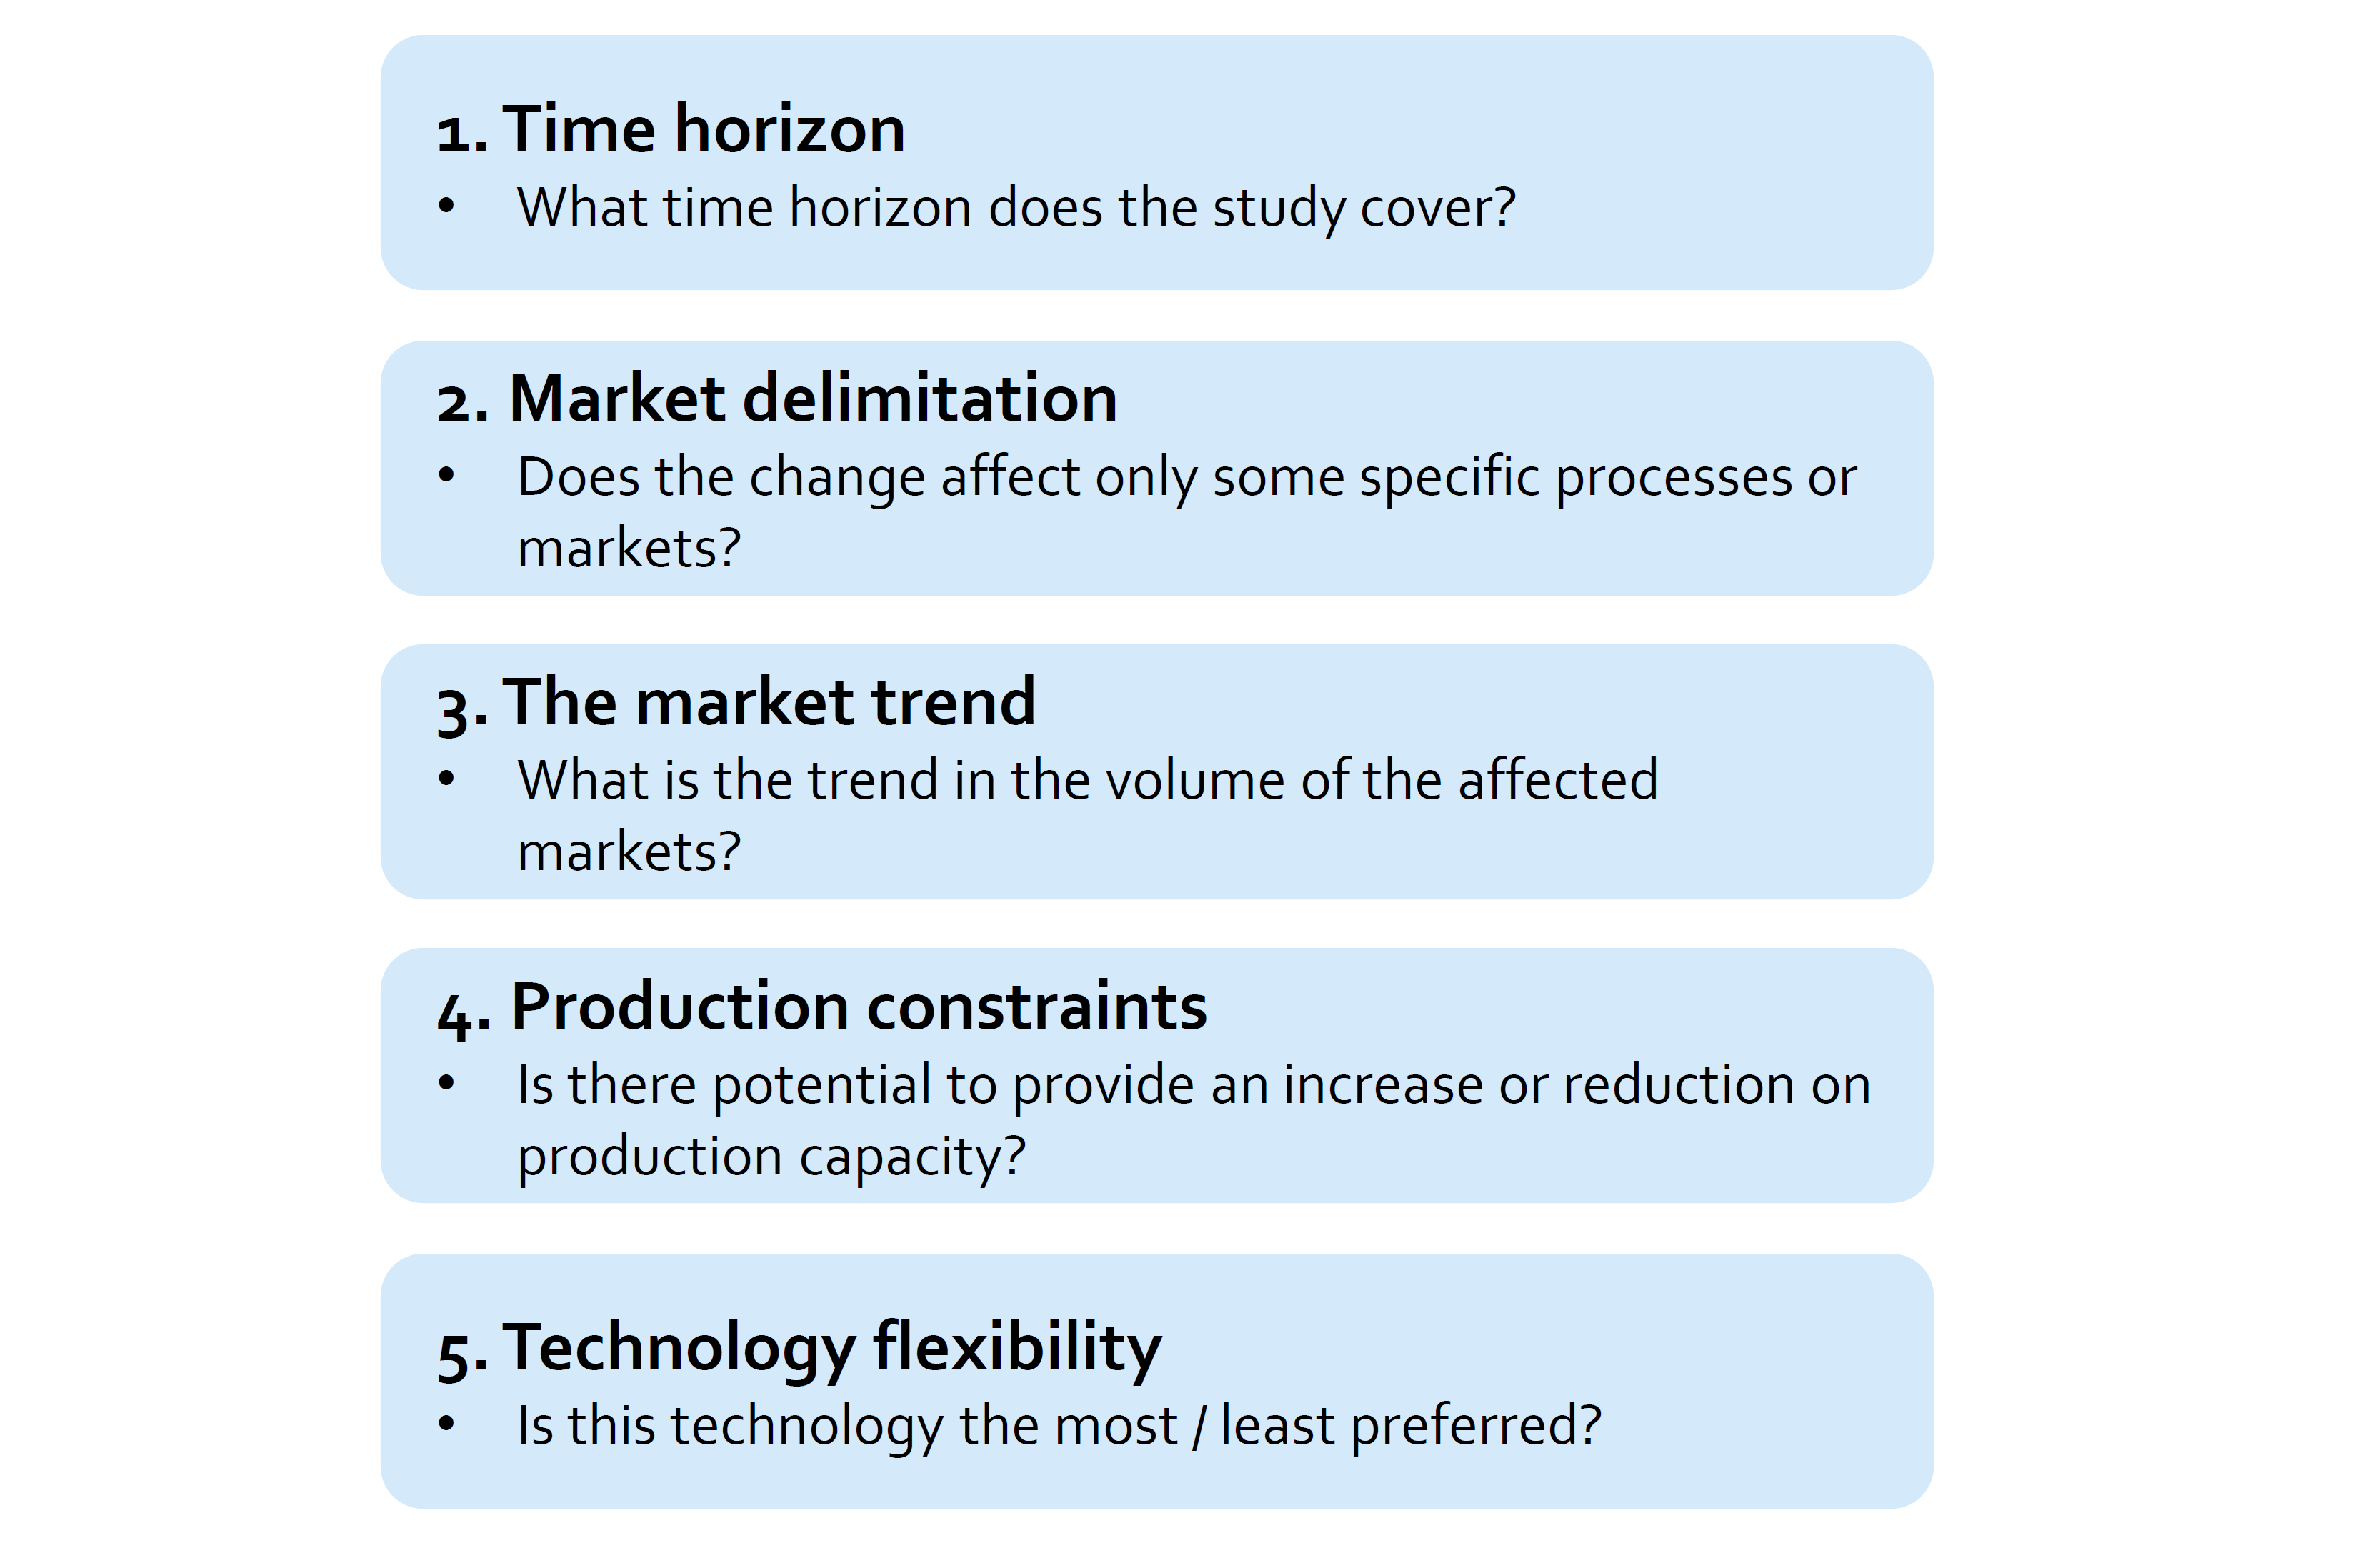
Figure 5. The CLCA framework (figure adapted from the work of Fauzi[1]Fauzi, R. T. et al. (2021). Life cycle assessment and life cycle costing of multistorey building: Attributional and consequential perspectives, Building and Environment, Vol 197. doi: 10.1016/j.buildenv.2021.107836.)
Footnotes
- ^ Fauzi, R. T. et al. (2021). Life cycle assessment and life cycle costing of multistorey building: Attributional and consequential perspectives, Building and Environment, Vol 197. doi: 10.1016/j.buildenv.2021.107836.
The notion of substituting products here refers to products whose production volumes are going to change in response to demand alterations arising from the manufacture of the recycled products made from wood waste. In practice, the products substituted for are those products assumedly to be replaced by these wood waste-based ones in the market.
As noted above, in addition to substituting products, the CLCA scenarios accounted for ‘marginal energy’, the energy most likely to respond to a change in demand – in this case, the energy-production technology that would be used should conditions arise wherein no wood waste is available for incineration. The selection of specific substituting products and of marginal-energy sources for consideration in our CLCA is discussed in greater depth in Chapter 4.
This study was carried out for the Nordic Council of Ministers by Gaia Consulting Ltd and Sweco. The research-team members and the authors of this report are Jatta Aho, Kaisa Järvinen, Pauliina Saari, Magda Horváth, Katri Leino, and Venla Kontiokari for Gaia Consulting Oy; Anna Joelsson, Andreas Asker, Isak Eklöv, and Karin Lindqvist with Sweco Sweden; Christine Collin and Julie Hald, with Sweco Denmark; and Karin Sjöstrand Cochard, with Sweco Norway. The first phase of the study was carried out in October–December 2021 and the second in January–May 2022.
3 Goal and Scope
The scope was aligned with the LCA’s goal of analysing the environmental impacts of alternative scenarios for wood waste’s treatment, to encourage production of recycled products and provide support for informed decisions about the waste’s treatment options in a form that is applicable and truly useful for the national Nordic authorities but also the wider audience in both the public and the private sector. That scope included studying treatment methods for manufacturing the following products from wood waste:
- Particle board
- Composite (wood–plastic)
- Insulation
- Bioethanol
- Biochar
- Textile fibre
As noted above, wood waste’s incineration with energy recovery served as a reference scenario.
Because of the absence of detailed data on the quality of the wood waste and the sparseness of information even on the relevant treatment methods’ quality requirements, the type and quality of the wood-waste input was left unspecified. We assumed that, within the scope of our study, the input wood waste after industrial sorting and processing is of a quality that renders it suitable for further use in producing the products considered here.
The focus from a geographical standpoint was on wood waste in the Nordic countries.
In the scenarios’ modelling via both attributional and consequential approaches, the former followed the cut-off method (also called the recycled-content approach), in which the transport of wood waste to the sorting site marks the beginning of the secondary cycle and the cut-off point is at the end of the activity producing the recycled product, and the CLCA modelling employed system expansion with substitution, considering the marginal impacts from substitution for another product and energy source. More details on the system boundaries for both ALCA and CLCA are presented in Section 3.2.
Further analysis was facilitated through the use of both location-based and market-based emission factors for electricity. In addition, modelling was conducted separately with different allocation factor B[1]Factor B is an allocation factor used in PEF´s Circular Footprint Formula (CFF) to conceptualise sharing of energy-recovery burdens and benefits among connected life cycles. for energy recovery. These analyses are described in more detail in Section 0.
The ecoinvent v 3.8 database was used as the primary source for background inventory data. SimaPro software (version 9.3.0.2) was used for modelling the inventory and calculating the impact assessment results.
Footnotes
- ^ Factor B is an allocation factor used in PEF´s Circular Footprint Formula (CFF) to conceptualise sharing of energy-recovery burdens and benefits among connected life cycles.
3.1 Functional unit
The functional unit selected for our assessment is treatment of one tonne of wood waste in the Nordic countries; that is, the results are calculated per tonne of wood waste delivered for treatment. This enables analysis and comparison of
- The environmental performance of individual treatment methods (via ALCA) in relation to the reference scenario, wood-waste incineration, and
- The consequences of changes in production volume from a broader system perspective (via consequential LCA).
3.2 System boundaries and scenarios
The above-mentioned system boundary, starting with the wood waste generated and including transportation by waste operators, industrial sorting, and processing of the wood waste, encompass six distinct treatment methods that produce the output of the system, the recycled products studied. These are articulated as scenarios 1–6, and the reference scenario (wood-waste incineration with energy recovery) was denoted as Scenario 7. The general delineation of system boundaries is presented in Figure 6.
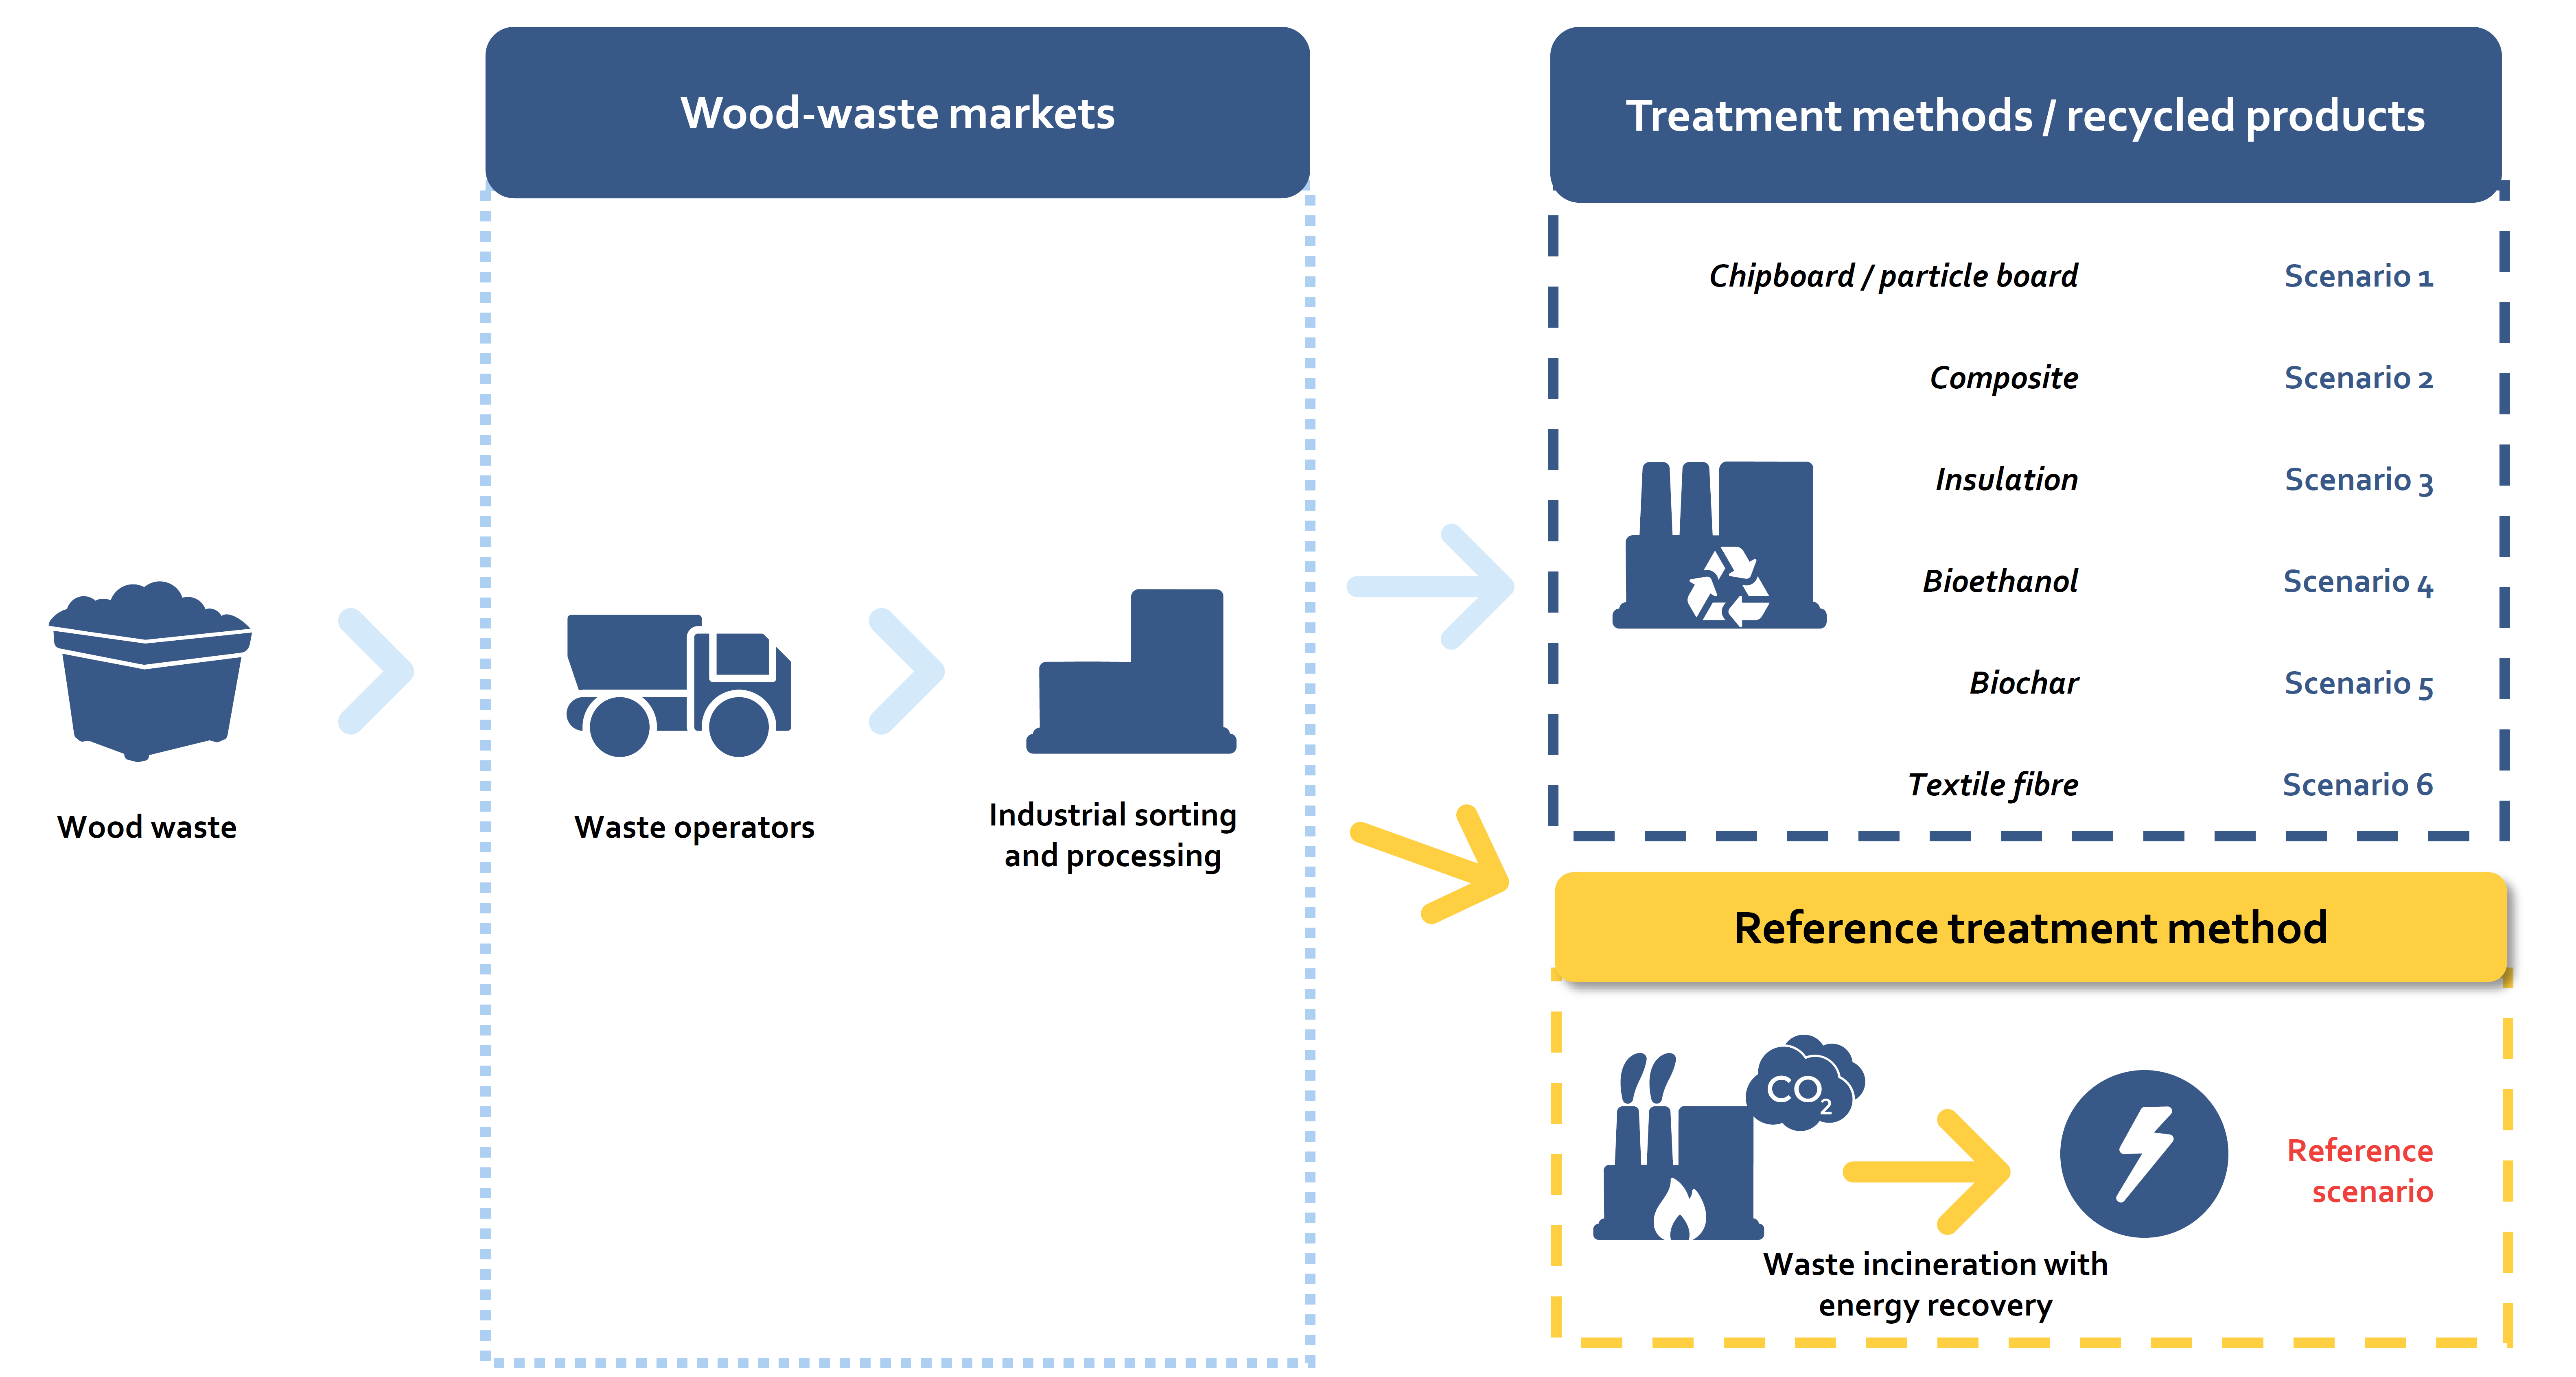
Figure 6. General system boundaries. The system’s process starts with the wood waste generated and includes transportation, industrial sorting and processing of the wood waste, and treatment methods that produce the output of the system: the recycled products under study. Wood-waste incineration with energy recovery was studied as a reference treatment scenario.
The environmental impacts of the wood waste from the previous life cycle phases are excluded from the assessment. It is assumed that the input is waste, not, for instance, residual material from industry, and the entire historical environmental burden is allocated to the first life cycle, the original product. Also, the use and end-of-life phases of the recycled products lie outside the system’s boundaries.
All relevant unit processes and mass/energy flows within the system boundary are included. In contrast, warehousing, capital goods, and infrastructure are excluded from analysis. These typically do not contribute much to overall impacts, and variations between the scenarios considered can be assumed to be particularly insignificant.
System expansion with substitution was applied for the consequential modelling. In this study the consequential analysis was limited to the products that would be replaced in consequence of making the products from wood waste and to the marginal energy displacing the energy production otherwise carried out through wood-waste incineration. Figure 7 depicts the further system boundary for the CLCA comparing between the wood-waste treatment scenarios studied with the substituting scenario. The studied systems include the manufacturing of wood waste-based products and energy production with marginal energy, and the substituting systems include the manufacture of the substituting product and energy production from wood waste’s incineration. Chapter 5 describes the details of the processes within the boundaries of each ALCA and CLCA scenario.

Figure 7. The system boundaries used for CLCA
3.3. Impact-assessment categories
The impact-assessment categories addressed in the study are climate change (fossil), climate change (biogenic), acidification, freshwater eutrophication, and abiotic resource depletion[1]These impact categories were chosen from among the 16 in the EU Product Environmental Footprint (PEF) method, which covers climate change (fossil), climate change (biogenic), ozone depletion, ecotoxicity for aquatic fresh water, toxicity to humans – cancer effects, toxicity to humans – non-cancer effects, particulate matter, ionising radiation – human-health effects, photochemical ozone formation, acidification, eutrophication – terrestrial, eutrophication – freshwater, eutrophication – marine, resource depletion – water, resource depletion – mineral, resource depletion – fossil resources, and land-use transformation.. These were identified as the most relevant categories with regard to assessment of wood-based products; in addition, climate impact, acidification and eutrophication are the most common impact categories reported upon in the relevant LCA literature.[2]See, for example, Mair-Bauernfeind, C., Zimek, M., Lettner, M., Hesser, F., Baumgartner, R. J., Stern, T. (2020). Comparing the incomparable? A review of methodical aspects in the sustainability assessment of wood in vehicles. Retrieved from https://link.springer.com/article/10.1007/s11367-020-01800-1#Tab8. The methods used for each impact category are listed in Table 14.
In addition, water use was considered relevant, especially for the textile-fibre scenario. Thus, to enable comparison, results from the AWARE method are provided for all scenarios. To cover impacts on biodiversity, the results for the end-point indicator for damage to ecosystems (biodiversity) from the ReCiPe method[3]ReCiPe is an LCIA method that creates the possibility of translating the LCI outputs into characterisation factors at midpoint level and at endpoint level. The midpoint indicators focus on individual environmental problems, such as climate change or acidification, while the endpoint ones represent the environmental impact at three higher aggregation levels: 1) effects on human health, 2) biodiversity, and 3) resource scarcity. are reported in addition.
Footnotes
- ^ These impact categories were chosen from among the 16 in the EU Product Environmental Footprint (PEF) method, which covers climate change (fossil), climate change (biogenic), ozone depletion, ecotoxicity for aquatic fresh water, toxicity to humans – cancer effects, toxicity to humans – non-cancer effects, particulate matter, ionising radiation – human-health effects, photochemical ozone formation, acidification, eutrophication – terrestrial, eutrophication – freshwater, eutrophication – marine, resource depletion – water, resource depletion – mineral, resource depletion – fossil resources, and land-use transformation.
- ^ See, for example, Mair-Bauernfeind, C., Zimek, M., Lettner, M., Hesser, F., Baumgartner, R. J., Stern, T. (2020). Comparing the incomparable? A review of methodical aspects in the sustainability assessment of wood in vehicles. Retrieved from https://link.springer.com/article/10.1007/s11367-020-01800-1#Tab8.
- ^ ReCiPe is an LCIA method that creates the possibility of translating the LCI outputs into characterisation factors at midpoint level and at endpoint level. The midpoint indicators focus on individual environmental problems, such as climate change or acidification, while the endpoint ones represent the environmental impact at three higher aggregation levels: 1) effects on human health, 2) biodiversity, and 3) resource scarcity.
Table 14. The impact-assessment categories
| Environmental impact category | Unit | Method | Description |
| GWP100 - fossil | kg CO2-eq | IPCC 2021 GWP100 V1.00 | Global warming potential over 100 years (fossil) |
| GWP100 - biogenic | kg CO2-eq | IPCC 2021 GWP100 V1.00 | Global warming potential over 100 years (biogenic) |
| Acidification | mol H+ eq | EF 3.0 Method (adapted) V1.02 / EF 3.0 normalisation and weighting set | Soil pH increases due to excessive nitrogen |
| Eutrophication, freshwater | kg P eq | EF 3.0 Method (adapted) V1.02 / EF 3.0 normalisation and weighting set | Excessive plant and algal growth due to excessive nutrient amount |
| Abiotic depletion (fossil fuels) | MJ | CML-IA baseline V3.07 / EU25 | Depletion of non-living resources |
| Ecosystems (damage assessment) | species.yr | ReCiPe 2016 Endpoint (H) V1.06 / World (2010) H/H | Changes in ecosystem services from environmental impacts |
| Water use | m3 | AWARE V1.04 | The relative available water remaining per area in a region after the demand of humans and aquatic ecosystems has been met. AWARE method has been used with characterization factors in regional/national level (not watershed level). |
4 Scenarios and Sub-scenarios Studied
This chapter explains the scenarios studied, including process descriptions, and goes into how the substituting products and marginal-energy scenarios examined were selected.
4.1 Wood-waste markets
Because the input wood-waste source, type, and quality were not specified in the data for this study, the sorting and processing step was assumed to be similar across all treatment scenarios. In the absence of more detailed data, a similar sorting process was assumed for the incineration-bound wood waste. In the calculations, the transportation distance from the source of the wood waste to sorting is assumed to be 50 km.
Transportation from sorting to the treatment facilities was assumed to involve the same distances as the typical raw-material transportation for each respective scenario. This assumption was made because separating inputs of wood material from other raw-material inputs would have been difficult, in that the ecoinvent factors do not itemise the transportation assumptions by raw material. The sensitivity of this assumption is examined further on in the report (see Section 0).
4.2 Marginal energy
In our CLCA context, marginal energy entails displacing the energy production that would otherwise be generated through wood waste’s incineration. As the global operation environment is changing rapidly, it is difficult to predict which energy-production methods are likely to be used to offset the decrease in energy production from wood-waste incineration. At the moment, CLCA methodology is not standardised with regard to the selection of marginal-energy sources, and solutions range from selecting only one energy source to using a mix of energy sources that is based on history trends[1]Muñoz, I., Weidema, B.P. (2021). Example – Marginal Electricity in Denmark. Version: 2021-06-08. www.consequential-lca.org.. In our study, to get a wider perspective on the impact of the marginal-energy choices assumed, we studied two distinct marginal-energy sub-scenarios for each treatment-method scenario.
Several alternatives for marginal heat and electricity were considered – namely, coal, peat, municipal waste, and wind energy / hydropower. Import of energy was not considered as an alternative across the Nordic region, on account of the common electricity markets, although it might have a role in some of the countries (e.g., Denmark). Those energy-production facilities currently fuelled with wood usually require their fuel to be in solid form. That renders coal, peat, and other sources of biomass feasible substitution candidates in the wake of decreased availability of wood waste. An increase in the use of coal or peat was seen as unlikely, however, in light of growing climate-related ambitions, so other sources of biomass were left as the only possible alternative. We chose to consider wood as the biomass source because wood chips had the best heat- and energy-production LCI data available, with data on producing electricity from wood chips existing even for Sweden.
It is clear that, for reaching the target recycling rates in the EU, which are growing stricter, incineration of municipal waste cannot continue its upward trend[2]Papineschi, J. et al. (2019). Analysis of Nordic regulatory framework and its effect on waste prevention and recycling in the region, Nordic Council of Ministers. DOI: 10.6027/TN2019-522.. Therefore, under the CLCA framework defined by Fauzi[3]Fauzi, R. T. et al. (2021). Life cycle assessment and life cycle costing of multistorey building: Attributional and consequential perspectives, Building and Environment, Vol 197. doi: 10.1016/j.buildenv.2021.107836. and Weidema[4]Weidema, B. (2003). Market information in life cycle assessment, Danish Environmental Protection Agency Environmental Project, 863(863), p. 147., the capacity for production of energy from municipal waste represents a constraint and likely will not respond to increasing needs for energy. Also, per that CLCA framework, the most flexible technology should be considered. At the moment, natural gas seems to be the most flexible technology, responding quickly to rises and declines in energy demand. Wind power on its own is not considered flexible[5]Muñoz, I., Weidema, B.P. (2021). Example – Marginal Electricity in Denmark. Version: 2021-06-08. www.consequential-lca.org., but in the future wind power in combination with a storage method, such as hydro, could provide enough flexibility.
The foregoing factors led to choosing natural gas and biomass from wood for the sub‑scenarios for sources of marginal heat and electricity. These were seen as the most realistic possible developments in the near term across the Nordic region and should also yield valuable insight as to the importance of the selection of marginal energy. According to a recent report by the Finnish Climate Change Panel[6]Seppälä, J., Heinonen, T., Kilpeläinen, A., Peltola, H., Pukkala, T., Sihvonen, M., Soimakallio, S., Weaver, S., Vesala,T., Ollikainen, M. (2022). Metsät ja ilmasto: Hakkuut, hiilinielut ja puun käytön korvaushyödyt. Finnish Climate Change Panel Report 3/2022., the climate benefit of incinerating wood is likely to decrease over time as the use of fossil fuels wanes and gets replaced by green energy. For that report, it was assumed that incineration of wood is not going to compensate for any fossil energy by 2070. In this light, assuming marginal energy to have net-zero climate impact might be justified, though it was not considered in our study.
The marginal-energy scenarios are highly sensitive to the amounts of heat and electricity assumed to be produced by incineration of wood waste. In the Nordics, wood-waste fractions are used in heat only-facilities and in combined heat and power (CHP) facilities both. Depending on the country, the amount of heat and electricity produced from one tonne of wood waste varies. For example, CHP facilities using wood-waste fractions produce 74% of Finland’s heat and 26% of its electricity, net. When heat-only facilities are considered in addition to CHP ones, the corresponding figures are 85.4% and 14.6%, respectively.[7]Based on Finnish district heating statistics (2020). Finnish Energy (Energiateollisuus ry) https://energia.fi/files/6520/KL_Alueellinen_2020_Paivitetty_20220201.xlsx. In the Swedish wood-waste incineration process, the average energy produced comes to 4,323 kWh per tonne of wood waste, of which 81.4% is heat and 18.6% electricity.[8]Sveriges officiella statistik. (2020). https://www.scb.se/contentassets/6f9dcff961bf4b2981ea8b4058ad711f/en0105_2020a01_sm_en11sm2101.pdf. The Swedish figure for energy production per tonne and the average between Finland’s and Sweden’s shares of heat and electricity production were used in this study.
In Finland, 47 district-heating facilities and 12 industrial facilities were using wood-waste fractions in 2020, with the following fuel percentages: forest fuel woods 29.5%, peat 18.9%, industrial wood residues 11%, natural gas 9.7%, coal 8.1%, municipal waste 8.5%, wood‑waste fractions 7.3%, and other fuels 7.1%.[9]Based on Finnish district heating statistics (2020). Finnish Energy (Energiateollisuus ry) https://energia.fi/files/6520/KL_Alueellinen_2020_Paivitetty_20220201.xlsx. The data do not address the use of multiple fuels within one facility; for example, natural gas is more likely to be burned in a separate dedicated unit. According to an interview with an expert in the energy industry[10]Expert interview with Juha Vanhanen, 2.2.2022., it is likely that, should wood-waste fractions be directed toward manufacturing of new products, other solid fuels – forest fuel woods, peat, and industrial residues among them – will cover the demand in Finland.
Footnotes
- ^ Muñoz, I., Weidema, B.P. (2021). Example – Marginal Electricity in Denmark. Version: 2021-06-08. www.consequential-lca.org.
- ^ Papineschi, J. et al. (2019). Analysis of Nordic regulatory framework and its effect on waste prevention and recycling in the region, Nordic Council of Ministers. DOI: 10.6027/TN2019-522.
- ^ Fauzi, R. T. et al. (2021). Life cycle assessment and life cycle costing of multistorey building: Attributional and consequential perspectives, Building and Environment, Vol 197. doi: 10.1016/j.buildenv.2021.107836.
- ^ Weidema, B. (2003). Market information in life cycle assessment, Danish Environmental Protection Agency Environmental Project, 863(863), p. 147.
- ^ Muñoz, I., Weidema, B.P. (2021). Example – Marginal Electricity in Denmark. Version: 2021-06-08. www.consequential-lca.org.
- ^ Seppälä, J., Heinonen, T., Kilpeläinen, A., Peltola, H., Pukkala, T., Sihvonen, M., Soimakallio, S., Weaver, S., Vesala,T., Ollikainen, M. (2022). Metsät ja ilmasto: Hakkuut, hiilinielut ja puun käytön korvaushyödyt. Finnish Climate Change Panel Report 3/2022.
- ^ Based on Finnish district heating statistics (2020). Finnish Energy (Energiateollisuus ry) https://energia.fi/files/6520/KL_Alueellinen_2020_Paivitetty_20220201.xlsx.
- ^ Sveriges officiella statistik. (2020). https://www.scb.se/contentassets/6f9dcff961bf4b2981ea8b4058ad711f/en0105_2020a01_sm_en11sm2101.pdf.
- ^ Based on Finnish district heating statistics (2020). Finnish Energy (Energiateollisuus ry) https://energia.fi/files/6520/KL_Alueellinen_2020_Paivitetty_20220201.xlsx.
- ^ Expert interview with Juha Vanhanen, 2.2.2022.
4.3 S1: Particle board
Wood-based boards, such as particle board and plywood, are a versatile building material. Particle board is used, for example, for subfloors, walls, ceilings, and furniture. They are manufactured in a continuous process wherein separate layers of glue-coated fine and coarse chips are pressed and hardened under pressure and heat. Through a process in which chips are spread on a track and settle partly in the transport direction, the resulting boards display a certain difference in properties between their transverse and longitudinal dimension. The most common glue for particle board is urea glue.[1]Svenskt Trä. Träbaserade skivmaterial. Available: https://www.svenskttra.se/bygg-med-tra/byggande/tra-och-trabaserade-produkter/trabaserade-skivmaterial/.
Production of particle board and plywood in Sweden totalled 651,000 m3 in 2020, of which the amount exported was 57,000 m3. The year showed a 1.8 decrease in production from the level in 2019, when the corresponding figure was 663,000 m3.[2]TMF (2021). Träskivor. Available: https://www.tmf.se/statistik/branschstatistik/traskivor/.
Several building materials can serve as alternatives to particle board, depending on the use. Of these, the one we chose as the substituting product was among the most commonplace: plasterboard (also called gypsum board). The global plasterboard market was estimated to be USD 45.08 billion in 2020, with wall-board products accounting for the largest market share, 54.54%.[3]Gypsum Board Market Size, Share & Trends Analysis Report By Product. (2021). Available: https://www.grandviewresearch.com/industry-analysis/gypsum-board-market. Plasterboard can be assumed to fill the same function. The weight of plasterboard is 9 kg/m2, and particle board weighs 10,6 kg/m2. The two products are assumed to have the same lifetime. Table 15 presents the sub-scenarios studied for particle board when the various marginal-energy scenarios are included.
Footnotes
- ^ Svenskt Trä. Träbaserade skivmaterial. Available: https://www.svenskttra.se/bygg-med-tra/byggande/tra-och-trabaserade-produkter/trabaserade-skivmaterial/.
- ^ TMF (2021). Träskivor. Available: https://www.tmf.se/statistik/branschstatistik/traskivor/.
- ^ Gypsum Board Market Size, Share & Trends Analysis Report By Product. (2021). Available: https://www.grandviewresearch.com/industry-analysis/gypsum-board-market.
| Sub-scenario | Substituting product | Marginal energy |
| 1A/E1 | Plasterboard | E1: Natural gas |
| 1A/E2 | Plasterboard | E2: Biomass |
Table 15. The sub-scenarios studied for particle board
4.4 S2: Composite
Global production of wood–plastic composite (WPC) materials increased from just under 50,000 tonnes per year in 1997 to nearly 2.5 million tonnes per year in 2012, and world trends point to continuing increase in the future also. Today, WPC accounts for 10–15% of the European composite market, and, with the ongoing increase in prices for plastic and fossil materials, WPC is expected to continue taking market share from other composite and plastic materials.[1]Stenlund, A. (2014). Wood plastic composites – a material for the future? Available: stenlund_a_140710.pdf (slu.se).
Wood–plastic composite is a composite that combines wood-based elements with polymers. The manufacturing process for WPC requires extrusion, injection moulding, and thermoforming (pressing); however, the modern technique for creating WPC entails additive manufacturing via fused-layer modelling and laser sintering, similar to that in 3D printing, also. In the manufacture of WPC, the most commonly used polymers are polyethylene and polyvinyl chloride.[2]Gardner, J., Han, Y., Wang, L. (2015). Wood-Plastic Composite Technology. Available: 40725_2015_16_Article 139..150 (springer.com).
In September 2013, the German research institution nova-Institute published a report titled ‘Wood–Plastic Composites (WPC) and Natural Fiber Composites (NFC): European and Global Markets 2012 and Future Trends’. Their study, which dealt with the current situation in the world biocomposite market, revealed an increase in the WPC and NFC volume produced, especially in North America and Asia over the past decade. In Europe, for the most part, the automotive industry accounts for the largest proportion of the increase in use of WPC, and the report states that WPC use in that industry could rise to even five or six times the 2013 level. In North America and Asia, it is primarily sales of duckboard materials that account for the producers’ largest market segment today. China too is witnessing an increase in the use of WPC, for doors and window frames, and here a continued increase is expected for the future. The institute predicted longer-term continuing growth in the amount of WPC produced, with the rise being at its greatest in China but also visible in Europe and the rest of the world.[3]Seppälä, J., Heinonen, T., Kilpeläinen, A., Peltola, H., Pukkala, T., Sihvonen, M., Soimakallio, S., Weaver, S., Vesala,T., Ollikainen, M. (2022). Metsät ja ilmasto: Hakkuut, hiilinielut ja puun käytön korvaushyödyt. Finnish Climate Change Panel Report 3/2022.
The global market for WPC in 2019 was valued at USD 4.77 billion, and forecasts by market-research company Fortune Business Insight indicate that its value will rise to USD 9.03 billion in 2027.[4]Fortune Business Insights (2021). Wood Plastic Composite Market. Available: Wood Plastic Composite Market Size, Share | Report, 2020-2027 (fortunebusinessinsights.com).
Since the WPC market is expected to grow, also capturing more of the market share from other, related products, no products were assumed to be relevant for substitution and our analysis compared between WPC board products from wood waste and from virgin wood. We assumed the WPC board to exhibit the same functions and physical characteristics whether produced from virgin wood or produced from wood waste, and the life expectancy too is assumed to be the same. Table 16 presents the sub-scenarios studied for composite, with the various marginal-energy scenarios included.
Footnotes
- ^ Stenlund, A. (2014). Wood plastic composites – a material for the future? Available: stenlund_a_140710.pdf (slu.se).
- ^ Gardner, J., Han, Y., Wang, L. (2015). Wood-Plastic Composite Technology. Available: 40725_2015_16_Article 139..150 (springer.com).
- ^ Seppälä, J., Heinonen, T., Kilpeläinen, A., Peltola, H., Pukkala, T., Sihvonen, M., Soimakallio, S., Weaver, S., Vesala,T., Ollikainen, M. (2022). Metsät ja ilmasto: Hakkuut, hiilinielut ja puun käytön korvaushyödyt. Finnish Climate Change Panel Report 3/2022.
- ^ Fortune Business Insights (2021). Wood Plastic Composite Market. Available: Wood Plastic Composite Market Size, Share | Report, 2020-2027 (fortunebusinessinsights.com).
| Sub-scenario | Substituting product | Marginal energy |
| 2A/E1 | WPC from virgin wood | E1: Natural gas |
| 2A/E2 | WPC from virgin wood | E2: Biomass |
Table 16. The sub-scenarios studied for composite
4.5 S3: Insulation
Wood has many properties that make it suitable as a material for insulation. It lasts a long time, is highly durable, is easy to work with, and – above all – has the capacity to absorb and release a reasonable amount of moisture without being damaged. There are several established wood-fibre insulation products on the market today, with various degrees of processing, and several more are under development. The least processed form, wood‑fibre insulation, is the one given focus in our study. It comes in two distinct forms, being usable either as boards of varying rigidity or as a loose fill. In use as a loose fill, one can adjust the density of the insulation by means of the blowing pressure. This characteristic gives insulation material made from wood fibre an outstanding thermal capacitance, in addition to the ability to reduce its material-internal convection. Wood‑fibre‑based insulation has approximately twice the heat-storage capacity of mineral wool.[1]Swedish Wood (2016). Wood-based insulation - Inhibit moisture and store energy. Available: https://www.swedishwood.com/publications/wood-magazine/2016-2/inhibit-moisture/.
Our study looked at wood-fibre insulation boards. Their manufacturing process can be either wet or dry. A benefit to the wet process is that the wood's natural lignin binds the product such that no extra adhesive is necessary.[2]Insulate Naturally. How STEICO wood fibre insulation materials are manufactured. Available: https://www.insulatenaturally.com.au/wet-dry-process. The wet process has the following steps:
- Chips and shavings, typically from spruce and fir, are retrieved as waste from the manufacture of other timber products
- The chips are ground into wood-fibre pulp
- This pulp is mixed with water and optionally a binder
- The mix gets pumped into a forming box as a continuous fibre mat
- Around half the water is removed through pressing and vacuum pumping
- The board material is dried in an air dryer
- The boards are cut to size and the edges milled[3]Greenspec. Wood fibre insulation: Manufacturing processes. Available: https://www.greenspec.co.uk/building-design/woodfibre-manufact-process/.
While the dry process requires a small amount of binder to be applied, it has the advantage of producing lighter products, which enables them to be thicker.[4]TMF (2021). Träskivor. Available: https://www.tmf.se/statistik/branschstatistik/traskivor/. The dry process usually comprises these steps:
- Chips and shavings are retrieved as waste from other timber-manufacture processes
- The fibres are sprayed with paraffin
- The sprayed fibres are dried by means of warm air
- The fibres then get sprayed with polyurethane resin as a binder
- The fibre mats are placed in a unit where the resin is cured and hardened through exposure to a mixture of air and water vapour[5]Gypsum Board Market Size, Share & Trends Analysis Report By Product. (2021). Available: https://www.grandviewresearch.com/industry-analysis/gypsum-board-market.
The demand for thermal-insulation materials in the EU was USD 8.4 billion by value in 2015 and is projected to reach USD 12.8 billion by 2027, at a compound annual growth rate (CAGR) of 3.48% (2015–2027). On account of their cost, availability, and insulation performance, mineral wool and plastic foams constitute more than 90% of the market for insulation materials today. However, new insulation materials are emerging that use biopolymers or biotic renewables, such as wood fibre. These show performance that is at least as good, and the market is expected to adopt them to a larger extent in the future. Also, other innovative materials with exceptional insulation properties, such as aerogels, are under development. Prices are higher for wood fibre and, especially, for aerogels than for conventional materials, but quality and environmental standards are likely to help improve the competitiveness between materials as the future unfolds.[6]Pavel, C.C., Blagoeva, D.T. (2018). Competitive landscape of the EU’s insulation materials industry for energy-efficient buildings.
In the study reported upon here, an unweighted average (50/50) between rock- and glass‑wool insulation materials was chosen as the first sub-scenario for the substituting product. For the second sub-scenario, polystyrene foam with graphite was the substituting product. These products account for in excess of 90% of the insulation-material market today. Mineral wool (rock wool or glass wool) and polystyrene foam are alternatives to wood wool that can be assumed to fill the same function. The weight used for rock wool here is 105 kg/m3, the weight of glass wool 55 kg/m3, and the weight for polystyrene foam 22 kg/m3. All insulation-product scenarios are estimated to involve a thermal conductivity of 0.04–0.042 W/mK, and the various products are assumed to have the same service life. Table 17 presents the sub-scenarios for insulation, including the various marginal-energy scenarios.
Footnotes
- ^ Swedish Wood (2016). Wood-based insulation - Inhibit moisture and store energy. Available: https://www.swedishwood.com/publications/wood-magazine/2016-2/inhibit-moisture/.
- ^ Insulate Naturally. How STEICO wood fibre insulation materials are manufactured. Available: https://www.insulatenaturally.com.au/wet-dry-process.
- ^ Greenspec. Wood fibre insulation: Manufacturing processes. Available: https://www.greenspec.co.uk/building-design/woodfibre-manufact-process/.
- ^ TMF (2021). Träskivor. Available: https://www.tmf.se/statistik/branschstatistik/traskivor/.
- ^ Gypsum Board Market Size, Share & Trends Analysis Report By Product. (2021). Available: https://www.grandviewresearch.com/industry-analysis/gypsum-board-market.
- ^ Pavel, C.C., Blagoeva, D.T. (2018). Competitive landscape of the EU’s insulation materials industry for energy-efficient buildings.
| Sub-scenario | Substituting product | Marginal energy |
| 3A/E1 | Mineral wool (50% rock wool, 50% glass wool) | E1: Natural gas |
| 3A/E2 | Mineral wool (50% rock wool, 50% glass wool) | E2: Biomass |
| 3B/E1 | Polystyrene foam slab with graphite | E1: Natural gas |
| 3B/E2 | Polystyrene foam slab with graphite | E2: Biomass |
Table 17. The sub-scenarios studied for insulation
4.6 S4: Bioethanol
Exploiting bioethanol as a substitute for fossil fuels is one way to reduce fossil greenhouse‑gas emissions from the transportation industry. Advanced biofuels based on cellulosic feedstocks are needed as a replacement for biofuels from agricultural feedstock. While the EU’s total biofuel consumption is projected to decrease, the share of advanced biofuel sources is predicted to rise from 2020’s 17% to 24% by 2029.[1]Organisation for Economic Cooperation and Development (OECD) iLibrary (2021). OECD-FAO Agricultural
Outlook 2020-2029, Biofuels. Retrieved from https://www.oecd-ilibrary.org/sites/3aeb7be3-en/index.html?itemId=/content/component/3aeb7be3-en. Ideally, conventional biofuels would be entirely replaced by advanced biofuels. As quantities of the feedstocks currently used for the latter are limited, there is potential for enormous demand for alternative feedstocks. For example, were Norway’s current annual quantity of wood waste converted to bioethanol, it could cover about 4% of the country’s total use of fuel for transportation, of which biofuel accounts for about 7% today[2]The value is calculated with total consumption of 8,200 million litres of fuel and with the fuel-energy content
roughly estimated to be 10 kWh/litre. We assumed 800,000 tonnes of wood waste (Norway 2020) with an
assumed energy content of 4 kWh/kg. Biofuel consumption comes to about 600 million litres per
year. https://www.ssb.no/energi-og-industri/artikler-og-publikasjoner/nedgang-i-sal-av-petroleumsprodukt--451089. (that is, wood waste could cover about 50% of Norway’s biofuel consumption). The share of biofuel in use of transportation fuels is expected to increase throughout the Nordic region, while the total demand for fuel is expected to fall in pursuit of the target set in the Paris Agreement.
Numerous types of biofuels can be produced from cellulosic material, via several technologies and variants of them, such as pyrolysis, syngas/gasification (with Fisher–Tropsch or methanol synthesis processes, producing biodiesel and ‘bio-gasoline’ respectively), and fermentation. Figure 8, below, diagrams the main routes to various bioenergy-supplying fuels.
Footnotes
- ^ Organisation for Economic Cooperation and Development (OECD) iLibrary (2021). OECD-FAO Agricultural
Outlook 2020-2029, Biofuels. Retrieved from https://www.oecd-ilibrary.org/sites/3aeb7be3-en/index.html?itemId=/content/component/3aeb7be3-en. - ^ The value is calculated with total consumption of 8,200 million litres of fuel and with the fuel-energy content
roughly estimated to be 10 kWh/litre. We assumed 800,000 tonnes of wood waste (Norway 2020) with an
assumed energy content of 4 kWh/kg. Biofuel consumption comes to about 600 million litres per
year. https://www.ssb.no/energi-og-industri/artikler-og-publikasjoner/nedgang-i-sal-av-petroleumsprodukt--451089.

Figure 8. The main routes to various bioenergy-fuels[1]Hossain, M. Zabed et al. (2019). Recent advances in biological pretreatment of microalgae and lignocellulosic biomass for biofuel production, Renewable and Sustainable Energy Reviews.
Footnotes
- ^ Hossain, M. Zabed et al. (2019). Recent advances in biological pretreatment of microalgae and lignocellulosic biomass for biofuel production, Renewable and Sustainable Energy Reviews.
While many of the technologies are well-known, adaptation to the use of wood as feedstock is rather immature. These technologies are, therefore, generally expensive, and only smaller factories/refineries and pilot plants exist at present. One problem both economically and for the environmental performance is the high energy demand (loss) involved in the production process, which leads to relatively low energy output in the final product (compared to the energy content in the feedstock). A meta-study[1]Sunde, K., Brekke, A.,Solberg, B. (2011). Environmental impacts and costs of woody Biomass-to-Liquid (BtL) production and use — A review, Forest Policy and Economics 13 591–602. on the energy-efficiency of using biomass-to-liquid (BtL) production vs fossil diesel showed a wide range of results, with an average of about 50–100% higher total energy consumption well to wheel (WTW) for a biofuel option in which 95% of the energy is bio-based.
There are many pilot plants and initiatives to change this situation, with clear ambitions for large-scale biofuel production. One of them is Silva Green Fuel, a joint venture between Södra and Statkraft aimed at adopting a new technology that applies hydrothermal liquefaction to produce a so-called hydrofaction oil (a type of crude oil) together with heat that can be recycled in the process or exported for district heating. The overall energy‑efficiency of the pilot plant is estimated at 81% without district-heating recovery and at 92% inclusive of it. The total electricity input is 0.08 MJ per megajoule of oil output, and the input of wood is 1.15 MJ per megajoule of oil output.
In the absence of bioethanol from wood waste, one could expect bioethanol to be made from either virgin wood or any agricultural feedstock. The likeliest fossil fuel for bioethanol to replace is petrol. Although engines can run on ethanol alone, it is more usual for petrol and ethanol to be mixed. For this report, 1 kg of ethanol was compared to the equivalent calorific amount of petrol. Table 18 presents the sub-scenarios studied for bioethanol, including the various scenarios for marginal energy.
Footnotes
- ^ Sunde, K., Brekke, A.,Solberg, B. (2011). Environmental impacts and costs of woody Biomass-to-Liquid (BtL) production and use — A review, Forest Policy and Economics 13 591–602.
| Sub-scenario | Substituting product | Marginal energy |
| 4A/E1 | Bioethanol from virgin wood | E1: Natural gas |
| 4A/E2 | Bioethanol from virgin wood | E2: Biomass |
| 4B/E1 | Bioethanol from the global production mix | E1: Natural gas |
| 4B/E2 | Bioethanol from the global production mix | E2: Biomass |
| 4C/E1 | Petrol | E1: Natural gas |
| 4C/E2 | Petrol | E2: Biomass |
Table 18. The sub-scenarios studied for bioethanol
4.7 S5: Biochar
Biochar is a carbon-intensive material created from organic feedstock via thermal combustion with a restricted supply of oxygen. Several feedstocks can be turned into char by carbonisation, usually pyrolysis. Other methods of obtaining biochar include gasification, hydrothermal carbonisation, flash carbonisation, and torrefaction. In the pyrolysis process, the feedstock is combusted at temperatures of around 300 to 900 °C in oxygen-deprived conditions. As a result, solid, liquid, and gaseous products are formed: biochar, bio-oil, and syngas, respectively.[1]Wang, J., Wang, S. (2019). Preparation, modification and environmental application of biochar: A review. Journal of Cleaner production Vol. 227 pp. 1002-1022 https://doi.org/10.1016/j.jclepro.2019.04.282. Pyrolysis is likely to remain the predominant production process for reason of being inexpensive and affording feedstock flexibility.[2]Fortune Business insight (2022). Biochar market size, share and covid-19 impact analysis by technology. Available: https://www.fortunebusinessinsights.com/industry-reports/biochar-market-100750. After pyrolysis, modification further improves the biochar’s physiochemical properties as the application dictates.[3]Wang, J., Wang, S. (2019). Preparation, modification and environmental application of biochar: A review. Journal of Cleaner production Vol. 227 pp. 1002-1022 https://doi.org/10.1016/j.jclepro.2019.04.282.
Among the most interesting characteristics of biochar are its high carbon content, stable structure, and porosity creating a large surface area and high adsorption capacity. The biochar’s properties depend on the feedstock type and on such process conditions as temperature and retention time. Generally, biochar that is produced at higher temperatures has a higher carbon content and larger surface area. On the downside, the yield is decreased with increasing temperature.[4]Wang, J., Wang, S. (2019). Preparation, modification and environmental application of biochar: A review. Journal of Cleaner production Vol. 227 pp. 1002-1022 https://doi.org/10.1016/j.jclepro.2019.04.282.
The biochar industry is highly fragmented in terms of products and end uses, and hence it provides an interesting case for a consequential LCA study. Biochar is used mainly in agriculture, to improve soil quality. It has the ability to remove contaminants such as organic pollutants and heavy metals from the soil, store water and nutrients, and neutralise acidic pH and increase soil fertility.[5]Wang, J., Wang, S. (2019). Preparation, modification and environmental application of biochar: A review. Journal of Cleaner production Vol. 227 pp. 1002-1022 https://doi.org/10.1016/j.jclepro.2019.04.282.
Another interesting quality of biochar is its ability to sequester carbon. However, results have proved inconsistent, and more research is needed. The ability of biochar to sequester carbon seems to depend on the feedstock type and process conditions and may also vary with the soil to which biochar is added. Biochar also finds use as an additive in composting, water and wastewater treatment, and animal feed; is a catalyst and electrode material; and has many other industry applications (e.g., in the building sector and for medicines and cosmetics).[6]Wang, J., Wang, S. (2019). Preparation, modification and environmental application of biochar: A review. Journal of Cleaner production Vol. 227 pp. 1002-1022 https://doi.org/10.1016/j.jclepro.2019.04.282.
Research has examined how biochar could replace peat moss as a growth medium. Replacing 50–70% of the growth-medium volume with biochar did not negatively influence the resulting amount of biomass or flowering. A lower substitutive volume (10–30%) showed a positive effect on the biomass quantity and leaf chlorophyll concentration.[7]Margenot, A. J. et al. (2018). Substitution of peat moss with softwood biochar for soil-free marigold growth. Industrial Crops and Products Vol 112, pp. 160-169. https://doi.org/10.1016/j.indcrop.2017.10.053.
The quality of biochar produced from wood waste and the associated air emissions from the pyrolysis process have been studied by Sørmo et al.[8]Sørmo, E., Silvani, L., Thune, G., Gerber, H., Schmidt, H.P., Botnen Smebye, A., Cornelissen, G. (2020). Waste timber pyrolysis in a medium-scale unit: Emission budgets and biochar quality. Science of the Total Environment 718 137335. They concluded that the emissions (CO, NOx, CH4, NMVOCs, PAHs, and PM10) were similar between wood-waste and clean‑wood pyrolysis. However, the biochar product did have higher PAH-16 and heavy‑metal content than the equivalent one from clean wood. Therefore, only clean-wood waste is suitable for biochar production if the material is destined for agricultural soil.
Biochar markets are expected to grow with a CAGR of 11–13.4% until 2030[9]Fortune Business insight (2022). Biochar market size, share and covid-19 impact analysis by technology. Available: https://www.fortunebusinessinsights.com/industry-reports/biochar-market-100750., [10]Fact, M.R. (2021). Biochar market outlook 2021–2031 https://www.factmr.com/report/3781/biochar-market., [11]Allied Market Research (2022). Biochar Market by production technology (Pyrolysis, Gasification, and Others), Application (Soil Amendment, Animal Feed, Industrial, and Others): Global Opportunity Analysis and Industry Forecast, 2021–2030 https://www.alliedmarketresearch.com/biochar-market-A11816.. The most common application is expected to remain soil-quality improvement, followed by use as an animal-feed additive, industrial applications, and other uses.[12]Fact, M.R. (2021). Biochar market outlook 2021–2031 https://www.factmr.com/report/3781/biochar-market.
Biochar has an extensive list of characteristics and diverse applications, so biochar cannot be a ‘drop-in’ replacement for merely one product. That said, one of its most common uses lies in improving soil quality, and prior literature has regarded replacing peat moss as promising in this regard. Accordingly, substitution for peat moss was selected for further investigation in our study with 1 kg biochar replacing 1 kg of peat moss. Table 19 presents the sub-scenarios examined for biochar, with the various marginal-energy scenarios included.
Footnotes
- ^ Wang, J., Wang, S. (2019). Preparation, modification and environmental application of biochar: A review. Journal of Cleaner production Vol. 227 pp. 1002-1022 https://doi.org/10.1016/j.jclepro.2019.04.282.
- ^ Fortune Business insight (2022). Biochar market size, share and covid-19 impact analysis by technology. Available: https://www.fortunebusinessinsights.com/industry-reports/biochar-market-100750.
- ^ Wang, J., Wang, S. (2019). Preparation, modification and environmental application of biochar: A review. Journal of Cleaner production Vol. 227 pp. 1002-1022 https://doi.org/10.1016/j.jclepro.2019.04.282.
- ^ Wang, J., Wang, S. (2019). Preparation, modification and environmental application of biochar: A review. Journal of Cleaner production Vol. 227 pp. 1002-1022 https://doi.org/10.1016/j.jclepro.2019.04.282.
- ^ Wang, J., Wang, S. (2019). Preparation, modification and environmental application of biochar: A review. Journal of Cleaner production Vol. 227 pp. 1002-1022 https://doi.org/10.1016/j.jclepro.2019.04.282.
- ^ Wang, J., Wang, S. (2019). Preparation, modification and environmental application of biochar: A review. Journal of Cleaner production Vol. 227 pp. 1002-1022 https://doi.org/10.1016/j.jclepro.2019.04.282.
- ^ Margenot, A. J. et al. (2018). Substitution of peat moss with softwood biochar for soil-free marigold growth. Industrial Crops and Products Vol 112, pp. 160-169. https://doi.org/10.1016/j.indcrop.2017.10.053.
- ^ Sørmo, E., Silvani, L., Thune, G., Gerber, H., Schmidt, H.P., Botnen Smebye, A., Cornelissen, G. (2020). Waste timber pyrolysis in a medium-scale unit: Emission budgets and biochar quality. Science of the Total Environment 718 137335.
- ^ Fortune Business insight (2022). Biochar market size, share and covid-19 impact analysis by technology. Available: https://www.fortunebusinessinsights.com/industry-reports/biochar-market-100750.
- ^ Fact, M.R. (2021). Biochar market outlook 2021–2031 https://www.factmr.com/report/3781/biochar-market.
- ^ Allied Market Research (2022). Biochar Market by production technology (Pyrolysis, Gasification, and Others), Application (Soil Amendment, Animal Feed, Industrial, and Others): Global Opportunity Analysis and Industry Forecast, 2021–2030 https://www.alliedmarketresearch.com/biochar-market-A11816.
- ^ Fact, M.R. (2021). Biochar market outlook 2021–2031 https://www.factmr.com/report/3781/biochar-market.
| Sub-scenario | Substituting product | Marginal energy |
| 5A/E1 | Biochar from virgin wood | E1: Natural gas |
| 5A/E2 | Biochar from virgin wood | E2: Biomass |
| 5B/E1 | Peat moss | E1: Natural gas |
| 5B/E2 | Peat moss | E2: Biomass |
Table 19. The sub-scenarios studied for biochar
4.8 S6: Textile fibre
There has been extensive research into wood-based textiles in recent years in the Nordic countries, especially Finland[1]See, for example, https://www.stjm.fi/en/new-textile-fibres-from-finland/, https://www.businessfinland.fi/49909d/globalassets/julkaisut/invest-in-finland/industry-outlines/industry-outline-innovative-bioproducts_2021.pdf., and market demand for wood-based textile fibres exhibits strong potential to rise in the future[2]Kallio, A. M. I. (2021). Wood-based textile fibre market as part of the global forest-based bioeconomy. Forest Policy and Economics, 123. Retrieved from https://www.sciencedirect.com/science/article/pii/S1389934120306900.. For these reasons, textile fibre was deemed an interesting case for study.
Generally, the process of manufacturing textile fibre from wood entails the following stages:
- At the pulp-manufacturing plant
- Trunk barking and hacking to create wood chips
- Separation of the cellulose component (via a prehydrolysis kraft process or sulphite process) to remove lignin and hemicellulose
- Bleaching of the pulp to remove remaining traces of lignin, drying, and rolling onto spools
- At the fibre-manufacturing facility
- Rolls of pulp broken down into small pieces
- Creation of a dissolved cellulose solution with chemicals (different chemicals for different processes)
- Forming of cellulose fibres, which involves pumping cellulose solution through spinnerets with fine nozzles
- Fibre spinning (e.g., wet spinning)
- Possibly further treatment
- Cutting and baling of the fibres
Numerous wood-based textile fibres are on the market today, including viscose, modal fibres, lyocell, and new innovations such as Ioncell and Spinnova. The viscose-production process employs an alkali and carbon sulphide as dissolving chemicals. Lyocell production uses amine oxide as the dissolving chemical, but the process is closed-loop: no chemicals need to be added after the initial introduction. For Spinnova, the process differs from the above-mentioned production methods in that it uses no chemicals to dissolve the cellulose – instead, the raw material is mechanically broken into microfilaments.
Annual production of textile fibre comes to 100 million tons globally (2019), with 66% being oil-based fibres, 27% cotton fibres, 6% wood-based fibres, and 1% wool and silk together. Demand is expected to reach 140 million tons per year by 2025–2030,[3]Per Huotari, P. (2019). Wood Pulp – The New Cotton for the Garment Industry? with Spinnova expecting the global market to grow to 150–155 million tons by 2030.[4]See the Spinnova Annual report (2021). https://mb.cision.com/Public/18819/3540960/a88b1c7946378c90.pdf.
Many promising new technologies for wood-based textile fibres are being developed in the Nordics. Spinnova is among the most promising of these, with a production-capacity forecast of 150,000 tons by 2025–2027.[5]See https://spinnovagroup.com/spinnova-as-a-company/business/. TreeToTextile is constructing a demo plant with a capacity of 1,500 tons,[6]See https://treetotextile.com/treetotextile-builds-demonstration-plant-for-upscaling-new-sustainable-textile-fiber. and Metsä Spring plans to build one with a 500-ton capacity[7]See https://metsaspring.com/fi/metsa-group-establishes-an-innovation-company/.. Many of these technologies can work with also sources of fibre other than virgin wood, such as wastepaper and board, old cotton garments, or non-wood cellulose. For example, Södra’s OnceMore® product uses wood cellulose and textile waste, and Renewcell’s Circulose® utilises mainly textile waste, with current capacity at 60,000 tons and plans in place for scaling to 360,000 tons by 2025.[8]See https://www.renewcell.com/en/year-end-report-2021/).
Given market prices, wood-based textile fibre would likely compete with viscose and cotton initially. Historically, the price of polyester has been about 50–60% that of viscose, and cotton prices some 90% of viscose’s.[9]Per Huotari, P. (2019). Wood Pulp – The New Cotton for the Garment Industry? Even if we expected the production cost of the new wood-based fibres to be somewhat higher than viscose on account of improvements to water-handling and more environment-friendly chemicals, it still should be possible to achieve a reasonable market price through the savings on raw materials, as wood waste is rather inexpensive.
Processing textile fibres into clothes is centred in Asia, where cotton is produced. Therefore, wood-based textile fibre produced in the Nordic region may face issues arising from transportation costs, and technologies that can utilise textile waste, straw, or other agricultural side streams that are abundant in Asia are likely to compete with wood-based fibres.
As Weidema[10]Weidema, B. (2003). Market information in life cycle assessment, Danish Environmental Protection Agency Environmental Project, 863(863), p. 147. has suggested, the most flexible technology that is able to respond to increased demand is likely to be the newest one. New technologies of this nature may face less extensive production constraints if they are able to use other cellulose-based raw materials, such as textile fibre or side streams from agriculture. For new processes capable of producing viscose-quality fibre at lower costs, one could expect them to pose a threat to current viscose production. However, as new technologies develop even further, the next target could be the second-biggest textile raw material – cotton.
In this study, cotton and viscose from virgin wood were chosen as the substituting products with 1 kg of textile fibre from wood waste replacing 1 kg of cotton fibre or viscose fibre. It was assumed cotton and viscose from virgin wood fill the same function and have the same lifetime. Table 20 presents all sub-scenarios studied for textile fibre, including the various marginal‑energy scenarios considered.
Footnotes
- ^ See, for example, https://www.stjm.fi/en/new-textile-fibres-from-finland/, https://www.businessfinland.fi/49909d/globalassets/julkaisut/invest-in-finland/industry-outlines/industry-outline-innovative-bioproducts_2021.pdf.
- ^ Kallio, A. M. I. (2021). Wood-based textile fibre market as part of the global forest-based bioeconomy. Forest Policy and Economics, 123. Retrieved from https://www.sciencedirect.com/science/article/pii/S1389934120306900.
- ^ Per Huotari, P. (2019). Wood Pulp – The New Cotton for the Garment Industry?
- ^ See the Spinnova Annual report (2021). https://mb.cision.com/Public/18819/3540960/a88b1c7946378c90.pdf.
- ^ See https://spinnovagroup.com/spinnova-as-a-company/business/.
- ^ See https://treetotextile.com/treetotextile-builds-demonstration-plant-for-upscaling-new-sustainable-textile-fiber.
- ^ See https://metsaspring.com/fi/metsa-group-establishes-an-innovation-company/.
- ^ See https://www.renewcell.com/en/year-end-report-2021/).
- ^ Per Huotari, P. (2019). Wood Pulp – The New Cotton for the Garment Industry?
- ^ Weidema, B. (2003). Market information in life cycle assessment, Danish Environmental Protection Agency Environmental Project, 863(863), p. 147.
| Sub-scenario | Substituting product | Marginal energy |
| 6A/E1 | Cotton | E1: Natural gas |
| 6A/E2 | Cotton | E2: Biomass |
| 6B/E1 | Viscose | E1: Natural gas |
| 6B/E2 | Viscose | E2: Biomass |
Table 20. The sub-scenarios studied for textile fibre
4.9 S7: Incineration
In the reference treatment scenario in our study (i.e., the scenario in which the wood waste gets incinerated), the wood-waste material is collected, sorted, and then transported to the waste-incineration facility to be incinerated with energy recovery. This reference scenario is used in comparison to all of the various product scenarios specified in Figure 6 in Section 3.2.
5 The Life Cycle Inventory and Modelling
The life cycle inventory and modelling for the ALCA and CLCA scenarios are described below. The presentation covers data sources, the processes included and excluded, and the assumptions made.
5.1 Wood-waste markets: Transport and sorting
The environmental impact of sorting was modelled with generic data from ecoinvent. It was assumed that the distance from waste source to sorting is 50 km. The sorting was modelled with the ‘treatment of waste wood, post-consumer, sorting and shredding’ ecoinvent dataset. The inputs were changes to European averages, and the value for wood-waste output was changed to 0 since the material is used in further processes. Chrome-preserved waste wood was not removed from the dataset, since the amount was small. Following the precautionary principle, it was assumed, that 1 tonne of wood waste was dry wood in the sorting process. This influenced only the amount of sorting needed in each scenario. A description of the data and the modifications is given in Table 21.
Table 21. Inputs and outputs of transport and sorting of wood waste
| Manufacturing process | Source of inventory data | Modifications | Amount |
| Transportation to sorting | Transport, freight, lorry >32 metric ton, EURO5 {RER}| transport, freight, lorry >32 metric ton, EURO 5 | Cut-off, U | - | 50 tkm |
| Sorting of wood waste | Wood chips, from post-consumer wood, measured as dry mass {CH}| treatment of waste wood, post-consumer, sorting and shredding | Cut-off, U | Changed to European tap water. Changed waste wood to markets to 0 | 1,000 kg |
5.2 The attributional life cycle inventory
All scenarios have been adjusted to represent Nordic conditions. This means that within the production process, any electricity use has been switched to Nordic electricity mix (Electricity, high voltage {NORDEL}| production mix | Cut-off, S). As the Nordic electricity mix is only available in high voltage and most processes use medium voltage energy, also losses from transformation of electricity high to medium have been taken into account.
5.2.1 S1: Particle board
The environmental impact of particle-board production was modelled with generic ecoinvent data. Since the dataset employed represents global production, again, the electricity input was changed to represent Nordic average production. A description of the data used, and the modifications is given below, in Table 22.
Table 22. Inputs and outputs of the particle board manufacturing scenario
| Manufacturing process | Source of inventory data | Modifications | Amount |
| Sorting of wood waste | See Section 5.1 | See Section 5.1 | 1 000 kg |
| Particle-board production | Particleboard, uncoated {RoW}| particleboard production, uncoated, modified with wood waste input | Cut-off, U | Sub-process (Sawlog and veneer log, eucalyptus ssp., measured as solid wood under bark {TH}| market for sawlog and veneer log, eucalyptus ssp., measured as solid wood under bark | Cut-off, U) changed to (Sawlog and veneer log, hardwood, measured as solid wood under bark {SE}| hardwood forestry, birch, sustainable forest management | Cut-off, S) Wood inputs removed Changed to Nordic electricity | 15,385 m3 |
The amount of particle board produced from 1 tonne of wood waste was determined on the basis of ecoinvent factor inputs. According to ecoinvent, making 1 kg of particle board requires 1.07 kg of wood inputs. Therefore, 935.3 kg of particle board can be produced from 1 tonne of wood waste.
5.2.2 S2: Composite
The environmental impact of composite materials was modelled with generic ecoinvent data. Findings from the literature review indicate that wood–plastic composite is the most probable product option for market use at present and in the near future. There is no ecoinvent dataset representing the production of WPC boards, but a mix of polyethylene and wooden materials in line with a commonplace material composition was assumed. A description of the data used, and the modifications is given below, in Table 23.
Table 23. Inputs and outputs of the composite manufacturing scenario
| Manufacturing process | Source of inventory data | Modifications | Amount |
| Sorting of wood waste | See Section 5.1 | See Section 5.1 | 1,000 kg |
| WPC board production | Wood–plastic composite board | 45% input set to polyethylene (Polyethylene, high density, granulate, recycled {Europe without Switzerland}| polyethylene production, high density, granulate, recycled | Cut-off, S) 55% input hardwood (Residual hardwood, wet {Europe without Switzerland}| sawdust, wet, measured as dry mass to generic market for residual softwood, wet | Cut-off, S) Wood inputs removed Changed to Nordic electricity | 1,000 kg |
The amount of WPC board production from a tonne of wood waste was determined on the basis of a material composition detailed by a WPC board producer.[1]Material district (2009). Wood plastic composite. Available: https://materialdistrict.com/material/wood-plastic-composite/. According to the example 1,818.2 kg of WPC boards can be produced from 1 tonne of wood waste.
Footnotes
- ^ Material district (2009). Wood plastic composite. Available: https://materialdistrict.com/material/wood-plastic-composite/.
5.2.3 S3: Insulation
The environmental impact of insulation material was modelled with generic ecoinvent data. The dataset for production of wood wool was adjusted to represent Nordic conditions. For the case of production of wood wool from wood waste, the wood-material inputs were set to 0. A description of the data used, and the modifications is given below, in Table 24.
Table 24. Inputs and outputs of the insulation manufacturing scenario
| Manufacturing process | Source of inventory data | Modifications | Amount |
| Sorting of wood waste | See Section 5.1 | See Section 5.1 | 1,000 kg |
| Wood-wool production | Wood wool {RER}| production | Cut-off, U | Wood inputs removed Changed to Nordic electricity | 1,000 kg |
The amount of wood wool for insulation produced from 1 tonne of wood waste was determined on the basis of ecoinvent factor inputs. According to ecoinvent, to make 1 kg of wood wool requires approximately 1 kg of wood inputs. Therefore 1,000 kg of wood wool can be produced from 1 tonne of wood waste.
5.2.4 S4: Bioethanol
The environmental impact of bioethanol production was modelled with generic ecoinvent data. The dataset from ecoinvent for production of bioethanol was adjusted to represent Nordic conditions. For the case of production of bioethanol from wood waste, the wood‑material inputs were set to 0. A description of the data used, and the modifications is given below, in Table 25.
Table 25. Inputs and outputs of the bioethanol manufacturing scenario
| Manufacturing process | Source of inventory data | Modifications | Amount |
| Sorting of wood waste | See Section 5.1 | See Section 5.1 | 1,000 kg |
| Bioethanol production | Ethanol, without water, in 99.7% solution state, from fermentation {Europe without Switzerland}| dewatering of ethanol from biomass, from 95% to 99.7% solution state | Cut-off, U | Sub-process (Ethanol, without water, in 95% solution state, from fermentation {RER}| ethanol production from rye | Cut-off, U) changed to (Ethanol, without water, in 95% solution state, from fermentation {SE}| ethanol production from wood | Cut-off, U) Wood inputs removed Changed to Nordic electricity | 250.5 kg |
For the modelling, the amount of bioethanol produced from 1 tonne of wood waste was based on ecoinvent factor inputs. According to ecoinvent, making 1 kg of bioethanol at 95% requires 3.80 kg of wood inputs. To dewater 95% ethanol to 99.7% ethanol by volume, every kilogram of the latter requires 1.0494 kg of 95% ethanol. Accordingly, wood inputs of 3.99 kg are needed for 1 kg of bioethanol at 99.7%. Hence, 1 tonne of wood waste can yield 250.5 kg of such bioethanol.
The process for creating ethanol from wood is a multi-output one, yielding 1 kWh of electricity for each kilogram of 95% ethanol. Emissions have been divided between electricity and wood by means of economic allocation.
5.2.5 S5: Biochar
The environmental impact of biochar production was modelled with generic ecoinvent data. The ecoinvent dataset for production of biochar was adjusted to represent Nordic conditions. For production of biochar from wood waste, the wood-material inputs were set to 0. A description of the data used, and the modifications is given below, in Table 26.
Table 26. Inputs and outputs of the biochar manufacturing scenario
| Manufacturing process | Source of inventory data | Modifications | Amount |
| Sorting of wood waste | See Section 5.1 | See Section 5.1 | 1,000 kg |
| Bioethanol production | Ethanol, without water, in 99.7% solution state, from fermentation {Europe without Switzerland}| dewatering of ethanol from biomass, from 95% to 99.7% solution state | Cut-off, U | Sub-process (Ethanol, without water, in 95% solution state, from fermentation {RER}| ethanol production from rye | Cut-off, U) changed to (Ethanol, without water, in 95% solution state, from fermentation {SE}| ethanol production from wood | Cut-off, U) Wood inputs removed Changed to Nordic electricity | 250.5 kg |
The amount of biochar produced from 1 tonne of wood waste was determined on the basis of ecoinvent factor inputs. According to ecoinvent, 1 kg of biochar requires 2.52 kg of wood inputs. Therefore, 396.4 kg of biochar can be produced from 1 tonne of wood waste.
5.2.6 S6: Textile fibre
The environmental impact of fibre production was modelled with generic ecoinvent data. The ecoinvent dataset employed is for global production, so we adjusted it to include only Nordic electricity as input. In addition, we modified the dataset to correspond to the system boundaries of the study, most importantly by removing wood feedstocks from the pulp‑production process inputs. A description of the data used, and the modifications is given below, in Table 27. Reviewing the literature revealed newly emerging technologies as a factor likely to disrupt the textile-fibre industry and respond to the increasing demand for naturally based fibres. Therefore, the modelling was based on the new production method with the highest use capacity in the Nordics, Spinnova. For the baseline wood-based textile-fibre process, viscose was chosen.
Table 27. Inputs and outputs of the textile fibre-manufacturing scenario
| Manufacturing process | Source of inventory data | Modifications | Amount |
| Sorting of wood waste | See Section 5.1 | See Section 5.1 | 1,000 kg |
| Fibre production | Fiber, viscose {GLO}| fiber production, viscose | Cut-off, U | Wood inputs removed Changed to Nordic electricity Assumed chemical inputs to be 0 Set hazardous-waste outputs to 0 | 758.4 kg |
The amount of textile fibre produced from 1 tonne of wood waste was determined on the basis of ecoinvent factor inputs. According to ecoinvent, manufacturing 1 kg of viscose textile fibre necessitates 1.32 kg of wood inputs, so 758.4 kg of textile fibre can be produced from a tonne of wood waste. To convert inputs from cubic metres to kilograms, we assumed a softwood wood-waste density of 400 kg/m3, which represents an average between spruce and pine stemwood, and for hardwoods we used 460 kg/m3, averaging birch, alder, aspen, and beech stemwood.[1]Alakangas, E. et al. (2016). Suomessa käytettävien polttoaineiden ominaisuuksia, VTT technical research center of Finland https://www.vttresearch.com/sites/default/filestemanord2022-539.pdftechnology/2016/T258.pdf. According to Lenzing, roughly 400kg of textile fibre can be made from 1 tonne of wood[2]Lenzing Group (2021). Focus paper, Lenzing Group, Wood and pulp. Available: https://www.lenzing.com/?type=88245&tx_filedownloads_file%5bfileName%5d=fileadmin/contenttemanord2022-539.pdf04_Nachhaltigkeit/Broschueren/EN/focus-paper-wood-pulp-EN.pdf. Part of the difference is explained by the assumptions of wood densities. This may underestimate the environmental impacts of wood-waste-based textile fibre.
Footnotes
- ^ Alakangas, E. et al. (2016). Suomessa käytettävien polttoaineiden ominaisuuksia, VTT technical research center of Finland https://www.vttresearch.com/sites/default/filestemanord2022-539.pdftechnology/2016/T258.pdf.
- ^ Lenzing Group (2021). Focus paper, Lenzing Group, Wood and pulp. Available: https://www.lenzing.com/?type=88245&tx_filedownloads_file%5bfileName%5d=fileadmin/contenttemanord2022-539.pdf04_Nachhaltigkeit/Broschueren/EN/focus-paper-wood-pulp-EN.pdf
5.2.7 S7: Incineration
The wood waste incineration scenario was constructed through the following sub-modules: sorting (including transportation from origin), transportation to the incineration facility, and incineration. Table 28 provides a description of the data sources and the modifications. Based on national statistics for heat and electricity production in Sweden and Finland, incinerating 1 tonne of wood waste would produce 4,323 kWh of energy of which 17% would be electricity and 83% heat. However, to ensure comparability, the amount of energy produced from one kg of wood for biomass heat and energy processes was used. The share of electricity and heat was chosen to be equal to national statics. Therefore incinerating 1 tonne of wood waste would produce 2,955 kWh energy of which 491 kWh electricity and 2,464 kWh heat. From both heat and electricity processes all wood inputs were removed and for heat process the electricity was changed to Nordic conditions.
Table 28. Inputs and outputs of the wood waste incineration scenario
| Manufacturing process | Source of inventory data | Modifications | Amount |
| Sorting of wood waste | See Section 5.1 | See Section 5.1 | 1,000 kg |
| Heat | Heat, district or industrial, other than natural gas {RoW}| heat production, wood chips from industry, at furnace 1000kW, state-of-the-art 2014 | Cut-off, U | Wood inputs removed Changed to Nordic electricity | 2,464 kWh |
| Electricity | Electricity, high voltage {SE}| heat and power co-generation, wood chips, 6667 kW, state-of-the-art 2014 | Cut-off, U | Wood inputs removed | 491 kWh |
5.3 Consequential LCI
In the CLCA, the environmental impacts are compared to substituting products per kg of product. A generic description of the consequential LCI modelling set-up is presented in Table 29. The two marginal-energy scenarios studied are detailed in greater depth in Subsection 5.3.1. After that, the LCI data used for each scenario’s substituting products are presented, in Subsection 5.3.2.
| Entry type | Source of inventory data | Amount |
| Input | Sorting of wood waste | Depends on scenario (see Section 5.1) |
| Input | Wood waste-based production | 1 representative unit (see Section 5.2) |
| Input | Marginal energy – depends on scenario | 2,955 kWh (see Subsection 5.3.1) |
| Avoided products | Substituting product – depends on scenario | 1 representative unit (see Subsection 5.3.2) |
| Avoided products | Incineration of wood waste | 2,955 kWh (see Subsection 5.2.7) |
Table 29. Consequential LCA entries for wood-waste-based products
5.3.1 Marginal energy
The ecoinvent factors used for the various marginal-energy scenarios are presented in Table 30. below. As the heat from biomass process was for rest of the world (RoW) geographical location while other inventory data was for Europe, it was was adjusted to represent Nordic conditions.
| Entry type | Source of inventory data | Amount |
| E1: Natural gas, heat | Heat, central or small-scale, natural gas {Europe without Switzer-land}| heat production, natural gas, at boiler atmospheric low-NOx non-modulating <100kW | Cut-off, U | 2,464 kWh |
| E1: Natural gas, electricity | Electricity, high voltage {FI}| electricity production, natural gas, conventional power plant | Cut-off, U | 491 kWh |
| E2: Biomass, heat | Heat, district or industrial, other than natural gas {RoW}| heat production, wood chips from industry, at furnace 1000kW, state-of-the-art 2014 | Cut-off, U | 2,464 kWh |
| E2: Biomass, electricity | Electricity, high voltage {SE}| heat and power co-generation, wood chips, 6667 kW, state-of-the-art 2014 | Cut-off, U | 491 kWh |
Table 30. Marginal-energy LCI entries
5.3.2 Substituting products
The ecoinvent factors applied for the various substituting products are presented in Table 31, below.
Table 31. LCI entries for substituting products
| Scenario | Substituting product | Inventory data source |
| S1 Particle board | Plasterboard | Gypsum plasterboard {CH}| production | Cut-off, U |
| S2 Composite | WPC board from virgin wood* | Residual wood, dry {RER}| fiberboard production, hard | Cut-off, U Polyethylene, high density, granulate, recycled {Europe without Switzerland}| polyethylene production, high density, granulate, recycled | Cut-off, U |
| S3 Insulation | Mineral wool (glass wool / rock wool) | Glass wool, fleece, production mix, at plant, density between 10 to 100 kg/m3 RER Rock wool, fleece, production mix, at plant, density between 30 to 180 kg/m3 RER |
| Polystyrene foam | Polystyrene foam slab with graphite, 6% recycled {CH}| processing | Cut-off, U | |
| S4 Bioethanol | Bioethanol from virgin wood | Ethanol, without water, in 95% solution state, from fermentation {SE}| ethanol production from wood | Cut-off, U |
| Bioethanol with the global production mix | **Ethanol, without water, in 99.7% solution state, from fermentation {GLO}| market for | Cut-off, U | |
| Petrol | Petrol, 5% ethanol by volume from biomass {CH}| production | Cut-off, U | |
| S5 Biochar | Charcoal, global production mix | Charcoal {GLO}| production | Cut-off, U |
| Peat moss | Peat moss {RoW}| peat moss production, horticultural use | Cut-off, U | |
| S6 Textile fibre | Viscose | Fibre, viscose {GLO}| fibre production, viscose | Cut-off, U |
| Cotton | Fibre, cotton {RoW}| fibre production, cotton, ginning | Cut-off, U | |
| * The WPC boards were simplified by assuming a share between wooden and plastic materials based on a common material compo-sition: Material district (2009). Wood plastic composite. Available: https://materialdistrict.com/material/wood-plastic-composite/ ** This factor does not include transportation, although it is a market factor | ||
6 The Life Cycle Impact Assessment and Its Interpretation
In this chapter, the LCIA results are presented and interpreted. The results from ALCA are presented in Section 0, and Section 0 outlines the CLCA results. These are followed by summary discussion of the most important environmental impacts. The chapter concludes with description of the sensitivity analysis, presented in Section 0. More detailed results can be found in Annex 1.
6.1 Attributional LCIA results
This section of the chapter presents the attributional LCIA results for each impact category.
6.1.1 Wood-waste markets: Transportation and sorting
The results for sorting of wood waste, including the associated transportation, are presented in Table 32. They are shown for tonne of wood-waste input to the system.
| Environmental impact category | Unit | Value per tonne of wood-waste input |
| GWP100 - fossil | kg CO2-eq | 11.0 |
| GWP100 - biogenic | kg CO2-eq | 0.88 |
| Acidification | mol H+ eq | 5.18E-02 |
| Eutrophication, freshwater | kg P eq | 7.62E-03 |
| Abiotic depletion (fossil fuels) | MJ | 134 |
| Ecosystems (damage assessment) | species.yr | 5.07E-08 |
| Water use | m3 | 1.85 |
Table 32. LCA results for wood waste’s transportation and sorting
6.1.2 S1: Particle board
The results for particle board’s production from wood waste are presented in Table 33 by tonne of wood-waste input to the system and per kilogram of final product.
| Environmental impact category | Unit | Value per tonne of wood waste input | Value per kg of product |
| GWP100 - fossil | kg CO2-eq | 271 | 0.29 |
| GWP100 - biogenic | kg CO2-eq | 228 | 0.24 |
| Acidification | mol H+ eq | 3.39 | 3.62E-03 |
| Eutrophication, freshwater | kg P eq | 3.75E-02 | 4.01E-05 |
| Abiotic depletion (fossil fuels) | MJ | 6,162 | 6.59 |
| Ecosystems | species.yr | 2.,32E-06 | 2.48E-09 |
| Water use | m3 | 349 | 0.37 |
Table 33. ALCA results for particle board
The contribution of sorting related to the treatment process represents <0.1%–20% of the impacts in particle-board production, having the smallest impact on damage to ecosystems and the largest impact on eutrophication. In the ALCA scenario for particle board, sorting represents 4% of the fossil GWP impact.
6.1.3 S2: Composite
The results for wood–plastic composite boards’ production from wood waste are presented Table 34 by tonne of wood-waste input to the system and per kilogram of final product.
| Environmental impact category | Unit | Value per tonne of wood waste input | Value per kg of product |
| GWP100 - fossil | kg CO2-eq | 1,877 | 1.03 |
| GWP100 - biogenic | kg CO2-eq | 939 | 0.52 |
| Acidification | mol H+ eq | 7.49 | 4.12E-03 |
| Eutrophication, freshwater | kg P eq | 0.29 | 1.60E-04 |
| Abiotic depletion (fossil fuels) | MJ | 2,572 | 1.41 |
| Ecosystems | species.yr | 1.33E-06 | 7.33E-10 |
| Water use | m3 | 72.2 | 3.97E-02 |
Table 34. ALCA results for composite
The contribution of sorting related to the treatment process represents 0.1%–5% of the impacts in WPC board production, having the smallest impact on acidification and the largest impact on abiotic depletion from fossil fuels. In the ALCA scenario for composite, sorting represents 0.6% of the fossil GWP impact. The reason for the large impact in the fossil GWP category is the use of plastic polymers in the material.
6.1.4 S3: Insulation
The results for producing insulation from wood waste are presented in Table 35 by tonne of wood-waste input to the system and per kilogram of final product.
| Environmental impact category | Unit | Value per tonne of wood waste input | Value per kg of product |
| GWP100 - fossil | kg CO2-eq | 28.2 | 0.028 |
| GWP100 - biogenic | kg CO2-eq | 5.84 | 5.84E-03 |
| Acidification | mol H+ eq | 1.43E-01 | 1.43E-04 |
| Eutrophication, freshwater | kg P eq | 1.24E-02 | 1.24E-05 |
| Abiotic depletion (fossil fuels) | MJ | 325 | 0.32 |
| Ecosystems | species.yr | 1.67E-07 | 1.67E-10 |
| Water use | m3 | 8.52 | 8.52E-03 |
Table 35. ALCA results for insulation
The contribution of sorting related to the treatment process represents 15%–62% of the impacts in the production of insulation made from wood, having the smallest impact on water use and the largest impact on abiotic depletion from fossil fuels. In the ALCA scenario for insulation, sorting represents 39% of the fossil GWP impact.
6.1.5 S4: Bioethanol
The results for producing bioethanol from wood waste are presented in Table 36 by tonne of wood-waste input to the system and per kilogram of final product.
| Environmental impact category | Unit | Value per tonne of wood waste input | Value per kg of product |
| GWP100 - fossil | kg CO2-eq | 120 | 0.48 |
| GWP100 - biogenic | kg CO2-eq | 1,338 | 5.34 |
| Acidification | mol H+ eq | 1.56 | 6.22E-03 |
| Eutrophication, freshwater | kg P eq | 1.21E-02 | 4.82E-05 |
| Abiotic depletion (fossil fuels) | MJ | 1,278 | 5.10 |
| Ecosystems | species.yr | 7.26E-07 | 2.90E-09 |
| Water use | m3 | 135 | 0.541 |
Table 36. ALCA results for bioethanol
The contribution of sorting related to the treatment process represents 0.1%–63% of the impacts in the production of bioethanol, having the smallest impact on water use and the largest impact on eutrophication. In the ALCA scenario for bioethanol, sorting represents 9% of the fossil GWP impact. The rest of the impacts come from chemicals, heat, and electricity.
6.1.6 S5: Biochar
The results for producing biochar from wood waste are presented in Table 37 by tonne of wood-waste input to the system and per kilogram of final product.
| Environmental impact category | Unit | Value per tonne of wood waste input | Value per kg of product |
| GWP100 - fossil | kg CO2-eq | 49.5 | 0.125 |
| GWP100 - biogenic | kg CO2-eq | 1,550 | 3.91 |
| Acidification | mol H+ eq | 2.52E-01 | 6.36E-04 |
| Eutrophication, freshwater | kg P eq | 1.99E-02 | 5.03E-05 |
| Abiotic depletion (fossil fuels) | MJ | 435 | 1.10 |
| Ecosystems | species.yr | 1.93E-06 | 4.86E-09 |
| Water use | m3 | 334 | 0.84 |
Table 37. ALCA results for biochar
The contribution of sorting related to the treatment process represents 0.1%–38% of the impacts in the production of biochar, having the smallest impact on biogenic GWP and the largest impact on eutrophication. In the ALCA scenario for biochar, sorting represents 22% of the fossil GWP impact while the rest is due mainly to heat and electricity needs.
6.1.7 S6: Textile fibre
The results for producing textile fibre from wood waste are presented in Table 38 by tonne of wood-waste input to the system and per kilogram of final product.
| Environmental impact category | Unit | Value per tonne of wood waste input | Value per kg of product |
| GWP100 - fossil | kg CO2-eq | 1,041 | 1.37 |
| GWP100 - biogenic | kg CO2-eq | 1,351 | 1.78 |
| Acidification | mol H+ eq | 8.00 | 1.05E-02 |
| Eutrophication, freshwater | kg P eq | 2.72E-01 | 3.59E-04 |
| Abiotic depletion (fossil fuels) | MJ | 9,841 | 13.0 |
| Ecosystems | species.yr | 6.02E-06 | 7.94E-09 |
| Water use | m3 | 1,883 | 2.48 |
Table 38. ALCA results for textile fibre
The contribution of sorting related to the treatment process represents 0.1%–2.8% of the impacts in the production of textile fibre, having the smallest impact on water use and the largest impact on eutrophication. In the ALCA scenario for textile fibre, process heating needs represent roughly 84% of the fossil global warming potential impact, followed by pulp production (11%), electricity needs (3%), sorting (1.1%), and other needs.
6.1.8 S7: Incineration
The results for wood-waste incineration are presented in Table 39. The figures shown are per tonne of wood-waste input and for 1 kWh of energy produced.
| Environmental impact category | Unit | Value per tonne of wood waste input | Value per kg of product |
| GWP100 - fossil | kg CO2-eq | 26.8 | 9.05E-03 |
| GWP100 - biogenic | kg CO2-eq | 1,940 | 0.66 |
| Acidification | mol H+ eq | 2.90E+00 | 9.83E-04 |
| Eutrophication, freshwater | kg P eq | 1.11E-02 | 3.75E-06 |
| Abiotic depletion (fossil fuels) | MJ | 170 | 5.75E-02 |
| Ecosystems | species.yr | 8.51E-07 | 2.88E-10 |
| Water use | m3 | 5.01 | 1.70E-03 |
Table 39. ALCA results for incineration of wood waste
The contribution of sorting related to the treatment process represents 0.1%–53% of the impacts in the incineration scenario, having the smallest impact on ecosystem damage and the largest impact on abiotic depletion from fossil fuels. In the ALCA scenario for incineration, sorting represents 50% of the fossil GWP impact.
6.1.9 Marginal energy
The results for the marginal-energy scenarios studied are presented in Table 40 for the amount of energy equivalent to incinerating one tonne of wood waste.
| Environmental impact category | Unit | Value per tonne of wood waste input | Value per kg of product |
| GWP100 - fossil | kg CO2-eq | 1,126 | 126 |
| GWP100 - biogenic | kg CO2-eq | 2.85 | 2,089 |
| Acidification | mol H+ eq | 1.52 | 3.66 |
| Eutrophication, freshwater | kg P eq | 2.48E-02 | 3.79E-02 |
| Abiotic depletion (fossil fuels) | MJ | 17,122 | 1,508 |
| Ecosystems | species.yr | 3.61E-06 | 5.18E-06 |
| Water use | m3 | 56.1 | 109 |
Table 40. Results for the two marginal-energy scenarios
Natural gas has a bigger impact on fossil global warming potential and abiotic depletion while biomass has a proportionally greater impact in relation to biogenic global warming potential, acidification, eutrophication, ecosystem damage, and water use.
6.2 Consequential LCIA results
The consequential LCA results are in this Section presented separately in graphs for each impact category assessed. The detailed results in tables are presented in Annex 1.
6.2.1 Global warming potential
The consequential LCA results for global warming potential are shown below for all scenarios studied, for the E1 marginal-energy scenario (with natural gas) in Figure 9 and the E2 scenario (biomass) in Figure 10.
Figure 9. A comparison of GWP (fossil) between the scenarios studied and the substituting products (‘SP’), with marginal-energy scenario E1 (natural gas) assumed. The impact of energy, either marginal energy or incineration, is presented in yellow, and the impact of production is shown in blue.
The production of wood-waste-based particle board has a much larger climate impact than plasterboard production. It has more significant global warming potential even before the contribution of the marginal energy based on natural gas is considered, although the biggest difference is visible when the marginal energy is taken into account.
The production of boards made of virgin-wood-based composite has a slightly larger climate impact than the production of wood-waste-based composite boards before the effect of marginal energy is added. However, when marginal energy based on natural gas is assumed, the latter composite boards display a much higher figure for global warming potential than corresponding virgin-wood-based boards do.
Production of mineral wool and polystyrene foam have a much larger climate impact than does production of wood-waste-based insulation, before the contribution of marginal energy is added, especially relative to mineral wool. Once the marginal-energy scenario involving natural gas is factored in, the GWP figure is still higher for mineral wool and polystyrene foam.
For bioethanol, the impacts from only production are quite similar across all scenarios studied, but with the marginal-energy scenario using natural gas the wood-waste-based bioethanol product shows the highest GWP figures. However, with regard to fuels it is important to note that the use phase has a significant impact on overall global warming potential. Fossil petrol emits roughly 2.9 kg CO2-eq / kg petrol[1]UK Department for Business, Energy & Industrial Strategy (Defra) (2021). Conversion factors 2021, available: https://www.gov.uk/government/publications/greenhouse-gas-reporting-conversion-factors-2021., corresponding to 470 kg CO2‑eq for the amount of bioethanol produced from a tonne of wood waste. Fuels of biogenic origin have zero fossil CO2 emissions, and their methane and dinitrogen oxide emissions come to around 0.01 kg CO2-eq / kg[2]UK Department for Business, Energy & Industrial Strategy (Defra) (2021). Conversion factors 2021, available: https://www.gov.uk/government/publications/greenhouse-gas-reporting-conversion-factors-2021., corresponding to 3 kg CO2-eq per tonne of wood-waste-based bioethanol. Without marginal energy, taking this WTW life-cycle approach to fuels indicates that bioethanol from wood waste has the smallest GWP impact. When marginal energy is considered, bioethanol from wood waste carries the burden of impacts from natural gas.
Biochar from wood waste has the smallest impacts from production when compared to biochar from virgin wood and peat moss. When marginal energy based on natural gas is assumed, wood-waste-based biochar has a much higher GWP figure than these substituting products, however.
As for the final main scenario, textile fibre from wood waste has the second-largest climate impact when natural gas is employed for marginal energy. Viscose has the greatest GWP impact and cotton the smallest. When only the production angle is considered, textile fibre created from wood waste is the product with the smallest impact.
Footnotes
- ^ UK Department for Business, Energy & Industrial Strategy (Defra) (2021). Conversion factors 2021, available: https://www.gov.uk/government/publications/greenhouse-gas-reporting-conversion-factors-2021.
- ^ UK Department for Business, Energy & Industrial Strategy (Defra) (2021). Conversion factors 2021, available: https://www.gov.uk/government/publications/greenhouse-gas-reporting-conversion-factors-2021.
Figure 10. A comparison of GWP (fossil) between the scenarios studied and the substituting products (‘SP’), with marginal-energy scenario E2 (biomass) assumed. The impact of energy, either marginal energy or incineration, is presented in yellow, and the impact of production is shown in blue.
Marginal energy based on biomass contributes much less to global warming potential than marginal energy involving natural gas. However, as Figure 10 clarifies, the climate impact of wood-waste-based particle board is still larger than that of plasterboard.
For composite boards produced from wood waste, the global warming potential is slightly lower than the corresponding figure for boards based on virgin wood when the marginal‑energy scenario involving biomass rather than natural gas is assumed; however, the difference between scenarios is very small. Wood-waste-based insulation represents a much smaller climate impact than do the insulation products potentially substituted for.
The marginal-energy choice has a large impact on how advantageous wood-waste-based production of bioethanol, biochar, and textile fibre material seems. Bioethanol produced from wood waste still has the strongest influence on global warming potential, but with much smaller difference. For the biochar-related scenarios too, the differences in global warming potential are small, and, since wood-waste-based biochar has the lowest climate impact from production, assuming marginal energy with lower emissions could make it the most attractive alternative.
For textile fibre with biomass as the source of marginal energy, wood-waste-based production seems to be the most advantageous approach to creation of the fibre.
6.2.2 Biogenic global warming potential
The figures below present the results of consequential LCA for biogenic-carbon-related GWP for all scenarios examined. They consider marginal-energy option E1, natural gas (Figure 11), and E2, biomass (Figure 12).
Figure 11. A comparison of GWP (biogenic) between the scenarios studied and the substituting products (‘SP’), with marginal-energy scenario E1 (natural gas) assumed. The impact of energy, either marginal energy or incineration, is presented in yellow, and the impact of production is shown in blue.
Because the substitution scenarios carry the burden of wood-waste incineration, all of them suffer from relatively high biogenic emissions when the marginal energy comes from natural gas, which has low biogenic emissions. In the natural-gas marginal-energy scenario, most wood-waste-based products outperform the products they substitute for.
Figure 12. A comparison of GWP (biogenic) between the scenarios studied and the substituting products (‘SP’), with marginal-energy scenario E2 (biomass) assumed. The impact of energy, either marginal energy or incineration, is presented in yellow, and the impact of production is shown in blue.
With biomass as the marginal-energy source, the wood-waste-based scenarios all have higher biogenic emissions than the substitution scenarios, apart from viscose. Again, the importance of the marginal-energy selection with regard to global warming potential is highlighted.
6.2.3 Acidification
The consequential LCA results for acidification are shown below for all of the scenarios studied – with E1 marginal energy (natural gas) in Figure 13 and E2 (biomass) in Figure 14.
Figure 13. A comparison of acidification between the scenarios studied and the substituting products (‘SP’), with marginal-energy scenario E1 (natural gas) assumed. The impact of energy, either marginal energy or incineration, is presented in yellow, and the impact of production is shown in blue.
From an acidification perspective, where natural gas serves as the source of marginal energy, the wood-waste-based composite, insulation, bioethanol, biochar, and textile fibre all outperform the products they substitute for. Only particle board displays (slightly) more acidification impact than plasterboard.
Figure 14. A comparison of acidification between the scenarios studied and the substituting products (‘SP’), with marginal-energy scenario E2 (biomass) assumed. The impact of energy, either marginal energy or incineration, is presented in yellow, and the impact of production is shown in blue.
When the marginal energy comes from biomass, the acidification is greater for all scenarios studied, but wood-waste-based composite, insulation, and textile fibre still outperform the products they substitute for. Bioethanol and biochar both outperform at least one of the substitution candidates studied. The marginal-energy scenarios studied have a fairly small impact on the acidification results.
6.2.4 Freshwater eutrophication
The results of consequential LCA for freshwater eutrophication are shown below for E1 marginal energy, natural gas (in Figure 15), and for E2 marginal energy, biomass (Figure 16). The figures cover all of the scenarios considered.
Figure 15. A comparison of freshwater eutrophication between the scenarios studied and the substituting products (‘SP’), with marginal-energy scenario E1 (natural gas) assumed. The impact of energy, either marginal energy or incineration, is presented in yellow, and the impact of production is shown in blue.
For freshwater eutrophication when natural gas is assumed to address marginal energy, the composite and textile-fibre scenarios all have quite big impacts; however, composite and textile fibre from wood waste outperform the products they substitute for. For all the other scenarios, the eutrophication impacts are quite small.
Figure 16. A comparison of freshwater eutrophication between the scenarios studied and the substituting products (‘SP’), with marginal-energy scenario E2 (biomass) assumed. The impact of energy, either marginal energy or incineration, is presented in yellow, and the impact of production is shown in blue.
The marginal-energy scenarios studied do not differ significantly in eutrophication impact. With biomass for marginal energy, the eutrophication effects are fairly similar to those in conditions wherein natural gas addresses the marginal energy.
6.2.5 Abiotic depletion
The graphs below show the consequential LCA results for abiotic depletion with regard to marginal energy for all scenarios studied: E1 (natural gas) in Figure 17 and E2 (biomass) in Figure 18.
Figure 17. A comparison of abiotic depletion between the scenarios studied and the substituting products (‘SP’), with marginal-energy scenario E1 (natural gas) assumed. The impact of energy, either marginal energy or incineration, is presented in yellow, and the impact of production is shown in blue
Quite predictably, natural gas for marginal energy has a large impact on abiotic depletion of fossil fuels. Wood-waste-based particle board and insulation display a smaller impact than the products they substitute for, while the other have a larger one.
Figure 18. A comparison of abiotic depletion between the scenarios studied and the substituting products (‘SP’), with marginal-energy scenario E2 (biomass) assumed. The impact of energy, either marginal energy or incineration, is presented in yellow, and the impact of production is shown in blue.
For E2 marginal-energy conditions (with biomass), alongside particle board and insulation the composite and textile-fibre products have a smaller impact than the products they substitute for. Bioethanol from wood waste outperforms petrol but has a larger impact than the other substitution candidates.
6.2.6 Damage to ecosystems
Below, the consequential LCA results for damage to ecosystems are shown for all scenarios, for marginal energy E1 (natural gas) in Figure 19 and E2 (biomass) in Figure 20.
Figure 19. A comparison of ecosystem damage between the scenarios studied and the substituting products (‘SP’), with marginal-energy scenario E1 (natural gas) assumed. The impact of energy, either marginal energy or incineration, is presented in yellow, and the impact of production is shown in blue.
When natural gas is the marginal-energy choice, wood-waste-based products have smaller impacts on ecosystem damage in the domains of particle board, composite, insulation, and textile fibre. Bioethanol and biochar outperform at least one of the substitution candidates studied. In all other scenarios, except the textile-fibre one, the majority of the wood-waste-based product’s impact comes from the marginal energy. From an ecosystem standpoint, cotton fibre has by far the biggest impact, with the impacts proving quite significant also for viscose, plasterboard, mineral wool, and polystyrene foam.
Figure 20. A comparison of ecosystem damage between the scenarios studied and the substituting products (‘SP’), with marginal-energy scenario E2 (biomass) assumed. The impact of energy, either marginal energy or incineration, is presented in yellow, and the impact of production is shown in blue.
When biomass is used for marginal energy, the negative ecosystem impacts of the wood‑waste-based products grow because biomass has a bigger impact on ecosystem damage than does the use of natural gas. Particle board, insulation, and textile fibre remain better options than the products they could replace, but the difference is smaller. For wood‑waste-based composite, the impacts become somewhat larger than those of composite created from virgin wood.
6.2.7 Water use
Figure 21 presents the consequential LCA results for all scenarios studied with regard to water use in E1 (natural gas) marginal-energy conditions, and Figure 22 presents the corresponding details for E2 (biomass) conditions.
Figure 21. A comparison of water use between the scenarios studied and the substituting products (‘SP’), with marginal-energy scenario E1 (natural gas) assumed. The impact of energy, either marginal energy or incineration, is presented in yellow, and the impact of production is shown in blue. The upper figure presents the results for all scenarios studied. In the lower picture, the result for textile fiber scenarios (S6) are excluded to more clearly present the results for the scenarios S1-S5 with smaller impacts.
As one can see from Figure 21, cotton production uses the most water, by a large margin. Water use is significant for viscose and textile fibre produced from wood waste also, with the latter having the smallest impact. From a water-use perspective, composite and insulation from wood waste have a smaller impact than the products they substitute for. The difference between the wood waste-based and the substituting scenarios is small in the cases of particle board and biochar. As for the bioethanol scenario, petrol uses the least water while bioethanol from the global mix consumes the most. Marginal-energy natural gas has an impact of roughly 56 m3 while incineration has a water-use impact of 5 m3.
Figure 22. A comparison of water use between the scenarios studied and the substituting products (‘SP’), with marginal-energy scenario E2 (biomass) assumed. The impact of energy, either marginal energy or incineration, is presented in yellow, and the impact of production is shown in blue. The upper figure presents the results for all scenarios studied. In the lower picture, the result for textile fiber scenarios (S6) are excluded to more clearly present the results for the scenarios S1-S5 with smaller impacts.
Using biomass for marginal energy consumes twice as much water as the use of natural gas, or roughly 110 m3. Still, composite, insulation, and textile fibre from wood waste display better water use than the products they substitute for. From a water-use perspective, the most significant improvement can be achieved by substituting wood‑waste‑based textile fibre for cotton fibre.
6.3 The most important environmental impacts in summary
Table 41 outlines the ALCA results for one tonne of wood waste for all scenarios considered. As the colouring elucidates, producing insulation from wood waste appears to be a good alternative to incinerating wood waste, having quite similar impacts across all categories – apart from biogenic GWP, for which insulation outperforms incineration, and abiotic depletion, in which insulation has roughly twice the impact of incineration. Bioethanol displays advantages in some impact categories when compared to incineration, but the differences are quite small and more accurate case-by-case analysis would be needed for verification. Biochar has a smaller impact on biogenic GWP and acidification than does incineration, with particle board showing the second-smallest impact on biogenic GWP (that of insulation is the smallest) and the second largest impact on abiotic depletion. Composite represents the largest impacts in the fossil GWP and eutrophication categories, and textile fibre is the biggest contributor to acidification, abiotic depletion, ecosystem damage, and water use.
Table 41. ALCA results of different treatment methods per one tonne of wood waste
| Environmental impact category | Unit | Particle board | Composite | Insulation | Bioethanol | Biochar | Textile fibre | Incineration |
| GWP100 - fossil | kg CO2-eq | 271 | 1.877 | 28 | 120 | 50 | 1.041 | 27 |
| GWP100 - biogenic | kg CO2-eq | 228 | 939 | 6 | 1.338 | 1.550 | 1.351 | 1.940 |
| Acidification | mol H+ eq | 3,39 | 7,49 | 0,14 | 1,56 | 0,25 | 8,00 | 2,90 |
| Eutrophication, freshwater | kg P eq | 3,75E-02 | 2,90E-01 | 1,24E-02 | 1,21E-02 | 1,99E-02 | 2,72E-01 | 1,11E-02 |
| Abiotic depletion (fossil fuels) | MJ | 6.162 | 2.572 | 325 | 1.278 | 435 | 9.841 | 170 |
| Ecosystems | species.yr | 2,3E-06 | 1,3E-06 | 1,7E-07 | 7,3E-07 | 1,9E-06 | 6,0E-06 | 8,5E-07 |
| Water use | m3 | 349 | 72,2 | 8,52 | 135 | 334 | 1.883 | 5,01 |
This study crystallised the differences among the production methods, relative to incineration, in the near term. It did not consider releases that occur in later stages of the products’ life cycle – namely, the use phase and end of life. These stages lay outside the system boundaries delimited for the study. Depending on the length of the life cycle of the products studied, the environmental advantages could extend for quite different spans of time. Research that includes the use and end-of-life parts of the life cycle is recommended.
When the substituting products and marginal energy are taken into consideration, other production routes too appear to show good environmental performance when compared to incineration. The LCIA results are summarised in Table 42 and Table 43 via the difference between the substituting scenario and the wood-waste scenario. In these tables, a positive value (with a green arrow) indicates that the wood-waste-based product has a smaller environmental impact, a negative value (with a grey arrow) denotes the wood‑waste‑based product having a bigger one, and yellow arrows show effects of ±20% as minor changes in the system might tip the results one way or the other
Table 42. CLCA results for the difference between the wood-waste scenario and each substituting scenario with E1 (natural gas) for marginal energy
| Environ|mental impact category | Unit | Particle board | Compo|site | Insulation | Bioethanol | Biochar | Textile fibre | |||||
| Plaster|board | Compo|site from virgin wood | Mineral wool | Polysty|rene foam | Bioethanol from virgin wood | Petrol | Bioetha|nol global mix | Biochar from virgin wood | Peat moss | Viscose | Cotton | ||
| GWP100 - fossil | kg CO2-eq | ↓ -90% | ↓ -33% | ↑ 181% | ↑ 59% | ↓ -88% | ↓ -91% | ↓ -83% | ↓ -86% | ↓ -90% | → 3% | ↓ -31% |
| GWP100 - biogenic | kg CO2-eq | ↑ 757% | ↑ 206% | ↑ 22239% | ↑ 22683% | ↑ 140% | ↑ 45% | ↑ 92% | ↑ 125% | ↑ 25% | ↑ 160% | ↑ 44% |
| Acidifi|ca|tion | mol H+ eq | ↓ -27% | ↑ 115% | ↑ 1591% | ↑ 481% | ↑ 46% | ↑ 29% | ↑ 137% | ↑ 99% | ↑ 65% | ↑ 154% | ↑ 315% |
| Eutro|phi|ca|tion, freshwater | kg P eq | ↓ -29% | ↑ 268% | ↓ -68% | ↑ 164% | ↓ -33% | ↓ -62% | ↑ 130% | → -8% | ↓ -72% | ↑ 170% | ↑ 406% |
| Abiotic depletion (fossil fuels) | MJ | ↑ 238% | ↓ -40% | ↑ 122% | ↑ 125% | ↓ -92% | ↓ -57% | ↓ -87% | ↓ -94% | ↓ -99% | → -10% | ↓ -51% |
| Eco|systems | species.yr | ↑ 334% | → 11% | ↑ 227% | ↑ 284% | ↑ 28% | ↓ -67% | ↑ 39% | ↑ 27% | ↓ -77% | ↑ 94% | ↑ 396% |
| Water use | m3 | ↓ -27% | ↑ 419% | ↑ 864% | ↑ 337% | ↓ -29% | ↓ -97% | ↑ 750% | → -12% | ↓ -99% | ↑ 27% | ↑ 1161% |
Table 43. CLCA results for the difference between the wood-waste scenario and each substituting scenario with E2 (biomass) for marginal energy
| Environ|mental impact category | Unit | Particle board | Compo|site | Insulation | Bioethanol | Biochar | Textile fibre | |||||
| Plaster|board | Compo|site from virgin wood | Mineral wool | Polysty|rene foam | Bioethanol from virgin wood | Petrol | Bioetha|nol global mix | Biochar from virgin wood | Peat moss | Viscose | Cotton | ||
| GWP100 - fossil | kg CO2-eq | ↓ -66% | → 1% | ↑ 2010% | ↑ 1090% | ↓ -38% | ↓ -54% | → -14% | → -6% | ↓ -36% | ↑ 91% | ↑ 29% |
| GWP100 - biogenic | kg CO2-eq | → -15% | → -5% | → -7% | ↓ -6% | → -6% | ↓ -43% | ↓ -25% | → -4% | ↓ -47% | → 2% | ↓ -43% |
| Acidifi|ca|tion | mol H+ eq | ↓ -49% | ↑ 73% | ↑ 639% | ↑ 154% | → -14% | ↓ -24% | ↑ 40% | → -10% | ↓ -25% | ↑ 107% | ↑ 239% |
| Eutro|phi|ca|tion, freshwater | kg P eq | ↓ -41% | ↑ 253% | ↓ -76% | ↑ 95% | ↓ -50% | ↓ -72% | ↑ 69% | ↓ -29% | ↓ -79% | ↑ 159% | ↑ 385% |
| Abiotic depletion (fossil fuels) | MJ | ↑ 925% | ↑ 190% | ↑ 2014% | ↑ 2040% | ↓ -46% | ↑ 182% | → -16% | ↓ -42% | ↓ -89% | ↑ 113% | → 16% |
| Eco|systems | species.yr | ↑ 244% | → -16% | ↑ 131% | ↑ 172% | → -6% | ↓ -76% | → 2% | → -1% | ↓ -82% | ↑ 67% | ↑ 327% |
| Water use | m3 | ↓ -35% | ↑ 267% | ↑ 429% | ↑ 140% | ↓ -44% | ↓ -98% | ↑ 565% | ↓ -23% | ↓ -99% | ↑ 24% | ↑ 1128% |
The results suggest that particle board from wood waste seems to be a worse option than plasterboard in all impact categories except abiotic depletion and ecosystem impacts. For biogenic GWP, the results depend on the source of marginal energy chosen, with wood‑waste-based production being a better alternative when its source is natural gas and with plasterboard representing the better option when biomass covers the marginal energy, though the difference is quite small with regard to the latter.
Composite from virgin wood is a borderline case, yielding quite similar or better environmental performance in some categories and worse in others, depending on the marginal-energy scenario assumed. The wood-waste-based product has a smaller impact on acidification, eutrophication, and water use in both marginal-energy scenarios. As there is no agreed-upon method of summing the various impacts together, the conclusion hinges on how the environmental impacts are weighted in the analysis. If marginal energy with even smaller environmental impacts were used, wood-waste-based composite might become a compelling alternative for addressing all categories of environmental impact studied.
For insulation, the CLCA results confirm what one might already expect from the ALCA findings: insulation produced from wood waste outperforms insulation created from mineral wool or from polystyrene foam in nearly all impact categories considered. That said, when biomass is used as the source of marginal energy, the biogenic GWP impacts are bigger for the wood-waste-based insulation, and there is a larger impact on eutrophication relative to the effects of mineral wool in both marginal-energy scenarios.
For bioethanol, when natural gas is used for marginal energy, wood-waste-based bioethanol has a smaller impact on biogenic GWP and acidification than do all substituting products studied and also a smaller eutrophication, ecosystem, and water-use impact when compared to the global bioethanol mix. With biomass for marginal energy, wood-waste-based bioethanol shows advantages only when compared to the global bioethanol mix, having a smaller impact on acidification, eutrophication, ecosystem damage, and water use (the impacts are quite similar in the other impact categories). Were fuels’ use phase to be taken into account, however, petrol would manifest significantly higher fossil greenhouse-gas emissions. From this perspective, ethanol based on wood waste is likely to be a better choice than petrol, at least when biomass is used to replace the energy that would have been produced via incineration of wood waste. As bioethanol has the shortest life cycle of all products studied in our scenarios, considering only the production stage and neglecting the use stage could lead interpretation astray, at least from a life-cycle environmental perspective.
The results suggest that biochar from wood waste is not a convincing alternative to the substituting products examined when biomass is used for marginal energy – it has larger impacts in all of the impact categories studied. With natural gas as the source of marginal energy, wood-waste-based biochar has a smaller impact on biogenic GWP and on acidification when compared to both peat moss and biochar from virgin wood, and also it displays a smaller impact on ecosystems than the latter does.
Textile fibre from wood waste is a good alternative to both viscose and cotton when biomass is used for marginal energy, although the biogenic GWP impact of the wood‑waste‑based product is larger than that for cotton and almost the same as that of viscose. When natural gas is chosen for marginal energy, wood-waste-based textile fibre could still be a better option, but this depends on how the analysis weights the individual types of environmental impact. Textile fibre from wood waste has a larger impact on global warming potential and abiotic depletion than cotton, and its impacts are quite similar to those of viscose. Water consumption is a critical environmental issue associated with textile fibres, and from this perspective wood-waste-based production offers significant improvements in performance. As in the case of all products, there are better- and worse‑performing variations on the market; for example, the environmental impacts of viscose vary greatly between producers.
Figure 23 compares the marginal-energy scenarios studied to the incineration scenario.
Figure 23. Comparison of incineration to marginal energy scenarios E1 natural gas and E2 biomass. Due to different environmental impacts having different units, the scenario with the largest impact is always scaled to 100%.
As the figure above attests, incineration of wood waste has the smallest impact across all categories of environmental impact studied except biogenic global warming potential and acidification, for which natural gas has the lowest impact. Natural gas shows the largest impact on fossil global warming potential and abiotic depletion of fossil fuels, while biomass from wood has the biggest impact on biogenic global warming potential, acidification, freshwater eutrophication, ecosystem damage, and water consumption.
6.4 Sensitivity analyses
6.4.1 Sensitivity analysis 1: Additional transportation of wood waste
To assess the validity of the assumption that conveying the wood waste from its source to sorting requires 50 km of transportation, we considered the impact of a significantly longer transportation distance. For this, we chose wood-waste transportation over an additional 500 km with the same ecoinvent factor that was included for the sorting process. The results for longer-distance transportation of wood waste are presented in Table 44 for tonne of wood waste entering the system.
| Environmental impact category | Unit | Value per tonne of wood-waste input |
| GWP100 - fossil | kg CO2-eq | 35.7 |
| GWP100 - biogenic | kg CO2-eq | 4.48E-02 |
| Acidification | mol H+ eq | 1.21E-01 |
| Eutrophication, freshwater | kg P eq | 1.44E-04 |
| Abiotic depletion (fossil fuels) | MJ | 500 |
| Ecosystems (damage assessment) | species.yr | 1.44E-07 |
| Water use | m3 | -0.05 |
Table 44. LCA results for transportation of wood waste
The results show that even a considerably longer transportation distance would not alter the magnitude of the environmental performance of the wood-waste-based products studied.
6.4.2 Sensitivity analysis 2: Average vs. residual energy
For the base scenario, the study employed a location-based approach wherein a Nordic average energy mix is assumed. To evaluate the variability of the results, a sensitivity analysis of the energy scenario was conducted wherein we changed the electricity mix considered to a Nordic residual energy mix (2020). With the latter, the emission factor for GWP is 365.27 g CO2-eq / kWh (in contrast against the 55.7 g CO2-eq / kWh from the Nordic average electricity mix). For the particle board production, the total GWP was 9% higher.
6.4.3 Sensitivity analysis 3: The PEF B factor
The Circular Footprint Formula (CFF), set forth in the EU framework for judging product environmental footprint (PEF), defines the rule for allocating the environmental burdens and benefits of recycling/recovering energy between the supplier and user of recycled materials.[1]Zampori, L., Pant, R. (2019). Suggestions for updating the Product Environmental Footprint (PEF) method. JRC Technical Reports. https://eplca.jrc.ec.europa.eu/permalink/PEF_method.pdf. The CFF considers specific emissions and resources consumed in connection with the material, energy, and disposal.
This study’s ALCA scenario work did not utilise the CFF for allocation of burdens and benefits, because we took a cut-off approach that assigns no benefits to recycling-based products for avoiding virgin-material-based production. The analysis with CLCA scenarios assumed 1:1 substitution, thus assigning the benefits from the production of the avoided substituting product to the recycling-based product. Also, the burdens and benefits are fully assigned to the incinerated wood waste (within the system limits considered). This is in accordance with the PEF, wherein a default value of 0 should be used for the B factor, a parameter that can be used to allocate only a portion of the burdens and benefits of energy recovery to the waste treatment. With a B factor of 0, however, the LCA results might create an inappropriate climate-based incentive for incineration.[2]Ekvall, T., Gottfridsson, M., Nellstr, M., Nilsson, J., Rydberg, M., Rydberg, T. (2021). Modelling incineration for more accurate comparisons to recycling in PEF and LCA. Waste Management 136 153–161. The effect of changing the allocation factor from B = 0 to B = 0.5, whereby 50% of the burdens and benefits of energy recovery gets allocated to elements outside the system boundaries of the scenarios studied, was modelled for the composite, bioethanol, and textile-fibre scenarios.
These results are presented in Table 45 and Table 46, showing the difference between the substituting scenario and the wood-waste scenario. In these tables too, a positive value (with a green arrow) indicates that the wood-waste-based product has a less extensive environmental impact, a negative value (a grey arrow) means that said product has a bigger one, and yellow arrows denote ±20% levels – minor changes in the system might tip the results in one or the other direction.
Footnotes
- ^ Zampori, L., Pant, R. (2019). Suggestions for updating the Product Environmental Footprint (PEF) method. JRC Technical Reports. https://eplca.jrc.ec.europa.eu/permalink/PEF_method.pdf.
- ^ Ekvall, T., Gottfridsson, M., Nellstr, M., Nilsson, J., Rydberg, M., Rydberg, T. (2021). Modelling incineration for more accurate comparisons to recycling in PEF and LCA. Waste Management 136 153–161.
Table 45. PEF results for the difference between the wood-waste scenario and each substituting scenario, with a B factor of 0.5 and marginal-energy scenario E1 (natural gas)
| Environ|mental impact category | Unit | Composite | Bioethanol | Textile fibre | |||
| Composite from virgin wood | Bioethanol from virgin wood | Petrol | Bioethanol global mix | Viscose | Cotton | ||
| GWP100 - fossil | kg CO2-eq | → -18% | ↓ -80% | ↓ -85% | ↓ -71% | ↑ 38% | → -7% |
| GWP100 - biogenic | kg CO2-eq | ↑ 103% | ↑ 68% | ↓ -27% | ↑ 20% | ↑ 88% | ↓ -27% |
| Acidifi|ca|tion | mol H+ eq | ↑ 117% | ↑ 32% | → 9% | ↑ 152% | ↑ 160% | ↑ 335% |
| Eutro|phi|ca|tion, freshwater | kg P eq | ↑ 281% | ↓ -21% | ↓ -65% | ↑ 223% | ↑ 180% | ↑ 426% |
| Abiotic depletion (fossil fuels) | MJ | → 6% | ↓ -85% | ↓ -21% | ↓ -77% | ↑ 31% | ↓ -29% |
| Ecosystems | species.yr | ↑ 61% | ↑ 103% | ↓ -61% | ↑ 122% | ↑ 134% | ↑ 505% |
| Water use | m3 | ↑ 562% | → -18% | ↓ -98% | ↑ 894% | ↑ 29% | ↑ 1180% |
Table 46. PEF results for the difference between the wood-waste scenario and each substituting scenario, with a B factor of 0.5 and marginal-energy scenario E2 (biomass)
| Environ|mental impact category | Unit | Composite | Bioethanol | Textile fibre | |||
| Composite from virgin wood | Bioethanol from virgin wood | Petrol | Bioethanol global mix | Viscose | Cotton | ||
| GWP100 - fossil | kg CO2-eq | → 3% | ↓ -25% | ↓ -46% | → 8% | ↑ 77% | → 19% |
| GWP100 - biogenic | kg CO2-eq | → -4% | → -6% | ↓ -59% | ↓ -32% | ↑ 85% | ↓ -28% |
| Acidifi|ca|tion | mol H+ eq | ↑ 92% | → -10% | ↓ -25% | ↑ 72% | ↑ 150% | ↑ 318% |
| Eutro|phi|ca|tion, freshwater | kg P eq | ↑ 273% | ↓ -38% | ↓ -72% | ↑ 155% | ↑ 65% | ↑ 211% |
| Abiotic depletion (fossil fuels) | MJ | ↑ 254% | ↓ -30% | ↑ 282% | → 11% | ↑ 98% | → 8% |
| Ecosystems | species.yr | ↑ 29% | ↑ 55% | ↓ -70% | ↑ 70% | ↑ 160% | ↑ 573% |
| Water use | m3 | ↑ 423% | ↓ -30% | ↓ -98% | ↑ 755% | ↑ 28% | ↑ 1167% |
When compared to the results with B = 0 (depicted in Table 42 and Table 43), there is no significant change for the textile-fibre scenarios, although wood-waste-based textile fibre becomes even better in most of the impact categories. The reason behind the small magnitude of the change is the relatively large impacts from the production phase. Also, composite from wood waste becomes a better option than composite from virgin wood in terms of abiotic depletion when natural gas is used as marginal energy; in fact, it has a smaller impact in all respects except with regard to fossil GWP. When biomass is assumed to be the marginal-energy source, composite based on wood waste has a smaller impact in all categories apart from biogenic GWP. With natural gas for marginal energy, wood-waste-based bioethanol remains quite similar in impact to bioethanol from virgin wood and the global bioethanol mix, but it becomes an even worse alternative than petrol, showing larger impacts in all categories except acidification. When biomass is used for marginal energy, wood-waste-based bioethanol shows better results for ecosystem impacts when compared to bioethanol from virgin wood and for fossil GWP, abiotic depletion, and ecosystem effects than the global bioethanol mix does.
7 Discussion and Conclusions
In this life cycle assessment study of the environmental impacts of various scenarios for wood waste’s treatment in the Nordics, issues of data availability restricted researching the scenarios in the setting of each of the five countries individually; therefore, average Nordic‑level scenarios were studied instead. It proved important to model the scenarios under study by means of both attributional and consequential approaches. A key decision for the ALCA was to position the system boundary at the generation of wood waste and include transportation, industrial sorting and processing of the wood waste, and various treatment methods to produce the output of the system (the recycled products studied). An important contribution with the CLCA was to apply system expansion with substitution, considering also both the products that would be substituted for in consequence of creating the relevant products from wood waste and the marginal energy, displacing the energy production that would otherwise be handled via incineration of wood waste.
The attributional LCA results indicate that producing insulation from wood waste appears to be a good alternative to incineration, whereas incineration outperforms the production of all the other recycled products in almost all impact categories studied. Relative to incineration, producing particle board, composite, and textile fibre all have a smaller impact only in terms of biogenic GWP; bioethanol production has a smaller biogenic GWP impact and quite similar impacts on eutrophication and ecosystem damage; and biochar production’s impact is smaller only for acidification. In many cases, however, the differences are quite small and, again, more accurate case-by-case analysis is warranted.
When substituting product and marginal energy are taken into consideration in the consequential LCA scenarios, the situation changes for some of the products studied. In general, the biogenic GWP results depend greatly on the source of marginal energy, such that wood-waste-based production is always a better alternative when the marginal-energy choice is natural gas, while the products substituted for are better when the marginal energy comes from biomass, though the difference is very small for many of the scenarios. The climate impact (fossil GWP) of the wood-waste-based products studied is smaller only for insulation, in both marginal-energy scenarios, and for textile fibre when biomass is the source of marginal energy.
In light of the other impact categories considered, insulation from wood waste appears to remain a good alternative, with smaller environmental impacts in all categories but eutrophication when compared to the mineral-wool scenario. The environmental impacts from the production phase are significantly less extensive for wood‑waste‑based insulation than for the substituting products, especially mineral wool, and the choice of marginal energy does not change the overall balance between the products. Particle board has bigger impacts than plasterboard in all impact categories apart from abiotic depletion and ecosystem damage. Composite from wood waste outperforms composite from virgin wood in terms of acidification, eutrophication, ecosystem impacts, and water use when natural gas is used for marginal energy, and it does so also with regard to abiotic depletion when biomass is assumed for marginal energy, while wood-waste-based composite’s ecosystem impacts are somewhat bigger. For bioethanol and biochar, the substituting products seems to have better environmental performance than the wood-waste-based products in almost all of the other impact categories considered when biomass is used for marginal energy. Wood-waste-based bioethanol has a smaller acidification, eutrophication, and water-use impact only when it is substituted for the global bioethanol mix and natural gas is used for marginal energy, and it creates less abiotic depletion than does petrol. With natural gas as the marginal-energy choice, the wood-waste-based bioethanol and biochar have smaller impacts on acidification relative to all the other substituting products, and wood-waste-based bioethanol also outperforms the global bioethanol mix in terms of eutrophication, ecosystem impacts, and water use. For the bioethanol scenario, it is important to note that only manufacturing-phase (well-to-tank, or WTT) emissions were considered in this study. All bioethanol variants studied would outperform fossil petrol if a life-cycle approach (WTW) were applied.
Textile fibre from wood waste has a larger impact than viscose and cotton only in abiotic depletion when natural gas is used as marginal energy. In addition, water consumption is a critical environmental issue for textile fibres, and from this perspective wood-waste-based production shows significant improvements in performance, especially when compared to cotton. Also, as with all products, the market features better-performing alternatives too, as in the aforementioned case of viscose’s large producer-specific variations in environmental impacts.
The results are sensitive to several of the assumptions made. Significantly longer-distance transportation of wood waste would not affect the results. Assuming a Nordic residual energy mix instead of a Nordic average energy mix increased the fossil GWP by 9% for the particle-board scenario. Composite from wood waste becomes a good alternative to composite from virgin wood when B = 0.5, having smaller environmental impacts in all categories other than global warming potential, fossil or biogenic, depending on the marginal-energy scenario considered. With B = 0.5, also bioethanol becomes a good alternative to the global bioethanol mix, especially in the biomass marginal-energy scenario, having either smaller or similar impacts in many of the categories examined.
Analysis identified the markets for all products studied to be growing, and they all face the same raw-material constraints since they are competing for the same raw materials – wood waste, industrial side streams, and forest residues as well as virgin wood. For some, it is possible to substitute at least a part of the raw material inputs with other cellulose‑based streams. Because every market studied is expanding, it is likely that increased supply will respond to increasing demand instead of replacing older, likely less environmentally friendly technology. Therefore, improvements in environmental performance are likely to arise not entirely through production based on wood waste.
This study did not address the carbon-sequestration effect. As noted in the introductory section’s discussion, carbon sequestration is especially relevant for wood-based products and could be expected to have a significant impact on the results especially in comparison to products created from fossil raw materials.
It should be noted that, because of the system boundaries established for it, the study did not consider releases that occur in later stages of the products’ life cycle (their actual use and end of life). Depending on the length of the life cycle of these products, the temporal extent of the environmental advantages created may differ greatly. Accordingly, further research is recommended that includes the use and EoL stages.
Annex 1: Detailed results
Table 47. ALCA results for particle board
| Environmental impact category | Unit | Value per tonne of wood waste | Value per kg of product | Sorting % |
| GWP100 - fossil | kg CO2-eq | 271 | 0,29 | 4,1 % |
| GWP100 - biogenic | kg CO2-eq | 228 | 0,24 | 0,4 % |
| Acidification | mol H+ eq | 3,39 | 3,62E-03 | 1,5 % |
| Eutrophication, freshwater | kg P eq | 3,75E-02 | 4,01E-05 | 20,4 % |
| Abiotic depletion (fossil fuels) | MJ | 6.162 | 6,59 | 2,2 % |
| Ecosystems | species.yr | 2,32E-06 | 2,48E-09 | 2,2 % |
| Water use | m3 | 349 | 0,37 | 0,5 % |
Table 48. ALCA results for composite
| Environmental impact category | Unit | Value per tonne of wood waste | Value per kg of product | Sorting % |
| GWP100 - fossil | kg CO2-eq | 1.877 | 1,03 | 0,6 % |
| GWP100 - biogenic | kg CO2-eq | 939 | 0,52 | 0,1 % |
| Acidification | mol H+ eq | 7,49 | 4,12E-03 | 0,7 % |
| Eutrophication, freshwater | kg P eq | 0,29 | 1,60E-04 | 2,6 % |
| Abiotic depletion (fossil fuels) | MJ | 2.572 | 1,41 | 5,2 % |
| Ecosystems | species.yr | 1,33E-06 | 7,33E-10 | 3,8 % |
| Water use | m3 | 72,2 | 3,97E-02 | 2,6 % |
Table 49. ALCA results for insulation
| Environmental impact category | Unit | Value per tonne of wood waste | Value per kg of product | Sorting % |
| GWP100 - fossil | kg CO2-eq | 28,2 | 2,82E-02 | 39,0 % |
| GWP100 - biogenic | kg CO2-eq | 5,84 | 5,84E-03 | 15,1 % |
| Acidification | mol H+ eq | 0,14 | 1,43E-04 | 36,3 % |
| Eutrophication, freshwater | kg P eq | 1,24E-02 | 1,24E-05 | 61,6 % |
| Abiotic depletion (fossil fuels) | MJ | 325 | 0,32 | 41,4 % |
| Ecosystems | species.yr | 1,67E-07 | 1,67E-10 | 30,4 % |
| Water use | m3 | 8,52 | 8,52E-03 | 21,7 % |
Table 50. ALCA results for bioethanol
| Environmental impact category | Unit | Value per tonne of wood waste | Value per kg of product | Sorting % |
| GWP100 - fossil | kg CO2-eq | 120 | 0,48 | 9,2 % |
| GWP100 - biogenic | kg CO2-eq | 1.338 | 5,34 | 0,1 % |
| Acidification | mol H+ eq | 1,56 | 6,22E-03 | 3,3 % |
| Eutrophication, freshwater | kg P eq | 1,21E-02 | 4,82E-05 | 63,2 % |
| Abiotic depletion (fossil fuels) | MJ | 1.278,03 | 5,10 | 10,5 % |
| Ecosystems | species.yr | 7,26E-07 | 2,90E-09 | 7,0 % |
| Water use | m3 | 135 | 0,54 | 1,4 % |
Table 51. ALCA results for biochar
| Environmental impact category | Unit | Value per tonne of wood waste | Value per kg of product | Sorting % |
| GWP100 - fossil | kg CO2-eq | 49,5 | 0,12 | 22,2 % |
| GWP100 - biogenic | kg CO2-eq | 1.550 | 3,91 | 0,1 % |
| Acidification | mol H+ eq | 2,52E-01 | 6,36E-04 | 20,5 % |
| Eutrophication, freshwater | kg P eq | 1,99E-02 | 5,03E-05 | 38,2 % |
| Abiotic depletion (fossil fuels) | MJ | 435 | 1,10 | 30,9 % |
| Ecosystems | species.yr | 1,93E-06 | 4,86E-09 | 2,6 % |
| Water use | m3 | 334 | 0,84 | 0,6 % |
Table 52. ALCA results for textile fibre
| Environmental impact category | Unit | Value per tonne of wood waste | Value per kg of product | Sorting % |
| GWP100 - fossil | kg CO2-eq | 1.041 | 1,37 | 1,1 % |
| GWP100 - biogenic | kg CO2-eq | 1.351 | 1,78 | 0,1 % |
| Acidification | mol H+ eq | 8,00 | 1,05E-02 | 0,6 % |
| Eutrophication, freshwater | kg P eq | 2,72E-01 | 3,59E-04 | 2,8 % |
| Abiotic depletion (fossil fuels) | MJ | 9.841 | 13,0 | 1,4 % |
| Ecosystems | species.yr | 6,02E-06 | 7,94E-09 | 0,8 % |
| Water use | m3 | 1.883 | 2,48 | 0,1 % |
Table 53. CLCA results for particle board, presented per tonne of wood waste, for E1 (natural gas) marginal energy
| Environmental impact category | Unit | Particle board from wood waste | Plasterboard production | ||||
| Production | Energy | SUM | Production | Energy | SUM | ||
| GWP100 - fossil | kg CO2-eq | 271 | 1.126 | 1.396 | 107 | 26,8 | 134 |
| GWP100 - biogenic | kg CO2-eq | 228 | 2,85 | 230 | 35,1 | 1.940 | 1.975 |
| Acidification | mol H+ eq | 3,39 | 1,52 | 4,91 | 0,70 | 2,90 | 3,61 |
| Eutrophication, freshwater | kg P eq | 3,75E-02 | 2,48E-02 | 6,23E-02 | 3,34E-02 | 1,11E-02 | 4,45E-02 |
| Abiotic depletion (fossil fuels) | MJ | 6.162 | 17.122 | 23.284 | 78.444 | 170 | 78.614 |
| Ecosystems | species.yr | 2,32E-06 | 3,61E-06 | 5,93E-06 | 2,49E-05 | 8,51E-07 | 2,58E-05 |
| Water use | m3 | 349 | 56,1 | 406 | 291 | 5,01 | 296 |
Table 54. CLCA results for particle board, presented per tonne of wood waste, for E2 (biomass) marginal energy
| Environmental impact category | Unit | Particle board from wood waste | Plasterboard production | ||||
| Production | Energy | SUM | Production | Energy | SUM | ||
| GWP100 - fossil | kg CO2-eq | 271 | 126 | 396 | 107 | 26,8 | 134 |
| GWP100 - biogenic | kg CO2-eq | 228 | 2.089 | 2.317 | 35,1 | 1.940 | 1.975 |
| Acidification | mol H+ eq | 3,39 | 3,66 | 7,05 | 0,70 | 2,90 | 3,61 |
| Eutrophication, freshwater | kg P eq | 3,75E-02 | 3,79E-02 | 7,54E-02 | 3,34E-02 | 1,11E-02 | 4,45E-02 |
| Abiotic depletion (fossil fuels) | MJ | 6.162 | 1.508 | 7.671 | 78.444 | 170 | 78.614 |
| Ecosystems | species.yr | 2,32E-06 | 5,18E-06 | 7,50E-06 | 2,49E-05 | 8,51E-07 | 2,58E-05 |
| Water use | m3 | 349 | 109 | 459 | 291 | 5,01 | 296 |
Table 55. CLCA results for composite, presented per tonne of wood waste, for E1 (natural gas) marginal energy
| Environmental impact category | Unit | Particle board from wood waste | Plasterboard production | ||||
| Production | Energy | SUM | Production | Energy | SUM | ||
| GWP100 - fossil | kg CO2-eq | 1.877 | 1.126 | 3.003 | 1.989 | 26,8 | 2.016 |
| GWP100 - biogenic | kg CO2-eq | 939 | 2,85 | 942 | 939 | 1.940 | 2.879 |
| Acidification | mol H+ eq | 7,49 | 1,52 | 9,01 | 16,4 | 2,90 | 19,3 |
| Eutrophication, freshwater | kg P eq | 2,90E-01 | 2,48E-02 | 3,15E-01 | 1,15E+00 | 1,11E-02 | 1,16E+00 |
| Abiotic depletion (fossil fuels) | MJ | 2.572 | 17.122 | 19.695 | 11.684 | 170 | 11.853 |
| Ecosystems | species.yr | 1,33E-06 | 3,61E-06 | 4,95E-06 | 4,63E-06 | 8,51E-07 | 5,48E-06 |
| Water use | m3 | 72,2 | 56,1 | 128 | 661 | 5,01 | 666 |
Table 56. CLCA results for composite, presented per tonne of wood waste, for E2 (biomass) marginal energy
| Environmental impact category | Unit | Particle board from wood waste | Plasterboard production | ||||
| Production | Energy | SUM | Production | Energy | SUM | ||
| GWP100 - fossil | kg CO2-eq | 1.877 | 126 | 2.003 | 1.989 | 26,8 | 2.016 |
| GWP100 - biogenic | kg CO2-eq | 939 | 2.089 | 3.028 | 939 | 1.940 | 2.879 |
| Acidification | mol H+ eq | 7,49 | 3,66 | 11,1 | 16,4 | 2,90 | 19,3 |
| Eutrophication, freshwater | kg P eq | 2,90E-01 | 3,79E-02 | 3,28E-01 | 1,15E+00 | 1,11E-02 | 1,16E+00 |
| Abiotic depletion (fossil fuels) | MJ | 2.572 | 1.508 | 4.081 | 11.684 | 170 | 11.853 |
| Ecosystems | species.yr | 1,33E-06 | 5,18E-06 | 6,51E-06 | 4,63E-06 | 8,51E-07 | 5,48E-06 |
| Water use | m3 | 72,2 | 109 | 181 | 661 | 5,01 | 666 |
Table 57. CLCA results for insulation, presented per tonne of wood waste, for E1 (natural gas) marginal energy
| Environmental impact category | Unit | Wood wool from wood waste | Mineral wool production | Polystyrene foam production | ||||||
| Production | Energy | SUM | Production | Energy | SUM | Production | Energy | SUM | ||
| GWP100 - fossil | kg CO2-eq | 28,2 | 1.126 | 1.154 | 3.220 | 26,8 | 3.246 | 1.805 | 26,8 | 1.831 |
| GWP100 - biogenic | kg CO2-eq | 5,84 | 2,85 | 8,69 | 0,00 | 1.940 | 1.940 | 38,6 | 1.940 | 1.979 |
| Acidifi|cation | mol H+ eq | 0,14 | 1,52 | 1,66 | 25,2 | 2,90 | 28,1 | 6,75 | 2,90 | 9,66 |
| Eutrophi|ca|tion, freshwater | kg P eq | 1,24E-02 | 2,48E-02 | 3,72E-02 | 8,96E-04 | 1,11E-02 | 1,20E-02 | 8,71E-02 | 1,11E-02 | 9,81E-02 |
| Abiotic depletion (fossil fuels) | MJ | 325 | 17.122 | 17.447 | 38.588 | 170 | 38.758 | 39.059 | 170 | 39.229 |
| Ecosystems | species.yr | 1,67E-07 | 3,61E-06 | 3,78E-06 | 1,15E-05 | 8,51E-07 | 1,23E-05 | 1,37E-05 | 8,51E-07 | 1,45E-05 |
| Water use | m3 | 8,52 | 56,1 | 64,6 | 618 | 5,01 | 623 | 278 | 5,01 | 283 |
Table 58. CLCA results for insulation presented per tonne of wood waste, for E2 (biomass) marginal energy
| Environmental impact category | Unit | Wood wool from wood waste | Mineral wool production | Polystyrene foam production | ||||||
| Production | Energy | SUM | Production | Energy | SUM | Production | Energy | SUM | ||
| GWP100 - fossil | kg CO2-eq | 28,2 | 126 | 154 | 3.220 | 26,8 | 3.246 | 1.805 | 26,8 | 1.831 |
| GWP100 - biogenic | kg CO2-eq | 5,84 | 2.089 | 2.095 | 0,00 | 1.940 | 1.940 | 38,6 | 1.940 | 1.979 |
| Acidifi|cation | mol H+ eq | 0,14 | 3,66 | 3,80 | 25,2 | 2,90 | 28,1 | 6,75 | 2,90 | 9,66 |
| Eutrophi|ca|tion, freshwater | kg P eq | 1,24E-02 | 3,79E-02 | 5,03E-02 | 8,96E-04 | 1,11E-02 | 1,20E-02 | 8,71E-02 | 1,11E-02 | 9,81E-02 |
| Abiotic depletion (fossil fuels) | MJ | 325 | 1.508 | 1.833 | 38.588 | 170 | 38.758 | 39.059 | 170 | 39.229 |
| Ecosystems | species.yr | 1,67E-07 | 5,18E-06 | 5,35E-06 | 1,15E-05 | 8,51E-07 | 1,23E-05 | 1,37E-05 | 8,51E-07 | 1,45E-05 |
| Water use | m3 | 8,52 | 109 | 118 | 618 | 5,01 | 623 | 278 | 5,01 | 283 |
Table 59. CLCA results for bioethanol, presented per tonne of wood waste, for E1 (natural gas) marginal energy
| Environmental impact category | Unit | Bioethanol from wood waste | Bioethanol from virgin wood | Bioethanol global mix | Petrol | ||||||||
| Production | Energy | SUM | Production | Energy | SUM | Production | Energy | SUM | Production | Energy | SUM | ||
| GWP100 - fossil | kg CO2-eq | 120 | 1.126 | 1.245 | 124 | 26,8 | 151 | 183 | 26,8 | 210 | 85,6 | 26,8 | 112 |
| GWP100 - biogenic | kg CO2-eq | 1.338 | 2,85 | 1.341 | 1.276 | 1.940 | 3.217 | 640 | 1.940 | 2.580 | 9,18 | 1.940 | 1.949 |
| Acidifi|ca|tion | mol H+ eq | 1,56 | 1,52 | 3,08 | 1,59 | 2,90 | 4,50 | 4,38 | 2,90 | 7,28 | 1,08 | 2,90 | 3,98 |
| Eutro|phi|ca|tion, fresh|water | kg P eq | 1,21E-02 | 2,48E-02 | 3,69E-02 | 1,38E-02 | 1,11E-02 | 2,48E-02 | 7,37E-02 | 1,11E-02 | 8,48E-02 | 3,06E-03 | 1,11E-02 | 1,41E-02 |
| Abiotic depletion (fossil fuels) | MJ | 1.278 | 17.122 | 18.400 | 1.343 | 170 | 1.513 | 2.167 | 170 | 2.337 | 7.680 | 170 | 7.849 |
| Eco|systems | species.yr | 7,26E-07 | 3,61E-06 | 4,34E-06 | 4,72E-06 | 8,51E-07 | 5,57E-06 | 5,20E-06 | 8,51E-07 | 6,05E-06 | 5,74E-07 | 8,51E-07 | 1,42E-06 |
| Water use | m3 | 135 | 56,1 | 192 | 131 | 5,01 | 136 | 1.622 | 5,01 | 1.627 | 0,70 | 5,01 | 5,71 |
Table 60. CLCA results for bioethanol presented per tonne of wood waste, for E2 (biomass) marginal energy
| Environmental impact category | Unit | Bioethanol from wood waste | Bioethanol from virgin wood | Bioethanol global mix | Petrol | ||||||||
| Production | Energy | SUM | Production | Energy | SUM | Production | Energy | SUM | Production | Energy | SUM | ||
| GWP100 - fossil | kg CO2-eq | 120 | 126 | 245 | 124 | 26,8 | 151 | 183 | 26,8 | 210 | 85,6 | 26,8 | 112 |
| GWP100 - biogenic | kg CO2-eq | 1.338 | 2.089 | 3.427 | 1.276 | 1.940 | 3.217 | 640 | 1.940 | 2.580 | 9,18 | 1.940 | 1.949 |
| Acidifi|ca|tion | mol H+ eq | 1,56 | 3,66 | 5,21 | 1,59 | 2,90 | 4,50 | 4,38 | 2,90 | 7,28 | 1,08 | 2,90 | 3,98 |
| Eutro|phi|ca|tion, fresh|water | kg P eq | 1,21E-02 | 3,79E-02 | 5,00E-02 | 1,38E-02 | 1,11E-02 | 2,48E-02 | 7,37E-02 | 1,11E-02 | 8,48E-02 | 3,06E-03 | 1,11E-02 | 1,41E-02 |
| Abiotic depletion (fossil fuels) | MJ | 1.278 | 1.508 | 2.787 | 1.343 | 170 | 1.513 | 2.167 | 170 | 2.337 | 7.680 | 170 | 7.849 |
| Eco|systems | species.yr | 7,26E-07 | 5,18E-06 | 5,91E-06 | 4,72E-06 | 8,51E-07 | 5,57E-06 | 5,20E-06 | 8,51E-07 | 6,05E-06 | 5,74E-07 | 8,51E-07 | 1,42E-06 |
| Water use | m3 | 135 | 109 | 245 | 131 | 5,01 | 136 | 1.622 | 5,01 | 1.627 | 0,70 | 5,01 | 5,71 |
Table 61. CLCA results for biochar, presented per tonne of wood waste, for E1 (natural gas) marginal energy
| Environmental impact category | Unit | Biochar from wood waste | Biochar from virgin wood | Peat moss | ||||||
| Production | Energy | SUM | Production | Energy | SUM | Production | Energy | SUM | ||
| GWP100 - fossil | kg CO2-eq | 49,5 | 1.126 | 1.175 | 138 | 26,8 | 165 | 85,3 | 26,8 | 112 |
| GWP100 - biogenic | kg CO2-eq | 1.550 | 2,85 | 1.553 | 1.550 | 1.940 | 3.490 | 0,11 | 1.940 | 1.940 |
| Acidification | mol H+ eq | 0,25 | 1,52 | 1,77 | 0,62 | 2,90 | 3,52 | 0,02 | 2,90 | 2,92 |
| Eutrophi|ca|tion, freshwater | kg P eq | 1,99E-02 | 2,48E-02 | 4,48E-02 | 3,00E-02 | 1,11E-02 | 4,10E-02 | 1,30E-03 | 1,11E-02 | 1,24E-02 |
| Abiotic depletion (fossil fuels) | MJ | 435 | 17.122 | 17.558 | 967 | 170 | 1.137 | 41,7 | 170 | 212 |
| Ecosystems | species.yr | 1,93E-06 | 3,61E-06 | 5,54E-06 | 6,21E-06 | 8,51E-07 | 7,06E-06 | 4,15E-07 | 8,51E-07 | 1,27E-06 |
| Water use | m3 | 334 | 56,1 | 390 | 338 | 5,01 | 343 | 0,43 | 5,01 | 5,44 |
Table 62. CLCA results for biochar presented per tonne of wood waste, for E2 (biomass) marginal energy
| Environmental impact category | Unit | Biochar from wood waste | Biochar from virgin wood | Peat moss | ||||||
| Production | Energy | SUM | Production | Energy | SUM | Production | Energy | SUM | ||
| GWP100 - fossil | kg CO2-eq | 49,5 | 126 | 175 | 138 | 26,8 | 165 | 85,3 | 26,8 | 112 |
| GWP100 - biogenic | kg CO2-eq | 1.550 | 2.089 | 3.639 | 1.550 | 1.940 | 3.490 | 0,11 | 1.940 | 1.940 |
| Acidification | mol H+ eq | 0,25 | 3,66 | 3,91 | 0,62 | 2,90 | 3,52 | 0,02 | 2,90 | 2,92 |
| Eutrophi|ca|tion, freshwater | kg P eq | 1,99E-02 | 3,79E-02 | 5,79E-02 | 3,00E-02 | 1,11E-02 | 4,10E-02 | 1,30E-03 | 1,11E-02 | 1,24E-02 |
| Abiotic depletion (fossil fuels) | MJ | 435 | 1.508 | 1.944 | 967 | 170 | 1.137 | 41,7 | 170 | 212 |
| Ecosystems | species.yr | 1,93E-06 | 5,18E-06 | 7,11E-06 | 6,21E-06 | 8,51E-07 | 7,06E-06 | 4,15E-07 | 8,51E-07 | 1,27E-06 |
| Water use | m3 | 334 | 109 | 443 | 338 | 5,01 | 343 | 0,43 | 5,01 | 5,44 |
Table 63. CLCA results for textile fibre presented per tonne of wood waste, for E1 (natural gas) marginal energy
| Environmental impact category | Unit | Textile fibre from wood waste | Viscose fibre | Cotton fibre | ||||||
| Production | Energy | SUM | Production | Energy | SUM | Production | Energy | SUM | ||
| GWP100 - fossil | kg CO2-eq | 1.041 | 1.126 | 2.166 | 2.206 | 26,8 | 2.233 | 1.472 | 26,8 | 1.499 |
| GWP100 - biogenic | kg CO2-eq | 1.351 | 2,85 | 1.354 | 1.575 | 1.940 | 3.515 | 13,3 | 1.940 | 1.954 |
| Acidification | mol H+ eq | 8,00 | 1,52 | 9,52 | 21,3 | 2,90 | 24,2 | 36,6 | 2,90 | 39,5 |
| Eutrophi|ca|tion, freshwater | kg P eq | 2,72E-01 | 2,48E-02 | 2,97E-01 | 7,92E-01 | 1,11E-02 | 8,03E-01 | 1,49E+00 | 1,11E-02 | 1,50E+00 |
| Abiotic depletion (fossil fuels) | MJ | 9.841 | 17.122 | 26.963 | 24.045 | 170 | 24.215 | 13.035 | 170 | 13.205 |
| Ecosystems | species.yr | 6,02E-06 | 3,61E-06 | 9,64E-06 | 1,79E-05 | 8,51E-07 | 1,87E-05 | 4,70E-05 | 8,51E-07 | 4,78E-05 |
| Water use | m3 | 1.883 | 56,1 | 1.940 | 2.468 | 5,01 | 2.473 | 24.461 | 5,01 | 24.466 |
Table 64. CLCA results for textile fibre presented per tonne of wood waste, for E2 (biomass) marginal energy
| Environmental impact category | Unit | Textile fibre from wood waste | Viscose fibre | Cotton fibre | ||||||
| Production | Energy | SUM | Production | Energy | SUM | Production | Energy | SUM | ||
| GWP100 - fossil | kg CO2-eq | 1.041 | 126 | 1.166 | 2.206 | 26,8 | 2.233 | 1.472 | 26,8 | 1.499 |
| GWP100 - biogenic | kg CO2-eq | 1.351 | 2.089 | 3.440 | 1.575 | 1.940 | 3.515 | 13,3 | 1.940 | 1.954 |
| Acidification | mol H+ eq | 8,00 | 3,66 | 11,7 | 21,3 | 2,90 | 24,2 | 36,6 | 2,90 | 39,5 |
| Eutrophi|ca|tion, freshwater | kg P eq | 2,72E-01 | 3,79E-02 | 3,10E-01 | 7,92E-01 | 1,11E-02 | 8,03E-01 | 1,49E+00 | 1,11E-02 | 1,50E+00 |
| Abiotic depletion (fossil fuels) | MJ | 9.841 | 1.508 | 11.349 | 24.045 | 170 | 24.215 | 13.035 | 170 | 13.205 |
| Ecosystems | species.yr | 6,02E-06 | 5,18E-06 | 1,12E-05 | 1,79E-05 | 8,51E-07 | 1,87E-05 | 4,70E-05 | 8,51E-07 | 4,78E-05 |
| Water use | m3 | 1.883 | 109 | 1.993 | 2.468 | 5,01 | 2.473 | 24.461 | 5,01 | 24.466 |
Annex 2: Critical review of Phase 1
Annex 3: Response to critical review of Phase 1
Response to third party critical review of phase 1 report of the study LCA on treatment of wood waste in the Nordics
21.2.2022
NIRAS performed a third party critical review on the Phase 1 report of the study LCA on treatment of wood waste in the Nordics prepared by Gaia Consulting and Sweco. This document describes the working groups response to the comments by each section.
Executive summary
As suggested, the basis behind the selection of products under focus will be mentioned in the executive summary of the Phase 2 report.
Section 1.1: Wood products and climate change mitigation
As suggested, more discussion on carbon sequestration, wood as resource, wood waste in general and how wood waste can contribute to solving climate change mitigation challenges will be added in the Phase 2 report.
A thorough literature study on different treatment options, their characteristics and differences between the Nordic countries is out of the scope of the project plan and will not be added. However, the chosen treatment methods will be studied in more detail in Phase 2 and discussed in more detail in the Phase 2 report and e.g. the differences between the Nordic countries will be taken into account in the modelling.
Section 1.2: Study objectives and Wood waste in the Nordics
As suggested, more details on the scope of the study will be added in the Phase 2 report, namely the geographical scope, specifying that hazardous wood waste in excluded and discussion on considered wood waste sources.
It was agreed with the steering group that there might be some limitations in following all the requirements of the ISO 14044 standard, and conformance with the standard will clarified and discussed in more detail in the Phase 2 report.
As suggested, a separate methodology Chapter will be added in the Phase 2 report in which in addition to the generic LCA process also the study methodology and process will be described.
Section 1.3: Wood waste in the Nordics
As suggested, the statistical data will be investigated and analyzed in more detail in Phase 2 report especially related to the discrepancies between national statistics and Eurostat data and the differences between the data input for Finland compared to the other countries.
Separating the selection of waste treatment solutions into a new chapter with subsections for statistics and recycled products will be considered when finalizing the Phase 2 report.
Section 1.4: Recycled products from wood waste
In the Phase 1 of this study data was to be collected only from literature and other online sources. More detailed data collection, from waste operators, processors and manufacturers will be done in Phase 2. As suggested, a methodology section including a description of the scope and process of the data collection during Phase 1 and Phase 2 will be added in Phase 2 report.
During Phase 2 also the volumes of different wood waste types and quality requirements of the chosen treatment methods will be studied in more detail. If applicable data is available also the quality related differences in sorting and processing will be taken into account in the modelling. If data is not available, at least qualitative discussion on quality requirements will be added in the Phase 2 report, as suggested.
As suggested, the reasoning behind the number of the chosen treatment methods for Phase 2 will also be clarified in the methodology section. Some further argumentations behind the choices will also be added if this is still considered relevant in the later stages of the study.
Reuse was agreed to be out of scope in thorough discussion with the steering group in the project kick-off. As suggested, this is explained in the methodology section.
Section 2.1: Goal of the study
As suggested, the reason for carrying out the study will be clarified, and the intended audience will be added in the Phase 2 report. It should be noted that even though the goal is to analyze and also compare the impacts of alternative scenarios for waste wood treatment, we do not consider this study as a comparative assertion as defined in the ISO 14044 standard.
Section 2.2: Scope of the study
As suggested, the system to be studied will be more clearly defined in Phase 2 report i.e. types of wood waste, function of the system, value choices and limitations.
Details on the critical review of the Phase 2 report or reasoning why critical review will not be made will be added to the Phase 2 report.
Section 2.2.1: Functional unit
As suggested, the functional unit (FU) will be specified in the Phase 2 report to also include treatment, location and technology assumptions. Also, the sentence to describe FU “it measures what is the best use we can make of 1 tonne available wood waste” will be modified (measures -> facilitate comparison) or removed if after specification of FU this is no longer needed.
Section 2.2.2: Type of LCA
As suggested, an argument on the benefits of applying both attributional and consequential methods will be added in the Phase 2 report.
Section 2.2.3: System boundaries and scenarios
As suggested, qualitative discussion on quality requirements will be added in the Phase 2 report. The team will also prioritize, as suggested, gathering more data on the wood waste quality and the quality related requirements for sorting and processing. If applicable data is available also the quality related differences in sorting and processing and handling and discharge of possible waste streams will be taken into account in the modelling. Also, the exclusion of any life cycle stages, processes, inputs or outputs will be clearly stated and the reasons for their omission explained in the Phase 2 report.
As suggested, more details on how multifunctionality and allocation procedures are handled in the ALCA will be added. The objective is to avoid allocation, but if allocation will be used it will be explained and justified.
Section 2.2.4: Choice of marginal technologies
As suggested, the latest version of Ecoinvent (v3.8) will be used for the modelling. The Ecoinvent consequential dataset will not be used in this study, and this will be corrected into the Phase 2 report. The marginal energy mixes will be specified in detail in Phase 2 report. Explanation on how marginal technologies will be defined and selected e.g. one representative vs. several substituted products will be studied as part of Phase 2 and the reasoning behind the selection will be described in the Phase 2 report.
Section 2.2.5: Geographical system boundaries
As suggested, the geographical system boundaries will be mentioned also in the study objectives, goal description and the FU section of the Phase 2 report.
Section 2.2.6: Data sources and quality
As suggested, discussion of the reasons and consequences of using cut-off system model in the consequential approach will be added in the Phase 2 report.
Section 2.2.7: Impact categories to be assessed
Because this study is not a comparative assertion, we consider it to be sufficient to include only limited set of impact categories. The selection of four main indicators that are the most relevant is considered to be sufficient enough to achieve the project goals. However, the inclusion of other impact categories relating to alternative treatment such as incineration with energy recovery, e.g. abiotic resource depletion, will be considered.
Formalities
All the comments and suggestions related to language and formalities will be taken into account and changed in the Phase 2 report.
About this publication
LCA for treatment of wood waste in the Nordics
Jatta Aho, Kaisa Järvinen, Pauliina Saari, Magda Horváth, Katri Leino, Venla Kontiokari, Anna Joelsson, Andreas Asker, Isak Eklöv, Karin Lindqvist, Christine Collin, Julie Hald, Karin Sjöstrand Cochard
ISBN 978-92-893-7377-7 (PDF)
ISBN 978-92-893-7378-4 (ONLINE)
http://dx.doi.org/10.6027/temanord2022-539
TemaNord 2022:539
ISSN 0908-6692
© Nordic Council of Ministers 2022
Cover photo: wmaster890 / iStock
Published: 6/10/2022
Disclaimer
This publication was funded by the Nordic Council of Ministers. However, the content does not necessarily reflect the Nordic Council of Ministers’ views, opinions, attitudes or recommendations.
Rights and permissions
This work is made available under the Creative Commons Attribution 4.0 International license (CC BY 4.0) https://creativecommons.org/licenses/by/4.0.
Translations: If you translate this work, please include the following disclaimer: This translation was not produced by the Nordic Council of Ministers and should not be construed as official. The Nordic Council of Ministers cannot be held responsible for the translation or any errors in it.
Adaptations: If you adapt this work, please include the following disclaimer along with the attribution: This is an adaptation of an original work by the Nordic Council of Ministers. Responsibility for the views and opinions expressed in the adaptation rests solely with its author(s). The views and opinions in this adaptation have not been approved by the Nordic Council of Ministers.
Third-party content: The Nordic Council of Ministers does not necessarily own every single part of this work. The Nordic Council of Ministers cannot, therefore, guarantee that the reuse of third-party content does not infringe the copyright of the third party. If you wish to reuse any third-party content, you bear the risks associated with any such rights violations. You are responsible for determining whether there is a need to obtain permission for the use of third-party content, and if so, for obtaining the relevant permission from the copyright holder. Examples of third-party content may include, but are not limited to, tables, figures or images.
Photo rights (further permission required for reuse):
Any queries regarding rights and licences should be addressed to:
Nordic Council of Ministers/Publication Unit
Ved Stranden 18
DK-1061 Copenhagen
Denmark
pub@norden.org
Nordic co-operation
Nordic co-operation is one of the world’s most extensive forms of regional collaboration, involving Denmark, Finland, Iceland, Norway, Sweden, and the Faroe Islands, Greenland and Åland.
Nordic co-operation has firm traditions in politics, economics and culture and plays an important role in European and international forums. The Nordic community strives for a strong Nordic Region in a strong Europe.
Nordic co-operation promotes regional interests and values in a global world. The values shared by the Nordic countries help make the region one of the most innovative and competitive in the world.
The Nordic Council of Ministers
Nordens Hus
Ved Stranden 18
DK-1061 Copenhagen
pub@norden.org
Read more Nordic publications on www.norden.org/publications