
- Full page image w/ text
- Table of contents
- Foreword
- Summary
- 1 Introduction
- 2 Methods
- 2.1 Method – Scaling of Ecodesign savings from EU level to the Nordic countries
- 2.1.1 Top-down – choosing between scaling factors
- 2.1.2 Data
- 2.1.3 Energy types
- 2.2 Bottom-up method
- 2.2.1 Background
- 2.2.1 Background
- 2.2.2 The two scenarios:
- 2.2.3 Assumptions
- 2.2.4 Data
- 2.2.5 Data sharing and sales scaling
- 2.2.6 Uncertainty
- 2.2.7 Quality assurance of assumptions
- 3 Results
- 4 Denmark
- 4.1 Denmark – Scale down results
- 4.2 Denmark – Bottom-up results
- 4.3 Denmark – Comparison bottom-up and scale-down results.
- 5 Sweden
- 5.1 Sweden – Scale down results
- 5.2 Sweden – Bottom-up results
- 5.3 Sweden – Comparison bottom-up and scale down results.
- 6 Norway
- 6.1 Norway – Scale down results
- 6.2 Norway – Bottom-up results
- 6.3 Norway – Comparison bottom-up and scale down results.
- 7 Finland
- 7.1 Finland – Scale down results
- 7.1 Finland – Scale down results
- 7.2 Finland – Bottom-up results
- 7.3 Finland – Comparison bottom-up and scale down results.
- 8 Iceland
- 8.1 Iceland – Scale down results
- 8.2 Iceland – Bottom-up results
- 8.3 Iceland – Comparison bottom-up and scale down results.
- 9 Sum of results and sensitivity
- 10 Discussion
- About this publication
MENU
Contents
This publication is also available online in a web-accessible version at https://pub.norden.org/temanord2021-523.
Foreword
The study presented in this report has been performed on behalf of the Swedish Energy Agency within the Nordic cooperation Nordsyn, sponsored by the Nordic Council of Ministers. Nordsyn is a cooperation of Nordic agencies responsible for policy and market surveillance of ecodesign and energy labelling. The study was performed by Kasper Mogensen at Big2Great ApS. Any opinions set out in the study are those of Big2Great and do not necessarily reflect the opinions of the Nordsyn members.
This project further develops the Nordic online tool Nordcrawl to estimate the energy savings from ecodesign and energy labelling on a national level in the Nordic countries. The project has developed two online models for effect calculations: a bottom-up stock model and a top-down model. The top-down model uses data on saved energy per product at EU-level from the EIA[1]Ecodesign Impact Accounting - OVERVIEW REPORT 2018 - Prepared by VHK for the European Commission December 2018 (rev. Jan. 2019) report, and the bottom-up model uses sales data on specific energy classes from APPLiA Denmark and Sweden and Elektronikkbransjen in Norway.
This project has been performed in parallel with the study “Effect of market surveillance in securing savings of ecodesign and energy labelling”, TemaNord 2021:522.
Lovisa Blomqvist, The Swedish Energy Agency
Footnotes
- ^ Ecodesign Impact Accounting - OVERVIEW REPORT 2018 - Prepared by VHK for the European Commission December 2018 (rev. Jan. 2019)
Summary
In this project, a tool was developed to calculate savings from ecodesign and energy labelling policy in the Nordic countries, and a "snapshot" calculation was done. Two different calculation methods were used, and both are implemented on the online platform Nordcrawl where assumption and input data can be changed to produce alternative calculations. In the top-down method, estimated EU savings[1]Ecodesign Impact Accounting - OVERVIEW REPORT 2018 - Prepared by VHK for the European Commission December 2018 (rev. Jan. 2019 are scaled-down, using suitable product specific scales, for the Nordics. In the bottom-up method, actual savings are estimated using sales data. The study shows large savings from ecodesign and energy labelling in the Nordic countries. The top-down calculations estimate yearly primary energy savings 2030 (final electricity savings in parenthesis) of about 52 TWh (12) for Denmark, 66 TWh (28) for Sweden, 41 TWh (19) for Norway, 84 TWh (21) for Finland, and 4 TWh (2) for Iceland.
Footnotes
- ^ Ecodesign Impact Accounting - OVERVIEW REPORT 2018 - Prepared by VHK for the European Commission December 2018 (rev. Jan. 2019
1 Introduction
An essential part of the EU energy and resource efficiency policies are ecodesign and energy labelling requirements for energy-related products. The effect of these policies is high, as shown by various studies. For instance, the aggregated effects on the EU level are 9% energy savings in 2020 compared to the Business As Usual (BAU) scenario, as presented in the "Ecodesign impact accounting"[1]Ecodesign Impact Accounting - OVERVIEW REPORT 2018 - Prepared by VHK for the European Commission December 2018 (rev. Jan. 2019) (EIA) report from 2018. However, this study and others do not break down the savings on the Member State level, making it challenging to perform cost-benefit analyses of the national implementation of the EU policies or when considering complementary national energy efficiency policies.
This project, initiated by Nordsyn and financed by the Nordic Council of ministers, aims to develop a tool to estimate the energy savings from ecodesign and energy labelling on a national level in the Nordic countries. Nordsyn cooperates with agencies responsible for policy and market surveillance of ecodesign and energy labelling in the Nordic countries. This specific project was performed by consultant Kasper Mogensen at Big2Great Aps.
This project further develops the Nordic online tool Nordcrawl. The project has developed two online models for effect calculations: a bottom-up stock model and a top-down model. The bottom-up model uses historical sales and stock figures, sales distributions of energy efficiency classes, calculated or assumed product lifetimes, and assumed natural sales development. The model forecasts the stock and efficiency and builds two scenarios: a baseline scenario with and without policies. The tool calculates the saved energy by comparing these two scenarios.
The top-down model uses data on saved energy per product at EU-level from the EIA report. Product-specific factors are developed at a national level to downscale the savings from the EU level to the national level. Finally, the results from the bottom-up and the top-down models are compared as a way to evaluate and calibrate each other, hence increasing the accuracy of the output data.
This report describes the method used in the two models and gives a snapshot of each of the five Nordic countries' current results.
Footnotes
- ^ Ecodesign Impact Accounting - OVERVIEW REPORT 2018 - Prepared by VHK for the European Commission December 2018 (rev. Jan. 2019)
2 Methods
2.1 Method – Scaling of Ecodesign savings from EU level to the Nordic countries
The method for calculating the Ecodesign savings for each country by scaling down EU savings is quite simple. As showed in the equation below, the country saving is calculated by multiplying the EU saving with a country and product group-specific downscaling factor. All relevant scales, references and specific assumptions are under notes on the scale down module of Nordcrawl.org.
2.1.1 Top-down – choosing between scaling factors
When choosing a feasible scaling factor, the question you want to answer is: how much of the total EU saving does my country account for? In the following, I will go through the factors you need to consider to answer this question.
First, we need to look at the generic/basic equation for a scaling factor – the energy share – assuming the savings are proportional to the consumption:
Where the consumption[1]It should be noted that the “consumption per appliances in stock” may not be the same for the EU stock as in the specific country. If the stock of appliances in a country is newer or more expensive it might use less energy than The EU average and vice versa. is calculated by:
The equation shows that the three factors we need to consider are: the stock, the usage, and the consumption per appliance in the stock. In many cases, at least one of these factors is the same for the EU as for the specific country, and in that case, it should not be considered since it adds no extra information to the scaling.
The stock of products compared to EU/market penetration
The first question is how much of the EU stock does my country account for. For example, if you know that your country accounts for 5% of the EU stock and the usage of the product is the same in all countries, then the scaling factor should be 5% (0,05).
In many cases, we do not know the actual stock. Still, you know that the stock and usage can be substituted with another factor like "number of houses" (like all houses have one unit of this product) or economic factors like "GDP", or "energy consumption" or "electricity consumption." For those cases, you can choose a scaling factor based on a substitute factor. For instance, transformers are correlated with electricity consumption.
Usage
If the usage of a product is different from the EU average, it should be reflected in the scaling factor. An example is heating products where the usage in the Nordic Countries is higher than the EU average. This can be corrected by using heating degree days[2]Heating degree days (HDD) are a measure of how cold the temperature was on a given day or during a period of days. in the scaling factor.
Consumption per appliance in stock
The real question here is whether the appliances in one country are more efficient than the EU average and if that is the case, is the better efficiency a result of The EU policy or different factors. The "Consumption per appliance in stock" should only be considered when setting the scaling factor in the cases where the extra efficiency is known to be due to other factors.
Footnotes
- ^ It should be noted that the “consumption per appliances in stock” may not be the same for the EU stock as in the specific country. If the stock of appliances in a country is newer or more expensive it might use less energy than The EU average and vice versa.
- ^ Heating degree days (HDD) are a measure of how cold the temperature was on a given day or during a period of days.
2.1.2 Data
EU savings
Data for the Ecodesign savings comes the Ecodesign Impact Accounting report from Dec 2018 (rev Jan 2019), which is Prepared by VHK for the European Commission. The report describes how the impact accounting is calculated, as follows:
" The accounting covers projections for the period 2010–2050, with inputs going as far back as 1990 and earlier. Studies of over 35 product groups with over 180 base case products have been harmonised and complemented to fit the methodology. For the period up to 2025-2030 inputs were derived from the available studies. The period beyond 2025–2030 is an extrapolation of the existing trend without any new measures, i.e. it is not in the scope of this study to develop new policies.
Projections use two scenarios: a 'business-as-usual' (BAU) scenario, which represents what was perceived to be the baseline without measures at the moment of the (first) decision making, and an ECO scenario that is derived from the policy scenario in the(most recent) studies which comes closest to the measure taken.
The Ecodesign Impact Accounting is being continued in the current study 4 (EIA II) for a period of three years starting from December 2015. The interim report of June 2016 updated the accounting to the information available on 1st January 2016, and also contained a first issue of the special report on material resources contained in EIA- products. The latter report is based on the Bills-of-Materials of the Ecodesign preparatory studies. The product weights per material category are multiplied by the EIA-sales or –stock to obtain the total amounts of material contained in EIA products sold in 2010 or installed in 2010. These amounts are compared to the EU-28 material consumptions per category."[1]Ecodesign Impact Accounting - OVERVIEW REPORT 2018 - Prepared by VHK for the European Commission December 2018 (rev. Jan. 2019) (p. 4)
Furthermore, the savings from the European commission Winter package[2]Updated ecodesign regulation e.g. COMMISSION DELEGATED REGULATION (EU) 2019/2016 2018/2019 is added to the following products: Light Sources, Electronic Displays, Enterprise Servers and Data Storage, Household Refrigeration, Commercial Refrigeration, household Washing Machine, Household Dishwashers, and Electric Motors LV 0.12-1000 kW.
Scaling factor input
Input for the scaling factor highly depends on what data sources are available for the country. The most common data sources are:
- Eurostat
- Odyssee-Mure database
- National statistics
- National report (like report on datacenters in Norway)
- Stock calculated in the bottom-up model
- Stock from the Impact Accounting report
| Source | Explanation |
| Eurostat | Eurostat is the statistical office of the European Union. Eurostat provides data on population, energy, and electricity. |
| Odyssee-Mure database | The Odyssee database is a database on energy efficiency indicators and energy consumption by end-use and their underlying drivers in the industry, transport, and buildings. The database provides consumption data for industry, residential, and service sectors. |
| National statistics | National statistical offices. They provide national data that are not included in Eurostat or Odyssee. An example is Statistics Iceland* that provides data on Icelands Industry consumption on, e.g., aluminum smelters. |
| National reports | National reports provide specific input for the consumption of a specific product group in one country. One example is the Norwegian report** on data centers. |
| Stock calculated in the bottom-up model | Stock calculation from the NordCrawl bottom-up model that is described later in this report. One example could be the stock of dishwashers in Finland. |
| Stock from the Ecodesign Impact Accounting report | In the EIA report, the total EU stock is calculated. The stock is used, for example, for the scale for dishwashers in Finland. |
| *https://statice.is/ *Energibruk fra datasentre i Norge – NVE 2019 - Energiavdelingen - Jarand Hole og Hallgeir Horne http://publikasjoner.nve.no/faktaark/2019/faktaark2019_13.pdf | |
Preferably, the data for the scaling should be between 2010 and 2020.
2.1.3 Energy types
The model considers the following “types” of energy:
- Primary Energy
Primary energy is determined as follows:
"only electricity" * primary energy factor for electricity + “only fuel”.
The primary energy factor for electricity was 2,5 and has been adjusted to 2,1 in 2018 through the Energy Efficiency Directive (2018/2002).
Primary energy is used for scaling down the EU savings.
- Only electricity
The savings in electricity
- Only fuel
Savings in fuels like oil, gas, wood etc.
- Final energy
The total saving in the final energy is: "only electricity" + "only fuel."
In some cases, it might be necessary to exclude "only electricity" or "only fuel" if there is no saving in the energy type in the country. One example is if the water is always heated by electricity and never fuel, then "only fuel" should be excluded.
2.2 Bottom-up method
The bottom-up models require sale data and distribution of sales on energy classes. The model was used for the product groups where these data were available: Refrigerator, refrigerator/freezer, freezer (chest), freezer (upright), washing machine, dishwasher, and tumble dryer.
2.2.1 Background
The bottom-up method is based on an Excel bottom-up model developed for Sweden and Denmark. The new model is developed as an online tool on the NordCrawl platform. The new model is based on the old model's method but updated to accommodate all Nordic countries and new requirements like rescaling the energy label (in March 2021).
The Bottom-up tool's methodological basis is the Danish bottom-up stock model ELMODEL-domestic (Fjordbak Larsen et al. 2003).
The tool's basic equation:

Figure 1: Elmodelbolig-domestic equation
The energy savings of the Ecodesign and energy labelling regulations are estimated by comparing the energy use of a product group in a baseline scenario (without the regulations, business as usual) with the energy use of the product group in a policy scenario (with the effect of the regulations).
Figure 2: Example of baseline and scenario consumptions
2.2.2 The two scenarios:
| Baseline scenario | Policy scenario | |
| Policy (MEPS + Energy label) | NO | YES |
| Sales number (total number sold per year) | Same as sale until 2019, from 2020 it’s 2019 sales * natural development | Same as baseline scenario |
| Energy class sales distribution (before 2020) | Same as first year + natural development; annually 2% of the sale in each class is moved one class up | Same as sales distribution* |
| Energy class sales distribution (After 2020) | Same as before 2020 | Sales distribution 2019 + energy label effect + Ecodesign cut off |
| Rescaled label (2021) | NO | YES (dishwasher, washing machine, refrigeration) |
| * Products are expected to experience a longer lifetime as a result of the resource efficiency requirements introduced in the ”winter package” (winter 2018–2019). There is no experience yet on the impact of these measures and its impact has therefore not been considered, however it should be taken into account in future exercises. | ||
Table 1: Characteristics of the two scenarios
Ideally, the estimations would be based on data for the stock of appliances in the households by energy class, as shown in Figure 3. Detailed data of this kind are not collected in any of the Nordic countries for any product groups. There have been attempts to use surveys to collects this type of data in Denmark[1]Elmodelbolig and Norway, but respondents have been unsure which energy class their products belong to. Instead, the model uses sales data by energy class. The model simulates the stock using a normal-distribution assumption for the lifetime of the appliances. Multiple years of sales will then make up for the total stock.
The next step in the model is to calculate a projection of the sales and the stock. This is for the baseline scenario done as a simple forecast of the total sales (e.g., linear trend) and an assumed natural development in the sales distribution on energy classes.
With these inputs, the stock per energy class, at a given year, can be calculated as a sum of all sales up until then that have survived according to the lifespan distribution, see Figure 3. The figure illustrated how the lower energy classes are phased out, while the higher energy classes make up larger shares of the stock.
To estimate the effects of Ecodesign (Minimum Energy performance standards (MEPS)), a policy scenario parallel to the baseline scenario is done, limiting the sales to the allowed energy efficiency classes according to the legislation stages successively coming into force. If a particular energy class is banned through an Ecodesign MEPS criteria, the sales are simulated to take place at the next energy class level. This is illustrated in Figure 3 where sales of banned energy classes are assumed to be 0 the years after the Ecodesign requirements enter into force, in this example, in two stages in 2022 and 2025 (Refrigerator revised ecodesign regulation).
The estimated savings coursed by the Ecodesign requirements (MEPS) is the difference between the baseline scenario curve and the policy scenario curve. Note that the natural development of sales distribution is still active in the Ecodesign scenario, avoiding the Ecodesign scheme from taking all credit for efficiency improvements in the sales.
The tool also provides a means to estimate the effects of energy labelling. This is done similarly to natural development simulation, i.e., setting an assumed annual change in percent towards more sales in higher energy classes. This shift in sales is illustrated in Figure 3. The sales in all energy classes are affected every year by the energy labelling. The effects of labelling are calculated in parallel to the Ecodesign effects, ensuring that any effect in sales already simulated by MEPS will not be accounted for when simulating the effects of labelling. This to ensures no double-counting of measures.
Footnotes
- ^ Elmodelbolig

Figure 3: Example of banned energy class
As mentioned before the savings by the Ecodesign and energy labelling regulations is estimated as the difference between the base case scenario and the policy scenarios for Ecodesign and energy labelling.
2.2.3 Assumptions
| Changeable assumption | Example | Explanation |
| Start year data | 1995 | First year in the data series |
| Staring year for baseline projections | 1996 | The first year where the baseline is projected, in most cases the year after the times series starts. |
| Staring year for projections | 2020 | The first year of projections in the policy scenario. The starting years can be changed to focus on the policy effects for a shorter period. |
| End year for projections | 2050 | Last year in the projection and thereby last year in the analysis. |
| End year for sale | 2021/2050 | Last year of sales of this product group. 2021 is chosen for the cases where a new time series for the new label will replace the old label. |
| End year for baseline sale | 2050 | Last year of sale for the baseline. |
| Baseline development (% p.a.) | 2% p.a. | The natural development of the baseline. This assumes that the energy efficiency will improve naturally without policies. |
| Lifetime | 12 years | The lifespan of a product |
| EEI ref consumption | 380,7 kWh/year | The Energy Efficiency Index reference consumption calculated the equation in the regulation, using assumed size(s) |
| EEI ref size | 7 kg | The Energy Efficiency Index reference size(s) used for the consumption calculation. |
Table 2: Table with assumptions (washing machine example)
The modeling is based on several other assumptions, some of which are:
- Normal-distributed lifetime of products typically mean value between 8–16 years for white goods.
- The energy consumption per year reference is calculated using an assumed average size(s) and the equations for the annual consumption per unit from the regulations. Some cases, like refrigerators, have many options for different compartment types etc. In those cases, we simplify the product to the most common types where data is available.
- Each energy class can be characterized by a mean annual energy consumption value. An example: On the old label for washing machines, class A++ is EEI between 46 and 52 the mean is EEI 49.
- The baseline is defined by a natural development in the market which is 2% per year of the sales in the specific energy class the previous year are assumed to move one energy-efficient class up. It is possible to adjust this number since the market's development can differ for different types of products.
- Non-compliant sales, MEPSs move the sale to the nearest available energy class.
- The effect of labelling is simulated by shifting X percent of the sale in each energy class to the next more efficient labelling class every year, where X is assumed to be high (~25%) the first years after the requirements come into force, and lower later on (~5%). This assumption is based on knowledge from the introduction of energy labelling for white goods in the late 90'ies.
All assumptions can be modified for each product group that is simulated.
2.2.4 Data
Data sources used for the modeling:
- Sales data from APPLiA Danmark and Sweden – The Association for Suppliers of Electrical Domestic Appliances. The association collects sales figures for white goods from its members.
- Elektronikkbransjen Norge, The Consumer Electronics Trade Foundation. Members are suppliers, dealer chains, independent dealers, and workshops.
- National energy statistics
- Elmodelbolig, Danish bi-annual survey with about 2,000 households performed by Energistyrelsen
- Other product-specific reports
- NordCrawl
2.2.5 Data sharing and sales scaling
The sales data used for the estimation of savings from Ecodesign and energy labelling of white goods are from APPLiA – The Association for Suppliers of Electrical Domestic Appliances in Demark and Sweden (only a few years) that collects sales data for white goods from their members. Likewise, Elektronikkbransjen in Norway also collects sales data (number of products and energy classes) from their members. It has been assumed that the Nordic consumers have the more or less the same energy efficiency preferences when buying white goods, which means that we can use the sales distribution of energy classes from Denmark, Norway or, Sweden in Iceland and Finland. Which country is the best match is determined by looking at factors like housing type distribution and economy. An argument for this assumption is the fact that web-shops like Elgiganten (Elkjøb Norway, Gigantti Finland) has the similar websites and selections. The sales figures (number of sold models per year) are scaled to adjust to different household stock. Sales data from Norway and Sweden cover fewer years than Denmark, so Danish sales data is used to extend those time series.
| Country | Data source | Scaling factor (for the annual sale in units of appliances) |
| Denmark | 1995 – 2019 APPLiA DK | – |
| Sweden | 1995 – 2016 APPLiA DK, 2017 - 2019 APPLiA SE | SE Sales / DK Sales (per product group) |
| Norway | 1995 – 2005 APPLiA DK, 2006 - 2019 Elektronikkbransjen Norge | NO Sales / DK Sales (per product group) |
| Finland | 1995 – 2019 APPLiA DK | FIN households / DK households |
| Iceland | 1995 – 2019 APPLiA DK | ICE households / DK households |
Table 3: Sales data sharing and scaling
Rescaled energy label
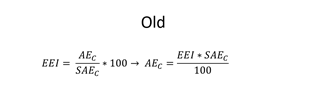
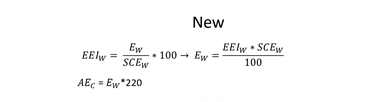
One of the significant changes in this project compared to the previous Swedish Effect project[1]Estimation tool for national effects of MEPS and labelling – version 2.0, Stengård et al 2017 is that most of the energy labels for the appliances in this project have been rescaled. The rescaling came into force 1 March 2021, therefore, no sales data for the new rescaled energy class distributions were available. We had to figure out a way to convert the old energy label distribution to the new scale. We did this by comparing the energy class ranges for the same sizes. The approach was:
- Calculate the standard annual energy consumption for the old and the new label, using the most common size, like 7 kg for washing machines.
- Used that standard consumption to calculate the min and max energy consumption for each class (using EEI), for the old and the new label.
- Compare those ranges and match the classes.
- In some cases, the range is matched well enough, while in other cases, we need to split the sales between two new energy classes.
The figure below shows an example of one of these energy class conversion tables. The example is for a 7 kg washing machine. The colors are those of the new energy class for each label.
Footnotes
- ^ Estimation tool for national effects of MEPS and labelling – version 2.0, Stengård et al 2017
| OLD | |||
| Class / Range | Min | Max | New |
| A+++ | 0,0 | 175,1 | E |
| A++ | 175,1 | 197,9 | F |
| A+ | 198,0 | 224,6 | G |
| A | 224,6 | 258,8 | |
| B | 258,9 | 293,1 | |
| C | 293,1 | 331,2 | |
| D | 331,2 |
| NEW | ||
| Class / Range | Min | Max |
| A | 0,0 | 98,6 |
| B | 98,6 | 113,7 |
| C | 113,8 | 130,8 |
| D | 130,8 | 151,7 |
| E | 151,7 | 172,5 |
| F | 172,5 | 193,4 |
| G | 193,4 |
Figure 4: Conversion calculation example, old to the new energy label
One of the significant issues with comparing the old and the new energy label directly is that the test method determining the energy consumption has changed. We consider this conversion the best option when we do not have sales data for the new energy label.
At the same time, new and more stringent MEPS were introduced. To handle the new MEPS and the new label with the new thresholds for the energy labelling classes, we decided to treat appliances with a new label as a new product replacing the models with the old label. When calculating the savings, we added the old label's savings to the savings from the new label. Over time, the old label appliances will be replaced with appliances with the new label in the stock. T The figure below shows how appliances with the new label replaces appliance with the old label over time. The model can easily be updated when sales data for the new energy label is available. The model can easily be updated when sales data for the new energy label is available.
Figure 5: Example of how the stock changes from the old to the new energy label
2.2.6 Uncertainty
The bottom-up modelling is data demanding, and the quality of the results naturally depends on the quality of the input data, especially detailed sales data can improve the quality. Since these data can be hard to get, assumptions must be introduced to establish sales data at the needed granularity, which adds to the uncertainty.
The long-term projections of the model are also uncertain since many of the assumptions made to establish the bottom-up basis are not valid in a long perspective. The model should only be used for 5–15 year's projections, equal to one generation of most white goods. Otherwise, it should be developed further to incorporate top-down elements to guide some of the model's assumed developments (or statics). An example of long-term uncertainty in a bottom-up model is that it is difficult to predict when a new technology is introduced for an appliance (often called technology leaps e.g. the utilisation of heap pumps in tumble driers). Another example is consumer preference changes. In some of the Nordic countries, we observed a change from chest freezers to upright freezers. If the model is used to project too far into the future, changes like the will not be adequately reflected.
In summary, the model can, estimate how the stock at any given year is composed in terms of energy parameters using data for how the actual annual sales are distributed on energy classes. This enables us to calculate the total energy consumption for a baseline situation, as well as the energy consumption for policy scenarios. The difference between the baseline scenario and the policy scenario constitutes the savings at the national level from the policies.
2.2.7 Quality assurance of assumptions
The following quality controls were performed to ensure the robustness of the assumptions.
Product penetration
We looked at the product penetration, which is the number of a product in a household (stock/households). We know from surveys in Denmark and Norway approximately what the expected penetration is, and by comparing the calculated penetration with the expected penetration, we can evaluate the assumption. One example, the general penetration of a refrigerator is around 1 refrigerator per household. If the calculated penetration is 0,5 refrigerators per household, there might be a problem with the scaling of sales data (in most cases the danish APPLiA data) or the assumed lifetime.
Comparison between countries
We compare the assumptions and the results between Nordic countries. Some variations are expected due to different lifestyles, like the popularity of dryers or housing types like many apartments will have fewer washing machines and shared washing machines typically in the basement. But the central assumption is that the results should be comparable, and we should be able to explain the variations logically.
Compare Bottom-up and scale-down results.
When comparing the bottom-up and scale-down model results, we will check if assumptions cause significant differences. In most cases, the problem is the scale-down model's scales being too generic and do not reflect local preferences.
3 Results
Results are presented for each country. First, the scale-down result with an explanation of the scaling factors. After that, the bottom-up results are presented and then the results of the bottom-up and the scale-down models are compared for each country. Finally, all results are summarized.
4 Denmark
4.1 Denmark – Scale down results
Scaling factors
Below is a list of available scales. Not all scales are used but can be used to indicate the country population/GDP size etc. The description column explains the data in the scale and the source and year. The scale represents the country's percent use of the total EU consumption.
| Name | Description | Scale | Used times |
| Energy | Gross inland consumption 2016, All products; TOE | 1.06% | 0 |
| Population | Population, 2018 | 1.13% | 1 |
| GDP | GDP, 2018; Current prices, million euro | 0.14% | 0 |
| Electricity | Energy Available for Final Consumption 2016, Electrical energy; TOE | 1.12% | 1 |
| Energy | Gross inland consumption 2016, All products; TOE | 1.06% | 0 |
| Population | Population, 2018 | 1.13% | 1 |
| GDP | GDP, 2018; Current prices, million euro | 0.14% | 0 |
| Houses | Stock of dwellings (permanently occupied), Odyssee; 2016 | 1.29% | 0 |
| Residential | Final consumption of residential with climatic corrections; 2016; Odyssee; MTOE | 1.76% | 0 |
| Space heating | Final consumption of residential for space heating with climatic corrections; Odyssee 2015; MTOE | 2.11% | 5 |
| Car consumption | Car consumption 2013; Odyssee; TOE | 1.41% | 1 |
| Industry | Final consumption of industry; Odyssee 2016; MTOE | 0.80% | 4 |
| Service | Electricity consumption of services; Odyssee 2016; MTOE | 1.37% | 4 |
| Residential electricity | Electricity consumption of houses; Odyssee 2015; kWh | 1.28% | 0 |
| Circulators | Country proportion of EU stock (guesses) X degree days above EU avg | 3.66% | 1 |
| Residential appliances electricity | Electricity consumption for dwellings for electrical appliances and lighting; Odyssee 2016 | 1.59% | 5 |
| None | None | 100.00% | 0 |
| Household Dishwashers | Household Dishwashers DK stock/EU stock 2020 | 1.73% | 1 |
| Household Washing Machines | Household Washing Machines DK stock/EU stock 2020 | 1.11% | 1 |
| Household Refrigerators & Freezers | Household Refrigerators & Freezers DK stock/EU stock 2020 | 1.59% | 1 |
| Household Laundry Driers | Household Laundry Driers DK stock/EU stock 2020 | 1.87% | 1 |
| Data centers | Average industry and service sector scale multiplied by 1,5 because assumed more datacenters in DK | 1.63% | 1 |
| Residential & Service | Average residential electricity and Service | 1.32% | 1 |
| Residential appliances & Service | Average residential appliances electricity and Service | 1.48% | 6 |
Table 4: Danish scaling factors
Top-down results
The scale-down results are in TWh/year. Most products only have electricity savings, but a few heating-related products have both electricity and fuel savings. Tyres only save fuel.
Table 5: Danish top-down results
| 2020 | 2030 | Scale | ||||||
| Group | Electricity | Fuel | Final energy | Electricity | Fuel | Final energy | Scale factor | Scale name |
| Dedicated Water Heater | 0.62 | 0.44 | 1.06 | 1.03 | 0.72 | 1.75 | 1.13% | Population |
| Central Heating combi, water heating | 0.02 | 1.52 | 1.54 | 0.02 | 3.59 | 3.61 | 2.11% | Space heating |
| Central Heating boiler, space heating | 0.15 | 10.60 | 10.75 | 0.06 | 17.73 | 17.79 | 2.11% | Space heating |
| Solid Fuel Boilers | 0.00 | 0.17 | 0.17 | 0.00 | 0.32 | 0.32 | 2.11% | Space heating |
| Central Air Cooling | 0.05 | 0.05 | 0.18 | 0.00 | 0.18 | 1.37% | Service | |
| Central Air Heating | 0.05 | 0.14 | 0.19 | 0.14 | 0.32 | 0.46 | 1.37% | Service |
| Local Heaters | 0.34 | 0.19 | 0.53 | 0.53 | 0.65 | 1.18 | 2.11% | Space heating |
| Room Air Conditioner (of which cooling) | ||||||||
| Room Air Conditioner (of which heating) | 0.13 | 0.00 | 0.13 | 0.25 | 0.00 | 0.25 | 2.11% | Space heating |
| Circulator pumps <2.5 kW | 0.40 | 0.00 | 0.40 | 0.48 | 0.00 | 0.48 | 3.66% | Circulators |
| Ventilation Units (res & nonres) | 0.15 | 1.22 | 1.37 | 0.33 | 2.20 | 2.53 | 1.33% | Residential & Service |
| Light Sources | 1.41 | 1.41 | 2.29 | 2.29 | 1.48% | Residential appliances & Service | ||
| Electronic Displays | 0.36 | 0.36 | 1.47 | 1.47 | 1.48% | Residential appliances & Service | ||
| Set Top Boxes | 0.06 | 0.06 | 0.06 | 0.06 | 1.59% | Residential appliances electricity | ||
| VIDEO | 0.02 | 0.02 | 0.02 | 0.02 | 1.59% | Residential appliances electricity | ||
| Enterprise Servers and Data Storage | 0.04 | 0.04 | 0.20 | 0.20 | 1.63% | Data centers | ||
| Personal Computers | 0.00 | 0.00 | 0.00 | 0.00 | 1.48% | Residential appliances & Service | ||
| Imaging equipment | 0.07 | 0.07 | 0.09 | 0.09 | 1.48% | Residential appliances & Service | ||
| SB (networked) Stand-By (rest) | 0.01 | 0.01 | 0.00 | 0.00 | 1.48% | Residential appliances & Service | ||
| External Power Supplies | 0.09 | 0.09 | 0.15 | 0.15 | 1.48% | Residential appliances & Service | ||
| UPS Total | ||||||||
| Household Refrigeration | 1.03 | 1.03 | 1.57 | 1.57 | 1.59% | Household Refrige|rators & Freezers | ||
| Commercial Refrigeration | 0.08 | 0.08 | 0.92 | 0.92 | 1.37% | Service | ||
| Professional refrigeration products | 0.05 | 0.05 | 0.15 | 0.15 | 1.37% | Service | ||
| Cooking Appliances | 0.02 | 0.02 | 0.08 | 0.11 | 1.59% | Residential appliances electricity | ||
| Household Coffee Makers | 0.03 | 0.03 | 0.03 | 0.03 | 1.59% | Residential appliances electricity | ||
| Household Washing Machine | 0.18 | 0.18 | 0.22 | 0.22 | 1.11% | Household Washing Machines | ||
| Household Dishwashers | 0.16 | 0.16 | 0.24 | 0.24 | 1.73% | Household Dishwashers | ||
| Household Laundry Drier | 0.07 | 0.07 | 0.17 | 0.17 | 1.87% | Household Laundry Driers | ||
| Vacuum Cleaners | 0.26 | 0.26 | 0.48 | 0.48 | 1.59% | Residential appliances electricity | ||
| Industrial Fans >125W | 0.12 | 0.12 | 0.27 | 0.27 | 0.80% | Industry | ||
| Electric Motors LV 0.12-1000 kW | 0.25 | 0.25 | 0.59 | 0.59 | 0.80% | Industry | ||
| Water pumps | 0.02 | 0.02 | 0.04 | 0.04 | 0.80% | Industry | ||
| Standard Air Compressors | 0.01 | 0.01 | 0.02 | 0.02 | 0.80% | Industry | ||
| TRAFO Utility Transformers | 0.07 | 0.07 | 0.21 | 0.21 | 1.12% | Electricity | ||
| Tyres, total Cl+C2+C3 | 0.00 | 0.52 | 0.52 | 0.00 | 0.93 | 0.93 | 1.41% | Car consumption |
4.2 Denmark – Bottom-up results
Below are the bottom-up results for 2030. The table is also the main assumptions for sizes in liters, kilogram, and place settings and lifetime in years.
| Size | Life time* | Baseline GWh/year | Scenario GWh/year | Savings GWh/year | |
| Refrigerator | 230 l | 14 | 265.6 | 149 | 116.6 |
| Refrigerator/Freezer | 260/90 l | 15 | 1424.8 | 533 | 891.8 |
| Freezer (Chest) | 230 l | 18 | 125.8 | 50.1 | 75.7 |
| Freezer (Upright) | 200 l | 16 | 455.1 | 212.2 | 242.9 |
| Washing machine | 7 kg | 9 | 825 | 403.1 | 421.9 |
| Dishwasher | 12 ps | 10 | 983.1 | 546.2 | 436.9 |
| Dryer | 7 kg | 13 | 1294.5 | 454.2 | 840.3 |
| *Lifetime is the number of years a product is used. It’s not necessarily the same as technical life (until the product dies) | |||||
Table 6: Danish bottom-up results
4.3 Denmark – Comparison bottom-up and scale-down results.
Below is a comparison between the bottom-up model results from 2030 and the Top-down results in GWh/year. For all refrigerators and freezers, the results are pretty close, while the savings for washing machines and dishwashers are roughly twice as high in the bottom-up model than in scale-down model. The savings for dryers shows the bottom-up model gives an even higher result. This is likely due to a lot higher use of these appliances in Denmark than in the rest of EU. But it could also be due to a better data quality/resolution in the bottom-up model.
| Bottom-up Saving GWh/year | Scale down savings GWh/year | |
| All refrigerators and freezers | 1327 | 1570 |
| Washing machine | 421.9 | 220 |
| Dishwasher | 436.9 | 240 |
| Dryer | 840.3 | 170 |
Table 7: Danish comparison between top-down and bottom-up results
5 Sweden
5.1 Sweden – Scale down results
Scaling factors
Below is a list of available scales. Not all scales are used but can be used to indicate the country population/GDP size etc. The description column explains the data in the scale and the source and year. The scale represents the country's percent use of the total EU consumption.
| Name | Description | Scale | Used times |
| None | None | 100.00% | 1 |
| Electricity | Energy Available for Final Consumption 2016, Electrical energy; TOE | 4.58% | 1 |
| Energy | Gross inland consumption 2016, All products; TOE | 3.00% | 0 |
| Population | Population, 2018 | 1.98% | 0 |
| GDP | GDP, 2018; Current prices, million euro | 2.96% | 0 |
| Houses | Stock of dwellings (permanently occupied), Odyssee; 2016 | 2.16% | 0 |
| Residential | Final consumption of residential with climatic corrections; 2016; Odyssee; MTOE | 2.60% | 6 |
| Space heating | Final consumption of residential for space heating with climatic corrections; Odyssee 2015; MTOE; Heating degree days | 3.89% | 0 |
| Car consumption | Car consumption 2013; TOE | 2.59% | 1 |
| Industry | Final consumption of industry; Odyssee 2016; MTOE | 4.51% | 0 |
| Service | Electricity consumption of services; Odyssee 2016; MTOE | 2.74% | 9 |
| Residential electricity | Electricity consumption of houses; Odyssee 2015; kWh | 5.34% | 0 |
| Circulators | SE proportion of EU stock (guesses) | 9.23% | 1 |
| Residential appliances electricity | Electricity consumption for dwellings for electrical appliances and lighting; Odyssee 2016 | 5.12% | 0 |
| Water heaters | Energy in Sweden, 3.4 elvärme in småhus 25% of total / EU consumption BAU scanario | 1.23% | 1 |
| Solid fuel boilers | Energy in numbers in Sweden, 3.4, småhus, Fuel share 0,6 (Expert assumption); Eco scenario 2020, reduced 30% | 2.41% | 1 |
| Central Air Heating | 3,6*0,5; Eco scenario 2020 only Electricity | 3.46% | 1 |
| Central Air Cooling | Energy in numbers in Sweden, 3.3, lokaler, Cooling share of driftsel 0,1 (Expert assumption); Eco sceario 2020 | 1.76% | 1 |
| Solid fuel boilers | Energy in numbers in Sweden, 3.4, småhus, Multi, loc Fuel share 0,6 but reduced 30%(Expert assumption); BAU 2020 | 3.85% | 1 |
| Local Heaters weighted | Energy in numbers in Sweden, 3.4, småhus 20, Fuel share 0,4,(Expert assumption); BAU scenario 2020 | 1.78% | 1 |
| Air-Air HP heat | Energy in numbers in Sweden, 3.4, småhus, Air-air HP share of elvärme 0.15 (heat 0.9 of that) (Expert assumption); Eco scenario 2020 | 6.08% | 1 |
| Air-Air HP cooling | Energy in numbers in Sweden, 3.4, småhus, Air-air HP share of elvärme 0.15, cooling (0.1 of that) (Expert assumption); Eco scenario 2020 | 1.09% | 1 |
| Residential+service | Residential + service sector merged | 4.00% | 0 |
| Washing machine | Washing machine bottom up baseline/ EU baseline consumption in h | 1.88% | 1 |
| Dishwasher stock | Dishwasher stock SE/EU *365 cycles/280 | 4.58% | 1 |
| Dryers stock | Stock 2010 SE /EU | 2.25% | 1 |
| Central Heating - Water | Energy in Sweden 2019 - 10% of El in Houses, Multi, Locals - BAU 2020. | 52.50% | 1 |
| Central Heating - Heating | Energy in Sweden 2019 - 35% of El in Houses, Multi, Locals - BAU 2020. Scale x5 since Savings EU 2030 are understimated by factor 5 | 30.37% | 1 |
| Servers & Data storage | Sweco scenario fast = 5TWh 2030 | 6.67% | 1 |
| Motors & more | 70% av El i industry Energiläget 20 vs EU BAU20 | 4.03% | 4 |
Table 8: Swedish scaling factors
Top-down results
The scale-down results are in TWh/year. Most products only have electricity savings, but a few heating-related products have both electricity and fuel savings. Tyres only save fuel.
Table 9: Swedish top-down results
| 2020 | 2030 | Scale | ||||||
| Group | Electricity | Fuel | Final energy | Electricity | Fuel | Final energy | Scale factor | Scale name |
| Dedicated Water Heater | 0.67 | 0.00 | 0.67 | 1.12 | 0.00 | 1.12 | 1.23% | Water heaters |
| Central Heating combi, water heating | 0.52 | 0.00 | 0.52 | 0.52 | 0.00 | 0.52 | 52.50% | Central Heating - Water |
| Central Heating boiler, space heating | 2.13 | 0.00 | 2.13 | 0.91 | 0.00 | 0.91 | 30.37% | Central Heating - Heating |
| Solid Fuel Boilers | 0.00 | 0.19 | 0.19 | 0.00 | 0.36 | 0.36 | 2.41% | Solid fuel boilers |
| Central Air Cooling | 0.07 | 0.00 | 0.07 | 0.23 | 0.00 | 0.23 | 1.76% | Central Air Cooling |
| Central Air Heating | 0.14 | 0.35 | 0.49 | 0.35 | 0.00 | 0.35 | 3.46% | Central Air Heating |
| Local Heaters | 0.28 | 0.16 | 0.44 | 0.44 | 0.55 | 0.99 | 1.78% | Local Heaters weighted |
| Room Air Conditioner (of which cooling) | 0.04 | 0.00 | 0.04 | 0.08 | 0.00 | 0.08 | 1.09% | Air-Air HP cooling |
| Room Air Conditioner (of which heating) | 0.36 | 0.00 | 0.36 | 0.73 | 0.00 | 0.73 | 6.08% | Air-Air HP heat |
| Circulator pumps <2.5 kW | 1.02 | 0.00 | 1.02 | 1.20 | 0.00 | 1.20 | 9.23% | Circulators |
| Ventilation Units (res & nonres) | 1.00 | 2.20 | 3.20 | 2.20 | 3.90 | 6.10 | 100.00% | None |
| Light Sources | 2.47 | 2.47 | 4.03 | 4.03 | 2.60% | Residential | ||
| Electronic Displays | 0.62 | 0.62 | 2.57 | 2.57 | 2.60% | Residential | ||
| Set Top Boxes | 0.11 | 0.11 | 0.11 | 0.11 | 2.74% | Service | ||
| VIDEO (game console) | 0.03 | 0.03 | 0.03 | 0.03 | 2.74% | Service | ||
| Enterprise Servers and Data Storage | 0.15 | 0.15 | 0.82 | 0.82 | 6.67% | Servers & Data storage | ||
| Personal Computers | 0.00 | 0.00 | 0.00 | 0.00 | 2.74% | Service | ||
| Imaging equipment | 0.14 | 0.14 | 0.16 | 0.16 | 2.74% | Service | ||
| SB (networked) Stand-By (rest) | 0.03 | 0.03 | 0.00 | 0.00 | 2.74% | Service | ||
| External Power Supplies | 0.16 | 0.16 | 0.28 | 0.28 | 2.74% | Service | ||
| UPS Total | 0.00 | 0.00 | 0.00 | 0.00 | 2.74% | Service | ||
| Household Refrigeration | 1.69 | 1.69 | 2.57 | 2.57 | 2.60% | Residential | ||
| Commercial Refrigeration | 0.16 | 0.16 | 1.84 | 1.84 | 2.74% | Service | ||
| Professional refrigeration products | 0.11 | 0.11 | 0.30 | 0.30 | 2.74% | Service | ||
| Cooking Appliances | 0.03 | 0.03 | 0.13 | 0.18 | 2.60% | Residential | ||
| Household Coffee Makers | 0.05 | 0.05 | 0.05 | 0.05 | 2.60% | Residential | ||
| Household Washing Machine | 0.30 | 0.30 | 0.38 | 0.38 | 1.88% | Washing machine | ||
| Household Dishwashers | 0.41 | 0.41 | 0.64 | 0.64 | 4.58% | Dishwasher stock | ||
| Household Laundry Drier | 0.09 | 0.09 | 0.20 | 0.20 | 2.25% | Dryers stock | ||
| Vacuum Cleaners | 0.42 | 0.42 | 0.78 | 0.78 | 2.60% | Residential | ||
| Industrial Fans >125W | 0.61 | 0.61 | 1.37 | 1.37 | 4.03% | Motors & more | ||
| Electric Motors LV 0.12-1000 kW | 1.25 | 1.25 | 2.98 | 2.98 | 4.03% | Motors & more | ||
| Water pumps | 0.12 | 0.12 | 0.20 | 0.20 | 4.03% | Motors & more | ||
| Standard Air Compressors | 0.04 | 0.04 | 0.08 | 0.08 | 4.03% | Motors & more | ||
| TRAFO Utility Transformers | 0.27 | 0.27 | 0.87 | 0.87 | 4.58% | Electricity | ||
| Tyres, total Cl+C2+C3 | 0.00 | 0.96 | 0.96 | 0.00 | 1.71 | 1.71 | 2.59% | Car consumption |
5.2 Sweden – Bottom-up results
Below are the bottom-up results for 2030. The table is also the main assumption for sizes in liters, kilograms, place settings, and lifetime in years.
| Size | Life time | Baseline GWh/year | Scenario GWh/year | Saving GWh/year | |
| Refrigerator | 345 | 12 | 526.3 | 219.5 | 306.8 |
| Refrigerator/Freezer | 240/90 | 12 | 1567.1 | 589.9 | 977.3 |
| Freezer (Chest) | 260 | 15 | 175.4 | 71.6 | 103.8 |
| Freezer (Upright) | 260 | 12 | 920.3 | 606 | 314.3 |
| Washing machine | 7 | 12 | 1042.5 | 540 | 502.5 |
| Dishwasher | 12 | 9 | 1189.3 | 586.2 | 603.1 |
| Dryer | 6 | 10 | 1306.1 | 459.6 | 846.5 |
Table 10: Swedish bottom-up results
5.3 Sweden – Comparison bottom-up and scale down results.
Below is a comparison between the bottom-up model results from 2030 and the top-down results in GWh/year. For all refrigerators and freezers, the bottom-up results are lower than the Top-down. for washing machines and dryers, the bottom-up savings are a lot higher, which may be explained by different use in Sweden than in the rest of the EU. The dishwasher savings are pretty close.
| 2030 | Bottom-up Saving GWh/year | Scale down savings GWh/year |
| All refrigerators and freezers | 1702.2 | 2570 |
| Washing machine | 502.5 | 380 |
| Dishwasher | 603.1 | 640 |
| Dryer | 846.5 | 200 |
Table 11: Swedish comparison between top-down and bottom-up results
6 Norway
6.1 Norway – Scale down results
Scaling factors
Below is a list of available scales. Not all scales are used but can be used to indicate the country population/GDP size etc. The description column explains the data in the scale and the source and year. The scale represents the country's percent use of the total EU consumption.
| Name | Description | Scale | Used times |
| Electricity | Energy Available for Final Consumption 2016, Electrical energy; TOE | 4.08% | 4 |
| Energy | Gross inland consumption 2016, All products; TOE | 1.70% | 0 |
| Population | Population, 2018 | 1.03% | 0 |
| GDP | GDP, 2018; Current prices, million euro | 2.31% | 2 |
| Houses | Stock of dwellings (permanently occupied), Odyssee; 2016 | 1.09% | 0 |
| Residential | Final consumption of residential with climatic corrections; 2016; Odyssee; MTOE | 1.41% | 3 |
| Car consumption | Car consumption 2013; TOE | 1.19% | 1 |
| Industry | Final consumption of industry; Odyssee 2016; MTOE | 2.03% | 1 |
| Service | Electricity consumption of services; Odyssee 2016; MTOE | 2.74% | 0 |
| Circulators | Country proportion of EU stock (guesses) X degree days above EU avg | 3.84% | 1 |
| None | None | 0.00% | 0 |
| 0.00% | 0 | ||
| Space heating | Final consumption of residential for space heating; Odyssee 2015; MTOE; NVE 2018 | 1.63% | 0 |
| Residential electricity | Electricity consumption of houses; Odyssee 2015; kWh; NVE 2018 | 5.06% | 0 |
| Residential appliances electricity | Electricity consumption for dwellings for electrical appliances and lighting; Odyssee 2016; NVE 2018 | 1.62% | 10 |
| Saving percentage | Saving percentage method | 100.00% | 1 |
| Air-to-Air-Heatpump | Electric consumption of A-A HP in Norway 2018; NVE calculation divided by Ecodesign scenario 2018, TWh/ year | 17.79% | 1 |
| Data centers | Ecodesign accounting ECO scenario EU consumption datacenters 2030, NVE rapport reference scenario TWh/a | 6.00% | 1 |
| Dedicated water heaters | NVE Market Study med beregnede tall for sales og stock for perioden 2013–2016.EU stock (Ecodesign Impact Accounting) | 0.62% | 0 |
| Dishwashers | Household Dishwashers 2020 Stock Norway calc / Report | 2.00% | 1 |
| Washing Machines | Household Washing Machines 2020 stock calc /EU stock | 1.16% | 1 |
| Household Refrigerators & Freezers | Household Refrigerators & Freezers Stock 2020 / EU Stock | 1.23% | 1 |
| Household Laundry Driers | Household Laundry Driers stock 2020 /EU stock | 1.44% | 1 |
Table 12: Norwegian scaling factors
Top-down results
The scale-down results are in TWh/year. Most products only have electricity savings, but a few heating-related products have both electricity and fuel savings. Tyres only save fuel.
Table 13: Norwegian top-down results
| 2020 | 2030 | Scale | ||||||
| Group | Electricity | Fuel | Final energy | Electricity | Fuel | Final energy | Scale factor | Scale name |
| Dedicated Water Heater | 0.60 | 0 | 0.60 | 0.99 | 0 | 0.99 | 1.09% | Houses |
| Central Heating combi, water heating | Left out | |||||||
| Central Heating boiler, space heating | Left out | |||||||
| Solid Fuel Boilers | 0 | 0.11 | 0.11 | 0 | 0.21 | 0.21 | 1.41% | Residential |
| Central Air Cooling | Left out | |||||||
| Central Air Heating | Left out | |||||||
| Local Heaters | 0.23 | 0.13 | 0.36 | 0.35 | 0.44 | 0.79 | 1.41% | Residential |
| Room Air Conditioner (of which cooling) | Left out | |||||||
| Room Air Conditioner (of which heating) | 1.07 | 0 | 1.07 | 2.13 | 0 | 2.13 | 17.79% | Air-to-Air-Heatpump |
| Circulator pumps <2.5 kW | 0.42 | 0 | 0.42 | 0.50 | 0 | 0.50 | 3.84% | Circulators |
| Ventilation Units (res & nonres) | Left out | |||||||
| Light Sources | 1.54 | 0 | 1.54 | 2.51 | 0 | 2.51 | 1.62% | Residential appliances electricity |
| Electronic Displays | 0.39 | 0 | 0.39 | 1.61 | 0 | 1.61 | 1.62% | Residential appliances electricity |
| Set Top Boxes | 0.06 | 0 | 0.06 | 0.06 | 0 | 0.06 | 1.41% | Residential |
| VIDEO | 0.02 | 0 | 0.02 | 0.02 | 0 | 0.02 | 1.62% | Residential appliances electricity |
| Enterprise Servers and Data Storage | 0.13 | 0 | 0.13 | 0.74 | 0 | 0.74 | 6.00% | Data centers |
| Personal Computers | 0 | 0 | 0 | 0 | 0 | 0 | 1.62% | Residential appliances electricity |
| Imaging equipment | 0.08 | 0 | 0.08 | 0.1 | 0 | 0.1 | 1.62% | Residential appliances electricity |
| SB (networked) Stand-By (rest) | 0.02 | 0 | 0.02 | 0 | 0 | 0 | 1.62% | Residential appliances electricity |
| External Power Supplies | 0.10 | 0 | 0.10 | 0.17 | 0 | 0.17 | 1.62% | Residential appliances electricity |
| UPS Total | 0 | 0 | 0 | 0 | 0 | 0 | 0.00% | |
| Household Refrigeration | 0.80 | 0 | 0.80 | 1.22 | 0 | 1.22 | 1.23% | Household Refrigerators & Freezers |
| Commercial Refrigeration | 0.14 | 0 | 0.14 | 1.55 | 0 | 1.55 | 2.31% | GDP |
| Professional refrigeration products | 0.09 | 0 | 0.09 | 0.25 | 0 | 0.25 | 2.31% | GDP |
| Cooking Appliances | 0.02 | 0 | 0.02 | 0.08 | 0 | 0.08 | 1.62% | Residential appliances electricity |
| Household Coffee Makers | 0.03 | 0 | 0.03 | 0.03 | 0 | 0.03 | 1.62% | Residential appliances electricity |
| Household Washing Machine | 0.19 | 0 | 0.19 | 0.23 | 0 | 0.23 | 1.16% | Washing Machines |
| Household Dishwashers | 0.18 | 0 | 0.18 | 0.28 | 0 | 0.28 | 2.00% | Dishwashers |
| Household Laundry Drier | 0.06 | 0 | 0.06 | 0.13 | 0 | 0.13 | 1.44% | Household Laundry Driers |
| Vacuum Cleaners | 0.26 | 0 | 0.26 | 0.49 | 0 | 0.49 | 1.62% | Residential appliances electricity |
| Industrial Fans >125W | 0.61 | 0 | 0.61 | 1.39 | 0 | 1.39 | 4.08% | Electricity |
| Electric Motors LV 0.12-1000 kW | 1.27 | 0 | 1.27 | 3.02 | 0 | 3.02 | 4.08% | Electricity |
| Water pumps | 0.12 | 0 | 0.12 | 0.20 | 0 | 0.20 | 4.08% | Electricity |
| Standard Air Compressors | 0.02 | 0 | 0.02 | 0.04 | 0 | 0.04 | 2.03% | Industry |
| TRAFO Utility Transformers | 0.24 | 0 | 0.24 | 0.78 | 0 | 0.78 | 4.08% | Electricity |
| Tyres, total Cl+C2+C3 | 0 | 0.44 | 0.44 | 0 | 0.79 | 0.79 | 1.19% | Car consumption |
6.2 Norway – Bottom-up results
Below are the bottom-up results for 2030. The table is also the main assumptions for sizes in liters, kilogram, and place settings and lifetime in years.
| Size | Life time* | Baseline GWh/year | Scenario GWh/year | Saving GWh/year | |
| Refrigerator | 285 | 16 | 254.6 | 114.1 | 140.5 |
| Refrigerator/Freezer | 220/90 | 12 | 852.1 | 353 | 499.1 |
| Freezer (Chest) | 265 | 18 | 608.9 | 264.1 | 344.8 |
| Freezer (Upright) | 210 | 15 | 424.2 | 164.4 | 259.8 |
| Washing machine | 6 | 10 | 583 | 304.6 | 278.4 |
| Dishwasher | 12 | 12 | 1280.5 | 722.6 | 557.9 |
| Dryer | 6 | 12 | 672 | 214 | 458 |
| *Lifetime is the number of years a product is used. It’s not necessarily the same as technical life (until the product dies) | |||||
Table 14: Norwegian bottom-up results
6.3 Norway – Comparison bottom-up and scale down results.
Below is a comparison between the bottom-up model results from 2030 and the Top-down results in GWh/year. In 2018 Norwegian NVE[1]The Norwegian Water Resources and Energy Directorate made a report[2]”Hvor mye energi sparer vi med energimerking av produkter?” – NVE 2018 that calculates how much energy is saved by energy label for products. The results from that report are also listed in the comparison table.
For all refrigerators and freezers, the bottom-up model results and the scale-down are extremely close, while the NVE report has higher savings. For washing machines, the results are close but not the same, while dishwashers and dryers have a lot higher savings in the bottom-up model than in the other models. This is likely due to a lot higher use of these appliances in Norway than in the rest of EU. But it could also be due to a better data quality/resolution in the bottom-up model. The assumptions and method used in the NVE report differ from the assumption in the bottom-up model, which can explain the differences.
| 2030 | Bottom-up Saving GWh/year | Scale down savings GWh/year | NO E-label report GWh/year |
| All refrigerators and freezers | 1244.2 | 1220.0 | 1616.8 |
| Washing machine | 278.4 | 230.0 | 319.0 |
| Dishwasher | 557.9 | 280.0 | 390.4 |
| Dryer | 458.0 | 130.0 | 289.2 |
Table 15: Norwegian comparison between top-down and bottom-up results
7 Finland
7.1 Finland – Scale down results
Scaling factors
Below is a list of available scales. Not all scales are used but can be used to indicate the country population/GDP size etc. The description column explains the data in the scale and the source and year. The scale represents the country's percent use of the total EU consumption.
| Name | Description | Scale | Used times |
| Electricity | Energy Available for Final Consumption 2016, Electrical energy; TOE | 2.90% | 3 |
| Energy | Gross inland consumption 2016, All products; TOE | 2.11% | 0 |
| Population | Population, 2018 | 1.08% | 1 |
| GDP | GDP, 2018; Current prices, million euro | 1.47% | 1 |
| Houses | Stock of dwellings (permanently occupied), Odyssee; 2016 | 1.32% | 0 |
| Residential | Final consumption of residential with climatic corrections; 2016; Odyssee; MTOE | 1.58% | 0 |
| Space heating | Final consumption of residential for space heating with climatic corrections; Odyssee 2015; MTOE; Heating degree days reverted | 3.26% | 6 |
| Car consumption | Car consumption 2013; TOE | 1.27% | 1 |
| Industry | Final consumption of industry; Odyssee 2016; MTOE | 3.99% | 3 |
| Service | Electricity consumption of services; Odyssee 2016; MTOE | 2.74% | 3 |
| Residential electricity | Electricity consumption of houses; Odyssee 2015; kWh | 2.63% | 0 |
| Circulators | Country proportion of EU stock (guesses) X degree days above EU avg | 6.06% | 1 |
| Residential appliances electricity | Electricity consumption for dwellings for electrical appliances and lighting; Odyssee 2016 | 2.10% | 11 |
| None | None | 100.00% | 2 |
| RF stock | Fin stock/EU stock 2010 | 1.55% | 1 |
| Washing stock | Fin stock/ EU stock 2010 | 1.44% | 1 |
| Dishwasher stock | Fin Stock /EU Stock 2010 | 1.99% | 1 |
| Dryer stock | Fin stock / EU stock | 1.63% | 1 |
Table 16: Finnish scaling factors
Top-down results
The scale-down results are in TWh/year. Most products only have electricity savings, but a few heating-related products have both electricity and fuel savings. Tyres only save fuel.
Table 17: Finnish top-down results
| 2020 | 2030 | Scale | ||||||
| Group | Electricity | Fuel | Final energy | Electricity | Fuel | Final energy | Scale factor | Scale name |
| Dedicated Water Heater | 0.59 | 0 | 0.59 | 0.98 | 0 | 0.98 | 1.08% | Population |
| Central Heating combi, water heating | 0.03 | 2.35 | 2.38 | 0.03 | 5.55 | 5.58 | 3.26% | Space heating |
| Central Heating boiler, space heating | 0.23 | 16.38 | 16.61 | 0.10 | 27.41 | 27.51 | 3.26% | Space heating |
| Solid Fuel Boilers | 0 | 0.26 | 0.26 | 0 | 0.49 | 0.49 | 3.26% | Space heating |
| Central Air Cooling | 0.12 | 0 | 0.12 | 0.38 | 0 | 0.38 | 2.90% | Electricity |
| Central Air Heating | 0.13 | 0.33 | 0.46 | 0.33 | 0.75 | 1.08 | 3.26% | Space heating |
| Local Heaters | 0.52 | 0.29 | 0.81 | 0.82 | 1.01 | 1.83 | 3.26% | Space heating |
| Room Air Conditioner (of which cooling) | ||||||||
| Room Air Conditioner (of which heating) | .0.2 | 0.2 | 0.39 | 0.39 | 3.26% | Space heating | ||
| Circulator pumps <2.5 kW | 0.67 | 0.67 | 0.79 | 0.79 | 6.06% | Circulators | ||
| Ventilation Units (res & nonres) | 0.3 | 2.52 | 2.82 | 0.68 | 4.55 | 5.23 | 2.74% | Service |
| Light Sources | 1.99 | 1.99 | 3.25 | 3.25 | 2.10% | Residential appliances electricity | ||
| Electronic Displays | 0.5 | .,5 | 2.08 | 2.08 | 2.10% | Residential appliances electricity | ||
| Set Top Boxes | 0.08 | 0.08 | 0.08 | 0.08 | 2.10% | Residential appliances electricity | ||
| VIDEO | 0.02 | 0.02 | 0.02 | 0.02 | 2.10% | Residential appliances electricity | ||
| Enterprise Servers and Data Storage | 0.06 | 0.06 | 0.36 | 0.36 | 2.90% | Electricity | ||
| Personal Computers | 0 | 0 | 0 | 0 | 2.10% | Residential appliances electricity | ||
| Imaging equipment | 0.10 | 0.10 | 0.13 | 0.13 | 2.10% | Residential appliances electricity | ||
| SB (networked) Stand-By (rest) | 0.02 | 0.02 | 0 | 0 | 2.10% | Residential appliances electricity | ||
| External Power Supplies | 0.09 | 0.09 | 0.15 | 0.15 | 1.47% | GDP | ||
| UPS Total | ||||||||
| Household Refrigeration | 1.01 | 1.01 | 1.54 | 1.54 | 1.55% | RF stock | ||
| Commercial Refrigeration | 0.16 | 0.16 | 1.84 | 1.84 | 2.74% | Service | ||
| Professional refrigeration products | 0.11 | 0.11 | 0.30 | 0.3 | 2.74% | Service | ||
| Cooking Appliances | 0.02 | 0.02 | 0.10 | 0.14 | 2.10% | Residential appliances electricity | ||
| Household Coffee Makers | 0.04 | 0.04 | 0.04 | 0.04 | 2.10% | Residential appliances electricity | ||
| Household Washing Machine | 0.23 | 0.23 | 0.29 | 0.29 | 1.44% | Washing stock | ||
| Household Dishwashers | 0.18 | 0.18 | 0.28 | 0.28 | 1.99% | Dishwasher stock | ||
| Household Laundry Drier | 0.07 | 0.07 | 0.15 | 0.15 | 1.63% | Dryer stock | ||
| Vacuum Cleaners | 0.34 | 0.34 | 0.63 | 0.63 | 2.10% | Residential appliances electricity | ||
| Industrial Fans >125W | 0.60 | 0.60 | 1.36 | 1.36 | 3.99% | Industry | ||
| Electric Motors LV 0.12-1000 kW | 1.24 | 1.24 | 2.95 | 2.95 | 3.99% | Industry | ||
| Water pumps | 0.06 | 0.06 | 0.10 | 0.10 | 2.10% | Residential appliances electricity | ||
| Standard Air Compressors | 0.04 | 0.04 | 0.08 | 0.08 | 3.99% | Industry | ||
| TRAFO Utility Transformers | 0.17 | 0.17 | 0.55 | 0.55 | 2.90% | Electricity | ||
| Tyres, total Cl+C2+C3 | 0.47 | 0.47 | 0.84 | 0.84 | 1.27% | Car consumption | ||
7.2 Finland – Bottom-up results
Below are the bottom-up results for 2030. In the table is also the main assumptions for sizes in liters, kilogram and place settings and lifetime in years.
| Size | Life time* | Baseline GWh/year | Scenario GWh/year | Saving GWh/year | |
| Refrigerator | 345 | 12 | 271.1 | 120.7 | 150.4 |
| Refrigerator/Freezer | 240/90 | 12 | 1158.5 | 447.4 | 711.1 |
| Freezer (Chest) | 260 | 15 | 120.2 | 46.7 | 73.5 |
| Freezer (Upright) | 260 | 12 | 477.7 | 303.8 | 173.9 |
| Washing machine | 7 | 12 | 730.5 | 360.6 | 369.9 |
| Dishwasher | 11 | 9 | 1279.5 | 570.1 | 709.4 |
| Dryer | 7 | 10 | 1122 | 386.5 | 735.5 |
| *Lifetime is the number of years a product is used. It’s not necessarily the same as technical life (until the product dies) | |||||
Table 18: Finnish bottom-up results
7.3 Finland – Comparison bottom-up and scale down results.
Below is a comparison between the bottom-up model results from 2030 and the Top-down results in GWh/year.
The bottom-up model results are a bit lower than the Top-down savings for all refrigerators and freezers. The result for washing machines, dishwashers, and dryers from the bottom-up model is slightly higher than the Top-down results. This is likely due to a lot higher use of these appliances in Finland than in the rest of EU. But it could also be due to a better data quality/resolution in the bottom-up model.
| 2030 | Bottom-up Saving GWh/year | Scale down savings GWh/year |
| All refrigerators and freezers | 1108.9 | 1540.0 |
| Washing machine | 369.9 | 290.0 |
| Dishwasher | 709.4 | 280.0 |
| Dryer | 735.5 | 150.0 |
Table 19: Finnish comparison between top-down and bottom-up results
8 Iceland
8.1 Iceland – Scale down results
Scaling factors
Below is a list of available scales. Not all scales are used but can be used to indicate the country's population/GDP size etc. The description column explains the data in the scale and the source and year. The scale represents the country's percent use of the total EU consumption.
| Name | Description | Scale | Used times |
| Electricity | Energy Available for Final Consumption 2016, Electrical energy; TOE | 0.62% | 1 |
| None | None | 100.00% | 4 |
| Energy | Gross inland consumption 2016, All products; TOE | 0.34% | 0 |
| Population | Population, 2018 | 0.07% | 4 |
| GDP | GDP, 2018; Current prices, million euro | 0.14% | 7 |
| Industry | Final consumption of industry; Odyssee 2016; MTOE | 1.87% | 0 |
| Service | Electricity consumption of services; Odyssee 2016; MTOE | 0.54% | 1 |
| Residential electricity | Electricity consumption of houses; Odyssee 2015; kWh | 0.38% | 15 |
| Ref stock | Ref stock Ice/ EU stock | 0.07% | 1 |
| Washing stock | ICE washing stock / EU Stock | 0.06% | 1 |
| Dishwasher stock | ICE dishwasher stock / EU stock | 0.10% | 1 |
| Dryer stock | ICE dryer stock/ EU stock | 0.10% | 1 |
Table 20: Icelandic scaling factors
Top-down results
The scale-down results are in TWh/year. Most products only have electricity savings, but a few heating-related products have both electricity and fuel savings. Tyres only save fuel.
Table 21: Icelandic top-down results
| 2020 | 2030 | |||||
| Group | Only electricity | Only fuel | Final energy | Only electricity | Only fuel | Final energy |
| WH dedicated Water Heater | 0 | 0 | 0 | 0 | 0 | 0 |
| CHC Central Heating combi, water heating | 0 | 0 | 0 | 0 | 0 | 0 |
| CH Central Heating boiler, space heating | 0 | 0 | 0 | 0 | 0 | 0 |
| SFB Solid Fuel Boilers | 0 | 0 | 0 | 0 | 0 | 0 |
| AHC central Air Cooling | 0 | 0 | 0 | 0.01 | 0 | 0.01 |
| AHC central Air Heating | 0 | 0 | 0 | 0 | 0 | 0 |
| LH Local Heaters | 0.01 | 0 | 0.01 | 0.02 | 0 | 0.02 |
| RAC Room Air Conditioner (of which cooling) | 0 | 0 | 0 | 0 | 0 | 0 |
| RAC Room Air Conditioner (of which heating) | 0 | 0 | 0 | 0 | 0 | 0 |
| CIRC Circulator pumps <2.5 kW | 0.04 | 0 | 0.04 | 0.05 | 0 | 0.05 |
| VU Ventilation Units (res & nonres) | 0.02 | 0 | 0.02 | 0.03 | 0 | 0.03 |
| LS Light Sources | 0.36 | 0 | 0.36 | 0.59 | 0 | 0.59 |
| P Electronic Displays | 0.09 | 0 | 0.09 | 0.38 | 0 | 0.38 |
| STB Set Top Boxes | 0.02 | 0 | 0.02 | 0.02 | 0 | 0.02 |
| VIDEO | 0 | 0 | 0 | 0 | 0 | 0 |
| Enterprise Servers and Data Storage | 0.01 | 0 | 0.01 | 0.07 | 0 | 0.07 |
| PC Personal Computers | 0 | 0 | 0 | 0 | 0 | 0 |
| EP & IJ imaging equipment | 0.02 | 0 | 0.02 | 0.02 | 0 | 0.02 |
| SB (networked) Stand-By (rest) | 0 | 0 | 0 | 0 | 0 | 0 |
| EPS External Power Supplies | 0.02 | 0 | 0.02 | 0.04 | 0 | 0.04 |
| UPS Total | 0 | 0 | 0 | 0.01 | 0 | 0.01 |
| RF Household Refrigeration | 0.04 | 0 | 0.04 | 0.07 | 0 | 0.07 |
| CF Commercial Refrigeration | 0.01 | 0 | 0.01 | 0.09 | 0 | 0.09 |
| Professional refrigeration products | 0.01 | 0 | 0.01 | 0.02 | 0 | 0.02 |
| CA Cooking Appliances | 0 | 0 | 0 | 0.02 | 0 | 0.02 |
| CM household Coffee Makers | 0.01 | 0 | 0.01 | 0.01 | 0 | 0.01 |
| WM household Washing Machine | 0.01 | 0 | 0.01 | 0.01 | 0 | 0.01 |
| DW Household Dishwashers | 0.01 | 0 | 0.01 | 0.01 | 0 | 0.01 |
| LD household Laundry Drier | 0 | 0 | 0 | 0.01 | 0 | 0.01 |
| VC Vacuum Cleaners | 0.06 | 0 | 0.06 | 0.11 | 0 | 0.11 |
| FAN Industrial Fans >125W | 0.02 | 0 | 0.02 | 0.05 | 0 | 0.05 |
| MT Electric Motors LV 0.12-1000 kW | 0.04 | 0 | 0.04 | 0.1 | 0 | 0.1 |
| WP Water pumps | 0.01 | 0 | 0.01 | 0.02 | 0 | 0.02 |
| CP Standard Air Compressors | 0 | 0 | 0 | 0 | 0 | 0 |
| TRAFO Utility Transformers | 0.04 | 0 | 0.04 | 0.12 | 0 | 0.12 |
| Tyres, total Cl+C2+C3 | 0 | 0.05 | 0.05 | 0 | 0.09 | 0.09 |
8.2 Iceland – Bottom-up results
Below are the bottom-up results for 2030. The table is also the main assumptions for sizes in liters, kilogram, and place settings and lifetime in years.
| Size | Life time* | Baseline GWh/year | Scenario GWh/year | Saving GWh/year | |
| Refrigerator | 260 | 12 | 8.6 | 3.6 | 5 |
| Refrigerator/Freezer | 240/90 | 12 | 68.5 | 26.4 | 42 |
| Freezer (Chest) | 260 | 15 | 5.1 | 3.1 | 2 |
| Freezer (Upright) | 260 | 12 | 20.4 | 7.4 | 13 |
| Washing machine | 7 | 12 | 56.2 | 27.8 | 28.4 |
| Dishwasher | 12 | 12 | 71.2 | 38 | 33.2 |
| Dryer | 6 | 15 | 61.4 | 22 | 39.4 |
| *Lifetime is the number of years a product is used. It’s not necessarily the same as technical life (until the product dies) | |||||
Table 22: Icelandic bottom-up results
8.3 Iceland – Comparison bottom-up and scale down results.
Below is a comparison between the bottom-up model results from 2030 and the Top-down results in GWh/year.
The results are a bit lower than the Top-down savings for all refrigerators and freezers, and dishwashers. For washing machines in dryers, the bottom-up savings are higher than the Top-down savings. This is likely due to a lot higher use of these appliances in Iceland than in the rest of the EU. But it could also be due to a better data quality/resolution in the bottom-up model.
| 2030 | Baseline | Scenario | Saving | Scale down savings |
| All refrigerators and freezers | 102.6 | 40.5 | 62 | 65.9 |
| Washing machine | 56.2 | 27.8 | 28.4 | 12.3 |
| Dishwasher | 71.2 | 38.0 | 33.2 | 14.7 |
| Dryer | 61.4 | 22.0 | 39.4 | 8.6 |
Table 23: Icelandic comparison between top-down and bottom-up results
9 Sum of results and sensitivity
9.1 Total savings top-down model
The table below shows results from the top-down model in total saving per year. These calculations are based on the EU-numbers from the Ecodesign Impact Accounting-report[1]Ecodesign Impact Accounting - OVERVIEW REPORT 2018 - Prepared by VHK for the European Commission December 2018 (rev. Jan. 2019). For each product group for each country a specific scale has been assigned in an iterative process with representatives from Nordsyn authorities in each country. The total savings from the top-down model are in TWh/year:
Footnotes
- ^ Ecodesign Impact Accounting - OVERVIEW REPORT 2018 - Prepared by VHK for the European Commission December 2018 (rev. Jan. 2019)
Table 24: Total savings from the top-down model
| 2020 | 2030 | |||||||
| Primary energy | Only electricity | Only fuel | Final energy | Primary energy | Only electricity | Only fuel | Final energy | |
| Denmark | 28.06 | 6.32 | 14.79 | 21.11 | 52.32 | 12.30 | 26.49 | 38.79 |
| Sweden | 36.41 | 15.50 | 3.86 | 19.36 | 65.76 | 28.18 | 6.58 | 34.76 |
| Norway | 18.89 | 8.67 | 0.68 | 9.35 | 41.07 | 18.87 | 1.44 | 20.31 |
| Finland | 43.47 | 9.94 | 22.60 | 32.54 | 84.27 | 20.78 | 40.63 | 61.41 |
| Iceland | 1.88 | 0.87 | 0.05 | 0.92 | 4.04 | 1.88 | 0.09 | 1.97 |
9.2 Total saving bottom-up
The table below shows the total savings from the bottom-up model in GWh/year in 2030, for the products this calculation was performed for. Note that bottom-up calculations were not possible to perform for all products due to lack of data, and this therefore will not show total savings in each country from market surveillance of ecodesign and energy labelling.
| 2030 | All refrigerators and freezers | Washing machine | Dishwasher | Dryer |
| Denmark | 1327 | 422 | 437 | 840 |
| Sweden | 1702 | 503 | 603 | 847 |
| Norway | 1244 | 278,4 | 558 | 458 |
| Finland | 1109 | 370 | 709 | 736 |
| Iceland | 103 | 56 | 71 | 61 |
Table 25: Total saving bottom-up savings 2030 GWh/year
9.3 Sensitivity bottom-up model:
Robustness of bottom-up model. To examine the model's robustness, a sensitivity test was performed for refrigerator/freezers in Sweden. It shows that increasing lifetime of products leads to higher savings due to a higher stock.
The table below shows the consequences of changing the assumptions. This is an example for refrigerator/freezers in Sweden. The first line shows the standard assumption. In this example, the sales numbers don't change. The first example is a decrease in lifetime from 12 to 10 years. It causes the stock to decrease, and therefore the savings to decrease by 15%. In the second example, the lifetime is increased from 12 to 14 years. It causes the stuck to increase and thereby the savings also to increase by 14%. In the third example, the size of the refrigerator/freezer is increased by 10%, which increases the savings by 6%. In the last example, the volume is decreased by 10%, which causes the savings to fall by 5%.
| Lifetime | Combined size in liter | Savings 2030 GWh/year | Stock 2030 old label | Stock 2030 new label | Total stock | Change % |
| 12 | 330 | 977.3 | 2945445 | 2136491 | 5081936 | 0% |
| 10 | 330 | 830 | 2502930 | 2084611 | 4587541 | -15% |
| 14 | 330 | 1111.5 | 3352567 | 2143140 | 5495707 | 14% |
| 12 | 363 | 1036.4 | 2945445 | 2136491 | 5081936 | 6% |
| 12 | 297 | 923.8 | 2945445 | 2136491 | 5081936 | -5% |
Table 26: Sensibility of assumptions in the bottom-up model
10 Discussion
This project aimed to develop a tool to calculate savings from ecodesign and energy labelling in the Nordic countries, and to do a "snapshot" calculation. This report shows two different methods to calculate the savings from ecodesign and energy labelling policies in the Nordic countries. Because both methods are implemented on the online platform Nordcrawl as ready-to-use modules, it is easy to change the assumption or update the data behind the report results. This report's results should be viewed as a current snapshot, and the results can be changed in the future if better data or assumptions are obtained.
The top-down method is a fast way to calculate results for the individual country, and it provides an estimate of the savings and can be altered by using different scaling methods, as shown in this report. As shown in comparing the results between the bottom-up method and the top-down method, the results are usually in the same magnitude but not precisely the same. There are different reasons for that. The bottom-up method can easier incorporate more details on how the product is actually used in each country. In many cases where data is not available, the top-down method can provide a relatively accurate estimate of the savings. In this project, we used a range of different scales for the top-down calculations, making the result more accurate than just using a generic scale for all product groups like the population, the energy consumption or the GDP. The top-down method is – except for used scales – highly dependent on the Top-down data. In this case, the Ecodesign Impact Accounting-report[1]Ecodesign Impact Accounting - OVERVIEW REPORT 2018 - Prepared by VHK for the European Commission December 2018 (rev. Jan. 2019), which might have faults. For example, the Swedish Energy Agency says it overestimates the energy savings from ventilation units.
This project has been performed in parallel with the study “Effect of market surveillance in securing savings of ecodesign and energy labelling”.[2]Effect of market surveillance in securing savings of ecodesign and energy labelling – Kasper Mogensen 2021 The present report shows ex-ante and ex-post estimations of energy savings from ecodesign and energy labelling policies, which assumes full market compliance. The results of the market surveillance study can be seen as having ensured to realize a portion of the savings estimated but that could have been lost. The results show that market surveillance activities are cost-effective and necessary to ensure that the expected savings are realized.
About this publication
Nordcrawl3
A web-based tool to calculate energy savings of ecodesign and energy labelling policies in the Nordic countries
Kasper Schäfer Morgensen
ISBN 978-92-893-7031-8 (PDF)
ISBN 978-92-893-7032-5 (ONLINE)
http://dx.doi.org/10.6027/temanord2021-523
TemaNord 2021:523
ISSN 0908-6692
© Nordic Council of Ministers 2021
Cover photo: Oskar Lürén /Swedish Energy Agency
Published: 10/6/2021
Disclaimer
This publication was funded by the Nordic Council of Ministers. However, the content does not necessarily reflect the Nordic Council of Ministers’ views, opinions, attitudes or recommendations.
Rights and permissions
This work is made available under the Creative Commons Attribution 4.0 International license (CC BY 4.0) https://creativecommons.org/licenses/by/4.0.
Translations: If you translate this work, please include the following disclaimer: This translation was not produced by the Nordic Council of Ministers and should not be construed as official. The Nordic Council of Ministers cannot be held responsible for the translation or any errors in it.
Adaptations: If you adapt this work, please include the following disclaimer along with the attribution: This is an adaptation of an original work by the Nordic Council of Ministers. Responsibility for the views and opinions expressed in the adaptation rests solely with its author(s). The views and opinions in this adaptation have not been approved by the Nordic Council of Ministers.
Third-party content: The Nordic Council of Ministers does not necessarily own every single part of this work. The Nordic Council of Ministers cannot, therefore, guarantee that the reuse of third-party content does not infringe the copyright of the third party. If you wish to reuse any third-party content, you bear the risks associated with any such rights violations. You are responsible for determining whether there is a need to obtain permission for the use of third-party content, and if so, for obtaining the relevant permission from the copyright holder. Examples of third-party content may include, but are not limited to, tables, figures or images.
Photo rights (further permission required for reuse):
Any queries regarding rights and licences should be addressed to:
Nordic Council of Ministers/Publication Unit
Ved Stranden 18
DK-1061 Copenhagen
Denmark
pub@norden.org
Nordic co-operation
Nordic co-operation is one of the world’s most extensive forms of regional collaboration, involving Denmark, Finland, Iceland, Norway, Sweden, and the Faroe Islands, Greenland and Åland.
Nordic co-operation has firm traditions in politics, economics and culture and plays an important role in European and international forums. The Nordic community strives for a strong Nordic Region in a strong Europe.
Nordic co-operation promotes regional interests and values in a global world. The values shared by the Nordic countries help make the region one of the most innovative and competitive in the world.
The Nordic Council of Ministers
Nordens Hus
Ved Stranden 18
DK-1061 Copenhagen
pub@norden.org
Read more Nordic publications on www.norden.org/publications