
- Front page
- Contents
- Foreword
- Introduction
- Status of Our Vision 2030
- A green Nordic Region
- A competitive Nordic Region
- A socially sustainable Nordic Region
- Methodology
- Appendix 1 – Nordic indicators for Our Vision 2030 (NMR)
- Appendix 2 – Reference points
- Appendix 3 – Baseline status and trends
- About this publication
MENU
This publication is also available online in a web-
Foreword
The prime ministers have a vision of the Nordic Region as the most sustainable and integrated region in the world by 2030, a vision that drives co-operation between our countries and serves as the guiding principle for my work as Secretary General of the Nordic Council of Ministers. But what is the current status of sustainability and integration in the Region?
The status report “Is the Nordic Region the most integrated and sustainable region in the world?” shows that we are on our way but still have much to do. It follows up on the 2021 baseline report and is based on the indicators adopted by the Ministers for Nordic Co-operation in September 2020.
The report will form the basis for the Nordic Council of Ministers’ work during 2025–2030 and optimise our efforts to realise the prime ministers’ vision.
We have made greatest progress in the two strategic priorities of a competitive and socially sustainable Nordic Region, whereas our greatest challenges lie in the strategic priority of a green Nordic Region.
The biggest challenge of all is our unsustainable level of consumption and production, which has a negative impact on the climate and biodiversity. Addressing this is a huge task for Nordic co-operation.
We now have just over six years to achieve our ambitious vision for 2030. In other words, there’s no time to waste!
Karen Ellemann
Secretary General of the Nordic Council of Ministers
 Karen Ellemann
Photo: Mathilde Schmidt/norden.org
Introduction
In 2019, the prime ministers adopted Our Vision 2030, the goal of which is to make the Nordic Region the most sustainable and integrated region in the world by 2030[1]The Nordic prime ministers’ declaration on Our Vision 2030 is available here: https://www.norden.org/en/declaration/our-vision-2030 (Figure 1). The Council of Ministers has been tasked with helping to realise this vision by focusing on three strategic priorities: a green Nordic Region, a competitive Nordic Region and a socially sustainable Nordic Region.
It is an ambitious vision, and it is important to closely monitor the work towards realising it. The Council of Ministers, therefore, uses a series of indicators to evaluate progress in the run-up to 2030.
The Ministers for Nordic Co-operation adopted the indicators in September 2021. The 45 indicators are linked to the vision’s three strategic priorities. Each priority covers five focus areas, for each of which there are three indicators. There are clear links between the Nordic indicators and the UN Sustainable Development Goals in Agenda 2030.
In 2020, the Nordic Council of Ministers commissioned Rambøll Management Consulting to write a baseline report for Our Vision 2030 (Baseline 2021), followed by this status report 2023.
Footnotes
- ^ The Nordic prime ministers’ declaration on Our Vision 2030 is available here: https://www.norden.org/en/declaration/our-vision-2030
Purpose of Our Vision 2030: Status Report 2023
The purpose of this report is to assess progress towards the overall vision for 2030. It is based on the 45 indicators adopted by the Nordic Council of Ministers in 2021 and the methodology used for the baseline report.
The report offers an assessment at regional level. As such, the data for the 45 indicators reflects the status of the Nordic Region as a whole, not the individual countries. In other words, the data consists of Nordic aggregate scores weighted according to national population. The extent to which the various countries meet the indicators differs. However, because Our Vision 2030 is concerned with Nordic co-operation, the baseline report did not highlight these differences, nor does this status report.
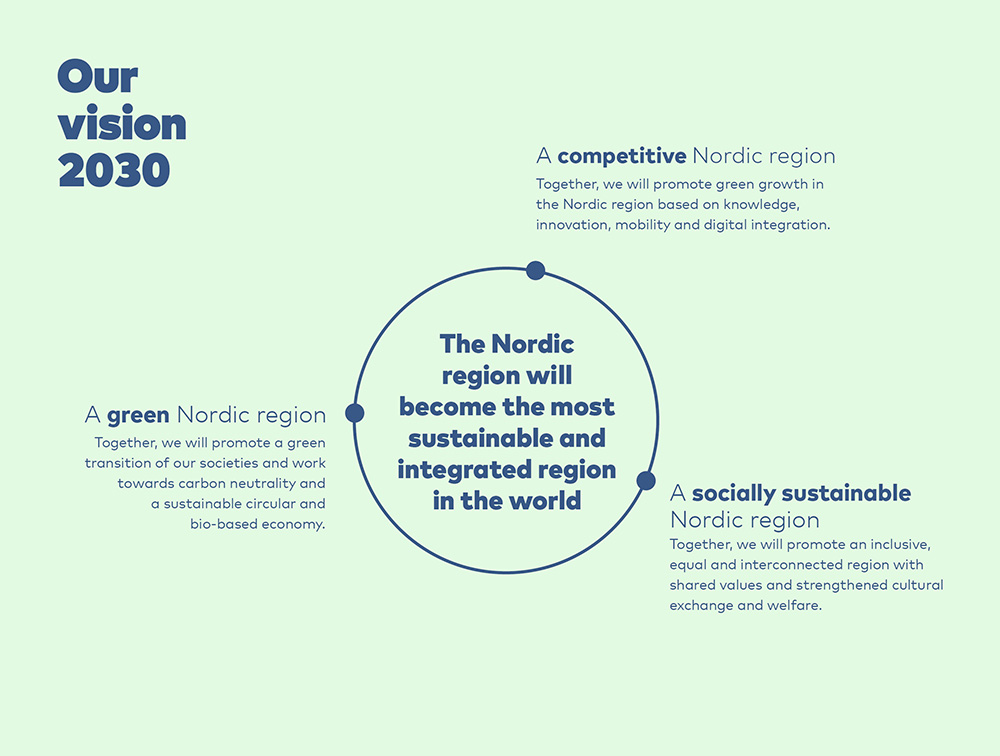
Figure 1. Our Vision 2030
Methodology
Rambøll Management Consulting developed the methodology used for the baseline report and this status report. It is based on internationally established measurements for sustainability developed by the EU, the UN and the Bertelsmann Foundation as part of Agenda 2030. The resulting assessment model is described in brief below and in more detail in section 7.
The model consists of four building blocks that together facilitate assessment of the indicators (Box 1). The building blocks are: A) setting upper and lower reference points; B) scaling and traffic light scoring, C) establishing the model benchmark; and D) inequality assessment. The upper and lower reference points (building block A) were derived using a staircase model to quantify the Nordic starting point and the status of the indicator. In other words, these are not politically determined goals set at Nordic level.
This status report describes relevant developments since the baseline report and will form the basis for future assessments as we progress towards 2030. However, there are some caveats to consider when comparing the results for status and trends in the two reports. In the baseline report, the assessments for some indicators were based on projections of historical trends, because actual data for the baseline year (2019) was not available. As a result, the status in the baseline report may differ from what actually occurred after it was published. The model is also sensitive to possible changes in the reference points, which can also affect the results, and the basis for comparison.
That does not mean that the baseline report is irrelevant. In fact, quite the contrary – it serves as an indication of how far our knowledge and understanding of the situation has improved. For further information, see the Methodology section.
Box 1: The four building blocks for the status report for Our Vision 2030
A: Setting upper and lower reference points: To make the status and progress of the 45 indicators quantifiable, we set upper and lower threshold values (Appendix 2). We based the method on a four-step staircase model supplemented by the principle that the measurements should be ambitious, realistic and meaningful in a Nordic context. The four steps were: 1) Nordic countries’ targets (weighted by population size); 2) the UN Sustainable Development Goals (SDGs) or other international goals for which the Nordic countries have signed up; 3) best-performing EU or OECD countries or the historical peak for the Nordic Region; or 4) technical extremes on the scale.
B: Scaling and traffic light scores: The model measures the status of and progress towards each ambition using a scaling and colour-coding method derived from the annual SDG Development Report (SDR). The distance between the upper and lower reference points for each indicator was plotted on a scale of 0–100, and a score assigned on one of four equal quartiles. These scores illustrate the status and progress of each indicator using a “traffic-light visualisation”:
Status: Green corresponds to 75.1–100 on the scale; yellow corresponds to 50.1–75; orange to 25.1–50; and red to 0–25.
Progress arrows: We based the arrows on a simple historical trend projection, so they only provide a hint of what the future might bring. A green arrow means that the indicator for 2030 will be in the green status field (75.1–100); a yellow arrow that the projection is moving towards the upper reference point (> 0.5%) but not fast enough to reach green status by 2030; an orange arrow indicates stagnation (-0.5–0.0%); and a red arrow indicates that the trend is moving in the wrong direction, that is towards the lower reference point (> 0.5%).
C: Benchmarks: In order to establish a comparative basis for monitoring status and progress towards the ambitions for the individual indicators, data was collected for the top five performing and comparable OECD countries and a group of comparable countries was established for each of the three strategic priorities. The group of comparable countries is updated each time the measurement is taken so that it best matches the situation at the given point in time. This means that the comparable countries in the baseline report will not necessarily be the same as those in the status reports.
D: Inequality assessments: Where data was available, gender, age and regional inequalities were assessed on the Theill index and supplementary data. The inequality assessments are purely descriptive.
The status report uses colour coding for the status assessment and progress arrows[1]The progress arrows are based on a simple projection of the historical trend and do not include other variables. As a result, the arrows only give a hint of the possible future trend. for each of the 45 indicators. The colours are:
Footnotes
- ^ The progress arrows are based on a simple projection of the historical trend and do not include other variables. As a result, the arrows only give a hint of the possible future trend.
| Status | Progress arrows | ||
| ● | Ambitions achieved | ↑ | On track |
| ● | Still some challenges | ↗ | Moderate improvements |
| ● | Still significant challenges | → | Stagnation |
| ● | Still major challenges | ↓ | Moving in wrong direction |
An expert group set up specifically for the purpose developed the methodology for the baseline report. It consisted of participants from Statistics Denmark, Statistics Sweden, Statistics Norway, the Finnish Environment Institute (SYKE), Oslo Centre for Interdisciplinary Environmental and Social Research (CIENS), Nordregio and three experts from the Nordic Council of Ministers’ Nordic Expert Group for Sustainable Development.
The report focuses on the status of the Nordic Region in relation to Our Vision 2030, based on the methods previously used to define the baseline. It does not include other analyses or research intended to explain or posit knowledge-based hypotheses about the background to the results. Like the baseline measurement, the status report is, therefore, primarily a descriptive analysis of the current position in relation to the 45 indicators.
The status report is based on the most recent available data for each of the indicators. A few indicators seem to have been particularly badly affected by the COVID-19 pandemic. Where this is the case, data from 2020 and/or 2021 is not included in the calculation for the trend. In a number of areas, no conclusions can yet be drawn about the full impact of the pandemic. As such, the status report is reluctant to conclude that any trends are solely attributable to it. In some cases, the status report mentions whether COVID-19 is assumed to have had a partial impact on the indicator, albeit without drawing any definitive conclusions.
Experts from the specialist consultancy Statisticon AB updated the data. Rambøll Management Consulting analysed the data and worked with Statisticon and the Nordic Council of Ministers to clarify any methodological questions.[1]Nordic Indicators for Our Vision 2030 https://www.nordicstatistics.org/areas/nordic-indicators-for-our-vision-2030/
Footnotes
- ^ Nordic Indicators for Our Vision 2030 https://www.nordicstatistics.org/areas/nordic-indicators-for-our-vision-2030/
Guide for the Nordic Council of Ministers’ work on Our Vision 2030
The status report for Our Vision 2030 will be used as a guide for the Council of Ministers’ work 2025–2030. The starting point and trends are important pieces of information that will help the Council of Ministers encourage already positive trends and address challenges or negative trends.
It must be stressed that several factors will influence progress towards the vision, including initiatives taken by the Council of Ministers, by the Nordic governments and by other stakeholders in the Region, as well as the impact of global trends. This report is not, therefore, an evaluation of the Council of Ministers’ work to realise its vision. Rather, it is an assessment of where the Nordic Region stands right now. The Council of Ministers can use this assessment as part of the basis on which decisions are made about future priorities and initiatives.
Status of Our Vision 2030
Overall status of the three strategic priorities
Overall, the 2023 status report shows that the Nordic Region remains on track to become the most sustainable and integrated region in the world in 2030. This is particularly true for the visions of a competitive Nordic Region and a socially sustainable Nordic Region. However, there is room for improvement with regard to the vision of a green Nordic Region.
Figure 2 provides an overview of the status report for the three strategic priorities, while the fourth box provides an overall picture for the 45 indicators. The colours reflect the status of the indicators and are described below. The figure does not depict trends for the indicators. These will be reported in the following sections.
Figure 2 shows that the picture is particularly positive in relation to the strategic priorities a competitive Nordic Region and a socially sustainable Nordic Region. However, in both of these areas, several indicators still require special focus in order to overcome existing challenges. As in the baseline report, the greatest potential for improvement is in the strategic priority a green Nordic Region. Although the Region appears to be realising its ambitions for more of the indicators than was the case in the baseline report, significant or major challenges remain in a number of areas.
Overall, the status report reflects a similar general picture to the baseline report. However, for several areas and indicators, there has been either a positive or negative change. Four indicators have changed colour in a more positive direction since the baseline report: three for a green Nordic Region, one for a competitive Nordic Region. Three indicators have changed colour in a more negative direction: one for a green Nordic Region and two for a competitive Nordic Region.
| A green Nordic Region | A competitive Nordic Region | A socially sustainable Nordic Region | The Nordic Region as a whole | |||
 |  |  |  |
| Status | ||||
| Green | Ambitions achieved | |||
| Yellow | Still some challenges | |||
| Orange | Still significant challenges | |||
| Red | Still major challenges | |||
Although the status report is subdivided into three strategic priorities, it must be emphasised that overall trends for the Region need to be considered from an integrated sustainability perspective. From that point of view, the baseline measurement and the status report indicate a number of synergies between the three strategic priorities that will be key to realising the vision. For example, the ambition of being a green Nordic Region is bolstered by the Region’s strong position in green innovation and the fact that it is highly competitive. The measurements also show that green growth and innovation must not undermine social sustainability. Growth and innovation must, in general, respect the sustainability of nature. These synergies are expanded upon later in the report.
The idea that everyone should be involved – “Leave no one behind” – is a fundamental principle in Agenda 2030 and the SDGs. As far as possible, the status report highlights gender, age and regional inequalities. It has not been possible to obtain data regarding inequalities for all of the indicators, including a green Nordic Region. This is one area in which improvements could be made.
Challenges for a green Nordic Region
The status report gives the impression that a green Nordic Region is the most challenging of the strategic priorities, as there are a number of significant or ongoing issues that transcend the focus areas.
However, the status report shows that there is a need for faster progress on green issues if the ambitions of a sustainable and integrated Nordic Region are to be realised by 2030. Nonetheless, the status of three of the indicators has improved since the baseline report, which is positive, while one has regressed.
Progress is particularly positive on ecolabelling and eutrophication of the Baltic Sea, and the Region is already fulfilling its ambitions in these areas. The trends for organic farming, renewable energy and energy intensity also suggest that the ambitions in these areas will be realised by 2030 if current trends continue.
However, in several other areas, the green potential has not yet been realised. Most notably, greenhouse gas emissions (including consumption-based emissions) are still too high. The Nordic Region also faces significant challenges in terms of greenhouse gas intensity and material footprint. With regard to the latter, the trend is actually moving in the wrong direction – even more so than in comparable countries. This was also the case in the baseline report. The trend in greenhouse gas emissions is heading in the right direction, but not fast enough.
The status report also identifies challenges in relation to the protection of nature and biodiversity. While the current status is reasonable for common bird species on agricultural land and fish stocks in the Arctic Ocean and Barents Sea, the trend is nonetheless negative, which gives cause for concern. The same applies to protected land areas and protected marine areas, for both of which the Region is not on track to fulfil its ambitions by 2030.
As mentioned previously, it has not been possible to assess inequalities in terms of a green Nordic Region because relevant data is not available. Going forward, it would be interesting to include an assessment of, in particular, regional inequalities and inequalities related to greenhouse gas emissions.
The Nordic Region is competitive, but there is potential for improvement
The status report is highly positive when it comes to the focus area a competitive Nordic Region. On most of the indicators, the Nordic Region is already fulfilling its ambitions. The report paints a picture of a competitive, innovative region with a well-educated and trained population and which prioritises research and green transition. This was also the case in the baseline report. The status for one indicator has since moved in a more positive direction, while two have unfortunately moved in the wrong direction.
The Nordic Region faces major challenges in terms of school dropout rates and gender differences in education and training. These indicators are closely linked to the focus area a socially sustainable Nordic Region and must be addressed to ensure that the Region lives up to the principle Leave no one behind”.
There are also close links between the strategic priorities a competitive Nordic Region and a green Nordic Region. The situation is positive for particulate pollution in urban areas and green patent applications, where the ambitions are already being realised. However, further action is needed on employment in the circular economy and bus and train transport. It will also be important to address challenges related to school dropout rates in order to ensure that the workforce is well-equipped to take part in the green transition.
The baseline report stressed the need to focus on intra-Nordic migration. The status report shows that this is still the case. The picture for cross-border commuting in the Øresund region is largely unchanged from the baseline report.
The Nordic Region is socially sustainable, but more work on inclusion is required
The status of the priority a socially sustainable Nordic Region is almost as positive as the status for a competitive Nordic Region. In general, the Nordic Region has healthy populations, high rates of employment and levels of equality, and a strong cultural life. Compared to the baseline report, the status of the 15 indicators for social sustainability remains unchanged.
However, there are still issues to address. First, the status report identifies significant challenges regarding gender equality. This is especially true for gender segregation on the labour market, where progress has stagnated, and fathers’ share of parental leave, which is not currently on track to meet the ambitions.[1]This assessment does not take into account the EU’s new work-life balance initiative, the deadline for the implementation of which was in 2022. Other challenges to gender equality include the integration of non-EU citizens into the labour market. This area continues to pose major challenges and is particularly critical for women from non-EU backgrounds.
The Nordic Region performs well in the areas of peace, justice and strong institutions but less so on election turnouts. Progress on the proportion of the population who report crime, violence and vandalism has also stagnated, which means there is still room for improvement here, too.
The three strategic priorities are closely linked. It is important to bear in mind that improvements in one area do not worsen conditions in another but, in fact, have positive spillover effects. For example, it is worth looking at how we can overcome the negative gender differences in education and training so that they do not spill over into the world of work.
Footnotes
- ^ This assessment does not take into account the EU’s new work-life balance initiative, the deadline for the implementation of which was in 2022.
Nordic Region
A green Nordic Region
Together we will promote the green transition of our societies and strive for carbon neutrality and a sustainable, circular and bio-based economy.
The status report indicates that the Nordic Region faces significant challenges in a number of areas when it comes to realising the ambitions of a green Nordic Region, both now and as 2030 approaches.
Although the overall trend is moving in the right direction, progress is too slow for a number of indicators. For six of them, the trend seems to be stagnating or moving in the wrong direction. On the positive side, several indicators have improved compared to the baseline report. Specifically, the status of three indicators has changed colour in a positive direction,[1]Compared to actual developments. while only one has moved in a negative direction.[2]Compared to actual developments.
The figure below shows the statuses and trends for 15 indicators in the strategic priority a green Nordic Region.
| Climate action | Greenhouse gas emissions | Consumption-based greenhouse gas emissions | Extent of Arctic ice | ||||||
| ● | ↗ | ● | ↗ | ● | → | ||||
| Affordable and clean energy | Renewable energy | Energy intensity | Greenhouse-gas intensity | ||||||
| ● | ↑ | ● | ↑ | ● | ↗ | ||||
| Responsible consumption and production | Material footprint | Recycling of municipal waste | Ecolabelling | ||||||
| ● | ↓ | ● | → | ● | ↑ | ||||
| Life on land | Protected land areas | Organic farming | Farmland birds | ||||||
| ● | → | ● | ↑ | ● | ↓ | ||||
| Life below water | Protected marine areas | Eutrophication of the Baltic Sea | Fish stocks in the Arctic Ocean and the Barents Sea | ||||||
| ● | ↗ | ● | ↑ | ● | ↓ | ||||
| See the statistics on which the indicators are based here: https://www.nordicstatistics.org/areas/nordic-indicators-for-our-vision-2030/ | |||||||||
| Status | Progress arrows | ||
| ● | Ambitions achieved | ↑ | On track |
| ● | Still some challenges | ↗ | Moderate improvements |
| ● | Still significant challenges | → | Stagnation |
| ● | Still major challenges | ↓ | Moving in wrong direction |
The green transition requires constant focus
The status report shows that for most indicators the trend is moving in the right direction, but not fast enough to realise the ambitions for 2030. As in the baseline report, a green Nordic Region remains the strategic priority area furthest from realising our ambitions.
For ecolabelling and eutrophication of the Baltic Sea, the ambitions have already been met. The status report indicates that, if current trends continue, the ambitions for organic farming, renewable energy and energy intensity will also be met by 2030.
In other areas, the Nordic Region continues to face challenges. In general, progress is not on course to realise the overall ambitions in this area by 2030. In particular, there are major challenges associated with material footprint – indeed, the trend points in the wrong direction. Recycling of municipal waste has not met its target either, and the trend has stagnated. This is particularly worrying, as the Region also lags behind the group of comparable countries, despite the fact that this has been a major focus area for the Nordic countries.[1]See Section 4.3 for a more in-depth description of the trend.
There are also significant challenges relating to greenhouse gas emissions, both general and consumption-based. The trend indicates moderate improvements, but not enough to fulfil the ambitions for 2030. A similar picture emerges for greenhouse gas intensity. The status report identifies significant challenges and a need for faster progress if the ambitions are to be realised. Compared to the baseline report, the status report generally shows a slight improvement in the status and trends for the indicators, but not enough to fulfil the ambitions by 2030.
Wildlife is also a challenge. Although the current status of common bird species on agricultural land and fish stocks in the Arctic Ocean and Barents Sea is relatively healthy, the Nordic Region is not on track – in fact, the trend is negative, which is a cause for concern. Similarly, the Region is not meeting its targets for nature reserves and marine nature reserves. The trend for the former has stagnated, which was also the case in the baseline report.
The next section describes the status and trend in each focus area.
Footnotes
- ^ See Section 4.3 for a more in-depth description of the trend.
Climate action
The Nordic Region faces major challenges
| Greenhouse gas emissions | Emissions of consumption-based greenhouse gases | Extent of Arctic ice | |||||||
| ● | ↗ | ● | ↗ | ● | → | ||||
In the focus area climate action, the Nordic Region faces challenges on all three indicators. If the trend continues as it is now, none of the ambitions in this area will be realised by 2030. Things are moving in the right direction, but progress needs to be faster. In a global context, Nordic greenhouse gas emissions are small. Through global leadership and a proactive approach, the Region can show the rest of the world the way. The status for the three indicators is unchanged since the baseline report, while the trends are moving in the right direction.
However, the Nordic Region’s total greenhouse gas emissions, which includes emissions from production, are currently too high. This is despite the fact that things are moving in the right direction and the Region has reduced its total CO2 emissions by around a third since 2010.[1]2020. Although there have been moderate improvements in the area, progress is still too slow to fulfil the ambitions. Compared to the baseline report, the trend has gone from stagnation to moderate improvement.
The Nordic Region faces significant challenges regarding consumption-based greenhouse gas emissions. This refers to emissions based on the consumption of products, whether produced in the Nordic Region or elsewhere. Currently, this indicator is only calculated for Sweden and Denmark. Since 2010, total emissions have been falling, although they have risen in certain years. While this is positive, the Nordic Region will not fulfil its ambitions for 2030 if progress does not speed up. The picture is very much the same as the baseline report.
The gradual melting of Arctic ice[2]Measures how many km2 of the Arctic are covered in ice. poses a significant challenge. According to climate scientists, the phenomenon is closely linked to greenhouse gas emissions.[3]Meredith, M., M. Sommerkorn, S. Cassotta, C. Derksen, A. Ekaykin, A. Hollowed, G. Kofinas, A. Mackintosh, J. Melbourne-Thomas, M.M.C. Muelbert, G. Ottersen, H. Pritchard, and E.A.G. Schuur, 2019: Polar Regions. In: IPCC Special Report on the Ocean and Cryosphere in a Changing Climate [H.-O. Pörtner, D.C. Roberts, V. Masson-Delmotte, P. Zhai, M. Tignor, E. Poloczanska, K. Mintenbeck, A. Alegría, M. Nicolai, A. Okem, J. Petzold, B. Rama, N.M. Weyer (eds.)]. Cambridge University Press, Cambridge, UK and New York, NY, USA, pp. 203-320. https://doi.org/10.1017/9781009157964.005. Since 1990, the Arctic ice cap has shrunk from 11.7 to 10.6 million km2, and the level in the status report is on par with 2015. If the projections are correct, the ice cap will be reduced to approximately 10 million km2 in 2030. In this light, it does not look as if the Nordic Region will fulfil its ambitions by 2030. Expert predictions about the future melting of the ice and its consequences vary considerably, but most see it as a challenge with potentially major negative implications for the climate and global society if current trends continue unabated. In summary, multiple challenges still exist, even though the picture is slightly more positive than in the baseline report.
Footnotes
- ^ 2020.
- ^ Measures how many km2 of the Arctic are covered in ice.
- ^ Meredith, M., M. Sommerkorn, S. Cassotta, C. Derksen, A. Ekaykin, A. Hollowed, G. Kofinas, A. Mackintosh, J. Melbourne-Thomas, M.M.C. Muelbert, G. Ottersen, H. Pritchard, and E.A.G. Schuur, 2019: Polar Regions. In: IPCC Special Report on the Ocean and Cryosphere in a Changing Climate [H.-O. Pörtner, D.C. Roberts, V. Masson-Delmotte, P. Zhai, M. Tignor, E. Poloczanska, K. Mintenbeck, A. Alegría, M. Nicolai, A. Okem, J. Petzold, B. Rama, N.M. Weyer (eds.)]. Cambridge University Press, Cambridge, UK and New York, NY, USA, pp. 203-320. https://doi.org/10.1017/9781009157964.005.
FURTHER INFORMATION
- Low-Carbon Circular Transition in the Nordics: Actions needed to unleash the potential (2023)
- Harnessing voluntary carbon markets for climate ambition: An action plan for Nordic cooperation (2022)
- Ecosystem accounting in the Nordic countries (2022)
Find out more here: https://www.norden.org/en/publications
Affordable and clean energy
Moving in the right direction, but not quite there yet
| Renewable energy | Energy intensity | Greenhouse gas intensity | |||||||
| ● | ↑ | ● | ↑ | ● | ↗ | ||||
The indicators for affordable and clean energy show that the Nordic Region is heading in the right direction and is expected to make progress in all areas by 2030. However, there is a particular need to address greenhouse gas intensity if the ambitions for 2030 are to be met. The statuses of renewable energy and greenhouse gas intensity remain unchanged compared to the baseline report, while both the status of and trends in energy intensity have improved.
The status of renewable energy is that challenges remain and require sustained focus. Since 2014, the share of consumption from renewable energy sources has risen from around 40% to 60%. The Nordic Region is currently well ahead of the group of comparable countries[1]Renewable energy statistics – Statistics Explained (europa.eu) in the use of renewable energy sources[2]Relative to total energy consumption. and is a pioneering region in this area. If current projections hold, this figure is expected to rise to 75% by 2030. The most positive aspect for this indicator is that the trend is sufficiently positive to suggest that the Region is on track to fulfil its ambitions by 2030. However, the Nordic countries still need to work together to ensure that this trend continues.
Energy intensity (total energy consumption in relation to GDP) continues to be a challenge for the Nordic Region, as it was at the time of the baseline report. However, significant improvements have been made. The status report identifies significant challenges, but it looks feasible to overcome them by 2030 if the trend continues. This should be seen in the light of the overall EU target of a 32.5% improvement from the starting point in 2018. While that target was for the EU as a whole rather than for each individual member state, it nonetheless serves as a useful benchmark.
Measured against this, the trend in the Nordic Region is moving in the right direction and is sufficiently positive to achieve the ambitions for 2030. Nordic energy intensity is on a par with the group of comparable countries, but based on current projections, those countries are expected to outperform the Nordic Region in 2030.
Greenhouse gas intensity (the ratio of energy-related greenhouse gas emissions to gross energy consumption) is currently not on track and still beset with challenges. The picture was the same at the time of the baseline report. Although the trend is for moderate improvement, and greenhouse gas intensity has been reduced by approximately 40% since 1996,[3]The 2021 status is based on a projection of actual data for 1990–2020. further efforts are required if the Nordic Region is to meet its 2030 ambitions.
Footnotes
- ^ Renewable energy statistics – Statistics Explained (europa.eu)
- ^ Relative to total energy consumption.
- ^ The 2021 status is based on a projection of actual data for 1990–2020.
FURTHER INFORMATION
Responsible consumption and production
Trend heading in the wrong direction
| Material footprint | Recycling of municipal waste | Ecolabelling | |||||||
| ● | ↓ | ● | → | ● | ↑ | ||||
The picture is mixed for the indicators linked to the focus area responsible consumption and production.[1]Compared to the updated baseline report. The general trend is heading in the wrong direction and there are still challenges in this area. In particular, the status report indicates that reducing the material footprint is a significant challenge. The status for ecolabelling is positive, and the ambitions are already being realised. However, there are significant challenges related to recycling of municipal waste. The Nordic Region is not currently realising its ambitions in this area and is not expected to do so by 2030. The status of material footprint is unchanged since the baseline report, recycling of municipal waste has moved in the wrong direction and ecolabelling has improved.[2]Tonnes of emissions per capita in the Nordic Region. The trends for these three indicators are unchanged since the baseline report.
The worst data is in the area material footprint[3]Tonnes of emissions per capita in the Nordic Region. where significant challenges persist. Although the Nordic Region’s material footprint has steadily decreased since 2008,[4]The status measurement for 2021 is based on a projection of actual data for 1990–2020. we lag behind both the best-performing OECD countries and the group of comparable countries. The trend is moving in the wrong direction, and there is an urgent need to reverse it if the ambitions are to be fulfilled by 2030. The baseline report reached the same conclusion.
The trend for recycling of municipal waste is negative and remains a challenge. The Nordic Region recycled approximately 8.5% less municipal waste in 2021 than 2019.[5]This may partly be explained by: 1) gaps in the NO and SE time series for 2020; and 2) a new method of calculation in Norway since 2020. The trend is for stagnation up to 2030. The Region is therefore unlikely to fulfil its ambitions. This is a step in the wrong direction since the baseline report.
The situation for ecolabelling is more positive. The Nordic Region is already fulfilling its ambitions in this area. In 2022, approximately 2,700 Nordic Swan labels were registered per 100,000 people in the Region. Ecolabelling has been steadily increasing since 2016, with an annual growth rate of 2.3%.[6]2016–2022. If this positive trend continues, current projections show that the Region will also fulfil its ambitions by 2030. However, it is not clear to what extent ecolabelling leads to sustainable consumption and a reduced material footprint.
Footnotes
- ^ Compared to the updated baseline report.
- ^ Tonnes of emissions per capita in the Nordic Region.
- ^ Tonnes of emissions per capita in the Nordic Region.
- ^ The status measurement for 2021 is based on a projection of actual data for 1990–2020.
- ^ This may partly be explained by: 1) gaps in the NO and SE time series for 2020; and 2) a new method of calculation in Norway since 2020.
- ^ 2016–2022.
FURTHER INFORMATION
- Circular Business Models: Nordic Opportunities And Challenges In The New Geopolitical Landscape (2023)
- Mapping Sustainable Textile Initiatives in the Nordic Countries (2023)
- Emission-free Construction Sites (2023)
- Climate, Gender and Consumption: A research overview of gender perspectives on sustainable lifestyles (2022)
- Innovation Dynamics in Multi-storey-Wood Construction in Sweden and Finland (2023)
Find out more here: https://www.norden.org/en/publications
Life on land
Mixed trends and challenges persist
| Protected land areas | Organic farming | Farmland birds | |||||||
| ● | → | ● | ↑ | ● | ↓ | ||||
The indicators for life on land reflect the Region’s strengths in protecting nature and biodiversity, but challenges remain. Based on current trends, the Region is on track to fulfil its ambitions for organic farming by 2030. However, improvements are required in nature reserves and common bird species on agricultural land. The mixed picture echoes the baseline report, in which the statuses and trends pointed in different directions.
The status report indicates that challenges persist regarding nature conservation. Almost 17% of Nordic landmass consists of nature conservation areas. In light of the EU target of 30%,[1]Protecting biodiversity: Commission advises how to designate additional protected areas (europa.eu) there is still room for improvement on this indicator. The trend has remained relatively unchanged since 2012.[2]16.5% in 2012. According to current projections, the trend will stagnate towards 2030. In other words, it is not expected that the ambitions in this area will be realised. As indicated in the baseline report, further action is needed.
Organic farming is the indicator in this focus area with the most positive status. In 2020, organic farmland accounted for approximately 14% of the total agricultural area, reflecting positive growth of 50% since 2012. The level is still some way off the EU target of 25%,[3]From farm to fork: Consilium (europa.eu) From farm to fork - Consilium (europa.eu) but if the current trend continues, the ambitions are likely to be met by 2030. However, it looks like the group of comparable countries may overtake the Nordic Region by 2024, so the trend may have to be sped up.
The status report shows that the Nordic Region still faces challenges in this area.[4]This differs from the baseline report, the status assessment of which was based on forecasts, not actual data. Since 2000, the bird population has fallen by 20%.[5]Data from 2020 Based on the current trend, the 2030 ambitions will not be realised. The same trend is seen in the group of comparable countries, where bird populations are also declining. Greater efforts are required on this indicator. The Nordic Region can show global leadership to boost efforts and fulfil its own ambitions. The picture remains as critical as it was in the baseline report.
Footnotes
- ^ Protecting biodiversity: Commission advises how to designate additional protected areas (europa.eu)
- ^ 16.5% in 2012.
- ^ From farm to fork: Consilium (europa.eu) From farm to fork - Consilium (europa.eu)
- ^ This differs from the baseline report, the status assessment of which was based on forecasts, not actual data.
- ^ Data from 2020
FURTHER INFORMATION
Life below water
Challenges and more work ahead
| Protected marine areas | Eutrophication of the Baltic Sea | Fish stocks in the Arctic Ocean and the Barents Sea | |||||||
| ● | ↗ | ● | ↑ | ● | ↓ | ||||
The situation for life below water is mixed, but overall, the Nordic Region faces challenges. Currently, the biggest ones relate to fish stocks in the Arctic Ocean and the Barents Sea and the proportion of marine nature reserves. The most positive trend is seen in eutrophication of the Baltic Sea, which has improved slightly in recent years. For the other two indicators, the trend needs to be accelerated. For fish stocks in the Arctic Ocean and Barents Sea, the current trend is heading in the wrong direction. It should be noted that the Nordic Region is not solely responsible for the protection of biodiversity in these marine areas. However, in addition to setting a good example, the Region has the opportunity to raise issues in relevant international forums and environmental agreements.
According to Natura 2000, the proportion of marine nature reserves is currently some way from the EU target. The status report identifies significant challenges for this indicator and shows that the Nordic Region is currently far from realising its ambitions. Current projections indicate moderate improvements by 2030, but at present progress is too slow. The picture is unchanged since the baseline report.
There is a slight improvement in relation to eutrophication of the Baltic Sea.[1]Eutrophication means that lakes or marine areas contain too many nutrient salts, often due to the use of fertilisers. See, for example (in Danish): https://undervisning.wwf.dk/eutrofiering-0 The indicator is measured against the definition set by the Helsinki Commission,[2]The upper reference has changed significantly since the baseline report, which may explain the difference between the status report and baseline report. and the Nordic Region is relatively well placed. Since 1995, the Region has reduced eutrophication by 25%, and this status report shows that it is already meeting its ambitions. However, it should be noted that the status for the Baltic Sea is highly dependent on the methodological threshold value. Other definitions or evaluations may reveal a different, more negative picture.
The picture for fish stocks in the Arctic Ocean and Barents Sea is also challenging. In two years, fish stocks (cod, blue whiting and herring) fell from almost 15 million tonnes in 2019 to 13 million tonnes in 2021. In 2004, the stock was just over 21 million tonnes. The trend is moving in the wrong direction and at an ever-faster pace.[3]Based on the average trend 2019–2021. In 2019, annual growth = -10.48%, in 2020 = -7.54% and in 2021 = -8.59%. We must act quickly to reverse the trend and fulfil the ambitions in this area by 2030. The Nordic Region still faces major challenges in this area, which was also the case in the baseline report.
Footnotes
- ^ Eutrophication means that lakes or marine areas contain too many nutrient salts, often due to the use of fertilisers. See, for example (in Danish): https://undervisning.wwf.dk/eutrofiering-0
- ^ The upper reference has changed significantly since the baseline report, which may explain the difference between the status report and baseline report.
- ^ Based on the average trend 2019–2021. In 2019, annual growth = -10.48%, in 2020 = -7.54% and in 2021 = -8.59%.
FURTHER INFORMATION
- DNA metabarcoding: Guidelines to monitor phytoplankton diversity and distribution in marine and brackish waters (2023)
- Coexistence and nature-inclusive design in Nordic offshore wind farms (2023)
- Addressing Microplastics in a Global Agreement on Plastic Pollution (2022)
- Low Sulphur Fuel Oil (LSFO): Identification of environmental impacts in a cold marine environment (2023)
- Quantification and environmental pollution aspects of lost fishing gear in the Nordic countries (2023)
- Accommodating Biodiversity in Nordic Offshore Wind Projects (2022)
- Climate actions and cultural heritage: Possibilities and points of interest concerning climate adaptive actions related to cultural heritage environments and objects (Norwegian with English summary, 2022): https://www.norden.org/no/publication/klimatilpasningstiltak-og-kulturarv
Find out more here: https://www.norden.org/en/publications
A competitive Nordic Region
Together, we will promote green growth in the Nordic Region, based on knowledge, innovation, mobility and digital integration.
The status report shows good progress in relation to the ambitions for a competitive Nordic Region based on green growth, innovation, mobility and a circular economy. Based on current trends, the Nordic Region will become even more competitive in the run-up to 2030. Since the baseline report, there has been an improvement in the status for economic growth, while both employment and educational attainment have moved in a negative direction.
The figure below shows the statuses and trends for the 15 indicators in this focus area.
| Quality education | Educational attainment | Early school leavers | Adult participation in education | ||||||
| ● | ↑ | ● | ↗ | ● | ↑ | ||||
| Decent work and economic growth | Employment | Employment in the circular economy | Economic growth | ||||||
| ● | ↑ | ● | → | ● | ↓ | ||||
| Industry, innovation, infrastructure | Research and development expenditure | Green patent applications | Digitalisation (DESI) | ||||||
| ● | ↑ | ● | ↑ | ● | ↑ | ||||
| Sustainable cities and communities | Transport in buses and trains | Pollution in urban areas | Open public spaces in urban areas | ||||||
| ● | ↗ | ● | ↑ | - | - | ||||
| Freedom of movement | Intra-Nordic immigration | Intra-Nordic trade | Cross-border commuting | ||||||
| ● | ↓ | ● | ↑ | ● | ↑ | ||||
| See the statistics on which the indicators are based here: https://www.nordicstatistics.org/areas/nordic-indicators-for-our-vision-2030/ | |||||||||
| Status | Progress arrows | ||
| ● | Ambitions achieved | ↑ | On track |
| ● | Still some challenges | ↗ | Moderate improvements |
| ● | Still significant challenges | → | Stagnation |
| ● | Still major challenges | ↓ | Moving in wrong direction |
A competitive and innovative Nordic Region can contribute positively to both the green transition and social sustainability
The status report suggests that the Nordic Region is a competitive region with well-educated and well-trained workforces, high employment rates and good positions of strength in both research and green innovation – all of which are important prerequisites for realising the ambitions for 2030.
Education and training are crucial for Nordic competitiveness. While the overall picture is of well-qualified workforces, some challenges in this area do require attention. Firstly, the Region is not currently realising its ambitions for educational attainment. Despite the positive trend in recent years, there are signs that the ambition will not be realised by 2030 if the current trend continues. Secondly, there is a lack of gender quality in education, with fewer men proceeding to higher education than women. This challenge is well-known and was also evident in the baseline report. Nonetheless, it is important to address, as the Nordic welfare society relies on well-educated workforces.
Regarding freedom of movement, there are some positive takeaways from the status report. People in the Nordic Region continue to make regular shopping trips in each other’s countries. The status for cross-border commuting in the Øresund Region is also positive. For these two indicators, the Nordic Region is already fulfilling its ambitions and is expected to do so in 2030. The picture is less positive for intra-Nordic immigration. The trend is moving in the wrong direction, and it is important to reverse this if the ambitions of an integrated Nordic Region are to be realised by 2030.
The status report shows a mixed picture for the current status and expectations towards 2030 in relation to indicators that link a competitive Nordic Region with a green Nordic Region. On the one hand, the air in Nordic cities is still clean, and the number of green patent applications has gone up in recent years. On the other hand, improvements are needed in the proportion of green jobs. The Nordic Region is currently not realising its ambitions in this area and the trend is stagnating. The same is true for public transport, which continues to face challenges. The baseline report showed a similarly mixed picture. There is still some way to go before Nordic competitiveness is green.
The following section describes the status and trend in each focus area.
Quality education
The workforce is well-qualified, but certain areas require greater focus
| Educational attainment | Early school leavers | Adult participation in education | |||||||
| ● | ↑ | ● | ↗ | ● | ↑ | ||||
Overall, the status report paints a picture of a well-trained and well-educated region. However, there is still room for improvement, especially in relation to educational attainment. More attention also needs to be paid to the education gap between men and women – men are generally less educated than women and more likely to drop out of education. This was also the case in the baseline report.
Looking at the status of the higher education indicator, the Region is already realising its ambitions. 51.4% of people aged 30–34 have completed tertiary education. In 1999, one-third of 30–34-year-olds had completed tertiary education. This trend has been steadily rising in recent decades. However, the gender distribution is skewed – 60% of women have completed tertiary education, compared to 43% of men. Based on current trends, gender inequality is expected to increase in the future. Across the Nordic Region, there is also clear inequality between rural and urban districts in terms of educational attainment. Numerous challenges remain to be addressed in this area, as was the case in the baseline report.
The Nordic Region is facing significant challenges in the area of educational attainment. The trend has been heading in the wrong direction in recent years. In 2019, the dropout rate was 8.4% (18–24-year-olds), rising to 9.7% in 2021. On this criterion, the Nordic Region is not among the best-performing EU countries. Despite the recent decline, there has been a moderate overall improvement since 2006, when the dropout rate was 11%. The gender disparity is clear, with 11.4% of men and 7.5% of women dropping out of education. If this trend continues, the gender gap is expected to widen in the future. If the ambitions for 2030 are to be realised more broadly, the trend must be further accelerated, with a particular focus on gender imbalance. The same conclusion was reached in the baseline report. In other words, the situation has not improved.
For adult and continuing education, the current status is that the Region is on track, and it is expected that the ambitions will be realised by 2030. The Nordic Region is also performing significantly better than the group of comparable countries, as it has a higher proportion of 25–64-year-olds who have completed adult and continuing education. The overall trend was positive from 2005 to 2021 but there has been a clear decline in recent years: 28.1% in 2019 to 23.9% in 2020. This may be partially related to the COVID-19 pandemic. The gender education gap is also clear, with 33% of women completing adult and continuing education, compared to 23.4% of men. In addition, participation in adult and continuing education decreases with age, with around twice as many 25–34-year-olds as 55–64-year-olds.
FURTHER INFORMATION
- Language Training Services for Adult Immigrants in the Nordic Countries: A comparative study (2023)
- Attractive Vocational Education and Training Programmes in the Nordic Region (in Danish, 2023)
- Work environment knowledge for young people (2023)
Find out more here: https://www.norden.org/en/publications
Decent work and economic growth
More green jobs are needed
| Employment | Employment in the circular economy | Economic growth | |||||||
| ● | ↑ | ● | → | ● | ↓ | ||||
Currently, the Nordic economy is growing, and the employment rate is high. However, the Region must continue to focus on economic growth and employment, particularly the proportion of jobs in the circular economy. At the same time, the Nordic Region must prioritise green growth, which requires an emphasis on knowledge, innovation and competitiveness. The status report shows a slight fall in employment and a slight improvement in economic growth.
The employment rate is 75%. This places the Nordic countries among the OECD countries with the highest proportion of people in work. Despite this, the status report indicates that there are still challenges in this area. Nonetheless, if the current trend continues, the Region will fulfil its ambitions in this area by 2030. Looking at the inequality parameters, the employment rate is 77.1% for men, 73.1% for women. In terms of age, the highest employment rate is found among 35–54-year-olds, the lowest among 55–64-year-olds. Although the employment rate is lowest for 55–64-year-olds, the rate for this group has increased by almost 10% between 2009 and 2021. The employment rate for this age group in 2021 was 73.8%. Since the baseline report, the status has fallen slightly.
The status report also identifies challenges related to jobs in the circular economy. Although the Nordic Region is performing better than the group of comparable countries, the report indicates that progress will stagnate in the run-up to 2030. Based on the current trend, it seems unlikely that the Region will be able to fulfil its ambitions by 2030. This was also the case with the baseline report.
Overall, economic growth in the Nordic Region has been positive since 2008. There was a significant dip in GDP in 2020,[1]Measured in annual GDP growth and fixed prices. related to the COVID-19 pandemic, after which growth quickly returned to 4.4% in 2021. The current status therefore fulfils the ambitions. Overall, the trend for economic growth points in a negative direction, but this should be taken with caution, as it is based on a simple historical projection.
Footnotes
- ^ Measured in annual GDP growth and fixed prices.
FURTHER INFORMATION
- Nordic and North European Flatfish Value Chains (2022)
- Attractive Vocational Education and Training Programmes in the Nordic Region (in Danish, 2023)
- Combatting long-term unemployment among immigrants beyond the COVID-19 pandemic: Experiences from the Nordic countries (2022)
Find out more here: https://www.norden.org/en/publications
Industry, innovation, infrastructure
The Nordic Region is at the forefront of digitalisation and green innovation is gaining ground
| Research and development expenditure | Green patent applications | Digitalisation (DESI) | |||||||
| ● | ↑ | ● | ↑ | ● | ↑ | ||||
The picture is positive for the focus area industry, innovation, infrastructure. The Nordic Region is a leader in digitalisation and has a high level of research and development expenditure. Based on these trends, it is expected that the ambitions for 2030 for all three indicators will be realised. The picture was the same in the baseline report.
For the indicator research and development expenditure, the status is positive, and the ambitions are already being realised. The Nordic Region has enjoyed a stable trend in this area since 2003, with research and development expenditure amounting to 2.6–2.8% of GDP p.a. Given this level of investment, the Nordic Region ranks higher than the group of comparable countries, but the lead has narrowed since 2003. If current trends continue, it is expected that the ambitions for 2030 will be realised. The Region remains strong in this area, which was also the case in the baseline report.
The indicator green patent applications[1]Data available up to and including 2020. is currently on track. The trend was positive from 2005 to 2019, during which the number of Nordic green patent applications more than doubled. However, 2020 saw a significant drop in the number of applications, probably due to the COVID-19 pandemic. In general, the Nordic Region outperforms the group of comparable countries, which also experienced significant falls in 2020. It is expected that the ambitions in this area will be realised by 2030 if the trend continues. This is the same picture as in the baseline report.[2]The deviation from the baseline report (2021) is due to the fact that data in the baseline report was based on a projection for 2019. The actual data for 2019 was more positive.
The Region faces challenges in relation to the Digital Economy and Society Index (DESI)[3]DESI monitors Europe’s digital economy and digital society. and is not currently realising its ambitions. The indicator is defined as the peak of the DESI index, and there is still room for improvement. The trend in this area has been positive since 2017. A similar positive trend has been seen among the comparable countries, although the Nordic Region has performed slightly better. If the trend continues, the Nordic Region is on track to fulfil its ambitions by 2030. Many of the conclusions in this status report are the same as in the baseline report.
FURTHER INFORMATION
Sustainable cities and communities
Both challenges and strengths
| Transport in buses and trains | Pollution in urban areas | Open public spaces in urban areas | |||||||
| ● | ↗ | ● | ↑ | - | - | ||||
Overall, the picture for sustainability in Nordic cities and local communities is relatively positive. The air has become cleaner in urban areas, but challenges remain in relation to promoting the use of public transport, e.g. buses and trains. The baseline report emphasised that the two indicators only offer a partial picture of the sustainability of cities and communities, and this is still the case.
The Nordic Region continues to face challenges in terms of the proportion of people using bus and train transport. The trend has been close to stagnant for 20 years. In 1996–2019, the use of buses and trains was around 15–18% of total passenger transport. In 2020, there was a significant drop to 12.7%, due to the COVID-19 pandemic. In general, the situation in the Nordic Region is much the same as in the group of comparable countries, which also saw the same drop in the use of bus and rail transport in 2020. This suggests that encouraging a shift from private vehicles to public transport is a general challenge. Based on the trend, the Region will not realise its ambitions in this area, so greater efforts are required. While there has been a slight improvement since the baseline report,[1]Data available up to and including 2020. it is not enough.
The picture is more positive for the indicator particulate pollution in urban areas, in which the ambitions are already being realised. Since 2012, there has been an overall reduction in pollution, and the Region has been well ahead of the group of comparable countries. If the trend continues, the ambitions for 2030 will be realised. The situation is unchanged since the baseline report.
Data for the final indicator, open public spaces in urban areas, is not yet available. As such, it has not been possible to evaluate any trends. This was also the case in the baseline report.
Footnotes
- ^ Data available up to and including 2020.
FURTHER INFORMATION
- Value Chains and Resilient Coastal Communities in the Nordic Atlantic (2022)
- A Nordic toolbox for green-blue structures and ecosystem services (Swedish with summary in English, 2022)
- Participation in cultural life in the Nordic Region: A knowledge overview based on surveys of cultural habits and research into cultural policy (in Swedish with summary in English, 2022)
- Policy Brief: Nordic Cities – Green, Resilient, Healthy – Fostering national policies and initiatives for urban green space (2022): https://www.norden.org/en/publication/policy-brief-nordic-cities-green-resilient-healthy
- Arctic Tourism in Times of Change (2022)
Find out more here: https://www.norden.org/en/publications
Freedom of movement
More intra-Nordic migration is needed, but the ambitions for an integrated Region are being realised
| Intra-Nordic immigration | Intra-Nordic imports | Cross-border commuting | |||||||
| ● | ↓ | ● | ↑ | ● | ↑ | ||||
Overall, the picture for freedom of movement within the Nordic Region is positive. However, the status report shows a need for more intra-Nordic immigration – an area in which we face challenges, and the trend is negative. The trend is unchanged since the baseline report.[1]The deviation in cross-border commuting from the baseline report (2021) is due to the fact that method of calculation has been updated and the overall picture is now more complete. The most significant difference is due to the fact that the peak point (the historic maximum) is different from that specified in 2021 (due to a break in the data series). The updated data revealed a more positive picture in 2019.
There are ongoing challenges in the area of intra-Nordic immigration, which hit its historical peak in 2011. From 2011 to 2021, the trend has been declining, resulting in current migration across the Nordic countries being on a par with the previous low point in 1992. This status report shows that the trend is heading in the wrong direction. If this continues, the Region will face even greater challenges in 2030 in terms of realising its ambitions. The picture has not changed since the baseline report.
The picture is more positive for intra-Nordic imports, an area in which ambitions are already being realised. Imports from other Nordic countries have remained relatively stable at around 20–24% of total imports over the past 20 years, albeit with a slightly downward trend. Despite this, the trend suggests that the Region will fulfil its ambitions by 2030. The baseline report came to the same conclusions.
The status report also paints a positive picture for cross-border commuting. The Nordic indicator for cross-border commuting is based on commuting between Denmark and Sweden in the Øresund Region.[2]Deviation from the baseline report (2021) is due to the fact that the data has been updated and calculated in a more complete form. The most significant difference between this and the previous report is due to the fact that the peak point (the historical maximum) is different from that used in 2021 (again due to a break in the data series). The updated data revealed a more positive picture in 2019. It is therefore not comprehensive, as it does not cover cross-border commuting across the whole Region. At present, there is a lack of up-to-date Nordic statistics on commuting. The Nordic statistics agencies are currently investigating the potential for collating regular cross-border statistics for the whole Region. The generally positive picture for cross-border commuting also depends on how statuses are compared. The reference point in this report is the historical peak in 2015. From 1997–2008, commuting in the Øresund Region steadily increased. After this time, the trend began to stagnate, with the 2023 level in line with 2010. The trend is slightly upwards.
Footnotes
- ^ The deviation in cross-border commuting from the baseline report (2021) is due to the fact that method of calculation has been updated and the overall picture is now more complete. The most significant difference is due to the fact that the peak point (the historic maximum) is different from that specified in 2021 (due to a break in the data series). The updated data revealed a more positive picture in 2019.
- ^ Deviation from the baseline report (2021) is due to the fact that the data has been updated and calculated in a more complete form. The most significant difference between this and the previous report is due to the fact that the peak point (the historical maximum) is different from that used in 2021 (again due to a break in the data series). The updated data revealed a more positive picture in 2019.
FURTHER INFORMATION
- Baseline study of cross-border data exchange in the Nordic and Baltic countries (2021)
- Re-start competence mobility in the Nordic Region (2022)
- Mapping of border obstacles to Nordic cultural exchange (2022)
- The Freedom of Movement Council’s annual report 2022 (2023): https://www.norden.org/sv/publication/granshinderradets-arsrapport-2022
Find out more here: https://www.norden.org/en/publications
A socially sustainable Nordic Region
Together, we will promote an inclusive, equal and interconnected region with shared values and strengthened cultural exchange and welfare.
The status report shows that the Nordic Region is generally well on the way to realising its ambitions for a socially sustainable region. The Nordic Region is characterised by good health, low crime, high employment rates and high levels of trust.
However, it still has room for improvement, particularly in terms of gender equality, integration of non-EU citizens into the labour market and self-rated well-being. Compared to the baseline report, the picture for this strategic priority has not altered enough for any of the indicators to change colour.[1]Compared to the updated dashboard.
The figure below shows the statuses and trends for the 15 indicators.
Footnotes
- ^ Compared to the updated dashboard.
| Good health and well-being | Life expectancy | Self-rated health | Preventable and treatable mortality | ||||||
| ● | ↑ | ● | → | ● | ↑ | ||||
| Gender equality | Gender-segregated labour market | Fathers’ share of parental leave | Women MPs | ||||||
| ● | → | ● | ↗ | ● | ↑ | ||||
| Reduced inequalities | Economic inequality | Risk of poverty and social exclusion | Labour market integration of non-EU citizens | ||||||
| ● | ↑ | ● | ↑ | ● | → | ||||
| Peace, justice and strong institutions | Social trust | Voter turnout | Crime, violence and vandalism | ||||||
| ● | ↑ | ● | → | ● | ↗ | ||||
| Strong cultural scene | Culture-related trade between the Nordic countries | Public spending on culture | Household spending on culture | ||||||
| ● | ↓ | ● | ↑ | ● | ↑ | ||||
| See the statistics on which the indicators are based here: https://www.nordicstatistics.org/areas/nordic-indicators-for-our-vision-2030/ | |||||||||
| Status | Progress arrows | ||
| ● | Ambitions achieved | ↑ | On track |
| ● | Still some challenges | ↗ | Moderate improvements |
| ● | Still significant challenges | → | Stagnation |
| ● | Still major challenges | ↓ | Moving in wrong direction |
Overall, the status report indicates that the Nordic population is in good health. People are thriving, healthy and living longer, and fewer are dying from preventable and treatable diseases. It is therefore particularly striking that self-rated health has deteriorated in recent years.
The status report notes that the Nordic Region still faces major challenges related to gender equality. In particular, the indicators gender-segregated labour market and fathers’ share of parental leave do not meet the ambitions and are unlikely to do so by 2030. On a more positive note, the proportion of women MPs is already fulfilling the ambitions.
The Nordic Region generally has a high degree of equality, and a low risk of poverty and social exclusion. In other words, it is already realising its ambitions for the area. However, the Region faces major challenges when it comes tolabour market integration of non-EU citizens, especially women. The trend suggests that the situation will deteriorate further in the run-up to 2030. As such, significant work is needed to realise the ambitions in this area.
The Nordic Region is currently characterised by high levels of social trust. If the trend continues, the ambitions for 2030 will be realised. However, the Nordic Region currently falls short of its ambitions in terms of voter turnouts, crime, violence and vandalism, and this is expected to remain the case as 2030 approaches. The picture is mixed in this focus area, but further action is required for the ambitions to be realised.
The status of the cultural sector is also mixed. Public and household spending on culture fulfil the ambitions both now and in the future. However, imports of cultural products from other Nordic countries are not on track, nor are they expected to be by 2030.
The following section describes the status and trend in each focus area.
Good health and well-being
Generally strong, but progress on self-rated health has stagnated
| Life expectancy | Self-rated health | Preventable and treatable mortality | |||||||
| ● | ↑ | ● | → | ● | ↑ | ||||
The overall picture (both now and up to 2030) for the focus area good health and wellbeing, including preventable and treatable mortality, looks positive. However, self-rated health does not currently fulfil the ambitions, and the trend is stagnant for this indicator. The status of the focus area is unchanged since the baseline report.
The status for average life expectancy is positive. Average life expectancy is 82.6 and the ambition is already being realised. It has increased by 0.6 years since 2019. In terms of gender, the data shows that the average for women is 84.4, for men 80.6. The trend also looks positive. If it continues, average life expectancy will be 84.8 in 2030, meaning that the Nordic Region will fulfil its ambitions in this area.
The picture for self-rated health (both physical and mental) is relatively positive. The Nordic Region fares better than the group of comparable countries, but some challenges still need to be overcome before its ambitions are realised. Self-rated health varies by gender and age, and between rural and urban areas. Across the Nordic countries, men rate their health more positively than women. The data also shows that self-rated health declines with age. Around 30% of those aged 85+ rate their health as good or very good, compared to around 66% of 16–24-year-olds. There is also a difference depending on whether people live in rural or urban areas. A higher proportion of people in urban areas rate their health as good or very good. The trend has largely stagnated, with a slight downward tendency, and the Region is not expected to fulfil its ambitions by 2030.
The status for preventable and treatable mortality is positive, and the Nordic Region is already realising its ambitions in this area. Currently, 182 people per 100,000 die before the age of 75 from diseases that could be prevented and treated. Mortality rates have fallen steadily since data was first collated in 2011. The positive trend means that the ambitions for 2030 are expected to be fulfilled.
FURTHER INFORMATION
- A cross-Nordic Mapping of Associative Factors to the increase of Mental Distress Among Youth: Nordic co-operation on young people’s mental health (2022)
- Cross-Nordic collaboration and practice examples: Nordic co-operation on young people’s mental health (2022)
- Alcohol and drug prevention in the Nordic countries: A conference report (2023)
- Can isolation be broken? Experiences with digital tools in elderly care in three Swedish municipalities (in Swedish, 2022)
- Health literacy in the Nordic countries: Not only a determinant of health, but also a tool for health promotion (2022)
Find out more here: https://www.norden.org/en/publications
Gender equality
Significant challenges remain
| Gender-segregated labour market | Fathers’ share of parental leave | Women MPs | |||||||
| ● | → | ● | ↗ | ● | ↑ | ||||
Significant challenges remain in the focus area gender equality. Although the ambition for the number of women MPs has been realised, there is still a need to address the stagnant trend in the gender-segregated labour market, and to increase the share of paternity leave taken by fathers.
There are significant challenges in the area gender-segregated labour market.[1]The indicator is based on the Karmel and MacLachlan index (IP index), which shows the proportion of those in work who would have to change jobs in order to achieve an equal distribution between men and women in all sectors of the labour market. 17.8% of employees would have to change jobs to achieve an equal distribution between men and women in the labour market. The trend in this area has stagnated, with a slight improvement since 2019. Based on the current trend, the Nordic Region will not fulfil its ambitions by 2030.
There are also significant challenges relating to fathers’ share of parental leave. In 2021, fathers took around 23% of parental leave, compared to around 20% in 2019. If this trend continues, the share of parental leave taken by fathers will have doubled by 2030 compared to 2009. However, this is not enough to fulfil the ambitions for 2030. As such, there is a need to increase fathers’ share of parental leave. It is expected that the trends in Finland, Denmark and Sweden will be significantly affected in the next few years by the implementation of the EU Work-Life Balance Directive, which was adopted in 2019, with a deadline for implementation in 2022.
The status for proportion of women MPs is positive. In 2022, 45.2% of MPs in the Nordic Region were women, a slight increase from 44.2% in 2019.This means that the ambitions are currently being realised, and if the trend continues this will also be the case in 2030. At present, the Nordic Region has a greater proportion of women MPs than the group of comparable countries, but this gap is expected to narrow over time.
Footnotes
- ^ The indicator is based on the Karmel and MacLachlan index (IP index), which shows the proportion of those in work who would have to change jobs in order to achieve an equal distribution between men and women in all sectors of the labour market.
FURTHER INFORMATION
- Labour market attachment in the Nordic countries: Toward a more inclusive labour market in the Nordics? (2023)
- Gender-equal pensions in the Nordics: What can the Nordic countries learn from each other in order to close the gender pension gap? (2023)
- Monitoring Digital Inclusion in the Nordic-Baltic region (2022)
- Gender in Nordic Blue Economies: Initial networking results and future academic research (2022)
- Hate crimes against LGBTI people in the Nordic Region: A mapping of strategies, working methods and initiatives
Find out more here: https://www.norden.org/en/publications
Reduced inequalities
A positive economic trend, but challenges in integrating non-EU citizens into the labour market
| Economic inequality | Risk of poverty and social exclusion | Labour market integration of Non-EU citizens | |||||||
| ● | ↑ | ● | ↑ | ● | → | ||||
In the focus area reduced inequalities, the Nordic societies generally have high levels of economic equality and a low risk of poverty and social exclusion. However, the Region still faces challenges when it comes to integrating non-EU citizens into the labour market. The overall picture is unchanged since the baseline report.
The status for economic inequality (measured by the Gini coefficient) is that the Nordic countries are among the most equal in the world. The trend has stagnated since 2004 but has stabilised at a high and positive level. The Nordic Region is therefore fulfilling its ambitions in this area. Based on the current trend, economic inequality will increase slightly towards 2030, albeit not enough to significantly change the picture.[1]In Danish: https://cepos.dk/abcepos-artikler/0004-danmark-har-den-7-laveste-ulighed-blandt-oecd-landene It is therefore expected that the Nordic Region will continue to fulfil its ambitions in this area in 2030, as was also the expectation in the baseline report.
The status report shows a positive picture regarding the risk of poverty and social exclusion. 17.2% of the population is at risk of poverty and social exclusion, the same level as in 2004. The Nordic Region is therefore currently fulfilling its ambitions in this area. There appears to be little difference in risk based on gender. However, there are differences between age groups: 31.2% of 16–24-year-olds and 37.3% of 25–54-year-olds are at risk of poverty and social exclusion, compared to those aged 55+, of whom only 15.6% are at risk. The trend is moving slightly in the wrong direction, but it looks as if the ambitions for 2030 will be fulfilled. The status report therefore paints a slightly more positive picture of the trend than the baseline report.
There are major challenges related to integration of non-EU citizens into the labour market. Overall, the trend has not changed since data was first collected in 2006, and the employment gap remains at 17%. There is an additional, significant challenge related to gender, as the employment gap for women with a non-EU background is 22%, for men 12%. This means that women with non-EU backgrounds face extra challenges in the labour market. Based on the current trend, progress will stagnate towards 2030, and the Nordic Region will not fulfil its ambitions in this area.
FURTHER INFORMATION
- Combatting long-term unemployment among immigrants beyond the COVID-19 pandemic: Experiences from the Nordic countries (2022)
- Gender-equal pensions in the Nordics: What can the Nordic countries learn from each other in order to close the gender pension gap? (2023)
- Labour market attachment in the Nordic countries: Toward a more inclusive labour market in the Nordics? (2023)
Find out more here: https://www.norden.org/en/publications
Peace, justice and strong institutions
Social trust is high, but there is room for improvement in voter turnout and prevention of crime, violence and vandalism
| Social trust | Voter turnout | Crime, violence and vandalism | |||||||
| ● | ↑ | ● | → | ● | ↗ | ||||
The three indicators related to peace, justice and strong institutions suggest that the Nordic societies still have high levels of social trust but continue to face challenges related to voter turnout and crime, violence and vandalism. Overall, the status of peace, justice and strong institutions remains more or less unchanged since the baseline report.
Social trust is currently on track. Overall, average social trust in the Nordic Region has not changed significantly since the data was first collated in 2002. The Nordic Region outperforms the group of comparable countries in this area, both now and in projections for 2030. In addition, there is no major fluctuation in social trust between genders. Based on this trend, the Nordic Region is expected to fulfil its ambitions by 2030. The data for social trust is not subdivided by age and region.
Voter turnout for general elections in the Nordic countries paints a relatively positive picture, with a turnout of 75% (2021). There is, of course, room for improvement, but this is still better than the group of comparable countries, with a turnout of 60% (2021). However, the trend is stagnant, with a slight downward tendency. If the trend continues, the ambitions for 2030 are unlikely to be fulfilled.
The Nordic Region is well on its way to reducing the proportion of the population who report problems with crime, violence and vandalism.[1]Refers to situations in which people state that crime, violence or vandalism are a problem for the household, but this is not necessarily related directly to personal experiences or violence in personal relationships. For further information see: https://www.norden.org/en/declaration/our-vision-2030 Around 7.7% of the Nordic population report problems with crime, violence and vandalism. Although the trend is positive, it is not enough for the Nordic Region to fulfil its ambitions, either now or by 2030. Challenges remain in this area, despite the situation having improved slightly since the baseline report.
Footnotes
- ^ Refers to situations in which people state that crime, violence or vandalism are a problem for the household, but this is not necessarily related directly to personal experiences or violence in personal relationships. For further information see: https://www.norden.org/en/declaration/our-vision-2030
FURTHER INFORMATION
- A Nordic approach to democratic debate in the age of Big Tech: Recommendations from the Nordic Think Tank for Tech and Democracy (2023)
- Everyday Life in the Culture of Surveillance (2023)
- “When neo-Nazis march on Norwegian streets, you hear a lot of Swedish”: Pan-Nordic and transnational dimensions of right-wing extremism (2023)
Find out more here: https://www.norden.org/en/publications
Strong cultural scene
Importing Nordic culture is a major challenge
| Culture-related trade between the Nordic countries | Public spending on culture | Household spending on culture | |||||||
| ● | ↓ | ● | ↑ | ● | ↑ | ||||
Overall, the picture for the focus area a strong cultural scene is positive. The Nordic Region already fulfils the ambitions for both household and public spending on culture. However, it is not fulfilling its ambitions for culture-related trade between the Nordic countries, for which the trend is negative. This was also the case at the time of the baseline report
Imports of physical cultural products (e.g. art and books) from other Nordic countries (based on data from Denmark, Sweden and Finland) accounted for 20.2% of total imports of cultural products in the Region in 2021. This is significantly below the historical maximum of 31.7% in 2004. The overall trend is still moving in the wrong direction, and if this continues the Region will not fulfil its ambitions by 2030. There are still challenges in this area, despite a slightly positive change since the baseline report.
Public spending on culture is currently fulfilling the ambitions. This picture has remained fairly stable since 2005. Nordic public spending is well above the level of the group of comparable countries. According to the trend, public spending on culture in the comparison countries will stagnate in the future, while spending in the Nordic Region is set to increase. This will widen the gap between the group of comparable countries and the Region, which will continue to fulfil its ambitions in 2030.
The overall picture for household spending on culture is also positive, and the ambitions for this indicator are being met. Based on the current trend, household spending on culture is expected to increase, as a result of which the Nordic Region is expected to fulfil its ambitions for 2030.[1]It should be noted that this trend excludes 2020 values due to COVID-19. Household spending has fallen slightly since the baseline report, partly due to the COVID-19 pandemic, during which many cultural programmes had to be shut down. However, this drop is not large enough to change the overall positive picture.
Footnotes
- ^ It should be noted that this trend excludes 2020 values due to COVID-19.
FURTHER INFORMATION
- Participation in cultural life in the Nordic countries: A knowledge overview based on cultural habit surveys and cultural policy research (2022)
- Changing the system: Promoting cultural sustainable development and diversity – Expert opinions from the Culture and Arts Policy Dialogues between Canada and the Nordics in 2021 (2022)
- Cultural policy in the Nordic welfare states: Aims and functions of public funding for culture (2022)
- Freedom of art and culture in the Nordic Region: Mapping based on cultural policy research (in Swedish with English summary, 2022): https://www.norden.org/sv/publication/konstens-och-kulturens-frihet-i-norden
Find out more here: https://www.norden.org/en/publications
Methodology
Rambøll Management Consulting developed the method for calculating the baseline and monitoring the indicators. It is based on the internationally recognised methodology for measuring sustainability developed for Agenda 2030 by the EU, the UN and the Bertelsmann Foundation.
The assessment model for the baseline report was developed in collaboration with an expert group that qualified and validated the draft version.
The assessment model and development process are described in greater detail below.
Comparison with the baseline report
This status report will form the basis for future assessments as we progress towards 2030. The status report therefore compares the data with the baseline report where relevant.
However, there are some caveats to consider when comparing status and trends in the two reports. For certain indicators in the baseline report, the status is based on a projection of the historical trend, as actual data for the baseline year (2019) was not available. As a result, the description in the baseline report may differ from the actual reality after the report was published.
Specifically, there are cases where the scaling – and in some cases, the traffic light score – for the individual indicators in the baseline report developed in a way that differs from the projection. However, that does not mean that the baseline report is irrelevant. Quite the contrary. It serves as an indication of how far our knowledge and understanding of the situation has improved. In this status report, footnotes indicate when the results from the baseline report turned out to be different from those shown in Appendix 3. In addition, Appendix 3 shows the results from the updated measurements and trends from the baseline report.
The model chosen for this report is sensitive to the choice of upper and lower limits and extreme values at both ends of the distribution. If the historical high/low point and/or the values of the best-performing EU or OECD countries change significantly in the period between the baseline report and the status report, it affects the model, and therefore the basis for the comparison.
In cases where COVID-19 (or other unusual factors) are not indicative of the overall trend, these outliers have been removed from the calculation. This is also indicated in footnotes where applicable.
The assessment model
The method for assessing status is based on existing approaches in the field. The final model consists of four building blocks:
A: Setting upper and lower reference points: To make the status and progress of the 45 indicators quantifiable, we set upper and lower threshold values (Appendix 2). This method is based on a four-step staircase model supplemented by the principles that the measurements should be ambitious, realistic and meaningful in a Nordic context. The four steps to setting the reference points were: 1) Nordic countries’ targets (weighted by population size); 2) SDGs or other international goals to which the Nordic countries have signed up; 3) best-performing EU or OECD countries or the historical peak for the Nordic Region; or 4) technical extremes on the scale.
B: Scaling and traffic light scores: The model measures the status of and progress towards each ambition using a scaling and colour-coding method derived from the annual SDG Development Report (SDR). The distance between the upper and lower limit was scaled from 0–100, and a score was then assigned in this range based on four equal quartiles. This starting point illustrates the status and progress of the indicator using a “traffic-light visualisation”:
Status: Green corresponds to a scaling from 75.1–100; yellow corresponds to 50.1–75; orange from 25.1–50 and red from 0–25.
Progress arrows: These are based on a simple historical trend projection, so give only a hint of what the future might bring. A green arrow means that the indicator for 2030 will be in the green status field (75.1–100); a yellow arrow that the projection is moving towards the upper reference point (> 0.5%) but not fast enough to reach green status by 2030; an orange arrow indicates stagnation (-0.5–0.0%); and a red arrow indicates that the trend is moving in the wrong direction, that is towards the lower reference point (> 0.5%).
C: Establishment of the model benchmark: In order to establish a comparative basis for monitoring status and progress towards the ambitions for the individual indicators, data was collected for the five best-performing and comparable OECD countries. A group of comparable countries was considered for each of the three strategic priorities. The group of comparable countries is updated each time the measurement is taken, so that it best matches the situation at the given point in time. This means that the comparable countries in the baseline report are not necessarily the same as those in the status reports.
D: Inequality assessment: Inequalities were assessed in relation to gender, age and/or region for the development indicators where data was available. The assessment was based on the Theill index and supported by supplementary statistics. The inequality assessment is purely descriptive.
The output of the status report consists of a colour code to indicate status and development arrows[1]The development arrows are based on a simple projection of the historical trend and do not include other variables. The arrows, therefore, give only a hint of the possible future trend. for each of the 45 Nordic indicators.
A: Setting of upper and lower limits for Nordic Council of Ministers’ indicators
The model facilitates comparisons between the current status and future projections for tangible and quantifiable reference points for each of the 45 indicators. To make this work, quantitative upper and lower limits are needed for each one. Setting the upper limit involved a prioritisation staircase based on the method developed for the SDG Development Report (SDR). The staircase consists of four methods of setting the reference point. The assessors start on the top step and work their way down until they find one that works for the particular indicator concerned. These methods are used at Nordic and international levels and mean that the baseline measurement is based on widely-accepted targets.
An overview of the prioritisation staircase for the upper reference points is illustrated below.
Footnotes
- ^ The development arrows are based on a simple projection of the historical trend and do not include other variables. The arrows, therefore, give only a hint of the possible future trend.
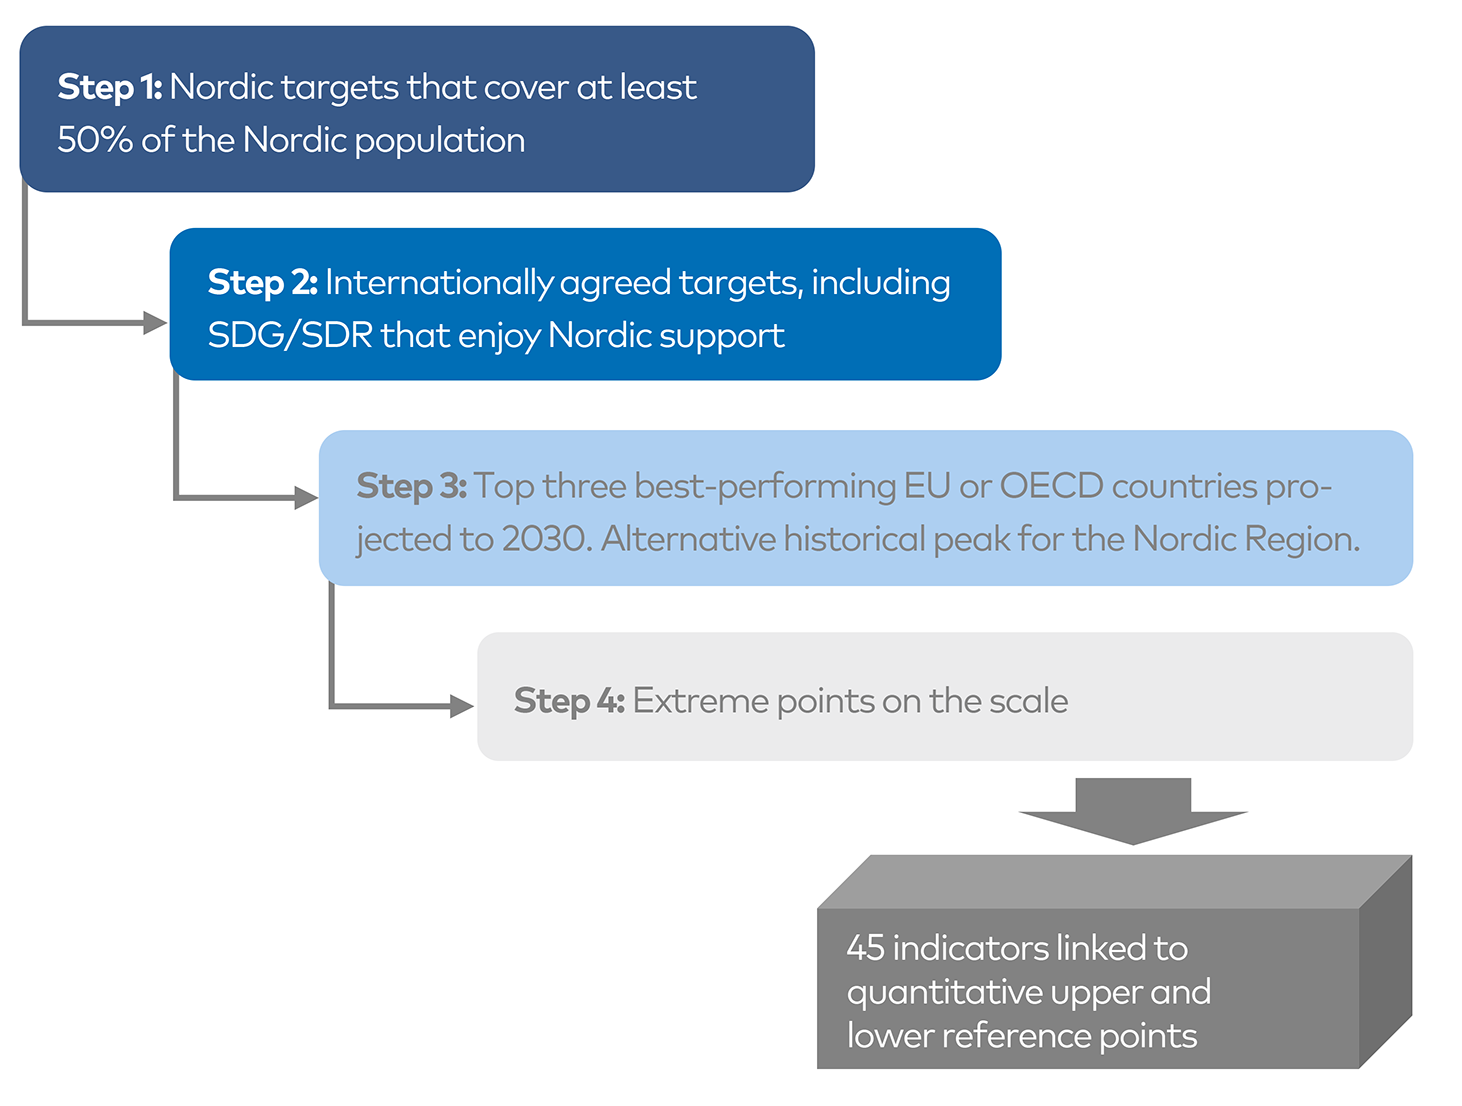
The lower reference point is set on the basis of either a weighted mean value for the lowest-performing EU or OECD countries, a technical minimum for the indicator or a historical low point for the Nordic Region. The lower reference point is set on the basis of the upper reference point, and what is considered here to be ambitious, realistic and useful for the given indicator in the Nordic context.
B: The “traffic light visualisation” of status and trend
The next building block in the model involves a re-scaling (normalisation) of the lower and upper limit (from step A) for each indicator to a score from 0–100. It is on this scale that the status of the indicator in relation to achieving the goal and progress toward the target is visualised in the model using a step-by-step colour code (traffic-light system). The colour indicates how “far” the Nordic countries are from reaching the aggregate upper reference point. The scoring method and colour-code subdivisions are based on the Sustainable Development Solutions Network (SDSN) and Bertelsmann Stiftung’s annual SDG Development Report (SDR). The score from 0–100 is subdivided into four equal quartiles, as illustrated below
| Score: 100–75.1 | Score: 75–50.1 | Score: 50–25.1 | Score: 25–0 |
| ● | ● | ● | ● |
Progress arrows: In addition to describing the current status of individual indicators, the model includes a simple projection of the historical trend toward fulfilling the goal. The projection is shown in the form of a trend line and arrows, which both in direction and colour show whether the development in the indicator supports suggests that the goal in 2030. This can act as a guide to whether Nordic initiatives have had the desired impact, but also whether there are indicators for which further initiatives should be targeted or strengthened. The trend is assigned a colour according to the following criteria:
Green arrow = when projecting the indicator to 2030, the status is within the green field (75.1–100%). Progress is deemed to be on track.
Yellow arrow = when projecting the indicator to 2030, the trend is positive, i.e. over 0.5% improvement towards the upper reference point, but not sufficient to land in the green field (i.e. 75.1–100% in 2030). The trend is deemed to be moderately positive or with moderate improvements.
Orange arrow = when projecting the indicator to 2030, progress is stagnant within a range of -0.5–0.5%. The trend is stagnating.
Red arrow = when projecting the indicator to 2030, the trend is negative, with movement of more than 0.5% towards the lower reference point. The trend is moving in the wrong direction.
The colour coding in the status report denotes the following:
| Status | Progress arrows | ||
| ● | Ambitions achieved | ↑ | On track |
| ● | Still some challenges | ↗ | Moderate improvements |
| ● | Still significant challenges | → | Stagnation |
| ● | Still major challenges | ↓ | Moving in wrong direction |
C: Setting benchmarks (benchmark countries)
In addition to presenting a status and trend report for Nordic scoring on the 45 indicators, the model also has a benchmark which sees the absolute Nordic score and trend in relation to the level and direction of travel in a group of comparable countries. Based on the Nordic Council of Ministers’ ambition to become the most sustainable and integrated region in the world, the model’s benchmark was established on the basis of the five top-performing OECD countries that are socio-economically comparable with the Nordic countries. “Comparable” is defined as those countries that differ only to a small extent from countries in the Nordic Region on a number of relevant and explanatory macroeconomic parameters. For each of the strategic priorities, a group of comparable countries has been identified. The groups have been updated since the baseline report, but the majority of them remain the same. For each strategic priority, five relevant and meaningful comparator countries have been selected, based on macroeconomic parameters such as purchasing power parity, per capita GDP, proportion of investment in health and education, inequality (Gini coefficient), etc. The groups of comparable countries for each strategic priority are listed below:
A green Nordic Region: Austria, Germany, Latvia, Lithuania, Portugal, Switzerland and the UK.
A competitive Nordic Region: Austria, Belgium, the Netherlands, Canada, Czech Republic, Germany, France.
A socially sustainable Nordic Region: Austria, Belgium, Czech Republic, Canada, France, Germany and the Netherlands.
D: Assessment of inequalities in relation to gender, age and region (“Leave no one behind”)
Where relevant, and whenever data is available, the final step in the model looks at whether there are significant differences in goal fulfilment in relation to age groups, gender and region. This should be seen as an extension of Agenda 2030’s priority “Leave no one behind”. The aim is to determine whether all social groups are equally included in relation to the indicator in question.
The inequality analysis is based on a Theill index, which facilitates the quantification of inequalities. Theil is a special version of the Generalised Entropy Index and is calculated as follows:
N is the number of categories (for example, the number of regions), is the relevant variable for which we assess inequality in the i’te category (for example, the employment rate in the i’te region) is the mean value across the categories.
At perfect equality, the index will be equal to zero, . In theory, the index is unbounded and can move towards infinity, but from a practical point of view, the upper limit will be given by which we can use to define total inequality.
The OECD uses a similar approach, for example, to provide an indication of inequality between regions. One of the strengths of this index is that it provides an opportunity to compare the degree of inequality across multiple indicators.
The assessment is based on data submitted by the Nordic Council of Ministers and supplemented by data from recognised public databases (including Statistics Denmark, Statistics Norway, etc.).
Qualifying the status report
Consultants from Statisticon AB, which specialises in statistics and data work, updated the data for the status report.
Rambøll Management Consulting has analysed the data for the updated statuses and validated the results with Statisticon and the Nordic Council of Ministers on methodological issues.
The results of the status report and the detailed assessment model have been presented to the Nordic Council of Ministers on several occasions for comments and adjustments. The final report, including a detailed updated methodology description, has been submitted to the Nordic Council of Ministers for use in subsequent updates of the status report.
Appendix 1 – Nordic indicators for Our Vision 2030 (NMR)
A green Nordic Region
| No. | Indicator | Description |
| Climate action (SDG 13) | ||
| 1.1.1 | Emission of greenhouse gasses*13.2.2 | The trend for total territorial greenhouse gas emissions (including international aviation). |
| 1.1.2 | Emission of consumptionbased GHGs*13.2.2 Data only available for Sweden at present. | The trend for total consumption-based greenhouse gas emissions. |
| 1.1.3 | Extent of Arctic ice | Number of km2 of the Arctic covered by ice. |
| Affordable and clean energy (SDG 7) | ||
| 1.2.1 | Proportion of gross energy consumption provided by renewable energy*7.2.1 | The proportion of gross energy from renewables. |
| 1.2.2 | Energy use in relation to GDP*7.3.1 | The relationship between energy supply and economic output (GDP). A lower ratio indicates that less energy is used to produce one unit of GDP. GDP is expressed at fixed prices. |
| 1.2.3 | Emission intensity from greenhouse gases from energy use | Progress since 2000 on the relationship between energy-related greenhouse gas emissions and gross domestic energy consumption (in tonnes of CO2 equivalents). |
| Responsible consumption and production (SDG 12) | ||
| 1.3.1 | Material footprint per inhabitant*8.4.1/12.2.1 | The material footprint is the amount of primary material required to cater for a country’s total material demands. The per capita material footprint describes the average material use for a country’s total material demand. |
| 1.3.2 | Degree of recycling of municipal waste*12.5.1 | The proportion of total generated municipal waste that is recycled. |
| 1.3.3 | Number of registered ecolabel licences | The number of registered licenses for the Nordic Swan ecolabel on 31 December each year. |
| Life on land (SDG 15)** | ||
| 1.4.1 | Renewable energy share of the gross energy use*15.1.2 | The proportion of land protected in accordance with Natura 2000 (Denmark, Finland, and Sweden); national parks, nature reserves, and protected habitats (Iceland); and national parks, nature reserves, and protected landscape areas (Norway). |
| 1.4.2 | Proportion of organic agricultural land*2.4.1 | The proportion of agricultural land used for organic farming (productive and sustainable). |
| 1.4.3 | Common birds in agricultural landscapes*15.5.1 | Common farmland bird index. An index of the presence of common birds in agricultural landscapes, selected by the national ornithology organisations. Index 2000 = 100. |
| Life below water (SDG 14)*** | ||
| 1.5.1 | Protected marine areas (total area)*14.5.1 | Marine areas protected in accordance with Natura 2000 (Denmark, Finland, and Sweden). Norway: Marine areas protected. |
| 1.5.2 | Eutrophication of the Baltic Sea*14.1.1 | Tonnes of nitrogen and phosphorus added to the Baltic Sea p.a. The measurements are taken from seven areas, from the Gulf of Bothnia in the north to the Kattegat between Denmark and Sweden in the south. The measurement reflects the total added from the air and watercourses. |
| 1.5.3 | Fish stocks in the Arctic Ocean and the Barents Sea*14.4.1 | Total stocks of cod, herring and blue whiting in the northeast Arctic and Barents Sea (thousands of tonnes). |
| ** Linked to Zero Hunger (SDG 2). *** Connected to Clean Water and Sanitation for All (SDG 6). | ||
A competitive Nordic Region
| No. | Indicator | Description |
| Quality education (SDG 4) | ||
| 2.1.1 | Level of education attained: college/university education*4.1.2 | The proportion of the population aged 30–34 who have completed post-secondary school education. |
| 2.1.2 | People who leave education prematurely | The proportion of the population aged 18–24 who drop out of education. |
| 2.1.3 | Adult participation in continuing education*4.3.1 | The proportion of adults aged 25–64 who have participated in continuing education during the past four weeks. Participation in education is a measure of lifelong learning. |
| Decent work and economic growth (SDG 8) | ||
| 2.2.1 | Employment rate | The proportion of the population aged 15–64 in employment. |
| 2.2.2 | Share of employment in private companies related to the circular economy (and bioeconomy) | The proportion of the total workforce employed in recycling, repair and reuse and rental and leasing. |
| 2.2.3 | Annual GDP growth*8.1.1 | The percentage change in GDP p.a. in fixed prices. Fixed prices (instead of current prices) remove the effects of price fluctuations, and the series shows the change in GDP volume. |
| Industry, innovation, infrastructure (SDG 9) | ||
| 2.3.1 | Expenditure on research and development as a share of GDP*9.5.1 | Total “in-house expenditure” on research and development as a percentage of GDP. Intramural/“in-house” R&D expenditure consists of all current and fixed expenditure for research and development during a specific period, regardless of the source of the funding. |
| 2.3.2 | Number of patent applications in environmental technology | The number of patent applications to EPO in areas classified by the OECD as “Selected environmental-related technologies”. |
| 2.3.3 | Digital Economy and Society Index (DESI) | Based on a weighting of 37 measures, DESI looks at countries’ overall digital performance and progress in terms of digital competitiveness. |
| Sustainable cities and communities (SDG 11) | ||
| 2.4.1 | Proportion of total passenger transport on buses and trains*11.2.1 | The proportion of all passenger transport on public transport expressed in passenger kilometres (pkm). Public transport refers to buses and trains. Total passenger transport includes cars, buses, and trains. |
| 2.4.2 | Exposure to airborne particulate matter pollutants in urban areas*11.6.2 | The annual average concentration of particles smaller than 2.5 µm in the air in urban areas. Weighted in proportion to population size. |
| 2.4.3 | Average proportion of public open spaces in cities in the built environment *11.7.1 | No statistics are available for this indicator at the moment. |
| Freedom of movement | ||
| 2.5.1 | Intra-Nordic immigration | Migration per 10,000 of the population from one Nordic country to another. |
| 2.5.2 | Imports of goods from Nordic countries | The proportion of total imports of goods that come from other Nordic countries. |
| 2.5.3 | Nordic region work-related commuting across Nordic national borders | The indicator measures the number of people who commute to work across the borders in the Öresund region – between Denmark and Sweden. |
A socially sustainable Nordic Region
| No. | Indicator | Description |
| Good health and well-being (SDG 3) | ||
| 3.1.1 | Average life expectancy at birth | The anticipated life expectancy at birth. |
| 3.1.2 | Self-rated health | The proportion of people who rate their health as good or very good. |
| 3.1.3 | Mortality before the age of 75 from diseases that can be prevented and cured | The number of deaths from specific diseases per 100,000 people aged 0–75. The age distribution is standardised to facilitate national comparisons. The diseases included are those deemed curable or preventable. |
| Gender equality (SDG 5) | ||
| 3.2.1 | Gender-segregated labour market | Standardised index/the Karmel MacLachlan index (IP). Proportion of the workforce that would need to change jobs in order to achieve an equal share of men and women in their occupations. |
| 3.2.2 | Fathers’ share of parental leave | Fathers’ share of parental leave. |
| 3.2.3 | Proportion of women in national parliaments*5.5.1 | The proportion of women MPs. |
| Reduced inequalities (SDG 10) **** | ||
| 3.3.1 | Gini coefficient | The Gini coefficient is an economic measure of inequality (e.g. income distribution). |
| 3.3.2 | Proportion of people living at risk of poverty and social exclusion | A summary measurement based on the following criteria: (1) people below the poverty threshold (60% of national median disposable income after social transfers); (2) severe material poverty; and (3) households with very low labour intensity. |
| 3.3.3 | Difference in unemployment/inactivity between those born outside the EU and those born in the country | The difference between the proportion of unemployed or inactive people who were born outside the EU compared with those born in the country concerned. |
| Peace, justice and strong institutions (SDG 16) | ||
| 3.4.1 | Social trust | Ten-point scale showing the level of trust people have in other people in general. The scale goes from 0 (no trust) to 10 (belief that most people are trustworthy). |
| 3.4.2 | Electoral turnout in national parliaments | The proportion of the electorate that casts a vote (valid, blank and invalid votes). |
| 3.4.3 | Proportion of the population who experience problems with crime, violence, and vandalism*16.2.1 | The proportion of the population who report experiencing problems with crime, violence or vandalism in their local area. |
| Strong cultural scene | ||
| 3.5.1 | Imports of culture-related goods from Nordic countries | The proportion of culture-related goods imported from other Nordic countries. |
| 3.5.2 | Public expenditure on culture as a share of GDP | The share of public spending (by national, regional and local government) allocated to culture. |
| 3.5.3 | Household cultural expenditure, index (2015 = 100) | Household expenditure on recreation and culture in fixed prices compared with 2015. The spending is seen as an approximation of participation levels in cultural activities. |
| **** Linked to No Poverty (SDG 1). | ||
Appendix 2 – Reference points
A green Nordic Region
| No. | Indicator | Step | Upper boundary | Lower boundary | Method used to set the boundaries |
| Climate action (SDG 13) | |||||
| 1.1.1 | Greenhouse gas emissions | 1 | 61% reduction compared to 1990-levels. | Emission volume as in 1990 | Upper boundary: Weighted average of the Nordic countries national 2030-targets Lower boundary: Emission as in the reference year used in the Paris Agreement. |
| 1.1.2i | Consumption-based greenhouse gas emissions | 2 | 37,485 thousand tonnes | 96,114 thousand tonnes | Upper boundary: 61% reduction of 2011 level (historical maximum since 2010) Lower boundary: Historical maximum since 2010 |
| 1.1.3 | Extent of Arctic ice | 3 | 16.3 m km2 | 0.0 | Upper boundary: The upper boundary is sat as the historical maximum since 1979 with respect to the levels measured in March. The upper boundary is therefore not an average between March and September.* Lower boundary: Technical minimum |
| Affordable and clean energy (SDG 7) | |||||
| 1.2.1 | Renewable energy share of the gross energy use | 1 | 89.4% | 3.0 | Upper boundary: Weighted national Nordic targets Lower boundary: As defined in the SDR-report |
| 1.2.2 | Energy use in relation to GDP | 2 | 74.5 | 110.4 | Upper boundary: EU-defined target - Reduction in energy usage of 32.5% Lower boundary: 2018-levels, as this is reference point from the reduction |
| 1.2.3 | Emission intensity of greenhouse gases from energy use | 2 | 0.0 | 117.4 | Upper boundary: SDR report, using a Technical optimum index (2000 = 100) Lower boundary: Historical maximum value index (2000 = 100) |
| Sustainable consumption and production (SDG 12) | |||||
| 1.3.1 | Material footprint per inhabitant | 4 | 14.54 | 47.07 | Upper boundary: Weighted average of the three OECD-countries with the lowest footprint, forecasted to 2030 Lower boundary: Weighted average of the three OECD-countries with the highest footprint, forecasted to 2030 |
| 1.3.2 | Degree of recycling of municipal waste | 2 | 60% | 0% | Upper boundary: EU-defined target Lower boundary: Technical minimum |
| 1.3.3 | Number of registered ecolabelling licenses | 4 | 3.288 | 0 | Upper boundary: A continued historical growth, i.e. the 2019 number of licences has been forecasted to the number that would result in 2030 assuming the same average yearly growth rate. Lower boundary: Technical minimum |
| Life on land (SDG 15) | |||||
| 1.4.1 | Proportion of protected land areas (in relation to the country’s total area) | 2 | 30% | 0% | Upper boundary: EU-defined target, as no national targets have been found Lower boundary: Technical minimum |
| 1.4.2 | Proportion of organic agricultural land | 2 | 25% | 0% | Upper boundary: EU-defined target, as no national targets have been found Lower boundary: Technical minimum |
| 1.4.3 | Common birds in agricultural landscapes | 2/3 | 100 | 0 | Upper boundary: Index of 100 (2000 as historical maximum) Lower boundary: Technical minimum |
| Life in the ocean (SDG 14) | |||||
| 1.5.1 | Protected marine areas (total area) | 2 | 30% (corresponding to an area of 108,272 km2) | 0% | Upper boundary: EU-defined target, as no national targets have been found. Lower boundary: Technical minimum |
| 1.5.2 | Eutrophication of the Baltic Sea | 3 | 813,925 tonnes p.a. | 1,124,725 tonnes p.a. | Upper boundary: Max. allowable input, MAI (of N and P) to the area per year, defined by HELCOM Lower boundary: Historical max. discharge (of N and P both) |
| 1.5.3 | North-east Atlantic catches, by fish species | 3 | 21,359 | 0 | Upper boundary: Historical maximum Lower boundary: Technical minimum |
| * https://www.eea.europa.eu/data-and-maps/daviz/arctic-sea-ice-extent-6#tab-chart_1 | |||||
A competitive Nordic Region
| No. | Indicator | Step | Upper boundary | Lower boundary | Method used to set the boundaries |
| Good education for all (SDG 4) | |||||
| 2.1.1 | Level of education attained: college/ university education | 4 | 59.8 | 0% | Upper boundary: Weighted average performance for the three top-performing EU countries projected to 2030 Lower boundary: Technical minimum |
| 2.1.2 | People who leave education prematurely | 4 | 0.6 | 11.6 | Upper boundary: Weighted average performance for the three top-performing EU countries projected to 2030 Lower boundary: Historical Maximum |
| 2.1.3 | Adult participation in continuing education | 4 | 34.6 | 0% | Upper boundary: Weighted average performance for the three top-performing EU countries projected to 2030 Lower boundary: Technical minimum |
| Decent work and sustainable economic growth (SDG 8) | |||||
| 2.2.1 | Degree of employment | 2 | 80.4 | 57.4% | Upper boundary: Weighted average for the three top-performing OECD countries, projected to 2030 Lower boundary: Weighted average for the three lowest performing OECD countries, forecasted to 2030 |
| 2.2.2 | Proportion of employment in private companies related to the circular economy | 4 | 2.9 | 0.0 | Upper boundary: Weighted average of the three top-performing EU countries, projected to 2030 Lower boundary: Technical minimum |
| 2.2.3 | Annual GDP growth | 2 | 5.1% | 0.4% | Upper boundary: Weighted average for the three top-performing OECD countries, projected to 2030 Lower boundary: Historical minimum for the Nordic Region in the period 2000–2017 |
| Sustainable industry, innovation, and infrastructure (SDG 9) | |||||
| 2.3.1 | Expenditure on research and development as a share of GDP | 2 | 3.7% | 0.0 | Upper boundary: Best-performing OECD countries Lower boundary: Technical minimum |
| 2.3.2 | Number of patent applications in environmental-related technology | 4 | 5.43 per 100,000 inhabitants | 0 per 100,000 inhabitants | Upper boundary: Weighted share of environmental patent applications per country GDP, from the three top-performing OECD countries, multiplied by the sum of the Nordic countries’ GDP, and then scaled to patents per 100,000 inhabitants in the Nordic Region Lower boundary: Technical minimum |
| 2.3.3 | Digital Economy and Society Index (DESI) | 4 | 100 | 0 | Upper boundary: Technical optimum Lower boundary: Technical minimum |
| Sustainable cities and societies (SDG 11) | |||||
| 2.4.1 | Proportion of total passenger transport on buses and trains | 4 | 29.0 | 0.0 | Upper boundary: Weighted average performance for the three top-performing EU countries projected to 2030 Lower boundary: Technical minimum |
| 2.4.2 | Exposure to airborne particulate matter pollutants in urban areas | 2 | 6.3 | 87.0 | Upper boundary: SDR report Lower boundary: SDR report |
| 2.4.3 | Average proportion of public open spaces in cities in the built environment | 3 | 15m2/ inhabitant. | 0 m2/ inhabitant | Upper boundary: Target defined by the WHO case study report Lower boundary: Technical minimum |
| Freedom of movement | |||||
| 2.5.1 | Intra-Nordic migration | 4 | 21.3 per 10,000 inhabitants | 0 per 10,000 inhabitants | Upper boundary: Historical maximum Lower boundary: Technical minimum |
| 2.5.2 | Imports of goods from Nordic countries | 4 | 23.7% | 0.0% | Upper boundary: Historical maximum value Lower boundary: Technical minimum |
| 2.5.3 | Nordic Region work-related commuting across Nordic national borders | 4 | 20,050 | 0 | Upper boundary: Historical maximum value Lower boundary: Technical minimum |
A socially sustainable Nordic Region
| No. | Indicator | Step | Upper boundary | Lower boundary | Method used to set the boundaries | |
| Good health and well-being (SDG 3) | ||||||
| 3.1.1 | Average life expectancy at birth | 2 | 83 | 54 | Upper boundary: SDR report Lower boundary: SDR report | |
| 3.1.2 | Self-rated health | 4 | 80.6% | 52.6% | Upper boundary: Weighted average performance for the three top-performing EU countries projected to 2030 Lower boundary: Weighted average for the three lowest performing OECD countries projected to 2030 | |
| 3.1.3 | Mortality before the age of 75 from diseases that can be prevented and cured | 4 | 137.5 | 400.9 | Upper boundary: Weighted average of national targets from Denmark and Sweden, projected to 2030 Lower boundary: Weighted average of the three lowest performing EU countries, projected to 2030 | |
| Gender equality (SDG 5) | ||||||
| 3.2.1 | Gender-segregated labour market | 4 | 13.2 | 20.2 | Upper boundary: Weighted average for the three top-performing EU countries, projected to 2030 Lower boundary: Weighted average for the three lowest performing EU countries, forecasted to 2030 | |
| 3.2.2 | Fathers’ share of parental leave | 4 | 50% | 0% | Upper boundary: Technical optimum Lower boundary: Technical minimum | |
| 3.2.3 | Proportion of women in national parliaments | 4 | 50% | 0% | Upper boundary: Technical optimum Lower boundary: Technical minimum | |
| Reduced inequalities (SDG 10) | ||||||
| 3.3.1 | Gini coefficient | 2 | 0.275 | 0.63 | Upper boundary: SDR report Lower boundary: SDR report | |
| 3.3.2 | Proportion of people living at risk of poverty and social exclusion | 2/4 | 0% | 100% | Upper boundary: Technical maximum Lower boundary: Technical minimum | |
| 3.3.3 | Difference in unemployment/ inactivity between those born outside the EU and those born in the EU | 4 | 0.0% | 18.2% | Upper boundary: Technical minimum Lower boundary: Historical maximum | |
| Peaceful and inclusive societies (SDG 16) | ||||||
| 3.4.1 | Social trust | 4 | 6.9 | 4.2 | Upper boundary: Historical maximum Lower boundary: Weighted average of the three lowest performing EU countries, projected to 2030 | |
| 3.4.2 | Electoral turnout in national parliaments | 4 | 90.8% | 46.2% | Upper boundary: Weighted average of the three best-performing OECD countries Lower boundary: Weighted average of the three poorest performing OECD countries | |
| 3.4.3 | Proportion of population who report problems with crime, violence or vandalism | 4 | 0.0% | 17.3% | Upper boundary: Technical optimum Lower boundary: Weighted average of the three lowest performing EU countries, projected to 2030 | |
| Strong culture | ||||||
| 3.5.1 | Imports of culture-related goods from Nordic countries | 4 | 31.7% | 0.0% | Upper boundary: Historical maximum Lower boundary: Technical minimum | |
| 3.5.2 | Public expenditure on culture as a share of GDP | 4 | 1.6% | 0.0 | Upper boundary: Historical maximum Lower boundary: Technical minimum | |
| 3.5.3 | Household cultural expenditure | 4 | 124.8 | 0.0 | Upper boundary: Historical maximum (Index (2015 = 100)) Lower boundary: Technical minimum (Index (2015 = 100)) | |
Appendix 3 – Baseline status and trends
Appendix 3 shows an updated status for the 45 indicators in the baseline report. For some indicators, the status colours have changed since the 2021 baseline report. This is due to new data for some of the indicators that were based on projections in the baseline report.
There has been no corresponding update of the trends as the methodological complexity was deemed too high.
Below are the statuses and trends for the baseline report, divided into the three strategic priorities.
A green Nordic Region: Baseline report status and trends
| Climate action | Greenhouse gas emissions | Consumption-based greenhouse gas emissions | Extent of Arctic ice | ||||||
| ● | ↗ | ● | ↗ | ● | → | ||||
| Affordable and clean energy | Renewable energy | Energy intensity | Greenhouse-gas intensity | ||||||
| ● | ↑ | ● | ↑ | ● | ↗ | ||||
| Responsible consumption and production | Material footprint | Recycling of municipal waste | Ecolabelling | ||||||
| ● | ↓ | ● | → | ● | ↑ | ||||
| Life on land | Protected land areas | Organic farming | Farmland birds | ||||||
| ● | → | ● | ↑ | ● | ↓ | ||||
| Life below water | Protected marine areas | Eutrophication of the Baltic Sea | Fish stocks in the Arctic Ocean and the Barents Sea | ||||||
| ● | ↗ | ● | ↑ | ● | ↓ | ||||
Colour changes for status in the baseline report on dashboard updates: 1) Eutrophication of the Baltic Sea (red to yellow), 2) Common birds in farmland (green to yellow).
A competitive Nordic Region: Baseline report status and trends
| Quality education | Educational attainment | Early school leavers | Adult participation in education | ||||||
| ● | ↑ | ● | ↗ | ● | ↑ | ||||
| Decent work and economic growth | Employment | Employment in the circular economy | Economic growth | ||||||
| ● | ↑ | ● | → | ● | ↓ | ||||
| Industry, innovation, infrastructure | Research and development expenditure | Green patent applications | Digitalisation (DESI) | ||||||
| ● | ↑ | ● | ↑ | ● | ↑ | ||||
| Sustainable cities and communities | Transport in buses and trains | Pollution in urban areas | Open public spaces in urban areas | ||||||
| ● | → | ● | ↑ | - | - | ||||
| Freedom of movement | Intra-Nordic immigration | Intra-Nordic trade | Cross-border commuting | ||||||
| ● | → | ● | ↑ | ● | ↓ | ||||
Colour changes for status in the baseline report on dashboard updates: 1) Economic growth (yellow to red), 2) Green patent applications (yellow to green), 3) Cross-border commuting (yellow to green).
A socially sustainable Nordic Region: Baseline report status and trends
| Good health and well-being | Life expectancy | Self-rated health | Preventable and treatable mortality | ||||||
| ● | ↑ | ● | → | ● | ↑ | ||||
| Gender equality | Gender-segregated labour market | Fathers’ share of parental leave | Women MPs | ||||||
| ● | → | ● | ↗ | ● | ↑ | ||||
| Reduced inequalities | Economic inequality | Risk of poverty and social exclusion | Labour market integration of Non-EU citizens | ||||||
| ● | ↑ | ● | ↑ | ● | → | ||||
| Peace, justice and strong institutions | Social trust | Voter turnout | Crime, violence and vandalism | ||||||
| ● | ↑ | ● | → | ● | ↗ | ||||
| Strong cultural scene | Culture-related trade between the Nordic countries | Public spending on culture | Household spending on culture | ||||||
| ● | ↓ | ● | ↑ | ● | ↑ | ||||
Colour changes for status in the baseline report when updating the dashboard.
About this publication
THE NORDIC REGION – a sustainable and integrated region?
Our Vision 2030 – Status Report 2023
PolitikNord 2023:728
ISBN 978-92-893-7605-1 PDF
ISBN 978-92-893-7606-8 ONLINE
http://doi.org/10.6027/politiknord2023-728
© Nordic Council of Ministers 2023
This publication was funded by the Nordic Council of Ministers. However, the content does not necessarily reflect the Nordic Council of Ministers’ views, opinions, attitudes or recommendations.
Published: 6.7.2023
Video: Common Ground
Nordic co-operation
Nordic co-operation is one of the world’s most extensive forms of regional collaboration, involving Denmark, Finland, Iceland, Norway, Sweden, the Faroe Islands, Greenland, and Åland.
Nordic co-operation has firm traditions in politics, the economy, and culture. It plays an important role in European and international collaboration, and aims at creating a strong Nordic community in a strong Europe.
Nordic co-operation seeks to safeguard Nordic and regional interests and principles in the global community. Shared Nordic values help the region solidify its position as one of the world’s most innovative and competitive.
Nordic Council of Ministers
Nordens Hus
Ved Stranden 18
DK-1061 Copenhagen
www.norden.org
Read more Nordic publications: www.norden.org/publications