Many sectors lag behind
The Nordic countries have reduced CO2 emissions from fossil fuels and industry by 30% since 1990. In that sense, we are on track.
The overall GHG emissions decreased between 1990 and 2010. However, since then, the increasing LULUCF emissions have to some degree countered the reductions in CO2 emissions from fossil fuels and industry, leading to a diversion from our track.
Finland, Iceland and Norway have set earlier target years for climate neutrality and/or emission reductions and need further initiatives to achieve their respective targets in time.
Denmark and Sweden have chosen later target years (2050 and 2045 respectively) for their climate neutrality and emission reductions and are on track to reach them.
Targets for Nordic Climate Neutrality
In 2019, the Nordic countries signed a joint Declaration on Carbon Neutrality, committing to making the Nordic countries carbon neutral, in line with the COP21 Paris Climate Agreement. All Nordic countries are aiming for climate neutrality with different target years and varying additional overall targets.
Country | Target year for climate neutrality | LULUCF* included | Carbon credits allowed | Emission reduction targets on the way to climate neutrality | Based on |
Denmark | 2050 | Yes | No | GHG –70% by 2030 | |
Finland | 2035 | Yes | No | GHG excl. LULUCF –60% by 2030, -80% by 2040, -90% by 2050 | |
Iceland | 2040 | Yes | No | GHG excl. LULUCF –40% by 2030 | |
Norway | 2050 | Yes | Yes | GHG excl. LULUCF - 55% by 2030 | |
Sweden | 2045 | Yes** | No** | GHG excl. LULUCF –85% by 2045 |
* LULUCF: Land Use, Land Use Change, and Forestry.
** Sweden's forest carbon sinks are very large, and their negative emissions re calculated only partially in the overall target. Sweden's climate goals technically allow credits, but LULUCF sinks should be enough to provide the remaining 15% of the GHG reductions.
** Sweden's forest carbon sinks are very large, and their negative emissions re calculated only partially in the overall target. Sweden's climate goals technically allow credits, but LULUCF sinks should be enough to provide the remaining 15% of the GHG reductions.
Total emission reductions not on track
Nordic CO2 emissions from fossil fuels and industry are decreasing with at pace modelled in the NCES project.
However, the total GHG emissions have decreased more slowly between 2010-2020 than between 2000-2010 due to reduced forest carbon sinks, and are currently not on the trajectory to reach the national targets.
Progress towards Nordic climate neutrality
Looking at historical developments in emissions in the Nordic countries, they have been falling relative to 1990 levels. The dashed lines indicate the estimated target pathways from 2020 to the respective target years of each country. Additional targets listed in the previous slide are included in the estimates.
Norway, Finland, and Iceland have the most ambitious target years (2030-2040), but are not yet on their GHG reduction target pathways.
Sweden and Denmark are aiming for carbon neutrality in 2045 and 2050, respectively, and are both on track to reach those longer-term targets.
Large CO2 emission reductions from fossil fuels and industry
Nordic CO2 emissions from fossil fuels and industry increased until the early 2000s and have steadily decreased since, due to a wide range of energy and climate policies. In 2022, a 30% decrease compared to 1990 in Nordic CO2 emissions from fossil fuels and industry was achieved, as shown in Figure 02.3.
The country picture is more nuanced: Norway has reduced CO2 emissions from fossil fuels and industry per capita by 8% compared to 1990 levels, but not the country’s overall CO2 emissions. This is because of a quite significant growth of population.
In Iceland’s case, the CO2 emissions from fossil fuels and industry rose, both overall and per capita, to a large extent because of a growth in carbon intensive industry.
Denmark left behind a carbon-heavy power and heat sector, succeeding in reducing CO2 emissions from fossil fuels and industry per capita by 53% in 2022 compared to 1990 levels. Sweden and Finland both follow close behind with 49% and 42% reductions, respectively.
Denmark | Finland | Iceland | Norway | Sweden | Nordics | |
1990 | 10,3 | 11,3 | 8,7 | 8,1 | 6,7 | 8,8 |
2022 | 4,8 | 6,5 | 9,9 | 7,4 | 3,4 | 5,2 |
Reduction | -53% | -42% | 13% | -8% | -49% | -41% |
Data sources: Denmark’s Integrated National Energy and Climate Plan, Finland's Integrated Energy and Climate Plan, Iceland’s Climate Action Plan 2020, KLIMAKUR 2030, Sveriges integrerade nationella energi- och klimatplan, The Swedish climate policy framework, Hiilineutraali suomi 2035 - Skenaariot ja vaikutusarviot, National Inventory Report - Emissions of greenhouse gases in Iceland from 1990 to 2018, REPORT ON POLICIES, MEASURES AND PROJECTIONS - Projections of Greenhouse Gas emissions in Iceland til 2035, Meld. St. 13 (2020 – 2021) Report to the Storting (white paper); Norway’s Climate Action Plan for 2021–2030, EEA; Trends and projections in Europe 2019
Largest emission reductions in the power and heat sector
In the Nordics, the largest CO2 reductions have been in the power and heat sectors (-25 MtCO2 from 1990 to 2022) and other fuel combustion (-23 MtCO2 from 1990 to 2022). Other fuel combustion is mainly from the heating but includes a range of smaller CO2 sources as well.
Nordic road transport emissions peaked in 2008 and have reduced since. In 2022, these emissions were 7% below 1990 levels.
Industrial CO2 emissions (fuel use and processes) also peaked in the early 2000s and have declined since. In 2022, these emissions were 11% below 1990 levels.
Emissions decoupling from energy consumption
Since 1990, the Nordic countries have achieved a 30% reduction in CO2 emissions by 2021. Despite this reduction, both gross and final energy consumption in the Nordics have increased by 13% and 16%, respectively, since 1990.
The energy consumption in Iceland between 1990-2021 has doubled, which can be attributed to the country's success in attracting energy-intensive industries that seek to benefit from its green electricity. Norway’s energy consumption increased by 31%, while Denmark’s and Sweden’s increased by only 7% each. Finland’s energy consumption increased by 18%.
Meanwhile, populations across the Nordic countries have grown since 1990, meaning that the increase in energy consumption per capita has not necessarily followed the same upward trend. This suggests that while overall energy consumption has risen, the efficiency and sustainability of energy use per individual may have improved.
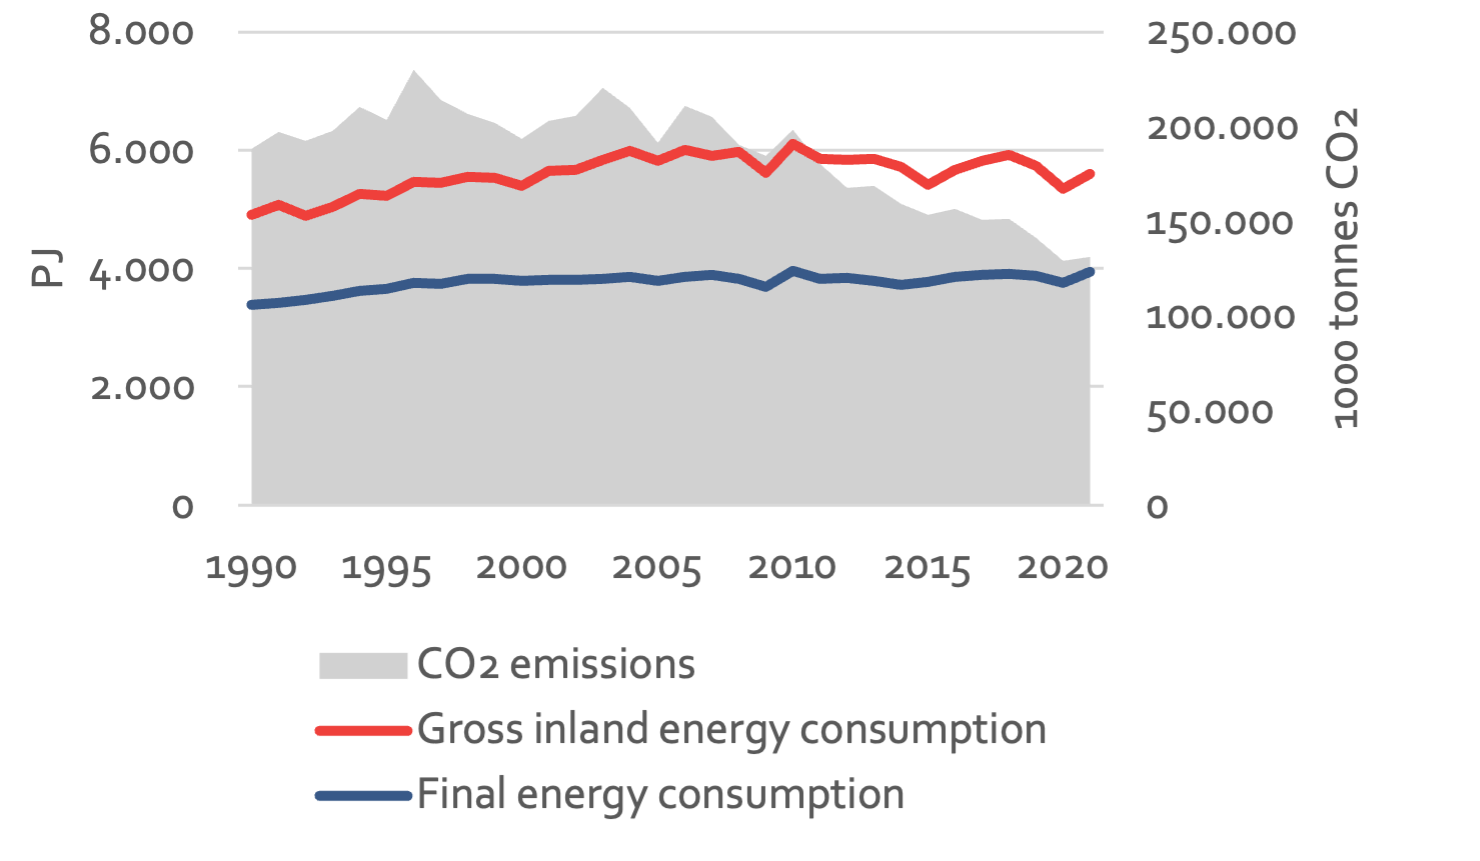
Data source: Eurostat.
Share of renewable energy in consumption increases
Over the last ten years, on average, the five Nordic countries have increased the share of renewable energy in their final energy consumption by 12%. All five Nordic countries have seen significant increases in the utilisation of renewable energy.
Sweden leads the charge in share of renewable energy from the gross final energy consumption with a 17% increase, closely followed by Denmark at 16%. Finland isn’t far behind with a 14% rise, while Norway and Iceland also make significant strides with 11% and 6% increases, respectively.
This increase highlights the Nordic region’s commitment to sustainable energy solutions, racing well ahead of the average European increase of 5 percentage points in the period 2012-2022.
Increased renewable energy production
Since 1990, the Nordic countries have made remarkable strides in boosting their renewable energy (RE) production. Denmark has led the way by tripling its production of renewable energy, while Iceland has impressively doubled its own. Finland has seen a 1.5-fold increase in its RE production, and Sweden has achieved a substantial 95% rise. Norway, too, has made significant progress with a 39% increase. These achievements underscore the region's strong commitment to sustainable energy and its leadership in the global shift towards greener power sources.
In the spotlight:
The Climate Alliance
DK2020 Initiative: Aligning Danish Municipalities with the C40 Framework for Climate Action Planning
The DK2020* initiative marks a significant milestone as it represents the first adaptation of the C40 standard to smaller cities. This adaptation facilitates the development of ambitious climate action plans that are in line with the Paris Agreement. All 98 municipalities in Denmark are participating in this initiative, with 96 municipalities having already established their climate action plans. The DK2020 initiative provides technical assistance to Danish municipalities, guiding them on their path to becoming CO2-neutral and climate resilient by 2050. This initiative is a collaborative effort between Realdania, Local Government Denmark (KL), and the five Danish regions.
*The Climate Alliance is the new name of the previously called DK2020 programme.
Source: Concito, 2024