
- Front page
- Authors
- Table of contents
- Summary
- 1. Introduction
- 2. Literature on fisheries and tourism
- 2.1 Recreational fisheries
- 2.2 Commercial fisheries
- 3. Case studies
- 3.1 Sweden
- 3.1.1. Description of the case
- 3.1.2. Research question
- 3.1.3. Method
- 3.1.4. Data
- 3.1.5. Results
- 3.1.6. Discussion
- 3.1.7. Take-home message
- 3.2 Denmark
- 3.2.1 Description of the case
- 3.2.2 Research question
- 3.2.3 Method
- 3.2.4 Data
- 3.2.5 Results
- 3.2.6 Discussion
- 3.2.7 Take-home message
- 3.3 Norway
- 3.3.1. Description of the case
- 3.3.2 Research question
- 3.3.3 Method and data
- 3.3.4. Results
- 3.3.5. Discussion
- 3.3.4. Results
- 3.4 Finland
- 3.4.1 Description of the case
- 3.4.2. Research question
- 3.4.2. Research question
- 3.4.5. Data and model specification
- 3.4.6. Results
- 3.4.7. Discussion and take-home message
- 4. Discussion
- References
- About this publication
MENU
Interactions between Fisheries and Tourism in the Nordic Countries
Staffan Waldo, AgriFood Economics Centre, Swedish University of Agricultural Sciences
Margrethe Aanesen, Centre for Applied Research, Norwegian School of Economics
Ceren Ahi, Centre for Applied Research, Norwegian School of Economics, NORCE
Anna Andersson, AgriFood Economics Centre, Swedish University of Agricultural Sciences
Johan Blomquist, AgriFood Economics Centre, Swedish University of Agricultural Sciences
Tuija Lankia, Bioeconomy & Environment, Natural Resources Institute Finland
Max Nielsen, Department of Food and Resource Economics (IFRO), University of Copenhagen
Rasmus Nielsen, Department of Food and Resource Economics (IFRO), University of Copenhagen
Heidi Pokki, Statistical Services, Natural Resources Institute Finland
Contents
This publication is also available online in a web-accessible version at https://pub.norden.org/temanord2023-518.
Summary
Tourism is one of the world’s major economic sectors. Destinations worldwide largely compete for the same tourists, and it is of crucial importance to offer popular attractions and activities. In this regard, the global tourism market is divided into a number of segments. Examples are cultural tourism where visiting famous ancient sites is the main attraction, tourism directed towards physical activities like climbing and hiking, and of course marine tourism offering swimming and sunbathing. In this report, the focus is on tourist destinations in the Nordic countries that attract visitors through some kind of fishing related activities. This could be either destinations providing recreational fishing opportunities or coastal villages with a genuine fishing atmosphere provided by commercial fisheries. The report contains case studies from Sweden, Denmark, Norway and Finland.
The Swedish and Danish case studies analyse if commercial fisheries attract tourists to local fishing communities. If such a relation can be proved, it provides managers with an argument for supporting local fisheries in tourist harbours since too few vessels might harm the tourism sector. The conclusion from the Swedish case study is that harbours with high commercial fishing activity also have high tourism activity measured as restaurant turnover. The relation is strongest on the Swedish west coast, which is a major tourism area that also has a strong fishing industry employing a major part of the Swedish commercial fishers. However, it is not possible to establish a causal relationship proving that fisheries attract tourists. In the Danish case study, on the other hand, it is shown that more fishing activity by commercial fisheries leads to more overnight stays in Danish coastal areas. The effect is found for three of six investigated measures of fishing activity: the number of vessels landing in a coastal area, the number of vessels with home harbour in a coastal area, and the landing value of fish for human consumption.
The Finnish case study focuses on recreational fishing for salmon in the River Teno. The results emphasize the importance of the salmon stock in attracting fishing tourists. The amount of salmon caught on the most recent trip had a positive effect on the total number of visits. Further, tourists who find fishing services such as access to boats, guides, or a well-functioning fishing permit system particularly important made more trips to Teno than others. The services for fishing tourists could be further developed by combining accommodation and fishing services in the same market places instead of the tourist having to seek services from several service providers.
The Norwegian case study focuses on tourists who visited Lofoten during 2020–2021. Lofoten has both a famous recreational fishery and a large commercial fishery for cod. The main conclusion from a survey among the tourists is that they would be willing to pay more for a visit to Lofoten if it included the opportunity to visit a seafood market, and even more if it also gave the opportunity to participate in a seafood festival. Additional recreational catches and additional commercial fishing vessels are less valued.
The results highlight the role of site-specific development of tourism. Different tourists value different attributes, where some tourists want pristine nature and high recreational catches and others favour developed services and a local commercial fishing culture. The Nordic countries might be able to attract more tourists by adapting tourist destinations to the respective countries’ competitive advantages where for example the role of nature, catch rates, closeness to major travel hubs, restaurants, traditional fishing vessels in the harbour, etc. could play important roles in future development.
1. Introduction
Tourism is a major sector worldwide and provides substantial contributions to the economy. For example, in the OECD countries the tourism sector accounts for about 4 percent of GDP and 7 percent of employment (OECD, 2020). In the Nordic countries, tourism is both an important and growing industry. This has been highlighted e.g. in the plan for Nordic tourism co-operation established in 2019 (Nordic Council of Ministers, 2019). An important part of this industry is related to maritime and fresh water activities where the Nordic countries can offer a wide range of tourism experiences ranging from swimming in clean waters to whale watching and world famous salmon fisheries.
Although tourism is a major part of the blue economy (EU, 2014a), it is sometimes difficult to separate from other blue activities. An example is tourism and fisheries, which are tightly interlinked in many Nordic regions – either through recreational fishers visiting areas with rich fishing opportunities, or through commercial fisheries providing fresh seafood and a genuine fishing atmosphere to tourists in coastal areas. This report provides an analysis of how fisheries might contribute to the development of tourism in a Nordic context. Case studies from four Nordic countries are presented: 1) the role of commercial fisheries for the development of restaurants close to harbours in Sweden, 2) the role of commercial fisheries for overnight stays in Denmark, 3) the role of management of recreational fisheries in the River Teno for salmon tourism in Finland, and 4) the role of commercial and recreational fisheries for tourism in Lofoten, Norway.
The most direct link between fisheries and tourism is through recreational fisheries. Recreational fishers travelling to fishing grounds outside their residential area will need places to stay and eat. A common indicator of the size of recreational fisheries is the total expenditure spent by fishers on gear, boats, accommodation, food, fuel, etc. (Tinch et al., 2015). Many of these components directly form part of the tourism sector. Due to long coastlines and abundant inland waters, the potential for fishing tourism is great in the Nordic countries where recreational fishing is a major recreational activity (Vaage, 2015; Carlén et al., 2021; Toivonen et al., 2004). Norway alone has e.g. more than 1000 registered tourist fishing companies in their official registers (Vølstad et al., 2020). Since recreational fishers are heterogeneous, different characteristics of fishing sites will attract different fishers (Bonnichsen, et al., 2016). Knowledge about the recreational fishers’ preferences is thus crucial for the development of fishing destinations. The Finnish case study of River Teno contributes to this by analysing how catches, nature activities, and services in the area affect how the fishers value their trip.
Turning to commercial fisheries, it is very important from a policy perspective to prove if commercial fisheries actually attracts tourists to a destination. If a causal relationship is established between commercial fisheries and tourism, it provides managers with a theoretically sound argument for supporting fisheries in local tourist harbours. An industry providing services to another industry, without being able to benefit from this through the market mechanisms, is according to economic theory providing a positive externality. In the case of fisheries and tourism, the tourism industry may benefit from nice picturesque fishing villages with local fishers landing their daily catches by the dockside. However, if the tourists do not buy local fish, the fishers do not get any benefits from the tourists. In this situation, there is a risk that the fishing activity in the harbour will be too low from a societal point of view. Fishers might e.g. locate to harbours with less tourism but better landing facilities, ice machines, etc. If fishing activity attracts tourists, this provides an argument for management to support fishing vessels to keep using the tourist harbours. While some Nordic countries, such as Norway and Iceland, have large fishing industries, many coastal communities in Sweden face the risk of losing their last commercial fishing vessel (Waldo and Blomquist, 2020). Likewise, the Danish fishing fleet has been substantially re-structured during the last decades, leaving some regions almost without commercial fisheries. The Danish and Swedish cases contribute by empirically estimating the impact of thriving fishing harbours on tourism measured as restaurants and overnight stays. If such relationships exists, companies in the tourism sector gain from cooperation with the fisheries sector to maintain as many active vessels as possible in the harbours. Moreover, governmental actions to maintain active vessels in the harbours might be considered a tool to both benefit the fishing and tourist sector.
Finally, the Norwegian case contributes with an analysis where both recreational and commercial fishers utilise the same fish resource in the same local community – the case of cod fisheries in Lofoten. In this case, tourists visit the fishing communities both for the genuine fishing atmosphere and for utilising the coastal cod stock for their own recreational fishing. While this is a prominent feature of the Lofoten tourism industry, the situation is far from unique within the Nordic countries where many tourist destinations offer both recreational fisheries and harbours with local seafood restaurants.
The next chapter contains a review of relevant literature on fisheries and tourism from both a recreational and commercial fisheries perspective. This is followed by a chapter with the four case studies – Sweden, Denmark, Norway and Finland. Detailed information about the cases including descriptions of the fisheries, the data, the methodology used, and the results from the analyses is provided. In the last section of the report, the results from the four case studies are discussed.
2. Literature on fisheries and tourism
2.1 Recreational fisheries
FAO[1] FAO code of practice for recreational fisheries: «Fishing of aquatic animals that do not constitute the individual’s primary resource to meet nutritional needs and are not generally sold or otherwise traded on export, domestic or black markets”. defines recreational fishing as fishing where the goal is not to secure a sufficient income or diet. However, in some cases fishing may at the same time provide both recreation and fish for eating (Hall, 2021). Both local residents and tourists practice recreational fishing (Morales-Nin et al., 2015). Especially in rural areas, fishing tourism can provide important means of livelihoods as it brings revenues from outside the area and thus stimulates the regional economy and regional development. The income effects of fishing tourism can be versatile as tourists need a variety of services including accommodation, restaurants, retail and guidance services (Kauppila and Karjalainen, 2012).
Compared to other parts of Europe, the inhabitants of Northern Europe have access to relatively rich aquatic and marine environments due to the low population density and high availability of water and coastline (Arlinghaus et al., 2021). The participation rates in recreational fishing are among the highest in the world (Arlinghaus et al., 2021). There are approximately 1.5 million Finnish recreational fishers in Finland (OSF, 2022), and 32.5 percent of the population over 15 years of age reported that they participated in recreational fishing at least once during the last 12 months in 2020. In Norway, 40.7 percent say they have been fishing at least once during the last year (Statistics Norway, 2021). Of these, about 20 percent fish at least once a month. In 2011, 45 percent stated that they had been fishing at least once the last year, and 37 percent said they had been fishing more than two times the last year (Statistics Norway, Statistikkbanken, table 09118). In 2021, approximately 1.5 million recreational fishers were active in Sweden, and the share of the Swedish population over age 15 who practiced recreational fishing in 2021 was approximately 17.7 percent (Statistics Sweden, 2022). In Denmark the total number of registered recreational fishers in 2016 was estimated to 31 335 people. The total number of recreational fishers consists of both registered and non-registered individuals, where the latter category is constituted by people below age 18 and above age 65 as well as people fishing in put and take lakes (Landbrug- og Fiskeristyrelsen, 2017, table 4.5).
Recreational fishing is a significant contributor to economy across the world: It has been evaluated that the total economic impact of marine recreational fishing in Europe is 10.5 billion euros, supporting almost 100 000 jobs (Hyder et al., 2017). Its significance to people’s lives in economic terms can be evaluated also from individual recreational fishers’ perspective: One way to measure the benefits a recreational fisher obtains from the fishing is to assess the amount of money an individual is willing to pay for the activity (Scheufele and Pascoe, 2022). The benefits are often found to be substantial (Arlinghaus et al., 2021;Johnston et al., 2006). For example in Finland, the estimated consumer surplus of a fishing day was 140 euros in 2018 (Pokki et al., 2020). In 2016 the estimated consumer surplus of a fishing day in the river Tornionjoki in Finland was 121 euros for short visits and 159 euros for long visits (Pokki et al., 2020a). Moreover, the estimated total recreational value of salmon fishing in the River Teno was 2.6–3.7 million euros in 2011 (Pokki et al., 2018). An early study on the economic impacts of fishing tourism in Norway shows that total expenditure in the industrialised fishing tourism sector equalled 104 million euros in 2009 (Borch et al., 2011). Of this, 60 million euros was generated in Northern Norway (op cit). Daily expenditures of a tourist fisher are estimated to 172 euros, of which accommodation and boat rental count for about 100 euros, or 58 percent.
While commercial fisheries have been identified as the primary cause for the global decline in fish stocks, recreational fisheries have been considered to potentially contributing to the decline (Cooke and Cowx, 2006, 2004). This has increased the need for improving the management of recreational fishing (Scheufele and Pascoe, 2022). For example, in the River Teno, on the border of Norway and Finland, and its tributaries the salmon population has declined, causing a pressure to increase the regulation of the salmon fishery (Hiedanpää et al., 2020). In 2017, in a new Teno fishing agreement, Norway and Finland aimed to reduce the fishing effort by 30 percent to ensure a viable population. The new rules concerned all users, including tourists as well as the indigenous Sami people, other locals, and fishing entrepreneurs (Hiedanpää et al., 2020). In 2021, all salmon fishing was prohibited in Teno and its tributaries due to a worryingly low state of the salmon stock (Finnish Government, 2021). The situation is somewhat different when it comes to marine tourism fishing, at least in (parts of) Norway. In Norway no fishing license is needed for salt-water recreational fishing. While local people can apply a range of gear, and are also allowed to sell some of the catch, foreign recreational fishers are more strictly regulated. They are only allowed to use a rod and line or hand-held line, and are not allowed to sell their catches. Although there is no limit as to how much they can catch, there is a bag-limit on 20 kg for how much they are allowed to take out of Norway (Borch et al., 2011). The marine fishing tourism sector in Norway grew between 2000 and2010, and the main growth took place in the mid and northern parts of the country (Borch, 2009a). One reason for this may be that the stocks of species that are important for tourism fishers, among them cod, are in a good shape in the Arctic, and hence tourism fishers can expect good possibilities for catching both a variety of species and large fish (Borch et al., 2011).
People engage in recreational fishing for a range of expected individual psychological, health and nutritional benefits (Cooke et al., 2017) and for both catch and non-catch related motivations (Birdsong et al., 2021). It has been recognised that understanding the human perspective of recreational fishing is essential to a sustainable management of recreational fisheries, both for maximising the social and economic benefits of recreational fisheries and for an ecologically sustainable management of fisheries (Birdsong et al., 2021). An understanding of anglers’ behaviour may be useful for developing fishing tourism (Lam-González et al., 2021) and for predicting the effects of regulatory interventions (Hunt et al., 2019).
To understand recreational fishers’ preferences, economists have often studied how anglers choose among competing fishing sites (Hunt et al., 2019). Site choice studies examine anglers’ preferences by assuming that the attractiveness of a fishing site arises from fishing site characteristics and anglers’ preferences for them (Hunt et al., 2019). In a review of such studies, Hunt et al. (2019) found the primary drivers of fishing site choice to be costs, catch-related quality, facility quality, destination size, regulations and congestion. Among these factors, costs, catch and destination size were found to be the most influential. To understand anglers’ expectations, socio-psychologists have, in turn, studied what motivates people to recreational fishing and which aspects of fishing, such as catch rate or environmental quality, that determine the recreational anglers’ satisfaction with their fishing trips (Birdsong et al., 2021). In a review of recreational anglers’ satisfaction studies, Birdsong et al. (2021) found the most important determinants to be catch-related attributes: catch, harvest, and size of the fish capture. Space, congestion, aesthetics, facilities, and opportunity mastery were however also found to contribute to recreational anglers’ satisfaction with their trips.
In River Teno, fishing tourists rated the importance of 21 different services and natural and cultural characteristics of the area for their fishing trips, and rated opportunities to fish wild salmon, the quality and health of captured fish, a unique natural landscape, and the peace in nature as the most important (Lankia et al., 2022). The amount of salmon catch received rank 14 in the perceived importance. Still, from six factors describing the perceived performance of the different features, fish catch had the strongest influence on the fishing tourists’ overall satisfaction with their most recent fishing trip to Teno.
Another approach to estimating the economic value of recreational fisheries is the total economic value (TEV) of recreational fisheries, including both use and non-use values of such activities. While use values are obvious, examples of non-use values are the conservation and restoration of stocks. In 1999–2000 a mail survey was implemented among the general population of five Nordic countries.[2]The countries included were Denmark, Finland, Island, Norway and Sweden. Those who said they participated in recreational fishing were asked how much they spent on this activity annually, and how much more they would be willing to pay (WTP) to be able to fish. Both those who were fishing and others were asked how much they would be willing to pay for preserving the current fish stocks and current quality of recreational fishing. Among those who were fishing, the mean of actual expenses was about twice their WTP for fishing above the actual expenses. Regarding the non-use values, these were substantially lower than the use values, and the mean non-use WTP for fishers was higher compared to non-fishers. The latter is not surprising, since preserving stocks may imply higher use values for fishers in the future (Toivonen et al., 2004).
Footnotes
- ^ FAO code of practice for recreational fisheries: «Fishing of aquatic animals that do not constitute the individual’s primary resource to meet nutritional needs and are not generally sold or otherwise traded on export, domestic or black markets”.
- ^ The countries included were Denmark, Finland, Island, Norway and Sweden.
2.2 Commercial fisheries
The literature on the link between commercial fisheries and tourism is quite limited but more attention has been devoted to the issue lately. A number of studies highlight that destination characteristics related to fishing and locally caught seafood are important for visitors in several countries. However, there are very few studies that use more advanced methods, such as econometrics, to investigate if and how commercial fisheries affect tourism.
By interviewing actors involved in fishing festivals in the Bay of Maine region in the USA, Claesson et al. (2005) find that fishing cultural heritage and fishing festivals are seen as important for visitors. It is also claimed that tourists are attracted to active fishing piers where landings take place. Khakzad (2018) uses photo analysis to show that fishing-related heritage items are the third most photographed feature by tourists in coastal areas in North Carolina, USA. Surveying tourists in the area show that more than 80 percent of the tourists consider fish houses, boats and boatyards historically important. Moreover, 40 percent of the tourists state that they are likely to visit commercial docks, fish houses and seafood festivals, and 66 percent state that they are very likely to visit seafood restaurants. Khakzad (2018) concludes that tourists appear to have a considerable interest in commercial fishing material (i.e. boats, fish houses, and gear) as it contributes to local culture, heritage and sense of place. Voyer et al. (2016) survey the public in New South Wales, Australia, on possible connections between commercial fishing and tourism in the region’s coastal areas. They find that 76 percent of the respondents believe that eating local seafood is an important part of their coastal holiday. Further, 64 percent of the respondents claim to be interested in watching professional fishers at work when on holiday.
Interview studies in Europe also find evidence supporting a connection between commercial fisheries and tourism. Kvarnbäck and Johansson (2013) conduct an interview study with stakeholders in the fishing sector in a region in western Sweden. They find that local fishing activities are believed to preserve the maritime cultural heritage and attract tourism. An interview study by Trojette et al. (2015) finds that almost 95 percent of the visiting tourists in the French coastal city Le Guilvinec did at least one activity related to fishing, of which walking in the harbour and watching boats were most common. Also, about 34 percent of the visitors would not have chosen the destination without the associated fishing activities. A survey study by Waldo et al. (2020) shows that 20–30 percent of tourists visiting the areas of Skillinge and Träslövsläge in Sweden find fishing-related attributes, such as fishing boats, fishing huts and active fishers, to be very important but a relatively large part of the surveyed tourists do not find them important at all (e.g. 20 percent of the tourists visiting Träslövsläge).
Above studies have not quantified the possible value of commercial fishing for tourism. Even if they indicate that tourists and businesses in most cases believe that commercial fishing contributes to the attractiveness of a destination, it is difficult to know how strong this connection is without more advanced studies. Moreover, most surveys and interviews are conducted with people either involved in fishing tourism or tourists that already have chosen a certain destination associated with fishing activities. Hence, it is possible that these respondents have a more positive attitude to fishing than average citizens do. To our knowledge, only a few studies have attempted to either value fishing amenities or to quantify the effect of fishing on tourism. The results of these are mixed and presented below.
Durán et al. (2015) examine how preserving maritime cultural heritage is valued in the Atlantic region of Galicia, Spain. By performing a discrete choice experiment, they find a positive willingness to pay for cultural preservation related to fisheries. The highest willingness to pay is found for preserving traditional architecture connected to fishing (18.36 EUR), followed by fishermen’s knowledge (17.77 EUR), other traditional knowledge (15.52 EUR), fishermen’s folklore (9.82 EUR), and traditional boats (8.47 EUR).[1]The willingness to pay is calculated for households per year for 5 years. Ropars-Collet et al. (2017) analyse the willingness to pay for different coastal amenities in the regions of France, Belgium and the UK that border the English Channel and the North Sea using the choice experiment method. Visitors to all coastal regions positively value amenities related to fishing such as the presence of fishing boats (4.49 – 5.79 EUR), direct sales (1.91 – 4.93 EUR) and architectural heritage (5.65 – 6.78 EUR). However, amenities not related to fishing, such as the presence of a beach (10.72 – 11.45 EUR) or the opportunity to take coastal walks (7.12 – 8.72 EUR), were ranked higher by coastal visitors than fishing amenities.[2]The willingness to pay is calculated per round trip per person.
Waldo et al. (2020) perform a travel cost study in the area of Träslövsläge, Sweden. It is shown that the value of the visit for the tourist would decrease by 11 percent (3.43 EUR) if there were no fishing boats in the harbour, and by 7 percent (2.11 EUR) if there were no active fishers.[3]The change in value is calculated per trip per person. Values have been converted from Swedish crowns (SEK) to Euros (1 SEK = 0.094 EUR in 2020). Waldo et al. (2020) conclude that commercial fishing appears to have a value for tourism but that active fishing alone is not always enough to attract tourists. Complementary activities such as restaurants are important. Andersson et al. (2021) use econometric methods to estimate the effect of local fishing for tourism demand measured as overnight stays in coastal municipalities in Sweden. The results depend on the estimation method used but no relationship between fishing and tourism is found when using panel-data methods, the preferred method by the authors. This result holds when the authors test different measures of fishing activity (number of vessels, landings, active harbours and small-scale fishing).
In sum, there are many indications of a possible relationship between commercial fishing and tourism, especially if commercial fishing contributes to the cultural heritage of a coastal community and provides local seafood to restaurants. When asked, tourists who have chosen to visit a coastal community often claim to have an interest in fishing-related activities and heritage. However, there is an evident risk that these tourists are not representative of the population. Scientific evidence is very scarce when it comes to valuing fishing-related attributes and quantifying the effect of commercial fishing on tourism. More research is needed to get deeper insights into the connections between commercial fishing and tourism. It is still unclear if an active fishery needs to be present to create an attractive coastal destination for tourists or if it is enough with amenities such as old fishing huts and gear.
3. Case studies
3.1 Sweden
Anna Andersson, Johan Blomquist, Staffan Waldo
3.1.1. Description of the case
Fishery is a small sector in Sweden. Only about 1,400 people are employed in the Swedish fishing fleet and its total landed value is about 115 million euros (STECF, 2021). Herring, Norway lobster, sprat, and North Sea shrimp are the economically most important species for the sector (Bergenius et al., 2018). The fishery sector has experienced a negative development the last decades with decreases in active fishing vessels and landed quantities. As can be seen in Figure 1, total catch onboard has decreased substantially the last 20 years with total catches in 2021 being less than half of total catches in 1999. In the same period, the number of registered commercial fishing vessels has decreased from 2,140 in 1999 to 1,052 in 2021 (EU Fleet Register). The changes in the fishery sector depend on several factors such as entry barriers, bad profitability, scrapping premiums, the introduction of transferable fishing rights and the scrapping of old vessels (Bergenius et al., 2018).
Figure 1 Catch onboard (1000 tonnes)
A possible link between commercial fisheries and tourism has been highlighted by several governmental agencies (Swedish Agency for Marine and Water Management and Swedish Board of Agriculture, 2021a; Swedish Board of Agriculture, 2022). The policy debate especially stresses the importance of the small-scale fleet for tourism (see e.g. Stobberup et al., 2017; Swedish Agency for Marine and Water Management and Swedish Board of Agriculture, 2021a). In brief, it is argued that a lively harbour area and local commercial fishers supplying fresh seafood to local restaurants are important for attracting tourists. Concerns are now raised, for example by 17 coastal municipalities, that declining fishing activity may affect the attractiveness of coastal tourist destinations (Wernersson et al., 2017).
As the literature review showed in chapter 2, there are several indications of a positive relationship between active fishing and tourism, i.e. supporting the claims in the policy debate. For example, when asked, tourists visiting coastal communities often state that active fishing and locally caught seafood are important destination characteristics (e.g. Voyer et al., 2016; Trojette et al., 2015; Ropars-Collet et al., 2017). A recent Swedish study also shows that tourists in a Swedish fishing village have a willingness to pay to have fisheries in the port (Waldo et al., 2020). However, it is unclear to what degree fishing needs to be present to attract tourists as the scientific evidence is very scarce when it comes to quantifying the effect of commercial fishing on tourism. The sole previous study that has estimated the effect of commercial fishing on tourism using observed data of fishing activity and tourist flows found that the effect was insignificant (Andersson et al., 2021). More research is needed to better understand if and how commercial fishing affects tourism patterns.
3.1.2. Research question
The aim of this case study is to investigate the connection between commercial fishing and tourism in Sweden. It is important to get better insight into this possible connection since, if present, it can be used as an argument for supporting the fishery sector. If fisheries attract tourists, it can be argued that fisheries provide positive externalities, which can motivate government support. In this study, we give special attention to the small-scale fishery as it has been claimed to be especially important for tourism, is struggling with profitability and is politically prioritised (EU, 2013; Swedish Agency for Marine and Water Management and Swedish Board of Agriculture, 2021a). It is therefore a possible candidate for government support e.g. through the European Maritime, Fisheries and Aquaculture Fund (EMFAF; EU, 2021).
Our study uses econometric methods to investigate if commercial fishing is related to tourism, measured as restaurant activity. By using restaurant activity as a proxy for tourism demand, we complement Andersson et al. (2021) who investigated the possible connection between commercial fishing and overnight stays. We choose restaurant activity because we want to capture day-trippers and overnight tourists alike. Using a measure that excludes day-trippers risks underestimating tourist demand, especially in smaller communities where the possibility to stay overnight is limited. Using restaurant activity as a measure can also be motivated by the fact that it constitutes an important part of tourists’ expenses. According to the Swedish Agency for Economic and Regional Growth (2020), tourists from abroad spend around 30 percent of their total consumption in Sweden on restaurants and cafés (excluding travel expenses). Visits from tourists are also important from the perspective of the restaurants. On average, around 20 percent of the total value added in the Swedish restaurant sector originates from tourists’ expenses (Swedish Agency for Economic and Regional Growth, 2020). In places with a lot of tourism, this number is likely to be significantly higher.
We match firm-level data for restaurants and logbook data for fisheries for the period 1997–2019 to get detailed information on both the development of restaurant activity, measured as turnover, and different types of fishing activity in Sweden. Estimations are done at postal code level with Ordinary Least Squares (OLS) as well as panel-data methods using fixed effects. Fishing activity is measured both as a continuous variable and as a set of dummy variables. This means that we first analyse if more fishing activity leads to more tourism and second if a certain amount of fishing activity is needed to affect tourism.
3.1.3. Method
The fact that fishing activity has declined in Sweden means that we can examine how tourism is affected by changes in fishing activity. It is important to point out that it is not the case that fishing activity has completely ceased in some regions but not in others, or that external shocks have caused activity to cease suddenly.
Given this setting, our main analysis investigates if the degree of fishing activity affects tourism in Sweden in the period 2003–2019. Fishing activity is measured with three different variables from logbook data: total landings, the number of active vessels, and landings by small-scale vessels.[1]Small-scale vessels are vessels below 12 meters that use passive gear. Active vessels are vessels with at least one landing a certain year. Special attention is given to small-scale vessels since these have been highlighted as important for attracting tourism, as mentioned above. It should be noted that small-scale vessels dominate the Swedish fleet. Of the 1052 registered vessels in Sweden in 2021, 903 were classified as small-scale, i.e. below 12 meters (EU Fleet Register).[2]However, not all registered vessels are active. In 2020, there were 609 active small-scale vessels (STECF, 2021). We do not solely focus on small-scale vessels, as we believe that many trawler vessels may likewise contribute to tourism since they are relatively small[3]The median length of vessels above 12 meters was 18 meters in 2021 (authors’ calculations based on data from the EU fleet register). and are an integrated part of local fishing traditions in Swedish harbours.
The level of analysis is postal codes. Hence, we measure fishing activity per postal code. In the baseline estimations, fishing activity is measured as a continuous variable. In an extension, we also measure fishing activity with dummy variables in order to test different thresholds of fishing activity.
Although fishing takes place along the entire Swedish coast as well as in lakes and rivers, it is predominantly the fishing-intensive south and west coast that are associated with fishing cultural heritage. These regions also use images of commercial fishing, fishing activities and seafood restaurants in tourism advertising (Visit Sweden, 2022a). Hence, fishing could be especially important for attracting tourism to these regions. This is something we choose to acknowledge in our model specification below.
Model specification
The baseline model we estimate is the following:
(1)
where the dependent variable, lnYit, is the logged turnover of restaurants in postal code i in year t, and lnFishingit-1 is the log of fishing activity measured as landings, lnLandingsit-1, landings of small-scale vessels, lnSmallit-1, or the number of active vessels, lnVesselsit-1. The fishing activity variables are lagged one year to mitigate possible endogeneity caused by simultaneity between tourism and fishing activity. It is possible that there are feedback effects from tourism to fishing if more tourism leads to a larger market for fish in the region, increasing the supply of fish. If this is the case, estimates may be biased and inconsistent since the exogeneity assumption does not hold. Moreover, tourists often make plans ahead of their travel meaning that their decision is likely to be based on information on the destination from the previous vacation season. We therefore argue that it is reasonable to make current tourism a function of fishing activity the previous year which implies that the fishing variables are pre-determined in the model.
Further, we control for possible differences in effects between regions by including an interaction term defined as the product of the fishing activity variables and a dummy variable for the region Bohuslän, Bohusläni. Bohuslän is a region on the Swedish west coast that is especially known for fishing cultural heritage. The dummy variable Bohusläni takes the value 1 if postal code i is located in Bohuslän, and 0 otherwise. We also include control variables for population at municipal level[4]Unfortunately, we do not have access to population data at postal code level., lnPopmt, and economic activity, lnEcActit, which control for the economic size of the postal code and region. Economic activity is proxied by summing turnover for all retail firms in a postal code. We include fixed effects for years, μt, which capture aggregate trends that affect all postal codes in a similar way, e.g. business cycles, GDP and exchange rates. Lastly, εit is an idiosyncratic error term. Equation 1 is estimated with OLS.
We also estimate the following fixed effects model:
(2)
This model contains fixed effects for postal codes, κi, that account for all non-time-varying unobserved characteristics at postal code level that can affect tourism. Not considering unobserved heterogeneity may lead to biased estimates. For example, a popular area may attract both fishery and tourism, which leads to a positive correlation, but caused by an omitted factor. The inclusion of the fixed effects at postal code level means that we need to drop the dummy variable for Bohuslän since regional affiliation does not change over time. Standard errors are estimated using the Arellano (1987) clustered covariance matrix, which is consistent in the presence of serial correlation and heteroskedasticity in the errors.
When we estimate potential threshold effects, we replace lnFishingit-1 with dummy variables in Equations 1 and 2. We call the dummy variables LandingsDit-1, VesselsDit-1, and SmallDit-1. They equal 1 if postal code i is fishing intensive, according to the criteria listed in Table 2, in year t-1 and 0 otherwise.
Neighbouring postal codes
Swedish postal codes consist of five digits. The first two digits mark the postal code area and the last three digits both define a geographic area within the postal code area and notify which type of distribution applies, e.g. post box or delivery post to private individuals in urban areas. There are large differences in the size of the geographic areas represented by a postal code as these depend on population density. Since postal codes do not take the location of harbours and restaurants into consideration, it is possible that a harbour and a restaurant that are located very close to each other do not share the same postal code. Only analysing possible connections between fishing activity and restaurant activity within a certain postal code may therefore be problematic. In order to address this issue, we perform additional estimations of Equations 1 and 2 where restaurant and economic activity in neighbouring postal codes are included. Two methods are used for constructing sets of neighbouring postal codes: 1. we include all neighbouring postal codes to a postal code with fishing activity, i.e. postal codes that share a polygon border with a postal code with fishing activity, 2. we include all postal codes within two kilometres of the centre of the postal code with fishing activity. For our sample of postal codes, more neighbours are found when using the first method.
We do not change Equations 1 and 2 when including neighbouring postal codes. However, we define restaurant activity and economic activity in a new way. Restaurant (economic) activity for a certain postal code is now the sum of its own and the neighbouring postal codes’ restaurant (economic) activity. This means that values of restaurant (economic) activity are higher in this analysis if neighbouring postal codes have active restaurants (retailers) during our investigated period. Note that fishing activity is measured as before.
Footnotes
- ^ Small-scale vessels are vessels below 12 meters that use passive gear. Active vessels are vessels with at least one landing a certain year.
- ^ However, not all registered vessels are active. In 2020, there were 609 active small-scale vessels (STECF, 2021).
- ^ The median length of vessels above 12 meters was 18 meters in 2021 (authors’ calculations based on data from the EU fleet register).
- ^ Unfortunately, we do not have access to population data at postal code level.
3.1.4. Data
The data used for the empirical estimations are gathered from two main sources. We use firm-level data on restaurant activity from Statistics Sweden and logbook data on fishing activity from the Swedish Agency for Marine and Water Management. The data are yearly and cover the period 2003–2019.
The firm-level data contain economic information on all firms, including restaurants, in Sweden. A restaurant is defined as any place that serves some type of food, i.e. cafes, ice-cream kiosks and hot dog stands are defined as restaurants. It is not possible to see what type of food that is served in the data, which means that our sample includes all possible types of restaurants. The data contain information on a number of economic indicators for the different firms but also the postal codes for all establishments. When we construct our sample, we first find all restaurants in postal codes that have fishing activity at least once in the period 2003-2019. Hence, postal codes that never have fishing activity are excluded from the sample. We sum restaurant turnover for each postal code and year, and select postal codes that have positive turnover of restaurants each year during our selected period. This means that the dependent variable is always larger than zero. When using neighbouring postal codes, we collect data on restaurant activity for these in a similar way. The main difference is that restaurant turnover is summed for each group of neighbouring postal codes, when neighbours exist. Groups that have a positive turnover the entire studied period are included in the sample. Data on the geographic coverage of postal codes used to find relevant neighbours are from Postnummerservice. Note that our investigated period ends in 2019, meaning that effects on the restaurant sector of the COVID-19 pandemic are not covered. The firm-level data are also used to construct a variable that measures economic activity in different postal codes. We proxy economic activity by summing turnover for all retail firms in a certain postal code or a group of neighbouring postal codes.
The logbook data contain information on different fishing variables, i.e. landings and number of vessels, as well as locations for all Swedish harbours. Information on location is restricted to the name of the harbour and the municipality. As our empirical analysis is at postal code level, we needed to complement the logbook data with postal code information for the harbours. Postal codes were found by a manual search using Google maps. If no postal code was found, the harbour was excluded from the data sample.[1]About 20 harbours of more than 550 are dropped. Data on fishing activity in harbours were aggregated to postal code level. Our sample only contains postal codes that have fishing activity at least one year during our investigated period but the postal code need not have fishing activity each year. Finally, we use data on municipal population from Statistics Sweden.
We choose to remove the three largest cities in Sweden (Stockholm, Gothenburg and Malmö) from our sample even if these municipalities may have postal codes with fishing activity. We do not believe that tourists choose to visit larger cities for the same reasons as for visiting coastal communities. As shown in Andersson et al. (2021), the three largest cities have a large influence on tourist flows in Sweden. Including them in our analysis may therefore produce misleading results.
Summary statistics of the sample used for the baseline estimations, without neighbours, can be found in Table 1. We see that all included postal codes always have restaurant activity while all postal codes may not have fishing activity each year. The sample contains 123 postal codes when no neighbours are included. Including neighbours according to method 1 gives us a sample of 317 postal codes while using method 2 gives us a sample of 149 postal codes.[2]Note that method 2 finds fewer neighbours than method 1, which makes it harder to find postal code groups with positive restaurant turnover the entire period.
| Variable | Obs. | Mean | Std. dev. | Min | Max |
| lnTurnover | 1,968 | 15.77 | 1.37 | 9.16 | 19.19 |
| lnFishing | 1,968 | 6.13 | 5.01 | 0 | 17.30 |
| lnSmall | 1,968 | 5.55 | 4.59 | 0 | 13.85 |
| lnSignal | 1,968 | 1.03 | 1.05 | 0 | 4.39 |
| Bohuslan | 1,968 | 0.18 | 0.38 | 0 | 1 |
| lnEcActivity | 1,968 | 9.73 | 8.33 | 0 | 21.66 |
| lnPop | 1,968 | 10.31 | 0.77 | 8.83 | 11.90 |
Table 1 Summary statistics for the baseline sample
Threshold levels
In an extended analysis, we measure fishing activity with dummy variables instead of continuous variables to test how different threshold levels of fishing activity affect tourism. We construct three different dummy variables for each fishing activity proxy (total landings, small-scale landings and number of active vessels). When we constructed the sample we chose to focus on postal codes that have fishing activity at least once during our studied period. This means that postal codes may have zero fishing activity some years but positive fishing activity in other years. Our first dummy variable exploits this fact and takes the value 1 if fishing activity is present in a certain postal code a certain year, and 0 otherwise. Second, we construct two dummy variables, based on the 50th percentile and the 75th percentile, that test if a certain amount of fishing activity is needed to affect tourism. Table 2 shows how the set of dummy variables are defined.
| Threshold 1 (fishning or not) | Threshold 2 (50th percentile*) | Threshold 3 (75th percentile) | |
| Baseline sample | |||
| Total landings | > 0 kg | 2,306 | 23,755 |
| Small-scale landings | > 0 kg | 1,605 | 13,849 |
| Active vessels | > 0 kg | 2 | 4 |
| Sample with neighbours (method 1) | |||
| Total landings | > 0 kg | 441 | 12,901 |
| Small-scale landings | > 0 kg | 118 | 8,032 |
| Active vessels | > 0 kg | 2 | 4 |
| Sample with neighbours (method 2) | |||
| Total landings | > 0 kg | 1,764 | 20,542 |
| Small-scale landings | > 0 kg | 1,130 | 11,882 |
| Active vessels | > 0 kg | 2 | 4 |
| *The 50th percentile for active vessels is 1 in all samples. We have chosen to use 2 as the threshold. If we had used 1, there would be no difference between the first and second threshold for active vessels. Source: Kartverket (Norwegian mapping authority) | |||
Table 2 Threshold levels per postal code and year
We replace lnFishingit-1 in the models specified above with a dummy variable taking the value 1 if postal code i is fishing intensive, according to one of the criteria listed in Table 2, in period t-1 and 0 otherwise. We call the dummy variables LandingsDit-1, VesselsDit-1, and SmallDit-1,
3.1.5. Results
The baseline results from the OLS and fixed effects regressions based on model 1 and 2 are presented in Table 3. Columns 1–3 show the OLS results while columns 4–6 show the fixed effects results. Note that different measures of fishing activity are used in different columns. Columns 1 and 4 report results when lnLandings proxy fishing activity. In columns 2 and 5, lnLandings is replaced by lnVessels. Finally, we use lnSmall as the measure for fishing activity in columns 3 and 6. If we first focus on the OLS results, we can see that all three fishing activity measures and the interaction between fishing activity and Bohuslän are positive and statistically significant. This means that there is a positive relationship between fishing activity and tourism, measured as restaurant turnover, regardless of how we measure fishing activity. This relationship is stronger in Bohuslän than in other regions. We can also see that the coefficient of lnVessels is larger than the coefficients of lnLandings and lnSmall. For example, a 1 percent increase in landings is related to a 0.02 percent increase in restaurant turnover while a 1 percent increase in the number of vessels is related to a 0.13 percent increase in restaurant turnover. Looking at the results of the fixed estimations in columns 4–6, we can see that there is no significant effect of fishing activity on tourism.
Table 3 OLS and fixed effects estimation results, baseline sample
| OLS | OLS | OLS | FE | FE | FE | |
| lnTurnover | lnTurnover | lnTurnover | lnTurnover | lnTurnover | lnTurnover | |
| lnLandingst-1 | 0.019*** | 0.004 | ||||
| (0.007) | (0.016) | |||||
| lnLandingst-1 *bohuslan | 0.034** | 0.022 | ||||
| (0.015) | (0.024) | |||||
| lnVessels t-1 | 0.131*** | -0.086 | ||||
| (0.034) | (0.118) | |||||
| lnVessels t-1 *bohuslan | 0.147** | 0.088 | ||||
| (0.060) | (0.275) | |||||
| lnSmall t-1 | 0.021*** | 0.007 | ||||
| (0.007) | (0.016) | |||||
| lnSmall t-1 *bohuslan | 0.054*** | 0.004 | ||||
| (0.017) | (0.027) | |||||
| bohuslan | 0.205 | 0.159 | 0.150 | |||
| (0.137) | (0.119) | (0.133) | ||||
| lnPop | 0.098** | 0.105*** | 0.094** | -0.847 | -0.779 | -0.837 |
| (0.040) | (0.040) | (0.040) | (0.554) | (0.529) | (0.549) | |
| lnEcActivity | -0.006* | -0.007* | -0.006* | -0.003 | -0.003 | -0.003 |
| (0.004) | (0.004) | (0.004) | (0.003) | (0.003) | (0.003) | |
| Constant | 14.78*** | 14.79*** | 14.89*** | 24.55*** | 23.35*** | 23.83*** |
| (0.434) | (0.426) | (0.426) | (5.697) | (5.429) | (5.634) | |
| Observations | 1,968 | 1,968 | 1,968 | 1,968 | 1,968 | 1,968 |
| R-squared | 0.060 | 0.070 | 0.065 | 0.101 | 0.101 | 0.100 |
| Note: All estimations include fixed effects for years. The fixed effects estimations include fixed effects for postal codes and years. Robust standard errors in parentheses for the OLS estimations. Cluster-robust standard errors in parentheses for the fixed effects estimations. *** p<0.01, ** p<0.05, * p<0.1 | ||||||
In Table 4, we use a different sample where the restaurant activity of neighbouring postal codes are included. The neighbours are found according to method 1 described above. Including neighbours means that the number of observations increases substantially as more postal codes can be included in the analysis. The organisation of the table is the same as in Table 3. Looking at the OLS results, we see that they are quite similar to those in Table 3. However coefficients tend to be smaller and interaction effects are only significant at the 10 percent level. Nonetheless, the main results are still the same – there is a positive relationship between fishing activity and tourism and this relationship is stronger in Bohuslän than in other regions. The fixed effects results show, as before, no significant effect of fishing activity on tourism. Yet, it is interesting to note that the size of the coefficients of the Bohuslän interaction is similar in the OLS and fixed effects models. The main difference is that the estimated standard errors are much higher in the fixed effects model, which implies statistically insignificant coefficients.
Table 4 Neighbour analysis method 1
| OLS | OLS | OLS | FE | FE | FE | |
| lnTurnover | lnTurnover | lnTurnover | lnTurnover | lnTurnover | lnTurnover | |
| lnLandingst-1 | 0.014*** | -0.003 | ||||
| (0.003) | (0.007) | |||||
| lnLandingst-1 *bohuslan | 0.013* | 0.011 | ||||
| (0.007) | (0.017) | |||||
| lnVessels t-1 | 0.094*** | -0.028 | ||||
| (0.018) | (0.053) | |||||
| lnVessels t-1 *bohuslan | 0.061* | 0.062 | ||||
| (0.031) | (0.117) | |||||
| lnSmall t-1 | 0.010*** | -0.004 | ||||
| (0.004) | (0.008) | |||||
| lnSmall t-1 *bohuslan | 0.015* | 0.010 | ||||
| (0.008) | (0.029) | |||||
| bohuslan | 0.194*** | 0.186*** | 0.205*** | |||
| (0.052) | (0.049) | (0.050) | ||||
| lnPop | 0.186*** | 0.181*** | 0.191*** | 0.015 | 0.011 | 0.013 |
| (0.021) | (0.020) | (0.021) | (0.274) | (0.274) | (0.274) | |
| lnEcActivity | 0.095*** | 0.096*** | 0.095*** | 0.023*** | 0.023*** | 0.023*** |
| (0.007) | (0.007) | (0.007) | (0.006) | (0.006) | (0.006) | |
| Constant | 12.73*** | 12.67*** | 12.79*** | 16.56*** | 17.01*** | 15.81*** |
| (0.252) | (0.252) | (0.251) | (2.806) | (2.819) | (2.802) | |
| Observations | 5,072 | 5,072 | 5,072 | 5,072 | 5,072 | 5,072 |
| R-squared | 0.191 | 0.195 | 0.188 | 0.322 | 0.322 | 0.322 |
| Note: All estimations include fixed effects for years. The fixed effects estimations include fixed effects for postal codes and years. Robust standard errors in parentheses for the OLS estimations. Cluster-robust standard errors in parentheses for the fixed effects estimations. *** p<0.01, ** p<0.05, * p<0.1 | ||||||
We also construct a sample where neighbouring postal codes are included according to method 2 described above. Results of OLS and fixed effects estimations when using this sample are found in Table 5. The main difference to the previous results is that the interaction effects are no longer significant when using OLS as the estimation method. Hence, we still find a positive relationship between fishing activity and restaurant turnover but there is no difference between the general effect and the effect for Bohuslän. As before, the fixed effects estimations show no significant effect of any of the fishing activity variables.
Table 5 Neighbour analysis method 2
| OLS | OLS | OLS | FE | FE | FE | |
| lnTurnover | lnTurnover | lnTurnover | lnTurnover | lnTurnover | lnTurnover | |
| lnLandingst-1 | 0.031*** | -0.007 | ||||
| (0.007) | (0.012) | |||||
| lnLandingst-1 *bohuslan | -0.012 | 0.008 | ||||
| (0.013) | (0.018) | |||||
| lnVessels t-1 | 0.234*** | -0.132 | ||||
| (0.033) | (0.087) | |||||
| lnVessels t-1 *bohuslan | -0.0750 | 0.111 | ||||
| (0.055) | (0.152) | |||||
| lnSmall t-1 | 0.0312*** | -0.005 | ||||
| (0.00751) | (0.013) | |||||
| lnSmall t-1 *bohuslan | -0.00304 | 0.0206 | ||||
| (0.0149) | (0.020) | |||||
| bohuslan | 0.445*** | 0.403*** | 0.415*** | |||
| (0.109) | (0.097) | (0.104) | ||||
| lnPop | 0.142*** | 0.149*** | 0.141*** | -0.489 | -0.450 | -0.487 |
| (0.040) | (0.040) | (0.0400) | (0.422) | (0.410) | (0.422) | |
| lnEcActivity | 0.069*** | 0.067*** | 0.0692*** | -0.006* | -0.006* | -0.006* |
| (0.004) | (0.004) | (0.00388) | (0.003) | (0.003) | (0.003) | |
| Constant | 13.15*** | 13.94*** | 13.16*** | 20.92*** | 21.49*** | 20.87*** |
| (0.433) | (0.429) | (0.431) | (4.304) | (4.217) | (4.297) | |
| Observations | 2,384 | 2,384 | 2,384 | 2,384 | 2,384 | 2,384 |
| R-squared | 0.152 | 0.163 | 0.151 | 0.165 | 0.167 | 0.165 |
| Note: All estimations include fixed effects for years. The fixed effects estimations include fixed effects for postal codes and years. Robust standard errors in parentheses for the OLS estimations. Cluster-robust standard errors in parentheses for the fixed effects estimations. *** p<0.01, ** p<0.05, * p<0.1 | ||||||
Threshold analysis
All estimations above define fishing activity as a continuous variable. We now choose to define fishing activity as a dummy variable, i.e. a postal code can be classified as fishing intensive or not depending on a certain criteria, see Table 2. We first test if having fishing activity, i.e. fishing activity >0, is related to tourism and then if a certain amount of fishing activity is needed to influence tourism. Table 6 shows the results of the threshold analysis using the baseline sample. Note that the first column of the table shows how the different thresholds are defined. To save space, we present the results in a condensed table only showing coefficients of the fishing intensity variables and the interaction terms.[1]Complete results are available from the authors upon request.
Results in Table 6 are quite similar to the above presented results. We tend to find a positive relationship between fishing activity and restaurant turnover when using OLS as the estimation method but this relationship disappears when using the fixed effects approach. The OLS estimations show that having fishing activity is positively related to restaurant turnover no matter how we measure fishing activity. This relationship is stronger in Bohuslän but only if we measure fishing activity as small-scale landings. Using the second threshold (the 50th percentile) we see that VesselsDt-1 and SmallDt-1 are significant while LandingsDt-1 is not. Further, two of the three interaction effects are significant, indicating a stronger relationship in Bohuslän. Using the third threshold (the 75th percentile), no fishing intensity variables are significant but all interaction effects are. Hence, only tourism in Bohuslän benefits from additional fishing activity if there is already quite a lot of fishing taking place.
As before, we lose the positive relationship between fishing activity and restaurant turnover when using the fixed effects approach. All fishing activity variables and interactions are insignificant with the exception of the third threshold for LandingsDt-1 which is significant at the 5 percent level. The coefficient is negative indicating that too large landings may be negatively related to tourism measured as restaurant turnover. As a robustness test, we have performed the threshold analysis with the samples including neighbours.[2]Results available upon request. In general, results are very similar regardless of which sample is used. Yet, using the sample with neighbours found according to method 2 and the fixed effects approach, we find a positive and significant relationship between threshold 3 for small-scale landings and restaurant turnover in Bohuslän.
| Total Landings | ||||
| OLS | FE | |||
| Threshold | LandingsDt-1 | lnLandingsDt-1 *bohuslan | LandingsDt-1 | lnLandingsDt-1 *bohuslan |
| > 0 kg | 0.248*** (0.073) | 0.244 (0.171) | 0.183 (0.118) | -0.096 (0.190) |
| 2,306 kg | 0.0542 (0.067) | 0.376** (0.159) | -0.031 (0.110) | 0.094 (0.198) |
| 23,755 kg | -0.101 (0.072) | 0.716*** (0.165) | -0.261** (0.121) | 0.254 (0.213) |
| Active vessels | ||||
| OLS | FE | |||
| Threshold | VesselsDt-1 | VesselsDt-1 *bohuslan | VesselsDt-1 | VesselsDt-1 *bohuslan |
| > 0 | 0.248*** (0.073) | 0.244 (0.171) | 0.183 (0.118) | -0.096 (0.190) |
| 2 | 0.177*** (0.066) | 0.249 (0.164) | -0.026 (0.117) | 0.246 (0.220) |
| 4 | 0.177 (0.069) | 0.361* (0.156) | -0.108 (0.109) | 0.066 (0.183) |
| Small-scale landings | ||||
| OLS | FE | |||
| Threshold | SmallDt-1 | lnSmallDt-1 *bohuslan | SmallDt-1 | lnSmallDt-1 *bohuslan |
| > 0 kg | 0.264*** (0.072) | 0.282* (0.165) | 0.165 (0.117) | -0.125 (0.173) |
| 1,605 kg | 0.146** (0.067) | 0.392** (0.157) | 0.004 (0.116) | 0.021 (0.175) |
| 13,849 kg | 0.111 (0.070) | 1.024*** (0.163) | -0.170 (0.136) | 0.151 (0.290) |
| Note: All estimations contain all control variables as specified above and fixed effects for years. The fixed effects estimations also include fixed effects for postal codes. The dependent variable is lnTurnover. Robust standard errors in parentheses for the OLS estimations. Cluster-robust standard errors in parentheses for the fixed effects estimations. *** p<0.01, ** p<0.05, * p<0.1 | ||||
Table 6 Threshold analysis
3.1.6. Discussion
As shown in the result section, the OLS estimations generally find a positive relationship between fishing activity and tourism measured as restaurant turnover, and this relationship tends to be stronger in the region Bohuslän on the Swedish west coast. When using the fixed effects approach to control for unobserved confounders at the postal code level, the statistically significant positive relationship is lost. Although occasional fishing activity variables can be significant when using dummy variables and the fixed effects approach, we do not find enough evidence for claiming that commercial fishing affects tourism measured as restaurant turnover. The result is similar to the results in Andersson et al. (2021) who study the relationship between commercial fisheries and overnight stays in Sweden between 1998 and 2015 using municipal level data. As discussed above, using restaurant activity as the dependent variable captures day-trippers as well as tourists staying overnight, which complements the study by Andersson et al. (2021). Further, using data at postal code level focuses the analysis on local harbours where the restaurants and fishing activities are closely located rather than on large administrative units such as municipalities. Both the current study and Andersson et al. (2021) find a positive relationship between fisheries and tourism – especially on the Swedish west coast – but cannot prove a causal relationship, that fisheries attract tourists.
The positive relationship found in the OLS estimates could be due to unobserved factors such as both fisheries and tourism benefitting from areas with a healthy sea and vast archipelagos. If this is the case, the positive relationship should not be interpreted as a causal effect of fisheries on tourism. The results from the fixed effects model, which incorporates such unobserved factors, show statistically insignificant effects, indicating that the OLS estimates may be biased. One explanation for the lack of a causal effect may be the choice of dependent variable in the regression models. Although a significant part of restaurant turnover is dependent on tourism expenses, it is a relatively noisy measure of tourism demand. The lack of a statistically significant effect does not rule out that there exists a positive effect in some villages/postal codes.
From a policy perspective, the results of this paper do not support the case that Swedish fisheries management should subsidise fisheries in order to attract tourists by keeping landings and fishing vessels in harbours. However, the fact that the relationship between fisheries and tourism is stronger on the Swedish west coast may indicate that there are regional variations in the interactions between the two industries. For example, Visit Sweden markets the west coast with fisheries as “The kooky, quaint, fishing villages are well worth a visit here. Grebbestad is where 90 percent of Sweden’s oysters originate, need we say more?” (Visit Sweden, 2022b). This shows that tourism managers view fisheries as an important attribute for the region. Exploring the synergistic effects between fisheries and tourism in regions where fishing cultural heritage is prominent would be a valuable contribution of future studies. Such information provides managers with tools regarding where to put extra effort in developing synergies between the sectors.
3.1.7. Take-home message
The conclusion from the Swedish case is that harbours with high fishing activity also have high tourism activity measured as restaurant turnover. The relation is strongest on the Swedish west coast, which is a major tourism area and at the same time has a strong fishing industry employing a major part of Swedish commercial fisheries. However, it is not possible to establish a causal relationship proving that fisheries attract tourists. The positive relationship found could be due to unobserved factors, such as vast archipelagos positively influencing both industries.
3.2 Denmark
Max Nielsen, Rasmus Nielsen, Anna Andersson, Johan Blomquist, Staffan Waldo
3.2.1 Description of the case
In 2020, the Danish fishery sector consisted of 1,996 registered vessels, of which 1,330 were active with a landing value larger than zero and 461 were commercially active with an annual landing value of more than 36,000 euros (Nielsen and Nielsen, 2022). Of the registered vessels, 1,177 were below 17 meters, while 317 of the commercial vessels were below 17 meters. Most vessels in Denmark are owned and operated individually. In addition to Danish vessels, foreign vessels (especially Swedish, Norwegian and German) also land in Denmark and are included in the analysis. Employment at Danish vessels, measured as persons ultimo, was 1,745 in November (Statistics Denmark, 2022a), while full-time employment on commercial active vessels was 917 (Nielsen and Nielsen, 2022). Hence, fishery activity consists of a group of commercial active vessels largely operated by full-time fishers, another group of less active vessels with limited activity operated by part-time fishers and a group of inactive vessels that are registered for fishing and remain in harbours without any fishery activity, typically former fishing vessels.
The total landing quantity and the total value of landed fish in Denmark by Danish and foreign vessels in 2020 were 951,500 tons and 480 million euros, respectively (Statistics Denmark, 2022b). Of the landing value, 307 million euros was fish for human consumption and the rest was fish for reduction, used to produce fish meal and oil. Species landed spread over pelagic and demersal fish, as well as mussels and crustaceans. Value-wise in 2020, herring, plaice and Norway lobster were the most important species. Of the total landing value of 480 million euros, 304 million euros was landed in the Northern Jutland Region and 147 million euros in the Central Jutland region. Hence, the main part of catches is landed in Northern and Western Jutland, located close to the main fishing grounds for the large vessels in the North Sea and Skagerrak, fishing small pelagics and fish for reduction. However, despite the fact that most landings are made in these regions, the vessels remain spread over the whole country with many small vessels present in the inner Danish waters and the Baltic Sea.
The Danish fishery is managed by individual transferable quotas and vessel quota shares that allow for continuous structural adjustment over time, as indicated by the reduction in the number of commercial active vessels from 1,528 in 2000 to 461 in 2020. Based on a desire to keep small vessels and vessels using passive gears active, a special advantageous arrangement for vessels below 17 m is in force (Nielsen and Nielsen 2022). This arrangement is voluntary and provides extra quota to fishers that enrol. In exchange for the extra quota, the fishers agree to bind the arrangement for either three years or permanently. During the binding period the fishers that enrol are not allowed to sell quotas to vessels outside the arrangement. Vessels using passive gears and vessels choosing a permanently binding arrangement receive more extra quota. These regulations are important for the number of active vessels.
The Danish tourism sector consists of overnight stay facilities, restaurants and different activities for tourists. In 2020, 1,617 overnight stay facility companies and 12,852 away-from-home eating facility companies were registered (Statistics Denmark, 2022c). At overnight stay facilities, 19,641 persons were hired by the end of November (Statistics Denmark, 2022d), and the full-time employment was 12,152 (Statistics Denmark, 2022c, 2022d). At away-from-home eating facilities, 89,672 were employed, while the full-time employment was 46,750. Hence, both overnight stay and away-from-home eating facilities are characterised by a substantial number of part-time workers, among other things due to seasonal variation.
Turnover of the overnight stay facilities was 1.4 billion euros in 2020 and at away-from-home eating facilities 5.1 billion euros. For overnight stay facilities, the turnover has grown from 1.3 billion euros in 2000, corresponding to a 17 percent in annual price level. For away-from-home eating facilities, the numbers were 3.1 billion euros in 2000 and 5.1 billion euros in 2020, corresponding to a two-third increase. Taking into account the inflation (increase in consumer price index) of 36 percent in the period, the activity of the overnight stay facilities was reduced, while an increase is seen for eating facilities.
The total number of overnight stays in Denmark was 45 million in 2020 (Statistics Denmark 2022e). That range from 1.1 million in December to 11.6 million in July, indicating a seasonal trend. The number of overnight stays at hotels was 11.7 million, hostels 1.1 million, camping areas 10.9 million, marinas 1.0 million and summer houses 19.9 million. Of the total number of overnight stays of 45 million, 14.7 million was in the Region of Southern Denmark, 10.7 billion in Region Central Jutland, 10.6 million in the Northern Jutland Region, 7.0 million in the Capital Region and 4.5 million in Region Zealand. The total number of overnight stays increased from 41.7 million in 2000 to 44.5 million in 2020, corresponding to an increase of 7 percent.
3.2.2 Research question
The purpose of this chapter is to identify whether a positive externality exists from fishing activities to tourism in small coastal communities in Denmark. The possible presence of a positive effect of fishery activity on overnight stays is important. In a case with fleet over-capacity, the economic performance of the fishing industry gains from fleet reduction since competition for quotas decreases, while tourism may gain from keeping a larger part of the fleet due to active harbours attracting tourists. Hence, the optimal fleet size for society depends on both. Further, not only fleet size but also fleet composition might be important. The gains might further increase if fishers and tourism companies cooperate in single harbours.
3.2.3 Method
The quantity of overnight stays is determined by supply and demand in the coastal area, where demand is determined by the preferences for overnight stays and the income of tourists. This paper analyses the demand for overnight stays using a revealed preference framework to explain the quantity of overnight stays in coastal areas by a fishery activity variable and the tourist demand variables population and income in the municipality or region. Using postal code data, we estimate changes in overnight stays with the independent variables of fishery activity in the coastal area, population and income.
So called simultaneity between fishery and tourism presents a potential problem in the model. For example, fishery activity may attract tourists, but tourism also induces direct local sales from fishers to restaurants at hotels which in turn attracts fishers to the area. To take that into account, we lag the fishing variables one year. It is assessed as reasonable that overnight stays often are planned in advance, for example a year, and that the decision on where to go on holiday depends on previous experiences and reputations.
Another potential endogeneity issue is omitted explanatory variables that may induce a correlation between the fishery activity variable and the error term. Endogeneity problems may follow from the lack of inclusion of unobserved time-invariant effects for coastal areas in the estimations. For example, better road infrastructure to one coastal area than another improves business both for fisheries and tourism. Hence, a positive correlation prevails and the estimations may be biased upwards.
The endogeneity problem is handled using panel data that allow for dealing with effects from omitted variables of coastal areas, as long as they are constant over time. To avoid the endogeneity problem, a model with fixed effects for coastal areas and yearly dummies is therefore estimated instead of OLS. Aggregate trends that affect different coastal areas equally are thus accounted for. These trends include peaks and lows in the economy, exchange rates and GDP, shown to affect tourism demand significantly (Li, Song and Witt, 2005; Song and Li, 2008; Song et al., 2012). By controlling for fixed effects for coastal areas we also control for unobservable regional characteristics that do not vary over time.
Seasonality of the data is also a factor that may affect the results. Seasonality is accounted for by including monthly seasonal dummies in the estimations.
The fixed effects regression equation estimated appear in (3).
(3)
LNightsTit is the logarithm of number of overnight stays in the coastal area i in period t. LIncREGjt is the logarithm of the average income in the region in period t, LPopREGjt is the logarithm of the population in the region in period t. LFishActit-12 is the logarithm of fishing activity in coastal area i in the period one year earlier t-12 (applying monthly data). Fishing activity is measured as the number of vessels that land in the coastal area, the number of vessels with home harbour in the coastal area, landing quantity, total landed value or landed value of fish for human consumption. Finally, SDit and Yearit are monthly and yearly dummy variables, μi is the fixed effects for coastal areas, and εit is the error term of the ith coastal area in period t. Standard errors for the parameters are identified using the clustered covariance matrix of Arellano (1987).
3.2.4 Data
Merged data at the most detailed level geographically were ordered for the analysis from Statistics Denmark. From this order, monthly data from January 2016 to December 2021 are available for postal codes in coastal areas. The dataset includes data on overnight stays of Danes and foreign guests, although discretion reduces the options of applying the data when few tourism companies operate in a postal code area. Initially, 146 postal codes in coastal areas were included in the dataset. However, due to the presence of too few companies in several areas, data from the 146 postal code areas were merged into 62 areas. Data on fishery are available from the Danish Fisheries Agency for the same areas. Finally, data on drivers of tourism demand are available from Statistics Denmark. The list of variables appears in Table 7.
| Group | Variable | Description |
| Basic | Time | Year and month that cover 2016.01-2021.12. |
| PostalCodeGroup | Groups of postal code areas that include 146 postal code areas summed to 62 due to discretion. | |
| Municipality | The municipalities in which the postal code areas are located. | |
| SD1-11 | Seasonal dummies. SD1 = 1 in January otherwise zero, SD2 = 1 February otherwise zero, etc. | |
| Fishery | VesselsLT | Number of vessels with landing value > 0 (Danish and foreign) in the postal code area |
| VesselsRES | Number of vessels with landing value > 0 residing in a harbour (Danish and foreign) in the postal code area | |
| Harbours | Number of active harbours in the postal code area (landing value > 0) | |
| LandQT | Total landings in the postal code area (tons) | |
| LandQH | Landings for human consumption in the postal code area (tons) | |
| LandVT | Total landings in the postal code area (DKK million) | |
| LandVH | Landings for human consumption in the postal code area (DKK million) | |
| Tourism | NightsT | Total number of overnight stays |
| NightsD | Number of overnight stays by Danes | |
| NightsF | Number of overnight stays by foreign tourists | |
| PopMUN | Municipal population quarterly in the first day of the quarter in all three months in the quarter (neither monthly data nor population data at postal code areas are available) | |
| IncomeMUN | Average annual municipal income after tax, DKK (neither monthly data nor data at postal code areas are available) | |
| Note: “L” before the variable mentioned above means in all cases that the logarithm of the number is used. Sources: Tourists overnight stays: Special order to Statistics Denmark (2021), Overnight Stays in Danish Hotels, Hostels, Camping Areas, Marinas and summer houses, monthly 2016-2021. Tourism demand drivers: Population: Statistics Denmark (2022), Population at the first day of the quarter by region, sex, age and marital status (Database FOLK1A), available at: https://www.statbank.dk/statbank5a/default.asp?w=1920. Income: Statistics Denmark (2022), Payout after deduction of tax etc. by municipal, unit, sex, age and income interval (Database AINDK3), available at: https://www.statistikbank.dk/statbank5a/default.asp?w=1920. Fishery: Number of vessels: Danish Fisheries Agency (2022), The Vessel Register. Landings: Danish Fisheries Agency (2022), Landing and Catch Statistics. | ||
Table 7 List of fishery and tourism variables for postal codes in coastal areas, monthly data 2016–2021
The data include fishery and tourism data for postal code areas with a coastline, except for areas with a coastline in deep fiords such as areas inside the Isefiord and the Roskilde Fiord. Moreover, areas with fishery taking place in freshwater lakes and streams in landlocked areas are excluded. Finally, since overnight stays are presumed to be driven by other factors than fishery in the large cities, areas in Greater Copenhagen, Aarhus, Odense and Aalborg are excluded, despite being located by the coast. The variables are described in three groups in Table 7. The first group are the basic variables time, postal code group, municipality and seasonal dummies. The second group contains fishery data. The dataset includes variables for the number of vessels that reside and land in a harbour in the postal code area and for the number of harbours in each area. There are also variables for landings in quantity and value, measured as total landings or landings for human consumption (excluding fish for reduction). The third group contains numbers of overnight stays (total, Danes and foreign guests) in hotels, hostels, camping areas, marinas and summer houses. This group also contains the control variables for municipal population and income. These variables are selected as the total number from the municipalities in which the postal code areas are located. Hence, the variables only take nearby tourist demand into account. Income is measured as the after tax average for the municipality and region where the postal code area is located.
Summary statistics of the variables in the dataset are shown in Table 8 as total average annual numbers per area (of the 62 areas and without logarithms).
| Variable | Total in dataset | Average per area (of 62 areas) |
| Fishery | ||
| VesselsLT (no. vessels) | 858 | 13.8 |
| VesselsRES (no. vessels) | 843 | 13.6 |
| Harbours (no. harbours per area) | 1.8 | |
| LandQT (tons) | 582,120 | 9,389 |
| LandQH (tons) | 143,352 | 2,312 |
| LandVT (million EUR) | 331 | 5.3 |
| LandVH (million EUR) | 231 | 3.7 |
| Tourism | ||
| NightsT (no. nights) | 23,158,623 | 373,526 |
| NightsD (no. nights) | 17,535,431 | 282,830 |
| NightsF (no. nights) | 5,623,192 | 90,697 |
| PopMUN (no. persons per municipal) | 44,923 | . |
| IncomeMUN (EUR/person) | 24,920 | . |
Table 8 Summary statistics, annual total and annual average per postal code group, 2016–2021.
The dataset includes 331 million euros of the annual average landing value for Denmark in 2016–2021 of 507 million euros, corresponding to a coverage of two thirds. For vessels, the average number in 2016–2021 is 990 including both Danish and foreign vessels, as compared with the total number of active Danish vessels in 2020 of 1,330. Hence, both measured as number of vessels and as landing value, the majority of the fishery activities in Denmark is included in the analysis.
The average number of overnight stays per year in the Danish coastal areas in the dataset is 23.2 million, corresponding to 52 percent of the total number of overnight stays in Denmark. Hence, also for overnight stay facilities, the majority of the activities are included in the analysis.
The annual average per area indicates that 15 vessels have their home harbour and land in each area and that each area, on average, has 1.8 harbours. The average total landings per area are 9,389 tons and 5.3 million euros, while landings for human consumption are 2,312 tons and 3.7 million euros. The average number of overnight stays in each area is 373,526, consisting of 282,830 Danish guests and 90,697 foreign guests. The tourism demand variables for the municipalities the postal code areas are part of have an average population of 44,923 people with an average income of 24,920 euros.
3.2.5 Results
The results of the estimation of the fixed effect regression model in (3) appear in Table 9. Six different models are estimated. All models have the logarithm of overnight stays as the dependent variable. The first column presents the model with the number of vessels landing in the coastal area as the independent fishery activity variable, while the second column shows the results for the model when fishing activity is measured as the number of vessels with home harbour in the area. The third and fourth column present the results of models with fishing activity measured as total landed quantity and total landed quantity for human consumption, respectively. Finally, the fifth and sixth column show the results of models with total landing value and landing value of fish for human consumption as the fishery activity variable. Estimations are performed using Stata.
Table 9 Fixed effect results
| (1) | (2) | (3) | (4) | (5) | (6) | |
| Variables1 | LNightsT | LNightsT | LNightsT | LNightsT | LNightsT | LNightsT |
| LVesselsLTt-1 | 0.0824* | |||||
| (0.0455) | ||||||
| LVesselsRES t-1 | 0.113** | |||||
| (0.0458) | ||||||
| LLandQT t-1 | 0.00103 | |||||
| (0.0145) | ||||||
| LLandQH t-1 | 0.00736 | |||||
| (0.0144) | ||||||
| LLandVT t-1 | 0.0259 | |||||
| (0.0196) | ||||||
| LLandVH t-1 | 0.0277 | |||||
| (0.0174) | ||||||
| LPopMUN | 0.183*** | 0.198*** | 0.207*** | 0.202*** | 0.191*** | 0.187*** |
| (0.0329) | (0.0317) | (0.0280) | (0.0284) | (0.0305) | (0.0303) | |
| LIncomeMUN | 8.435*** | 8.253*** | 8.353*** | 8.321*** | 8.444*** | 8.294*** |
| (2.711) | (2.629) | (2.655) | (2.650) | (2.705) | (2.694) | |
| Year2 | 0.512*** | 0.498*** | 0.512*** | 0.510*** | 0.515*** | 0.507*** |
| (0.144) | (0.139) | (0.141) | (0.140) | (0.144) | (0.143) | |
| Year3 | 0.418*** | 0.409*** | 0.419*** | 0.416*** | 0.420*** | 0.414*** |
| (0.110) | (0.107) | (0.108) | (0.108) | (0.110) | (0.110) | |
| Year4 | 0.358*** | 0.350*** | 0.357*** | 0.355*** | 0.357*** | 0.352*** |
| (0.0892) | (0.0863) | (0.0870) | (0.0869) | (0.0890) | (0.0887) | |
| Year5 | 0.0941** | 0.0896** | 0.0931** | 0.0926** | 0.0933** | 0.0917** |
| (0.0426) | (0.0414) | (0.0413) | (0.0414) | (0.0424) | (0.0424) | |
| SD1 | 0.125*** | 0.125*** | 0.127*** | 0.128*** | 0.129*** | 0.129*** |
| (0.0262) | (0.0262) | (0.0269) | (0.0267) | (0.0263) | (0.0263) | |
| SD2 | 0.224*** | 0.221*** | 0.227*** | 0.228*** | 0.229*** | 0.229*** |
| (0.0263) | (0.0258) | (0.0273) | (0.0270) | (0.0263) | (0.0263) | |
| SD3 | 0.603*** | 0.596*** | 0.613*** | 0.613*** | 0.614*** | 0.613*** |
| (0.0462) | (0.0463) | (0.0468) | (0.0466) | (0.0460) | (0.0459) | |
| SD4 | 0.810*** | 0.803*** | 0.823*** | 0.823*** | 0.823*** | 0.821*** |
| (0.0525) | (0.0522) | (0.0521) | (0.0520) | (0.0517) | (0.0516) | |
| SD5 | 0.946*** | 0.940*** | 0.958*** | 0.959*** | 0.960*** | 0.959*** |
| (0.0552) | (0.0548) | (0.0554) | (0.0552) | (0.0547) | (0.0546) | |
| SD6 | 1.316*** | 1.311*** | 1.319*** | 1.322*** | 1.327*** | 1.327*** |
| (0.0647) | (0.0644) | (0.0656) | (0.0654) | (0.0643) | (0.0641) | |
| SD7 | 1.102*** | 1.098*** | 1.107*** | 1.110*** | 1.114*** | 1.114*** |
| (0.0574) | (0.0571) | (0.0578) | (0.0575) | (0.0565) | (0.0563) | |
| SD8 | 0.822*** | 0.817*** | 0.831*** | 0.833*** | 0.835*** | 0.835*** |
| (0.0495) | (0.0491) | (0.0498) | (0.0496) | (0.0488) | (0.0486) | |
| SD9 | 0.605*** | 0.599*** | 0.616*** | 0.617*** | 0.616*** | 0.615*** |
| (0.0408) | (0.0401) | (0.0414) | (0.0409) | (0.0406) | (0.0405) | |
| SD10 | 0.317*** | 0.313*** | 0.325*** | 0.326*** | 0.326*** | 0.325*** |
| (0.0245) | (0.0236) | (0.0253) | (0.0252) | (0.0249) | (0.0247) | |
| SD11 | 0.126*** | 0.125*** | 0.128*** | 0.129*** | 0.130*** | 0.129*** |
| (0.0233) | (0.0230) | (0.0241) | (0.0238) | (0.0234) | (0.0233) | |
| Constant | -42.06*** | -41.19*** | -41.67*** | -41.49*** | -42.14*** | -41.34*** |
| (14.29) | (13.87) | (14.01) | (13.98) | (14.27) | (14.21) | |
| Observations | 3,041 | 3,041 | 3,041 | 3,041 | 3,041 | 3,041 |
| R-squared | 0.762 | 0.763 | 0.761 | 0.761 | 0.762 | 0.762 |
| Number of id | 62 | 62 | 62 | 62 | 62 | 62 |
| Note: 1. Robust standard errors in parentheses. *** p<0.01, ** p<0.05, * p<0.1. The (t-1) for the fishery activity variables indicates that the estimations are performed with a lag of one year. Fixed effects for postal code areas are included in all estimations. | ||||||
The results of all six models are based on data from 62 coastal areas totally providing 3,041 observations. The R2 of 0.76 is high, implying that all models are well-suited to explain the number of overnight stays.
The constant term, the seasonal dummies and the fixed effect for years are all significant at the 5 percent level or less. That is also true for municipal population and average income, where the estimated parameters for both have positive signs indicating that overnight stays increase both with population size and income.
The fishery activity variables have the expected positive sign in all six cases but only two are statistically significant: the number of vessels landing in a coastal area and the number of vessels with home harbour in a coastal area. The interpretation of the coefficient of 0.113 in model 2 is that when the number of vessels with home harbour in the area increases by 1 percent, the number of overnight stays increases by 0.113 percent. The coefficient of the number of vessels landing in a coastal area is significant at the 10 percent level in model 1 while the coefficient of the number of vessels with home harbour in a coastal area is significant at the 5 percent level in model 2.
The positive and significant coefficients in model 1 and 2 taking unobserved heterogeneity into account provide evidence of a positive relationship between fisheries and overnight stay facilities. The results thereby suggest that there is a positive externality from fishery to tourism. Evidence is provided both for vessels with home harbour in the coastal area and for vessels that land in the coastal area. The higher parameter for vessels with home harbour than for vessels that land in the area (0.113 versus 0.0824), further reveal that vessels with home harbour in the coastal area are more important for tourism than vessels that land in the area.
As opposed to model 1 and 2, the fishery activity variables in model 3–6 are not statistically significant. Therefore, a relationship between quantity landed and tourism could not be identified in these models.
The robustness of the results obtained is assessed by performing a sensitivity analysis. When estimating the models in column 1 and 2 with regional population and regional income as tourism demand variables instead of municipal population and municipal income, largely the same results are achieved. R2 remains largely unchanged and the seasonal dummies, the income variable, and the fishery activity variables remain significant and have the expected signs. The only change is that regional population as opposed to the municipal population is not significant, although the sign is positive.
By estimating model 6 with regional population and income instead of municipal population and income, R2 is largely the same and the parameters for all variables are positive as expected. Moreover, parameters for all variables except regional population are significant. The parameter for the fishery activity variable landing value of fish for human consumption is 0.0296 and significant at the 10 percent level. Hence, this model provides extra evidence of a positive relationship between tourism and fishery measured as landing value of fish for human consumption.
3.2.6 Discussion
Private cooperation between fisheries and tourism will include topics of fleet size and fleet composition, with tourism companies gaining from a large number of smaller vessels while fishers might gain from fewer but larger vessels. While the two sectors coexist in most harbours, decisions on the fleet size are based on the situation in the fishery sector only. Decisions are based on economic considerations within the Danish individual transferable quota system, focusing on maximising the economic profit for the individual company. In parallel, decisions on activities in tourism and overnight stay facilities could currently be considered to be taken without consulting the fisheries. Implicitly, these decisions may reflect the level of fishery activities, although knowledge of to what extent companies are aware of the positive externality is not available. Formal agreements are not presumed to exist, but informal agreements might be present in the form of an implicit mutual acceptance of coexistence in the harbours.
Cooperation in determining the mutually optimal fleet size requires agreements that companies within both sectors gain from it. Moreover, tourism companies must realise that they gain from the presence of a large fishing fleet in their local area and must be willing to compensate fishers for having more fishing vessels than what is optimal based on profits from fishing only. Finally, agreements require that fishers are willing to accept interference from tourism companies, e.g. in the form of when, where and how to land their catch, where to sell it, etc. Under such circumstances, agreements may potentially appear.
Agreements may take different forms. One possibility is that overnight stay facilities compensate fishers directly or indirectly for their fishing services. Compensation can be done in different ways. First, by using side-payment arrangements, e.g. that tourism companies agree to purchase fish from local fishers for a longer period of time. Second, by providing direct investments to small vessels and part-time fishers. Third, by supporting the creation of an attractive environment for non-local fishers to land. Fourth, by tourism companies owning their own small fishing vessels, thereby ensuring vessels in their local harbour. Fifth, by ensuring agreements between the two sectors indirectly as part of larger plans covering all activities and sectors in a harbour. For publicly owned harbours, this can be done via political municipal plans, and via plans coordinated by the Board of owners for privately owned harbours. By that, it may be possible to accommodate the interests of both sectors. For example, by investing in a well-functioning infrastructure for the fishery in the harbour to attract local fishers to stay active and non-local fishers to land. Via the increased number of vessels that may follow, tourism may increase simultaneously.
3.2.7 Take-home message
In this case study, the effect on tourism of fisheries activities in local coastal communities has been studied in Denmark by estimating a fixed effect regression model. A significant positive relationship is found where the number of fishing vessels explains overnight stays at hotels, hostels, camping areas, and summer houses. The positive effect is found both for vessels with home harbour in the area and for vessels that land in the area. Evidence of fishery creating a positive externality valuable for tourism in coastal areas of Denmark is thus provided. However, the effect is solely from the number of vessels since landed quantities did not have a significant effect on tourism.
3.3 Norway
Margrethe Aanesen, Julide Ceren Ahi
Marine recreational fishing tourism is a tourism segment where Norway has comparative advantages globally. A millennium old fishing culture combined with access to abundant resources along a long coastline secure both knowledge and raw material necessary for a successful development of this tourism segment. This tourism segment sparked off in the mid-1990s, and has grown tremendously the last 25 years. In 2019 it hosted 1.4 million guest nights, and its value added equaled 1.4 billion Norwegian kroner (NOK). In total 1550 full-time jobs are related to marine recreational fishing tourism in Norway, and of these 800 are direct jobs in the sector distributed on about 750 enterprises (Grønvik and Erraia, 2022).
Commercial fishing is the oldest industry in Norway, with roots back to the Viking era more than 1000 years ago (https://snl.no/Norsk_fiskerihistorie). Still, today commercial fishing and aquaculture is the second largest export sector, only beaten by oil and gas (Statistics Norway, 2022). On one hand, this old and large sector has been a precondition for the progress of marine fishing tourism, on the other hand it has been claimed that fish caught by tourist anglers has become a threat to coastal fishers in parts of the country (https://www.kystogfjord.no/nyheter/forsiden/Turistfiske-regjeringa-og-EU). While the detrimental effect of fishing tourism on commercial fisheries is disputed and not well substantiated (Borch et al., 2009b) commercial fisheries importance for the development of marine fishing tourism is an interesting and highly important research question.
3.3.1. Description of the case
Lofoten is the common name for a group of islands just north of the Arctic Circle in Norway. Traditionally, fishing has been the main economic sector and the most important species is, and has always been, cod. Each year in February–April huge numbers of mature cod enter the coastal waters around the Lofoten islands to spawn. This has been the foundation for the traditional Lofoten fisheries, attracting fishers from large parts of Norway. While this has traditionally been a subsistence and commercial fishery, recently it has also attracted tourist fishers, both domestic and foreign fishers (https://snl.no/lofotfisket). Being an important fishing harbour for centuries, and hosting fishers that came to participate in the cod-fisheries, it was built a large number of small houses, called rorbuer, to house the long-distance fishers. These “rorbuer” have been transformed into modern small huts for tourists, and has laid the foundation for the development of the tourism sector in Lofoten.
Currently, Lofoten includes six municipalities with a total population of about 25,000. The largest town is Svolvær with about 5,000 inhabitants. Most people are employed within private and public service and administration. But about 10 percent are employed in the primary sector, mainly coastal fishing, and this is a higher share compared to the country average of 5 percent (Statistics Norway). The tourism sector employs about 550 persons (Statistics Norway, 2022), but has substantial ripple effects in all the municipalities (Grønvik and Erraia, 2022). Figure 2 shows a map of the island group.
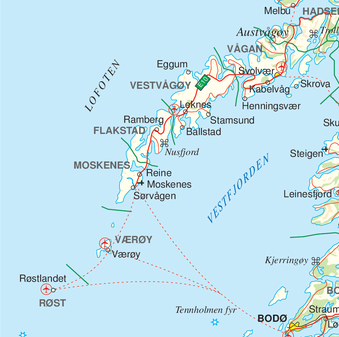
Figure 2 Map of Lofoten
3.3.2 Research question
Using the most famous destination for marine recreational fishing tourism in Norway, Lofoten, we explore the importance of commercial fisheries related activities and attractions for tourists who have visited this destination. We do not directly investigate potential links between commercial fisheries activities, including the presence of a fisheries culture, and the existence and/or development of marine fishing tourism.
3.3.3 Method and data
The survey
To elicit tourists’ preferences when it comes to fisheries related attractions and activities we implemented an electronic survey among tourists that had visited the Lofoten islands during summer either in 2020 or 2021. The survey was only in Norwegian, which was not a problem as, due to the pandemic, in these years there were very few international tourists at this destination.
The survey instrument
The survey, in the form of a choice experiment, encompassed fifteen questions and eight choice cards. The questions concerned when the trip took place, with whom, motivation for choosing this destination, and which activities the respondent had taken part in while in Lofoten. They also included questions on demographic and economic situation.
The choice cards included three alternatives described by four attributes, catch per person per trip (CATCH), size of the active fleet in the harbour (BOATS), fishing tradition and culture (CULTURE), and costs of choosing an alternative with more activities compared to today (COSTS). Taken together, these attributes yield a few possible scenarios for what Lofoten may offer for activities and attractions in the future. Table 10 describes the attributes and the levels they may take.
| Attribute | Levels |
| Catch per person per trip | 5 fish per person per trip (SQ) 3 fish per person per trip 10 fish per person per trip |
| Size of the active fleet in harbour | 100 registered boats (SQ) 30 registered boats 200 registered boats 300 registered boats 400 registered boats |
| Fishing tradition and culture | No seafood festival or fish market (SQ) Seafood festival only Fish market only Both seafood festival and fish market |
| Cost | 0 NOK (SQ) 500 NOK 1,000 NOK 1,500 NOK 2,000 NOK 3,000 NOK |
Table 10 Attributes and attribute levels
While alternative 1 always describes the current situation, alternatives 2 and 3 describe a hypothetical situation for how the destination may develop in the next years. Figure 3 yields an example of a choice card.
| Nåværende situasjon | Alternativ 1 | Alternativ 2 | |
Fangst pr person pr fisketur  | 5 fisk | 5 fisk | 10 fisk |
Antall kystfiskefartøy i havna | Mellom 5–10 kystfiskefartøy | 20 kystfiskefartøy | 3 kystfiskefartøy |
Levende havn | Verken fisketorg eller sjømatfestival | Fisketorg | Fisketorg & sjømatfestival |
Kostnad | 0 NOK | 500 NOK | 3000 NOK |
| Jeg foretrekker |
Figure 3 Example of choice card
Photo: Daniel Diemer/Unsplash
After the eight choice cards, respondents were asked, on a scale from 1=not important to 6=very important, how important each of the attributes was when they made their choices. And finally, the respondents were asked whether they thought results from the survey would be used by decision makers (consequentiality).
Data collection
The data collection was administered by a polling company. They distributed the survey via social media, using an advertisement asking for respondents to the survey (se Figure 4 for the advertisement).
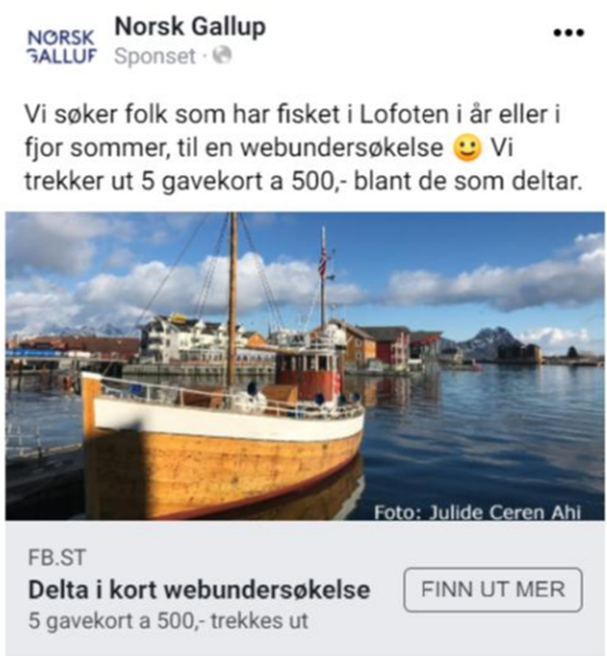
Figure 4 Advertisement in SoMe asking for respondents to the survey. Text says: “We are seeking people who have been fishing in Lofoten this summer or last summer for a web-survey. Among the participants we will draw 5 who will be offered a gift card of NOK 500 (about 50 EUR).
The data collection period was October (pilot) and November (main survey) 2021. The pilot included 66 respondents, and the main survey 135 respondents, yielding a total of 201 respondents. This is a convenience sample, and we have no information regarding the population of tourists who have been visiting Lofoten and have been fishing there the last two summer seasons. Socio-demographic information of the sample shows that 50 percent are female, the average age is 53.7 years, about 60 percent have a University degree, and the mean income is about 550,000 NOK (55,000 EUR).
Econometric model
Lancaster’s (1966) theory of value lies in the theoretical foundation of discrete choice experiment (DCE) methodology. According to Lancastrian consumer theory, the total utility of a good can be decomposed into separable utilities of its characteristics (Zanoli et al., 2013, which translate into various attributes in DCE methodology.
Econometric modelling of the utility is often executed by applying random utility modelling (RUM) framework (McFadden, 1973). According to RUM, the total utility individual n obtains from alternative i on choice occasion t can be expressed as:
(4)
where the total utility U consists of a systematic component, V, and a stochastic component ε (McFadden, 1974; Train, 2009). When the observable part of the utility (V) is expressed as a linear function of the vector of the taste parameters (βn1 and attribute levels (xnit), the total utility (Unit) becomes:
(5)
The model (5) can be adjusted such that monetary and non-monetary attributes are separated, enabling direct estimation of willingness to pay (WTP) within the utility specification, which is referred to as utility in WTP space (Train and Weeks, 2005):
(6)
In equation (6), anrepresents the preferences for cost, and the vector of taste coefficients for non-cost attributes (b'n) deliver the WTPs directly[1]For technical details regarding estimation in WTP-space, please see Train and Weeks (2005). Consequently, the probability of choosing alternative i becomes the logit probability:
(7)
However, logit probability assumes homogenous utility across individuals, which implies that each individual has the same WTP for a given attribute. Therefore, we estimate a mixed logit model (MIXL) and with a complete variance-covariance matrix to account for heterogeneity across individuals and correlation across individual choices. Accordingly, the probability of the sequence of choices (Y) by individual n becomes the integral of the product of logit formula over all possible values of β (Train, 2009):
(8)
which is simulated by averaging R draws from the specified distribution.
In our application, we assume all non-cost parameters to follow a multivariate normal distribution, allowing both positive and negative preferences. For the cost attribute, however, we specify a negative log-normal distribution to ensure only negative preferences for an increased cost. The maximum likelihood estimation employs 5000 scrambled Sobol draws (Czajkowski and Budziński, 2019).
We model the attributes of CATCH and BOATS, as described in Table 10 and referring to the two first lines (not counting the heading) in the choice card (Figure 3), as linear and continuous. Consequently, their parameters indicate the WTP for a unit increase in catch per tourist per fishing trip and per coastal fishing boat in the harbour, respectively. In contrast, CULTURE, as described in Table 10 and referring to the third line in the choice card (Figure 3), is modelled as categorical which enables WTP estimation for each level (the levels are given in Table 10).
Footnotes
- ^ For technical details regarding estimation in WTP-space, please see Train and Weeks (2005).
3.3.4. Results
Travel information
The survey started by asking respondents a few questions about the trip to Lofoten. Table 11 shows that couples are the largest group with almost half of the respondents. The second largest group is people travelling with friends, and less than 10 percent travel alone. The fact that our sample includes only tourists visiting the islands during the summer season means that it does not cover activities taking part only during winter. The so-called Lofoten-fishery is a millennia old fishery taking part in the winter (February-April), when the northeast Atlantic cod migrates to the coast of Lofoten to spawn. In the last decade, tourism companies have started offering tourists to go out in old, traditional fishing vessels and take part in this fishery with handheld gear, as it was run in earlier times. These companies also offer the participants to take part in preparing the fish they catch and eat it in the traditional manner after the fishing trip. Our sample does not include people who have participated in these activities, and thus may not be representative of typical winter activities. According to the largest company offering this activity, it typically attracts more men than women (personal communication), and although the impression is that the men come either alone or in groups with other men to take part in this activity, they cannot verify whether this is the case.
| Travel group | N | % |
| Solo traveler | 19 | 0.09 |
| With partner | 94 | 0.47 |
| With partner and kids | 35 | 0.17 |
| With Friends | 39 | 0.19 |
| Other | 14 | 0.07 |
| Total | 201 | 1.00 |
Table 11 Travel group, number and %
In the formulation of the survey we used the official homepage of the regional tourist office, Visit Lofoten (https://visitlofoten.com/en/), for an overview over activities and attractions offered, and we applied their categorisation of activities when formulating answer categories for questions on motivation and implementation of activities.
| Activities | N |
| Marine fishing | 9 |
| Northern lights tour | 1 |
| Sea safari | 9 |
| Whale safari | 0 |
| Paddling | 0 |
| Hiking | 24 |
| Biking | 2 |
| Museums and fishing villages | 17 |
| Competition participation | 1 |
| Culinary experiences | 17 |
| Nature experience | 9 |
| Family visit | 30 |
| Visit on the way | 20 |
| No specific activity/unsure | 20 |
| Other | 9 |
| 112 | 9 |
| Note: The activities mentioned under “other” are activities that have been mentioned by respondents, and that do not belong to any of the categories mentioned. | |
Table 12 Number of respondents that mentioned each of the given category of activities as a motivation for them to visit Lofoten
While hiking is the single most important activity that motivates respondents to go to Lofoten, visiting museums and fishing villages and enjoying culinary events are also mentioned as important by many visitors. The second most important activity that motivates people is fishing and sea safari.
The activities that respondents took part in, presented in Table 13 below, reflect the motivation for respondents to visit Lofoten. The respondents were asked to tick off all activities they took part in and attractions they visited.
| Activities (1+) | N | % |
| Marine fishing | 18 | 0.09 |
| Northern lights tour | 3 | 0.01 |
| Sea safari | 30 | 0.15 |
| Whale safari | 2 | 0.01 |
| Paddling | 3 | 0.01 |
| Hiking | 49 | 0.24 |
| Biking | 4 | 0.02 |
| Museums and fishing villages | 74 | 0.37 |
| Competition participation | 2 | 0.01 |
| Culinary experiences | 67 | 0.33 |
| No specific activity | 52 | 0.26 |
| Other | 26 | 0.13 |
Table 13 Number of respondents that they took part in each of the categories of activities while visiting Lofoten
Table 13 shows that visiting museums and fishing villages and testing culinary experiences are the most common activities among the respondents, followed by hiking, sea safari and marine fishing.
Choice experiment results
Having indicated what motivated visitors to go to Lofoten, and what they actually did there, the choice experiment is asking the same visitors to choose between the status quo (SQ), i.e. a situation as it was when they visited the destination, and a few scenarios including additional attractions and a larger presence of the commercial fisheries in the form of fishing vessels in the harbour. It is easy to prefer additional attractions and activities if these come for free, and thus we informed that the respondents could only choose one of the non-SQ alternatives if they were willing to pay an amount that was given in the bottom line of the choice cards. These costs allow us to derive willingness to pay estimates for each of the attributes.
Table 14 presents the results of the mixed multinomial model for the choices made by the 201 respondents in the survey.
| Coefficients in preference space | Mean | Standard deviation |
| STATUS QUO | 0.140 | 3.41*** |
| (t-ratio) | (0.47) | (9.05) |
| -ln (COST) | -1.48*** | -0.22 |
| (t-ratio) | (4.44) | (-1.13) |
| Coefficients in WTP space | Mean (NOK) | Standard deviation (NOK) |
| CATCH | -77*** | 51.3*** |
| (t-ratio) | (4.53) | (7.47) |
| FLEET SIZE | 8.83** | 7.86*** |
| (t-ratio) | (2.21) | (4.94) |
| SEAFOOD FESTIVAL | 1,075*** | 1,135*** |
| (t-ratio) | (11.1) | (9.61) |
| FISH MARKET | 2,846*** | 814*** |
| (t-ratio) | (12.15) | (6.07) |
| BOTH SEAFOOD FESTIVAL AND FISH MARKET | 3,357*** | 568*** |
| (t-ratio) | (12.51) | (20.3) |
| Log-likelihood (0) | -1,766 | |
| Log-likelihood | -1,242 | |
| AIC | 2,592 | |
| BIC | 2,698 | |
| McFadden’s ρ | 0.29 | |
| Number of observations | 1,608 | |
| Number of parameters | 29 | |
| Note: *, ** and *** indicate significance at 10%, 5% and 1% level respectively. | ||
Table 14 Mean non-cost attribute WTP and standard deviation in NOK, and mean preference sensitivity and standard deviation for alternative specific constant and cost attribute.
Concentrating on the attribute WTPs, Table 14 shows that the single most important attraction for the respondents is a seafood market. They would be willing to pay almost NOK 3,000 more for a trip to Lofoten if there were a seafood market. The second most important attraction is a seafood festival, for which they are willing to pay more than NOK 1,000. As expected, if both the mentioned attractions are present the respondents are willing to pay more than for each single attraction, namely NOK 3,357. Increasing the fishing fleet size is of far smaller importance to respondents in our sample, and on average they are only willing to pay about NOK 9 per extra fishing vessel above the 5–10 vessels that are currently in the harbour at any time. Although small, the positive and significant parameter indicates that there is a willingness to pay for extra fishing vessels in the harbour. On the other hand, higher catches are not important to respondents in our sample. The negative and significant sign of this attribute means that people prefer lower catches than five fishes per participant on an arranged fishing trip. This is not surprising, as our sample to a large degree includes couples, families and groups of friends for whom the activities and doing them with their family and friends probably is more important, and the outcome, like catches is of less importance. Had the sample included tourists going to Lofoten to take part in winter fishing activities, the result may have come out differently. The fishing activity offered during the traditional Lofoten-fishery in February–April includes the option to participate in preparing and eating the catches in a traditional manner, which means that catches may be of certain importance.
The coefficient for the status quo alternative is insignificant. This coefficient represents the average effect of omitted factors, like the weather, motivation and purpose of the trip to Lofoten, on the utility of the SQ-alternative relative to the two scenarios. The fact that the coefficient is insignificant shows that there is no preference for the SQ-alternative in relation to the two scenarios caused by unincluded factors. Finally, the cost coefficient is negative, which is as expected.
The model’s fit is represented by McFaddens R2, which equals 0.29. For logit models this is acceptable, as for this type of models a value between 0.2–0.4 is considered acceptable (https://spureconomics.com/goodness-of-fit-for-logit-and-probit-models/).
| Attribute | Not important | 2 | 3 | 4 | 5 | Very important | Unsure |
| Catch | 0.41 | 0.07 | 0.17 | 0.16 | 0.06 | 0.06 | 0.07 |
| Fleet size | 0.19 | 0.07 | 0.16 | 0.20 | 0.14 | 0.09 | 0.13 |
| Fish market and festival | 0.06 | 0.06 | 0.16 | 0.21 | 0.22 | 0.22 | 0.05 |
| Cost | 0.06 | 0.06 | 0.18 | 0.22 | 0.15 | 0.23 | 0.08 |
Table 15 How important were the attributes when you answered the choice cards? Share of persons for each of the attributes
Table 15 shows that, on average, catch is the least important attribute for the respondents answering the choice cards. 41 percent of those responding to this attribute said that they do not find it important at all, and only 6 percent found it very important. Fleet size is not regarded as very important either, with 19 percent saying it is not important at all, and only 9 percent saying it is very important. The most important attributes are fish market and food festival and cost. Only 6 percent said that these attributes were not important when they made their choices in the choice cards, while 44 percent and 38 percent said that they were either important or very important.
Finally, after the choice cards we asked whether the respondents thought the results of the survey would be used by decision makers. Table 16 yields the results, and shows that many of the respondents think the results will be of some importance (category 4 out of 6), and only a few state that they do not think it will be important.
| Not important | 2 | 3 | 4 | 5 | Very important | Unsure | |
| … for the policy makers | 7 | 12 | 41 | 60 | 29 | 21 | 30 |
| …for the tourism offer in Svolvær | 5 | 21 | 26 | 72 | 22 | 21 | 34 |
Table 16 How important do you think the results of the survey will be for decision makers? Number of persons.
3.3.5. Discussion
Although the tourism sector grows globally (although it is still not back at the pre-COVID level) there is competition between destinations in attracting tourists. In this competition, offering unique attractions and activities may increase the competitiveness. The background for this case study was whether the presence of a traditional fishing culture may serve as an attraction for tourists. Our empirical case is the Lofoten islands in Arctic Norway. Here, traditional fisheries have been the foundation for a rapidly growing tourism industry, as old abandoned fishers’ huts have been transformed into modern huts for tourists. In the last year before the pandemic (2019) the Lofoten islands hosted 1.4 million guest nights, and adding tourists that sleep in tents and private accommodation, the number is probably even higher. The total population of the islands is less than 25,000.
There is no doubt that active fisheries and the presence of a traditional fishing culture have been the foundation for the development of the tourism sector in Lofoten. Hence, we have in this paper elicited tourists’ - who have visited Lofoten during the years 2020–2021 - views on present and potential future attractions.
Visiting museums and fishing villages, and participating in culinary events are the most frequent activities for the respondents in our sample. When asked, they prefer additional cultural and culinary attractions and activities like a seafood market and seafood festival. These are preferred to the presence of more fishing vessels in the harbour and higher catches by recreational fishing.
Regarding the size of catches by recreational fishing, this is the attribute the respondents cared the least about. One reason may be that less than 10 percent of the sample said that fishing was one of the activities they took part in while visiting Lofoten, and even fewer said that it was a main motivation to visit Lofoten. Although somewhat unexpected, the negative sign of the WTP for the size of recreational catches is also reported in other surveys. For example, Aanesen et al. (2018) find that local inhabitants prefer a reduction in recreational catches to an increase, in a survey where they are asked to prioritise between commercial development and private use of marine resources. Hence, while our result may be due to the low number of recreational fishers in the sample, it may also indicate that the size of the catch is of minor importance in recreational fishing.
As of today, on average only between 5–10 fishing vessels are present in the harbour in Svolvær. Still, although positive, tourists’ WTP for more fishing vessels in the harbour is low. This could indicate that the presence of fishing culture is more of a qualitative character than a quantitative. As long as fishing vessels can be seen, the number of such vessels present in the harbour at any time is of less importance. We did not include a scenario where the number of fishing vessels in the harbour equals zero. The inclusion of such an alternative would have enabled us to elicit the importance of the presence vs non-presence of fishing vessels. This is something that should be considered in future work.
3.3.6 Take-home message
The main conclusion from our survey among tourists who visited Lofoten during 2020–2021 is that they prefer more activities similar to those they already participate in. They would be willing to pay more for a visit to Lofoten if it included the opportunity to visit a seafood market, and even more if it also gave the opportunity to participate in a seafood festival.
3.4 Finland
Tuija Lankia, Heidi Pokki
3.4.1 Description of the case
Fishing is a popular form of recreation in Finland. There are approximately 1.5 million recreational fishers in Finland (OSF, 2022), and a majority of them go fishing only in their province of residence (Pokki et al., 2020b). Inland fishing destinations attracting most Finnish fishers are rivers in Lapland, and lakes and rapids in Southern Savonia and Central Finland (Pokki et al., 2020b). This study focuses on River Teno, which is one of the few freely flowing salmon rivers in Finland. River Teno is situated on the northern border between Finland and Norway in the municipality of Utsjoki, which has around 1200 inhabitants. Salmon fishing in Teno is the foundation for the sustenance and culture of the indigenous Sámi (Hiedanpää et al., 2020). The river also provides livelihoods for fishing tourism entrepreneurs. Teno has been seen as the most prestigious salmon river in Europe (Saaristoasiain neuvottelukunta,. 2017) and it has been attracting fishing tourists for a long time based on the good reputation, relatively high catch rates, and the possibility to catch very large fish.
Still a decade ago, Teno had the largest wild Atlantic salmon stock complex in the world (Anon, 2012), but the number of salmon populations of the Teno tributaries has declined drastically, calling for stricter regulative measures. In 2017 Finland and Norway ratified the new Teno Fishing agreement aiming to reduce the fishing effort by 30 percent. The new regulations concerned all users of the river: the indigenous Sámi and other locals, tourists, and fishing entrepreneurs. In the fishing seasons 2021, 2022, and 2023 the salmon fishing was prohibited completely (Laki lohenkalastuksen määräaikaisesta kieltämisestä Tenojoen vesistössä 409/2022). The main reason for the salmon stock decline in the Teno and elsewhere in the northern Fennoscandia seems to be poorer survival rates during the sea migration (Vitenskapelig råd for lakseforvaltning, 2022). At the same time, River Teno has been facing large populations of invasive pink salmon that have been introduced to the North-West Russia from the Pacific area. While it is not yet known why the population of pink salmon has increased drastically in River Teno, the number of pink salmon already surpassed the number of original salmon in 2021.
As fishing tourism has been a significant source of income for the municipality of Utsjoki, weak salmon stocks cause a loss of income for the area. For example, in 2018, fishing tourists spent 2.6 million euros in Utsjoki. Taking into account the multiplier effects of the spending, the total impact of fishing tourism on the economy of the region was over 4 million euros. It has been estimated that the economic output from the fishing tourism was approximately five percent of the estimated total output of the local economy in 2018 (Knuuttila et al., 2020). The income from fishing tourism will be lost from the area’s income cycle as long as salmon fishing is prohibited for tourist anglers.
3.4.2. Research question
This study provides insights for the management of this remote northern fishing tourism destination, where fishing needs to be regulated to ensure a sustainable fish stock, but at the same time, fishing tourism is important in providing a vital livelihood in the area. To tackle this challenge, an increased understanding of tourist anglers’ preferences is important for both further development of tourism services and efficient fisheries management that requires an understanding of how anglers respond to social and ecological changes.
The study consists of two main parts. First, we examine which factors affect the number of fishing tourists' trips to Teno, with a special emphasis on whether fishing tourists' preferences for different services and the natural and cultural characteristics of the area affect the number of visits. The demand analysis also enables us to assess the value of recreational fishing trips for fishing tourists in monetary terms. While recreational fishing is an activity for which there is no market price, recognising its monetary value is important to support political decision-making. It is an estimate of the loss of welfare for fishing tourists in a situation where it would no longer be possible to fish salmon in the River Teno. Second, in order to produce information for the future development of tourism in the area, we study how often fishing tourists plan to visit Teno in the future under different scenarios. We analyse how the number of trips in the future would be affected by a decrease in the salmon catch, the change of fishing permits to a quota format and the development of nature tourism opportunities in the area. Diversification of non-fishing and non-catch related services and attractions could bring additional revenues to the area and decrease the pressure on the declining migratory fish population if the community could provide new types of services and benefits for tourists.
3.4.3. Method
This study uses two methods for economic valuation of non-market environmental goods and services, which are commonly used to estimate the demand and economic value of recreational visits to nature. First, the travel cost method is used to model the demand for and monetary value of the trips to Teno in the salmon fishing season of 2018. Second the combined travel cost – contingent behaviour method is used to evaluate how hypothetical future scenarios of the Teno area affect tourist anglers’ demand for the trips in the future.
Travel cost method
The Travel cost method (TCM) is a commonly used method for valuing the economic value of the recreational use of nature and was originally introduced by Hotelling (1949). The basic idea of TCM is that the cost of traveling to a recreational destination can be considered as an approximation for the cost of a recreational visit, assuming that the higher the cost, the fewer visits will be made (Garrod and Willis, 1999). Based on data on the number of visits to a specified recreational site during a specified time period and the associated travel costs, the demand curve for the visits can be estimated. The demand curve allows an estimation of the economic value of one visit in terms of consumer surplus (Parsons, 2003).
The econometric models used in the travel cost method produce the demand curve as an exponential function of the explanatory variables:
(9)
In the formula, yi is the number of trips an individual i takes, β0 is a constant, TCi is the travel cost variable and βTC its regression coefficient, xki and βk denotes all other explanatory variables included in the model and their regression coefficients. The consumer surplus per trip can be estimated simply with the formula:
(10)
In this study, the travel cost method is used to estimate the monetary value of the River Teno recreational fishing for fishing tourists in the 2018 fishing season. In addition, we examine whether fishing tourists’ preferences for the various services in the area affect the number of trips they make to Teno.
Travel cost – contingent behaviour method
Estimation of the impacts of changes in the site characteristics on the number of trips is not possible with a traditional travel cost model, since at a single site in one period, there seldom are any notable variations in site characteristics. Therefore, to examine the effects of future scenarios on the number of fishing trips to the River Teno, the combined travel cost-contingent behaviour approach (TC–CB) (e.g. Landry, et al., 2012; Kipperberg et al., 2019) is applied. In the TC-CB, data on the actual past trip frequency are supplemented with contingent behaviour data on the trip frequency under hypothetical future scenarios. The contingent behaviour method is a stated preference valuation method in which respondents are asked how many times they would visit the recreation site in the future under different hypothetical environmental quality scenarios. Combining data on the actual past visitation with contingent behaviour data on the hypothetical future visits enables the estimation of a recreation demand curve in which the site characteristics are incorporated.
Consequently, the effects of the future development scenarios on the trip demand can be estimated. In the TC-CB method the demand curve gives the number of trips y an individual i takes under the scenarios s:
(11)
Survey design and implementation
The data used in this study were collected by means of an online survey in the spring of 2019 and are reported in detail in Lankia et al. (2022). The survey was designed to collect data on the spending of fishing tourists in the River Teno region to assess the local economic impact of salmon fishing (Knuuttila et al., 2020), and to elicit tourist anglers’ perceptions of the importance and performance of several services and natural and cultural attractions of the River Teno area (Lankia et al., 2022). The survey also included questions needed to construct the travel cost and travel cost – contingent behaviour models that are analysed here.
The study population consisted of all non-residents who purchased a salmon fishing permit for the River Teno for the fishing season 2018. Contact details were received from the River Teno catch register. In total, contact details were available for 2,594 non-resident recreational anglers. To test the survey, first a pilot survey was sent to 200 randomly selected individuals in the sample in February 2019. Based on the feedback from the pilot, the survey was finalised and the invitation to respond to the main survey was sent by e-mail in March to 2,394 recreational fishers. After two reminders, in total 1,776 responses were received with the response rate of 74.2 percent. Including both the pilot survey and the final survey, the response rate was 71.5 percent, with 1,853 respondents in total. The pilot data were pooled with the main survey data in the analysis. The descriptive statistics of the sample are reported in Lankia et al. (2022).
Number of trips to River Teno
In the survey, respondents were asked to report the number of fishing trips they made to Teno in the fishing season 2018, as well as in the past five years. The number of trips in 2018 formed the basis for the TC -model, and the number of trips in the past five years was used for the TC-CB -model.
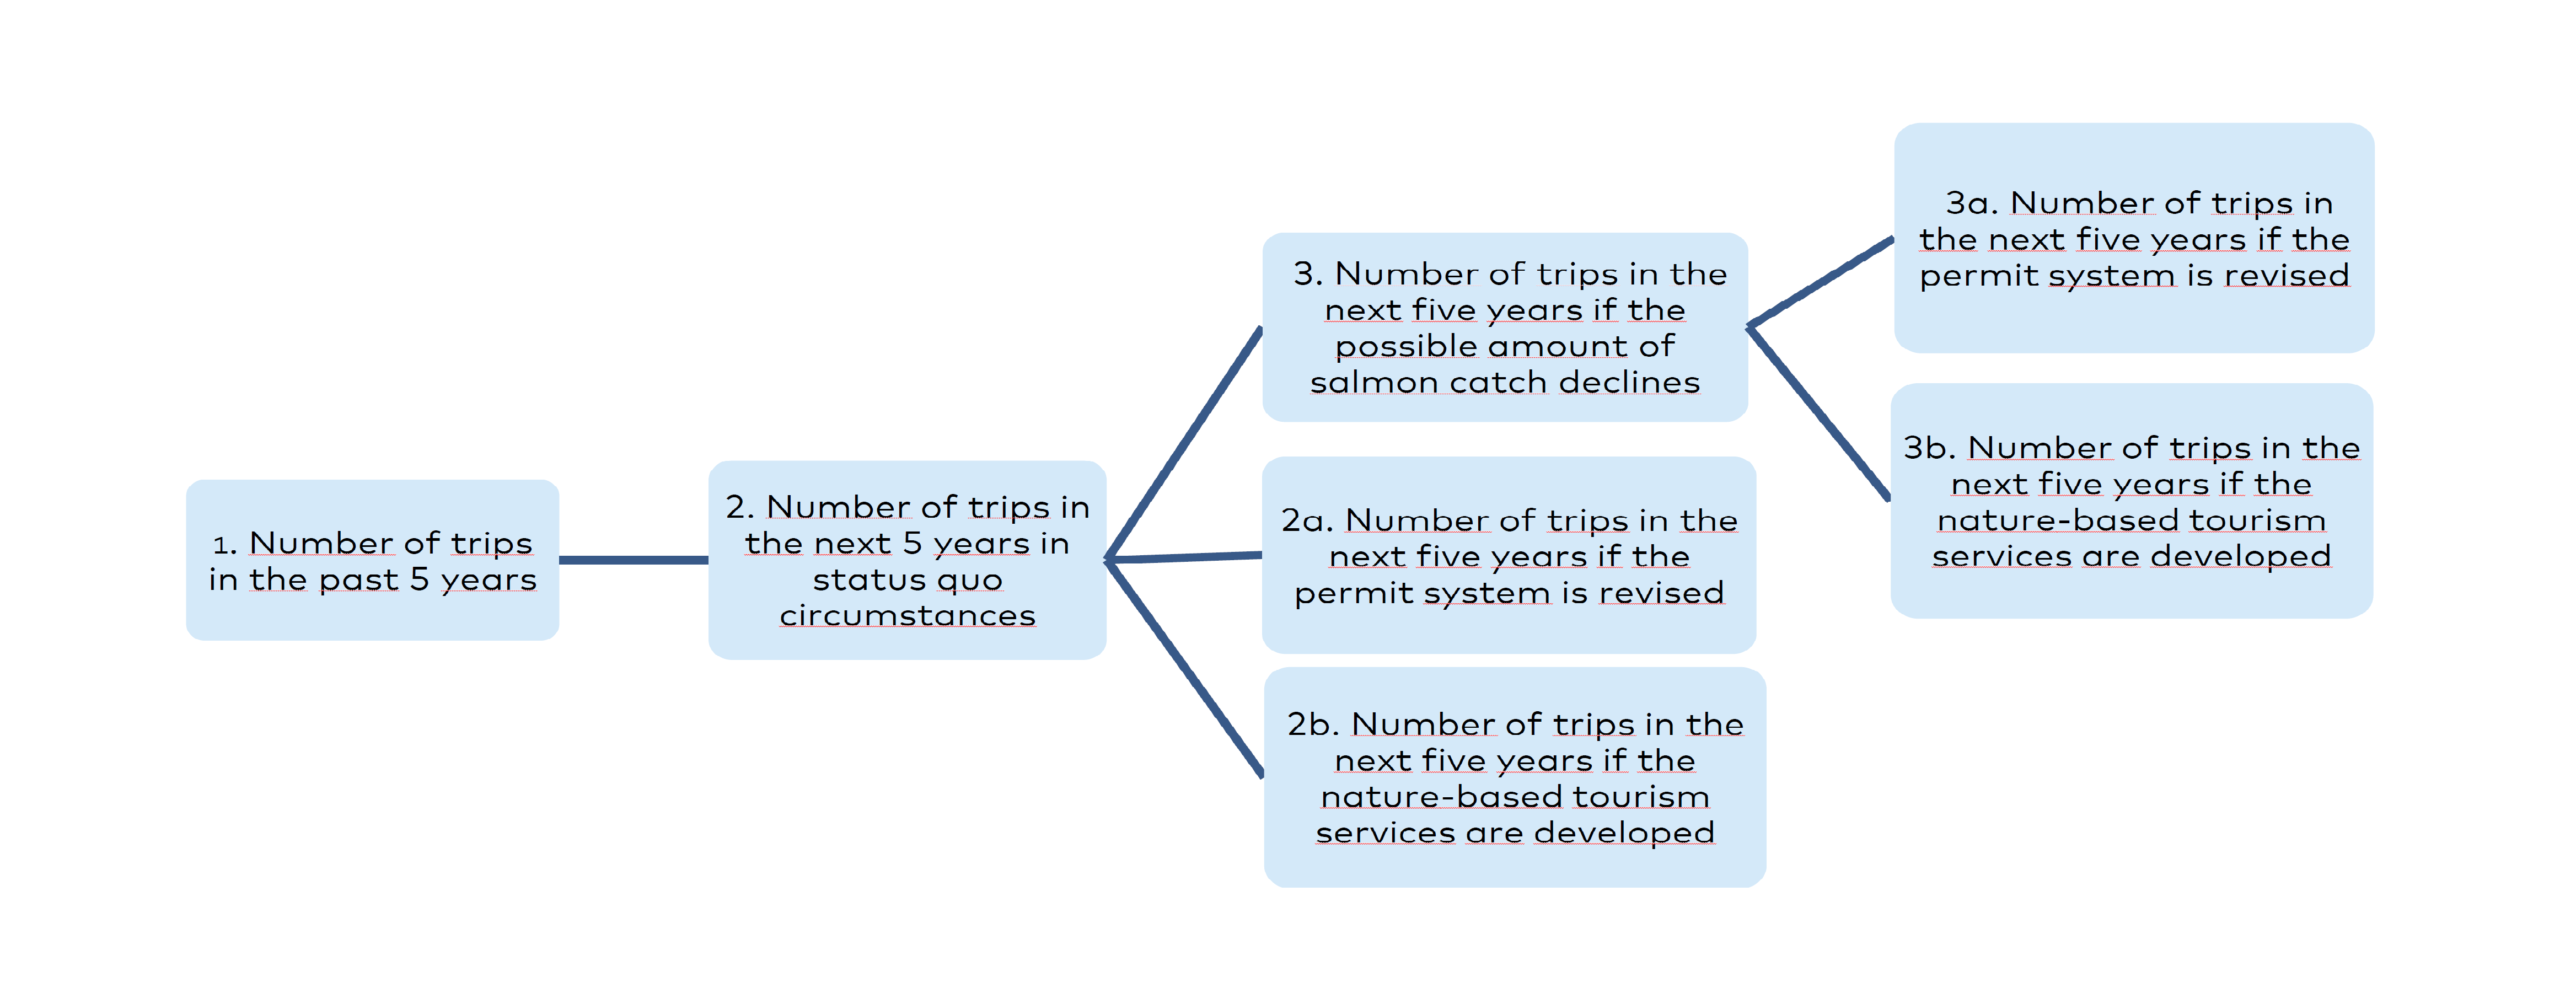
Figure 5 Structure of the contingent behaviour questions in the survey
Figure 5 illustrates the survey design for the TC-CB model. First, the whole sample was asked to report the number of fishing trips they made to Teno in the past five years (question 1 in Figure 5). After that the whole sample was asked how many Teno fishing trips they are expecting to make in the next five years if the services in the area, salmon population, fishing permit system and other relevant aspects remain as they were when the survey was conducted (question 2 in Figure 5). Next, half of the sample was asked to report the expected number of trips to Teno if the possible amount of salmon they could catch would decline to half of their current Teno catch (question 3 in Figure 5). Finally, the whole sample was asked to report the expected number of Teno fishing trips in the next five years if the permit system would be revised (questions 2a and 3a), and if the nature-based tourism services would be developed with special emphasis on tourists travelling with their families and children (questions 2b and 3b). For half of the sample these questions were linked to the scenario of a declined salmon catch (question 3a and 3b) and for half of the sample to the current circumstances of the area. This structure enabled us to study whether the impacts of the development of the nature-based tourism services and the permit system revision are influenced by the amount of possible salmon catch.
In the survey, the catch quota was defined as follows: The salmon catch per person would be limited to 1-2 salmon per season, and female salmon would have to be released in the later part of the season. At the same time anglers would be given more freedom to choose the angling time and location than under the current permit regime, but the total amount of fishing days available would remain at the current level.
The development of nature-based tourism was defined as follows: Hiking routes, guidance and rest places in the area would be developed. Also new services for tourists would be developed paying particular attention to the needs and enjoyment of anglers’ families, including nature and culture attractions, different kinds of courses, and guided day tours.
Fishing tourists’ preferences for the services and characteristics of the area
In the survey, fishing tourists’ preferences for the services and characteristics of the area were elicited by asking respondents to rate the perceived importance and performance of 22 different services and characteristics of the area selected based on previous studies and interviews with local experts and fishing tourism actors. The results of the ratings are presented in Lankia et al. (2022). To summarise the ratings into a smaller set of variables Lankia et al. (2022) used factor analysis for both performance and importance ratings. To study how the perceived importance of different services and characteristics affects the demand for trips to Teno, we use the importance factors from the study. Six factors describing the perceived importance of different services and other characteristics of the area were formed: Side attractions, fishing permits, environmental quality, basic services, fishing practices and fish catch.
3.4.4. Data and model specification
Travel cost model
In the travel cost model, the dependent variable is the total number of fishing trips to River Teno during the 2018 fishing season (Table 17). Two different trip demand models are presented. First, a trip demand model is estimated with the following explanatory variables: round trip travel costs including accommodation and cost of travel time (Combined travel costs), age of the respondent (Age), fishing in Norway (Norway, dummy), salmon catch in the latest fishing trip (Salmon, dummy), residency in Utsjoki (Local, dummy) and number of fishing days during the latest fishing trip to River Teno (Fishing days). In addition to the explanatory variables already presented, the second trip demand model includes the estimated factor scores on the ‘fishing permits’ factor and the ‘fishing practices’ factor found in Lankia et al. (2022).
| Variable | Variable definition |
| Dependent variable | |
| Fishing trips | Total number of fishing trips to River Teno during the 2018 fishing season |
| Explanatory variables | |
| Combined travel costs*) | Round trip travel costs in euros including driving, accommodation and cost of travel time |
| Age | Age of the respondent |
| Norway, dummy | 1, if the respondent had been fishing in Norway as well in the fishing season 2018, 0 otherwise |
| Salmon, dummy | 1, if the respondent got salmon catch in the latest fishing trip to River Teno, 0 otherwise |
| Local, dummy | 1, if the respondent comes from Utsjoki region or has a summer cottage there, 0 otherwise |
| Fishing days | Number of days spent in River Teno during the latest fishing trip in 2018 |
| Fishing permits factor | Factor score of the respondent on the factor measuring the importance of the fishing permit system for visitors. |
| Fishing practices factor | Factor score of the respondent on the factor measuring the importance of boat fishing practice for visitors. |
| *) Driving costs: reported round-trip kilometres*0.27 euro/km. Cost of travel time: 0.3333*round trip travel time (hours)*the respondent’s average hourly wage. | |
Table 17 Definitions of the variables used in the travel cost model
All six factors were tested in the TC model, but only two had a statistically significant impact on the number of trips. These were the fishing permits and fishing practices factors as presented in Table 17. The fishing permits factor measures the importance of the fishing permit system for visitors and includes the importance of the availability of fishing permits, the functionality of the fishing permit system, and the price of the fishing permits. The fishing practices factor measures the importance of fishing practices for fishing tourists and includes the importance of the following attributes: suitability for fishing from a boat, suitability for fly fishing, and fishing services such as guides and rowing services. The results of the factor analysis are reported in detail in Lankia et al. (2022).
The mean of fishing trips to River Teno for the demand model without factors is 1.39 with a standard deviation of 1.47, while the mean is 1.40 for the model with factors included and a standard deviation of 1.51 (Table 18). The descriptive statistics of the variables used in the basic travel cost models are presented in Table 18. The models have different N due to missing values in certain variables.
Since all respondents have taken at least one trip to the site, a zero truncated Possion model was used.[1]As number of trips only can take integer values greater than or equal to zero, travel cost models are commonly estimated with count data regression models, Poisson models, or a negative binomial model. The Poisson regression model can be used when the variance of the trip distribution equals its mean (Cameron and Trivedi, 1998). If the variance exceeds the mean so called overdispersion exists, and the negative binomial model is preferred (Haab and McConnell, 2002). Here the overdispersion parameter alpha was statistically insignificant, and therefore the Poisson model was used. The demand models for fishing trips were estimated using the NLOGIT software package (Greene, 2007).
Footnotes
- ^ As number of trips only can take integer values greater than or equal to zero, travel cost models are commonly estimated with count data regression models, Poisson models, or a negative binomial model. The Poisson regression model can be used when the variance of the trip distribution equals its mean (Cameron and Trivedi, 1998). If the variance exceeds the mean so called overdispersion exists, and the negative binomial model is preferred (Haab and McConnell, 2002). Here the overdispersion parameter alpha was statistically insignificant, and therefore the Poisson model was used.
| Poisson model, no factors included (n=842)a | Poisson model, factors included (n=796) | |||
| Variable | Mean | Std. dev. | Mean | Std. dev. |
| Dependent variable | ||||
| Fishing trips | 1.39 | 1.47 | 1.40 | 1.51 |
| Explanatory variables | ||||
| Combined travel costs*) | 801.16 | 335.27 | 799.68 | 337.69 |
| Age | 51.96 | 12.91 | 51.99 | 13.04 |
| Norway, dummy | 0.27 | 0.44 | 0.27 | 0.44 |
| Salmon, dummy | 0.55 | 0.50 | 0.55 | 0.50 |
| Local, dummy | 0.18 | 0.38 | 0.17 | 0.38 |
| Fishing days | 7.18 | 6.63 | 7.15 | 6.71 |
| Fishing permits factor | 0.03 | 0.90 | ||
| Fishing practices factor | -0.02 | 0.84 | ||
| a The number of observations in the models is smaller than in the data due to missing values in the data and the exclusion of erroneous observations from the estimation sample. The observations were limited to those with a one-way distance to Teno < 1401 km, number of trips < 200 and travel costs (including opportunity cost of time) < 10 000. | ||||
| *) Driving costs: reported round-trip kilometres*0.27 e/km. Cost of travel time: 0.3333*round trip travel time (hours)*the respondent’s average hourly wage. | ||||
Table 18 Descriptive statistics of the variables used in the travel cost models
Travel cost – contingent behaviour model
In the TC-CB model, the dependent variable is the total number of fishing trips to River Teno during five years (Table 19) in the past or in the future. Five years was chosen as the time period instead of one fishing season, because the effects of different scenarios on the trip frequency were assumed to be more visible in a period of five years than in one fishing season as a large share of the visitors visits the area only once a year. As the objective was to study how the selected future scenarios would impact the number of trips, each respondent has multiple observations for the dependent variable corresponding to the scenarios described above: the number of trips made in the past five years, the expected number of trips in the next five years in the status quo circumstances, the expected number of trips in the next five years if the possible amount of salmon catch declines, the expected number of trips in the next five years if the fishing permit system is revised and the expected number of trips in the next five years if the nature-based tourism opportunities are developed. Table 19 presents the summary statistics for the number of trips to Teno in the past five years and for the next five years under each of these scenarios. On average, respondents indicated that they are expecting to do fewer trips in the next five years (mean 4.96) than in the past five years (6.90). According to the survey responses, the development scenarios would further decrease the expected number of trips in the next five years. The greatest decline is seen in the scenario where the salmon catch declines and the nature-based tourism services are developed.
| Number of trips in the past or under different future scenarios | Mean | Std dev. | Number of observations |
| in the past 5 years (Question 1 in Figure 5) | 6.90 | 7.48 | 1,705 |
| in the next 5 years, status quo (SQ) circumstances (Question 2 in Figure 5) | 4.96 | 6.21 | 1,305 |
| in the next 5 years, revised permit system (Question 2a in Figure 5) | 4.77 | 4.77 | 628 |
| in the next 5 years, nature-based tourism development (Question 2b in Figure 5) | 4.58 | 5.25 | 601 |
| in the next 5 years, declined salmon catch (Question 3 in Figure 5) | 4.22 | 6.34 | 628 |
| in the next 5 years, declined salmon catch and revised permit system (Question 3a in Figure 5) | 4.92 | 5.00 | 626 |
| in the next 5 years, declined salmon catch and nature-based tourism development (Question 3b in Figure 5) | 3.93 | 4.35 | 617 |
Table 19 Descriptive statistics for the dependent variable trip frequencies in the fishing season 2018, in the past five years, in the next five years, and under the development scenarios
The impacts of the development scenarios on the number of trips are studied in the model with the following dummy variables: Trips future, Trips_revised_permit_system, Trips_nature_tourism, Trips_declined_catch, Trips_declined_catch_and_revised_permits, and Trips_declined_catch _and_nature_tourism. The Trips_future-dummy measures how many trips respondents are expecting to make in the next five years regardless of whether there will be any changes in the services and other characteristics or not. This variable accounts for the fact that respondents may plan to make more or fewer trips in the future than before, regardless of whether the conditions in the area change or not. In the model, this variable has the value of one for all the hypothetical future observations. Trips_revised_permit_system, Trips_nature_tourism, Trips_declined_catch, Trips_declined_catch_and_revised_permits, and Trips_declined_catch _and_nature_tourism are included to study whether the development scenarios would impact the number of expected future trips. For example, when the variables Trips_future and Trips_declined have the value of one, the model gives the expected number of visits in the next five years if the salmon catch declines. When Trips_future has the value one, and all the scenario dummies have the value zero, the model gives the number of visits in the next five years in the case where the services and other characteristics of the area remain as they were when the survey was conducted. When all the scenario dummy variables have the value of zero, the model gives the value of the number of trips in the past five years.
Other explanatory variables of the TC-CB model and their descriptive statistics are presented in Table 20.
| Variable | Mean | Std. dev. |
| Combined travel costs, EUR*) | 781.89 | 355.58 |
| Income, EUR/month/person | 3,941.45 | 2,230.80 |
| Age | 53.22 | 12.86 |
| Norway, dummy | 0.26 | 0.44 |
| Salmon, dummy | 0.53 | 0.50 |
| Local, dummy | 0.17 | 0.38 |
| Substitute site, dummy | 0.62 | 0.48 |
| Trips_future – TC | 598.00 | 454.47 |
| *) Includes: Driving costs: reported round-trip kilometres*0.27 e/km, Cost of travel time: 0.3333*round trip travel time (hours)*the respondent’s average hourly wage, and reported costs from accommodation on the way to Teno | ||
Table 20 Descriptive statistics of the explanatory variables used in the TC-CB model (n=931)
For the most part the explanatory variables in the TC-CB model are the same as in the TC model, yet two additional variables were added to the model. To control for the possibility that respondents might not take their budget constraint into account in the same way in hypothetical questions as when making real travel decisions, the interaction variable “Trips_future – TC” between Trips_future dummy and the travel cost variable TC was added to the model (defined as TC multiplied with Trips_future). It measures whether the travel cost variable affects the number of future trips differently than the number of trips actually made in the past. In addition, the variable substitute site was added to the model to study the possible impacts of the availability of substitute sites to Teno in the demand for the trips. It is a dummy variable that takes the value of one if a respondent reported that they would have gone fishing to some other destination if they had not visited Teno.
Combining data on the actual past behaviour and the hypothetical future behaviour in the same dataset generates a panel data set with multiple observations for each respondent. To take into account a possible correlation between them in the modelling, the random effects Poisson model was chosen as the econometric approach for the TC-CB model. It allows a positive correlation of the trip frequency observations of the same individual and accounts for potential overdispersion in the data (Whitehead et al., 2013). The model is commonly applied in TC-CB studies (e.g. Landry et al., 2012, Kipperberg et al., 2019).
3.4.5. Results
Model for past visits to River Teno (trip demand model)
Using basic travel cost modelling, two trip demand models are estimated, one with the factors ‘fishing permits’ and ‘fishing practices’ defined in Lankia et al., (2022) and one without these factors. In the trip demand model without factors included, all other explanatory variables selected for the model are statistically significant at the 1 percent significance level, but the constant is significant at the 10 percent level. The most important variable, the combined travel cost variable, has a negative and statistically significant coefficient at the 1 percent significance level in both models.
Age has a positive coefficient in both models; a higher age of the respondent indicates more fishing trips to River Teno. Furthermore, the positive coefficient of the Norway dummy suggests that River Teno and fishing in Norway are complements and that fishers visiting Norway are more frequent visitors in Teno than others. The positive coefficient for salmon implies that fishers that successfully caught salmon on their previous trip are likely to visit River Teno more than others. As expected, the local dummy has a positive coefficient that is statistically significant at the 1 percent level in both models; locals take more trips to River Teno than fishers travelling from far. This is in line with the general tendency in Finland, as the majority of the recreational fishers in Finland catch fish mainly in their residential province (Pokki et al., 2020b). The negative sign of the fishing days coefficient suggests that the longer the stay in River Teno during the latest fishing trip, the lower number of trips taken.
The fishing permit factor and the fishing practices factor are both statistically signi|ficant and have a positive sign in the second model. The larger the factor value, the more important the service group was considered by the respondent and a higher perceived importance of the services in question increases the number of visits.
| Poisson model, no factors included | Poisson model, factors included | |
| Constant | -0.4486* | -0.2481 |
| Combined travel costs | -0.0017*** | -0.0018*** |
| Age | 0.0127*** | 0.0102** |
| Norway, dummy | 0.5991*** | 0.5658*** |
| Salmon, dummy | 0.4865*** | 0.4226*** |
| Local, dummy | 1.0710*** | 1.0182*** |
| Fishing days | -0.0373*** | -0.0308*** |
| Fishing permits factor | 0.2822*** | |
| Fishing practices factor | 0.1863** | |
| n | 842 | 796 |
| Pseudo-R2 | 0.43 | 0.43 |
| Log L | -666.04 | -635.69 |
| Restricted Log L | -1,169.94 | -1,118.88 |
| Point estimate (CS), EUR per visit | 595.24 | 561.80 |
| Standard error (CS), EUR per visit | 57.20 | 60.65 |
| Standard error (CS), % | 9.61 | 10.80 |
Table 21 Estimated demand functions for recreational fishing trips per season
The consumer surplus per visit calculated based on the travel cost coefficient is 595 euros for the trip demand model without factors and 562 euros for the trip demand model including the factors. The total recreational use value for fishing in Teno is estimated by multiplying the consumer surplus per visit with the average number of trips and the number of visitors in Teno in 2018. The total recreational use value for salmon fishing in River Teno was 2.03–2.14 million euros in 2018 depending on the model.
Model for future visits to River Teno (TC-CB model)
The modelling results for the random effects Poisson model on the impacts of the future scenarios on the number of expected future trips to Teno are presented in Table 22. The dependent variable in the TC-CB model is the number of trips to Teno in five years. As the objective was to study how the selected future scenarios would impact the number of trips, each respondents have multiple observations for the dependent variable corresponding the scenarios described above: the number of trips in the past five years, the expected number of trips in the next five years in the status quo circumstances, the expected number of trips in the next five years if the possible amount of salmon catch declines, the expected number of trips in the next five years if the fishing permit system is revised and the expected number of trips in the next five years if the nature-based tourism opportunities are developed.
| Random effects Poisson model | |
| Constant | 1.6285*** |
| Combined travel costs | -0.0004*** |
| Age, years | 0.0056*** |
| Income, EUR | 0.00003*** |
| Norway, dummy | 0.1942*** |
| Salmon, dummy | 0.1421*** |
| Local, dummy | 0.7377*** |
| Substitute site, dummy | -1.1237*** |
| Trips Future, dummy | -0.4411*** |
| Trips declined catch, dummy | -0.1630*** |
| Trips revised permit system, dummy | -0.0103 |
| Trips nature tourism, dummy | -0.0696** |
| Trips declined catch and revised permits, dummy | 0.1518*** |
| Trips declined catch and nature tourism, dummy | 0.02465 |
| Trips future – TC | 0.0001*** |
| Alpha | 0.3334*** |
| Number of observations | 3,922 |
| Number of groups | 931 |
| Log L | -9,783.84 |
| **p<0.05 ***p>0.001 | |
Table 22 Estimated TC-CB model for the number of trips in the future
The statistically significant negative coefficient for the Trips future-dummy variable indicates that respondents are expecting to make fewer trips to Teno in the future than in the past five years regardless of whether there will be any changes in the services and other characteristics or not. To some extent, this can be explained by the fact that in 2017 changes were made to Teno's fishing permit system, which many Teno visitors were dissatisfied with (Lankia et al., 2022). The predicted values for the number of trips under different scenarios presented in Table 23 demonstrate the expected decrease in the number of trips: the predicted value for the number of trips in the past five years is 6.54 and the predicted value for the next five years in the status quo conditions is 4.66.
The statistically significant coefficient for the Trips declined catch-dummy indicates that the number of trips in the next five years would decrease from 4.66 trips to 3.96 trips if the possible amount of salmon catch would be about half of the amount caught during the 2018 fishing season.
In the scenario where the salmon catch would decline but changes would be made to the permits system in order to maintain the salmon stock (Trips declined catch and revised permits, dummy), the number of trips would be almost the same (4.61) as in the next five years in the status quo conditions (4.66). The statistically non-significant coefficient for the Trips revised permit system indicates that if the salmon catch stayed at the level of the fishing season of 2018, the revision of the fishing permit system would have no statistically significant impact on the number of trips.
The statistically significant and negative coefficient for the Trips nature tourism variable indicates that if the catch did not decline and the nature tourism services were to be developed, the number of trips would decrease to 4.34 per five years. Development of nature tourism services (Trips declined catch and nature tourism, dummy) did not have a statistically significant effect on the number of trips in the scenario where the salmon catch would decline.
The effects of the other explanatory variables are in line with the results of the travel cost model (Table 21). The travel costs have a negative and statistically significant effect on the number of trips indicating that the further away one lives from the Teno the fewer times one visits. The positive and statistically significant coefficient for the variable Trips future – TC indicates that the travel costs had a smaller effect on the hypothetical number of trips than on the actual number of trips taken in the past five years. Higher age and higher income increase the number of trips slightly. Respondents who also visited Norway for fishing during their most recent trip to Teno tend to visit Teno more often than others. Similarly, respondents who caught salmon during their most recent Teno trip, and who were born in the area or have a leisure home in the area take more trips to the area than others. The respondents reporting that they would have gone fishing to some other destination if they had not visited Teno tend to take fewer trips than others. The sociodemographic variables education, gender, and living environment (urban vs. rural) were not statistically significant, and were therefore not included in the final model.
| Expected number of trips under the CB-scenarios | |
| Number of trips in the past 5 years (Question 1 in Figure 5) | 6.54 |
| Number of trips in the next 5 years, status quo circumstances (Question 2 in Figure 5) | 4.66*** |
| Number of trips in the next 5 years, revised permit system (Question 2a in Figure 5) | 4.61 |
| Number of trips in the next 5 years, nature-based tourism development (Question 2b in Figure 5) | 4.34** |
| Number of trips in the next 5 years, declined salmon catch (Question 3 in Figure 5) | 3.96*** |
| Number of trips in the next 5 years, declined salmon catch and revised permit system (Question 3a in Figure 5) | 4.61*** |
| Number of trips in the next 5 years, declined salmon catch and nature-based tourism development (Question 3b in Figure 5) | 4.10 |
| ** p-value of the regression coefficient in the model is<0.05 *** p-value of the regression coefficient in the model is < 0.01 | |
Table 23 Predicted number of trips under each scenario
3.4.6. Discussion and take-home message
Traditionally, River Teno has been seen as an attractive fishing destination for tourists, and the most visited salmon fishing destination in Finland. Fisheries management in Teno faces difficult decisions for the future of the salmon fishery; how to allow tourist anglers to enjoy the recreational benefit from fishing, the locals to receive income from fishing tourism, and the indigenous Sámi people to continue their cultural heritage of fishing in River Teno, all at the same time. In addition, this needs to be done sustainably, together with Norway, conserving the multiple diverse salmon populations in the Teno system (Vähä et al., 2017). Contradicting views of different actors on how the Teno salmon stock should be managed creates management tensions (Hiedanpää et al., 2020).
The current state of the Atlantic salmon stock in River Teno is worrying. The number of spawning salmon in various populations of the Teno tributaries have declined drastically, and the invasive species pink salmon is increasing in numbers. Fishing of salmon has been prohibited during the 2021, 2022, and 2023 seasons to revive the salmon populations and it has had a drastic impact on the local economy of Utsjoki, which is largely depending on the income from fishing tourism over the summer periods. Many of the local entrepreneurs had to close down their businesses, direct their services to other types of customers, or change sector (Abernethy et al., 2022).
The results of the study emphasise the importance of the salmon stock in attracting fishing tourists to Teno as the amount of salmon caught on the most recent Teno trip had a positive effect on both the number of trips made to Teno in the past and the number of trips planned in the future. In addition, the reduction in salmon catch to half of the 2018 season catch would reduce the number of trips in the future. The importance of a sustainable salmon stock management is emphasised by the fact that tourists lose approximately 2 million euros of recreational benefits each year as long as the salmon population will be in such a weak state that fishing has to be prohibited. Accordingly, the absence of fishing tourists impacts the regional economy of Utsjoki municipality substantially; 4.1 million euros of income is lost annually from the regional economy, when accounting for the multiplier effect (Knuuttila, et al., 2020).
The importance of salmon to tourist anglers’ Teno experience is also reflected in the appreciation of the fishing services. The tourists for whom fishing services were particularly important made more trips to Teno than others in the 2018 season. The services for fishing tourists could be further developed by combining accommodation and fishing services in the same places instead of the tourist having to seek services from several service providers (Saaristoasiain neuvottelukunta, O. C., 2017). Fishing tourists also appreciate well-functioning fishing permit practices. The more important the fishing permit practices were to a fishing tourist, the more often they visited Teno. Naturally, the relationship can also be the other way around, the fishing permit matters may be particularly important for those who visit Teno frequently.
4. Discussion
Tourism is one of the world’s major economic sectors. It is the third largest export category, after fuels and chemicals. In 2019 it accounted for 7 percent of global trade (https://www.unwto.org/about-us). The sector was severely hit by the COVID pandemic, but already in the first half of 2022 international tourism reached almost 60 percent of pre-pandemic levels, and it is expected that the sector will grow the next years, and thus be of great importance for the economy and job creation in many countries (https://www.unwto.org/unwto-world-tourism-barometer-data). Destinations worldwide largely compete for the same tourists, and it is of crucial importance to offer popular attractions and activities. In this regard, the global tourism market is divided into a number of segments. There is cultural tourism, where visiting world heritage sites and other famous ancient sites is the main attraction. Then there is tourism directed towards physical activities like climbing, running, and hiking. The probably largest segment is charter tours to destinations with warm and sunny climate and good opportunities for swimming and sunbathing.
In this report, focus is on tourist destinations in the Nordic countries that attract visitors by offering some kind of fishing related activities. This could be either destinations providing recreational fishing opportunities or coastal villages with a genuine fishing atmosphere provided by commercial fisheries. The report contains case studies from Sweden, Denmark, Norway and Finland. Below, we discuss the results from the case studies in a wider context starting with recreational fisheries. The results are discussed in relation to relevant literature as well as to inputs from the workshop Tourism and fisheries[1]The workshop was held as part of the dissemination of the case study results in Copenhagen on November 10-11 2022. where the case studies have been discussed with relevant stakeholders and scientists.
With millions of both Nordic and non-Nordic citizens involved in recreational fishing, the development of fishing tourist destinations has a great potential of generating income for local communities. Recreational fishing opportunities are commonly located in rural areas and the recreational fishing industry thus has the potential to generate economic activity outside the major urban areas. Attracting recreational fishers to these areas might, however, be challenging. Hunt et al. (2019) have synthesised the scientific literature on what determines recreational fishers’ destination choices and found travelling costs to be a major determinant. Many parts of the Nordic counties with great recreational fishing sites might thus deter tourists from visiting due to long and expensive travelling. On the other hand, this might be compensated by good catch opportunities, high quality of supporting facilities (boats, hotels, etc.), and high environmental quality (Hunt, et al., 2019). For Nordic countries to be competitive in recreational fisheries tourism, it is important to gather information about what attributes are important for tourists considering visiting the region and develop the local sites accordingly.
Here, we use the Finnish River Teno fishery for salmon and the Norwegian cod fishery at Lofoten as case studies on how recreational fishing destinations can be developed. The River Teno fishery primarily attracts highly specialised fishers willing to travel long distances to fish in pristine nature with the possibility to catch large salmon. One of the results from the study is that reduced catches would have a significantly negative effect on the number of visits, thus showing (in accordance with Hunt et al., 2019) that catches are important for attracting tourists. Fishing tourists in River Teno are not particularly interested in other nature tourism services. Rather, development of new services outside fishing might even reduce the number of trips. The visitors at Lofoten, on the other hand, highly value attributes outside the recreational fishing services. Recreational catches even seem to be negatively valued by the Lofoten tourists. Notably, the tourists in the case study are to a large extent not primarily recreational fishers themselves, so they do not get a major personal utility from recreational catches. Rather, they value the possibility to visit local seafood markets and festivals. The results from the Finnish and Norwegian cases highlight the role of site-specific development for utilising the attributes where the site is competitive. Recreational fishing tourists differ in their preferences as also shown by e.g. Bonnichsen et al. (2019) who identify three groups of trout angling tourists in Denmark - catch oriented, nature oriented, and trophy oriented – each having different views on what properties an attractive fishing site have. Tourism destination managers need to have information on what kind of fishers they can attract in order to be able to develop the destination accordingly.
The combination of different characteristics for attracting tourists was discussed in the Tourism and fisheries workshop where the need for “ready packages” containing several services making the destination easily available was discussed. For attracting non-Nordic fishers, the accessibility, price, and information on food, accommodation etc. are important. This might be even more important for attracting new fishers as well as other categories of fishers such as families with children. These groups might not be equally attracted by catching large fish or visiting pristine nature, but also wants other attributes such as shorter fishing trips with high probabilities of catch, restaurants, swimming possibilities, etc. Ideas for improving the industry were e.g. to improve the quality of the stay rather than the number of tourists. Collaboration with local businesses outside the fishing industry, such as local restaurants and hotels, is often appreciated by tourists looking for a “genuine” experience. This also creates local employment opportunities.
A topic of interest from a Nordic perspective is the possible competition/collaboration between the countries. There is a competition for the river and lake fishers between Finland, Sweden, Norway and Denmark (Saaristoasiain neuvottelukunta, O. C., 2017). The Nordic countries all have great potential for developing the fishing tourism business as they have many and diverse water bodies with clean water and in many cases comparatively simple fishing permit systems allowing easy access to fishing. Using Finland as an example, there are many professional fishing guides and high-quality fishing equipment offered around the country, but most of the businesses are small and they are not networking sufficiently with the companies offering accommodation, which slows down the internationalisation of the industry (Saaristoasiain neuvottelukunta, O. C., 2017). The Ministry of Agriculture and Forestry of Finland is currently renewing the action program for fishing tourism to attract more foreigners to visit Finnish fishing destinations and seeking new attractive fishing products for domestic fishing tourists (Ministry of Agriculture and Forestry of Finland, 2008). Also the other Nordic countries have development plans for their tourism industries, where e.g. the Swedish plan for the development of recreational fishing tourism states that recreational fishing should contribute to the attractiveness of Sweden as a tourism destination (Swedish Agency for Marina and Water Management and Swedish Board of Agriculture, 2021b, page 27). If Nordic countries are to attract more tourists from other parts of the world, knowledge of which destination attributes are important in the different countries might be important. Pristine nature and clear waters might be attractive for some fishers and suit some countries, regions and destinations, while proximity to airports and restaurants might be important for other tourists and could be developed by other fishing sites.
Turning to commercial fisheries, the question is if commercial fisheries have a positive external effect on the tourism sector – that is if they provide a value by keeping local fishing communities genuine and charming in a way that attracts tourists but does not contribute to economic gains for the fishers. If this is the case, there is a risk of vessels leaving the harbours or selling their quotas if that increases the economic return to the individual fisher. A first issue for the analysis is thus whether there is a risk of tourist harbours having a too low fishing activity or not. If not, there is no need to consider management actions supporting fishers to stay in the harbour since there is enough fishing activity anyway. For example, in the Norwegian case of Lofoten, there is clearly not a lack of commercial fishing vessels. However, Waldo and Blomquist (2020) show that in Sweden, 23 out of 68 coastal municipalities with fisheries had less than five active vessels in 2017 and many of these were not used at a commercially viable scale. Thus, many fishing communities face the risk of losing their last fishing vessel, which might affect not only the fishing industry but also the general attractiveness of the harbour for visitors. In Denmark, 29 out of the 62 postal code areas included in the estimations had five or fewer active fishing vessels (2021). Moreover, the share of the landing value in the five largest harbours of the total landing value in Denmark of all vessels increased from 86 percent in 2013 to 91 percent in 2021. Thus, if fisheries are important for attracting tourists in Sweden and Denmark, there is a risk that too many vessels leave the harbours if the issue is not addressed by fisheries management.
The Swedish case study does not find enough evidence for claiming that commercial fishing affects tourism measured as restaurant turnover in local harbours. This is in accordance with the results found in Andersson et al. (2021) who do not find fisheries to influence the number of overnight stays in Swedish coastal communities. Notably, both the Swedish case study and Andersson et al. (2021) find that areas with a lot of fishing activity also have a lot of tourism – especially on the Swedish west coast – but cannot prove a causal relationship that fisheries attract tourists. The positive relationship found could be due to unobserved factors such as both fisheries and tourism benefitting from areas with a healthy sea and vast archipelagos. In the Danish case study on the other hand, a significant positive relationship is found; more fishing vessels cause more overnight stays. The positive effect is found both for vessels situated in the harbour and for vessels that land in the harbour (but not for landed quantity). The results from the Swedish and Danish cases indicate that fisheries at least to some extent attract tourists and that this might be more profound in regions where fisheries are important for the local cultural heritage (also supported by the importance of fisheries in the Norwegian case of Lofoten). This provides fisheries managers with a case for supporting fisheries in harbours that otherwise might lose too many vessels. Several options to support local fishing industries are available. Examples are regional quotas, which can only be used by fishers active in specific regions. These quotas are commonly combined with obligations to land catches in the region. Further, subsidies can be provided for vulnerable vessel segments, e.g. within the European Maritime and Fisheries Fund, where small-scale vessels below 12 meters are eligible to higher levels of support (EU, 2014b). The small-scale fleet constitutes the major part of the Nordic fishing fleets as measured in the number of vessels and it is the small-scale fleets that to a large extent are visible in the harbours. These vessels are already prioritised in the EU Common Fisheries Policy (CFP; EU, 2013) as well as in Norway (Office of the Auditor General of Norway, 2019–2020), and in this sense, the external effects are taken into account in the policy.
Both commercial and recreational fisheries are important for the tourism industry as shown above, and many coastal communities combine the two in the same tourist destination. This is common in all Nordic countries and represented by the Norwegian region Lofoten in the report. In the Norwegian case study, it is emphasised that other attributes than recreational catches (such as local fish markets) are important for the visitors. This does not say that recreational and commercial fisheries cannot co-exist in the local harbours, but provides interesting tourism development perspectives to the destination. This relates to the discussion above on what attributes are important for attracting tourists and what are the competitive advantages of the specific site. Comparing River Teno with Lofoten, they are both located in remote areas and provide high-quality fishing opportunities. However, the tourists in the two case studies differ considerably in what attributes they prefer from the destination.
In the scientific literature, the consumers’ values from recreational fishing attributes are frequently estimated as discussed above which provides insights into how to develop sites to fit different tourists. This is not the case for tourism attributes provided by commercial fisheries. An exception for Nordic fisheries is Waldo et al. (2020) who find that fisheries are highly important for some tourists, but not for others. Those valuing fishing attributes highly are older and tend to stay for a longer time in the village (e.g. in the camping or a summerhouse). Those with a low valuation of the fishing attributes are younger and visit over the day (e.g. for surfing or eating at the famous local ice-cream café). Interviews with tourist entrepreneurs and managers in Träslövsläge reveal that they view the fishing heritage as important but that additional attributes are necessary. Such attributes could be e.g. restaurants, souvenir shops, etc. that provide tourists with something to do while enjoying the harbour. In the Tourism and fisheries workshop, synergies between fisheries and coastal tourism were discussed. Examples were the possibility for tourists to buy seafood at the dockside and the creation of fisheries museums that attract tourists. However, it was also discussed that even if fisheries contribute to a living harbour it also creates noise and might smell (which are negative external effects). This might generate conflicts with other activities and e.g. leisure boats are also important for many harbours and provide attractive marinas for tourists. However, keeping at least one fishing vessel in the harbour was put forward as an important topic in the Tourism and fisheries workshop.
A way forward to facilitate the synergies between commercial fisheries and tourism is to develop companies that are involved in both. If fishers could be compensated for their contribution to the local tourism industry, they might stay in the local harbour without any governmental intervention. One possibility is that tourist companies compensate fishers economically for the value, but this could be hard to achieve in practice. An alternative would be different kinds of diversification strategies where e.g. fishers diversify into tourism by opening fish restaurants, etc. For EU countries, funding for diversification is available in the European Maritime, Fisheries, and Aquaculture Fund (EU, 2021). On the other hand, existing tourist companies often cannot go into fisheries due to license and quota ownership regulations. In theory though, a possible solution would be for local restaurants and other tourism operators to own quotas and fishing vessels in order to get the maximum joint benefit from the fishing and restaurant activities. If it is not possible for the industry to find solutions, management might intervene.
In summary, the Nordic countries all have the potential to develop tourism based on both recreational and commercial fisheries. The results clearly show that each destination could be developed uniquely dependent on specific site characteristics and the demand from different tourist groups. Some tourists want pristine nature and high recreational catches, while others might favour developed services and a local commercial fishing culture. The Nordic countries might be able to attract more tourists by adapting tourist destinations to the respective countries’ competitive advantages where for example the role of pristine nature, high recreational catch rates, closeness to major travel hubs, etc. might play important roles in the future development.
Footnotes
- ^ The workshop was held as part of the dissemination of the case study results in Copenhagen on November 10-11 2022.
References
Aanesen, M., Falk-Andersson, J., Vondolia, G.K., Borch, T., Navrud, S. and Tinch, D. (2018). Valuing coastal recreation and the visual intrusion from commercial activities in Arctic Norway. Ocean and coastal management, 153, 157-167.
Abernethy, P., Saijets, J., Jokinen, M., Knuuttila M. and Hiedanpää, J. (2022). Tenojoen lohenkalastuskiellon yhteiskunnalliset vaikutukset ja niiden seuranta. Luonnonvara- ja biotalouden tutkimus 103/2022. Luonnonvarakeskus. Helsinki. 76 s.
Andersson, A., Blomquist, J. and Waldo, S. (2021). Local Fisheries and Thriving Harbors: Is There a Value for the Tourism Sector? Marine Resource Economics, 36(2), 111-131.
Anon (2012). Status of the River Tana salmon Populations. Report 1-2012, Working Group on Salmon Monitoring and Research in the Tana River System. Retrieved from http://mmm.fi/documents/1410837/1801192/Tenojoen_lohikantojen_tila__Status_of_the_Rive_Tana_Salmon_Population.pdf/dc7b2918-39a3-4ae1-a6f3-26dccfe2df72
Arellano, M. (1987). Computing Robust Standard Errors for Within-Groups Estimators. Oxford Bulletin of Economics and Statistics, 49, 431-434.
Arlinghaus, R., Aas, Ø., Alos, J., Arismendi, I., Bower, S., Cale, S., Czarkowski, T., Freire, K.M.F., Hu, J., Hunt, L.M., Lyach, R., Kapusta, A., Salmi, P., Schwab, A, TSuboi, J-I., Trella, M., McPhee, D., Potts, W., Wolos, A. and Yang Z-J. (2021). Global participation in and public attitudes toward recreational fishing: International perspectives and developments. Reviews in Fisheries Science & Aquaculture, 29(1), 58-95.
Bergenius, M., Ringdahl, K., Sundelöf, A., Carlshamre, S., Wennhage, H. and Valentinsson, D. (2018). Atlas över svenskt kust- och havsfiske 2003-2015. Aqua reports 2018:3, Institutionen för akvatiska resurser, Swedish University of Agricultural Sciences.
Birdsong, M., Hunt L.M., and Arlinghaus, R. (2021). Recreational angler satisfaction: What drives it? Fish and Fisheries, 22(4), 682-706.
Bonnichsen, O., Jensen, C.L. and Olsen, S. B. (2016). An empirical investigation of German tourist anglers' preferences for angling in Denmark. IFRO Working Paper, No. 2016/10, University of Copenhagen, Department of Food and Resource Economics (IFRO), Copenhagen.
Bonnichsen, O., Jensen, C.L. and Olsen, S.B. (2019). Fishing for more tourists – An empirical investigation of tourist anglers’ preferences for angling site quality. Marine Policy, 106. Retrieved from https://doi.org/10.1016/j.marpol.2019.103532
Borch, T. (2009a). Marine fishing tourism in Norway. Nordic Tourism, in Hall, C.M., Müller, D.K. and Saarinen, J. (eds.), Issues and Cases, Bristol: Channelview Publications.
Borch, T. (2009b). Contested coastal commercialisation: Marine Fishing Tourism in Norway. MAST Marine Studies, 8(1), 33-51.
Borch, T., Moilanen, M. and Olsen, F. (2011). Marine fishing tourism in Norway: Structure and economic effects. Økonomisk fiskeriforskning (Economic fisheries research), 21(1), 1-17.
Cameron, C. and Trivedi, P. (1998). Regression Analysis of Count Data. Econometric Society Monographs No 30, Cambridge: Cambridge University Press.
Carlén, O., Bostedt, G., Brännlund, R. and Persson, L. (2021). The value of recreational fishing in Sweden – Estimates based on a nationwide survey. Fisheries Management and Ecology, 28, 351–361. DOI: 10.1111/fme.12484.
Claesson, S., Robertson, R.A. and Hall-Arber, M. (2005). Fishing heritage festivals, tourism, and community development in the Gulf of Maine. In Peden, J.G., Schuster, R.M. (eds.), Proceedings of the 2005 Northeastern Recreation Research Symposium; 2005 April 10-12, Bolton Landing, NY. Gen. Tech. Rep. NE-341. Newtown Square, PA: U.S. Forest Service, Northeastern Research Station.
Cooke, S.J. and Cowx, J.G. (2004). The role of recreational fishing in global fish crises. BioScience, 54(9), 857-859.
Cooke, S.J. and Cowx, J.G. (2006). Contrasting recreational and commercial fishing: Searching for common issues to promote unified conservation of fisheries resources and aquatic environments. Biological Conservation, 128(1), 93-108.
Cooke, S.J., Twardek, W.M., Lennox, R.J., Zolderdo, A.J., Bower, S.D., Gutowsky, L.F.G., Danylchuk, A.J., Arlinghaus, R. and Beard, D. (2017). The nexus of fun and nutrition: Recreational fishing is also about food. Fish and Fisheries, 19(2), 201-224.
Czajkowski, M., and Budziński, W. (2019). Simulation error in maximum likelihood estimation of discrete choice models. Journal of choice modelling, 31, 73-85.
Durán, R., Farizo, B.A., and Vásquez, M.X. (2015). Conservation of maritime cultural heritage: A discrete choice experiment in a European Atlantic Region. Marine Policy, 51, 356-365.
EU (2013). Common fisheries policy, Regulation (EU) No 1380/2013 of the European Parliament and of the Council of 11 December 2013.
EU (2014a). A European Strategy for more Growth and Jobs in Coastal and Maritime Tourism. COM(2014) 86 final. Brussels, 20.2.2014.
EU (2014b). European Maritime and Fisheries Fund, Regulation (EU) No 508/2014 of the European Parliament and of the Council of 15 May 2014.
EU (2021). Establishing the European Maritime, Fisheries and Aquaculture Fund, Regulation (EU) No 2021/1139 of the European Parliament and of the Council of 7 July 2021.
EU Fleet Register. https://webgate.ec.europa.eu/fleet-europa/index_en
Finnish Government (2021). Valtioneuvoston asetuslohenkalastuksen määräaikaisesta kieltämisestä Tenojoen vesistössä vuonna 2021 [Government Decree on a temporary ban on salmon fishing in the Tana/Teno River system in 2021, 2021], Asetus 359/2021. Retrieved from https://finlex.fi/fi/laki/alkup/2021/20210359
Garrod, G. and Willis, K. G. (1999). Economic Valuation of the Environment – Methods and Case Studies. USA: Edward Elgar Publishing.
Greene, W. H. (2007). LIMDEP Version 9.0 Reference Guide. Econometric Software.
Grønvik, J. and Erraia, J. (2022). Ringvirkninger av havfisketurisme I Norge. report no 21/2022, Menon Economics.
Haab, T.C and McConnell, K.E. (2002). Valuing environmental and natural resources. Cheltenham: Edward Elgar.
Hall, M. (2021). Tourism and fishing. Scandinavian Journal of Hospitality and Tourism 21(4), 361-373.
Hiedanpää, J., Saijets, J., Jounela, P., Jokinen, M. and Sarkki, S. (2020). Beliefs in Conflict: The Management of Teno Atlantic Salmon in the Sámi Homeland in Finland. Environmental Management 66, 1039–1058. Retrieved from https://doi.org/10.1007/s00267-020-01374-6
Hotelling, C. R. (1949). Letter to National Park Service. In An economic study of the monetary evaluation of recreation in the National Parks, U.S. Department of the Interior, National Park Service and Recreational Planning Division, Washington DC.
Hunt, L., Camp, E., van Poorten, B. and Arlinghaus, R. (2019). Catch and Non-catch-related Determinants of Where Anglers Fish: A Review of Three Decades of Site Choice Research in Recreational Fisheries. Reviews in Fisheries Science & Aquaculture, 27(3), 261-286. DOI: 10.1080/23308249.2019.1583166
Hyder, K., Radford, Z., Prellezo, R., Weltersbach, M. S., Lewin, W-C., Zarauz, L., Ferter, K., Ruiz, .J, Townhill, B., Mugerza, E. and Strehlow, H.V. (2017). Research for PECH Committee – Marine recreational and semi-subsistence fishing - its value and its impact on fish stocks. European Parliament, Policy Department for Structural and Cohesion Policies, Brussels.
Johnston, R.J., Ranson, M.H., Besedin, E.Y. and Helm, E.C. (2006). What determines willingness to pay per fish? A meta-analysis of recreational fishing values. Marine Resource Economics, 21(1), 1-32.
Kauppila, P. and Karjalainen, T.P. (2012). A process model to assess the regional economic impacts of fishing tourism: A case study in northern Finland. Fisheries Research, 127-128, 88-97.
Khakzad, S. (2018). Promoting coastal communities through cultural tourism: the case of fishing communities in Brunswick County, North Carolina. Journal of Heritage Tourism, 13(5), 455-471.
Kipperberg, G., Onozaka, Y., Bui, L.T., Lohaugen, M., Refsdal, G. and Sæland, S. (2019). The impact of wind turbines on local recreation: Evidence from two travel cost method – contingent behavior studies. Journal of Outdoor Recreation and Tourism, 25, 66-75.
Knuuttila, M., Lankia, T., Länsman, M., Pouta, E. and Venesjärvi, R. (2020). Tenojoen lohen aluetaloudelliset vaikutukset ja kalastusmatkailun kehittäminen. Luonnonvara- ja biotalouden tutkimus 85/2020.
Kvarnbäck, M., and Johansson, M. (2013). Småskaligt kustnära fiske i Bohuslän – en intervjustudie. Fiskeområde Bohuslän.
Laki lohenkalastuksen määräaikaisesta kieltämisestä Tenojoen vesistössä 409/2022. Given in Naantali and Helsinki 10.6.2022. Retrieved from https://www.finlex.fi/fi/laki/smur/2022/20220409.
Lam-González, Y.E., Leon. C.J., Gonzalez Hernandez, M.M. and de Leon, J. (2021). The structural relationships of destination image, satisfaction, expenditure and loyalty in the context of fishing tourism. Scandinavian Journal of Hospitality and Tourism, 21(4), 422-441.
Lancaster, K. J. (1966). A new approach to consumer theory. Journal of Political Economy, 74(2),132–157.
Landbrug- og Fiskeristyrelsen (2017). Fiskeristatistisk årsbog 2016. Miljø- og Fødevareministeriet, December 2017.
Landry, C.E., Allen, T., Cherry, T. and Whitehead, J.C. (2012). Wind turbines and coastal recreation demand. Resource and Energy Economics 34, 93-111.
Lankia, T., Venesjärvi, R. and Pouta, E. (2022). Importance-performance analysis of the fishing tourism service structure: Recreational anglers’ preferences on the remote salmon river of Teno in Finland. Fisheries Research, 254, 106425.
Li, G., H. Song, and Witt, S. (2005). Recent Developments in Econometric Modelling and Forecasting. Journal of Travel Research, 44, 82–99.
McFadden, D. (1973). Conditional logit analysis of qualitative choice behavior. In Zarembka, P. (ed.), Frontiers in Econometrics. New York: Academic Press, 105–142.
Ministry of Agriculture and Forestry of Finland (2008). Kalastusmatkailun kehittämisen valtakunnallinen toimenpideohjelma 2008-2013. Helsinki: Ministry of Agriculture and Forestry of Finland.
Morales-Nin, B., Cardona-Pons, F., Maynou, F., and Grau, A. M. (2015). How relevant are recreational fisheries? Motivation and activity of resident and tourist anglers in Majorca, Fisheries Research, 164, 45-49.
Nielsen, M. and Nielsen, R. (2022). Udviklingen i dansk kystfiskeri 2018-2021. IFRO Udredning Nr. 2022/22. Retrieved from https://ifro.ku.dk/medarbejdere/?pure=da%2Fpublications%2Fudviklingen-i-danskkystfiskeri-20182021(af5e1824-fb73-4674-b614-9b208f4a0653).html.
Nordic Council of Ministers (2019). Plan for Nordic Tourism Co-operation 2019-2023. PolitikNord 2019:727.
OECD (2020). OECD Tourism Trends and Policies 2020. Organization for Economic Co-operation and Development, Paris: OECD Publishing.
Office of the Auditor General of Norway (2019-2020), Riksrevisjonens undersøkelse av kvotesystemet i kyst- og havfisket. Dokument 3:6. Retrieved from kvotesystemet_i_kyst_og_havfisket.pdf (riksrevisjonen.no).
Official Statistics of Finland (OSF) (2022). Recreational fishing 2020. Natural Resources Institute Finland. Retrieved from https://stat.luke.fi/en/recreational-fishing.
Parsons, G. R. (2003). The Travel Cost Model, Chapter 9. In a Primer for Nonmarket Valuation, Champ, P. A., Boyle, K. J. and Brown, T. C. (eds.), Netherlands: Springer.
Pokki, H., Artell, J., Mikkola, J., Orell, P. and Ovaskainen, V. (2018). Valuing recreational salmon fishing at a remote site in Finland: A travel cost analysis. Fisheries Research 208, 145–156. Retrieved from https://doi.org/10. 1016/j.fishres.2018.07.013.
Pokki, H., Jacobsen, J. B., Olsen, S. B. and Romakkaniemi, A. (2020a). Understanding angler profiles in cases of heterogeneous count data – A travel cost model. Fisheries Research, 221, 105377. Retrieved from https://doi.org/10.1016/j.fishres.2019.105377.
Pokki, H., Pellikka, J., Eskelinen, P. and Moilanen, P. (2020b). Regional fishing site preferences of subgroups of Finnish recreational fishers. Scandinavian Journal of Hospitality and Tourism.
Ropars-Collet, C., Leplat, M. and Le Goffe, P. (2017). Commercial fisheries as an asset for recreational demand on the coast: evidence from a choice experiment. Marine Resource Economics, 32(4), 391-409.
Saaristoasiain neuvottelukunta, O. C. (2017). Suomen saaristo- ja vesistömatkailusta eurooppalainen vetovoimatekijä Saaristo- ja vesistömatkailun selvityshankkeen loppuraportti. Helsinki: Ministry of Agriculture and Forestry.
Scheufele, G. and Pascoe, S. (2022). Estimation and use of recreational fishing values in management decisions. Ambio 51, 1275-1286.
Song, H., Dwyer, L., Li, G. and Cao, G. (2012). Tourism Economics Research: A Review and Assessment. Annals of Tourism Research, 39 (3), 1653–82.
Song, H. and Li, G. (2008). Tourism Demand Modelling and Forecasting: A Review of Recent Research. Tourism Management, 29, 203–20.
Statistics Denmark (2022a). Statistics on work places, jobs, fulltime employment and salary after unit and time. Retrieved from https://www.statistikbank.dk/statbank5a/default.asp?w=2560.
Statistics Denmark (2022b). Landings in Denmark by region, harbor, unit and type of fish. Retrieved from https://www.statistikbank.dk/statbank5a/default.asp?w=2560.
Statistics Denmark (2022c). General firm statistics after time, branch and unit. Retrieved from https://www.statistikbank.dk/statbank5a/default.asp?w=2560.
Statistics Denmark (2022d). Work places, jobs, fulltime employment and salary after branch and unit. Retrieved from https://www.statistikbank.dk/statbank5a/default.asp?w=2560.
Statistics Denmark (2022e). Overnight stays after form, area, nationality of the guest and period. Retrieved from https://www.statistikbank.dk/statbank5a/default.asp?w=2560.
Statistics Norway (2021). Levekårsundersøkelsen EU-SILC 2021. Documentation, Statistics Norway report 2021/46.
Statistics Sweden (2022). Recreational fishing in 2021. Report JO 57 SM 2201.
STECF (2021). The 2021 Annual Economic Report on the EU Fishing Fleet (STECF 21-08). EUR 28359 EN, Luxembourg: Publications Office of the European Union.
Stobberup, K., Dolores Garza Gil, M., Stirnemann-Relot, A., Rigaud, A., Franceschelli, N. and Blomeyer, R. (2017). Research for PECH Committee – small-scale fisheries and “Blue Growth” in the EU. European Parliament, Policy Department for Structural and Cohesion Policies, Brussels.
Swedish Agency for Economic and Regional Growth (2020). Fakta om svensk turism 2020. Report number 0384. Stockholm, Sweden.
Swedish Agency for Marine and Water Management (2020). Utvärdering av system med individuella fiskemöjligheter. Dnr 1374-20. Havs- och vattenmyndigheten, 2020-08-28.
Swedish Agency for Marine and Water Management and Swedish Board of Agriculture (2021a). Strategi för svenskt fiske och vattenbruk 2021–2026. Retrieved from https://www.havochvatten.se/arkiv/aktuellt/2021-06-01-gemensam-strategi-visar-vagen-framat-for-svenskt-fiske-och-vattenbruk.html.
Swedish Agency for Marine and Water Management and Swedish Board of Agriculture (2021b). Handlingsplan för utveckling av svenskt fritidsfiske och fisketurism 2021-2026. Swedish Agency for Marine and Water Management (SwAM) and Swedish Board of Agriculture (SJV), 2021-06-02.
Swedish Board of Agriculture (2022). Commercial fishing. Retrieved from https://jordbruksverket.se/utveckla-foretagande-pa-landsbygden/vattenbruk-och-fiske/yrkesfiske [Accessed 2022-10-12].
Tinch, R., Mathieu, L., Anderson, S., och Radford, A. (2015). Comparing Industry Sector Values, With a Case Study of Commercial Fishing and Recreational Sea Angling. UKFEM, Seafish, Defra, Marine Scotland.
Toivonen, A-L., Roth, E., Navrud, S., Gudbersson G., Appelblad, H., Bengtsson B., Tuunainen, P. (2004). The economic value of recreational fisheries in Nordic countries. Fisheries Management and Ecology, 11, 1-14.
Train, K. E. (2009). Discrete choice methods with simulation. Cambridge university press.
Train, K., and Weeks, M. (2005). Discrete choice models in preference space and willingness-to-pay space. In Applications of simulation methods in environmental and resource economics, Dordrecht: Springer, 1-16.
Trojette, I., Changeant, A., Le Gallic, B. och Nourry, M. (2015). Deliverable 3.5. Identifying and quantifying non-market values (Grant Agreement Number 635188). Strategic Use of Competitiveness towards Consolidating the Economic Sustainability of the European Seafood sector (SUCCESS).
Vaage, F. O. (2015). Fritidsaktiviteter 1997-2014. Barn og voksnes idrettsaktiviteter, friluftsliv og kulturaktiviteter. Resultater fra Levekårsundersøkelsene. Statistics Norway, Report 2015:25.
Visit Sweden (2022a). Bohuslän – a gem on the idyllic west coast of Sweden. https://visitsweden.com/where-to-go/southern-sweden/bohuslan/ [Accessed 2022-10-12].
Visit Sweden (2022b). Sweden’s west coast and islands. https://visitsweden.com/where-to-go/southern-sweden/vastsverige/west-coast-archipelago/ [Accessed 2022-10-08].
Vitenskapelig råd for lakseforvaltning (2022). Status for norske laksebestander i 2022. Rapport fra Vitenskapelig råd for lakseforvaltning nr 17.
Voyer, M., Barclay, K., McIlgorm, A. and Mazur, N. (2016). Social and Economic Evaluation of NSW Coastal Professional Wild-Catch Fisheries: Valuing Coastal Fisheries (FRDC 2014-301). Canberra, Australia: Fisheries Research and Development Corporation (FRDC).
Vähä J-P, Erkinaro J, Falkegård M et al. (2017). Genetic stock identifcation of Atlantic salmon and its evaluation in a large population Conservation Genetics (2021) 22:35–51 51 1 3 complex. Can J Fish Aquat Sci. https://doi.org/10.1139/cjfas -2015-0606.
Vølstad, J. H., Christman, M., Ferter, K., Kleiven, A. R., Ottera, H., Aas, Ø., Arlinghaus, R. Borch, T. Colman, J., Hartill, B. Haugen, T. O., Hyder, K., Lyle, J. M., Ohldieck, M. J. Skov, C., Strehlow, H. V., van Voorhees, D., Weltersbach, M. S. and Weber, E. D. (2020). Field surveying of marine recreational fisheries in Norway using a novel spatial sampling frame reveals striking under-coverage of alternative sampling frames. ICES Journal of Marine Science, 77, 2192–2205.
Waldo, S. och Blomquist, J. (2020). Var är det lönt att fiska? – en analys av fisket i svenska regioner. AgriFood Fokus rapport 2020:2.
Waldo, S., Blomquist, J., Masinovic, I., Sundström, K. and Waldo, Å. (2020). Kan yrkesfisket locka turister? En analys av hamnarna Skillinge och Träslövsläge. AgriFood rapport 2020:4. Lund, AgriFood Economics Centre.
Wernersson, M-L., Fohlin, M., Danielsson, P., Mattson, P-O., Hansson, P., Forsberg, H., Johansson, J-O., Fredriksson, R., Olsson, K-E., Abrahamsson, M., Dafteryd, P., Björklund, H., Karlsson, T., Stenkil, A-C., Flankör, D., Mårtensson, K. and Spangenberg, J. (2017). Det lokala fisket riskerar att försvinna helt. Svenska Dagbladet, Published 2017-06-29. Retrieved from https://www.svd.se/det-lokala-fisket-riskerar-forsvinna-helt/om/debatt.
Whitehead J.C., Johnson, B.K., Mason, D.S. and Walker, G.J. (2013). Consumption benefits of national hockey league game trips estimated from revealed and stated preference demand data. Economic Inquiry, 51(1), 1012-1025.
Zanoli, R., Scarpa, R., Napolitano, F., Piasentier, E., Naspetti, S., and Bruschi, V. (2013). Organic label as an identifier of environmentally related quality: A consumer choice experiment on beef in Italy. Renewable Agriculture and Food Systems, 28(1), 70-79.
About this publication
Interactions between Fisheries and Tourism in the Nordic Countries
Staffan Waldo, Margrethe Aanesen, Ceren Ahi, Anna Andersson, Johan Blomquist, Tuija Lankia, Max Nielsen, Rasmus Nielsen
and Heidi Pokki
ISBN 978-92-893-7595-5 (PDF)
ISBN 978-92-893-7596-2 (ONLINE)
http://dx.doi.org/10.6027/temanord2023-518
TemaNord 2023:518
ISSN 0908-6692
© Nordic Council of Ministers 2023
Cover photo: Asaf Kliger/imagebank.sweden.se
Published: 5/7/2023
Disclaimer
This publication was funded by the Nordic Council of Ministers. However, the content does not necessarily reflect the Nordic Council of Ministers’ views, opinions, attitudes or recommendations.
Rights and permissions
This work is made available under the Creative Commons Attribution 4.0 International license (CC BY 4.0) https://creativecommons.org/licenses/by/4.0.
Translations: If you translate this work, please include the following disclaimer: This translation was not produced by the Nordic Council of Ministers and should not be construed as official. The Nordic Council of Ministers cannot be held responsible for the translation or any errors in it.
Adaptations: If you adapt this work, please include the following disclaimer along with the attribution: This is an adaptation of an original work by the Nordic Council of Ministers. Responsibility for the views and opinions expressed in the adaptation rests solely with its author(s). The views and opinions in this adaptation have not been approved by the Nordic Council of Ministers.
Third-party content: The Nordic Council of Ministers does not necessarily own every single part of this work. The Nordic Council of Ministers cannot, therefore, guarantee that the reuse of third-party content does not infringe the copyright of the third party. If you wish to reuse any third-party content, you bear the risks associated with any such rights violations. You are responsible for determining whether there is a need to obtain permission for the use of third-party content, and if so, for obtaining the relevant permission from the copyright holder. Examples of third-party content may include, but are not limited to, tables, figures or images.
Photo rights (further permission required for reuse):
Any queries regarding rights and licences should be addressed to:
Nordic Council of Ministers/Publication Unit
Ved Stranden 18
DK-1061 Copenhagen
Denmark
pub@norden.org
Nordic co-operation
Nordic co-operation is one of the world’s most extensive forms of regional collaboration, involving Denmark, Finland, Iceland, Norway, Sweden, and the Faroe Islands, Greenland and Åland.
Nordic co-operation has firm traditions in politics, economics and culture and plays an important role in European and international forums. The Nordic community strives for a strong Nordic Region in a strong Europe.
Nordic co-operation promotes regional interests and values in a global world. The values shared by the Nordic countries help make the region one of the most innovative and competitive in the world.
The Nordic Council of Ministers
Nordens Hus
Ved Stranden 18
DK-1061 Copenhagen
pub@norden.org
Read more Nordic publications on www.norden.org/publications