
- Frontpage
- Contents
- Abstract
- Tiivistelmä
- Preface
- 1 Introduction
- 2 Description of the urban experimental ecosystem accounting pilot in Nordic cities and municipalities
- 3 What is ecosystem accounting
- 4 Urban ecosystem accounting
- 5 Cities and their politics or other questions to be supported by ecosystem accounts
- 6 Pilot ecosystem accounts
- 7 How to overcome challenges in urban ecosystem accounting
- 8 Draft roadmap for urban ecosystem accounting in Nordic cities
- References
- About this publication
MENU
Contents
This publication is also available online in a web-accessible version at
https://pub.norden.org/temanord2022-557
Abstract
Urban experimental ecosystem accounting pilot in the Nordic cities
Urban green and blue areas offer multiple ecosystem services, including recreational opportunities, places for education, stormwater runoff mitigation, and local climate regulation, that support urban resilience and contribute to the well-being and quality of life of urban dwellers. Urban development poses a risk of losing urban ecosystems and their services to inhabitants, while climate change and biodiversity loss simultaneously increase their importance. Blue and green infrastructure provide an opportunity to benefit from nature-based solutions in urban development. Urban green spaces need to be integrated into urban planning and decision making in a systematic way to preserve and enhance biodiversity and the important services and benefits that the ecosystems supply. Urban ecosystem accounting (EA) provides a framework for quantifying changes in the extent and the condition of urban ecosystems and for assessing change in the ecosystem service supply and use over time. It also measures the contributions of nature to different economic sectors (households, government, business, etc.) and human well-being. Moreover, EA takes into consideration how the value of ecosystems as natural capital changes over time. As a result, EA provides an information system that can support municipal planning and policy.
Aim and Purpose
Mapping and assessment of ecosystems and their services (EU’s MAES activity) as well as valuation of ecosystem services has been conducted in an increasing number of regions and cities in Europe. The United Nations published an international statistical standard for ecosystem accounting (SEEA EA) at national level in 2021. However, urban ecosystem accounting at municipal level is still in an experimental phase. To help overcome knowledge gaps and encourage municipalities, this project provided a platform for co-creating understanding of the needs for and possibilities of urban and municipal EA and sharing experiences. Importantly, a number of ecosystem accounts were piloted in four cities: the city of Helsinki, the city of Tampere and the municipality of Pirkkala in Finland, and the city of Oslo in Norway.
Case Studies
Different ecosystem accounts were developed based on concrete political or planning related needs, priorities, and data availability discussed with each municipality individually and together during several workshops. The city of Helsinki and the municipality of Pirkkala were interested in quantifying the extent of different types of forests and the recreational services provided by them. The city of Oslo focused on recreational benefits of all urban green areas. For the quantitative assessment of the physical supply and use of recreational services data retrieved from the popular social media platform Flickr, citizen science applications (i.e., iNaturalist and eBIRD) and movement data from the STRAVA application were used. The priorities of the city of Tampere in ecosystem accounting were the changes in the extent of different ecosystems represented by land use and land cover data as well as stormwater infiltration. The InVEST model was used for the assessment and economic valuation of flood mitigation service provided by green infrastructure within the core city of Tampere.
Solving the challenges of urban ecosystem accounting
The compilation of ecosystem accounts requires resources and time. The four pilot ecosystem accounts are not all comprehensive physical and monetary accounts. Due to the experimental nature of the accounts, multiple technical discussions and stakeholder consultations were necessary to address methodological challenges. Data availability was the major limitation encountered in all pilot studies. Existing land use/land cover data covering the desired area has many gaps which limited the analysis. Social media is a useful source of information to assess the recreational value provided by green areas, but it should be recognized that these data are biased and do not represent the population at large. A possible approach to overcome these limitations could be to complement data inferred from social media with data gathered with participatory GIS surveys or workshops with stakeholders or, for example, by visitor counters. More generally the pilot case studies from the different Nordic cities raise questions about the possibility to standardize urban ecosystem accounts at the local level, the way standardization is intended by the UN for national accounts. The project provides valuable experiences in the ability of Nordic municipalities and associated researcher institutions to apply UN ecosystem accounting designed for national accounts at the municipal level.
A draft roadmap for municipal ecosystem accounting
Based on the research study a draft roadmap for implementing municipal ecosystem accounting is presented in this report. When more municipalities start ecosystem accounting and experiences will build up the roadmap can be complemented and improved. The Nordic municipalities share similar type of societal situations and have good connections to act as peers to each other. This provides a possibility for the Nordic municipalities to take a leading role in ecosystem accounting implementation in Europe.
Keywords: Ecosystem accounting, urban areas, Nordic cities, ecosystem services, monetary value, social media, recreation, flood mitigation
Tiivistelmä
Kunnallinen ekosysteemitilinpidon pilotointi pohjoismaisissa kunnissa
Pohjoismaisten kuntien ekosysteemitilinpidon pilotti
Viheralueet ja vesistöt tarjoavat monenlaisia ekosysteemipalveluita, kuten virkistysmahdollisuuksia, rankkasateiden aiheuttamien tulvien hillintää ja paikallisilmaston säätelyä, jotka tukevat kuntien kestävyyttä ja myötävaikuttavat asukkaiden hyvinvointiin ja elämänlaatuun. Rakentaminen ja maankäytön muutokset aiheuttavat kuitenkin paineita ekosysteemeille ja niiden ihmisille tarjoamille ekosysteemipalveluille, vaikka samaan aikaan ilmastonmuutos ja luontokato korostavat näiden merkitystä rakennetussakin ympäristössä. Sini-viherrakenne antaa mahdollisuuden hyödyntää luontopohjaisia ratkaisuja kaupunkien kehittämisessä ja sopeutumisessa muuttuviin olosuhteisiin ja sen vuoksi se tulisikin integroida maankäytön suunnitteluun ja päätöksentekoon systemaattisesti siten, että turvataan luonnon monimuotoisuuden elpyminen ja tärkeät ekosysteemipalvelut. Kunnallinen ekosysteemitilinpito tarjoaa viitekehyksen, jonka avulla voidaan mitata muutoksia ekosysteemien laajuudessa ja tilassa sekä ekosysteemipalveluiden tarjonnassa ja kysynnässä pitkällä aikajänteellä. Ekosysteemitilinpidon avulla voidaan myös mitata luonnon vaikutuksia eri taloussektoreihin (kotitaloudet, julkishallinto, liiketoiminta jne.) sekä ihmisten hyvinvointiin. Ekosysteemitilinpito tarkastelee myös, miten ekosysteemien luontopääoman arvo muuttuu ajan myötä. Niinpä ekosysteemitilinpito tarjoaakin tietojärjestelmän, joka voi tukea kunnallista suunnittelua ja poliittista päätöksentekoa.
Kunnallisen ekosysteemitilinpidon pilotoinnin tarkoitus
Ekosysteemien ja niiden tuottamien palveluiden kartoittamista ja arviointia (EU:n MAES-aktiviteetti) samoin kuin ekosysteemipalveluiden arvottamista on tehty kasvavassa määrässä alueita ja kuntia Euroopassa. YK julkaisi kansainvälisen tilastostandardin kansallisen tason ekosysteemitilinpitoa (SEEA EA) varten vuonna 2021. Kunnallinen ekosysteemitilinpito on kuitenkin edelleen kokeiluvaiheessa. Tässä julkaisussa kuvattu hanke kerrytti tietopohjaa ja ymmärrystä kuntien tarpeista ja mahdollisuuksista toteuttaa ekosysteemitilinpitoa. Samalla kunnat pääsivät vaihtamaan ajatuksia ja kokemuksia ekosysteemitilinpidosta. Hankkeen tavoitteena olikin tukea ja rohkaista kuntia.
Tapaustutkimukset
Hankkeessa pilotoitiin kuntien valitsemia ekosysteemitilejä neljässä kunnassa: Helsingissä, Tampereella ja Pirkkalassa Suomessa sekä Oslossa Norjassa. Pilottikunnat valitsivat testattavat ekosysteemitilit perustuen ajankohtaisiin konkreettisiin poliittisiin tai suunnitteluun liittyviin tarpeisiin, prioriteetteihin ja tarvittavan tiedon saatavuuteen. Jokaisen kunnan kanssa keskusteltiin valittavista ekosysteemitileistä erikseen, ja lisäksi näistä keskusteltiin kuntien yhteisissä työpajoissa. Helsingin kaupunki ja Pirkkalan kunta olivat kiinnostuneita arvioimaan erilaisten metsien laajuutta ja tässä tapahtunutta muutosta sekä niiden tuottamia virkistys- ja opetuksellisia ekosysteemipalveluita. Oslon kaupunki keskittyi kaikkien kaupungin viheralueiden tuottamiin virkistyshyötyihin. Fyysisen virkistysekosysteemipalvelun toteutuneen tarjonnan ja kysynnän määrälliseksi arvioimiseksi käytettiin suosituista sosiaalisen median sovelluksista saatavaa dataa. Näitä sovelluksia ovat Flickr, kansalaistiedesovellukset (esim. iNaturalist ja eBird) ja liikkumistieto STRAVA-sovelluksesta. Tampereen kaupungin prioriteetteina ekosysteemitilinpidossa oli arvioida muutoksia eri maanpeiteluokkien kuvaamien ekosysteemien laajuudessa sekä sini-viherrakenteen tuottamaa tulvavesien hallintaa. Tampereen ydinalueen viherrakenteen tarjoaman sadetulvavesien hallintapalvelun arviointiin ja taloudelliseen arvottamiseen käytettiin InVEST-mallia.
Kunnallisen ekosysteemitilinpidon haasteiden ratkaiseminen
Ekosysteemitilien kokoaminen vaatii resursseja ja aikaa. Hankkeessa tuotetut neljä ekosysteemitiliä eivät ole kaiken kattavia fyysisiä ja rahallisia tilejä. Kunnallisten ekosysteemipalvelutilien kokeellisuuden takia tarvittiin lukuisia teknisiä keskusteluja ja yhteistyötä kuntien kanssa, jotta menetelmälliset haasteet saatiin ratkaistua. Sopivan tiedon puute oli suurin rajoitus ekosysteemitilien laskemiselle kaikissa pilottikunnissa. Olemassa olevissa maankäyttö- ja maanpeiteaineistoissa oli monia puutteita, jotka rajoittivat analyysejä. Sosiaalisen median aineistot ovat hyödyllisiä tietolähteitä viheralueiden virkistysarvon arvioimiseen, mutta on tällaiset aineistot ovat aina jollakin tavoin vinoutuneita eivätkä edusta koko väestöä. Aineistoja voisikin täydentää esimerkiksi keräämällä tietoa paikkatietopohjaisilla kyselyillä, järjestämällä työpajoja sidosryhmien kanssa tai esimerkiksi kävijälaskureilla. Yleinen kokemus pohjoismaisissa kunnissa toteutetusta pilotoinnista on, että paikallisen tason kunnallisia ekosysteemitilejä voisi olla hyödyllistä standardoida samaan tapaan kuin YK on standardoinut kansallisen ekosysteemitilinpidon mallin. Hanke tuotti arvokasta kokemustietoa pohjoismaisten kuntien ja niiden kanssa työskennelleiden tutkimuslaitosten kyvystä soveltaa YK:n kansalliselle tasolle suunniteltua ekosysteemitilinpitoa kunnallisella tasolla.
Alustava tiekartta kunnalliselle ekosysteemitilinpidolle
Raportissa esitetään tutkimuksen perusteella alustava tiekartta kunnallisen ekosysteemitilinpidon toteuttamiselle. Kun useammat kunnat aloittavat ekosysteemitilinpidon ja kokemuksia alkaa kertyä, tiekarttaa voidaan täydentää ja parantaa. Pohjoismaiden kunnilla on samantapainen yhteiskunnallinen tilanne ja niillä on hyvät keskinäiset yhteydet, mikä mahdollistaa vertaistuen. Tämä mahdollistaa sen, että Pohjoismaiden kunnat voisivat ottaa jopa johtavan roolin ekosysteemitilinpidon toteuttamisessa Euroopassa.
Asiasanat: Ekosysteemitilinpito, kaupunkiseudut, pohjoismaiset kaupungit, ekosysteemipalvelut, rahallinen arvo, sosiaalinen media, virkistys, sadevesien imeyttäminen
Preface
Cities in the Nordic countries have a long tradition of planning, designing, and managing cities with nature and greenery. However, during the last decades urban densification, changes of land use and lack of policy have changed urban development into a greyer and more hard surfaced urban fabric. Meanwhile, the Nordic cities like other parts of the world, face a climate emergency, biodiversity loss, and public health challenges (most recently the global COVID-19 pandemic), which calls for an increasing focus on greener cities. The need to develop urban environments that are healthy and resilient, and where individuals and communities can thrive, is increasingly recognized by policy makers, researchers, and specialists.
In 2018 the Nordic Council of Ministers for Climate and Environment appointed a Nordic Working Group for Sustainable Cities. The overall objective and purpose of the efforts of this working group have been to contribute to achieving the sustainable development goals of Agenda 2030 with an emphasis on strengthening the exchange of experiences and co-operating on Nordic solutions for sustainable urban development. The importance of urban green spaces in achieving this has been a key focus of the group’s work during the years 2019–2021.
One of the outputs from the group was a Nordic Green Space Survey (carried out by Swedish University of Agricultural Sciences in 2020), where green space managers in 15 municipalities in the Nordic countries were interviewed concerning challenges, opportunities and future needs. The study showed that there is a strong need for new methods to identify and assess the multiple functions and values of urban and peri-urban green space.
This report Urban experimental ecosystem accounting pilot in the Nordic cities is one step in developing methodology for urban ecosystems. Urban ecosystem accounting provides a framework for quantifying the extent and condition of urban ecosystems and the related services and benefits provided to people. The Nordic Working Group for Sustainable Cities sees ecosystem accounting as an important contribution to more transparent and evidence-based methodology for assessing ecosystem services and taking their benefits and values into account in urban planning.
The report has been commissioned by the Working group for Sustainable Cities and conducted by SYKE and NINA in 2021–2022. The working group has been given the opportunity to provide input to the report during the work. However, the authors are responsible for the content of the report.
We hope that the report will inspire cities and municipalities in the Nordic countries to work with ecosystem accounting.
Nordic Council of Ministers’ Working Group for Sustainable Cities
Ingvild Tjønneland, Ministry of Climate and Environment (Norway)
Suvi Anttila, Ministry of the Environment (Finland)
Sigurjón Jóhannsson, National Planning Agency (Iceland)
Ulrika Åkerlund, National Board of Housing, Building and Planning (Sweden)
1 Introduction
Urban green spaces provide a variety of ecosystem services including recreational opportunities, stormwater runoff protection and climate mitigation and adaptation, carbon sinks and storages and biodiversity conservation that are of utmost importance to the quality of life, health and well-being of people and the society. The condition and the extent of these ecosystems is threatened at the local scale by increasing population, densification of built land, land use changes, biodiversity loss and climate change. These global challenges affect ecosystems’ capacity to provide services benefiting urban inhabitants. To promote the conservation of these important urban ecosystems, the value of the environmental and social benefits provided by green areas will need to be integrated in spatial planning, national level policies and urban decision-making in a systematic way. Urban ecosystem accounting provides a framework for quantifying the extent and condition of urban ecosystems and the related services and benefits provided to people. Ecosystem accounting is not yet implemented in local planning in Nordic cities. The overall goal of the presented pilot case studies in this report was to provide examples of good practices to the Nordic cities and municipalities.
Natural capital is recognized to be one of the three components of capital, together with produced capital and human capital. Yet, the economic contributions provided by this natural capital have too often been taken for granted (for free and without any limits) when making important economic decisions. To improve the situation, natural capital accounting (hereafter ecosystem accounting) has been proposed. It integrates nature and its benefits into already existing decision frameworks, such as the System of Environmental Economic Accounting (SEEA) and at higher level, to the System of National Accounts (SNA). The objectives of ecosystem accounting are to recognize ecosystems as assets that must be maintained and managed, with its contributions (services) measured and considered in decision making, and to enhance sustainable development which is the only resilient way forward to the future.
Eurostat, in close collaboration with EU member states, is developing amendment to Regulation 691/2011 on European environmental economic accounts to include three new modules of environmental accounts, one of them being ecosystem accounts. These obligatory accounts would be complied at the country level, but it is foreseen that urban ecosystem accounting could be a voluntary thematic account. Nordic countries can benefit from cooperation in developing a feasible urban ecosystem accounting model, and act as a lighthouse region for the EU. Urban ecosystem accounting provides a framework for municipal reporting on urban nature, which can further support municipal master planning processes and annual environment, biodiversity, and climate reporting.
Urban ecosystem accounting is experimental by nature as there are no standards for it yet. There have been developments in urban experimental ecosystem accounting in Britain, the Netherlands and most recently in Norway. The Urban EEA project (2017–2020) in Norway was funded by the Research Council of Norway and coordinated by David N. Barton from Norwegian Institute for Nature Research (NINA) (https://www.nina.no/english/Sustainable-society/Ecosystem-accounting/Urban-Ecosystem-Accounting-Urban-EA). During the project, urban ecosystem extent and condition mapping and accounting using remote sensing data were tested, and selected ecosystem services of high importance to the municipality of Oslo were mapped for the first time. Valuable experience was gained on the scale of effort required to compile a complete set of ecosystem accounts at municipal level, at the same level of ambition as envisaged by the SEEA EA for national accounts. In addition, urban ecosystem assessment has been carried out at the EU level (EC/Joint Research Centre) as well as local pilots implemented in 18 city labs around Europe in the frame of EC’s EnRoute project (Zulian et al., 2018). In this, indicators of biodiversity, ecosystem structure and extent, ecosystem condition, and ecosystem services supply and use were tested. Despite of all these pilots, urban ecosystem accounting is still in the beginning. Urban ecosystem accounting is a complex issue and covers versatile aspects of ecosystems. In addition, it is highly integrated with the municipal management and decision-making which adds challenges. To be able to bring ecosystem accounting as part of municipal overall accounting and get acceptability for it, it is of utmost importance to work in close cooperation with cities and municipalities themselves in the ecosystem accounting development and implementation.

2 Description of the urban experimental ecosystem accounting pilot in Nordic cities and municipalities
2.1 Objectives
As a result of previous efforts, a number of examples of individual pilot urban ecosystem accounts as well as urban ecosystem assessment indicators existed. In addition to that, lots of spatial data is available, including earth observation data, which can be useful for ecosystem accounting. Cities and municipalities themselves host versatile data and statistical data from various sources exists as well. However, knowledge of ecosystem accounting is very limited, and it has not been adopted as part of the municipal practice or governance yet. Cities and municipalities are interested in applying ecosystem accounting. Therefore, practical experimentation in producing pilot accounts and easy-to-follow guidance is needed.
The main objectives of our project were:
- To demonstrate the application of ecosystem accounting in a couple of cities in Finland and Norway as lighthouses and provide support for a couple of follower cities in other Nordic countries. The prerequisites were that
- municipal planning should support the use of ecosystem accounts,
- cities are engaged in producing the accounts themselves with the help of researchers. - To provide a platform for cooperation, problem solving and co-creation of ecosystem accounting in the participating cities and municipalities.
- To create a draft roadmap for implementing ecosystem accounting as a part of city and municipal governance in other Nordic cities.
2.2 Implementation steps of the project
Pilot cities and municipalities are as follows (see Figure 1 for a map):
- The city of Helsinki, the city of Tampere and the municipality of Pirkkala in Finland
- The city of Oslo in Norway
- Follower cities were Umeå in Sweden and Reykjavik in Iceland.

Figure 1. Map of the pilot cities and municipalities involved in the Nordic urban ecosystem accounting study. Background map data from naturalearthdata.com.
As a first step of the project, we made together with the frontrunner cities a short list of a few ecosystem accounts that could be implemented in the pilot cities/municipalities. After that we discussed the possibilities and options of ecosystem accounting, data availabilities and methodological issues based on which the pilot cities decided which ecosystem accounts will be implemented. The precondition was that the city could identify a concrete political, planning-related or some other need for which the ecosystem accounts would provide important information.
The implementation of ecosystem accounting was carried out in close cooperation with the cities/municipalities. We applied a mixed-method analyses in creating the ecosystem accounts and related maps and input-output-tables.
Finally, experiences of the project were collected from the cities/municipalities. Based on all the work and experiences in the pilot ecosystem accounting work we produced a draft roadmap for other cities/municipalities.
The project was carried out by a team of researchers:
- Leena Kopperoinen, Syke: project lead, ecosystem accounting development, coordinator of municipal interaction
- David N. Barton, NINA: project co-lead, ecosystem accounting development, monetary valuation
- Pekka Hurskainen, Syke: ecosystem extent accounts, physical ecosystem service supply accounts, accounting maps
- Marion Kruse, NINA: GIS, spatial ecosystem accounts
- Laura Costadone, Syke: physical ecosystem service demand accounts, accounting maps
- Tin-Yu Lai, Syke: physical and monetary ecosystem service accounting development.
3 What is ecosystem accounting
The System of Environmental-Economic Accounting (SEEA) is an internationally agreed framework integrating economic and environmental data to provide a comprehensive and multipurpose view of the interrelationships between the economy and the environment and the stocks and changes in stocks of environmental assets, as they bring benefits to humanity. It brings together economic and environmental information in an internationally agreed set of standard concepts, definitions, classifications, accounting rules and tables to produce internationally comparable statistics.
The SEEA consists of two parts: the SEEA Central Framework (SEEA CF), which looks at “environmental assets”, such as water and energy resources, forests, raw materials, etc., their use in the economy and returns back to the environment in the form of waste, air and water emissions. The second part of SEEA consists of Ecosystem Accounting (SEEA EA), which differs from environmental accounts in the SEEA CF in two fundamental ways: 1) by taking the perspective of ecosystems and the flow of ecosystem services to society, instead of looking only at natural resources, and 2) by taking a spatial approach, in a sense that the accounts can be presented also as maps, which further enables geospatial analysis of ecosystem accounting data and integration to other spatial planning systems.
The SEEA EA was adopted as an international standard by United Nations Statistical Commission in March 2021. The standard includes three of the five core accounts (light green boxes in Figure 2). The monetary accounts were accepted only as good practice (orange boxes in Figure 2). In addition to the core accounts, four others more specific (and still very much experimental) thematic accounts are also proposed, one of them being urban account.

Figure 2. Accounts and their interactions in the SEEA EA framework.
The most important terminology related to ecosystem accounting includes the following:
- Ecosystem accounts (EA) record the stock as extent of ecosystems and their condition, and the flow of ecosystem services to their users (supply and use).
- Ecosystem accounting area (EAA) is the geographical territory for which an ecosystem account is compiled.
- Ecosystem type reflects a distinct set of abiotic and biotic components and their interactions.
- Ecosystem assets are contiguous spaces of specific ecosystem types.
- Ecosystem extent is the size of ecosystems in terms of area. Ecosystem extent accounts record the areas and changes in areas for each ecosystem type within the EAA.
- Ecosystem condition is the quality of an ecosystem measured in terms of its abiotic, biotic and landscape characteristics. The condition directly affects the ecosystem’s capacity to deliver ecosystem services.
- Ecosystem services (ES) are the contributions of ecosystems as benefits for economic and other human activity. They include (i) provisioning, (ii) regulating and maintenance, and (iii) cultural ecosystem services (https://cices.eu/). Ecosystem services accounts record the supply and use of ES in the form of supply and use tables. The supply table records the supply of ES from ecosystems to society. The use table records the use of ES by institutional sectors.
4 Urban ecosystem accounting
Urban ecosystem accounting is proposed as one of four thematic accounts in the SEEA EA. It is not part of the statistical standard, but chapter 13.6 of the SEEA EA presents guidelines following internationally recognized principles (as is the case for chapters 8–12 on monetary and combined accounts) (https://unstats.un.org/unsd/statcom/52nd-session/documents/BG-3f-SEEA-EA_Final_draft-E.pdf). Because cities/municipalities do not implement a local equivalent of national accounts, nor the SEEA Central Framework, piloting of urban ecosystem accounting takes many forms, often carrying out ecosystem mapping and assessment to address a selection of prioritized ecosystem services for cities to address municipal policy questions. A challenge for municipalities in adopting SEEA EA at local level is that policy priorities, their geographical scale and resolution are different from national accounts (Figure 3).
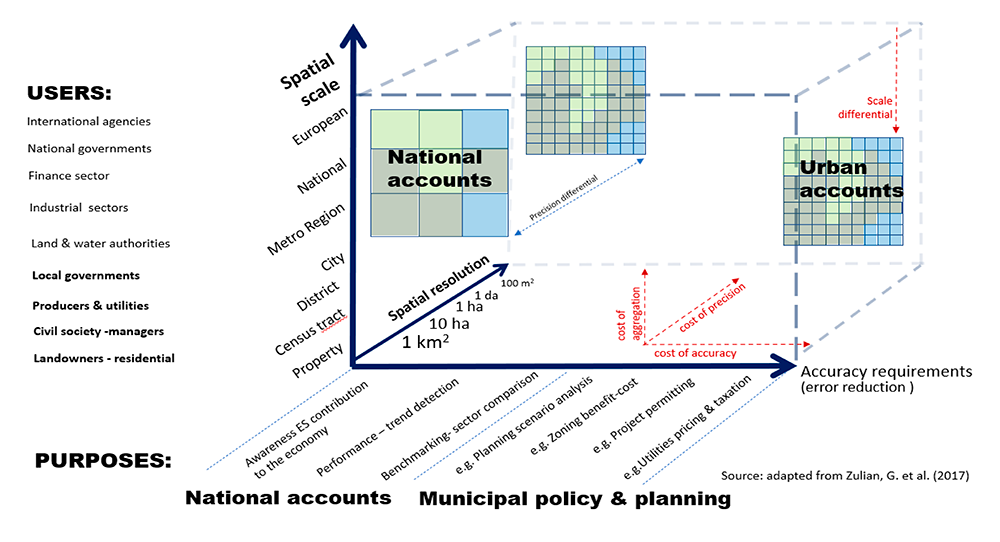
Figure 3. Conceptual diagram of the different spatial scales, spatial resolution and purposes of ecosystem accounts. Ecosystem accounts at national and urban governance levels are not necessarily aligned. The spatial extent for ES mapping is defined by the primary user group (vertical axis). The level of information accuracy (horizontal axis) and the spatial resolution are defined by the needs of the users for decision support and the intended management or policy application.
The ‘inspiration’ provided by the UN SEEA EA for municipalities could be summarized as (i) following consistent methods to mapping and ecosystem service assessment over time to account for changes; (ii) mapping at high spatial resolution using ground-truthed remote sensing methods to produce statistics for different administrative planning units of interest (census tracts, neighbourhoods, city districts, built zone, municipality, functional urban area); (iii) monetary valuation of ecosystem services’ contribution to urban economy and well-being.
Through the physical extent, condition and ecosystem service accounts SEEA EA statistical standard offers a framework to consistently and over time, inform municipal level impact assessment and municipal planning. Municipalities already compile environmental and social indicators for use in planning and impact assessment. SEEA EA will promote the production of standardized data at national level for thematic climate change, biodiversity and oceans, which in time may support municipal planning (in addition to existing national environmental monitoring programmes). In addition, the SEEA EA statistical principles for monetary valuation methods provide a standardized way of evaluating exchange values of urban ecosystem services. Exchange values of ecosystem services might be useful support for adjusting the pricing of municipal utilities to internalize municipal costs of providing ecosystem services. Since municipalities are not carrying out this work for national accounting purposes (such as quantifying ecosystem services’ contribution to the national economy), they are not necessarily constrained to using the accounting values that are compatible with national accounts. Economic valuation methods that quantify consumer and supplier economic surplus[1]E.g. the difference between willingness-to-pay and the actual market price paid; and between supply costs and market price received. from ecosystem services using so-called ‘economic’ or ‘welfare-based’ methods are useful for cost-benefit analyses, and e.g. assessing willingness-to-pay utilities fees (Barton et al., 2019a). In summary, SEEA EA offers additions to a dashboard of value indicators already being developed by many cities for the municipal planning and policy purposes.
Given resource and time constraints it is necessary to start compiling ecosystem accounting data from the bottom, and in a way that (1) addresses municipal policy and planning needs first, and (2) while hopefully doing so in a way that also allows cities to track their own performance in time, to benchmark with other cities, and allows national statistical agencies to aggregate to a national level to help national accounts. A simpler way to think of municipal ecosystem accounting is by starting by establishing land use accounts, focused on ecosystem extent; proceeding to map ecosystem condition and physical ecosystem services. Once this is done consideration can be given to monetary valuation of annual ecosystem services contributions (per year), and present valuation of specific assets (their capital value in total over time) for the purpose of raising awareness about nature as capital. This can be conceptualized as a triangle where ‘investment in the knowledge base’ is necessary before ‘building’ the next level (Figure 4).
Footnotes
- ^ E.g. the difference between willingness-to-pay and the actual market price paid; and between supply costs and market price received.

Figure 4. Ecosystem accounting triangle applied for urban setting. Investments in creating base maps and spatial datasets should represent the basis for building the ecosystem accounting structure.
Building urban ecosystem accounts requires access to standardized and regularly updated base maps and spatial statistics, which for most municipalities need to be provided by national authorities. When basic data sets are in place then it is easy to start with ecosystem extent and condition accounts, before moving to physical ecosystem service accounting and valuation. It is important to recognize that the accounting system is not ‘an environment agency’ or sectoral tool – it can serve all agencies within a municipality. Once the accounting workflow and data are in place, statistics can be compiled to create different thematic accounts and indicators depending on a municipality’s specific needs. Because ecosystem accounts require a large up-front investment by a municipality, it is essential that they serve multiple agencies’ needs. Even if no city level commitment to this investment is forthcoming, urban ecosystem accounts can be built ‘project-by-project’ if there is a common understanding of a framework and principles. SEEA EA offers such a roadmap.
5 Cities and their politics or other questions to be supported by ecosystem accounts
Municipal ecosystem accounting and its usefulness is bound to identified policy questions for the tackling of which practitioners and decision-makers across sectors need data on temporal and spatial change in ecosystems and their condition as well as their capacity to answer to societal demand for various ecosystem services. Ecosystem accounting can support the work by providing that data. Therefore, the first task in ecosystem accounting is to discuss the relevant policy questions that it can support.
The policy questions of pilot cities were discussed through several workshops and meetings with them as well as within the cities. In summary, recreational services were emphasized in all the cities. In addition to these, other cultural ecosystem services, (e.g., educational services), and regulation services (i.e., cooling services from urban green and urban forest ecosystems, and flood and storm water mitigation services) were discussed most. The health benefits from recreational and other services were also discussed with the cities. The final focuses of each city are introduced separately below.
5.1 City of Oslo
Norway’s capital Oslo is located at the northern end of the Oslofjord. In 2019, a total of 681,071 inhabitants lived in the city. The city of Oslo and its surrounding areas have experienced increasing population growth and urbanization during the last decades. The current prognosis is an increase to more than 800,000 inhabitants by 2040. The total area of Oslo municipality is 454 km², of which 300 km² are part of the protected forest area (‘Marka’), constraining urban development to the existing built area. Around 98% of Oslo’s inhabitants live less than 300 m linear distance from green areas (Oslo Kommune, 2020).
5.1.1 Political priorities in Oslo
Oslo municipality is the first in the country to carry out “green accounts” (Grøntregnskap) mapping, the extent of actual (rather than regulated) vegetation cover in the city’s built zone between 2013–2017 (Oslo Kommune, 2018). During the four-year-accounting period all city districts except one registered net loss of vegetation cover ranging as high as 5% loss. Using available Lidar data Hanssen et al. (2021) conducted accounts of urban tree canopy cover for Oslo for the period 2011–2017, observing a net increase in tree canopy cover in Oslo’s built zone as a whole but a net loss in suburban small house area (Småhusplan). Different data sources, green structures and time periods mean that accounts are not directly comparable, but work is ongoing to improve the comparability and consistency of remote sensing data used for high resolution urban extent accounting. Other priorities of the municipality reflect global change concerns, particularly biodiversity conservation and stormwater runoff control. The municipality has implemented a performance-based instrument to promote blue and green infrastructure in new urban developments called Blue-Green Factor, which addresses a number of ecosystem services (Oslo Kommune, 2019). NINA conducts research through a number of projects to address these priorities using ecosystem service assessment and accounting frameworks (see https://www.nina.no/%C3%98kosystemer/Natur-i-by/Urban-EA-naturregnskap-for-byer ). Oslo municipality has carried out mapping and (qualitative) valuation of their recreation areas within the built zone following a national methodology (Miljodirektoratet, 2013). Oslo Municipality also regularly conducts surveys of the use of the peri-urban Marka forests with a representative sample of the adult population (‘Markaundersøkelse’). This survey includes questions regarding frequency of use which provide a point of comparison with mobility frequency data obtained from training apps or mobile phones.
5.1.2 Ecosystem accounting project in Oslo
A study by NINA has recommended testing greater use of GIS-based methods to map recreation area condition and to test using mobility data to quantify use frequency (Cimburova and Barton, 2021). NINA researchers have proposed that the modeling recreation impacts of covid-19 lockdown restrictions using STRAVA data (Venter et al., 2020) could also be used to quantify recreation use in ecosystem accounting. However, potential end users may question the representativeness of this data source for the purposes of ecosystem accounting. Discussing the pros and cons of this type of mobility data for accounting of recreation services is the focus of Oslo’s pilot case study in this report.
5.2 Pirkkala Municipality
Pirkkala municipality (61°28′N, 23°39′E) is located in the western part of Finland, south-west of the neighbouring City of Tampere. Pirkkala is a small municipality with 19,803 inhabitants (Statistics Finland, 2021), 81.42 km2 land areas and 22.5 km2 water areas (Maanmittauslaitos (MML), 2020) in 2020. A ring road (E12) crosses through the municipality and most of the people live in the northern part of the municipality (inside the ring road). Tampere-Pirkkala airport is located at the southern part of the municipality, and there are large forest areas at the south-eastern part of the municipality, which are important for recreational use for the surrounding areas also in other municipalities.
5.2.1 Political priorities in Pirkkala
Pirkkala municipality was especially interested in the different kinds of values provided by the forest. In terms of ecological value, ecological connectivity between important natural areas and biodiversity value were emphasized in the workshops. In terms of ecosystem services and economic value, the recreational and educational services provided by the forest ecosystems were of special concern. These forest values are under a threat of loss due to competing land use pressures, the increase of population and traffic volumes, as well as traffic noise pollution. In addition, when above certain threshold, recreational value potentially conflicts with the ecological value with increasing population and their demand for recreational use of the forest.
The municipality of Pirkkala has an ambitious biodiversity programme for 2020–2030 (Pirkkalan kunta, 2020). One activity in the programme is to experiment ecosystem accounting at municipal level, and the goal is to have at least one ecosystem account ready by 2025, which will be maintained at least until 2030. Accounting for recreation ecosystem service supply and use is specifically mentioned in the programme.
5.2.2 Ecosystem accounting project in Pirkkala
Based on the policy need from the municipality, the following accounts were experimentally compiled: (1) extent accounts on forest ecosystems, which can reveal the ecological importance of specific forest types; (2) monetary supply and use account of recreational services based solely on forest extent. In addition to the recreational services, a survey to the kindergartens and schools in Pirkkala was conducted by the municipality, to quantify the educational services provided by the forest ecosystem services.
5.3 City of Tampere
The city of Tampere (61° 30´N, 23° 45’E) is located in the western part of Finland, in the Pirkanmaa Region, which is one of the most rapidly developing regions of the country. Tampere is the third largest city in Finland with more than 225,000 inhabitants living within the municipal boundaries and close to half a million people living in the Tampere Region (Buttafuoco et al., 2017). The city landscape is dominated by two large lakes (Näsijärvi and Pyhäjärvi). The general land use of the city includes residential areas (44.8%), forests (28%), industrial areas (15%), lakes (11.8%) and agricultural areas (0.7%) (Ranta and Rahkonen, 2008). Forest tree species composition is mostly dominated by coniferous tree species and birches (Picea abies, Pinus sylvestris and Betula spp.). The forests owned by the city are usually managed as urban green areas and used for recreational activities. Most of the vegetation is natural or seminatural (Ranta and Viljanen, 2011).
5.3.1 Political priorities in Tampere
A critical issue for Tampere is flooding and thus, stormwater management is an important ecosystem service. Stormwater runoff has been found to be a major source of pollution in natural water systems due to the high concentration of nutrients and solids in water runoff. Flood management is a critical issue that is expected to gain even more importance in the near future due to rainfall intensification, landscape transformation linked to urbanization and deforestation. It is estimated that precipitation will increase in Finland by 25% in the next decades due to climate change. Heavy rain events are also assumed to become more intense (Olsson et al., 2015). As a result, the City of Tampere was interested in the economic valuation of flood mitigation services provided by green infrastructure within the municipal boundaries. Urban stormwater flooding is a global challenge often caused by the reduced infiltration, retention and drainage capacity in cities. Stormwater load can be substantially reduced by urban green infrastructure like patches of vegetation or forests that attenuate runoff during flash floods. Quantification of the benefits provided by natural infrastructures can allow the integration of this natural capital into decision making.
5.3.2 Ecosystem accounting project in Tampere
Based on the policy needs of the city, the following accounts were experimentally compiled: (1) ecosystem extent account and (2) physical supply and use account of flood risk retention services based on the estimation from InVEST model.
5.4 City of Helsinki
The city of Helsinki (60.1699° N, 24.9384° E) is located in southern Finland in the Helsinki-Uusimaa Region. It has a population of 650,000 within the municipal boundaries, while the wider Helsinki Metropolitan area hosts approximately 1.1 million people.
5.4.1 Political priorities in Helsinki
Green areas cover more than a third of the city’s land area. Forested areas provide an important recreational service for its residents and visitors. These urban forests are facing increasing pressure due to high land demand for urban development (Simkin et al., 2020). Integrating data on the recreational use and economic value of the urban forested areas along with information on their condition can help showing the importance of ecosystem services for people and mainstreaming into planning and economic decisions. Consequently, the City of Helsinki was interested in the economic valuation of the recreational services provided by the forested areas within the municipal boundaries.
5.4.2 Ecosystem accounting project in Helsinki
Based on the policy needs of the city, the following accounts were experimentally compiled: (1) extent account of forest ecosystems, and (2) physical supply and use estimation of recreational services based on a simplified supply account and the number of visits to the forests approximated by social media data.
6 Pilot ecosystem accounts
The selection of ecosystem accounts that were piloted is presented in Table 1. In the following subchapters, the methods and results of the pilots are summarized pilot by pilot.
Table 1. Summary of ecosystem accounts piloted in the project.
| Municipality | Account type | Account topics | Methodology | Data source | Data Resolution |
| Oslo | Recreational use | Recreation | Modelling / GIS | GIS data: Polygons from recreational areas (M98 data set) + STRAVA mobility data | Vector data: Line segments from ca. 5–500 m (STRAVA data) |
| Pirkkala | Ecosystem extent account (2021) | Forest | GIS | Finnish Forestry Centre’s gridded forest resource data | 16x16 m |
| Ecosystem services supply and use account (monetary) (2020) | Recreation | Meta-analysis benefit transfer function based on forest extent | Extent account, Grammatikopoulou & Vačkařova (2021), World Bank (2021), Statistics Finland (2021), MML (2020) | - | |
| Tampere | Ecosystem extent account (2018) | All ecosystem types | GIS | Corine Land Cover data 2012, 2018 (SYKE) | 20x20 m |
| Ecosystem services supply and use account (physical) (2018) | Stormwater runoff mitigation | InVEST modelling | Corine Land Cover and watershed data (SYKE), Geological Survey of Finland 1:20 000 soil map, Finnish Meteorological Agency precipitation data, MML building data (National Land Survey of Finland, CC BY 4.0) | Variable | |
| Helsinki | Ecosystem extent account | Forest | GIS | Finnish Forestry Centre gridded and polygon forest resource data, Metsähallitus forest polygon data, Helsinki forest polygon data | Variable |
| Ecosystem services supply and use estimation (physical) | Recreation | Social media and citizen science applications | Flickr, iNaturalist, eBird | - |
6.1 City of Oslo
Figure 5 shows Oslo’s municipal boundaries, corresponding to the ecosystem accounting area with the built zone and the surrounding Marka areas.
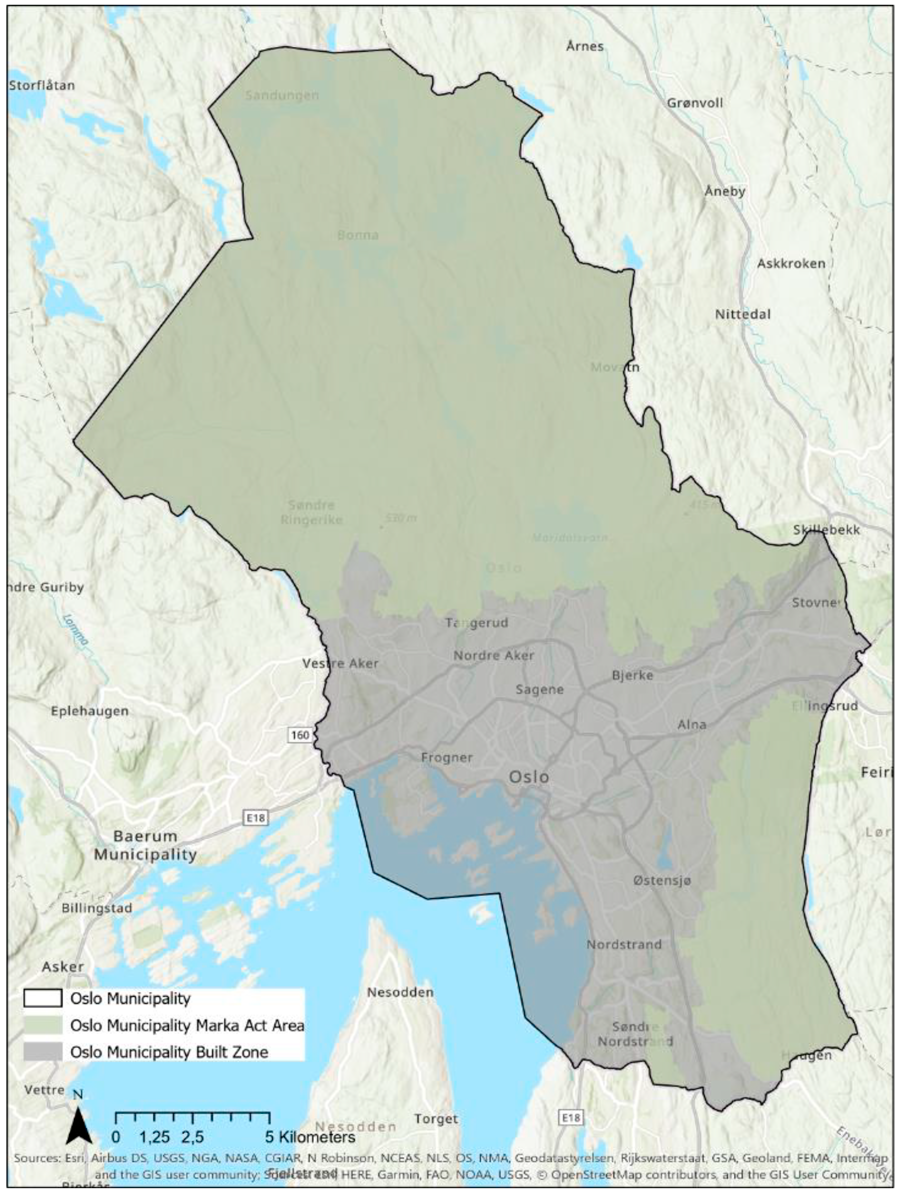
Figure 5. Pilot recreation accounting areas including the Oslo Marka Act Area and the built zone of Oslo municipality.
The background for the Oslo pilot case is the report on the national guidance for municipal mapping of recreation areas (Norwegian Environment Agency Report M98-2013; Miljødirektoratet, 2013). This methodology report describes why and how all Norwegian municipalities should identify recreational areas following a classification regarding recreation type (Table 2). The aims were to secure quality in mapping at the same time as giving the recreational areas a value. Seven main criteria (e.g., user frequency, symbolic value and function) were applied with six supporting criteria (e.g., accessibility, potential use). Based on this typology, recreational areas are valued on a scale (A–D) making a comparison possible.
All municipalities are obliged to make the results accessible on the website “naturbase kart” (Naturbase kart (miljodirektoratet.no)).
Table 2 lists the nine recreation area types which were classified in the city of Oslo. Large hiking areas with facilities, green corridors and natural terrain make up the largest share. Coastal zones and contiguous sea and watercourses are limited to the southwest where the Oslo fjord area is located.
Table 2. Recreation area types for which recreation service variables are computed in this study (Miljødirektoratet, 2013; Cimburova & Barton, 2021).
| Recreation area type within the city of Oslo | - Other recreation areas - Green corridors - Agricultural landscape - Playgrounds and recreation areas - Peri-urban forest (Marka)* - Natural terrain - Large hiking areas with facilities - Coastal zone and contiguous sea and watercourses - Recreation destination area** |
| * Not included in accounting tables because only one small polygon was defined in this class. ** Utfartsområde: “Recreation destination areas “. The sense of highly visited localised areas (e.g., Sognsvann). | |
The aim of the pilot account for the city of Oslo is to demonstrate recreation accounts for Oslo’s built zone and the Marka peri-urban forest using the municipal mapping of recreation area extent and condition (M98 data set) (Figure 6). Using SEEA EA terminology, the city of Oslo’s definition of M98 recreation area is the basis for a recreation ‘‘area extent account’. A condition account may use some of the M98 criteria describing the qualities of recreation areas. Building on already existing GIS data and methods has the advantage of developing methods further in the approach of accounting with new user groups, such as municipalities. In this pilot we demonstrate how to replace the qualitative assessment of the “use” criteria with quantitative visitor data based on calibrated STRAVA data.
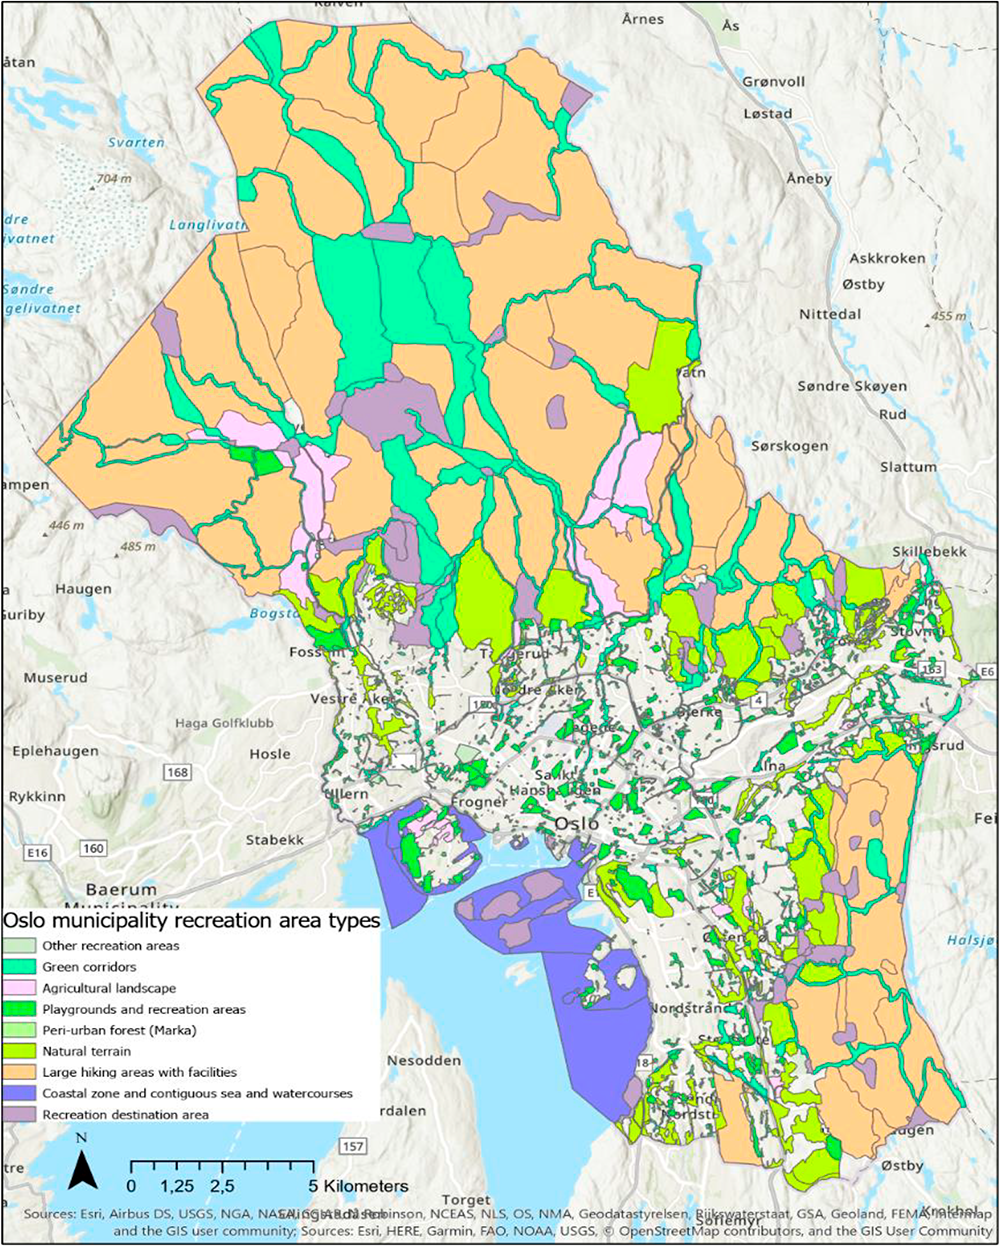
Figure 6. M98 recreation polygons for Oslo Municipality showing the different types of recreation area (Naturbase kart (miljodirektoratet.no)).
6.1.1 Quantifying recreation use
Aggregating recreation area visitation estimates for the built zone and for whole municipality provides support for reporting under SDG 11 Sustainable Cities and Communities; and specifically Target 11.7.1 Provide access to safe and inclusive green and public spaces – Open spaces in cities. The target indicator is defined as “average share of the built-up area of cities that is open space for public use for all, by sex, age and people with disabilities” (https://sdg-tracker.org/cities”), which does not require measuring use frequency. However, the goal of the indicator is to “Provide universal access to safe, inclusive and accessible, green and public spaces by 2030” (op.cit). Open space availability is really only a proxy indicator for this goal, while an indicator measuring actual change in use over time addresses the indicator goal directly. The reason a proxy is used is due to the difficulty in consistently and robustly measuring recreation area use. The Oslo pilot case addresses this need by testing the use of mobility data.
STRAVA is a mobile application which is used to monitor personal sports activities such as jogging and cycling. STRAVA data is a form of crowdsourced GPS tracking data which can be therefore used as a proxy for research on recreational areas.
The method applied in this study focuses on the available Strava data which is calculated for M98 recreation area polygons. The calculation method is described in Venter et al. (2020). The STRAVA data set is calibrated against counter station data where one STRAVA user represents approximately 30 of total entries to recreation destination areas in the Marka peri-urban forest (for further details see Venter et al., 2020).
In this study the annual accounting period is 2018 and 2019 and the STRAVA data include a summary of the activities from pedestrians and cyclists. These years were chosen for proof of concept since the data delivery in March 2020 from STRAVA changed format, rendering the data not directly comparable before and after this period. In future work we will format the delivery data post March 2020. For this particular demonstration the post 2020 period is not long enough to demonstrate annual recreation accounts. For this reason, we chose 2018–2019.
In this study, trips were defined using an activity constant per activity type using the origin-destination data from STRAVA (only available for a few users) to calculate an average trip distance for pedestrians and cyclists. These turn out to be that pedestrians walk for average 4.4 km per trip and cyclists ride for 12.3 km per trip. This was then used to define “whole trips”.
6.1.2 Method constraints
In general, the STRAVA users are representative of a segment of the population which uses and logs outdoor physical exercise. Nevertheless, STRAVA has a substantial user base in Norway with 175 000 individual runners and 95 000 individual cyclists recording a total of 5.2 million trips in 2020 (Venter et al., 2020).
Annual changes might be confounded by the increase in STRAVA usership over time. STRAVA membership is rising steadily, but this does not mean that total recreation level in Oslo has increased. This has been corrected for by detrending STRAVA data (Venter et al., 2020). STRAVA data has then been scaled to represent the total population of outdoor recreationists using available path counters recording total numbers of visitors passing by entry points to the Marka peri-urban forest (op.cit). Counter stations were not available for all recreation area types, so the scaling calculation is expected to have errors for parks in the built zone (underrepresentation of total visitor number) and wilderness areas (over representation). STRAVA does not capture off-trail activity although it is known that off-trail activity is significant because the basic data set is connected to Open Street Map. STRAVA data captures some winter activities such as skiing, but in this study, it has not been identified although also the Marka peri-urban forest is significant.
In this study, we do not account for recreation activities outside the M98 recreation areas in other urban landscapes of the built zone. This means that the approach loses some information on recreation use.
6.1.3 Results
Table 3 gives an overview of the cumulative distance in km of paths per individual M98 recreation area. The cumulative distance is smallest in the areas with limited extent (e.g., other recreation areas and coastal zones). There is no difference between both years, meaning that no trail segments were added in the period. Availability of trails is related to the M98 criteria “facilities”. This is an example of a (man-made) ecosystem condition variable. A methodological consideration is whether Open Street Map (OSM) data is changing over the accounting period through addition, deletion /closing of tracks. Part of the data quality assurance includes checking that the STRAVA data set is using the OSM data from the corresponding year.
Table 3. Cumulative distance (km) of paths with STRAVA records (intersected with M98 polygons). This table includes aggregated and de-identified data from Strava Metro, scaled to estimated total visitation frequencies using third party data.
| Period | Metric | Other recreation area | Green corridors | Agricultural landscape | Playgrounds and recreation areas | Natural terrain | Large hiking areas with facilities | Coastal zone and contiguous sea and water courses | Recreation destination area |
| 2018 | Km path | 21.4 | 783.0 | 63.8 | 382.0 | 566.3 | 721.6 | 21.4 | 293.7 |
| 2019 | Km path | 21.4 | 783.0 | 63.8 | 382.0 | 566.3 | 721.6 | 21.4 | 293.7 |
Table 4. Number of accumulated activity kilometers per M98 recreation area type. Note: This table includes aggregated and de-identified data from Strava Metro, scaled to estimated total visitation frequencies using third party data.
| Period | Metric | Other recreation area | Green corridors | Agricultural landscape | Playgrounds and recreation areas | Natural terrain | Large hiking areas with facilities | Coastal zone and contiguous sea and water courses | Recreation destination area |
| 2018 | Annual km | 127 618 | 72 075 923 | 420 745 | 7 476 202 | 4 017 315 | 1 619 348 | 313 762 | 9 736 509 |
| 2019 | Annual km | 138 417 | 71 130 066 | 411 365 | 7 528 922 | 3 868 720 | 1 317 124 | 315 136 | 8 988 668 |
| Change 2019–2018 | Annual km | 10 800 | -945 857 | -9 380 | 52 720 | -148 595 | -302 224 | 1 374 | -747 841 |
| % | 8% | -1% | -2% | 1% | -4% | -19% | 0% | -8% |
Table 4 shows larger differences in the number of accumulated activity kilometers which is by far the highest for green corridors. Interestingly, there is a slide change between the two years for most types from positive to negative. The largest negative change is the large hiking areas with facilities.
Table 5. Number of accumulated trips (pedestrian and cyclist) per M98 recreation area type. Note: This table includes aggregated and de-identified data from Strava Metro, scaled to estimated total visitation frequencies using third party data.
| Period | Metric | Other recreation area | Green corridors | Agricultural landscape | Playgrounds and recreation areas | Natural terrain | Large hiking areas with facilities | Coastal zone and contiguous sea and water courses | Recreation destination area |
| 2018 | Annual trips | 10 687 | 7 912 267 | 80 082 | 1 235 741 | 686 034 | 266 902 | 43 738 | 1 416 880 |
| 2019 | Annual trips | 11 867 | 7 706 304 | 78 925 | 1 246 107 | 659 160 | 207 989 | 42 853 | 1 261 752 |
| Change 2019–2018 | Annual trips | 1 180 | -205 963 | -1 157 | 10 366 | -26 874 | -58 913 | -885 | -155 128 |
| % | 11%* | -3%* | -1%** | 1% | -4% | -22%¤ | -2% | -11%¤ | |
| Numbers marked with* in Table 5 show that the average trip has shortened (% increase in # trips > than % increase in km trip length) respectively marked with ** where the average trip has shortened (% decrease in # trips < than % decrease in km trip length). The large hiking areas with facilities and the recreation destination areas are the ones where the average trip has lengthened (% decrease in # trips > than % decrease in km trip length) (marked ¤ in Table 5). | |||||||||
Table 6 summarizes the use relative to the availability of trails per M98 recreation area type where there is an increase or decrease of trip length.
Table 6. Recreation intensity (trips/km trail). Note: This table includes aggregated and de-identified data from Strava Metro, scaled to estimated total visitation frequencies using third party data.
| Period | Metric | Other recreation area | Green corridors | Agricultural landscape | Playgrounds and recreation areas | Natural terrain | Large hiking areas with facilities | Coastal zone and contiguous sea and water courses | Recreation destination area |
| 2018 | Annual trips / km trail | 499 | 10 106 | 1 255 | 3 235 | 1 211 | 370 | 2 047 | 4 823 |
| 2019 | Annual trips / km trail | 554 | 9 842 | 1 237 | 3 262 | 1 164 | 288 | 2 006 | 4 295 |
| Change 2019–2018 | Annual trips / km trail | 55 | -263 | -18 | 27 | -47 | -82 | -41 | -528 |
| % | 11% | -3% | -1% | 1% | -4% | -22% | -2% | -11% |
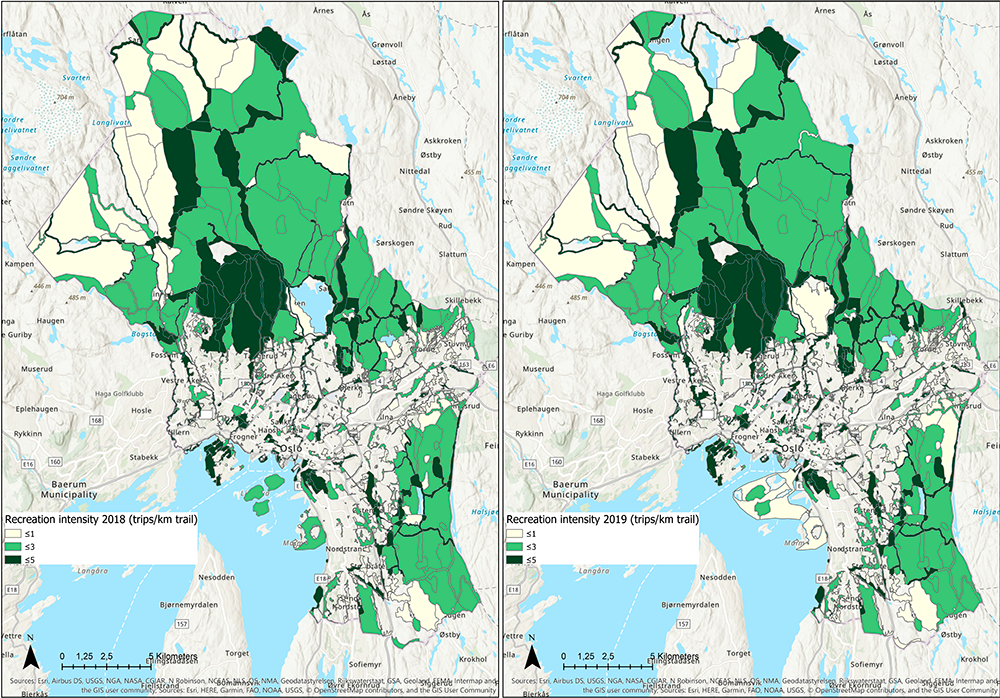
Figure 7. Spatial representation of the recreation intensity in the M98 recreation polygons for Oslo Municipality in 2018 (left) and 2019 (right). Note: This figure includes aggregated and de-identified data from Strava Metro, scaled to estimated total visitation frequencies using third party data.
Figure 7 displays the accounting results as maps for a comparison of the two accounting periods. Displayed as maps, use accounts can be further analyzed regarding causes of change. The recreation use accounts can be used to ask policy questions such as whether changes in recreation area condition lead to changes in the spatial distribution of recreation use, e.g. due to forest clear-cut or facilitation of trails. A further step is to value recreation use exchange values. STRAVA data make it possible to value trip frequency or trip time. The most important advantage of the STRAVA data set is the high temporal resolution. However, it is clear that the dataset has to be carefully chosen to fit the research questions due to the limitations mentioned above.
6.1.4 Assessing uncertainty in recreation use accounting and valuation
Above we discussed the likelihood that STRAVA data, even when calibrated against path counters (Venter et al., 2020) are likely to underestimate total recreational use of outdoor spaces in urban landscapes of Oslo. This raises the question of the robustness of physical ecosystem service accounting data. Accounting for urban recreational use of open space is very challenging because there are no official data sources. In this section we used survey data of households self-assessed recreation activity (reported in Cole et al., 2018 and Barton et al., 2015) to compare with calibrated STRAVA data. In order to carry out the comparison we extended the accounting focus to cover all STRAVA mobility reporting within the municipality in 2016, compared to total recreation in any open space as determined from the NORSTAT household survey (Figure 8).
Furthermore, several alternative approaches are available to value recreation monetarily, particularly when municipal ecosystem accounts are not constrained by having to be compatible with national accounting valuation methods (Barton et al., 2019a,b). Using different valuation methods – opportunity cost of time, cost of market substitute (training studio), choice experiment and travel cost methods (Barton et al., 2015) we show the potential range of annual monetary value of recreation services in Oslo municipality (Figure 9).
Figure 8 shows that NORSTAT survey data and STRAVA data show similar aggregate recreation use of open spaces in built area (paths and roads with vegetation), while STRAVA data provides estimates that are orders of magnitude lower than household self-reported recreation in Marka areas. STRAVA trips lengths are also typically shorter in greenspaces than what is revealed by recreation surveys (Barton et al., 2015; Gundersen et al., 2015).
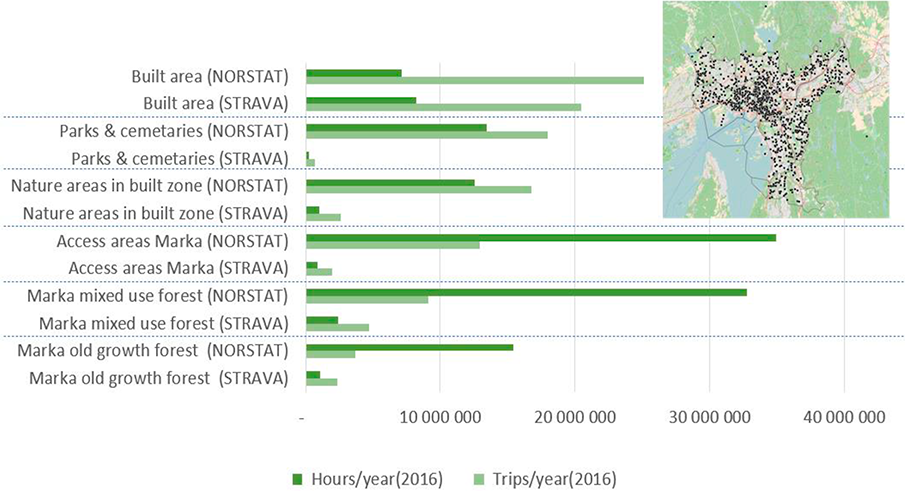
Figure 8. Comparison of visitation frequency and time in open spaces in Oslo municipality based on household survey data by NORSTAT and STRAVA mobility data. Note: This figure includes aggregated and de-identified data from Strava Metro, scaled to estimated total visitation frequencies using third party data. Source: NORSTAT survey data from Barton et al. (2015) and STRAVA data prepared by Zander Venter, NINA.
Figure 9 applies the range of recreation use data to different monetary valuation methods. The simple unit value estimates are for illustration purposes – further work could differentiate estimates by recreation user types and value estimates would be periodically updated. Using the illustrative estimates, we observe that the highest estimate of 15.3 billion NOK/year is obtained by combining user recreation time data derived from household and recreation survey data, with valuation of the opportunity cost of time. The most conservative estimate of 528 million NOK/year is obtained by using STRAVA training app data combined with an estimate of the cost of training in a gym instead of outdoors. The latter valuation estimate is based on exchange value and would be accounting compatible. The other valuation methods are based on consumer surplus measures, or valuation of household time, and are not considered accounting compatible by SEEA EA (Barton et al., 2019a).
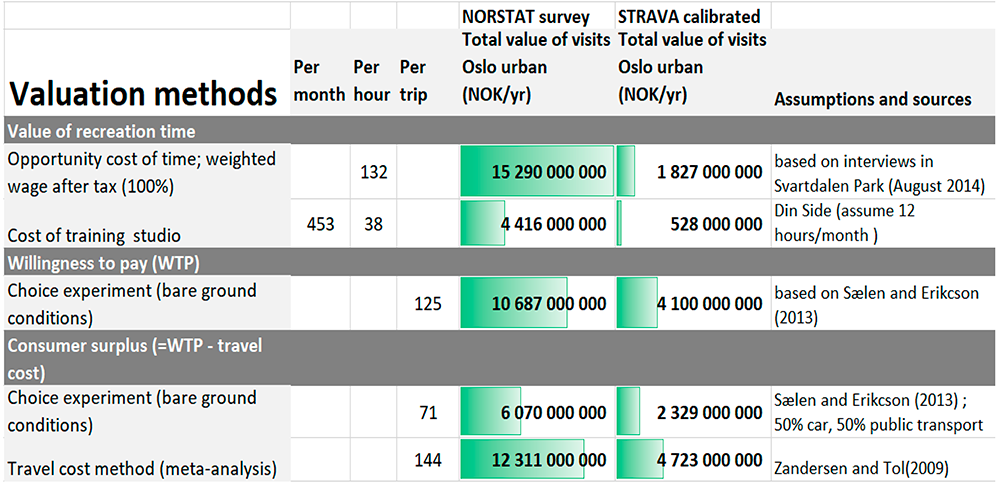
Figure 9. Range of monetary value of recreation in Oslo Municipality in 2016 based on either household survey data or STRAVA mobility data, and alternative monetary valuation methods.
This smaller exchange value estimate versus welfare-based value estimates is expected but presents a municipality with a dilemma if it is carrying out ecosystem accounting to raise awareness about the importance of ecosystem services, while also trying to implement valuation practices used in national accounts to calculate GDP.
6.1.5 Other data sources and ways forward
Regarding Figure 9, our expectation was that STRAVA calibrated by/scaled up to a population estimate by path counters would underrepresent recreation in the built area and parks in the built zone if total use is higher than at access areas to Marka. We saw this bias relative to the visitation rates based on survey data. However, we expected that calibrated STRAVA data may overrepresent recreation in Marka mixed use and old growth areas. We did not see this - survey data gave substantially higher visitation estimates for all these areas. A possible explanation is that we did not correct the survey data sufficiently for overreporting that is known to occur with self-reported visitation (we adjusted visitation rates down by a factor 1.5; Cole et al., 2018. Neither the mobility data nor the household survey data represent actual recreation use. There is reason to believe that they represent opposite ends of a range and that the actual use is somewhere in between. This can be tested in future with access to mobile phone position data from mobile phone operators with a larger and more representative population coverage than STRAVA app users. The drawback of mobile phone data relative to STRAVA data is that position statistics is aggregated to grid cells whose size/granularity depends on residential population density (Figure 10). There is therefore a tradeoff between the very high spatial resolution of STRAVA data (but under-representing the total population) and mobile phone position data which is more representative of temporal mobility trends in the total population but has low spatial resolution and cannot identify in what type of recreation area mobility took place. In future, it may be possible to find intercalibration approach that borrow power from the best aspects of each dataset.
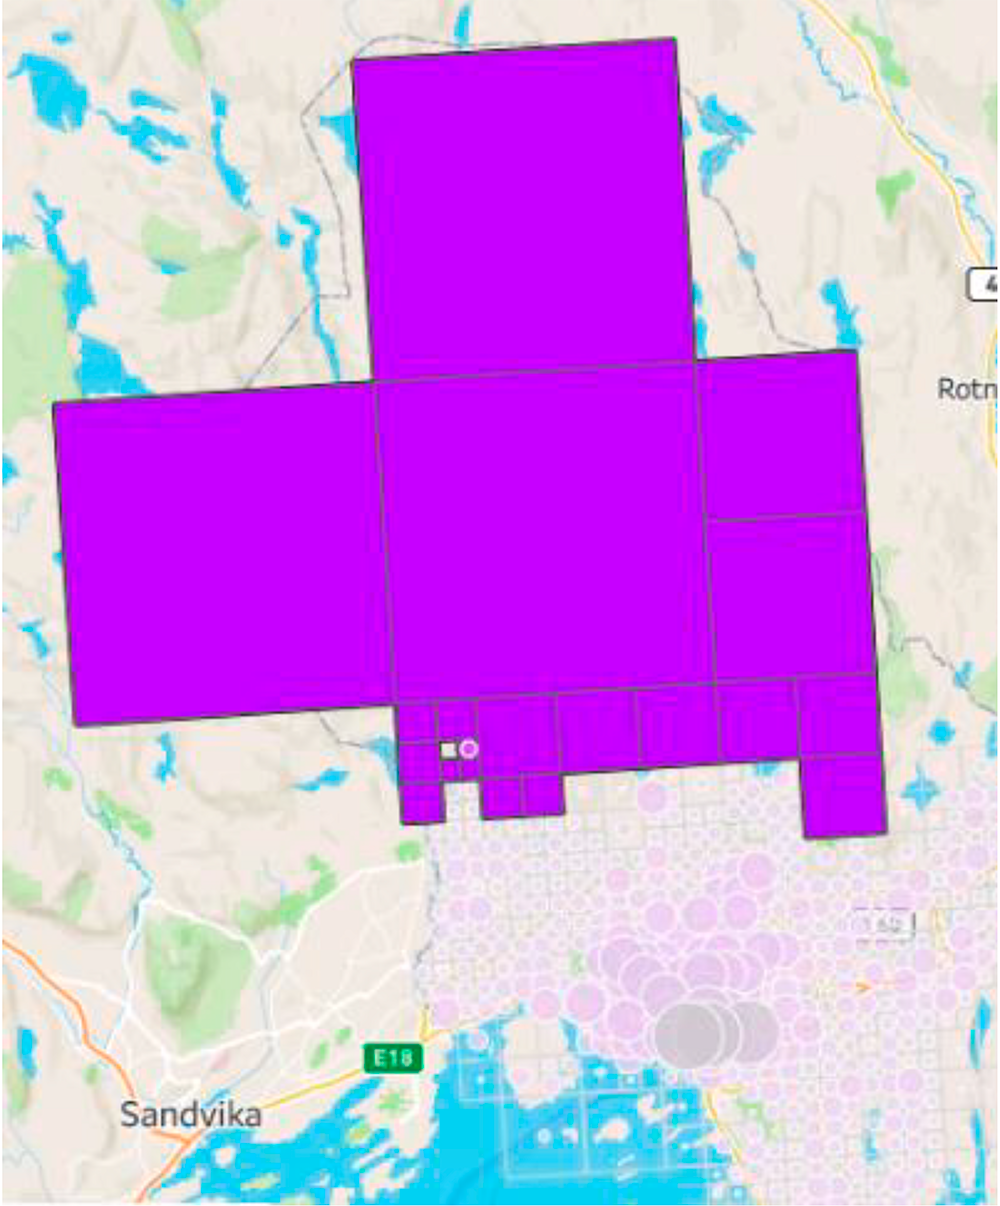
Figure 10. An example of Telia mobile phone statistics grid cells for the Nordmarka peri-urban forest and comparison with grid cell resolution in the built area (represented by ovals). Source: courtesy of Beredskaps-etaten, Oslo Kommune.
6.2 Pirkkala municipality
6.2.1 Extent of forest ecosystems
The municipality of Pirkkala is widely covered by forests which have both biodiversity and recreational ecosystem service values. Pirkkala’s location next to the big city of Tampere causes urban development pressures as well as forest use pressure which make the extent account of forests very relevant to the municipality. The Finnish Forestry Centre’s gridded forest resource data was selected as a data source for the forest extent account because (i) it provides the most complete coverage of forest ecosystems in Pirkkala (regardless of their ownership or protection status), (ii) has higher resolution than National Forest Inventory data (and has less uncertainties at forest stand level), (iii) is continuously being updated and (iv) has many forest parameters that could be used for assessing ecosystem condition and supply of ecosystem services later on. In this dataset, forests are separated by fertility class, which is a common way in Finland to classify forest types based on their species communities and habitat fertility.
SYKE together with Pirkkala municipality did some modifications to the original data set. First, a set of additional herb-rich forests – especially biodiverse and valuable ecosystems - (totaling 20.8 hectares) missing from the data were identified with expert local knowledge of Pirkkala municipality, and these were added to the Finnish Forestry Centre data by reclassification. Second, the data was updated to comply to the recent land cover changes, i.e. to represent the actual forest cover extent in the year 2021. Existing and latest GIS data on road network and buildings (data from Pirkkala municipality and the National Land Survey) were overlaid with the forest data, and any overlapping areas were reclassified as non-forest. Third, we did additional geospatial analysis to get information on forest ownership and protection status. Dataset on land ownership from Finnish cadastral data (National Land Survey), classified by economic sectors, was intersected with the forest extent data. Similarly, data on protection status (publicly and privately protected sites) was intersected with the forest extent data.
Results of the Pirkkala forest extent for the year 2021 (broken by economic sector, only opening extent given) are shown in Table 7. Spatial distribution of the forest types is shown in Figure 11.
Table 7. Pirkkala forest ecosystem extent account 2021. Units in hectares.
| Ecosystem type | Herb-rich forests | Herb-rich heath forests | Mesic heath forests | Sub-xeric heath forests | Xeric heath forests | Barren heath forests | Forests on rocky terrain | Total (ha) |
| Opening extent by economic sector | ||||||||
| Non-financial corporations (S.111) | 2.9 | 201.6 | 253.7 | 15.9 | 2.7 | 0.2 | 1.4 | 478.3 |
| Housing corporations (S.112) | 0.0 | 4.1 | 4.0 | 0.5 | 0.3 | 0.4 | 0.0 | 9.3 |
| Financial and insurance corporations (S.12) | 0.0 | 0.0 | 0.0 | 0.0 | 0.0 | 0.0 | 0.0 | 0.1 |
| Central government (S.1311) | 1.0 | 115.0 | 177.4 | 38.4 | 1.2 | 0.1 | 0.2 | 333.3 |
| Local government (S.1313) | 19.0 | 358.7 | 524.3 | 40.6 | 7.5 | 2.4 | 2.1 | 954.6 |
| Households (S.14) | 29.0 | 1 184.8 | 1 696.5 | 115.6 | 18.6 | 3.6 | 3.1 | 3051.2 |
| Non-profit institutions serving households (S.15) | 0.0 | 5.1 | 2.1 | 0.0 | 0.0 | 0.0 | 0.0 | 7.2 |
| Owner unknown | 0.9 | 75.1 | 96.8 | 14.2 | 10.9 | 0.4 | 0.6 | 198.8 |
| Total | 52.7 | 1 944.4 | 2 754.8 | 225.2 | 41.3 | 7.1 | 7.4 | 5 033.0 |
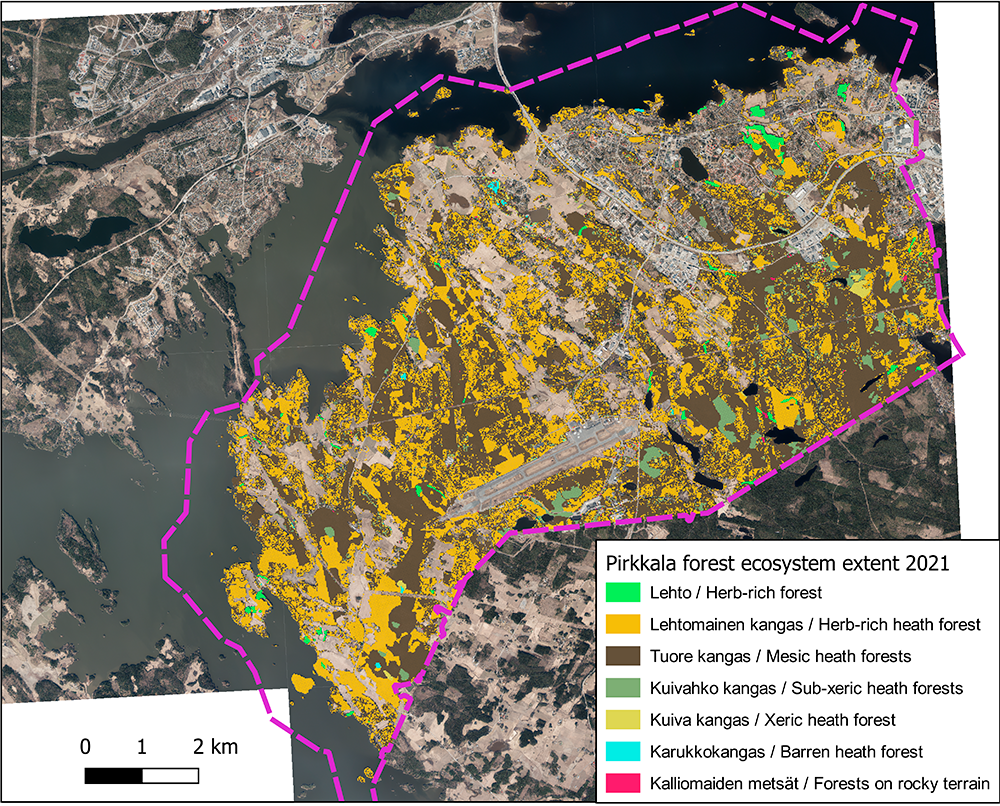
Figure 11. Pirkkala forest ecosystem extent map. Gridded forest data from Finnish Forestry Centre (CC BY 4.0), background aerial photographs from National Land Survey of Finland.
6.2.2 Monetary supply and use account of recreational services
To compile the monetary supply and use account of recreational services provided by Pirkkala’s forest ecosystems, we applied the benefit transfer approach to estimate the value of recreational services based on the extent account. The benefit transfer approach, which uses an estimated value from another or several other study site(s) for the target site with some adjustment, is commonly applied in valuing ecosystem services when the primary valuation at the target site is difficult to conduct (Brander, 2013). Here, the target site refers to Pirkkala municipality, and the estimated values of visits to forests in Pirkkala were derived from other sites based on Grammatikopoulou & Vačkářová (2021).
The benefit transfer approach is one of the recommended approaches in SEEA EA (UN, 2021). For the purpose of ecosystem accounting, the most suitable method is to apply the transferred value with the physical unit of ecosystem services. In the case of recreational services, this means that the transferred value should be in terms of EUR/visit estimated in other forest recreational studies and be multiplied with the number of visits to the forests in Pirkkala. However, the physical unit of the recreational services (i.e. total number of visits to the forests) was challenging to estimate in Pirkkala (see more discussion in chapter 7). As forest extent is the only available information at this stage, we applied the benefit transfer approach with the unit value in terms of EUR/ha of forest, which also has been applied in another ecosystem accounting application (Grammatikopoulou & Vačkářová, 2021).
Grammatikopoulou & Vačkářová (2021) estimated a meta-analysis benefit transfer function based on 30 forest ecosystem services studies from European countries, including the studies on forest recreational services. In this pilot project, we directly applied the function of the coefficients estimated by Grammatikopoulou & Vačkářová (2021). Figure 12 shows the procedures and the variables required for applying the function, and the data sources of the variables (e.g., protected and non-protected forest areas, GDP per capita in Finland, population density of Pirkkala) for the case of Pirkkala. After the unit value was estimated by the function, the supply accounts could be compiled based on the areas of protected and non-protected forest types.
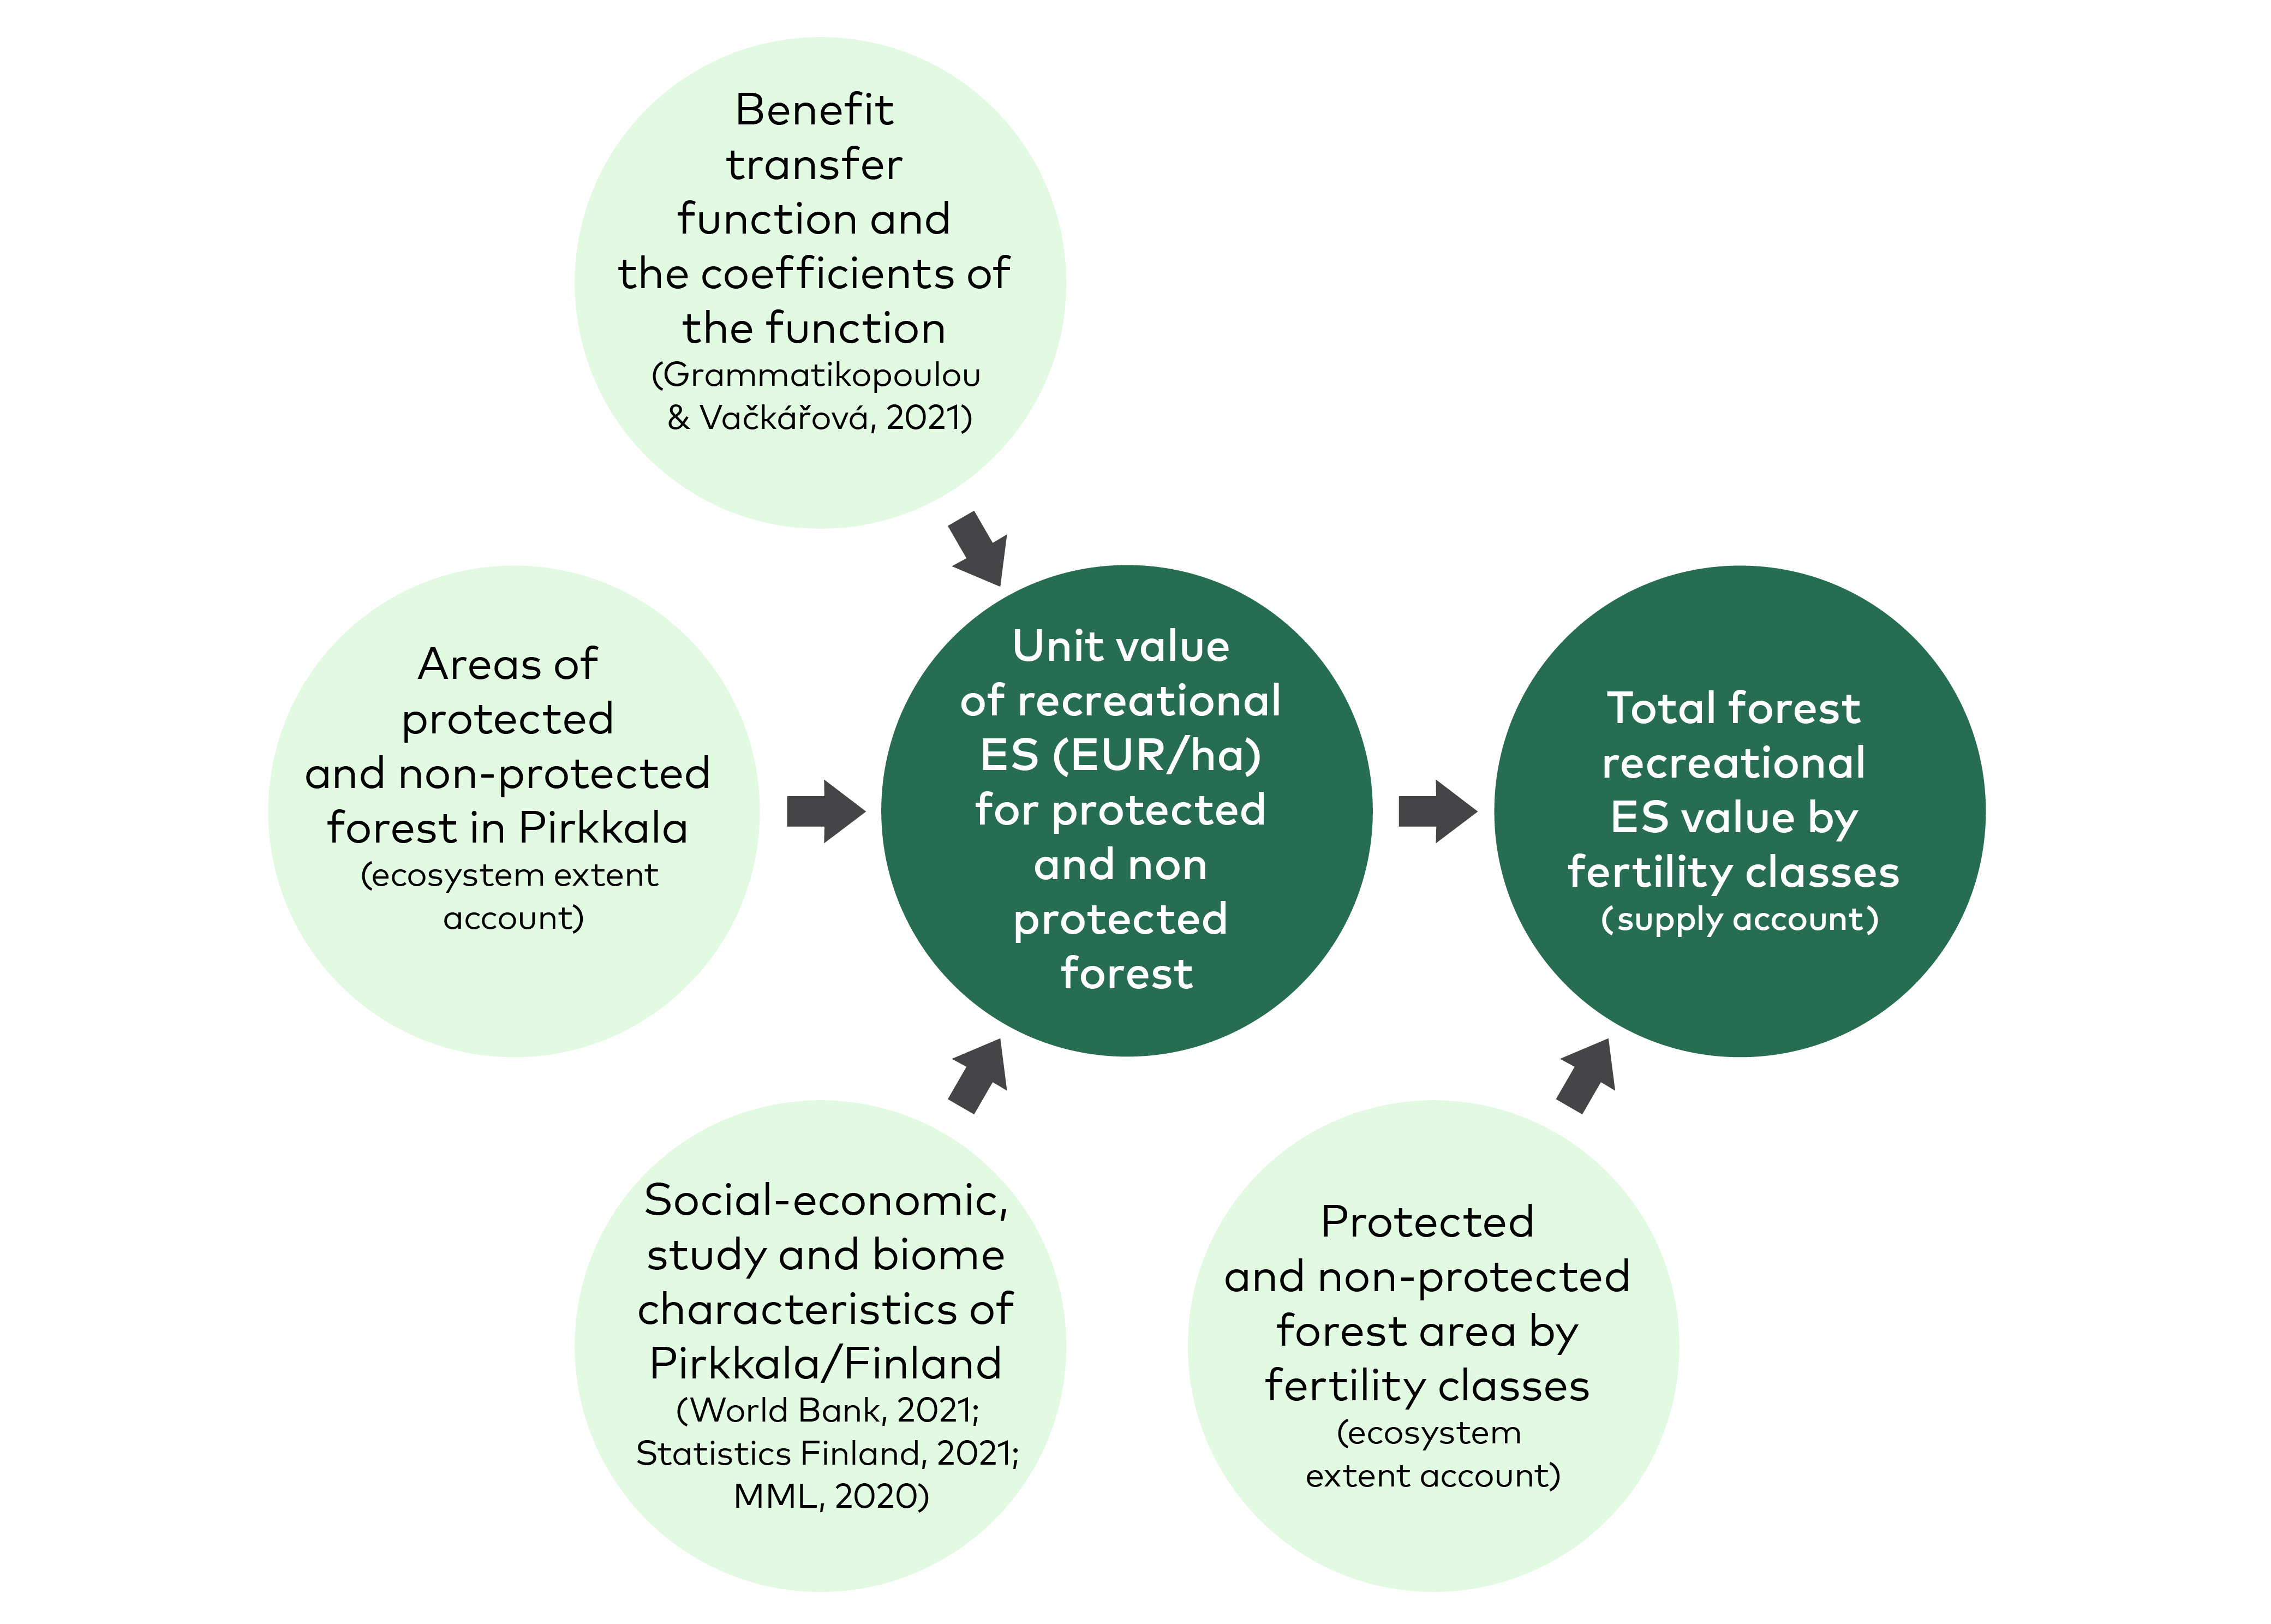
Figure 12. Procedure and data sources to estimate the value of forest recreational services.
Table 8 shows the monetary supply and use table of recreational services provided by Pirkkala forest ecosystem assets. In the supply side, it shows the recreational value of different forest types, following the extent account. In the use side, all the recreational services of forests are used by the households. Without the estimation of the number of visits to the forest (physical units of recreational services) and the sources of visitors, the estimated recreational value can only be shown in an aggregated form that is used by the households who live in and outside the Pirkkala municipality.
Table 8. Monetary supply and use account of recreational services provided by forest ecosystems in Pirkkala in 2020. Units are in thousand EUR. Rows show the ecosystem service types that are recorded, which need to be duplicated under both supply side and use side. It is possible to include several ecosystem service types in the same table, but there is only one ecosystem type in this case. In column, the first part is the use table that shows the amount (value) of ecosystem services used by different economic units (in this case, household is the only economic unit); the second part is the supply table that shows the amount (value) of ecosystem services provided by different forest ecosystems (ecosystem assets) aligning the same classification as in the ecosystem extent account.
| Economic unit | Ecosystem asset | |||||||||
| Household | Forest ecosystems in Pirkkala | |||||||||
| In Pirkkala | Outside Pirkkala | Herb-rich forests | Herb-rich heath forests | Mesic heath forests | Sub-xeric heath forests | Xeric heath forests | Barren heath forests | Forests on rocky terrain | Total (EUR) | |
| Supply | ||||||||||
| ES1: recreational services | 8-13 | 303-471 | 429-666 | 35-55 | 6-10 | 1-2 | 1-2 | 785-1 218 | ||
| Use | ||||||||||
| ES1: recreational services | 785-1 218 | |||||||||
There are two additional new tasks planned for the next steps. First, the benefit transfer valuation function can be re-estimated with the studies from Nordic countries and include some ecosystem condition indicators if possible. Within the Nordic countries, the function estimated by Grammatikopoulou & Vačkářová (2021) is probably more suitable for municipalities in Denmark and in the southern part of Sweden than for municipalities in Finland, due to its classification of forest types and the studies included in the benefit transfer function (Grammatikopoulou & Vačkářová, 2021; Dinerstein et al., 2017). It is necessary to re-estimate the function for the Finnish municipalities as well as other municipalities in the Nordic countries. In addition, if other approaches are applicable to estimate the physical unit of the recreational services (see the approach for the case of Helsinki and discussion in chapter 7), the valuation from this benefit transfer function and the valuation based on the unit of ecosystem services, rather than ecosystem extent, can be compared to current approach.
6.3 City of Tampere
6.3.1 Ecosystem extent based on land cover classes
The city of Tampere wanted to account for the extent of all ecosystem types. For that purpose, the ecosystem extent account was compiled using Corine land cover (CLC) data 2012–2018 from SYKE at 20 m spatial resolution. Although a very high resolution (0.5 m) land cover map compiled by the city of Tampere was also available (https://kartat.tampere.fi/oskari), its spatial coverage was not large enough to cover all watersheds within the city, which was a prerequisite to model urban stormwater management ecosystem service supply as another ecosystem account.
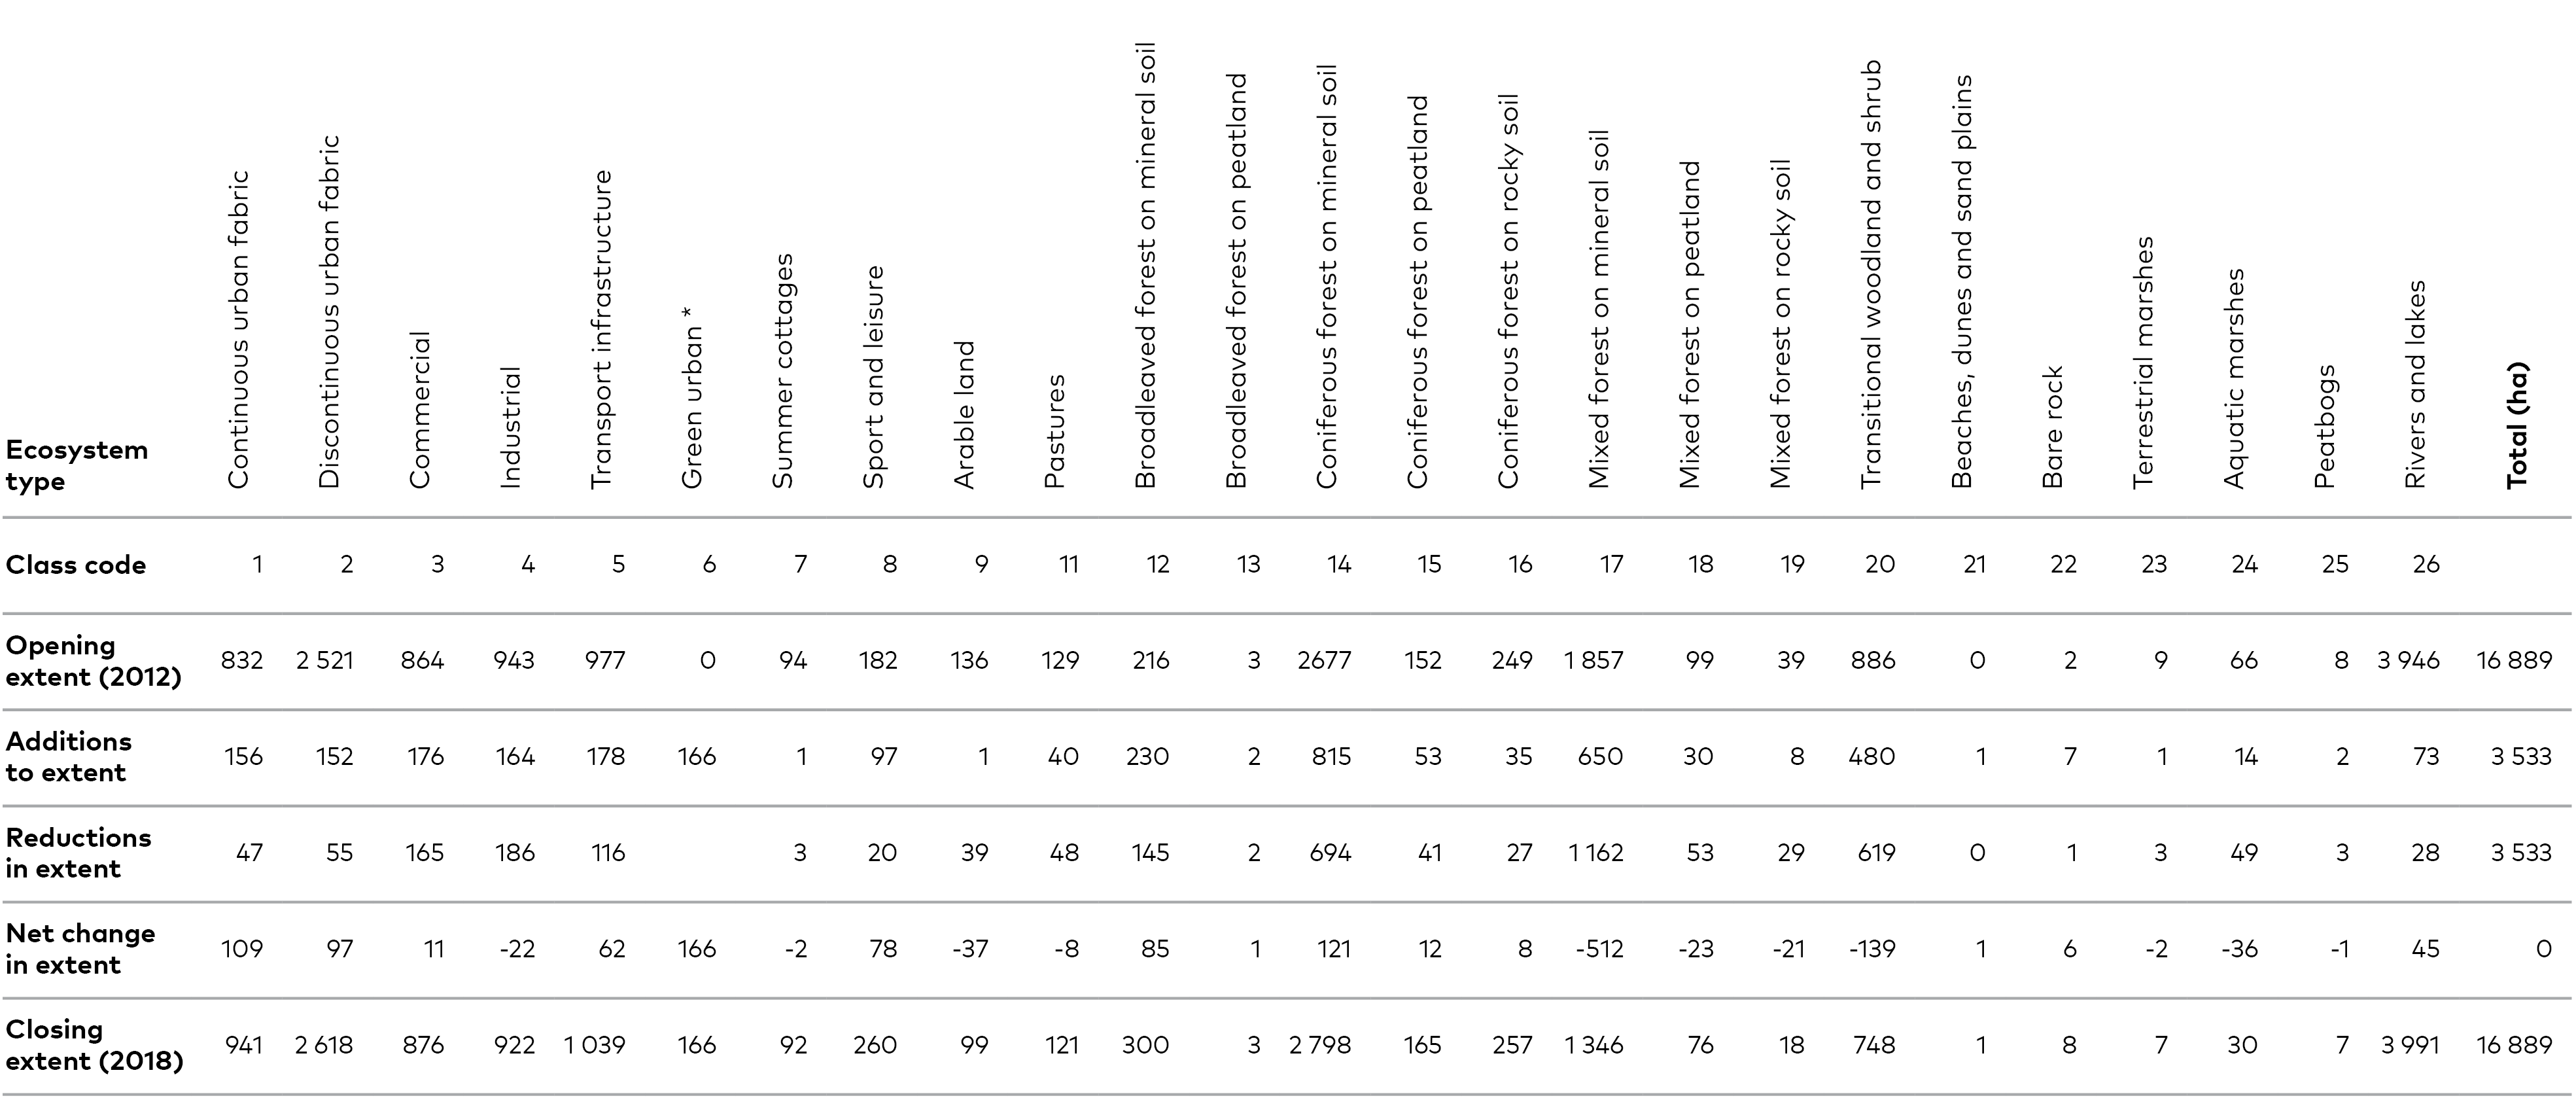
The CLC data from 2012 was used for opening extent and 2018 for closing extent (Figure 13). Both datasets were first simplified (reclassified) from 47 classes to 26 classes. The ecosystem type change matrix (not shown), with detailed from-to ecosystem type change information, was calculated with “Cross-classification and tabulation” tool in SAGA. Data from the change matrix were then used to fill in the opening extent (2012), additions, reductions and net change in extent (2012–2018) and closing extent (2018) of the ecosystem extent account (Table 9).
Based on the calculated net change in the extent the biggest negative changes have taken place in different mixed forests. On the other hand, the extent of coniferous forests has increased most but, interestingly, both additions to and reductions in the extent have been big. In addition, the extent of both continuous and discontinuous urban fabric has grown. It is important, however, to notice that the changes in the extent may result from data inaccuracies instead of actual changes in the extent (this is discussed more in Chapter 7.1).
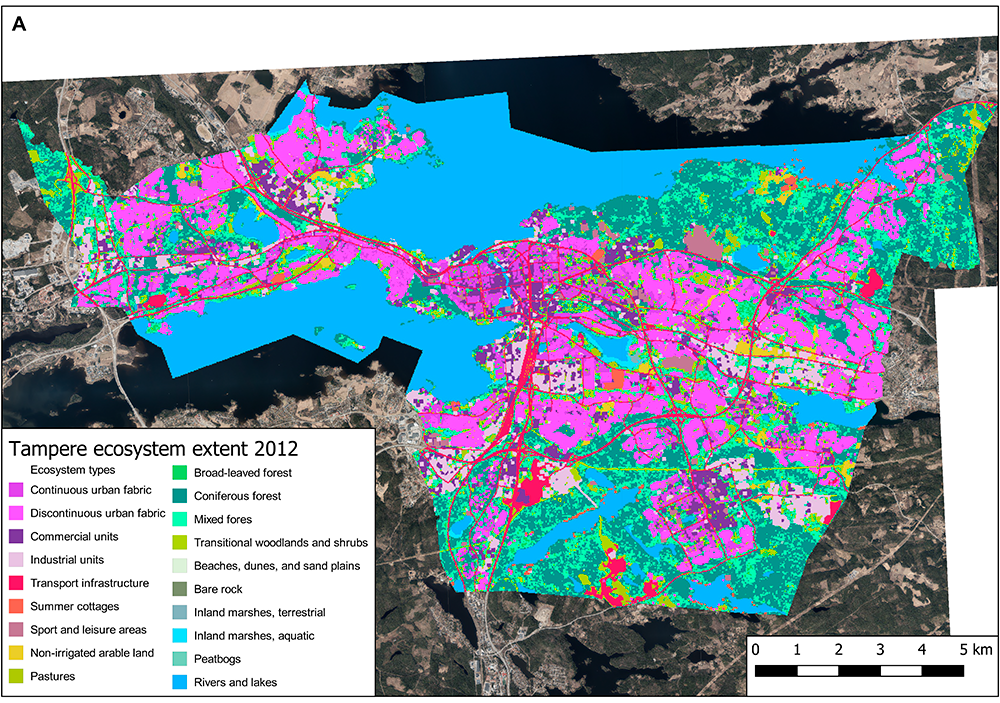
Figure 13. Tampere ecosystem extent in 2012 (A) and 2018 (B). CORINE land cover data from SYKE (CC BY 4.0), background aerial photographs from National Land Survey of Finland.
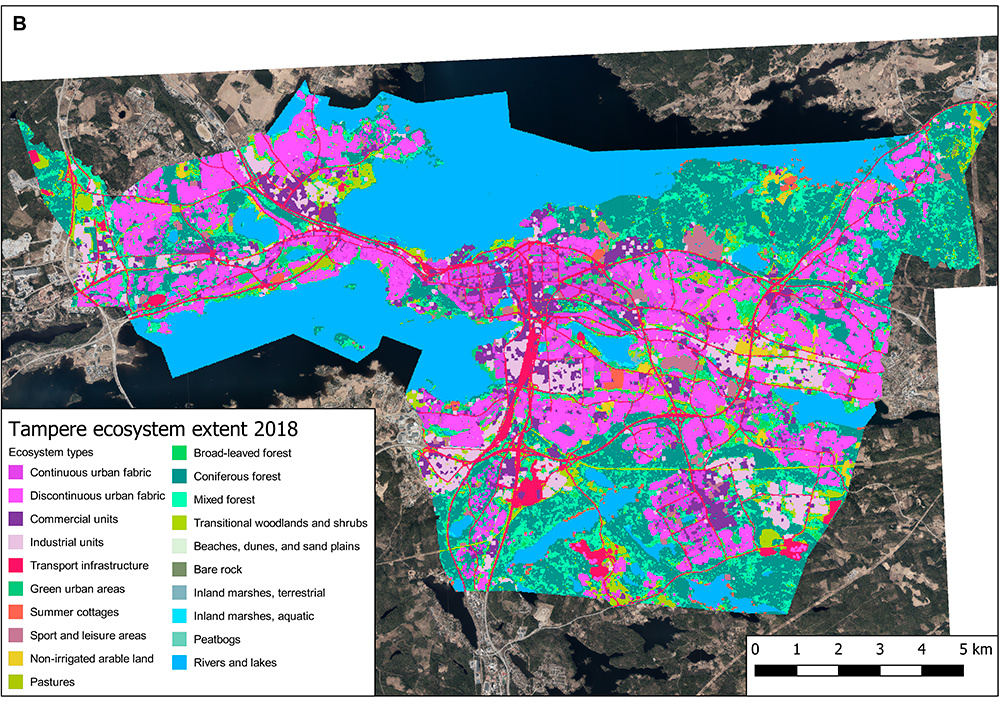
Table 9. Tampere ecosystem extent account 2018. Ecosystem types are in columns. In rows are the opening extent (total area of ecosystem assets for the ecosystem type at the beginning of the accounting period, 2012, in hectares), additions to extent (increases in the area of an ecosystem type, 2012–2018, in hectares), reductions in extent (decreases in the area of an ecosystem type, 2012–2018, in hectares), net change in extent (the difference between additions and reductions, 2012–2018, in hectares), and closing extent (total area of ecosystem assets for the ecosystem type at the end of the accounting period, 2018, in hectares). Note that green urban* was not mapped in CLC 2012.
6.3.2 Physical ecosystem service supply assessment of stormwater management
Events of heavy rain (i.e. stormwater) may be especially problematic in built-up areas where there is less permeable areas and rainwater cannot infiltrate into the ground. In addition, the type and condition of soil affects the infiltration capacity of permeable areas. Green and water areas mitigate stormwater events by delaying water’s movement and by reducing the amount of water running on the surface by infiltrating water into the ground (service called runoff retention). Excess runoff water and pooling may cause damages to property, transport infrastructure and even people. Along the climate change Finland is predicted to have more rain and more extreme weather events meaning that the stormwater mitigation service becomes even more important in time.
We used the InVEST Urban Flood Mitigation Model to calculate the amount of stormwater runoff reduction over the municipality of Tampere due to the presence of green and forested areas. The model uses the US soil conservation service curve number (SCS-CN) and the land-use/land-cover (LULC) characteristics to estimate the runoff (Q). The curve number method is a wide and efficient approach for determining the approximate amount of runoff from a rainfall event based on the hydrologic soil group, land use, treatment and hydrologic condition of a particular area. The model also calculates the runoff retention index that is directly proportional to both the mitigation services provided by the green spaces and the direct economic damage avoided due to the floods. The primary inputs to the model are a watershed vector, a raster of the land use and land cover (LULC) classes, a raster layer of hydrologic soil groups, depth of rainfall in mm (i.e. value of a maximum precipitation event at a certain percentile), and a biophysical table containing the curve number (CN) values for each of the LULC classes and each hydrologic soil group (Figure 14, Table 10).
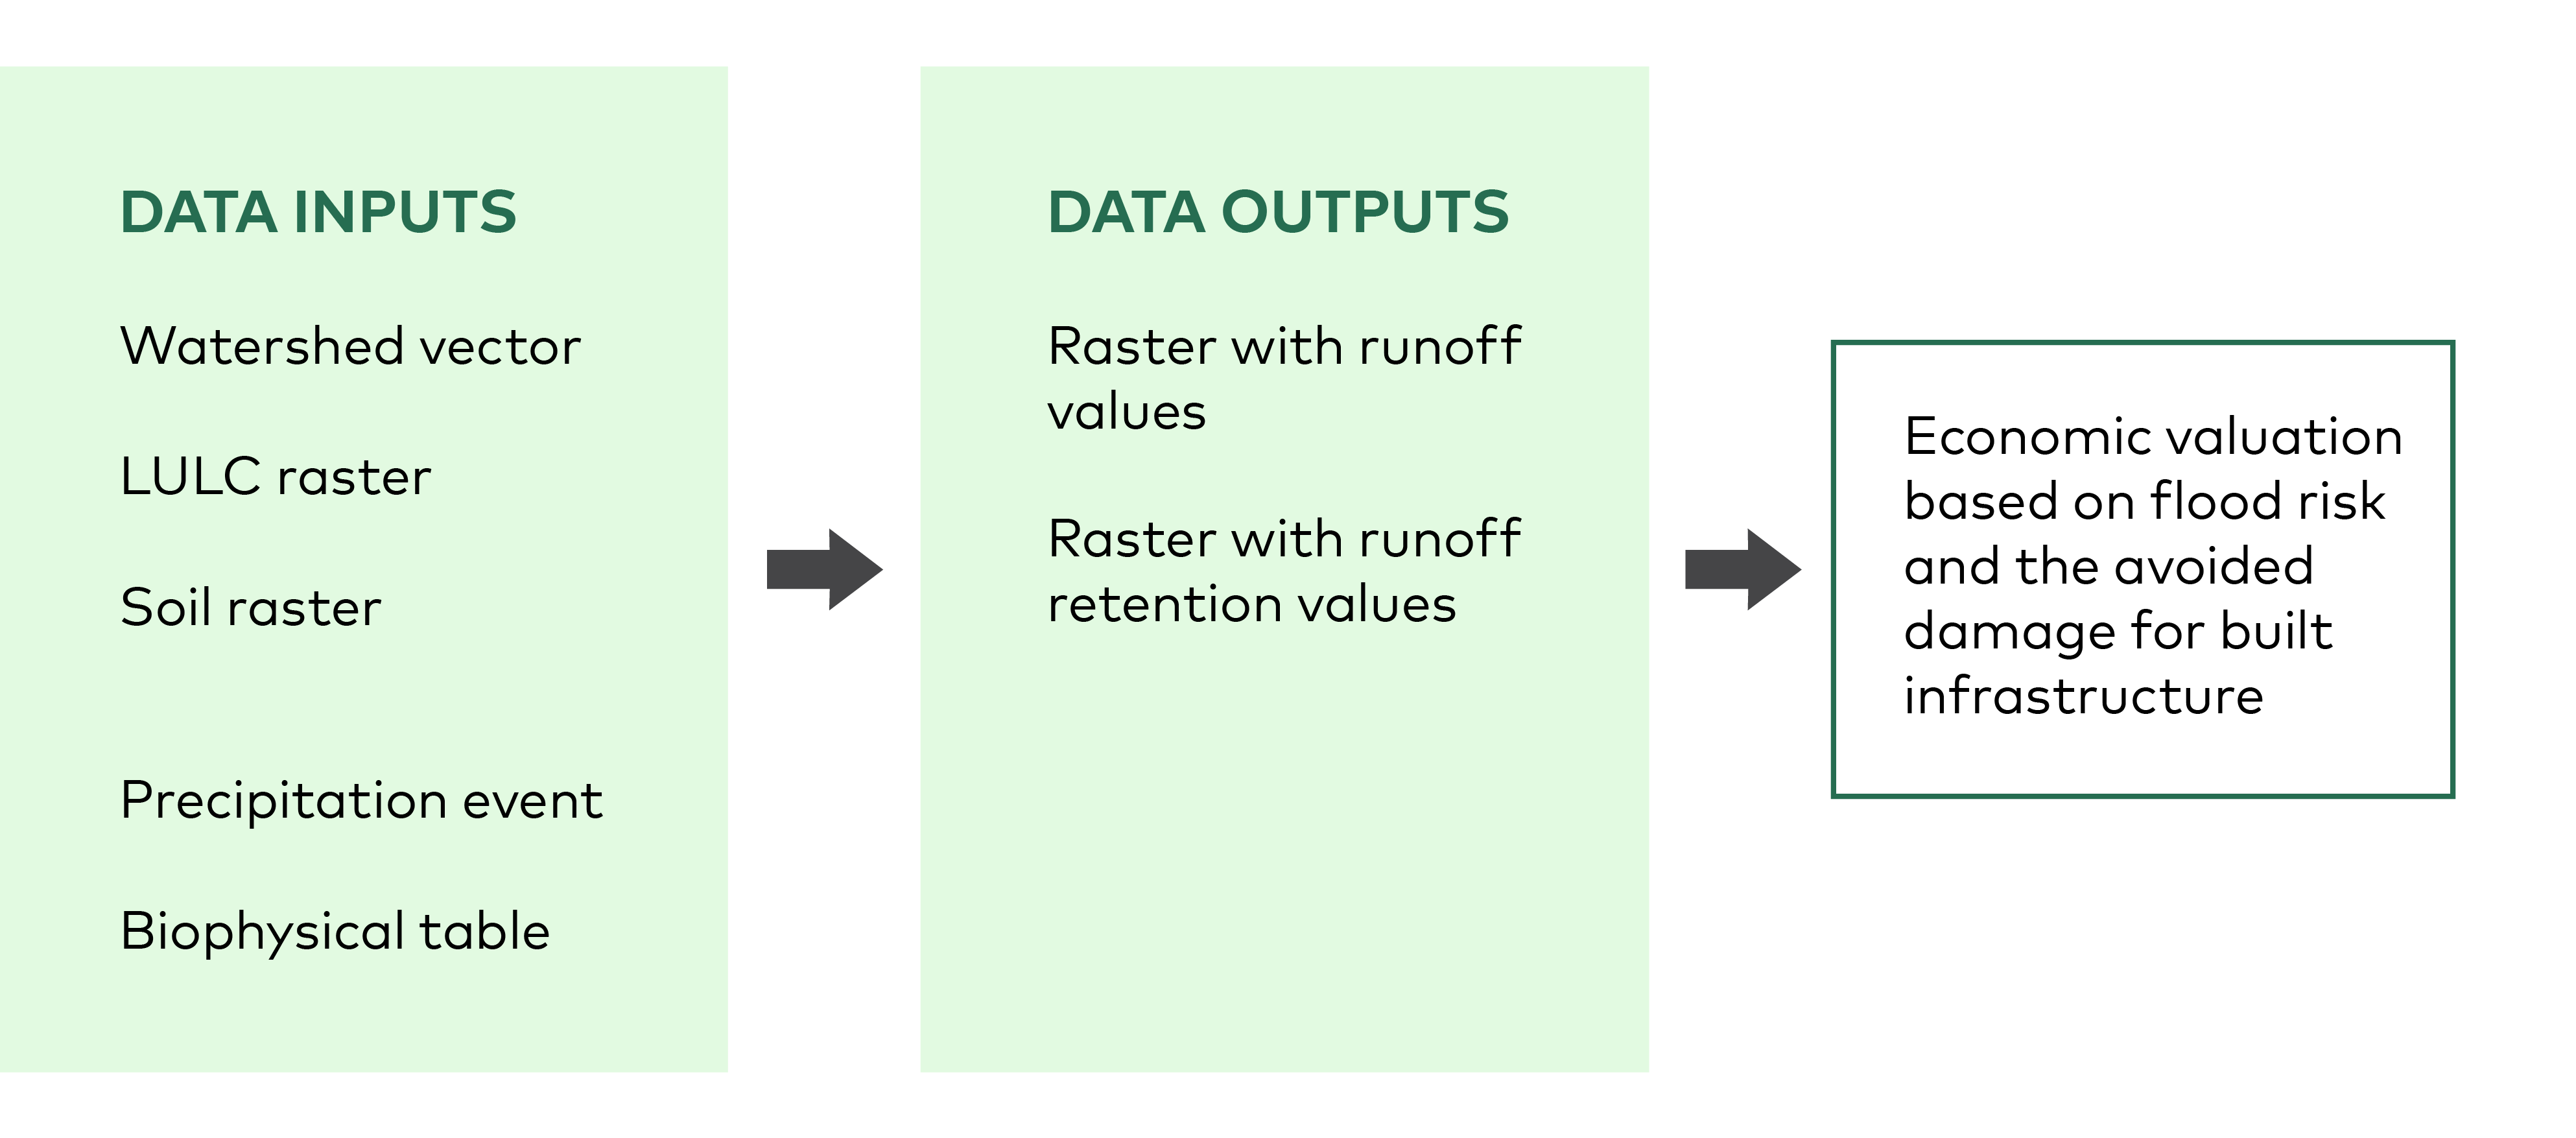
Figure 14. Conceptual model of the InVEST Urban Flood Mitigation Model.
Table 10. Characteristics of the input data for the urban flood mitigation model.
| Data | Format (unit or scale) | Spatial resolution | Source |
| Watershed of interest | vector | 1: 50 000 | SYKE (2021) |
| Depth of rainfall | mm | 24 mm | |
| LULC | raster | 20 m | CLC (SYKE 2018) |
| Hydrologic soil group | raster | 20 m | Geological survey of Finland Soil Map |
| Curve number values | constant | not applicable | NRCS-USDA Part 630 Hydrology National Engineering Handbook, Chapter 9 Hydrologic Soil-Cover Complexes. 2004. |
| Built infrastructure | shapefile | 1:5 000 - 1:10 000 | Topographic Map Database, National Land Survey (2021) |
We reclassified the soil raster, based on the particle size, to match the four hydrological classes (A, B, C, D), where A has the least runoff potential and D has the most. We also reclassified the 48 CLC classes in 26 groups and we derived curve number (CN) values for each LULC type and each hydrologic soil group from the USDA[1]USDA = United States Department of Agriculture, https://www.usda.gov handbook: (NRCS-USDA, 2007 Chap. 9). The model was calibrated using data collected from the hydrological station 031 (61.66449, 24.34379) located in the watershed Oriselkä. The hydrological station 031 collects measurements related to an area of 1.5 km2. For the calibration we used hourly precipitation and runoff data. For the precipitation depth (mm) we selected a precipitation event that occurred on 3 July 2018 with 16.5 mm of rain in a four-hour event. This precipitation event was selected because it was at least 2-standard deviations from the precipitation mean of the time-period considered (1 January 2018 to 17 February 2021), i.e. an exceptional rain event which represents the demand for stormwater mitigation service. Assuming that there was a lag time between the precipitation event and the run-off/discharge measured by the gauge 031, from the hydrograph we considered the discharge of 5.5l/s/km2.
The volume of runoff for the entire watershed for the selected event was calculated by multiplying the runoff 5.5 (l/s/km2) * 1.5 km2 * 86400 (seconds/day). To estimate the runoff produced by the precipitation event we subtracted the volume of baseflow, defined by the runoff at the end of a period when there has not been any precipitation for a long time. The observed runoff volume was compared with the volume of runoff estimated by the InVEST model. The curve number coefficients were adjusted during calibration to improve the performance of the model. The model quantified in terms of run-off retention volume (m3) the flood mitigation by the urban green spaces and forested areas (Figure 15). The runoff retention is directly proportional to the mitigation services provided by the green spaces. The higher retention values are observed over areas with a high green cover (i.e., urban green areas, forested areas, woodlands). The areas characterized by impervious surfaces (red areas) presented the lower retention benefits and as a result are the areas with more runoff.
Footnotes
- ^ USDA = United States Department of Agriculture, https://www.usda.gov
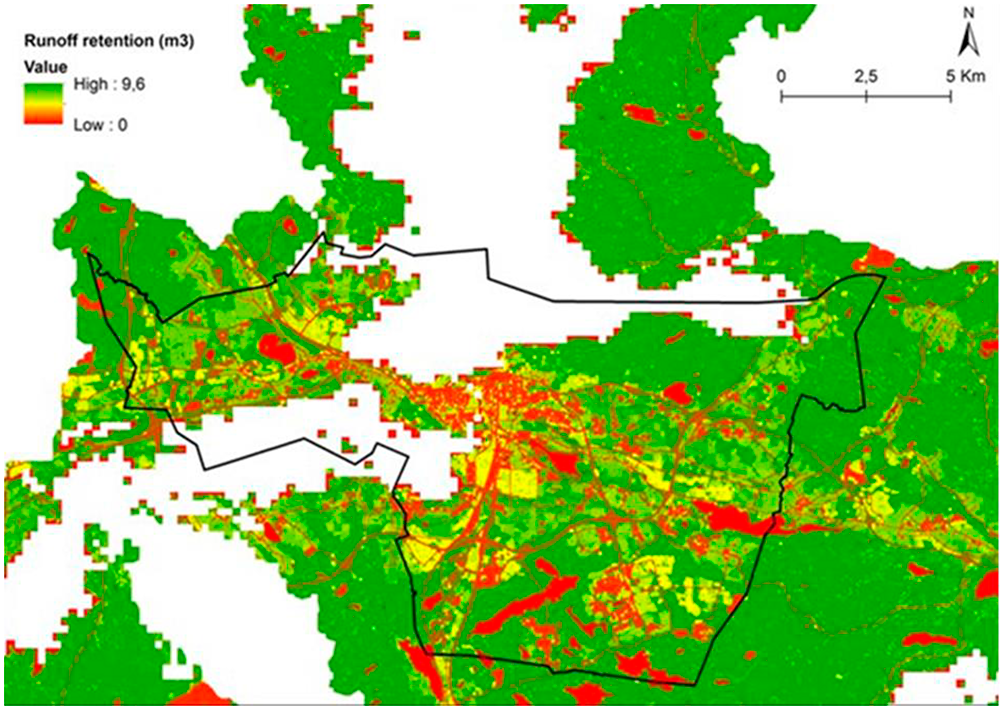
Figure 15. Runoff retention volume (m3) calculated by the InVEST model for the city of Tampere. The areas in green covered by vegetation provide the highest runoff retention service, considered as the proportion of precipitation that is retained by the vegetation and soil and which does not become runoff. This map has been generated using as a data source Corine 2018 © SYKE (partly LUKE, MAVI, LIVI, DVV, EU, NLS Topographic Database 01/2017) and the Superficial deposits map 1:20 000 (C) Geological Survey of Finland, CC Attribution 4.0.
The InVEST model also calculates the runoff production (mm) based on the precipitation event and the land use and land cover characteristics (Figure 16). Within the study area, impervious surfaces characterized by constructed and sealed surfaces, such as buildings, sidewalks, roads and parking lots, prevent precipitation from infiltrating into the soil. These areas generate the highest amount of surface runoff. Lakes can help prevent flooding by harvesting stormwater and reducing the volume of runoff across the drainage catchment. The next step would be to clarify the important regulating services provided by urban freshwater systems in buffering extreme events.
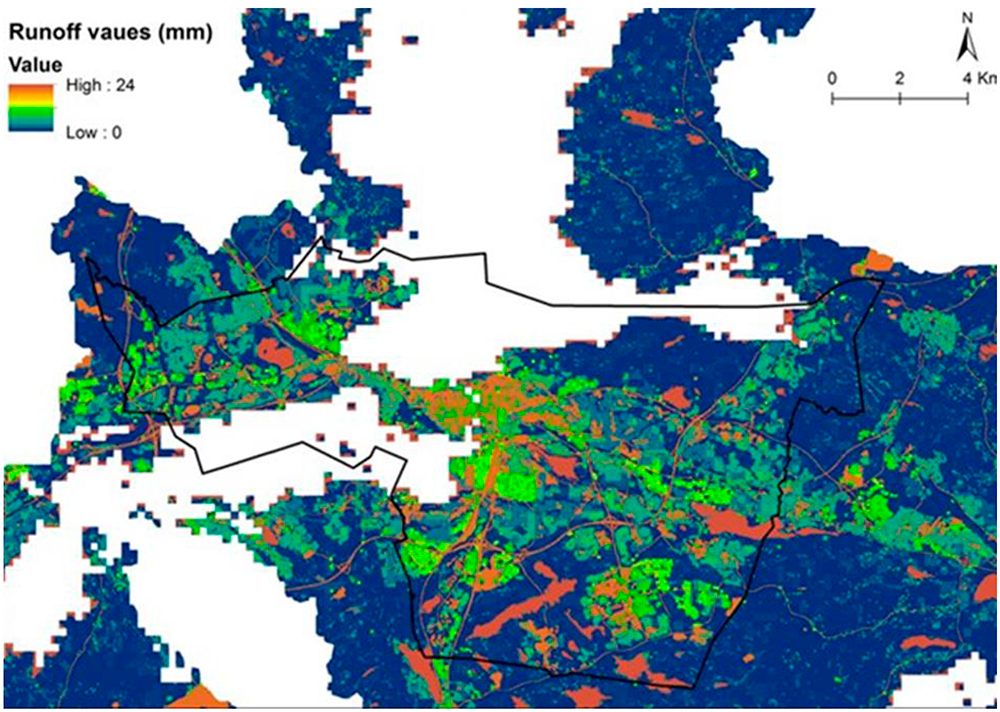
Figure 16. Runoff production (Q) in mm estimated by the InVEST model per-pixel based on the precipitation (P in mm) and land use and land cover. The orange areas are covered by impervious surfaces and generate higher amount of surface runoff than areas in blue covered by vegetation. This map has been generated using as a data source Corine 2018 © SYKE (partly LUKE, MAVI, LIVI, DVV, EU, NLS Topographic Database 01/2017) and the Superficial deposits map 1:20 000 (C) Geological Survey of Finland, CC Attribution 4.0.
6.3.3 Physical ecosystem service supply and use account of stormwater mitigation
The areas where runoff retention is above zero benefit from the flood / stormwater mitigation service which prevents suffering from the predicted maximum height of the flood during flood events. The services are possibly fully provided (where Q is 0) or partly provided (where Q is smaller than the maximum height). There are areas which, due to this ecosystem service, may not have concrete economic loss or, in the worst case, mortality when a flood event takes place. Therefore, the runoff retention above zero can be interpreted as potential supply of the service.
Physical ecosystem service supply and use account should record the actual services rather than the potential supply of the services. Therefore, it is necessary to overlay three layers: (1) areas where runoff retention is above zero, (2) building footprints, and (3) raster of land cover types the production of which may be lost due to flood events and the extent of which should thus be used for the ecosystem extent. By overlaying (1) and (2) the areas or the number of buildings and infrastructure benefiting from the ecosystem service can be estimated. By overlaying (1) and (3) the areas of different land cover types that benefit from the services can be estimated. By overlaying (1), (2), and (3) it is possible to understand the benefits that are provided by different ecosystem types. Figure 17 shows the procedures of compiling a physical ecosystem service supply and use account based on the results of extent account and InVEST model results. After the supply of actual ecosystem service is estimated, it is necessary to allocate the actual service to the economic units.
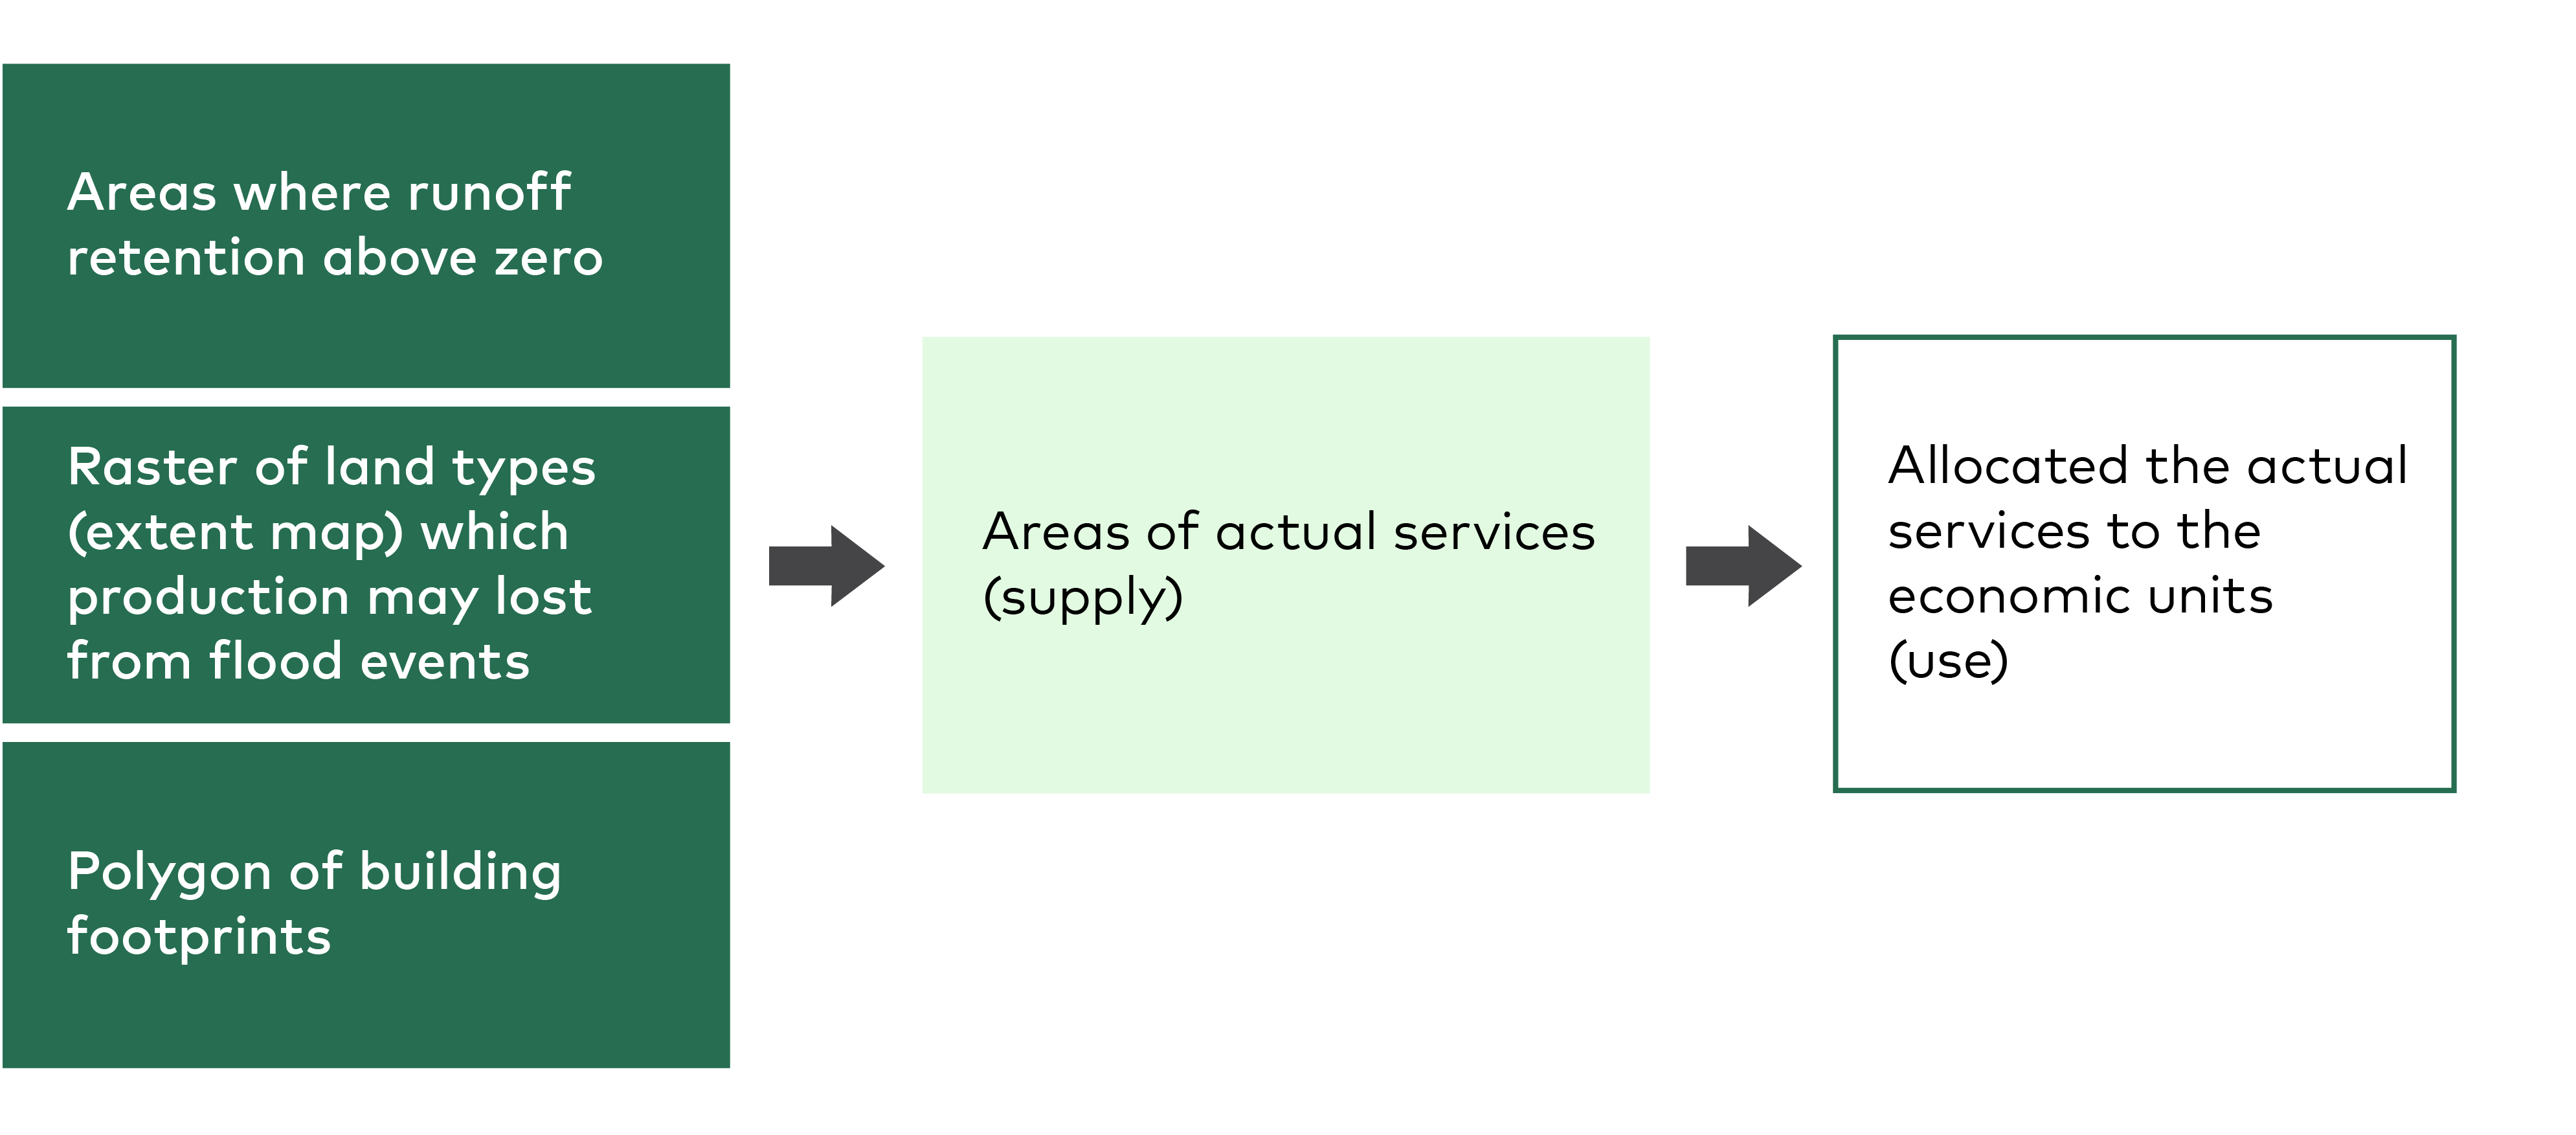
Figure 17. Procedures of the InVEST model and ecosystem extent results used to produce stormwater mitigation service supply and use account.
In the accounting table, economic unit refers to different economic sectors, such agricultural sector, industrial sector, or final demand unit like household or export that uses ecosystem services. Depending on the ecosystem service type, the economic unit that uses the service can vary a lot. Therefore, allocating the actual ecosystem services to the economic units requires a step of linking the ecosystem types and buildings to the economic sectors (Vallecillo et al., 2020). For buildings, building footprint data from Finnish Topographic database (National Land Survey of Finland, CC BY 4.0)) include the information of the purpose of use of each building, which can be linked to households (residential and vacation buildings), commercial or public sectors (office or public buildings), industrial sectors, and religion and others. For ecosystem types, the linkage to economic sectors can be found in Table 11. A few issues remain in the linkage step in this pilot study. First, for some building types (office or public buildings) and ecosystem types (continuous and discontinuous urban fabric in Table 11), the data does not provide clear enough links to specific sectors. Moreover, although a link can be found from the forest ecosystem types to the forestry sector, we do not include the actual ecosystem service used by forestry sector. This is because the damage cost function (Huizinga et al., 2017) that we planned to use to value flood mitigation service in the next step does not include economic loss of forest land (but if there are buildings located in the forest land, the actual ecosystem service would be included). In this study, we assume that the economic loss caused by flood events to the forestry sector are minor and can be ignored. We could not find evidence from the literature that short flooding would damage forests in Finland. Excluding the forest land for the supply and use table implies that the potential supply of the stormwater mitigation service of the forest ecosystems cannot be directly revealed and valued. However, the service and value provided by the forest ecosystems can still be revealed by comparing the service and value change based on the forest land extent change over time or in the policy scenario cases.
Table 11. Ecosystem types linked to economic units.
| Ecosystem type | Economic unit |
| 1. Continuous urban fabric | Households and / or Public sector |
| 2. Discontinuous urban fabric | Households and / or Public sector |
| 3. Commercial | Commercial sector |
| 4. Industrial | Industrial sector |
| 5. Transport infrastructure | Transportation sector |
| 6. Green urban | Public sector |
| 7. Summer cottages | Households |
| 8. Sport and leisure | Public sector |
| 9. Arable land | Agricultural sector |
| 11. Pastures | Agricultural sector |
| 12. Broadleaved forest on mineral soil | Forestry sectors, assuming no demand for the services as the loss from the flood events probably are minor and can be ignored |
| 13. Broadleaved forest on peatland | |
| 14. Coniferous forest on mineral soil | |
| 15. Coniferous forest on peatland | |
| 16. Coniferous forest on rocky soil | |
| 17. Mixed forest on mineral soil | |
| 18. Mixed forest on peatland | |
| 19. Mixed forest on rocky soil | |
| 20. Transitional woodland / shrub | |
| 21. Beaches / dunes / sand plains | Nature areas, assuming no demand for the services |
| 22. Bare rock | |
| 23. Terrestrial marshes | |
| 24. Aquatic marshes | |
| 25. Peatbogs | |
| 26. Rivers and lakes |
The physical supply and use account for the stormwater / flood mitigation service can be seen in Table 12. The table shows that some buildings also use the services provided by the ecosystem types that are classified as forest and nature areas as the buildings locate in those areas. The building areas that benefit from the ecosystem service supply have an extra column that includes the ecosystem types of river and lake, other, and error to be corrected. This column is used to balance the supply and use total, as overlaying the raster data (ecosystem extent type) and polygon data (building footprints) in the supply created some errors in calculating the areas. Also, the use table shows that the classification of economic units might be different when different indicators of ecosystem services are used.
The next step in the pilot ecosystem accounting will be to estimate the value of the stormwater / flood mitigation service and compile the monetary supply and use accounts. The value of the service will be based on the (avoided) damage cost function of the flood events (Huizinga et al., 2017). As the provided service protects the area from suffering from the predicted highest flood, the value of the service is the prevented cost. At the areas where Q= 0, the value of the service is the prevented maximum damage cost; at the area of 0 < Q < maximum flood height, the value of the service is the difference in the damage costs between the flood height and the maximum damage cost. The flood height varies by location. Therefore, instead of using the physical unit that already was compiled in the physical stormwater mitigation supply and use account to estimate the value, the estimation of the precise value needs to be conducted using GIS. The valuation of the mitigation service can be combined with some policy application, for example, by comparing the ecosystem service and value difference, based on the ecosystem extent change between 2012 and 2018. Optional policy applications include revealing the importance and value of stormwater mitigation service with increasing severity and frequency of flood events under climate scenarios or evaluating the flood mitigation service and its value change with specific forest extent change scenarios to reveal the mitigation service value of the forest.
Table 12. Physical stormwater / flood mitigation service supply and use account in Tampere in 2018. Units in hectares. Ecosystem services are in the rows of the table; they need to be duplicated under both supply side and use side. In columns, the first part is the use table that shows the amount (value) of ecosystem service used by different economic units; the second part of the columns form the supply table that shows the amount (value) of ecosystem service provided by ecosystems (ecosystem assets) according to the same classification as in the ecosystem extent account.
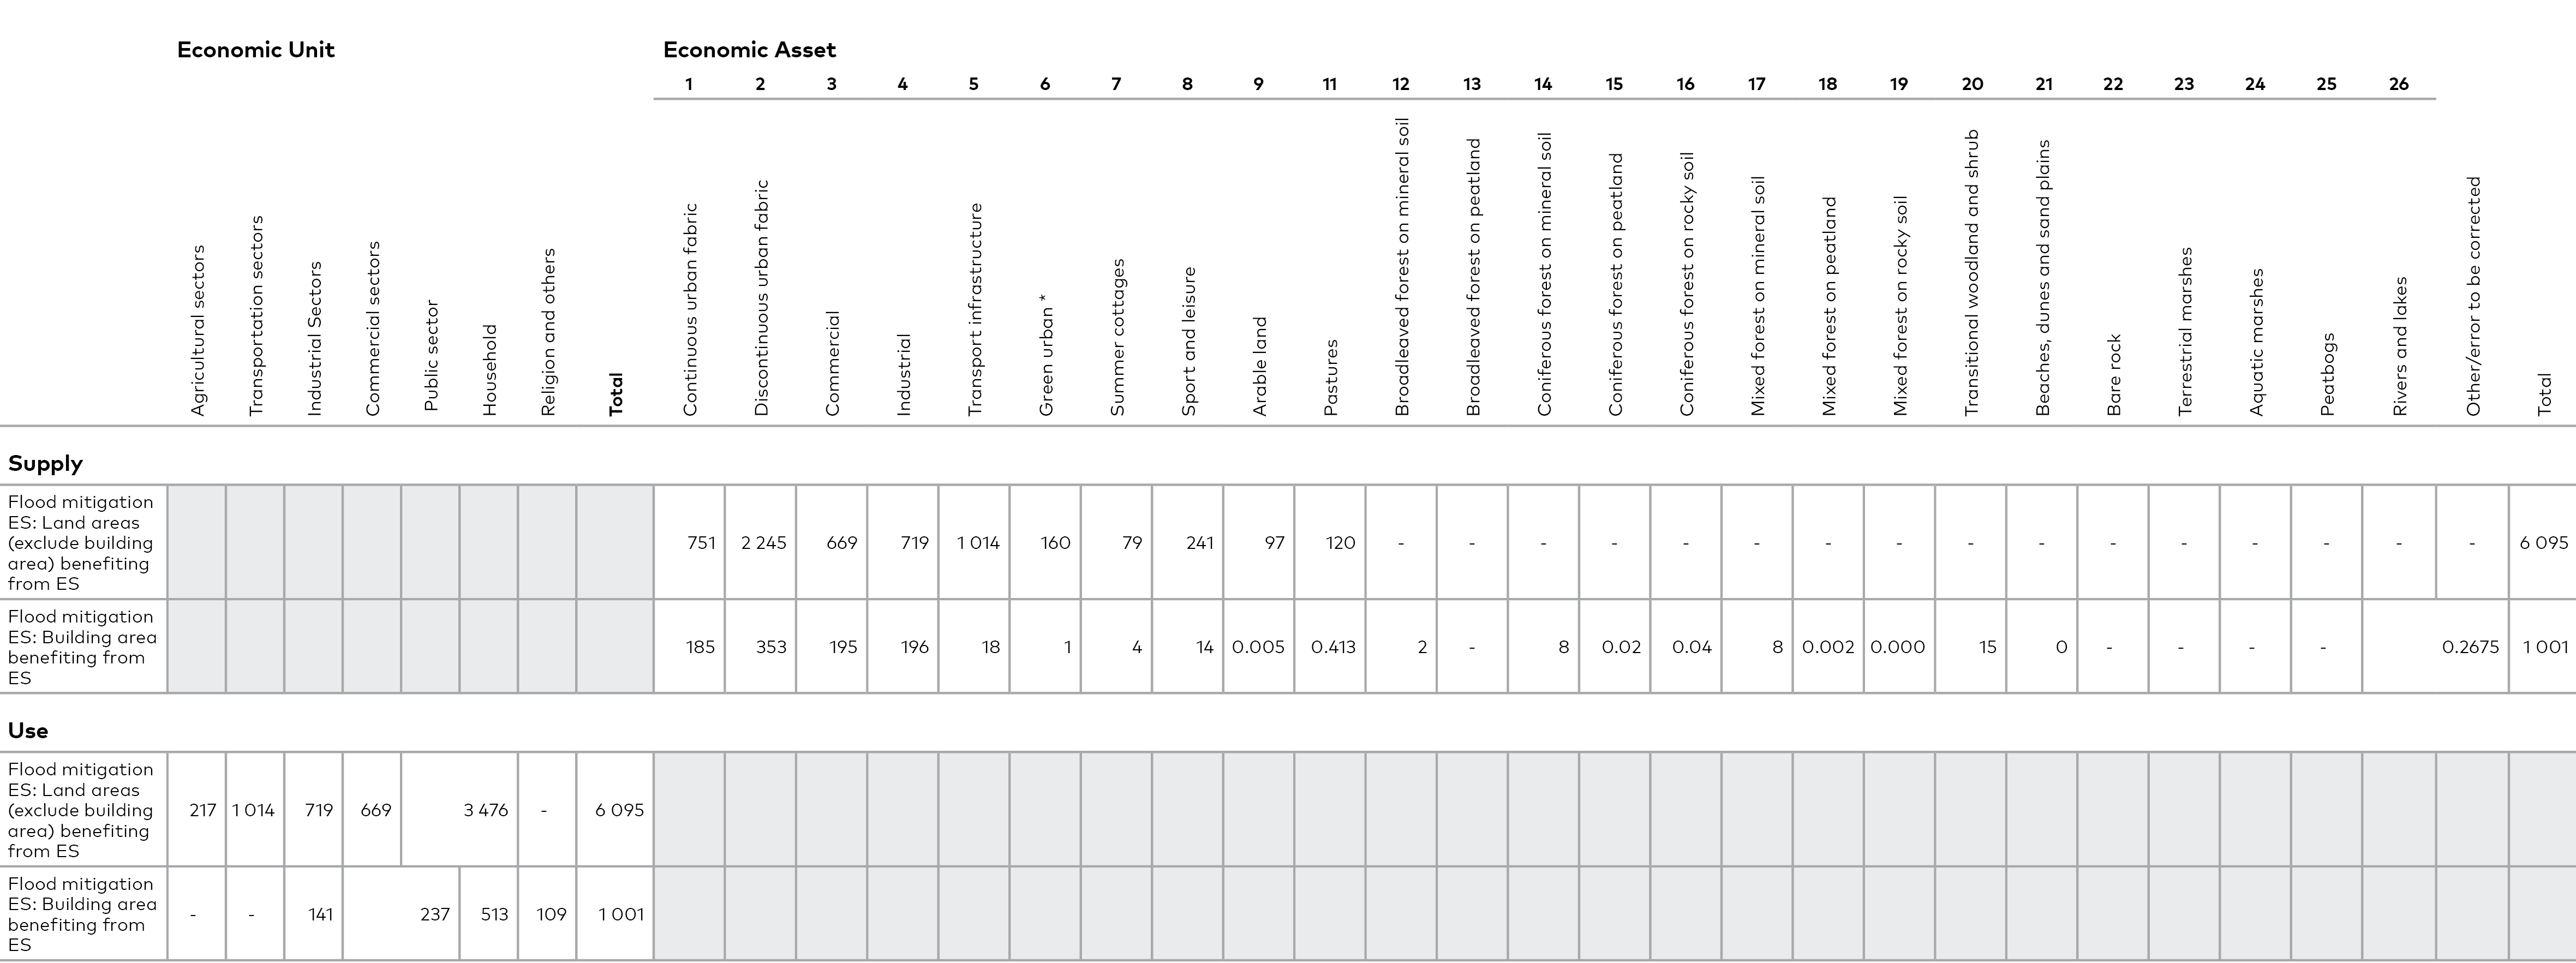
6.4 City of Helsinki
6.4.1 Ecosystem Extent
The forested areas within Helsinki are in very high demand for recreational use, mostly by residents, although in the summer the archipelago is flocked by tourists. Recently (partly due to the continuing covid-19 situation), residents have started to actively defend forests from urban development, emphasizing the high importance of even small, forested patches when they are located close to residential areas. The crown jewel of Helsinki is the Central Park, which stretches 10 kilometers almost from the city centre to the northern border of Helsinki and covers a total forested area of 700 hectares.
Similar to Pirkkala, we compiled a forest ecosystem extent account also for Helsinki, using forest fertility classes as ecosystem types. We aimed to use the most up-to-date and detailed forest data available, but unfortunately, we could not find a single dataset that would cover all forest extent in Helsinki. The city had their own forest stand polygon dataset, which has been verified with field work, but that did not cover all municipality-owned forests especially in Östersundom in the eastern part of Helsinki and in the archipelago.
Helsinki is a bit of a special case when it comes to forestry data: on the one hand, there is very little forest that is managed for timber production, and a lot of forest is publicly owned. Thus, the Finnish Forestry Centre data, which mostly is collected from privately owned forests, was not sufficient alone, like it was in Pirkkala. On the other hand, a big portion of publicly owned forests in Helsinki are either on remote islands with restricted access, or are governed by the the Finnish Defence Forces, and thus spatial data on these forests is not available.
The Helsinki forest ecosystem extent account was geoprocessed and merged from four different source datasets, ranked by the order of preference: 1) Helsinki municipality forest stand data, 2) Finnish Forestry Centre gridded forestry data, 3) Finnish Forestry Centre polygon stand data, and 4) Metsähallitus biotope data (covering government-owned forests). By visual inspection we could see that these datasets complemented each other – there were a lot of overlaps, but also data gaps between the four datasets. Again, Finnish Forestry Centre gridded forestry data was most extensive, but also included a substantial amount of commission errors caused by misclassification and fast urban development. We updated or cleaned the Finnish Forestry Centre data by overlay analysis with HSL (Helsinki Regional Transport Authority, a joint local authority managing public transport in the Helsinki region) high resolution land cover data (2020), i.e. removing grid cells classified as forests which in fact were either covered by impervious surfaces, croplands, bare soil, roads or buildings according to HSL data.
The forest extent was populated by merging these datasets one after another, using GIS overlay analysis to fill the gaps, avoid overlaps and remove small polygons which are artifacts of errors in the source data geometries or differences between the ways how forest polygons were digitized in different datasets. Processing and analysis of the GIS data was implemented and executed with a geoprocessing model in QGIS Graphical Modeler. The final processing step was to remove forests that were already converted to another land cover type, in a similar way as it was done in the Pirkkala case. The results – the forest extent map and extent account for 2020 – are shown in Table 13 and Figure 18.
Our approach combining data collected by different data producers in different years and collected for intended purposes is quite different from ecosystem accounting. Despite our efforts, we could not map all forest extent due to the still remaining data gaps. One alternative would have been to use the coarser (and older) Corine land cover (CLC) data to map forest extent (similar to the approach taken in Tampere), but we wanted to give preference to the high-resolution forest stand data collected by the city itself, although it did not provide enough coverage of the forest extent in the end.
Table 13. Helsinki Forest Ecosystem Extent Account 2020. Units in hectares.
| Ecosystem type | Herb-rich forests | Herb-rich heath forests | Mesic heath forests | Sub-xeric heath forests | Xeric heath forests | Barren heath forests | Forests on rocky terrain | Total |
| Opening extent | 970 | 1 366 | 2 166 | 615 | 86 | 17 | 955 | 6 174 |
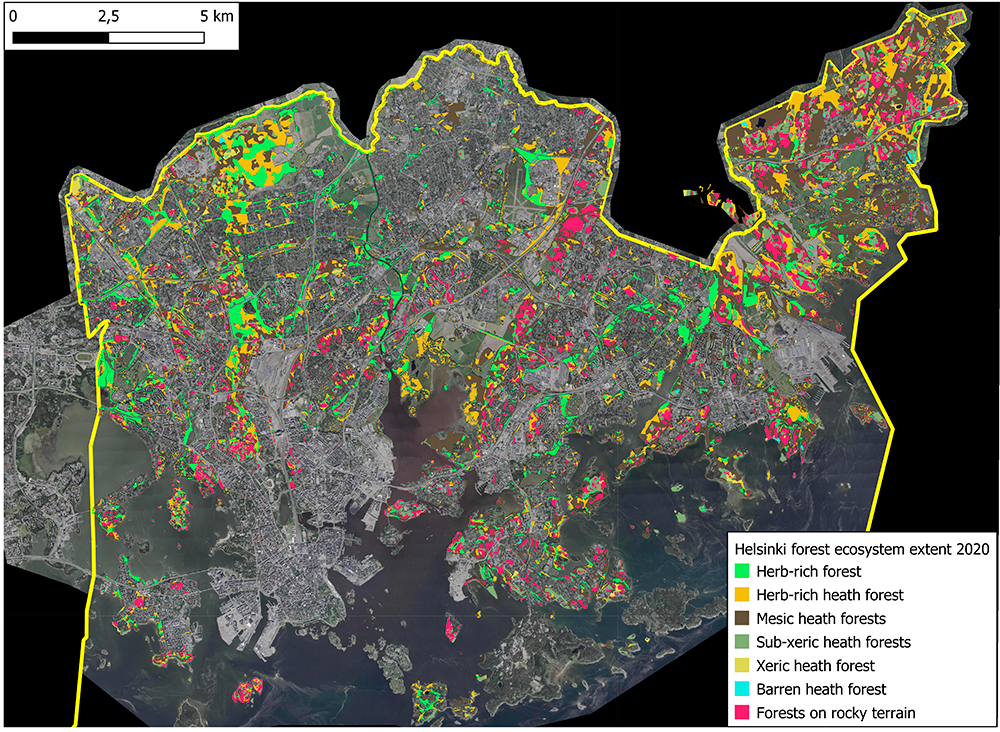
Figure 18. Map of forest ecosystem extent in Helsinki in 2020. Forest data from Finnish Forest Centre (CC BY 4.0), Metsähallitus (biotooppikuviot) and City of Helsinki (used with permission). Background aerial photographs from City of Helsinki (kartta.hel.fi).
6.4.2 Physical recreation ecosystem service use of forests
We quantified the value of nature-based recreational activities provided by forested areas within Helsinki’s municipal boundaries using data retrieved from a popular social media platform (Flickr) and two citizen science applications (eBird and iNaturalist). Publicly available georeferenced data were extracted from Flickr (92 million monthly active users) and from the popular citizen science web applications iNaturalist and eBird for the years 2019, 2020 and 2021. The geographical coordinates associated with each image or observation allowed to produce a heat density map based of the number of photos or observations. This provides a spatial representation of the areas with the highest density of data that could be considered hotspots for nature-based recreational activities (see Figure 19, Figure 20 and Figure 21).
The number of observations within the forested areas increased in 2020 probably as a result of the covid-19 pandemic that has influenced the recreational use of urban green spaces. However, it should be considered that the annual change could also be linked to the increased popularity of the citizen science applications.
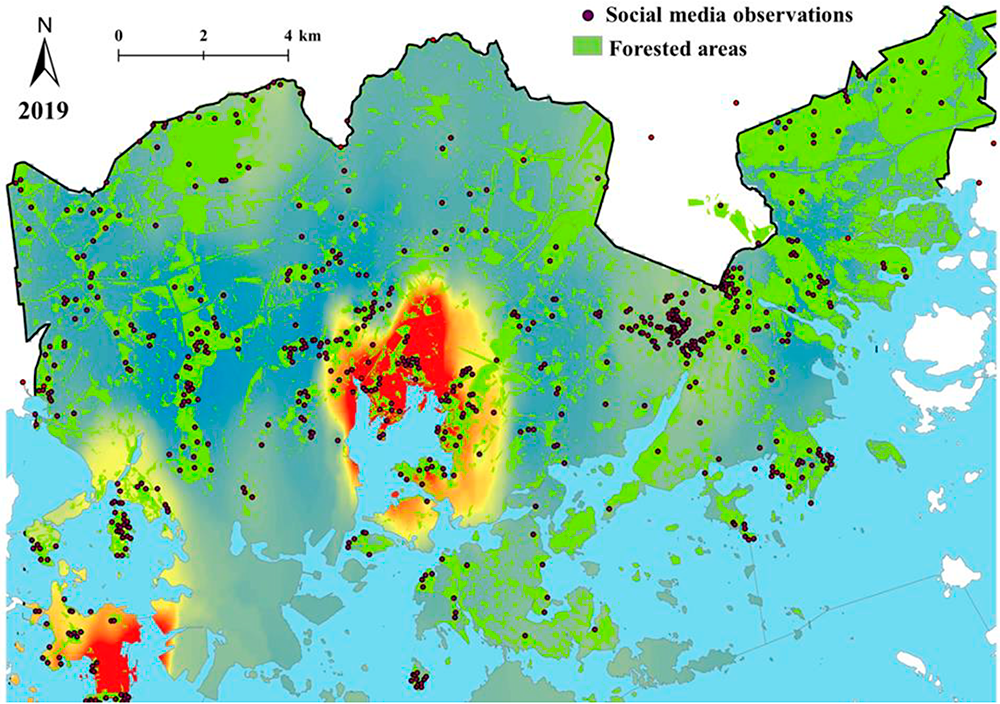
Figure 19. Heatmap of the social media observations (Flickr, iNaturalist and eBird) within the forested areas in 2019. The areas in red correspond to the areas with the highest density of social media observations that could be considered as a visitation proxy. Background shoreline from shorelines 1:10 000 (C) Finnish Environment Institute, CC4.0.
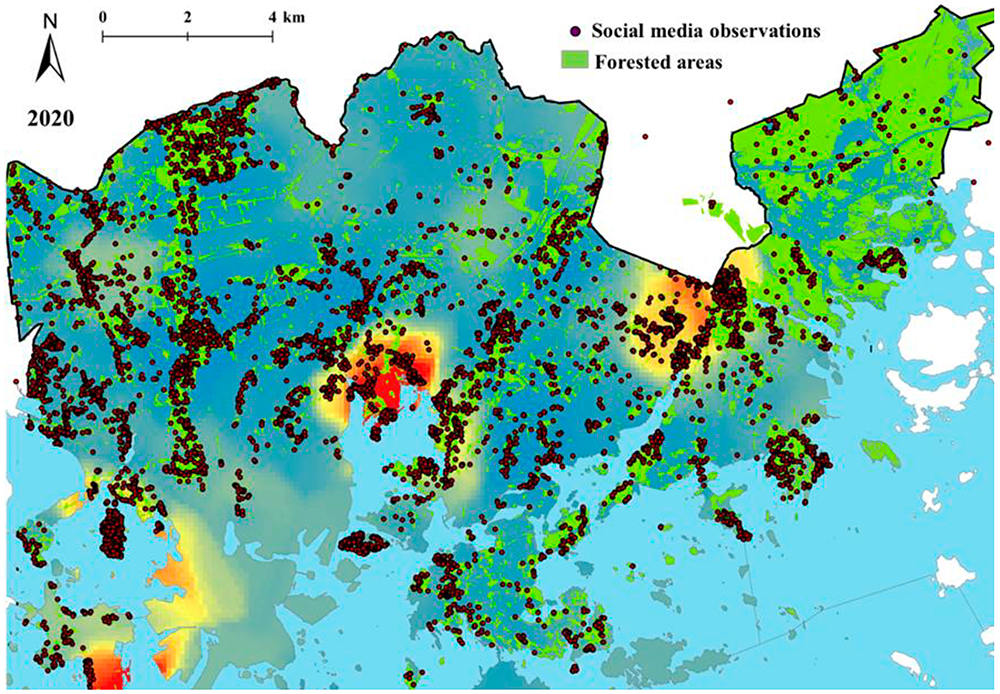
Figure 20. Heatmap of the social media observations (Flickr, iNaturalist and eBird) within the forested areas in 2020. The areas in red correspond to the areas with the highest density of social media observations that could be considered as a visitation proxy. Background shoreline from shorelines 1:10 000 (C) Finnish Environment Institute, CC4.0.
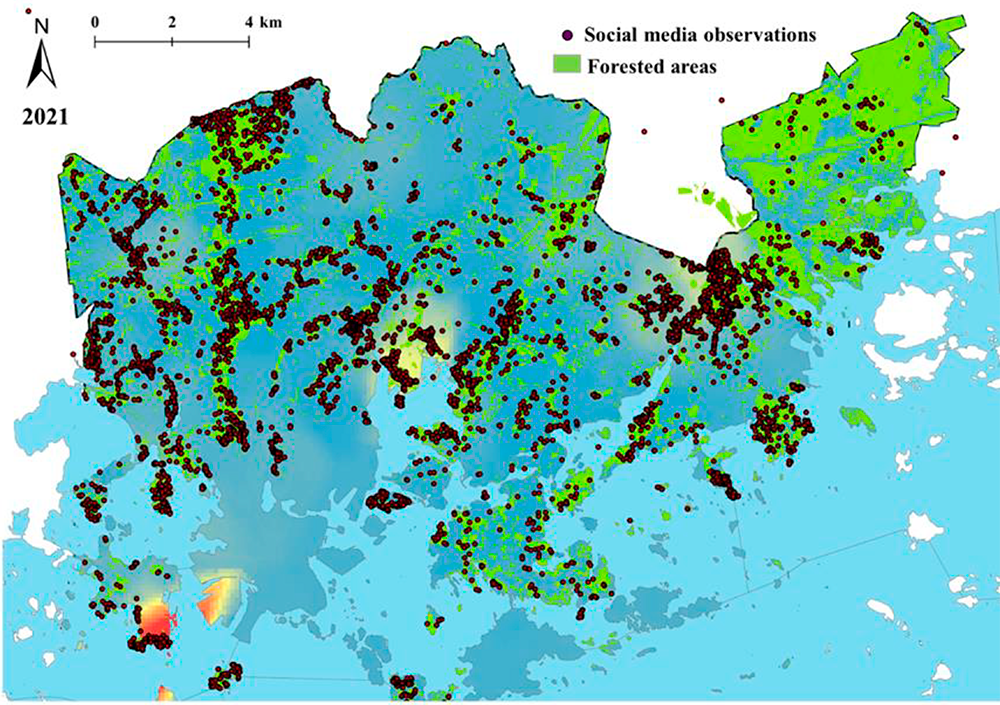
Figure 21. Heatmap of the social media observations (Flickr, iNaturalist and eBird) within the forested areas in 2021 (Flickr 2021 data refer to the period between 1/1/2021 to 31/10/2021). The areas in red correspond to the areas with the highest density of social media observations that could be considered as a visitation proxy. Background shoreline from shorelines 1:10 000 (C) Finnish Environment Institute, CC4.0.
Since it is likely that each user takes multiple images or observations within the same area, we only considered one observation per user per day within each specific forested location (“observation-user-day” OUD).
We retrieved a total number of 4,870; 16,875 and 18,601 observations for the years 2019, 2020 and 2021, respectively. A total number of unique observations or images (OUD) per each of the social media platforms considered was also estimated. In 2019 we found 414 unique OUD; 2,478 and 2,022 for the years 2020 and 2021, respectively. We also found that there was a significant difference in the proportion of observations retrieved from social media within each of the seven forest types (X-square=26,5, df=14, p-value=0,02) (Table 14). Mesic forests and forests on rocky terrain had the highest number of social media observations across the three years considered in this study.
Table 14. Aggregated number of unique observations (Flickr, iNaturalist and eBird) within each forest type.
| Forest type | Total number of observations | ||||||||
| 0 | 1 | 2 | 3 | 4 | 5 | 6 | 7 | ||
| 2019 | 26 | 106 | 72 | 86 | 21 | 4 | 0 | 99 | 414 |
| 2020 | 121 | 679 | 467 | 602 | 167 | 38 | 5 | 399 | 2 478 |
| 2021 | 100 | 547 | 400 | 509 | 118 | 29 | 7 | 312 | 2 022 |
Social media is a promising source to fill information gaps about nature-based recreational activities. The next steps will require to validate the results from the social media data and estimate the correlation between the actual visitation of forested areas and the visitation proxy estimated from the social media platforms. To this end we would use movement data (i.e., STRAVA data) and available survey data. After the validation of social media data as a good proxy for visitation of recreational areas, economic models will be applied to derive the economic value of natural recreation provided by the forested areas.
7. How to overcome challenges in urban ecosystem accounting
In this section we discuss some challenges in compiling different accounts from across the case studies and possible solutions where available.
7.1 Ecosystem extent and challenges with data sets
Most spatial data on land cover and forest resources (as a proxy for ecosystems) is of single date rather than time series, thereby not fulfilling the accounting need of following changes over time. Second, some of the datasets, such as the Finnish Forestry Centre data, is collected over a time range of several years and therefore it becomes impossible to state the exact year for the extent which could lead to the inconsistency between the extent and supply and use accounts in a way that a specific year cannot be identified. Solutions include (1) using alternative time series such as Copernicus Land cover (CLC) data, while keeping in mind the trade-offs (lower resolution, thematic detail, suitability), and (2) collecting own data through airborne / droneborne remote sensing backed up by field work. This needs careful planning and setting up user requirements. It is also costly to set up and needs regular updating.
Existing data can have also gaps in spatial coverage (e.g. forestry data in Helsinki). One approach to overcome this is to combine extent data from different sources to fill the gaps. Known limitations of this are that different datasets can have different data models (raster vs. vector), thematic detail (number of classes), spatial accuracy, and temporal consistency.
Even time-series data can have thematic gaps. For example, urban green was not mapped in Corine land cover prior to 2018, and therefore in the extent account additions to urban green give biased results for periods extending past 2018.
Tampere was the only pilot city, where we used time-series data and were able to compile a fully SEEA-EA -compliant extent account, with opening and closing extents, additions and reductions. However, some of the recorded additions and reductions in the Tampere extent account are not real, but an artifact from classification errors in the Corine land cover maps. In other words, if an ecosystem asset is wrongly classified in 2012 data but correctly classified in 2018 data, or vice versa, the change matrix (addition or reduction) will be misleading. On a general level, in a typical land cover map with high thematic detail such as Corine land cover, an overall accuracy of between 70% and 80% is considered acceptable. This means that 20% to 30% of the map is wrongly classified, and these will be directly reflected in the ecosystem extent account and the change matrix. A good example is the unrealistic changes from one forest type class to another between 2012 and 2018. A solution to this problem is to reduce the thematic detail (number of ecosystem types) in the extent account which will minimize the effect of classification artifacts. Still, classification errors of 20% are likely to confound trend detection in urban ecosystem types for e.g. annual accounting, and perhaps longer depending on the speed of land use change. A more sustainable solution would be to produce a statistically consistent time-series of Corine land cover for accounting purposes, which would eliminate most of these uncertainties.
Data availability was one of the main limitations in this project. The city of Tampere had a high-resolution land cover map in its possession, interpreted from airborne colour orthophotos and laser scanning. Unfortunately, this dataset only covered the urban city centre. Our analysis required datasets covering the entire watershed, therefore, we were not able to use it and we had to opt for the lower resolution Corine land cover data.
7.2 Ecosystem services and challenges with methods and measurements
Due to the lack of available stormwater runoff measurements data for the Tampere watershed we validated the InVEST model using stormwater measuring data collected in a nearby watershed. This limited the accuracy of the InVEST model in predicting runoff production and retention and should be considered when analyzing the results.
Social media data is a useful source of information to assess cultural ecosystem services, but it should be recognized that these data are biased and do not represent the population at large. For the municipality of Pirkkala there were not enough data points and therefore we could not use this approach to estimate the recreational use of the forested areas. Lack of data (i.e., survey data) to validate social media presented a major limitation in this phase of the pilot study and hindered the application of benefit transfer approach. Available user information was also retrieved from the platform Flickr. These data did not provide accurate identification of the user home location and therefore, we could not apply the travel cost method for economic valuation of the recreational benefits provided by forested areas.
Municipalities can overcome this data challenge by carrying out public participatory surveys to investigate the use of different areas. Visitor counters would be ideal, but it is not possible to set them in all green spaces. An extra “challenge” is that in the Nordic countries everyman’s rights provide free access to nature areas (with some exceptions, e.g. a number of strictly protected areas or areas used by the Defence Forces) and possible entry points to the areas are countless. A third option is to use locational data of mobile phones as a proxy of visitation. Privacy issues and possible cost of the data are among the several challenges related to mobile phone data.
7.3 Valuation of ecosystem services
The Oslo pilot case provided an illustration of a valuation dilemma that may not be just a peculiarity of the data. We showed that exchange value methods and observable ‘transactions’ (registration in STRAVA application) produce values which are an order of magnitude lower than survey-based willingness-to-pay based methods. The choice of appropriate monetary valuation method will depend on the policy question at hand (e.g. cost-recovery of a utility, financial feasibility of a NBS investment, aggregate benefits of climate risk mitigation of urban green infrastructure). It is difficult to see generic exchange values applied to any of these examples of different policy analysis purposes. This suggests that municipalities may adopt a prudent data collection policy if they decide to compile ecosystem accounts; regularly compile physical extent-condition accounts but apply ecosystem service mapping and valuation only to address specific policy questions.
7.4 Different accuracy across accounts and different purposes
Different priorities combined with local personnel and resource constrains of most municipalities mean that ecosystem accounting faces more barriers to uptake than at national level. Because ecosystem accounting requires a large up front ‘investment’ in setting up mapping and accounting workflows and applications, regular implementation at municipal level is likely to require development of common approaches by regional or national level agencies.
In highly modified urban landscapes, the distinction between ecosystem extent and condition is not always practical nor useful for ecosystem service accounting. In an asset-based approach structures such as trees represent different urban ecosystem components and the distinction between extent and condition is blurred. “Green accounts” such as in Oslo consider all vegetation cover to be urban ecosystem extent. Then vegetation structure, such as tree canopy extent and type can be interpreted as condition indicators. The recreation accounting pilot in Oslo maps frequency of use to recreation areas. Previous research by Venter et al. (2020) demonstrates that within recreation areas path greenness and canopy density (condition indicators) predict walking and biking frequency as recorded by STRAVA mobility data. However, it is generally true that remotely sensed high resolution ecosystem condition data (e.g. vegetation cover at 10 m pixels) cannot be matched by datasets on physical use, let alone mapping of marginal values.
There will always be precision gaps between physical and monetary accounting data. This suggests that physical and monetary accounts should be used by municipalities to serve different purposes. Physical extent and condition accounts should be used for change monitoring. Physical ecosystem services modelling serves to attribute impacts to types of land users in supply-use accounts, rather than at the level of specific ecosystem assets or pixels. Valuation methods will often have yet lower spatial accuracy, not even differentiate marginal values across types of users. In that case monetary values simply scale the physical ecosystem services to monetary units, but all change and spatial variation is explained by the physical variables. As shown in the Oslo pilot example, in these cases monetary accounting tables for administrative areas or populations provide awareness raising and advocacy arguments for the importance of ecosystem services in aggregate. In summary, by understanding the relative accuracy of different accounts, they can be employed to address different purposes in municipal planning and policy. Given the large information gaps uncovered in the pilot studies in this project, ‘the perfect must not become the enemy of the good’ - very high-resolution data is not necessary for all purposes. Each stepwise investment in additional ecosystem information should have an immediate purpose and policy use.
A broad finding across the Nordic cases was the challenge in obtaining ecosystem extent and condition data for multiple periods allowing for accounting and change analysis. This also meant that demonstrations of ecosystem service modelling, mapping and valuation served as useful examples to explore data needs and uncertainty but were not comprehensive enough to show how ecosystem accounts could provide aggregate ecosystem service and asset values. Municipal participants were nevertheless positive to continued piloting and experimentation of SEEA EA accounting methods at the municipal level.
8. Draft roadmap for urban ecosystem accounting in Nordic cities
Municipal ecosystem accounting pilots provided first insights on how to implement ecosystem accounting for the benefit of local level decision-making. This experience was used to produce a draft roadmap for any municipality willing to adopt a new method for reaching out to sustainable development. National level ecosystem accounting is predicted to become obligatory in the European Union by 2026. Municipalities having familiarized themselves with and taken at least the first steps in ecosystem accounting will be better prepared for the new national practice even if it is not obligatory at the local level.
The roadmap explains how municipalities can start implementing ecosystem accounting and thus take a step towards achieving their visions on more sustainable greener cities. Ecosystem accounting provides a tool for long-term planning based on the policy goals. It should be seen in a similar way as an actual map showing different routes to the destination and allowing also changes on the way along with new possibilities and knowledge. Importantly, the outcomes on the way can be used for checking whether the work is still on track or whether adjustment is needed.
The roadmap contents were produced in collaboration with the municipalities that participated in the Nordic urban ecosystem accounting project.
A. Vision making
Municipal ecosystem accounting starts with setting a shared vision for the policy goals in cross-sectoral collaboration within the municipality. An agreement on the same goals is crucial for the success. Municipalities have varying needs and thus also ecosystem accounting can be based on different priorities and have different emphasis. A shared vision can be, for example, to keep nature in the city, to set a sustainability measurement tool of policies, to implement policies to protect ecosystems and their services or to produce information for multiple uses, including climate adaptation.
Politics affects what a municipality wants to achieve. Therefore, it is important to find a consensus about what is important in a sustainable municipality. This requires dialogue among politicians and practitioners on what is a vision for it and how a green city could be built: how does it look like and what can be done to make the city better? The vision can focus on, for example, mitigating flooding, providing fair access to recreation to inhabitants or showing the (monetary) value of ecosystem services for the municipality. The vision can also cover a wider perspective of greening the city, no net land loss, or to become a frontrunner in environmental, social and / or economic sustainability by using nature-based solutions, for instance. It is important to guarantee inclusiveness and environmental justice while setting the vision for ecosystem accounting.
A strong vision is based on using ecosystem accounting information for legal / obligation frameworks or legal processes. However, addressing also softer issues such as increased awareness is good. Politicians may also ask further information than legal obligations require. Ecosystem accounting can serve this purpose. By planning carefully farther goals can be reached than legal frameworks ask to do.
Sometimes the vision can include being able to compare with peers, i.e. other municipalities in the same country or in other countries. For example, the six biggest cities in Finland follow a common set of indicators, including those related to sustainability and biodiversity, every 2–3 years. It would be useful to include ecosystem accounting related indicators in the set. Decision-makers find this kind of a common indicator set as a great tool.
It should be taken into account in vision setting that there is a point where visions start colliding with the reality. Ecosystem accounting may, for example, show negative impacts of zoning afterwards, thus making the negative consequences of decisions visible. In addition, it is easy to get interested initially, to show how green the municipality is, but it is not certain that things get better. Municipal decision-makers and practitioners may find that the tool can be used to highlight their failings. Therefore, inconvenient facts that may be met by implementing ecosystem accounting need to be discussed in a diplomatic way. It should also be kept in mind that hiding one’s head in a bush does not make inconveniences disappear, on the contrary, courage to face reality is the first and most important prerequisite for successful ecosystem accounting.
Steps for vision making
- Familiarize yourself with basic facts on ecosystem accounting and consider how it could benefit your municipality. UN Global Platform, for example, offers an e-learning course for self-learning (https://learning.officialstatistics.org/course/view.php?id=78).
- Find support from national authorities or national legislation and policies for the implementation of municipal ecosystem accounting if needed.
- Gather with people from relevant sectors of the municipality and start drafting a vision.
- Approach politicians with available material on municipal ecosystem accounting and present how it could be used to support municipal decision-making and practical work. Engage politicians in vision making. Motivate them with interesting examples (for example, in Helsinki it has been calculated that money put into cycle paths comes eight times back).
- Come up with a shared vision.
B. Strategy development
A strategy sets the goals and ways for achieving the vision. UN’s recently published “Guidelines on Biophysical Modelling for EA” provide process guidance for institutions starting SEEA EA implementation (https://seea.un.org/ecosystem-accounting/biophysical-modelling). The UN programme is quite ambitious. In practice, there are knowledge and implementation gaps (and ways forward in a realistic way) in ecosystem accounting compared to the SEEA EA. Municipalities might think that they must do everything mentioned in the SEEA EA framework. Instead, they can shop and do what is useful for them and which – in the best case - also relates to or supports the national level accounting.
Ecosystem accounting can be integrated to other policies for sustainable development or those with clear goals that can be measured by ecosystem accounts. The strategy clarifies in a general level which policies ecosystem accounts are expected to support and how, which accounts could be useful for that, how the human and monetary resources could be ensured and who are the stakeholders. Pilot municipalities of the Nordic urban ecosystem accounting project brought up that ecosystem accounts, which are spatial by nature, produce useful information for planning processes. Using ecosystem services accounting for the master plans in the cities makes the decisions more tangible when it is possible to state what are the costs that come with the plan. Ecosystem accounting can be a great tool for local master planning and later for detailed planning. For example, add nature where there is no nature or in zoning to show how much green there needs to be in certain zones (a tool for architects etc.). Using ecosystem accounts in local master planning could help in proceeding in urban ecosystem accounting in cities in general. Information from ecosystem accounts can also be used in meetings with inhabitants.
When the strategic goals of ecosystem accounting have been agreed the strategy should also involve a realistic plan for resourcing the work. This is very important because municipalities have expressed their worries about having too little resources for ecosystem accounting work. In other words, political policy making must not be followed by a dead end due to missing human or financial resources to implement ecosystem accounting.
Steps for strategy work
- Translate the vision into a concrete strategy.
- Specify the policies or practical work that are to be supported by ecosystem accounting. Make the benefits clear and understandable.
- Explore and list those ecosystem types, ecosystem extent, ecosystem condition, physical ecosystem service supply and use, and monetary ecosystem service supply and use accounts that would be interesting and could support achieving the vision and related policies or practical work.
- Negotiate and ensure resources for ecosystem accounting. Remember to consider resources for upkeep / continued accounting as well.
C. Implementation plan
An implementation plan is an outline for executing ecosystem accounting along time so that the vision will be met. Although it shows clear steps in the ecosystem accounting process it should be broad enough to allow for innovation and flexibility when needed. New knowledge, data, methods and tools keep appearing and it should be possible to benefit from these by amending the implementation plan.
The plan indicates which municipal offices and sectors will be responsible for the implementation, how political policymakers will be engaged in the process and who else will be involved and how. Stakeholders and citizens should be engaged in the process as actors and not only receivers of information. This engagement should be well explained in the implementation plan.
The plan also details the ecosystem accounts to be implemented, optional data sources and methods that could be used. The UN’s “Guidelines on Biophysical Modelling for EA” provide an overview of possible data sources, methods and practical advice on the compilation of extent, condition and ecosystem services accounts in physical units and can thus be used as a reference also on the municipal level.
Ecosystem accounts
Possibilities of different ecosystem accounts are almost endless. The main question is which accounts make the most sense in the municipality to achieve the vision.
A simple way is to find simple indicators for ecosystem accounts to start with. Concrete examples of accounts that can be found for example in this report can help selecting the most interesting ones. Other municipalities’ experiences may prove useful as well. In any case, it is important to start easy.
It is advisable to think very concrete examples - what could be measured. Is it forests or waters, is it recreation or provision of food as an ecosystem service? Think how those could be measured. Prioritize ecosystems or assets and services where spatial data already exists and fits the purpose, as reusing such data is many times cheaper than collecting new data from scratch.
The easiest account is ecosystem extent account. Most municipalities have land cover / land use data, habitat maps, etc. and in the best case from multiple years. It is possible to assess the changes that are happening in the municipality. How much there is forest and how much of it has changed during the years (so called input and output extents)? GIS and some remote sensing knowledge are needed to get started as ecosystem accounts are always related to spatial units. The results can be presented both in ecosystem account maps as well as spreadsheets.
Ecosystem services demand and supply accounts must always be in balance which means that they should have the same values in the accounting table. This is based on economics where only used part of supply is accounted. Usually supply refers to potential provision of ecosystem services on most sustainable level for the ecosystem type or condition. Ecosystem accounts always need to record what is happening in terms of demand, too.
Monetary values are not always easy to estimate. Especially when it comes to the intrinsic value or cultural ecosystem service values of certain areas. One suggestion is to put a base value for those and not be too strict to put a “correct” value in align with SEEA EA guidelines.
Data
Implementing ecosystem accounts requires data. The first thing is to map current data and use available data. Data can be found in open national data banks (for example in Finland, https://www.syke.fi/en-US/Open_information), and in the municipalities but also in other places. In municipal level practice and decision-making, national level data can be too coarse to catch the local level spatial variability but can be a useful starting point. In some cases, the data can be down- or upscaled. New data can be created also along the ecosystem accounting process by spatial analysis in which new GIS datasets are produced. Citizens can be involved in gathering more data for example by using participatory GIS methods. Nowadays, all sorts of big data are available from social media (such as Flickr, Twitter, iNaturalist, eBird), phone companies, etc. but need skills for retrieving and analysing it. These types of data are usually used as indirect indicators of demand for ecosystem services. As such it should be remembered that it is only digital integration of people and no real stakeholder engagement. In addition, this type of innovative data that complements traditional data still needs more discussion on how to calibrate it.
The best way is to start simple, not too complex. And just start because ecosystem accounting is a learning process along the implementation. A good starting point is to build realistic understanding what can be done in the municipalities with the existing data. During the implementation, a gap can be found between indicators that were selected based on policy interest and the data availability. In addition, there are often real limitations of the existing data but these are not known before having hands on the work. In these cases, there usually is a way around so this should not scare too much.
Consistency in data collection provides good prerequisites for ecosystem accounting. Comparable databases and methods also make it possible to compare municipalities. Attention should also be paid to the quality of the data – transparently produced datasets usually come with proper metadata which should report characteristics such as intended use of the data, resolution / mapping scale and minimum mapping unit, and some measure of uncertainty related to the data (e.g. classification accuracy).
Methods
Basic methods used in ecosystem accounting are various GIS analysis methods and basic statistical methods. If big data is used machine learning skills are beneficial. Ability to use models is required for example in assessing certain ecosystem services, for example the InVEST model helps in assessing and mapping the supply and monetary value of nature-based stormwater mitigation among others. For monetary ecosystem service accounts, knowledge of applying various economic valuation methods is needed. The right methods should be selected carefully to assess the right thing and get reliable estimates. However, the limitations of any methods need always be addressed when interpreting results.
Preliminary methods for selected ecosystem accounts can be mentioned in the implementation plan but sometimes they need to be changed when too big limitations appear. It is wise to look for reference cases when possible.
Sharing and collaboration
Municipal ecosystem accounting should be an open and collaborative process involving citizens and other stakeholders in a just way. A good implementation plan includes the coordination of workflow along with collaboration with many stakeholders. It should clearly point out the co-creation or engagement activities with specified targets for them.
In addition to internal municipal collaboration, it is good to find peer municipalities with whom to share what is being done and examples of ecosystem accounts. Discussion of challenges and ways to overcome them with peers is also useful.
Steps for making an implementation plan
- Different sections of the city – set a common goal, work together and figure out the resources you have.
- Make together a realistic step-by-step implementation plan with clearly stated ecosystem accounts, mapped data, identified methods and stakeholder co-working plan.
- Find a simple indicator for each selected ecosystem account.
- List usable, consistent datasets that are preferably updated regularly.
- Start simple, not too complex. Use existing data.
- When simple ecosystem accounts are done, consider implementing also the more demanding ones.
- Collaborate across the sectors in the municipality and with stakeholders including citizens throughout the implementation plan period.
- Choose visually nice examples of relevant ecosystem accounts for interdisciplinary use and to be used as information material for internal educational / information purpose.
- Find the most important ecosystem accounts to be re-implemented in certain time intervals on a permanent basis to enable monitoring of the development in the municipality. Exact values of selected indicators are not as important as the direction of the trend (improving, stable or declining).
- Be open for renewing the implementation plan on the go when new knowledge, data, methods, etc. make it possible to do things better.
D. Markers
Although roadmaps do not set exact dates for achieving specific goals it is important that the municipality sets some approximate target times for reaching various steps in the ecosystem accounting process.
It is crucial to have checking points at regular intervals to recall what the municipality’s vision was and what the municipality wants to achieve. That should be followed up. For example, if the vision is to implement specific kind of policies it should be monitored whether the policies are being achieved.
Markers can also be received from global, EU-level, national, regional or local strategies and programmes. For example, EU’s Biodiversity Strategy 2030 sets a target for all municipalities with at least 20,000 inhabitants to create a greening plan. Municipalities could implement ecosystem accounting for monitoring the greening after the plan is made or the goals of greening are agreed.
There is no actual ending date of ecosystem accounting because the aim of it is to provide a long-term monitoring method for assessing the sustainability of the municipal development.
Steps for setting markers
- Agree on general checkpoints to assess how the vision is being achieved and whether changes are needed but do not make a detailed plan for exact deadlines.
- Set an overall target time for the first implementation round of ecosystem accounting so that it is not forgotten in policymaking. However, do not give an exact end date for the implementation plan.
- Remember that ecosystem accounts are meant for long-term monitoring of municipal development. Ensure that everyone involved in the process including political policymakers understands this.
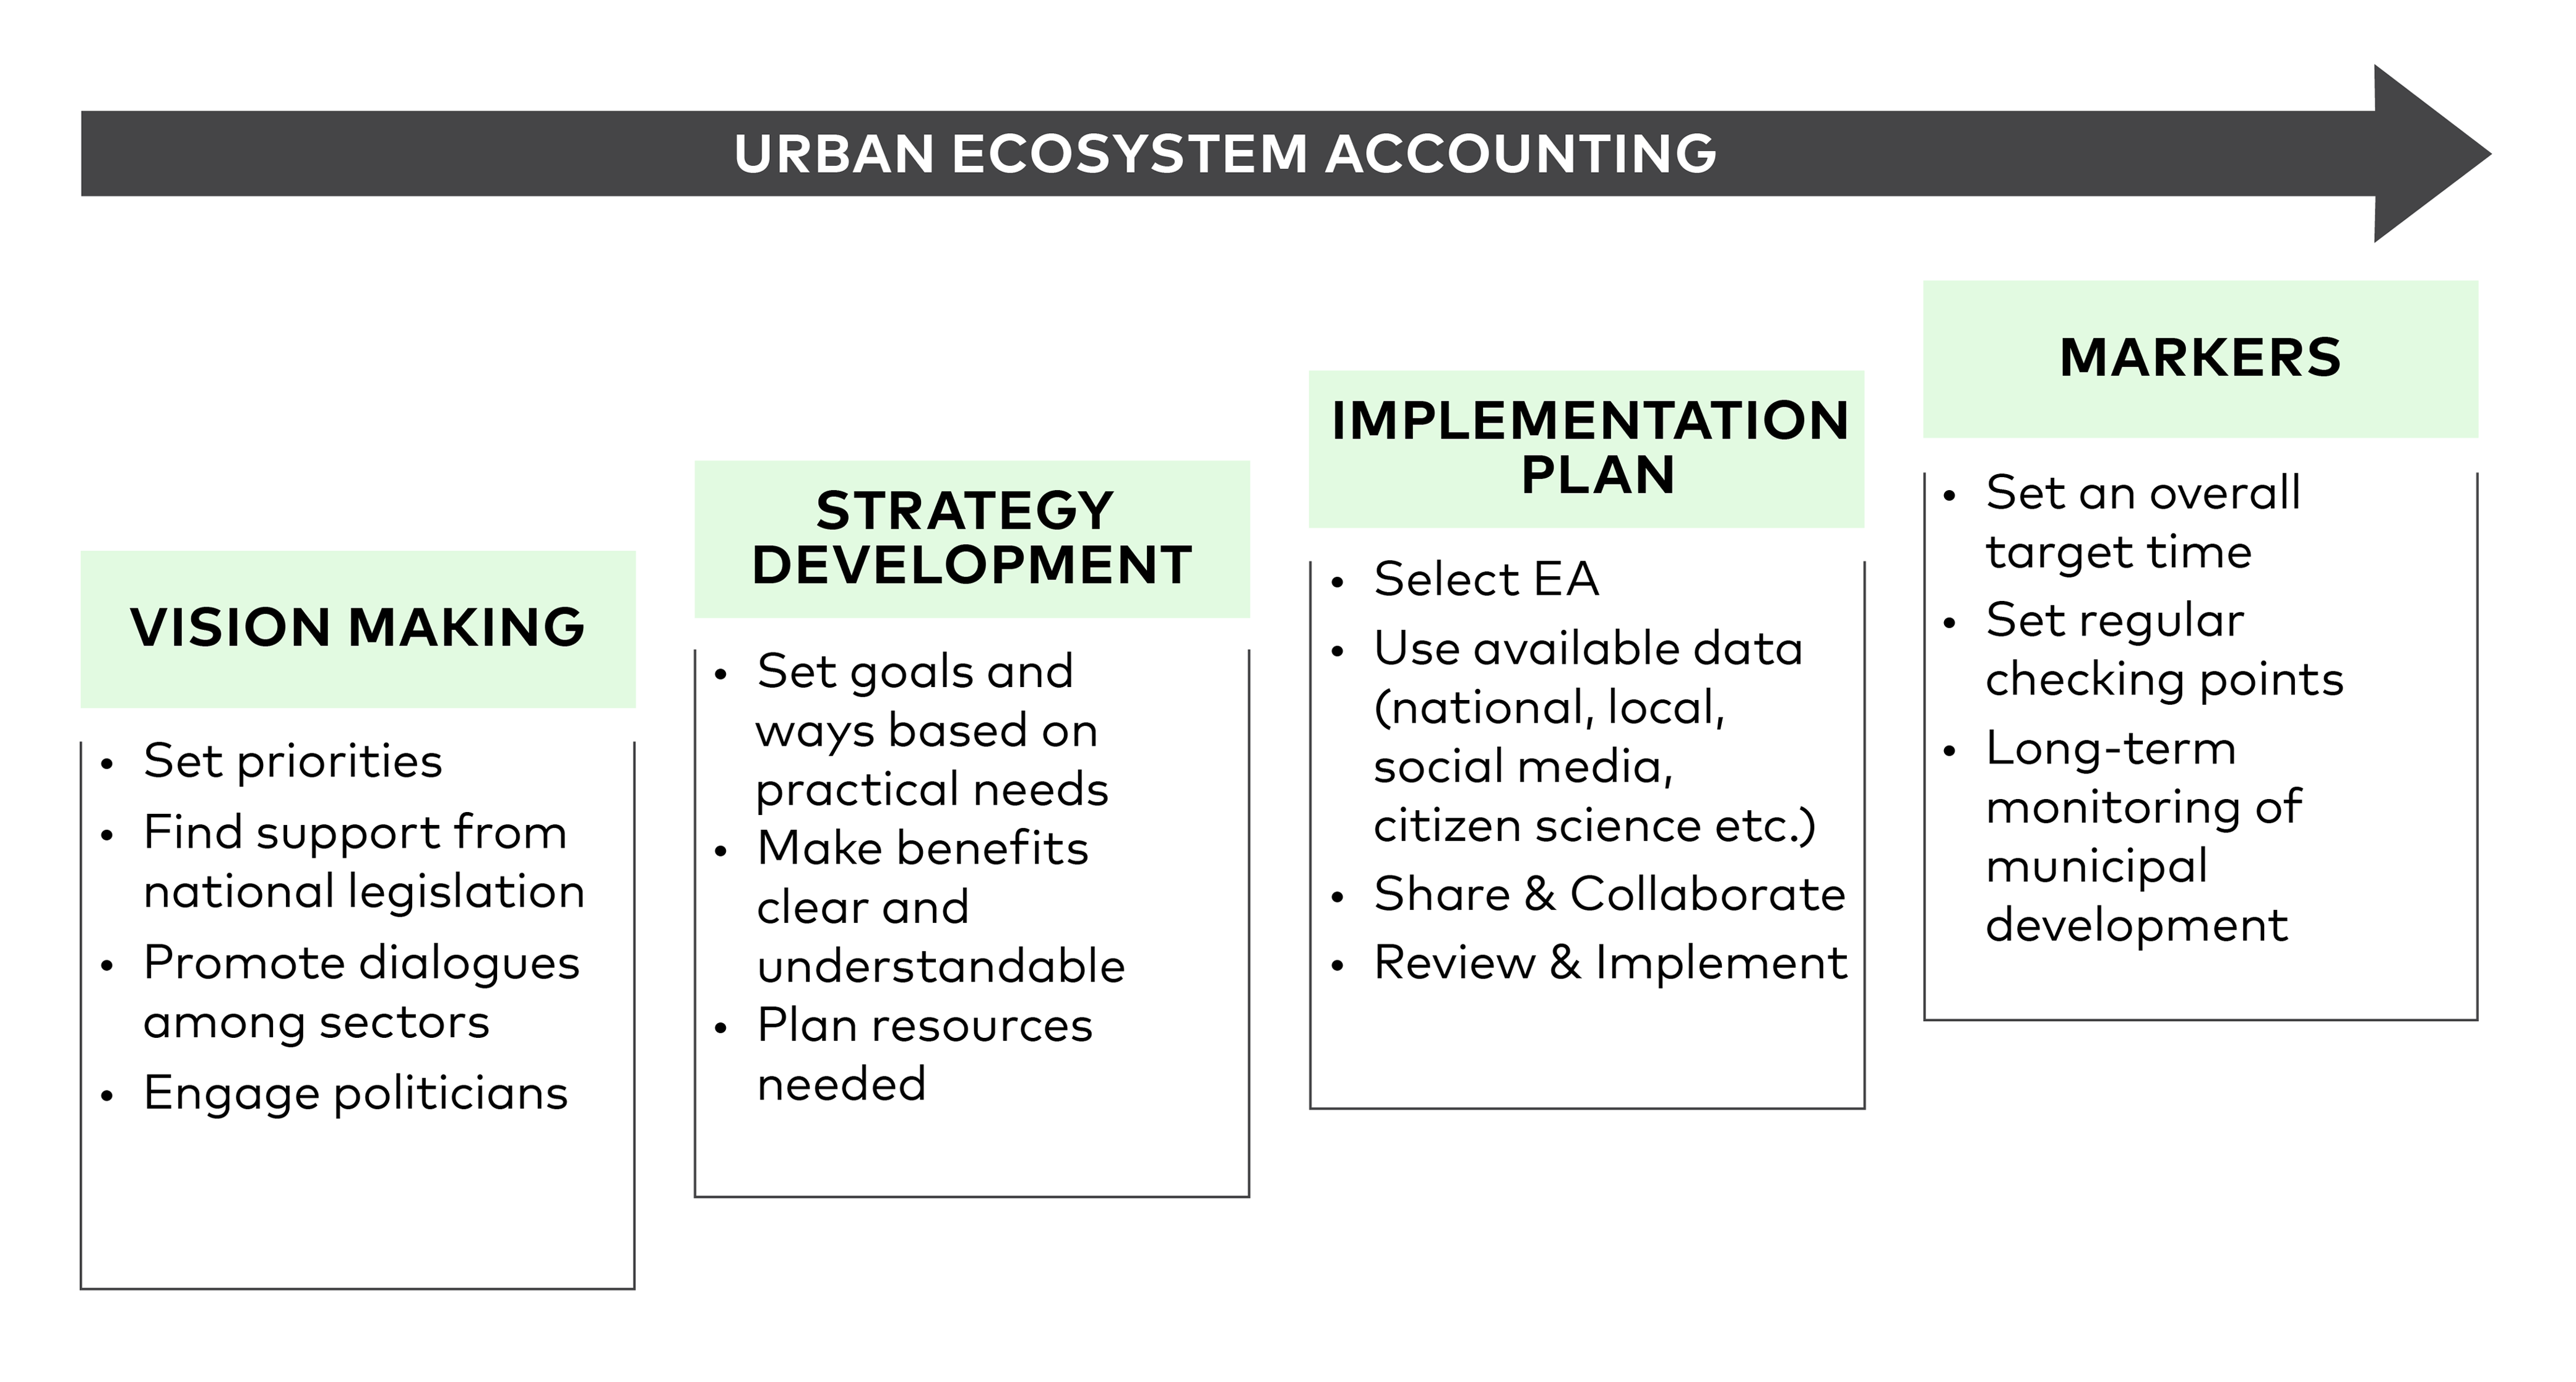
Figure 22. Draft roadmap for urban ecosystem accounting.
E. An example of a visual roadmap for connecting ecosystem accounting with people’s health
The Oslo case study presented possible avenues for further research linking the existing recreation area accounts to municipal accounting of public health benefits (Figure 23). Discussion revolved around whether extending partial pilot experiences with urban ecosystem accounting to health impacts would be ‘a step too far’ relative to research and municipal capacities. Despite these constraints there was support for experimenting with aka ‘thematic health accounts’ because it presents a complementary approach to valuing the importance of urban nature, which could be used with other physical and economic indicators provided by the SEEA EA approach.
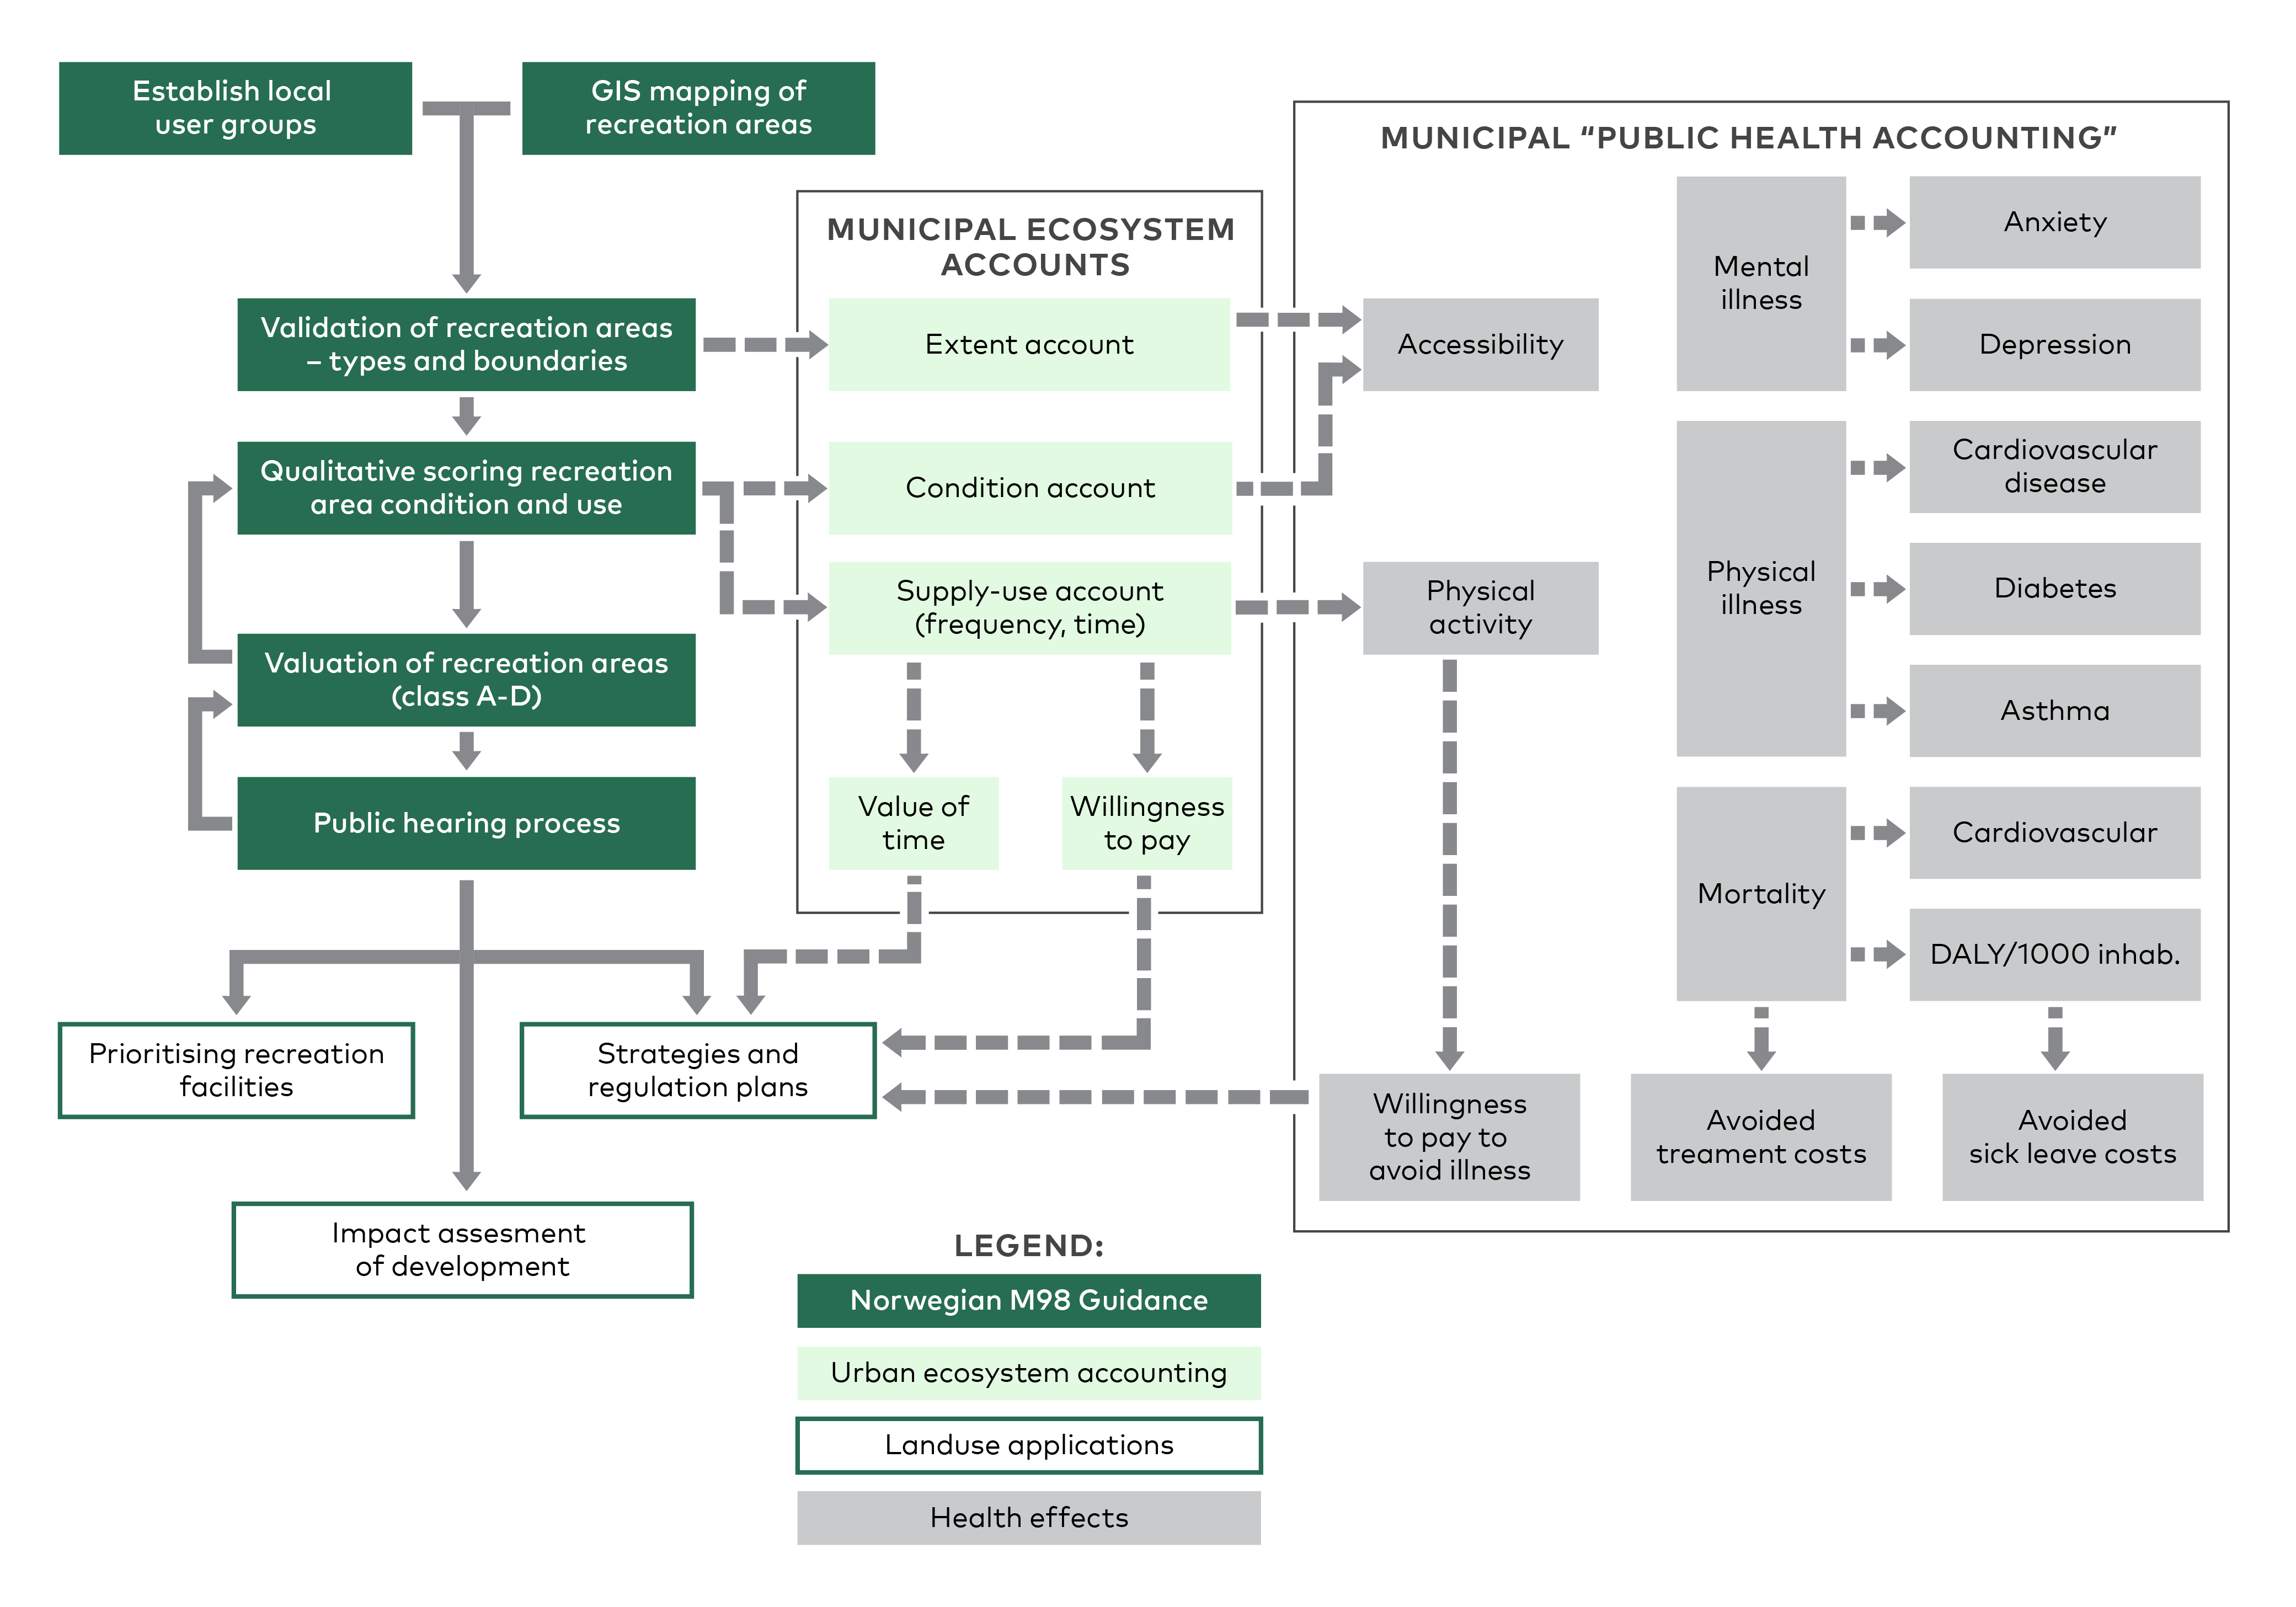
Figure 23. Example of a roadmap for extending recreation accounting to health impacts in urban areas in Norway (Source: adapted from Cimburova and Barton, 2021.
References
Barton, D.N., Stange, E., Blumentrath, S., Vagnes Traaholt, N., 2015.
Economic valuation of ecosystem services for policy. A pilot study on green infrastructure in Oslo [NINA Report 1114, 77p]. Available at https://www.researchgate.net/publication/284032018_Economic_valuation_of_ecosystem_services_for_policy_A_pilot_study_on_green_infrastructure_in_Oslo.
Barton, D.N., Caparrós, A., Conner, N., Edens, B., Piaggio, M., Turpie, J. 2019a.
Discussion paper 5.1: Defining exchange and welfare values, articulating institutional arrangements and establishing the valuation context for ecosystem accounting. Paper drafted as input into the revision of the System on Environmental-Economic Accounting 2012–Experimental Ecosystem Accounting. Version of 25 July 2019. Available at https://seea.un.org/sites/seea.un.org/files/documents/EEA/discussion_paper_5.1_defining_values_for_erg_aug_2019.pdf.
Barton, D.N., Obst, C., Caparrós, A., Dadvand, P., Fenichel, E., Yale, U., Hein, L., McPhearson, T., Zulian, G. 2019b.
Discussion paper 10: Recreation services from ecosystems. Paper submitted to the Expert Meeting on Advancing the Measurement of Ecosystem Services for Ecosystem Accounting, New York, 22–24 January 2019 and subsequently revised. Version of 25 March 2019. Available at https://seea.un.org/sites/seea.un.org/files/discussion_paper_10_-_recreation_services_final_0.pdf.
Buttafuoco, G., Guagliardi, I., Tarvainen, T., and Jarva, J. 2017.
A multivariate approach to study the geochemistry of urban topsoil in the city of Tampere, Finland. Journal of Geochemical Exploration. 18, 191–204.
Brander, L. 2013. Guidance manual on value transfer methods for ecosystem services. UNEP.
Cimburova, Z., Barton, D.N. 2021.
Testing GIS data-driven mapping and valuation of recreation areas in Oslo. NINA Report 1931. Norwegian Institute for Nature Research.
Cole, S., Lindhjem, H., Zandersen, M., Angelidis, I., Barton, D.N. 2018.
Nordic urban nature recreation. How to practically integrate economic values in decision-making. TemaNord 2018:529. Nordic Council of Ministers.
Grammatikopoulou, I. & Vačkářová, D. 2021.
The value of forest ecosystem services: A meta-analysis at the European scale and application to national ecosystem accounting. Ecosystem Services, 48, p.101262.
Gundersen, V., Tangeland, T., Kaltenborn, B.P. 2015.
Planning for recreation along the opportunity spectrum: The case of Oslo, Norway. Urban Forestry & Urban Greening 14, 210–217.
Hanssen, F., Barton, D.N., Venter, Z.S., Nowell, M.S., Cimburova, Z., 2021.
Utilizing LiDAR data to map tree canopy for urban ecosystem extent and condition accounts in Oslo. Ecological Indicators, 130, 108007. https://doi.org/10.1016/j.ecolind.2021.108007.
Heris, M., Bagstad, K.J., Rhodes, C., Troy, A., Middel, A., Hopkins, K.G., Matuszak, J. 2021.
Piloting urban ecosystem accounting for the United States. Ecosystem Services, 48, 101226. https://doi.org/10.1016/j.ecoser.2020.101226.
Huizinga, J., Moel, H. de, Szewczyk, W. (2017).
Global flood depth-damage functions. Methodology and the database with guidelines. EUR 28552 EN. https://doi.org/10.2760/16510.
Miljødirektoratet, 2013. Kartlegging og verdsetting av friluftslivsområder. Rapport M98-2013 (Mapping and valuation of recreation areas). Norwegian Environment Agency.
MML. 2020. Suomen pinta-ala kunnittain 1.1.2020. Maanmittauslaitos (MML). Available at https://www.maanmittauslaitos.fi/tietoa-maanmittauslaitoksesta/organisaatio/tilastot (accessed 25.11.2021).
Olsson, T., Jakkila, J., Veijalainen, N., Backman, L., Kaurola, J., and Vehviläinen, B. 2015. Impacts of climate change on temperature, precipitation and hydrology in Finland – studies using bias corrected Regional Climate Model data, Hydrol. Earth Syst. Sci., 19, 3217–3238, https://doi.org/10.5194/hess-19-3217-2015.
ONS. 2020. UK Natural Capital: ecosystem accounts for urban areas. Initial natural capital accounts containing information about green space in urban areas. Office for National Statistics [WWW Document]. https://www.ons.gov.uk/economy/environmentalaccounts/bulletins/uknaturalcapital/ecosystemaccountsforurbanareas (accessed 6.1.21).
Oslo Kommune. 2018. Fagrapport Grøntregnskap: en måling av grønnstruktur i Oslos byggesone. Plan og Bygningsetaten.
Oslo Kommune. 2020. Statistikk. Available at https://www.oslo.kommune.no/statistikk/.
Pirkkalan kunta, 2020. Pirkkalan luonnon monimuotoisuusohjelma 2020–2030. Available in Finnish at https://www.pirkkala.fi/library/files/60816ad7475a6c0eaf0859ee/Pirkkalan_luonnon_monimuotoisuusohjelma__LOPULLINEN.pdf (accessed 3.12.2021).
Ranta P., Rahkonen P. 2008.
Tampereen kaupunkiluonto. Opas kaupunkiekologiaan (A guide to urban ecology of the city of Tampere). Tampere-Seura. 235 pp.
Ranta, P., Viljanen, V. 2011.
Vascular plants along an urban-rural gradient in the city of Tampere, Finland. Urban Ecosyst 14, 361–376. https://doi.org/10.1007/s11252-011-0164-9.
Statistics Finland. 2021. Population according to age (1-year 0-112) and sex, 1972–2020. Statistics Finland. Available at https://pxnet2.stat.fi/PXWeb/pxweb/en/StatFin/StatFin__vrm__vaerak/statfin_vaerak_pxt_11rd.px/ (accessed 27.8.21).
Simkin, J., Ojala, A., Tyrväinen, L. 2020.
Restorative effects of mature and young commercial forests, pristine old-growth forest and urban recreation forest - A field experiment. Urban Forestry & Urban Greening, 48, 126567.
United Nations. 2021. System of Environmental-Economic Accounting— Ecosystem Accounting: Final Draft, Prepared by the Committee of Experts on Environmental-Economic Accounting.
Vallecillo Rodriguez, S., Kakoulaki, G., La Notte, A., Feyen, L., Dottori, F. and Maes, J. 2020.
Accounting for changes in flood control delivered by ecosystems at the EU level, Ecosystem Services, 44, 101142. https://doi.org/10.1016/j.ecoser.2020.101142.
Venter, Z. S., Barton, D. N., Gundersen, V., Figari, H., Nowell, M. S. 2020.
Urban nature in a time of crisis: recreational use of green space increases during the COVID-19 outbreak in Oslo, Norway. Environ. Res. Lett., 15, 104075.
World Bank. 2021.
GDP per capita (current US$) - Finland. Available at https://data.worldbank.org/indicator/NY.GDP.PCAP.CD?locations=FI (accessed 27.8.21).
Zou, Z., Wu, T., Xiao, Y., Song, C., Wang, K., Ouyang, Z. 2020.
Valuing natural capital amidst rapid urbanization: assessing the gross ecosystem product (GEP) of China’s ‘Chang-Zhu-Tan’ megacity. Environ. Res. Lett., 15, 124019. https://doi.org/10.1088/1748-9326/abc2f8
Zulian, G., Thijssen, M., Günther, S. Maes, J., 2018.
Enhancing resilience of urban ecosystems through green infrastructure (EnRoute). Progress report, EUR 29048 EN, Publications Office of the European Union, Luxembourg. ISBN 978-92-79-77697-7, https://op.europa.eu/en/publication-detail/-/publication/071c8afd-1071-11e8-9253-01aa75ed71a1/language-en.
About this publication
Urban experimental ecosystem accounting pilot in the Nordic cities
Leena Kopperoinen, David N. Barton, Laura Costadone, Pekka Hurskainen, Marion Kruse, Tin-Yu Lai
ISBN 978-92-893-7453-8 PDF
ISBN 978-92-893-7454-5 ONLINE
http://dx.doi.org/10.6027/temanord2022-557
TemaNord 2022:557
© Nordic Council of Ministers 2022
Published: 29-11-2022
Cover photo: Pirkkala, Forest track with people. Tin-Yu Lai
Disclaimer
This publication was funded by the Nordic Council of Ministers. However, the content does not necessarily reflect the Nordic Council of Ministers’ views, opinions, attitudes or recommendations.
Rights and permissions
This work is made available under the Creative Commons Attribution 4.0 International license (CC BY 4.0) https://creativecommons.org/licenses/by/4.0.
Translations: If you translate this work, please include the following disclaimer: This translation was not produced by the Nordic Council of Ministers and should not be construed as official. The Nordic Council of Ministers cannot be held responsible for the translation or any errors in it.
Adaptations: If you adapt this work, please include the following disclaimer along with the attribution: This is an adaptation of an original work by the Nordic Council of Ministers. Responsibility for the views and opinions expressed in the adaptation rests solely with its author(s). The views and opinions in this adaptation have not been approved by the Nordic Council of Ministers.
Third-party content: The Nordic Council of Ministers does not necessarily own every single part of this work. The Nordic Council of Ministers cannot, therefore, guarantee that the reuse of third-party content does not infringe the copyright of the third party. If you wish to reuse any third-party content, you bear the risks associated with any such rights violations. You are responsible for determining whether there is a need to obtain permission for the use of third-party content, and if so, for obtaining the relevant permission from the copyright holder. Examples of third-party content may include, but are not limited to, tables, figures or images.
Photo rights (further permission required for reuse):
Any queries regarding rights and licences should be addressed to:
Nordic Council of Ministers/Publication Unit
Ved Stranden 18
DK-1061 Copenhagen
Denmark
pub@norden.org
Nordic co-operation
Nordic co-operation is one of the world’s most extensive forms of regional collaboration, involving Denmark, Finland, Iceland, Norway, Sweden, and the Faroe Islands, Greenland and Åland.
Nordic co-operation has firm traditions in politics, economics and culture and plays an important role in European and international forums. The Nordic community strives for a strong Nordic Region in a strong Europe.
Nordic co-operation promotes regional interests and values in a global world. The values shared by the Nordic countries help make the region one of the most innovative and competitive in the world.
The Nordic Council of Ministers
Nordens Hus
Ved Stranden 18
DK-1061 Copenhagen
pub@norden.org
Read more Nordic publications on www.norden.org/publications