
- Front page
- Authors
- Table of contents
- Summary
- Resumé
- 1 Introduction
- 2 Approach
- 2.1 Literature review/desktop study
- 2.2 Interviews
- 2.3 Collaborative workshop
- 3 Background
- 3.1 Waste prevention
- 3.2 Monitoring waste prevention
- 3.3 Digitalisation
- 4 EU requirements for monitoring of waste prevention
- 4.1 Waste prevention programmes
- 4.2 Monitoring waste prevention
- 4.3 Monitoring of reuse
- 4.4 Circular Economy monitoring
- 4.5 Other relevant EU-driven processes
- 4.6 European Strategy for Data
- 4.7 Summary
- 5 Monitoring Waste Prevention: approaches in the Nordic Authorities
- 5.1 Waste prevention in the Nordic countries
- 5.2 Waste prevention monitoring in Nordic countries
- 5.3 Nordic plans for meeting the reuse reporting requirements
- 5.4 Current initiatives
- 5.5 Institutional barriersN/A
- 5.6 Summary
- 6 Monitoring waste prevention: international experience
- 6.1 Publicly driven experience from European countries
- 6.2 Non-governmental experience
- 6.3 Digital approaches
- 6.4 B2G data sharing
- 7 Novel waste prevention monitoring initiatives
- 8 Future potential for monitoring waste prevention
- 8.1 Digital product data
- 8.2 Transactions, exchanges and people
- 8.3 Infrastructure
- 8.4 Communication
- 9 Conclusions
- 10 Roadmap – toward better monitoring of waste prevention in the Nordic countries
- 10.1 Organisation
- 10.2 Identify and pilot data
- 10.3 Implementation
- 11 Literature
- Annex 1 – National factsheet – Sweden
- Annex 2 – National Factsheet – Denmark
- Annex 3 – National Factsheet – Norway
- Annex 4 – National Factsheet – Finland
- Annex 5 – informant organisations
- Annex 6 – Case studies
- Case 1: Accessibility of reusable textile and WEEE bring banks
- Case 2: Availability of municipal sharing services
- Case 3: Repair activity
- Case 4: Materiaalitori
- Case 5: Substances of Very High Concern (SVHCs)
- Case 5: Substances of Very High Concern (SVHCs)
- Case 6: Development of car sharing
- Case 7: Number of companies communicating about circular economy
- Case 8: Expiration date on food
- Case 9: The second-hand effect
- Case 10: Reuse activity
- Case 11: Concular
- Case 11: Concular
- Case 12: Circular public procurement
- Case 13: Vakansa
- Case 14: Business engagement in waste prevention and reuse
- Case 15: Waste reduction in food retail
- About this publication
MENU
Measuring waste prevention and reuse: digital opportunities
Using the digitalisation of society to inform policy
Authors
Bjørn Bauer (PlanMiljø), David McKinnon (PlanMiljø), Nina Lander Svendsen (PlanMiljø), Kia Egebæk (PlanMiljø),
John Baxter (Norsus), Yoko Dams (VITO), Leonidas Milios (IIIEE), Pauliina Saari (Gaia)
Contents
This publication is also available online in a web-accessible version at https://pub.norden.org/temanord2022-536.
Summary
Society is becoming increasingly digitalised – our actions and interactions are recorded and generate flows of data that together describe where we are and what we are doing, what we are using, buying, and selling. Our material world is also increasingly digitalised, with products in the real world linked to digital twins, online databases and leaving digital footprints.
Waste prevention and reuse are critical components of the transition to a circular economy. Minimising waste generation not only means that there is less waste to manage, but it also means that fewer materials are flowing into and out of the economy in a linear fashion, reducing pressures from material extraction, processing, manufacturing and associated transport. Measuring waste prevention and reuse is, however, not easily achieved using existing waste and material flow statistics. There are too many variables that influence waste generation to be able to draw a causal line from policy initiatives aiming to minimise waste, to actual changes in waste generation.
In the absence of official data and statistics that can comprehensively inform on waste prevention and reuse, there is a hope that the data flowing around our digital society can be harnessed to generate policy-relevant indicators. This project is a first step in that process. It maps the EU reporting demands for waste prevention and reuse and the methods currently employed in the Nordic countries to measure waste prevention and reuse. It then investigates the methods used in other European countries before developing a suite of case studies of novel methods for measuring waste prevention and reuse. Based on all these findings, the project elaborates where the greatest potentials lie for improving the monitoring of waste prevention and reuse, and presents a roadmap for improving the monitoring of waste prevention in the Nordic countries.
Monitoring Waste prevention and reuse in the Nordic countries
The Nordic countries have circular economy action plans and waste prevention programmes in place, yet use few indicators monitor waste prevention. Most of these indicators relate to waste volumes. However, Denmark uses indicators on eco-design and resource productivity, while Sweden uses indicators on consumption of textiles, and Norway and Finland monitor reuse of EEE through the respective national EPR systems.
Finland appears to be a front runner for meeting the EU reporting requirements on reuse – the Finnish authorities have already initiated reuse surveys for the relevant product groups and are developing a waste and product data management system, which should provide detailed information on a broad range of issues, including waste prevention. The Finnish authorities have also been driving an EU-funded project on promoting the Circular Economy – Circwaste – which also provides insight into waste prevention and reuse.
Leading the way – example of useful data
The case studies developed in the project illustrate that promising and informative examples of digital tools and methods are being used to measure waste prevention both in the Nordic countries and in other European countries, initiated within the private and public sectors. These point toward a host of promising types of data that could be further exploited in the future. In particular, online platforms for sharing products and spaces and selling second-hand goods provide an excellent opportunity to tap into second- and third-hand transactions, while commercial data on produce stock management could provide valuable insight into food waste prevention in particular. The internet provides a wealth of data that can be aggregated to inform on the communication around waste prevention both from private citizens and companies. There is little to prevent these case studies being implemented in other Nordic countries that generate the relevant data, subject to negotiated access to that data.
Future potentials for digital monitoring
In addition to the examples outlined in the case studies, a plethora of additional alternatives have also been identified that could be harnessed in the future to inform on waste prevention and reuse. These include:
- Digital product passports and product environmental footprints.
- Product tracking and product ID through sensor and tagging technologies.
- Data from these technologies can be used to inform on product lifespans and repair activities.
- Data detailing transactions. This can come from a variety of sources: online marketplaces, sharing platforms, product service systems platforms, (public and private) procurement systems and potentially also payments systems.
- Could be used to monitor reuse activity (as well as quantity and value) as well as use rates for shared-use products.
- Location and access data on reuse and waste prevention infrastructure, for example reuse shops, flea markets, and reuse bins, repair shops and cafes and zero-waste shops.
- Could be used to monitor the physical framework conditions for reuse.
- Internet publishing: including company web pages, social media, news outlets, libraries, and journals, as well as analysing search trends in search engines like Google.
- Could be used to inform on the actions being taken, how actively reuse and waste prevention is discussed on popular culture, the prevalence of these subject in scientific community, and how often people seek second-hand products.
Main challenges
Identifying relevant data streams, accessing those data streams, and analysing and integrating the data into a monitoring framework faces a variety of challenges:
- Capacity in authorities responsible for waste prevention monitoring: Waste prevention itself requires a significant cross departmental effort, although responsibility for waste prevention often lies with the waste departments within environmental authorities. Monitoring waste prevention by harnessing the digitalisation of society also requires competencies that are not typically found within the responsible authorities.
- Negotiating access to privately held data: Much of the data identified is held in private hands or is otherwise not publicly available. Accessing this data will require negotiations with the data owners. Some data may also be business sensitive, so approaches must be sensitive to the need to aggregate and/or anonymise data. The developing conventions around B2G data sharing in the EU Commission’s Digital Strategy could help ease this process.
- GDPR and other data privacy laws: Data on individuals may be subject to GDPR and other privacy legislation. This is not an ultimate barrier but does mean that access to and use of data needs to be sensitive to the legal framework.
Next steps … recommendations
Moving towards a more comprehensive monitoring framework for reuse and waste prevention harnessing the digitalisation of society will require a structured approach from the relevant authorities in the Nordic countries. There is ample opportunity to collaborate on the development of indicators: to exchange experiences, coordinate pilot indicators, build internal capacities and expertise, and test technical solutions.
The project provides a roadmap toward digital monitoring of waste prevention and reuse. Key steps in the near future include:
- Formulate a strategic approach to measuring waste prevention
Ensure that the data and indicators provide useful, policy-relevant information on waste prevention. - Ensure technical competencies are in place
May require additional cooperation across government agencies (including with statistical offices or other cross governmental data processing entities), expanding internal capacities or engaging external data experts. - Identify and engage with potential data sets and data providers
Take a point of departure in the data sources and types identified in this report. - Initiate pilot indicators
To assess the suitability of developing ongoing, policy relevant indicators based on relevant data sources. - Maintain and strengthen Nordic cooperation and knowledge sharing
This will help maximise the knowledge generated in the process of developing waste prevention and reuse indicators and strengthen capacities within the individual Nordic countries.
While this project seeks to identify potential data sources for indicators of waste prevention and reuse, a similar approach could be used to identify and develop indicators informing a host of other policy domains. One of the most immediate advantages of harnessing the data flowing around out digital society to inform policy processes is that there is a potential for a more rapid feedback loop, potentially enabling more responsive policymaking and a better understanding of policy impacts.
Resumé
Samfundet bliver mere og mere digitaliseret – vores handlinger og interaktioner registreres og genererer datastrømme, der tilsammen beskriver hvor vi er, hvad vi laver og hvad vi bruger, køber og sælger. Vores materielle verden bliver også i stigende grad digitaliseret, med produkter i den virkelige verden knyttet til digitale tvillinger, online databaser og efterladelse af digitale fodspor.
Affaldsforebyggelse og genbrug er kritiske komponenter i omstillingen til en cirkulær økonomi. Minimering af affaldsgenerering betyder ikke kun, at der er mindre affald at håndtere, men det betyder også, at færre materialer flyder ind og ud af økonomien på en lineær måde, hvilket reducerer presset fra materialeudvinding, forarbejdning, fremstilling og tilhørende transport. Måling af affaldsforebyggelse og genbrug er dog ikke let at opnå ved hjælp af eksisterende affalds- og materialestrømsstatistik. Der er for mange variabler, der påvirker affaldsproduktionen til at kunne pege på en kausalsammenhæng mellem politiske initiativer, der sigter mod at minimere affald, og faktiske ændringer i affaldsproduktionen.
I mangel af officielle data og statistikker, der udtømmende kan informere om affaldsforebyggelse og genbrug, er der et håb om, at de data, der flyder rundt i vores digitale samfund, kan udnyttes til at generere politikrelevante indikatorer. Dette projekt er et første skridt i den proces. Det kortlægger EU's rapporteringskrav til affaldsforebyggelse og -genbrug og de metoder, der i dag anvendes i de nordiske lande til at måle affaldsforebyggelse og -genbrug. Det undersøger derefter de metoder, der anvendes i andre europæiske lande, før der udvikles en række casestudier af nye metoder til måling af affaldsforebyggelse og genbrug. På baggrund af alle disse resultater uddyber projektet, hvor de største potentialer ligger for at forbedre overvågningen af affaldsforebyggelse og genbrug, og præsenterer en køreplan for at forbedre overvågningen af affaldsforebyggelse i de nordiske lande.
Overvågning af affaldsforebyggelse og genbrug i de nordiske lande
De nordiske lande har cirkulær økonomi handlingsplaner og affaldsforebyggelsesprogrammer på plads, men bruger få indikatorer til at overvåge affaldsforebyggelse. De fleste af disse indikatorer vedrører affaldsmængder. Danmark anvender dog indikatorer for eco-design og ressourceproduktivitet, mens Sverige anvender indikatorer for forbrug af tekstiler, og Norge og Finland overvåger genbrug af EEE (elektrisk og elektronisk udstyr) gennem de respektive nationale EPR-systemer (udvidet producent ansvar).
Finland ser ud til at være frontløber på at opfylde EU's rapporteringskrav om genbrug – de finske myndigheder har allerede iværksat genbrugsundersøgelser for de relevante produktgrupper og er ved at udvikle et affalds- og produktdatahåndteringssystem, som skal give detaljerede oplysninger om forskellige forhold, herunder affaldsforebyggelse. De finske myndigheder har også drevet et EU-finansieret projekt om at fremme den cirkulære økonomi – Circwaste – som også giver indsigt i affaldsforebyggelse og genbrug.
Viser vejen – eksempel på nyttige data
De casestudier, der er udviklet i projektet, illustrerer, at lovende og informative eksempler på digitale værktøjer og metoder igangsat inden for den private og offentlige sektor bliver brugt til at måle affaldsforebyggelse både i de nordiske lande og i andre europæiske lande. Disse peger mod et væld af lovende typer data, som kan udnyttes yderligere i fremtiden. Især online platforme til deling af produkter og ledige lokaler og salg af brugte varer giver en glimrende mulighed for at understøtte genbrugskøb, mens kommercielle data om håndtering af produktlager kunne give værdifuld indsigt i især forebyggelse af madspild. Internettet giver et væld af data, der kan samles for at informere om kommunikationen om affaldsforebyggelse både fra private borgere og virksomheder. Der er ikke meget til hinder for, at disse casestudier implementeres i andre nordiske lande, der genererer de pågældende data.
Fremtidige potentialer for digital overvågning
Ud over de eksempler, der er skitseret i casestudierne, er der også identificeret et væld af yderligere alternativer, som kunne udnyttes i fremtiden til at informere om affaldsforebyggelse og genbrug. Disse omfatter:
- Digitale produktpas og produkts miljøaftryk.
- Produktsporing og produkt-id gennem sensor- og tagging-teknologier.
- Data fra disse teknologier kan bruges til at informere om produktets levetid og reparationsaktiviteter.
- Data, der beskriver transaktioner. Dette kan komme fra en række forskellige kilder: online markedspladser, deleplatforme, produktservicesystemplatforme, (offentlige og private) indkøbssystemer og potentielt også betalingssystemer.
- Kunne bruges til at overvåge genbrugsaktivitet (såvel som mængde og værdi) samt brugsrater for produkter til delt brug.
- Lokalisering og adgang til data om genbrug og affaldsforebyggende infrastruktur; for eksempel genbrugsbutikker, loppemarkeder og genbrugsspande, reparationsværksteder og cafeer og nul-affaldsbutikker.
- Kunne bruges til at overvåge de fysiske rammebetingelser for genbrug.
- Internetpublicering: inklusive firmawebsider, sociale medier, nyhedsmedier, biblioteker og tidsskrifter samt analyse af søgetendenser i søgemaskiner som Google.
- Kunne bruges til at informere om de tiltag, der anvendes, hvor aktivt genbrug og affaldsforebyggelse diskuteres i populærkultur, udbredelsen af disse emner i det videnskabelige samfund, og hvor ofte folk søger brugte produkter.
Hovedudfordringer
At identificere relevante datastrømme, få adgang til disse datastrømme og analysere og integrere dataene i en overvågningsramme står over for en række udfordringer:
- Kapacitet i myndigheder med ansvar for overvågning af affaldsforebyggelse: Affaldsforebyggelse i sig selv kræver en betydelig tværgående indsats, selvom ansvaret for affaldsforebyggelse ofte ligger hos affaldsafdelingerne i miljømyndighederne. Overvågning af affaldsforebyggelse ved at udnytte digitaliseringen af samfundet kræver også kompetencer, som ikke typisk findes hos de ansvarlige myndigheder.
- Forhandling af adgang til private data: Meget af de identificerede data opbevares i private hænder eller er på anden måde ikke offentligt tilgængelige. Adgang til disse data vil kræve forhandlinger med dataejerne. Nogle data kan også være forretningsfølsomme, så tilgang skal være følsom overfor behovet for at samle og/eller anonymisere data. De udviklende konventioner omkring B2G-datadeling i EU-Kommissionens digitale strategi kan hjælpe med at lette denne proces.
- GDPR og andre databeskyttelseslove: Data om enkeltpersoner kan være underlagt GDPR og anden privatlivslovgivning. Dette er ikke en ultimativ barriere, men betyder, at adgang til og brug af data skal være følsom over for de juridiske rammer.
Næste trin … anbefalinger
At bevæge sig mod en mere omfattende overvågningsramme for genbrug og affaldsforebyggelse, der udnytter digitaliseringen af samfundet, vil kræve en struktureret tilgang fra de relevante myndigheder i de nordiske lande. Der er rig mulighed for at samarbejde om udvikling af indikatorer: at udveksle erfaringer, koordinere pilotindikatorer, opbygge intern kapacitet og ekspertise og teste tekniske løsninger.
Projektet giver en køreplan mod digital overvågning af affaldsforebyggelse og genbrug. Nøgletrin i den nærmeste fremtid omfatter:
- Formuler en strategisk tilgang til måling af affaldsforebyggelse
Sørg for, at data og indikatorer giver nyttig, politikrelevant information om affaldsforebyggelse. - Sørg for, at tekniske kompetencer er på plads
Kan kræve yderligere samarbejde på tværs af offentlige myndigheder (herunder med statistiske kontorer eller andre tværstatslige databehandlingsenheder), udvidelse af intern kapacitet eller inddragelse af eksterne dataeksperter. - Identificer og interager med potentielle datasæt og dataleverandører
Tag udgangspunkt i de datakilder og typer, der er identificeret i denne rapport. - Igangsætte pilotindikatorer
For at vurdere egnetheden af at udvikle løbende, politikrelevante indikatorer baseret på relevante datakilder. - Vedligeholde og styrke nordisk samarbejde og videndeling
Dette vil bidrage til at maksimere den viden, der genereres i processen med at udvikle indikatorer for affaldsforebyggelse og genbrug og styrke kapaciteten i de enkelte nordiske lande.
Mens dette projekt søger at identificere potentielle datakilder til indikatorer for affaldsforebyggelse og genbrug, kunne en lignende tilgang bruges til at identificere og udvikle indikatorer, der informerer en lang række andre politikområder. En af de mest umiddelbare fordele ved at udnytte de data, der flyder rundt i det digitale samfund, til at informere om politiske processer, er, at der er et potentiale for et hurtigere feedback-loop, hvilket potentielt muliggør en mere lydhør politikudformning og en bedre forståelse af politiske konsekvenser.
1 Introduction
Waste prevention is a critical component of the waste hierarchy. Minimising waste generation not only means that there is less waste to manage, but it also indicates that fewer materials are flowing though the economy in a linear fashion, and as such is a key component of a circular economy. Measuring waste prevention is not easily achieved using existing waste generation and material flow statistics – there are many variables that influence waste generation, many of which have nothing to do with waste prevention policy or initiatives.
Society is becoming increasingly digitalised – our actions and interactions are recorded and generate flows of data that together describe where we are, what we are doing and what we are using, buying, and selling. Our material world is also increasingly digitalised, with products in the real world linked to digital twins, online databases and digital footprints.
In the absence of official data and statistics that can comprehensively inform on waste prevention and reuse, there is a hope that the data flowing around our digital society can be harnessed to generate policy-relevant indicators. This requires identification of relevant data streams, negotiating access to this data, analysing and combining data in novel and innovative ways and interpreting the results to inform on the multitude components of waste prevention and reuse.
The first step in this study was to examine methods currently employed by the relevant authorities in the Nordic countries to monitor waste prevention and reuse. A next step was to develop informative case studies of novel approaches used in the Nordic countries and elsewhere, and consider the potential now and in the future for monitoring waste prevention and reuse by tapping into society’s digital shadow. Finally, a roadmap was developed detailing the key steps toward harnessing this data and how the Nordic countries can best cooperate in this task.
The study was commissioned by the Nordic Council of Ministers.
2 Approach
A variety of techniques were applied to generate new insights into how the digitalisation of our society and economy can be harnessed to inform on waste prevention and reuse in the Nordic countries.
These included literature review, expert interviews, and a collaborative workshop. Each of the methods are briefly described below.
2.1 Literature review/desktop study
An extensive literature review was conducted to identify:
- EU and national monitoring and monitoring requirements associated with waste prevention
- Cases where digitalisation has contributed to monitoring waste prevention both publicly and privately initiated
- Other digital tools and approaches that can potentially contribute to monitor waste prevention.
2.2 Interviews
In-depth interviews were conducted with national public agencies, data owners, and experts (see full list of informant organisation in Annex 5. This helped to map the current level of waste prevention monitoring in each of the Nordic countries, and to get further insights into 15 selected cases on digital monitoring of waste prevention as well as future opportunities. The interviews were based on semi-structured interview guides targeted at the specific informant.
2.3 Collaborative workshop
An online collaborative workshop was conducted to scope future potential for digital monitoring of waste prevention and reuse, as well as develop specific possibilities based on known data streams.
The workshop brought together circular economy- and data experts, and those working in the intersection between these fields, to develop data journeys (data source, collection, analytics, indicator) related to waste prevention strategies of reuse, repair, and prolonging of product lifetimes.
3 Background
This section provides a brief overview of the key concepts used in the rest of the report. First, the concept waste prevention is explained within the context of the circular economy. Conceptual models of waste prevention monitoring are then elaborated to provide an understanding of why current statistics and data streams do not adequately inform waste prevention policymaking. Lastly, a working understanding of digitalisation is developed with a focus on the generation and exploitation of new and novel data streams.
3.1 Waste prevention
The EU Waste Framework Directive (WFD) implements the waste hierarchy, which places waste prevention as the top priority followed by preparation for reuse, recycling, recovery and disposal. Waste prevention is defined as “measures taken before a substance, material or product has become waste, that reduce:
- The quantity of waste, including through the re-use of products or the extension of the life span of products;
- the adverse impacts of the generated waste on the environment and human health; or
- the content of hazardous substances in materials and products”.
The Dutch Environmental Protection Agency[1]PBL (2019). Circular economy: what we want to know and can measure in its Circularity Ladder has extended the waste hierarchy to ten circular economy strategies of which the upper six are related to the prevention of waste: refuse, rethink, reduce, reuse, repair and refurbish.
Footnotes
- ^ PBL (2019). Circular economy: what we want to know and can measure
| Prevention of waste | CE strategy | Explanation |
| R0 Refuse | Making a product redundant by cancelling its function, or by substituting it with a radically different product | |
| R1 Rethink | Intensifying product use (e.g., via product sharing or multifunctional products) | |
| R2 Reduce | More efficient use and/or manufacture of products through the use of fewer natural re-sources, materials and hazardous substances | |
| R3 Reuse | Reuse of discarded yet still usable product, for the same purpose, by a different user | |
| R4 Repair | Repair and maintenance of defective products so it can be used with its original function | |
| R5 Refurbish | Refurbishing and/or modernising an older product, so that the improved version can be used in the product’s original function |
Table 1. The Circularity Ladder: reuse and waste prevention components
The Circularity Ladder provides a useful conceptual framework for thinking about what activities are relevant to measure when looking to measure waste prevention and reuse. In particular, it serves as a reminder that waste prevention is not limited to reuse, repair and refurbishing of products, but also includes the more challenging concepts of reducing, rethinking and refusing products. These latter strategies tap into more fundamental changes in the way we make, buy, use and consume products and services. While it is technically and conceptually challenging to measure these aspects, they do potentially provide many additional data points that can be exploited to inform on broad progress in waste prevention, and also potentially provide an indication of the factors driving change.
3.2 Monitoring waste prevention
Being able to measure waste prevention (and by association reuse) is a vital tool for policymakers. Changes in waste generation are driven by a variety of factors, not least the health of the broader economy, so it is essential for policy makers to understand the extent to which changes in waste generation are driven by increased sustainability of products and consumption patterns (and how policy has influenced this process) in relation to the other drivers of waste generation.
Given the policy focus on waste prevention and reuse in recent years, it is unsurprising that measurement of these has received a great deal of attention. The main challenge is that measuring waste prevention means measuring something that has hasn’t happened – the waste was not generated.
Unlike data on waste generation, collection, and recycling rates, which can be drawn directly from existing waste data streams, measures of reuse and waste prevention are often inferred from other data sources[1]Wilts, H. et al (2019). Research study on holistic indicators for waste prevention.
In addition, knowledge about tools and methods for monitoring waste prevention – particularly in local and regional waste companies – is limited[2]Wilts, H. et al (2019). Research study on holistic indicators for waste prevention.
The Theory of Change is a useful optic for supporting the design of policy monitoring systems (and policy itself). It helps ensure that all processes of a desired change are addressed and monitored. When applied to waste prevention, the theory of change can provide a useful indication of what type of indicators can be used to inform on the processes for waste prevention and their results (Figure 1).

Figure 1. theory of change for waste prevention and reuse
Ultimately, outcomes are the key factor in any change – achieving the aim of waste prevention. As such, waste prevention should logically be measured by monitoring whether the amount of waste reduces. However, a reduction of waste can be caused by[1]Lakhan, C. (2017). Factors influencing waste generation, and guidance for how to measure waste reduction – An empirical approach. York University, Canada. Draft:
- Systemic change (changes in product structure – external to waste management system),
- Endemic characteristics (changes in demography, economy, economic structure etc.) and
- Attributional factors (efforts aimed at reducing waste generation).
As waste prevention is closely linked to consumption patterns, it is extremely difficult to isolate the effect of specific waste prevention measures. Likewise, changes in waste volumes inform only about the waste that has been generated, not the waste that has not been generated, nor the reasons for that waste not being generated[2]Wilts, H. et al (2019). Research study on holistic indicators for waste prevention. Nonetheless, a variety of methods have been employed to generate indicators for reuse and waste prevention. Waste prevention monitoring approaches can be categorised as follows[3]Watson, D. et al. (2013). European Topic Centre for Sustainable Consumption and Production: Proposals for targets and indicators for waste prevention in four waste streams. Nordic Council of Ministers.:
- Input-based: Indicators based on changes in consumption of goods or resources leading to the waste stream over time. This can be based on market size, expenditure per capita, etc.
- Output-based: Indicators based on the amount of waste generated (economy wide or within specific waste streams or within specific sectors).
- Input-versus-output: These indicators combine the above two measures calculating waste generation per unit input, as a measure of material efficiency. Typically given in physical quantities.
- Decoupling: These indicators combine waste generation data (for a waste stream, sector or economy-wide) with activity data – typically economic output data.
- Impacts: Indicators illustrate reduction of environmental impacts of generated waste – not due to changing waste management practices but through changing product design/consumption etc.
- Hazardous content: These indicators measure changes in the hazardous contents of products which end as waste, or in the changing hazardous content of waste.
- Response indicators: These indicators measure political actions taken to deliver waste prevention, including investments in eco-design research, economic instruments, level of integration of waste prevention into sectoral policies etc. (policies, measuring efforts), and
- Other: This is a ‘catch all’ category that typically includes qualitative indicators of reuse and waste prevention activity. For example, the number of reuse shops, repair services etc.
Most indicators currently used to measure reuse and waste prevention focus on the waste component (i-iv above) and response-type indicators (vii). in terms of Theory of Change, the waste indicators are a proxy for suitable outcome indicators, while the response indicators are input indicators. Success in waste prevention in the material-based indicators (i-iv) is typically measured as deviation from a baseline year, or against prior projections of waste generation[4]Takeshi, M. et al. (2017). Monitoring environmental burden reduction from household waste prevention [in Koyoto]. Waste Management 71 (2018) 2–9. These indicators are also universally compiled from existing data streams.
Looking specifically at household waste prevention, several techniques can be used to generate supplementary data[5]Sharp, V et al. (2010). Methods to monitor and evaluate household waste prevention. Waste Management & Research 2010: 28: 269–280, including self-weighing, monitoring or reporting; use of collection-round data (from waste collection); use of control and pilot groups; attitude and behaviour surveys; participation surveys; participation monitoring; compositional analysis; conversion factors, estimates and modelling. The techniques often rely on scaling up data collected on a small sample of participants. Using hybrid approaches – combining two or more techniques, can help make this process more robust – for example using control groups to verify survey results. All of these approaches require significant and dedicated effort, and typically generate one-off data sets.
While many waste prevention campaigns are broad in scope, they can also address specific product groups. This type of targeted waste prevention initiatives can be supported, and its success monitored by indicators on the targeted product group[6]Wilts, H. et al (2019). Research study on holistic indicators for waste prevention. Product groups with a significant resource footprint and environment impact, and for which potentials for improving waste prevention exist (e.g., through increasing market share of reuse, repair, product as a service models) are particularly relevant. Wilts et. al. (2019) point to the following product groups as being highly relevant to develop waste prevention indicators for:
Footnotes
- ^ Lakhan, C. (2017). Factors influencing waste generation, and guidance for how to measure waste reduction – An empirical approach. York University, Canada. Draft
- ^ Wilts, H. et al (2019). Research study on holistic indicators for waste prevention
- ^ Watson, D. et al. (2013). European Topic Centre for Sustainable Consumption and Production: Proposals for targets and indicators for waste prevention in four waste streams. Nordic Council of Ministers.
- ^ Takeshi, M. et al. (2017). Monitoring environmental burden reduction from household waste prevention [in Koyoto]. Waste Management 71 (2018) 2–9
- ^ Sharp, V et al. (2010). Methods to monitor and evaluate household waste prevention. Waste Management & Research 2010: 28: 269–280
- ^ Wilts, H. et al (2019). Research study on holistic indicators for waste prevention
- Large household appliances
- small household appliances
- IT and telecommunications equipment
- Toys, leisure and sports equipment
- Electrical and electronic tools
- Textiles
- Motor vehicles
- Furniture and furnishing
- Food and beverages[1]Research study on holistic indicators for waste prevention.
Measuring reuse and waste prevention is also on the agenda in other regions. The OECD categorises monitoring efforts into direct pressure indicators and direct response indicators, and material flow accounting-based indirect pressure and response indicators, while Japan has a raft of material flow indicators combined with productivity indicators and waste indicators[2]Takeshi, M. et al. (2017). Monitoring environmental burden reduction from household waste prevention [in Koyoto]. Waste Management 71 (2018) 2–9.
3.3 Digitalisation
As processes, activities and business models take advantage of digital technologies, new data streams emerge. Many newer businesses rely heavily on digital technologies. Sharing platforms, for example, typically manage access to and control over their assets purely through web-based solutions. At the same time, digital tools and technologies are indispensable across industry more broadly for stock management, procurement, supply chain management, transparency and due diligence, verification and documentation of products and their parts. Even typically conservative industries like the textile industry and the construction industry are heavily reliant on digital tools and systems to facilitate design and process management. Similarly, products are linked to an increasing amount of data. This is essential for stock management and supply chain management, but newer initiatives also maintain this data post-sale, so that consumers and the waste management sector can also access and in some cases modify that data.
Many products continue to generate data post-sale. Mobile phones are an obvious example, but buildings and increasingly cars and other vehicles have also begun to do this. Use meters and IoT tools that monitor state and condition of products to support preventative maintenance are also examples of emerging digital implementations that leave a data footprint.
The culmination of this progress toward a more digitally integrated society is the generation of a truly vast quantity of highly disaggregated data. A variety of technologies, tools and methodologies have been developed to capture, integrate, and analyse this generated data and produce intelligence from the noise.
Harnessing the generation and flow of this data can potentially inform on reuse and waste prevention activities and the amounts of waste avoided. Table 2 presents common digital technologies that can contribute to monitoring waste prevention.
Table 2. existing and emerging digital tools, technologies and methods for collecting, storing and analysing data.
Note: [1]The Danish Environmental Protection Agency (2015). The potential of RFID-technology to secure information flow between producers of electronics and waste processors, Environmental project No. 1631, The Danish Environmental Protection Agency, Copenhagen. [2]Demestichas, D. and E. Daskalakis (2020). Information and Communication Technology Solutions for the Circular Economy.
Footnotes
- ^ The Danish Environmental Protection Agency (2015). The potential of RFID-technology to secure information flow between producers of electronics and waste processors, Environmental project No. 1631, The Danish Environmental Protection Agency, Copenhagen.
- ^ Demestichas, D. and E. Daskalakis (2020). Information and Communication Technology Solutions for the Circular Economy.
| Tags, barcodes and use meters | Various tags, sensors and use meters can be attached to a product to inform about its surroundings, state and use. Tags enable identification and the tracking of products throughout value chains. Sen-sors can monitor their surrounding environment such as temperature or humidity, while use meters measure frequency of use and consumption of, for example, energy or water. Together they can help diagnose problems before they result in product failure and enable better and more timely repairs. These tags, sensors and use meters can also be machine read and/or combined with intelligent ana-lytics, which help foster circular use and treatment of the product. More advanced solutions often combine digital technologies to deliver more intelligent information. |
| Internet of Things | The Internet of Things (IoT) refers to the networking of a mass of devices, sensors, and actuators that in the past have been strictly ‘offline’. These generate new and massive streams of data that proac-tively inform users, manufacturers, and service providers on e.g. when maintenance is needed, when a waste container is filled up etc.. Real time data can further be used to track product location, use, and condition. All of which can enable an intensified use of products by enabling sharing, reuse, and repair as well increased resource efficiency. Tapping into this data could provide valuable insights into reuse and repair patterns. |
| Big data analytics | Big data analytics is an approach to analyse large data sets, rather than a technology. Big data analytics are characterized by four V’s: Volume, Velocity, Variety and Veracity – and many of the digital tools employed to facilitate the circular economy and support waste prevention generate and utilise high-volume, real-time data from a variety of sources. An adequate monitoring of the circular economy will likely require data from various sources and in varying quality; big data analytics can thus be a tool to analyse these. |
| Machine learning | Machine learning is a pattern identification technique. An algorithm is trained by feeding it with large amount of data. The algorithm can be coded to recognise specific patterns, predict, optimise, and plan or be integrated with robotics. |
| Artificial intelligence | AI is an advanced type of machine learning with reasoning and learning abilities with similarities to human cognitive abilities. |
| Predictive maintenance | Predictive maintenance is when a machine can register when it needs maintenance and inform it to the user. The predictive maintenance can contribute to prolonging the lifetime of a product. Mainte-nance information needs to be registered or logged (e.g., through sensors, actuators, IoT), such as failure information including types of failure (e.g. mechanical or electronic failure) and factors that affect the failure (e.g. pressure of the equipment, number of uses, power, geometrical values etc.). Predictive maintenance needs large amounts of high quality data and a good understanding when carrying out the analysis. |
| Blockchain | Blockchain functions as a log or a ledger, being a distributed chain of information. Decentral units monitor and integrate changes to the permanent log without altering the existing information. This makes it very difficult to manipulate or hack the system. The information is gathered in blocks with a unique code and point in time, the blocks of information are connected in a chain, therefore “block-chain”. Blockchain can help to increase transparency along supply chains and can also provide a rec-ord of ownership for products. |
| Digital twins | A digital twin is a virtual version of a physical object or process, which is maintained to reflect changes in the physical object. The data from the physical world can be collected automatically and continu-ously using sensors or actuators or using more manual processes at specific intervals. Digital twins allow for information about a product to be maintained remotely, which, depending on the product, can facilitate remote testing, problem tracing, predictive maintenance and maintenance support. |
| Barcode | Bar codes are found on almost all products, the standardised bar code system ensures that all prod-uct groups have an identifier, which can be scanned and understood across the world. Different information can be ascribed the barcode such as expiration date. |
| Radio Frequency IDentification (RFID) | RFID tags (a microchip with an antenna) are fastened to products or materials and collect information, which are tracked through radio waves by a reader connecting the data to a database. RFID emerged under the second world war and has been applied in many sectors and for many different purposes. RFID is thus quite mature but can be advanced by integrating it with other solutions such as sensors to monitor, measure and record various environmental conditions12. RFID tags can either be active or passive, or activated by a sensor e.g. textile brands, laundries etc. use RFID to check their storage by using an activation sensor to count the number of pieces in a shop or stock room. |
| SmartTags | SmartTags are based on QR-codes (unique identifier) and sensors (that can capture environmental specific information) with a memory and ability to process and communicate data13. |
| Digital watermarks | Digital watermarks are another type of barcode that has been used on consumer goods packaging and entails information on the manufacturer, stock-keeping unit (SKU) and other static information. |
| Use meters | Use meters detect the real-life usage of a given resource. Use meters can be a combined with ma-chine learning and other digital technologies to deliver intelligent use or predictive maintenance. |
| Location monitoring systems | Connected products can be identified and located online. Wirelessly connected products (like mo-bile phones, but also vehicles laptops, and a plethora of IoT devices, can be accurately locate and repot that location. Mobile phones essentially act as a highly accurate location device for the vast majority of individuals in the Nordic region. |
Digitalisation is seen as a key driver of the transition to a circular economy. Many of the emerging business models, the design challenges, consumer interactions, supply chain management and transparency, reuse and recycling practices are heavily reliant on emerging digital tools and techniques. Figure 2 provides an indication of where and how digital technologies drive and support circular economy activities. This also provides an illustration of where some of the new data streams may emerge, the types of data they may contain and how they could be utilised to monitor waste prevention and reuse. The figure indicates that data collection, data integration and data analysis are hierarchical processes for exploiting data flows within a circular economy[1]Pagoropoulos, A. et al. (2017). The emergent role of digital technologies in the Circular Economy: A review, Procedia CIRP 64, p. 19-24.. For the purposes of this project, however, capturing data from all these processes can potentially inform on waste prevention and reuse activities.
Footnotes
- ^ Pagoropoulos, A. et al. (2017). The emergent role of digital technologies in the Circular Economy: A review, Procedia CIRP 64, p. 19-24.
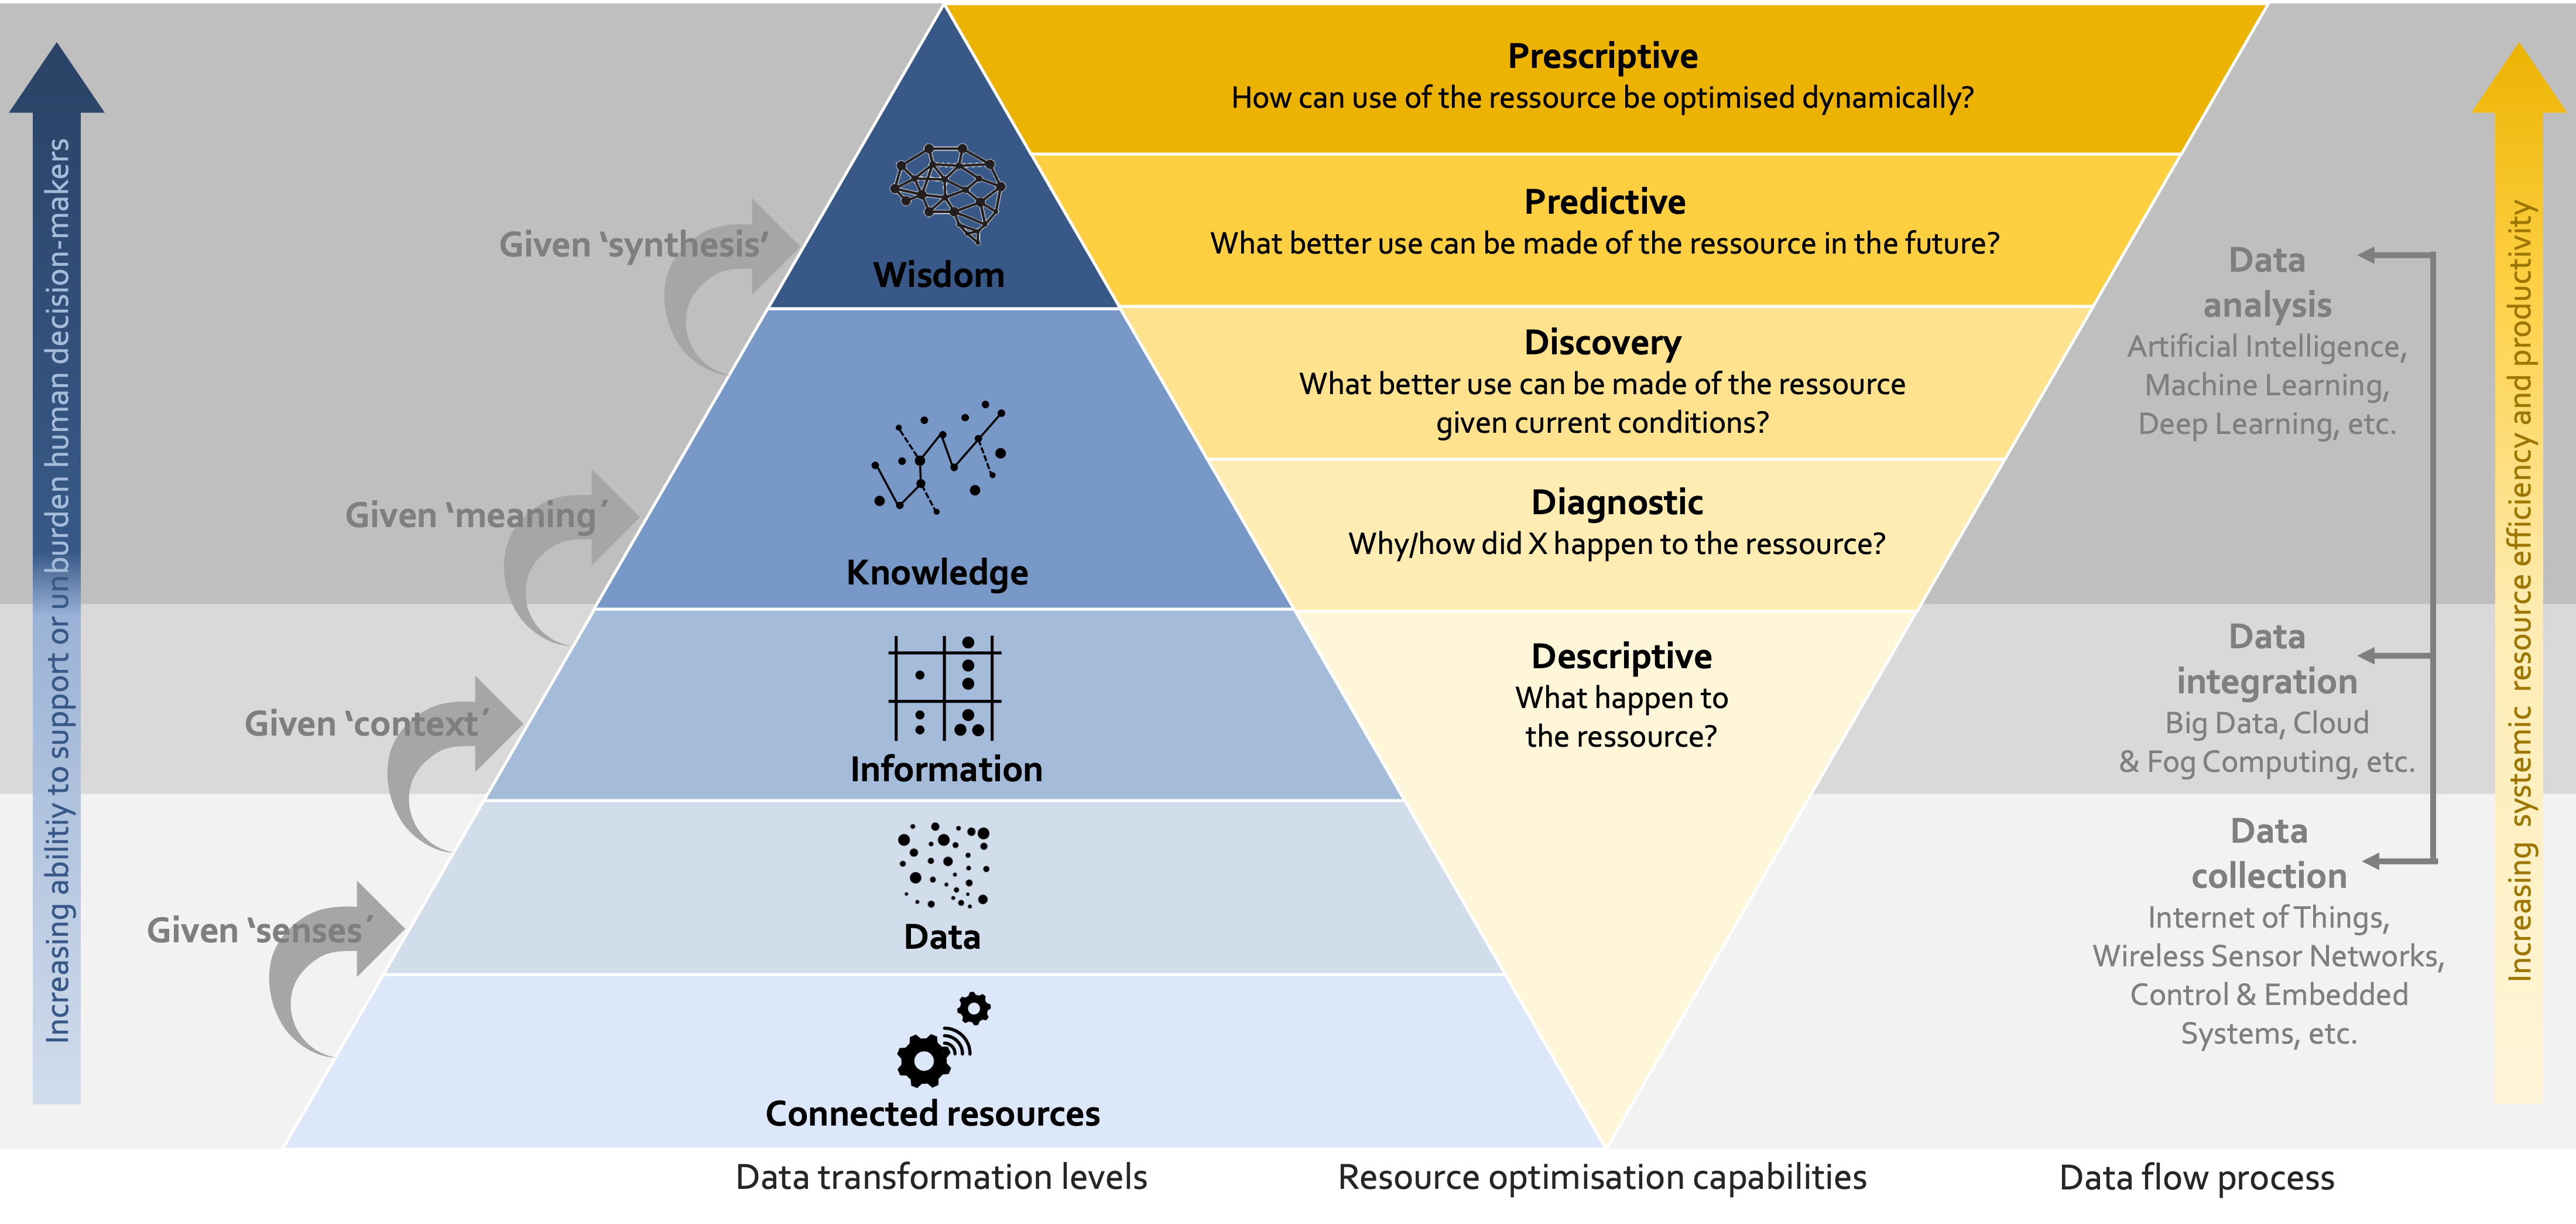
Figure 2. data in the circular economy[1]Kristoffersen, E. et al. (2020). The smart circular economy: A digital-enabled circular strategies framework for manufacturing companies
Footnotes
- ^ Kristoffersen, E. et al. (2020). The smart circular economy: A digital-enabled circular strategies framework for manufacturing companies
It is important to note, however, that the conceptual overview provided in Figure 2 provides only one perspective on what data could be useful in the context of measuring waste prevention and reuse. By focusing on digitalisation within and support for the circular economy, it of course ignores digitalisation that has little or nothing to do with the circular economy directly. Further, it takes the perspective of how data and digital tools can be used to promote circular economy, not necessarily how that data can inform on the progress in circular economy or waste prevention and reuse.
That said, the connected resources (Internet of Things, sensor networks, etc.) and the data therefrom, can, with the help of analytical tools, provide useful information about the progress of specific components of the circular economy like waste prevention and reuse. This albeit with the caveat that public authorities must have access to that data or a synthesis of that data to be able to draw insight.
4 EU requirements for monitoring of waste prevention
Under the EU’s Waste Framework Directive, the Nordic countries that are EU Member States or have committed themselves to implementing EU law, are required to prepare waste prevention programmes every six years. They are also required to monitor reuse and generation of food waste. The following section describes the current EU monitoring requirements and outlooks.
4.1 Waste prevention programmes
In the revised EU waste package, the obligation for EU Member States to take waste prevention measures has been strengthened, inter alia, by the extensions in Article 9(1) of the Waste Framework Directive. The waste prevention programmes shall include a description of the contributions to waste prevention from the instruments and measures set out in the revised Annex, with examples of waste prevention measures (Article 29(2) and Annex IV of the Waste Directive). Within the waste prevention programme, a special programme for the prevention of food waste must also be adopted. Annex 4 in the WFD presents examples of waste prevention measures related to:
- Framework conditions: Economic incentives promoting resource efficiency; R&D; development of indicators;
- Design, production and distribution: Promotion of eco-design; promotion of waste prevention techniques, awareness and competencies; promote environmental management systems;
- Consumption and use phase: Clean purchases, information provision, eco-labels, GPP, reuse and repair, industry agreements.
4.2 Monitoring waste prevention
According to Article 9(3) of the Waste Framework Directive, Member States shall monitor and assess waste prevention measures through appropriate qualitative or quantitative indicators and targets. Article 29(1) also requires that waste prevention objectives are set out in national waste prevention programmes. The EU’s new Circular Economy Action Plan announced waste prevention targets for selected waste streams to be implemented[1]EC (2020). The new Circular Economy Action Plan. Retrieved from: https://ec.europa.eu/environment/strategy/circular-economy-action-plan_en. Reuse and food waste have been selected for monitoring. In general, EU monitoring requirements are a key driver for monitoring waste prevention in the Nordic countries.
Footnotes
- ^ EC (2020). The new Circular Economy Action Plan. Retrieved from: https://ec.europa.eu/environment/strategy/circular-economy-action-plan_en
4.3 Monitoring of reuse
The EU requires all Member States to report on reuse as part of their waste prevention programmes. In December 2020 a common methodology of reporting reuse was published (Commission Implementing Decision (EU) 2021/19). The methodology consists of a qualitative description and impact assessment of measures on reuse (to be reported annually), and a quantitative estimate of reuse volumes (to be conducted every third year)[1]EUR-Lex, document C(2020) 8976. Retrieved from: https://eur-lex.europa.eu/legal-content/EN/TXTtemanord2022-536.pdf?uri=CELEX:32021D0019&rid=3. The quantitative data should be reported within 18 months of the end of the first reporting period, which is the first full calendar year after publication of the implementing act laying down the methodology and format for reporting. The Implementing Decision[2]Commission Implementing Decision (EU) 2021/19 was published in December 2020, meaning the first reporting period is the calendar year 2021, reporting for which should be by the end of June 2023.
Member States can decide which methods to apply to generate the quantitative estimate, but the relevance, representativeness and reliability of the chosen methods must be equal to the following methods, suggested by EC:
- Direct measurements of reuse, measuring the mass of reused products
- Mass balance calculation of reuse based on input and output of products in reuse operations
- Surveys and interviews with reuse operators or households
- Diaries/log of information on reuse conducted by individuals.
Any data sample must be representative for the population of reuse operators or households, and reused products must not be included twice.
For the quantitative reporting, Member States shall report on specific product categories:
- Textiles,
- EEE,
- Furniture,
- Construction and material products,
- ‘Other’ products for where measures are adopted.
Footnotes
- ^ EUR-Lex, document C(2020) 8976. Retrieved from: https://eur-lex.europa.eu/legal-content/EN/TXTtemanord2022-536.pdf?uri=CELEX:32021D0019&rid=3
- ^ Commission Implementing Decision (EU) 2021/19
4.4 Circular Economy monitoring
EU’s Monitoring of Framework of Circular Economy (Table 3) has ten indicators divided into four overall themes, of which the first – production and consumption – has some relevance for waste prevention. This section includes indicators for waste generation and food waste, as well as green public procurement.
| Production and Consumption | Waste Management | Secondary Raw Materials | Competitiveness and Innovation |
| 1. Self-sufficiency of raw materials for production in the EU (NA)19 2. Green public procurement (NA) 3. Waste generation; 3a: Per capita 3b: Per GDP-unit (excl. major mineral waste)20 3c: Per DMC | 5.Recycling rates 5a: Of municipal waste 5b: Of all waste excl. major mineral waste 6.Recycling rates of specific waste streams 6a: overall packaging 6b: Plastic packaging 6c: Wooden packaging 6d: E-waste 6e: Bio-waste 6f: Construction and Demolition waste | 7.Contribution of recycled materials to raw materials demand; 7a: End-of life recycling input rates (NA) 7b: Circular Material Use rate (CMU rate) 8.Trade of recyclable raw materials between the EU Member States and with the rest of the world. 8a: Imports from non-EU countries 8b: Export to non-EU-countries 8c: Intra EU-trade | 9.Private investments, jobs and gross value added;21 9a: Gross investment in tangible goods 9b: Persons employed22 9c: Value added factor costs 10. Patents related to recycling and secondary raw materials as a proxy for innovation. |
| 4. Food waste (NA) |
Table 3. Circular Economy Monitoring Framework (CEMF)
Note: [1]Is not informing how the materials are extracted, which implies it also include materials from mining and thus linear extraction methods. Moraga et al. (2019): Circular economy indicators: what do they measure? [2]General mineral waste includes soil and gravel, which is excluded as mineral waste accounts for 90% of the total weight of waste generation. Likewise, there a many ways of reporting mineral waste across Member States. [3]Measure on the sectors of recycling, reuse and repair and do not include spill-over effects on other sectors. [4]In circular economy sectors – recycling, reuse and repair
Footnotes
- ^ Is not informing how the materials are extracted, which implies it also include materials from mining and thus linear extraction methods. Moraga et al. (2019): Circular economy indicators: what do they measure?
- ^ General mineral waste includes soil and gravel, which is excluded as mineral waste accounts for 90% of the total weight of waste generation. Likewise, there a many ways of reporting mineral waste across Member States.
- ^ Measure on the sectors of recycling, reuse and repair and do not include spill-over effects on other sectors.
- ^ In circular economy sectors – recycling, reuse and repair
Waste generation
Waste generation is one of the key environmental statistics reported by Member States to Eurostat annually. By controlling overall waste generation for population change, the economy and material inputs, waste generation can provide a useful indication of consumption levels and material efficiency in the economy. Changes in waste generation over time can be a useful proxy for waste prevention, although it does not inform on which of the many possible drivers and in what combination have been responsible for the change in waste generation.
Food waste
According to Article 9(5) of the WFD, MS are obliged to monitor the implementation of food waste prevention measures across the value chain[1]EC (2020). Guidance of reporting of data on food waste and food waste prevention. Retrieved from: https://ec.europa.eu/eurostat/documents/342366/351811/Guidance+on+food+waste+reporting/5581b0a2-b09e-adc0-4e0a-b20062dfe564. Through Delegated decision 2019/1597, the EU has set up a methodology for the measurement of food waste: food waste should be measured in tons of fresh food mass and reported by full calendar year[2]EC (2019). Commission delegated decision 2019/1597.. The methodology includes a number of tools that should cover the entire food supply chain. When there is direct access to food waste, direct measurement should be performed through weighing, volumetric assessment, scanning/counting, waste composition analysis or logbooks. When direct measurement is not applicable, mass balance methods or calculations using coefficients may be applied.
Footnotes
- ^ EC (2020). Guidance of reporting of data on food waste and food waste prevention. Retrieved from: https://ec.europa.eu/eurostat/documents/342366/351811/Guidance+on+food+waste+reporting/5581b0a2-b09e-adc0-4e0a-b20062dfe564
- ^ EC (2019). Commission delegated decision 2019/1597.
Green Public Procurement (GPP)
The circular economy monitoring framework includes an indicator on GPP, which measures “the share of public procurement procedures above the EU thresholds (in number and value), which include environmental elements”[1]Eurostat (2021a). Circular economy indicators.. Some of these environmental elements could be related to waste minimisation. Data is currently not available, nor is there made any decision for MS to start to collect this data. As such, this indicator is only tangentially related to waste prevention and reuse, and unless further disaggregated to inform on the nature of the GPP taking place, is not directly useful for monitoring waste prevention or reuse.
Footnotes
- ^ Eurostat (2021a). Circular economy indicators.
Further development on circular economy indicators
The EU’s Circular Economy Action Plan announced further development of the circular economy monitoring framework. This will focus on the interlinkage between circularity, decarbonization and zero pollution. Likewise, Eurostat’s Circular Economy Monitoring Framework (CEMF) will be extended with indicators on material footprints. This could bring valuable information to the fore, and it will be important for the Nordic EU countries to continue to engage with the processes for developing the CEMF.
4.5 Other relevant EU-driven processes
Looking beyond initiatives addressing waste and GPP, a number of other processes at the EU level could provide information and data streams that could be harnessed to inform on waste prevention and reuse in the future.
Digital Product Passports
The coming EU Sustainable Product Policy Initiative (SPI) will aim to ensure that products put on the European market are more sustainable. The SPI is expected to be launched in March 2022 and product requirements are likely to be regulated primarily by a revised Ecodesign Directive. Product sustainable performance will be recorded and communicated through digital product passports, which are also being developed as part of the SPI. Product information could include presence of hazardous substances, performance and durability, recyclable content, removability and replaceability, carbon footprint and proof of due diligence. The design, content and use of the digital product passports is yet to be defined and is likely to vary between product categories. Digital product passports will generate new data streams on product use and disposal as well as reuse, depending on implementation, penetration, and use.
Battery passports have been included in the Commission proposal of a revision of the Battery Directive. In this proposal, it is noted that a battery passport and an interlinked dataspace will contribute to transparency and traceability of larger batteries, providing a digital twin[1]EC (2020b). Green Deal: Sustainable batteries for a circular and climate neutral economy.. This entails a more thorough treatment of product information. Digital twins are specific to individual items, rather than product types. For example, a digital product passport could contain information about a specific model (or at best a batch number), while digital twins contain information about each individual item.
Footnotes
- ^ EC (2020b). Green Deal: Sustainable batteries for a circular and climate neutral economy.
Monitoring of hazardous substances
Eurostat has developed a set of indicators that monitors progress in the reduction of hazardous chemicals[1]Eurostat (2021b). Hazardous substances. Retrieved from: https://ec.europa.eu/eurostatenvironment/hazardous-substances. The monitoring is based on data from the chemical sector. The monitoring efforts encapsulate chemicals that are toxic to humans, and chemicals that are environmentally harmful.
Footnotes
- ^ Eurostat (2021b). Hazardous substances. Retrieved from: https://ec.europa.eu/eurostatenvironment/hazardous-substances
EU taxonomy and corporate sustainability reporting
EU taxonomy for sustainable activities divides sustainability into six areas, one of which is the circular economy. The aim of the taxonomy is to create a common understanding of sustainability that can contribute to directing initiatives and direct investments to where the greatest impact can be achieved. The taxonomy is a classification system. In 2021, a first draft circular economy taxonomy was issued containing a categorisation of circular economy activities, minimum criteria to be met under each activity, and methodological guidance. The draft version of the taxonomy includes waste prevention strategies such as design for durability, modularity, easy disassembly, and repair, as well as reuse, repair, refurbishment and remanufacturing of end-of-life or redundant products[1]EC (2020a). Categorisation system for the circular economy – A sector-agnostic approach for activities contributing to the circular economy. Independent expert report. (understood in accordance with the Circularity Ladder presented under section 3.1, Table 1). A final taxonomy for circular economy is expected in Q1 of 2022.
Corporate sustainability reporting (for companies with more than 500 employees) will be extended to contain reporting requirements on the circular economy to align with the taxonomy as described in the proposal for a Corporate Sustainability Reporting Directive (CSRD)[2]EC (2021d). Proposal for a Directive of the European Parliament and of the Council amending Directive 2013/34/EU, Directive 2004/109/EC, Directive 2006/43/EC and Regulation (EU) No 537/2014, as regards corporate sustainability reporting.. The CSRD further requires companies to report all information in a digital tag. CSRD is thus expected to deliver a new data stream on circular economy in large companies. SME’s will not be obliged to carry out sustainability reporting, but they may align their efforts with circular taxonomy to attract funding.
Footnotes
- ^ EC (2020a). Categorisation system for the circular economy – A sector-agnostic approach for activities contributing to the circular economy. Independent expert report.
- ^ EC (2021d). Proposal for a Directive of the European Parliament and of the Council amending Directive 2013/34/EU, Directive 2004/109/EC, Directive 2006/43/EC and Regulation (EU) No 537/2014, as regards corporate sustainability reporting.
4.6 European Strategy for Data
The EU aims at becoming a leading data-driven society, enabling non-personal data to flow freely around sectors and inform decisions. To realise this vision of “a single market for data”, the Commission has several initiatives such a common data space for the European Green Deal, data regulation to protect personal data, investments in digital technologies, and facilitation of data sharing among Member States and sectors. The EU initiatives are likely to improve the contribution of data sharing, integration and analysis to the monitoring of waste prevention[1]EC (2021e). A European Strategy for data.
Footnotes
- ^ EC (2021e). A European Strategy for data
4.6.1 General Data Protection
The General Data Protection Regulation (GDPR) governs how personal data must be collected, processed, stored, and anonymised. GDPR requires consent for the storage and sharing of personal data. The EU calls for proportionality in the use of Business to Government (B2G) data sharing and use, meaning that any data burdens should be balanced with the advantages that the data delivers. This may initially be experienced as a barrier to data collection/sharing. However, the process of negotiating rights to usage and sharing of data may create crucial digital trust, which could enable more transparent and, therefore, more reliable data flows. Expert opinion seems to indicate that that GDPR in itself is not a significant barrier to the development of useful data sets, but the demands of GDPR need to be integrated into any data collection protocols.
4.7 Summary
The EU’s monitoring requirements are key drivers for monitoring waste prevention throughout Europe and in the (majority of) Nordic countries. Further requirements will likely follow with the Sustainable Product Initiative. Moreover, the Corporate Sustainability Reporting will produce valuable data on progress being made within European and Nordic businesses on waste prevention and the circular economy. Together, these will provide a useful dataset on waste prevention that could be exploited to inform and evaluate the waste prevention from a production perspective. However, the methods described by the EU for monitoring and reporting on the reuse of products are rather broad and leave significant scope for varying interpretation and implementation.
Existing and coming reporting demands on waste prevention and reuse cannot be met using waste statistics alone. Generating new official data by enforcing reporting obligations on economic operators through questionnaire surveys will be resource heavy. Digitalisation may help minimise the associated administrative burden and provide extra insight.
5 Monitoring Waste Prevention: approaches in the Nordic Authorities
This section briefly examines how each of the Nordic countries currently addresses waste prevention and waste prevention monitoring. This includes the indicators they currently use and how they plan to meet the EU’s demand for monitoring reuse, as well as describing the key institutional barriers to improvements in monitoring waste prevention and reuse, with a focus on digital monitoring techniques.
For a detailed description of the individual approaches to waste prevention and waste prevention monitoring in the Nordic countries, please see the country profiles in Annex 2.
5.1 Waste prevention in the Nordic countries
The Nordic countries all have programmes, action plans and/or strategies that specifically or in part address waste prevention. Table 2 provides an overview of relevant policy in the four largest Nordic countries.
Table 4. Key waste prevention policy documents in the four largest Nordic countries
| Policy relevant for waste prevention and reuse | Objective(s) | Some key activities | |
| DK | Action Plan for Circular Economy Handlingsplan for Cirkulær Økonomi: National plan for forebyggelse og håndtering af affald 2020–2032 Climate Plan for a Green Waste Sector and a Circular Economy Klimaplan for en grøn affaldssektor og cirkulær økonomi |
|
|
| FI | Strategic Programme for circular economy Kiertotalouden edistämisohjel-ma From Recycling to a Circular Economy – National Waste Plan to 2023. Kierrätyksestä kiertotalou-teen. Valtakunnallinen jätesuunnitelma vuoteen 2023 |
|
|
| NO | National strategy for a green, circular economy Nasjonal strategi for ein grøn, sirkulær økonomi Waste Plan 2020–2025 Avfallsplan 2020–2025 |
|
|
| SE | National Strategy for Circular Economy Cirkulär ekonomi - strategi för omställningen i Sverige National Action Plan for a circular economy Cirkulär ekonomi - Handlingsplan för omställning av Sverige Do more with less - National Waste Management Plan and Waste Prevention Program 2018–2023 Att göra mer med mindre – Nationell avfallsplan och avfallsförebyggande program 2018–2023. Reviderad 2020 Action Plan for Reduced Food Waste in 2030; Fler gör mer – Handlingsplan för minskat matsvinn 2030, |
|
|
While these strategies, programmes and action plans address monitoring of waste prevention, they do not always explicitly prescribe a method or approach for doing so. It is also clear from interviews with national authorities, that responsibility for waste prevention and the implementation of waste prevention initiatives, often draws on multiple agencies or bodies, and coordination between different levels and focus areas of government is often a key component in the efforts toward promoting waste prevention and reuse.
5.2 Waste prevention monitoring in Nordic countries
As active monitoring of waste prevention and reuse is still in its infancy, and EU-demands for reporting on waste prevention and reuse have only recently come into force, it is not surprising to find that the Nordic countries are still in the process of developing indicators and assessing methods for accurately monitoring waste prevention and reuse. Also, because efforts are in their infancy, there is quite a variation between how the different countries currently approach waste prevention and reuse monitoring. Table 5 illustrates the indicators currently considered for monitoring waste prevention and reuse in each of the four largest Nordic countries.
DK |
|
FI |
|
NO |
|
SE |
|
Table 5. Existing indicators used to measure reuse and waste prevention
Waste generation is widely used as an indicator of waste prevention, as it is based on relatively robust data. Waste generation indicators broadly inform on waste prevention – a decrease in waste generation could be interpreted as successful waste prevention – but as do not indicate causal effect i.e., the influence of policy or other initiatives designed to minimise waste. It is difficult to separate success in waste prevention from other factors that influence waste generation, for example macro-economic conditions, economic structure etc.
Denmark supplements this measure with indicators on product design, while Sweden includes indicators on consumption. Norway and Finland both employ an indicator on the reuse of EEE products at the end of first use. The indicators mentioned are those reported to monitor waste prevention. They do not reflect all available data on waste prevention in the respective countries. In the context of this project, it is important to note that none of these indicators or their associated data streams are derived from, or enabled by, novel data flows or data techniques – they draw on existing official data channels.
Waste quantities
All the Nordic countries use variations of total waste volumes indicators as these provide a useful baseline for understanding what the trends in waste generation. Sweden[1]Except mining and Norway include total waste amounts. Denmark and Finland include waste amount per capita[2]Except construction- and demolition waste and Finland further include waste pr GDP. Total waste generation (economy-wide or per capita) is closely correlated with consumption levels and economic fluctuations. When the economy is booming, we consume more and correspondingly produce more waste, and when the economy is in recession we consume less and produce less waste. Because of this, one cannot ascribe reductions in waste generation directly to waste prevention initiatives such as designing out waste or conscious consumer behaviour (reflecting increased prevalence of refuse, rethink, reduce, reuse, repair, refurbish). Waste generation indicators, thus, do not provide a particularly compelling indication of the influence and effect of actual and active waste prevention.
Integrating GDP into these indicators can help control for economic activity broadly, but this does not control for the types of activity taking place. For example, an economy transitioning away from manufacturing towards service will appear to be preventing waste, but individual activities have not reduced their waste generation, only the composition of activities across the economy has changed.
All the Nordic countries report on food waste throughout the value chain in accordance with EU obligations set out in the WFD. These indicators are also used to inform on waste prevention. Because these address a specific sector, and one that is largely unaffected by broader economic trends, food waste generation figures are likely to reflect efforts to minimise waste generation and/or efficiency gains in the supply chain.
Designing out waste
To monitor waste prevention, Denmark – among others – applies an indicator on resource productivity (RMC/GDP). This indicator signals how materially efficient the Danish economy is and more specifically how much economic value is derived per unit of material. Importantly, RMC also includes the materials required to produce the imported products and excludes the materials used to produce exported products. This means that the indicator measures the material intensity of consumption. Resource productivity can indicate if products are designed with fewer resources and thus if any waste prevention has been achieved.
Denmark also uses the number of products certified with the Nordic Swan ecolabel and the revenue from the Nordic Swan ecolabel as indicators to inform waste prevention. Some of the Nordic Swan ecolabelling criteria promote waste prevention. Assuming a fixed consumption level, any increase in ecolabels would prevent waste. Denmark further includes the share of construction being certified under the Nordic Swan, DGNB, LEED or BREEAM. The criteria used in these certification schemes award points for reducing waste generation. None of the other countries include indicators on product design to inform waste prevention.
Consumption
Sweden is the only Nordic country to include direct consumption indicators: Consumption of textiles/capita/year and consumption of plastic carrier bags/person/year. Using consumption indicators provides a valuable insight into the material input (within the narrowly defined product groups) and therefor the anticipated waste generation level and helps build a picture of the materiality of the economy.
Reuse
Finland and Norway employ an indicator of reused EEE. These indicators are enabled by Extended Producer Responsibility (EPR) schemes in the respective countries. Despite this, none of the Nordic countries have collected comprehensive and regular data on reuse as of September 2021. Finland has taken the first step to collect data about reuse in accordance with the EU requirements. Further details can be found in the national factsheet for Finland in Annex 4.
Response indicators
Almost no response indicators, capturing the initiatives to ensure waste prevention, are in place in the Nordic countries. Only Sweden includes an indicator on public authorities with an environmental management system in place (certification with EMAS or ISO 140002).
5.3 Nordic plans for meeting the reuse reporting requirements
The four largest Nordic countries are obliged by the EU (or their commitment to implement EU regulation) to report on reuse as described in section EU requirements for monitoring of waste prevention from latest 2023. As indicated in Table 4, Sweden, Denmark and Norway have yet to decide exactly how they will meet the monitoring and reporting requirements for reuse. As of 2021, Finland is the only country actively engaged in collecting data for reuse
| DK | Denmark expects to meet the EU’s requirement of monitoring reuse through a triangulation of several methods in line with those the EU has suggested. The concrete methods have, however, not yet been chosen, nor has the data collection been initiated. |
| FI | Aligned with the EU decision on monitoring reuse, the Finnish Environmental Institute (SYKE) has started to collect data about C2C and B2C reuse volumes of textiles, furniture, and construction materials- and production. The data is collected through a survey sent to online and physical second-hand shops. Additionally, a consumer barometer on the circular economy has been prepared to provide insights into reuse and waste prevention behaviour among consumers. Finland is working on a project33 developing waste and product data management systems. The project was initiated in Spring 2021 and will be finished by the end of 2022. The project will develop national information systems for waste and product data collection and add new components to the existing systems. The aim is a unified waste and product information system with reliable and comprehensive information. The project responds to changes in EU and Finnish waste legislation and development needs identified by the users of the data management systems. See the national factsheet for Finland in Annex 4 for further details. |
| NO | The Norwegian governmental note on EU 2021/1934 reports that discussions are continuing between the Environment Agency, Statistics Norway and the government regarding the approach to data gathering and monitoring. No specific approaches have yet been outlined. |
| SE | Sweden expects to meet EU’s requirement of monitoring reuse. The concrete methods have, however, not yet been chosen, nor has the data collection been initiated. |
5.4 Current initiatives
Existing official data streams in the Nordic countries are only of limited use for monitoring waste prevention and reuse. Generating reliable, timely and regular new data sets through official channels is costly both in development and implementation, and Nordic authorities have yet to take significant steps to generate new data that could inform on waste prevention and reuse. Despite the legislative demand for developing monitoring systems, there are a variety of barriers, both technical and organisational, that stand in the way of the development of such a system.
There has been some progress however:
- The Danish Circular Data Bank (see Box) will eventually be looking into data on waste prevention. This is still in the preliminary consultation phase, however, so cannot be expected to inform waste prevention policy in the near future.
- In Finland, the EU-funded project “CircWaste” has developed digital methods to set-up circular economy indicators of which two are related to waste prevention including users of local sharing services and accessibility of reuse bring sites (these indicators are further elaborated in case 1 and case 2). These indicators are, however, not yet integrated into the Finnish Waste Prevention Programme.
Circular Data Bank, Denmark
The vision of the Circular Data Bank is to be a central platform that delivers relevant data to citizens, companies, and authorities to inform decisions that promote climate action and the circular transition including waste prevention, reuse, and recycling and which create synergies and economic growth locally, nationally, and globally. The Circular Data Bank is facilitated by Denmark Environmental Portal in collaboration with the Danish EPA, Digital Agency and the Association of Local Authorities[1]The Danish Environmental Portal (2020). Circular Databank.. The Circular Data Bank is currently looking into improving waste data and is planning to gather data on waste prevention.
Footnotes
- ^ The Danish Environmental Portal (2020). Circular Databank.
5.5 Institutional barriers
Responsibility for implementing and monitoring waste prevention lies primarily within the waste departments of national Environmental Protection Agencies. As is increasingly common in environmental policy making, the factors driving waste generation are rarely within the (sole) control of a single department; waste management traditionally focuses on what to do with waste when it appears, rather than how to prevent it appearing in the first place.
Waste prevention efforts often focus on the steps in product lifecycles just before they become waste – to facilitate repair and reuse. There is less focus on initiatives that address refusing and rethinking – activities that are further removed from typical waste management practices.
Waste prevention is multi-disciplinary and requires cooperation between a variety of different competences and competent authorities. Similarly, monitoring waste prevention and reuse – particularly if using novel digital techniques and drawing on novel data streams - requires competences well beyond those typically found in waste departments in national environment agencies, municipalities and waste companies. This lack of capacity must be addressed, either by using competencies in other authorities or by expanding capacities within the departments currently responsible for waste prevention (and waste prevention monitoring).
5.6 Summary
The Nordic countries have circular economy action plans and waste prevention programmes in place. Yet, only a few indicators are in place to monitor waste prevention. Most of these indicators relate to waste volumes. Exceptions are the inclusion of a few indicators on eco-design and resource productivity (Denmark), indicators on consumption of textiles (Sweden), monitoring reuse of EEE enabled by EPR schemes (Norway and Finland).
International experience in exploiting digital approaches to monitoring waste prevention are presented in Section 6.
6 Monitoring waste prevention: international experience
This section presents best practices and experiences in monitoring waste prevention from other European countries and the private sector, drawing on expert interviews and literature.
6.1 Publicly driven experience from European countries
A European assessment of waste prevention indicators from 2017 identified a few upstream indicators of waste prevention, none of which are enabled by digitalisation[1]EEA (2017). Waste prevention in Europe. Most active indicators on waste prevention focus on waste volumes per capita or per unit GDP[2]Wilts, H. et al (2019). Research study on holistic indicators for waste prevention.
The upstream waste prevention indicators in use by national authorities are most often linked to reuse, and often for specific product groups (for example, textiles or EEE), or are input-based (e.g., number and revenue of reuse organisations). For example, Flanders monitors reused products (kg) and has a target to collect and resell locally, 5 kg of reusable goods/capita every year. New targets for 2022 are currently being negotiated[3]EEA (2017). Waste prevention in Europe
OECD’s inventory of circular economy indicators[4]OECD (2021). The OECD Inventory of Circular Economy Indicators shows how few official indicators for waste prevention and reuse are used by public authorities. The relevant indicators in the inventory include:
- Reduced emissions through GPP (Portugal, 2017), yet only relevant if GPP includes waste prevention criteria.
- Share of GPP contracts that include environmental/circular elements above EU thresholds (Navarra, 2019; Paris, 2017), yet only relevant if GPP includes waste prevention criteria.
- Purchases of products that are reusable or include recycled material (Galician, 2019)
- CO2 emissions avoided as a consequence of recovery and reuse of materials (Paris, 2017)
- Objects repaired at repair cafés (Paris 2017).
Again, there is no sign that these indicators rely on any form of automatically generated digital data[5]OECD (2021). The OECD Inventory of Circular Economy Indicators. In fact, it seems most likely that these indicators require manual data generation or exploit existing official data.
Indicators relevant for the measurement of waste prevention can also be found in the French monitoring framework “10 Key Indicators for Monitoring Circular Economy”[6]French Ministry of the Environment, Energy and Marine Affairs (2017). 10 Key Indicators for Monitoring the Circular Economy. Indicators relevant to waste prevention include waste generation quantities, resource productivity, eco-label certificates given, car sharing frequency rates (survey) and household spending on maintenance and repair (survey). Again, none of these indicators can be categorised as digital.
In Spain, the circular economy strategy is to be monitored by 20 indicators, of which two are related to waste prevention; material productivity[7]PACE (2021) Circular Indicators for Governments, and volume of reused water[8]OECD (2021). Assessing and unlocking the circular economy in Valladolid, Spain.. There are no signs that any of the monitoring in the Spanish strategy is performed through digital methods.
A German meta-study examined the current state of methods and tools for monitoring the transition to a circular economy. The initiative provides a monitoring framework that details both the desired and available indicators for monitoring the circular economy, including waste prevention and reuse. The set builds on the full resource cycle and includes some indicators related to waste prevention[9]Acatech (2021). Making Circular Economy count – What you can’t measure, you can’t manage. The relevant indicators identified are:
- Rethink: Number of new revenue models (Potting & Janemaaijer,2018)
- Reduce: Value-based resource efficiency indicator (Di Maio & Rem, 2017)
- Repair: Household spending on product repair and maintenance (Magnier et al., 2017)
- Remanufacture: Share of remanufacturing businesses in the manufacturing economy (EEA, 2016)
Data for the suggested German Waste Prevention indicators is not digitally collected.
The Netherlands has taken some interesting initiatives to monitor waste prevention through the following indicators[10]PBL (2019) Circular economy: What we want to know and can measure:
- Number of companies communicating on circular economy activities
- Waste production per unit of material use
- Material productivity
- Added value of second-hand shops
- Household expenditure on repair
- Number of shared cars
The first of these is currently supported by data collected using a web-scraper. This searches for the words ‘circular economy’ in the webpages of Dutch companies[11]PBL (2021) Integrale Circulaire Economie Rapportage 2021. This is, in principle, a wholly automated digital process, although it does require significant initial setup. The indicator measures all circular economy strategies, not only waste prevention, and even if tailored specifically to waste prevention, would only informs on the communication of waste prevention and not on the quality of the initiative or the quantity of materials reused or waste avoided. This example is elaborated in Case 7.
While there is broad interest in exploring the possibilities for monitoring reuse and waste prevention by exploiting digital technologies and the digitisation of the society and the economy, very few publicly driven digital monitoring efforts have been undertaken to date.
Footnotes
- ^ EEA (2017). Waste prevention in Europe
- ^ Wilts, H. et al (2019). Research study on holistic indicators for waste prevention
- ^ EEA (2017). Waste prevention in Europe
- ^ OECD (2021). The OECD Inventory of Circular Economy Indicators
- ^ OECD (2021). The OECD Inventory of Circular Economy Indicators
- ^ French Ministry of the Environment, Energy and Marine Affairs (2017). 10 Key Indicators for Monitoring the Circular Economy
- ^ PACE (2021) Circular Indicators for Governments
- ^ OECD (2021). Assessing and unlocking the circular economy in Valladolid, Spain.
- ^ Acatech (2021). Making Circular Economy count – What you can’t measure, you can’t manage
- ^ PBL (2019) Circular economy: What we want to know and can measure
- ^ PBL (2021) Integrale Circulaire Economie Rapportage 2021
6.2 Non-governmental experience
The private sector is also interested in monitoring, documenting, and demonstrating circular economy performance. Companies face barriers in using data to promote the circular economy, including the lack of a common definition of a circular economy in the business context, poor data quality throughout value chains, lack of systems to share and integrate data, lack of trust, and concerns about how data collection complies with the General Data Protection Regulation (GDPR)[1]Dansk Standard (2021). Brug data til at sætte skub på den cirkulære økonomi. Retrieved from: https://www.ds.dk/media/mtrdbzxl/slides-morgenbriefing-ds.pdf .
There is no common standard to monitor the circular economy or specific waste prevention strategies within it. However, several standards have been developed or are under development including, but not limited to:
- EU’s taxonomy on circular economy activities as described in section 4.5, which include activities that promote waste prevention
- The Ellen MacArthur Foundation has developed Circulytics; a tool for companies to assess how circular they are. Circulytics also includes waste prevention activities (Circulytics is described in Case 14)
- The World Business Council for Sustainable Development has likewise developed circular transition metrics and indicators. Waste prevention is only included to a limited degree: through ‘% of non-virgin content”, which includes reused and recycled material[2]WBCSD, Circular Transition Indicators V2.0 – Metrics for business, by business.
- Under ISO/TC 323 on Circular Economy the ISO organisation is developing six circular economy standards including a standard of measuring and assessing circularity and a standard for product circularity data sheets.
Footnotes
- ^ Dansk Standard (2021). Brug data til at sætte skub på den cirkulære økonomi. Retrieved from: https://www.ds.dk/media/mtrdbzxl/slides-morgenbriefing-ds.pdf
- ^ WBCSD, Circular Transition Indicators V2.0 – Metrics for business, by business.
Circularity Product Data Set (CPDS)
Luxemburg’s Ministry of the Economy has initiated the “Circularity Product Data Set” that aims to provide a standard for communicating data on the circular properties of products. It consists of:
- A data template with standardised and reliable information about the circularity of a product,
- A third-party verification process,
- A standardised data exchange protocol[1]Government of Luxembourg (2020). Product Circularity Data Sheet..
This standard feeds into the ISO standard for circular economy currently being developed.
Footnotes
- ^ Government of Luxembourg (2020). Product Circularity Data Sheet.
6.3 Digital approaches
Most business processes and activities such as sales, value chain management, payments, storage and logistics are managed and recorded digitally in Enterprise Resource Planning (ERP) and other associated systems. This data can provide insights into the practices and behaviour of individual businesses, of which some are related to waste prevention. Larger companies tend to have comprehensive data about their own and supply chain activities and materials, smaller companies with shorter supply chains also tend to have data available, whereas the data of medium-sized companies, which often have long supply chains without the ability to exert control along them, is often of poorer quality.
SAP, which provides business management systems, has engaged in the monitoring of the circular economy. Its Responsible Design and Production software monitors businesses material flows and help them comply with EPR-regulations. The software is aligned with Circulytics[1]https://ellenmacarthurfoundation.org/resources/circulytics/overview and other circular economy standards on the market.
The initial motivation was to investigate whether the data registered in SAP software could be applied to inform on the circular economy. The underlying data belongs to SAPs clients, so cannot be used directly. However, by building up mutual agreements, where clients allow access to their data in return for benchmarking or guidance toward improving circular economy performance, businesses can be incentivised to share. SAP has, together with Typolytics, made the first pilot based on data from Coca-Cola, DS Smith and BrewDog to create a map of flows of post-consumer waste. If nothing else, this example demonstrates willingness of companies to share data where they can provide mutual benefits[2]Tololytics (2020). Wastemap for waste producers..
Footnotes
- ^ https://ellenmacarthurfoundation.org/resources/circulytics/overview
- ^ Tololytics (2020). Wastemap for waste producers.
6.4 B2G data sharing
Business to government (B2G) data sharing refers to “data that is already collected by all kinds of private companies (e.g. supermarkets, retailers, digital platforms, telecommunication companies) and civil-society organisations (NGOs, philanthropic foundations) for internal business purposes or for developing future products or services (e.g. personalised services).”[1]High-Level Expert Group on Business-to-Government data sharing (2019). Towards a European strategy on business-to-government data sharing for the public interest. The data collected can both be raw data, partly processed, fully processed, or transferred into data driven insights. Much of this data will be drawn from digital systems, including sales and inventory data.
B2G data sharing is however not common, and several challenges exist:
- Firstly, high entrance costs of identifying a data-sharing partner, defining a contractual agreement, and processing data might outweigh the benefits, and an initial investment is required.
- Secondly, a governmental structure providing a legal framework, best practices and standard scenarios are lacking including who has the responsibility if data is biased, and whether the data sharing can result in unequal competition.
- Thirdly, the provision of safe and/or data is limited. Anonymisation through pseudonymisation and aggregation of data might overcome the barriers of trade secrets, sensitive commercial information, and customers’ personal information, but it requires the right supportive system[2]High-Level Expert Group on Business-to-Government data sharing (2019). Towards a European strategy on business-to-government data sharing for the public interest.
The EU Commission includes B2G data sharing in its digital strategy “Towards a common European data space”[3]EC (2018b). Towards a common European data space., which set outs the following criteria for B2G data sharing:
- Proportionality in the use of private sector data: Must be justified by clear public interest purpose, any costs must be proportional with the public benefit
- Purpose limitation: Clear and limited purposed should be defined in contractual provisions, which should further limit data durability and assure the data will not be used for any other purpose
- Do not harm: Trade secrets and commercial sensitive data are respected
- Conditions for data re-use: The level of compensation should be linked to the public interest pursued; B2G should be non-discriminatory; B2G data should reduce the need of other types of data (such as surveys) and thus reduce administrative data burdens.
- Mitigate limitations of private sector data: Data providers should offer support to assess and improve the quality of data as needed, and public authorities should avoid selection bias.
- Transparency and societal participation: Any B2G agreement should be transparent, and best practices should be shared.
Footnotes
- ^ High-Level Expert Group on Business-to-Government data sharing (2019). Towards a European strategy on business-to-government data sharing for the public interest
- ^ High-Level Expert Group on Business-to-Government data sharing (2019). Towards a European strategy on business-to-government data sharing for the public interest
- ^ EC (2018b). Towards a common European data space.
7 Novel waste prevention monitoring initiatives
Fifteen cases studies have been prepared that demonstrate how novel data streams can be captured to inform on progress in waste prevention. Of the 15, seven emerged from public sector projects, while eight are based on private sector initiatives or draw on data held by companies.
In only one of the seven cases from the public sector has the public authority actively taken the initiative to generate the data stream: the Dutch government has initiated a web-scrape of companies communicating on circular economy including waste prevention (Case 7). In the other six public authority cases, the data streams have arisen via legislation and/or digitalisation of activities. Legislation has been the driver in Case 3, where a Swedish tax break on repair generates a novel data stream about the volume of professional repair; in Case 4, the regulation for SMEs to report on their residual waste side streams generate knowledge about reuse of materials; and in Case 5, the requirement to inform on the content of Substances of Very High Concern produces data on hazardous content which is also a waste prevention issue. Case 1, 2 and 6 shows how digitalisation of activities - digital maps and sharing platforms - enable monitoring of these activities.
Digitalisation of activities has also been a key enabler among the cases derived from the private sector. This is seen especially in Case 9 addressing the online second-hand market, Case 10 concerning reuse activities and Case 13 on intensifying the use of buildings. The implementation of digital management systems for stock management in retail (Case 15 on monitoring food waste) provides a wealth of useful data, while procurement records provide the basis for Case 12. Another driver is the digitalisation of product information by attaching a digital barcode (Case 8) and via blockchain (Case 14). Lastly, the aim of documenting and tracking the circularity performance can be a driver of collecting data (Case 14 on Circulytics).
Table 7 provides an overview of the case studies, while the full case descriptions can be found in Annex 6
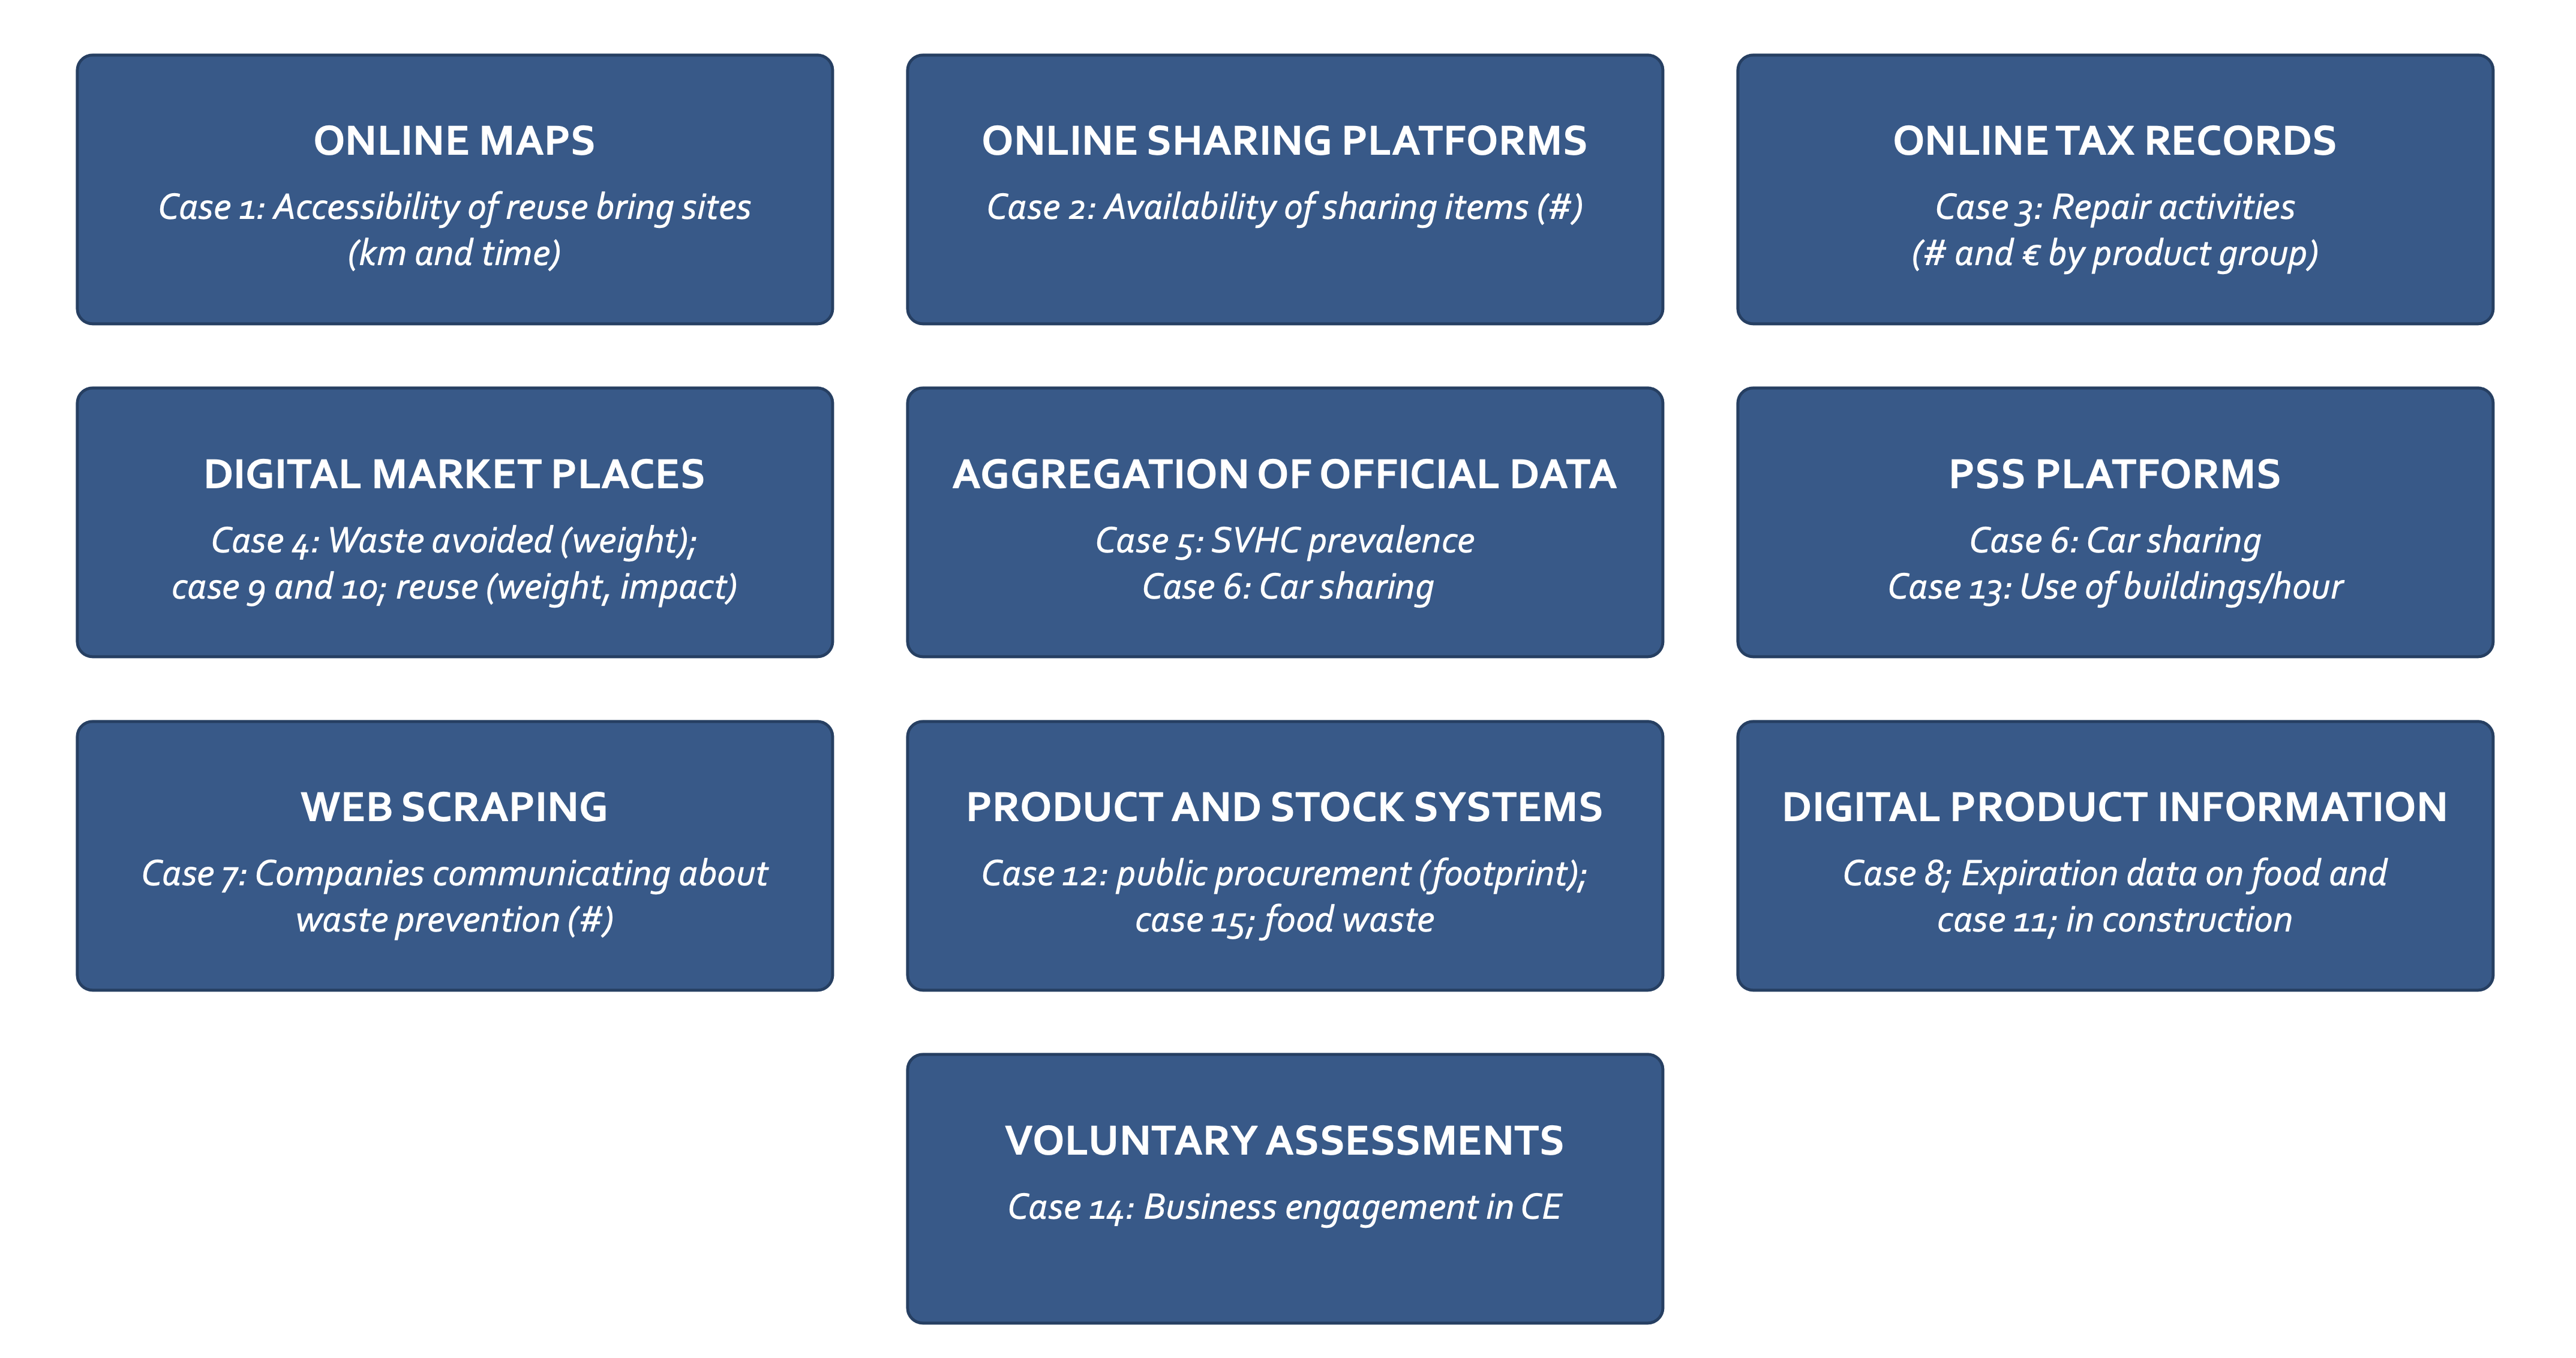
Table 7. Cases from public sector
| Case no. | Indicator – based on public data | Description/source | Digital component | Theory of change | Public/ private | Country | |
| 1 | Accessibility of reuse ‘bring sites’ | Average distance (km) or time (minutes) to nearest drop point. | Currently for textiles, reusable packaging waste and WEEE. Based on work undertaken on Circwaste project. | Collected from online/digital maps. | Output | Public | FI |
| 2 | Availability of municipal sharing services | Number of: - City bikes, - Non-typical library items, - Space. | Spaces and products available for lease/borrowing in municipalities. Drawn from two regions in Finland. Based on work undertaken on the Circwaste project. | Digital collection enabled by the use of a digital platform. | Input | Public | FI |
| 3 | Repair activity | The number/value of repairs by product group. | Using tax records to measure repair activities – drawn from Swedish business and person tax returns. | Digital collection based on digital analysis of public tax records. | Activity | Public | SE |
| 4 | Material reuse in public works | Quantity of waste materials avoided (tonnes); by sectors / material type (?). | Materiaalitori: a digital market-place connecting secondary mate-rials producers with potential buyers. Obligation for public works to use this publicly provided service. | Aggregated data from the digital marketplace. | Outcome | Public | FI |
| 5 | Prevalence of Substances of Very High Concern (SVHC) in Nordic products | Number of products by category. | Using existing product databases to inform on the number of products on the Nordic market that contain Substances of Very High Concern. | Digital collection, from SCIP database / Scan4Chem. | Output | Public | EU, DK, SE |
| 6 | Development of car sharing | Number of sharing providers, vehicles, locations, passenger km. | Measuring the penetration of car sharing broadly. Examples from German municipalities and industry organisations. | Digital business models enable digital collection of data. | Output | Public | DE |
| 7 | Business engagement with waste prevention and reuse | Number of companies communicating about waste prevention | Waste prevention strategies are translated into specific search words, which are found on Dutch companies’ webpages. | Digital collection of data using a web-scraper. | Input | Public | NL |
| 8 | Expiration date on food | - Expiry dates activated, and food products sold/ food waste avoided as a result hereof | Dynamic barcodes can improve inventory management, improve forecasts, ensure early action etc. | Digital barcodes | Activity | Private | NO |
| 9 | Size and impact of second-hand market | - Number of products; - Weight of products; - Saved CO2 emissions. | The second-hand effect: Sale of second-hand goods measured in weight and carbon emissions, from nine European online platforms owned by Schibsted and Adevinta. | Collection of data from/by the digital platforms. | Output | Private | SE, FI, NO |
| 10 | Reuse activity | - Share of Danes buying reuse during the last year by product category. - Number of posts etc. | ‘Reuse index’ based on survey and the company’s own data reuse market. Data on: activity; in which categories; number of posts; opinions; motivation; reuse platforms used. | Digital platform and presentation of data. | Activity | Private | DK |
| 11 | Material and carbon savings from reuse in construction. | Carbon savings Material saving. | Concular is a digital material passport of buildings (based upon blockchain) that further measures carbon and economic saving from reusing materials. Aggregating this data (could) provide economy wide indication of savings. | Digital collection and integration of data. | Outcome | Private | DE |
| 12 | Circular public procurement | Spend categories that promote circular economy. | Konsido: AI platform analysing electronic invoices, identifying the spend categories & activities with the largest potential in terms of circular economy. | Automatically collecting and analysing data on public procurement. | Activity / output | Private | DK |
| 13 | (Extra) utilisation of (public) buildings | Use of buildings/hours. | Vakansa: web-based platform to enable co-using "time vacancies" for existing tenants such as schools, civil society, and NGO's. But also to use it as a co-working space for companies. | Data from digital platform. | Activity | Private | SE |
| 14 | Business engagement in waste prevention and reuse. | Average circular economy scores within different sectors. | Circulytics: An online tool from the Ellen MacArthur Foundation enabling companies to assess their circularity developed by Ellen MacArthur Foundation (EMF). Several companies have used it, and EMF will report aggregated data. | Digital collection of data. | Output | Private | Global |
| 15 | Waste reduction in food retail | Tonnes of retail food waste avoided | WhyWaste: Tool for minimizing waste in food retail. Widespread use in key retailers. | Aggregated data from digital platform for management and reduction of food waste. | Outcome | Private | SE |
8 Future potential for monitoring waste prevention
This section draws on the 15 cases and the outputs of an interactive workshop to detail key opportunities for using digitalisation and digital technologies to inform on waste prevention and reuse. Based on this input, the opportunities have been structured around four conceptual focal points:
- Products - data generated by and about products,
- Transactions – data on products changing hands,
- Infrastructure – data on waste prevention and reuse infrastructure,
- Communication – data drawn from information published online.
8.1 Digital product data
Much of the waste produced by households, and each of the four categories for which reuse should be monitored by EU Member States, are end-of-life products. Methods of waste prevention include reducing the amount of materials in products, rethinking products by intensifying their usage, and prolonging products lifetimes through reuse and repair. Data about product properties, the ownership or location of products can give valuable information on the state of waste prevention.
8.1.1 Static product data
Product identifiers, like barcodes or tags, can be used to attach product information. This could include model number, care instruction, repair guides, component part numbers, end of life treatment and so on. This information can be exchanged among actors in the value chain. Static product data can refer to all instances of a given product (for example a specific model of washing machine), or to individual washing machines. Case 8 demonstrates how barcodes on food products containing expiry dates can activate price discounts and thus reduce food waste, contributing to reduce the overall food waste (ton).
The EU is expected to launch digital product passports in 2022 as part of the Sustainable Product Initiative. These digital passports are expected to contain static information about the content of products that can improve end of life treatment. The concrete design of digital product passports is not known and will likely differ across product groups depending on their environmental footprint and the complexity of a product group.
Relevant static information that can contribute to (monitoring of) waste prevention include:
- Digital Product Passports that include the content of a product in terms of volume of materials and use of hazardous substances. Aggregately, product passports can inform on the resource footprint of a product category. A tendency towards a lower resource footprint (materials/product group) of a product category will signal waste prevention. It is however important to pay attention to rebound effects. An indicator from material passport is the material footprint (kg of materials) that can indicate whether products are designing out waste and containing fewer hazardous substances.
- Repair information such as repair guides, access to spare parts and tools can inform on the framework conditions (input) for repair. Input indicators on repairability could be the share of products with available repair guides or the accessibility to spare parts (ideally monitoring both the time taken to procure spare parts; and average price of purchasing them). To measure repair as an outcome will require that repair input and activities are correlated with the product lifetime.
- Care and use instructions can likewise contribute to a prolonging of a product lifetime, but equally reflects an input (the share of products with care instructions available). Insights into the quality of the instructions could be worth considering and data might be collected by text mining the content of the instruction, but will require the training of an algorithm on what comprises a sufficient care instruction.
- The environmental impact of a product can be monitored by attaching information about Product Environmental Footprints (PEF). PEF methodologies are currently being standardised by the European Commission. PEFs enable comparison between products produced and used across Member States. PEFs can include information on average waste generated per product, signalling resource efficiency and waste prevention. Likewise, PEF can signal to what extend less hazardous and materials with lower environmental footprint are used. Indicators on products’ resource- and carbon footprint can be derived. Full environmental footprints also depend upon how a given product is used and PEF’s have trouble taking account of this, at least not when based on static information and use is not monitored.
Attaching products with tags or barcodes containing static information is readily possible and various examples exist.
Some projects take this concept a step further: for example, the “HolyGrail 2.0” project, where more than 85 companies and organisations from across the value chain are piloting digital watermarks technologies for a circular economy. Attaching such watermarks enable better sorting and higher-quality recycling rates for packaging in the EU[1]The Wholy Grail (2020). Pioneering Digital watermarks for smart packaging recycling in the EU.. The project is initiated by the European Brands Association (AIM).
Footnotes
- ^ The Wholy Grail (2020). Pioneering Digital watermarks for smart packaging recycling in the EU.
8.1.2 Product tracking data
Individual products can be tracked through supply chains and use by attaching a unique identifier and a machine-readable ID tag –such as Radio Frequency IDentification (RFID). To support monitoring of reuse, this technology needs to be permanent, rather than lost at point of sale. Some brand owners have already applied dynamic RFID tags. Gerry Weber has attached a RFID tag to the care-label of its clothing items. The RFID is destroyed, however, when the clothing is washed for the first time. The tag enables improved stock management by using a scanner installed in the ceiling to monitor the number of items in stock. Textile services and laundry company, Berendsen, has attached RFID tags to all textiles at the Danish hospital, Rigshospitalet. The tag is activated every time the textiles are washed by a portal-scanner at the entrance to the laundering hall, which allows the monitoring of the number of use cycles undergone by each product. In both systems, the tag is useful while the product remains in the ownership of the operator and the data created sits within a propriety business process management system.
Relevant data streams emerging from product location data include:
- Average product lifetime: By knowing when the product is put on market, purchased, and discarded, the lifetime of a product and the average lifetime of a product category can be calculated (time). A RFID tag can be passive but activated by a scanner placed at the point of sale and at the point of disposal. It will require a certain infrastructure but will contribute not just to monitoring of waste prevention, but likely also improve waste monitoring and management.
- Reuse: To measure the number of times a product has been reused; the exchange of ownership can be a signal. If sold through a physical second-hand shop, a sensor can scan the product, when it is sold to indicate a change in ownership. However, it is more complicated to measure informal reuse, where used products are exchanged between friends or family members. For some product groups, such as smart phones, a new login can be registered (e.g. Apple ID) that indicate a new owner.
- Repair: Professional repair can likewise be monitored through a sensor (number of repairs), activating the ID, placed at repair shops or cafes, or by requiring professional repairers to manually inform on the repair conducted for a specific product ID, or by requiring the product ID to be registered before a user can access repair guides or buy spare parts.
Internet connected products (like mobile phones and computers), also provide detailed information when they connect to internet services – for example, their operating system, browser type and version number, hardware – which provide an insight into the composition and age of the connected devices. Exploiting this could provide an interesting way to form a better understanding of the average age of IT equipment, a proxy for consumption and subsequently waste prevention.
8.1.3 Product state data
The Internet of Things (IoT) and the attachment of sensors can inform on the condition of a product. Knowledge about the condition of a product can indicate when maintenance and repair are needed, to ensure an optimised use of the product and thus prolong its lifetime. The information required is product-dependent and related to typical of reasons for obsolescence or failure. For example, battery condition is of key relevance and one of the typical reasons for obsolescence for smartphones. Data on the condition of a product can inform about:
- The typical reason for product failures that can inform product design, but also how often these occur within a certain product category (occurrence of product failures per product category).
- The use of products: How does the use of a product impact the lifetime of the product. Possible indicators are product use intensity, maintenance activities as well as more product specific activities (e.g. number of washes for textiles; types of washing programmes for washing machines etc.)
Currently, this type of data exists for more expensive electrical products – such as appliances. The data has more potential to be collected for EEE as well as more expensive goods, and for product service systems business models.
How AI can prolong product lifetimes and intensify product use
AI and machine learning can act as a driver for the circular economy by informing and improving design, material flows, and business models based on intensified product use. Design and development of new materials require a deep understanding of sourcing, quality, functionalities, performance, environmental impact etc. that AI can gather to identify smarter design choices. Material flows can be closed by looking into waste streams with visual recognition (cameras and sensors) that can sort out reusable goods. Business models based on intensified product use – such as Product Service Systems, sharing schemes – require that the location, use and condition of a product are monitored. When this data is collected (e.g. through IoT as described above), AI can forecast demand and set price.[1]EMF (2019). Artificial intelligence and the circular economy.
Footnotes
- ^ EMF (2019). Artificial intelligence and the circular economy.
Predictive maintenance
With a basis in product failure data, machine learning algorithm can identify a pattern for when a product is about to fail, and when maintenance is needed to avoid such failure. Deep learning analysis algorithms can improve the algorithms further and contribute to maintenance predictions (and how failures can be predicted). Predictive maintenance is thus based on several digital technologies that together prolong lifetimes. Data streams include types of failures, factors that affect failure, the given value of the factors, and also inform on the optimal maintenance of a given product and its optimal lifetime[1]Kristoffersen, E. et al. (2020). Smart Circular Economy: CIRCit Workbook 4.
Footnotes
- ^ Kristoffersen, E. et al. (2020). Smart Circular Economy: CIRCit Workbook 4
8.2 Transactions, exchanges and people
The section above focused on data about products themselves. This section focuses on data generated around and by the activities related to gaining access to second-hand products and shared-use products, be it second-hand platforms, PSS platforms, flea markets, but also about sales of new products and public procurement. The following briefly describes the potential for using transaction data to monitor waste prevention.
Transaction data that can inform on waste prevention include:
- Advertisement data from online second-hand platforms: Online second-hand platforms can inform on the number of sales taking place by asking the seller whether a product was sold, when an advertisement is taken down (this is demonstrated in Case 10 about the Danish Second hand Index). Additional information could also be harvested by asking addition questions: for example, about the age of the product when sold, and whether the seller was the first owner and whether any repairs had been carried out. In addition, knowing what used products have been purchased allows the calculation of environmental impacts (or savings) related to that product. Examples of this can be found in Case 9 measuring the resource and carbon impacts of second-hand compared to disposal.
- Transactions and stalls at Flea markets: Two types of transactions take place at flea markets: The hire of a stand and the purchase of used goods. The former may provide an idea about the infrastructure for reuse and may provide an entry point for knowledge about transaction data. The latter can be tracked by combining digital payments (such as MobilePay in Denmark) with the purchasers’ location to track the number/volume of transactions.
- Data on products from online sales points: Sales platforms and e-commerce sites provide a variety of information about the products on sale. While not as telling as sales volumes, the availability of reusable products, spare parts or refurbished products can inform about the visibility of the market. The data can be scraped using a search strategy combined with machine learning and/or image recognition.
- Procurement data: Professional procurers often have digital databases that manage procurement divided by product group, volumes, price, and suppliers. This data can contain useful information on the types, volumes and regularity of products and services procured. It can also help identify additional information related to the circular attributes of the product: whether the product is based on reused components, whether it can be repaired, details of service agreements and repair and maintenance schedules, all of which could inform on waste prevention and reuse.
- Retailers possess various digital product information both in term of sales number, materials, suppliers etc., these may contain information about whether products are designed to reduce waste e.g. by having a lower material footprint (weight).
- Use data from PSS and sharing platforms: These platforms have a wealth of data on users, use patterns and the state of their portfolio of products and services, which could provide valuable insight into general trends of consumption and thereby waste prevention, but also in the use patterns of items used for preventing waste - tools for repair for example. Case 6 demonstrates how car sharing data from various Car Sharing suppliers can be aggregated nationally and thus draw a national picture on the use of car sharing.
8.2.1 Non-monetary transactions
Some platforms are provided by public authorities and do not require a monetary transaction. The authority may, however, collect data about the use, for example by requiring a login as is the case with public libraries. Some public libraries have extended their sharing capacities from books to other services and the product intensity can then be monitored (as demonstrate by Case 2). Another example is the monitoring of the use of buildings (demonstrated in Case 14).
8.2.2 Citizen’s science
Citizen’s science is when citizens voluntarily report data and thus contribute to data collection (crowdsourcing). Data collection in citizen science is often enabled by a platform or app, where citizen can report on a given phenomenon through a recognised method. Citizen science data collection is widespread in biodiversity, where volunteers count and report the incidence of certain species. There are also examples of citizen science in the area of waste management: The Marine Litter Watch (coordinated by the EEA) reports the amount of litter in the sea through an app, and Zero Waste Scotland enables the reporting of illegal waste disposal by citizens. The Repair Alliance tool ‘Repair Monitor’ is based upon citizens science, where the quality of products and repair is registered based on a recognised method[1]Jørgensen, M. S. (2018). Citizens science møder cirkulær økonomi: Kan det give mere demokrati?.
Citizens could report on their own reduce, reuse and repair behaviour, although the potential for social desirability bias in self-reporting must be addressed. Combined with tips and trick, links to appropriate tools and crowd-source support, such a platform could support reuse and waste prevention and, as a by-product, provide valuable information about the scale and nature of reuse and waste prevention activities. Citizens will have to accept sharing data on waste prevention activities to comply with GDPR which may be a barrier unless they can see the value of entering the data themselves.
Footnotes
- ^ Jørgensen, M. S. (2018). Citizens science møder cirkulær økonomi: Kan det give mere demokrati?
8.2.3 Self-reporting circular data
The concept of citizens science can also be conducted on an organisational level. Various tools have been developed for companies to assess their circular performance as demonstrated by Circulytics (Case 14). Companies then register data about the materials they use, and based on which a score is calculated. This case illustrates that valuable information about circular performance and identification of areas of improvement can be an incentive for some companies to collect and report data related to circularity.
8.3 Infrastructure
The number and density of waste prevention facilities such as clothing bins and repair cafes can inform on the physical framework conditions to promote waste prevention. The physical framework conditions can be captured through online maps and average distances can be calculated; likewise opening hours can feed into an indicator of accessibility (km and time) of various waste prevention facilities such as:
- Reuse shops, flea market and reuse bins.
- Repair shops and repair cafes and
- Zero waste shops.
Infrastructure data mostly informs on enabling framework conditions and as such can be classified as providing input indicators, rather than indicators on actual use. Actual use of facilities could potentially be monitored though mobile phone tracking. Long distances may be a barrier of waste prevention in rural areas, for which accessibility indicators are more relevant.
8.4 Communication
Online communication channels provide a wealth of information, not least concerning waste prevention and reuse: Companies inform about their circular strategies; best practices are shared; academic articles about waste prevention are made available; transactions of second-hand goods are facilitated; Ideas and interest in Zero-Waste movements are shared. The circular transition taking place in the real world is reflected on the internet. Potentially useful communication data include:
- Social media: Trends in communities (e.g. number of and members of Facebook groups), number of hashtags or other content produced about waste prevention.
- Online libraries with information about scientific articles: Science in waste prevention (number of articles)
- Business- and organisational communication: Communication related to waste prevention; activities conducted about waste prevention (number of wordings related to waste prevention).
- Online news: Articles about waste prevention (number of wordings related to waste prevention).
- Trends in Google search related to waste prevention such as searching for ‘second-hand jacket’ rather than just a ‘jacket’ (share of searches containing ‘reuse’ /of all searches pr product category).
Broadly speaking, these communication channels measure popularity of trends, input and activities, rather than outcomes. Communication indicators can be affected by various other factors such as change in wordings and changes in the platforms in use. A sudden fall in the number of hashtags associated with ‘second-hand’ may be due to an increased use of the word ‘vintage’, for example. Likewise, words may change across boundaries and cultures, which makes it difficult to compare across countries. Lastly, not all societal groups are online, which lower the representation of the data.
8.4.1 Web crawlers
Data from the internet can be collected through web-crawlers. A web crawler is an advanced search strategy focusing on a specific concept that can be limited to a specific type of webpages (e.g. owned by companies) and/or geographical area. This allows large areas of the internet to be searched and analysed relatively quickly.
Web crawlers can be combined with image recognition or text mining to produce more advanced search algorithms. Text mining is based on machine learning and enables the identification of emergent patterns. The output of text mining is thus a frequency of words or trends. A variation of text mining is opinion mining, which investigates the emotional (negative/positive) load of a given wording. It can be used to look at citizens opinion of circular economy or specific circular economy initiatives such as buying second-hand. Web-crawlers can also be applied to identify operating online second-hand platforms, repair videos etc., which are available online. This data can give insight into a market and contribute data to calculate market shares.
Some web pages/platforms have open APIs, which allow a more structured interface with the platform, while others are closed. Most proprietary systems and commercial platforms are closed.
The data generated by webpage owners or individual’s digital footprint, is often owned/collected by a few tech giants including Google, Facebook, Apple and Amazon. However, GDPR reflects a new era of the individual right of personal data that might complicate the use of virtual data looking forward. Despite, this potential barrier, online behaviour can help to inform on the circular transition through web crawlers and supplementary approaches[1]Technopolis group (2016). Text and opinion mining for policy making..
Footnotes
- ^ Technopolis group (2016). Text and opinion mining for policy making.
8.4.2 Summary
Table 9 summarises current and potential indicators and data sources that are enabled by digitalisation.
Table 9. Current and potential data for measuring waste prevention in products, transactions, infrastructure and communication.
| Indicators derived from cases | Further opportunities / data streams / sources | |
Pro|ducts |
|
|
Trans|actions |
|
|
Infra|structure |
| Accessibility and convenience (km and time):
|
Communi|cation |
| Monitoring trends on:
|
9 Conclusions
State of monitoring
All the Nordic countries use waste volumes as a key waste prevention indicator, often moderated by other factors – for example population or GDP, and Sweden also considers food waste generation. At the other end of the material economy, Denmark uses resource productivity (RMC/GDP), while Sweden examines consumption of textiles and plastic bags. These indicators are supplemented by more activity and input related indicators on the number and sale of certified products, companies and authorities. These indicators, together provide a tangential indication of waste prevention in the Nordic countries.
Norway, Sweden and Denmark have not yet decided exactly how they will meet the EU’s reporting demands for reuse. Finland has begun data collection and a series of pilot projects to help develop a more comprehensive monitoring framework. Finland has further tested a few digital circular economy indicators through the Circwaste project, including accessibility of reuse bring sites and availability of municipal sharing services. The other Nordic countries are yet to take steps toward piloting the use of digital data streams.
Promising data streams
The case studies illustrate that there are already promising and informative examples of digital tools and methods being used to measure waste prevention both in the Nordic countries and in other European countries, initiated within the private and public sectors. These point toward a host of promising types of data that could be further exploited in the future. In particular, online platforms for sharing products and spaces and selling second-hand goods provide an excellent opportunity to tap into second- and third-hand transactions, while commercial data on produce stock management could provide valuable insight into food waste prevention, in particular. The internet provides a wealth of data that can be aggregated to inform on communication around waste prevention both from private citizens and companies. There is little to prevent these case studies being implemented in other Nordic countries subject to negotiated access to that data.
Key areas for future digital monitoring of waste prevention and reuse
As well as the existing examples outlines in the case studies, a plethora of alternatives have also been identified that can be harnessed in the future to inform on waste prevention and reuse. These include:
- Digital product passports and product environmental footprints,
- Product tracking and product ID through sensor and tagging technologies.
- Data from these technologies can be used to inform on product lifespans and repair activities.
- Data detailing transactions. This can come from a variety of sources: online marketplaces, sharing platforms, product service systems platforms, (public and private) procurement systems and potentially also payments systems.
- Could be used to monitor reuse activity (as well as quantity and value) as well as use rates for shared-use products.
- Location and access data on reuse and waste prevention infrastructure, for example reuse shops, flea markets, and reuse bins, repair shops and cafes and zero-waste shops.
- Could be used to monitor the physical framework conditions for reuse.
- Internet publishing: including company web pages, social media, news outlets, libraries and journals, as well as analysing search trends in search engines like Google.
- Could be used to inform on the actions being taken, how actively reuse and waste prevention is discussed on popular culture, the prevalence of these subject in scientific community, and how often people seek second-hand products.
Main challenges
Identifying relevant data streams, accessing those data streams, and analysing and integrating the data into a monitoring framework faces a variety of challenges:
- Capacity in authorities responsible for waste prevention monitoring: Waste prevention itself requires a significant cross departmental effort, although responsibility for waste prevention often lies with waste departments within environmental authorities. Monitoring waste prevention by harnessing the digitalisation of society requires competencies that are not typically found within the responsible authorities.
- Negotiating access to privately held data: Much of the data identified is held in private hands or is otherwise not publicly available. Accessing this data will require negotiations with the data owners. Some data may also be business sensitive, so approaches must be sensitive to the need to aggregate and/or anonymise data. The developing conventions around B2G data sharing in the EU Commission’s Digital Strategy could help ease this process.
- GDPR and other data privacy laws: Data on individuals may be subject to GDPR and other privacy legislation. This is not a critical barrier but does mean that access to and use of data needs to be sensitive to the legal framework.
10 Roadmap – toward better monitoring of waste prevention in the Nordic countries
The roadmap presented below provides a strategic and structured plan to monitor waste prevention digitally. There is a great opportunity for the Nordic countries to collaborate on this issue: to exchange experiences, coordinate pilot indicators, build internal capacities and expertise and test technical solutions. An important factor in developing digital monitoring strategies for waste prevention and reuse is that the digitisation of society has not and never will reach an end point. This means that new relevant data streams will appear and contemporary streams could become redundant. As such, this work has attempted to identify some specific contemporary data streams that could be useful now and in the near future (in the case studies), as well as identify areas of digital development and digitalisation that present further potential opportunities monitoring waste prevention and reuse.
The roadmap describes a general approach to the development of digital monitoring of waste prevention and reuse. It divides the processes into three components: Organisation; Identification, access and piloting; and; Implementation. The last component – implementation – is not addressed in this project as it is assumed to follow similar processes to those already in place to produce existing indicators. As such, the description of the roadmap focuses on the organisation of the process and the identification, access and piloting of potential indicators.

10.1 Organisation
Prioritisation of monitoring waste prevention. In the Nordic countries, monitoring of waste prevention requires new data to be collected and/or exploited. Digitalisation can ease the burden of data collection but requires that resources are allocated. Therefore, allocating necessary resources is a precondition for piloting and implementing digital monitoring of waste prevention. This can be tied to the aim of monitoring all aspects of the circular economy and not just waste prevention. The framing of any monitoring efforts should reflect local political priorities but be systematically approached to cover key aspect of the circular economy. It could be useful to build a circular economy or waste prevention monitoring working group between the relevant authorities in the Nordic countries. The Nordic Working Group for Circular Economy is a good starting point, although it would also be useful to include experts in digitalisation – potentially from ministries and agencies that typically do not participate in CE coordination work at the Nordic level.
Build data capacities in public authorities. Digital monitoring of waste prevention will require that public authorities understand how to collect, integrate, and analyse data from novel and disparate sources. Data experts can already be found within waste monitoring and within the area of digitalisation. It is crucial to ensure that those responsible of digital monitoring of waste prevention have the proper capacities or can otherwise draw on these competencies from supporting agencies. It is essential that knowledge and expertise of digitalisation already present in public authorities be exploited to the full. This will require a large degree of cross-ministry and cross-agency collaboration. Where necessary, in-house competencies can be supplemented with the procurement of technical expert services as needed.
Divide responsibilities of digital monitoring of waste prevention. Multiple work streams will need to be coordinated to successfully monitor waste prevention and reuse. The conceptual framework must be developed and updated, indicators defined and the supporting data must be identified, collected, integrated and analysed. In Denmark, the Circular Data Bank draws upon expertise from both the users of the data (the Association of Municipalities and the Danish EPA), but also those with insights into data management (the Digital Agency and the Environmental Data Portal). Coordinating this work across the Nordic region could help streamline this process and support mutual learning.
Plan for data storage and integration. A monitoring framework for waste prevention will need a support system that stores and integrates data sources, and ideally also enables data analysis. A pre-screening of available systems or integration with existing systems – such as waste data systems – should be part of the initial planning.
10.2 Identify and pilot data
Exploit public data. An initial screening of current and future public data streams that inform waste prevention should be made. Such data will often be linked to implemented policies that support waste prevention. A sharing platform of various products has been exemplified in Finland (Case 1 where the average distance and time to nearest reuse bring sites has been used as an indicator or Case 2 where the use of sharing items have been applied as an indicator). An alternative possibility is presented by reporting obligations such as those concerning information on the product content of substances of very high concern (see e.g. Case 5).
Product data is of key relevance for monitoring waste prevention. In a globalised world, where products and their components may cross several national borders, there is need for broad alignment in the content and format of product data. Standing alone, the Nordic countries will find it difficult to impose and enforce digital product data; especially in global markets such as EEE, where little production takes place in the Nordic countries. Common and aligned standards for product data – such as the EU digital product passport - will have a greater impact, and the Nordic countries should focus on EU collaboration to push this agenda.
Seek cooperation with private data holders. The data generated in today’s digital economy is often confidential and/or business critical. Accessing this data requires cooperation with the data holder. This could be in the form of voluntary industry initiatives such as the second-hand effect[1]Schibsted (2021). The second-hand effect or the reuse index[2]DBA (2020). Genbrugsindekset. However, where the company is the sole developer of the indicator, it can be difficult for public authorities to rely on this data to provide time series. Companies can also be incentivised to share data through certification, training or other assistance (see e.g. Case 14 – Circulytics). Public authorities can also play an important role in driving the development of data standards for products and services supporting transparency and openness, as well as supporting compliance with regulation such as GDPR.
Private companies own a vast quantity of data, and many have deep insights into monitoring of consumption trends – particularly those that have a significant share of their market. Public authorities can cooperate directly with these companies, or the relevant business associations and sector representatives to test models for data sharing and for developing useful indicators.
A first step could be to facilitate a broad circular monitoring partnership that brings together civil society and business actors to identify relevant data sharing collaborations. Such partnership could also identify incentives for data sharing. The EU requirement for quantitative and qualitative monitoring of reuse could be a natural starting point e.g. inviting second-hand platforms, some of which already report the amount of reuse taking place through their platforms, but also flea market managers, and physical second-hand shops. Case 9 on the impact of reuse shows how the average weight of product categories can be estimated and used to calculate environmental footprints.
Exploit B2G data sharing. In continuation and expansion of the cooperation with business encouraged above, B2G data sharing – a more systematic and structured transfer of data from businesses to authorities – may be explored. To implement a B2G data sharing, supportive framework condition needs to be in place. These include contractual agreement and anonymisation through aggregation of data and the removal of commercial sensitive data. B2G data sharing should aim to generate societal value, must be transparent, respect commercial sensitive data, and handled securely and without misuse. The administrative costs of collecting and sharing data could also be compensated. B2G sharing must be mutually beneficially and in some cases could take place under procurement processes or be a condition of procured services. As very few experiences with B2G data sharing exist, B2G data sharing on reuse could thus be a pilot that can inform future B2G data sharing. If this is the case, experiences, pitfalls and recommendations should be systematically collected throughout the process.
Consider further data collection. Public authorities can take steps to collect data or procure a data service, in particular within open-sourced infrastructure data, communication and transactions data. Such data collection should be aligned with political priorities as pointed out under the first step of this roadmap. The Netherlands has, for example, taken steps to monitor how businesses communicate on the circular economy as a proxy for companies involved in the circular transition. The data was collected through a web-scraper, scraping from company webpages (see Case 7).
Product data is expected to be implemented with digital product passports through EU regulation, but transactional data could also be an interesting entry point. Data on public procurement tenders and invoices could help monitor circular public procurement as indicated in Case 12, or the possibilities of exploiting e-commerce data could inform on (circular) consumer behaviour.
Similarly, future publicly-funded research and development projects supporting waste prevention and reuse should include data standardisation, transparency, and collection as a standard component. This could even be a common component of all publicly-funded R&D projects that generate data.
Coordinate pilot indicators and data streams between the Nordic countries. Pilot indicators based on identified data streams should be established to provide an understanding of data quality, ease of implementation and usefulness of the indicator. Pilots should pay attention to any implementation barriers and opportunities. This is a key area where responsible authorities in the Nordic countries should cooperate. Rather than duplicating efforts, it will be more efficient to coordinate trials and pilots across countries. This will be aided by ensuring that there is also coordination earlier in the process, so that the Nordic countries are broadly aligned on the framework for measuring waste prevention and reuse. In Finland, the Circwaste project created a playground for testing and trying out various data streams. It is important to create a room for pilots where mistakes can take places and learning can occur.
| Recommendations | Indicator opportunities | |
| Pro|ducts | Follow and support the development of Digital product passports at the EU level. These contain information on material composition, environmental performance and additional product information and could provide valuable data in coming decades. Explore the possibilities of collaborating with sharing/PSS platforms to better understand use trends and market size. Collaborate with retailers/brands to investigate the possibilities of using data generated through dynamic barcodes to monitor supply chain and potentially consumer waste at product level. Explore the potential of using browser data to measure the age (and other attributes) of internet connected devices, which could inform on consumption levels. Promote open data standards through public procurement. |
|
| Data will be more accurate with dynamic product information that take the use phase into account, although this is still emerging for consumer products. | ||
| Trans|actions | Transaction data can be harvested now, enabling the Nordic countries to take steps to collect data now. Transaction data can further supplement product data to monitor Green Public Procurement and Product as a Service. Here and now, the Nordic countries can use transaction data to monitor the volume of second hand from online second-hand platforms. Looking forward, combining transaction (purchase) and location data could provide valuable insights, although this will require careful negotiation on data rights and GPDR issues. |
|
| Infra|structure | Data on infrastructure facilities to improve waste prevention can contribute to monitor the framework conditions, which is mostly relevant in countries with larger distances and where the lack of physical facilities are a barrier or in rural areas. | Accessibility and convenience (km and time):
|
| Communi|cation | This data is already publicly available and just needs to be collected and analysed. There are a number of companies that provide this type of market analysis service. Alternatively, the authorities in Nordic countries could initiate pilot projects to develop these indicators internally. | Monitoring trends on:
|
10.3 Implementation
The implementation process – collecting, integrating, and analysing the data, and finally reporting all take place within existing structures. While data collection could differ from existing practices, the nature of that process will be highly dependent on exactly which data sources are used. As this project aimed at identifying future data streams to inform monitoring of waste prevention, the implementation phase is not described in more detail.
11 Literature
Acatech (2021). Making Circular Economy count – What you can’t measure, you can’t manage
Danish Environmental Ministry (2021). Handlingsplan for cirkulær økonomi – national plan for forebyggelse og håndtering af affald 2020–2032: https://mim.dk/media/222902/handlingsplan-for-cirkulaer-oekonomi_0607211338.pdf
Dansk Standard (2021). Brug data til at sætte skub på den cirkulære økonomi. Retrieved from: https://www.ds.dk/media/mtrdbzxl/slides-morgenbriefing-ds.pdf
Danish Environmental Portal (2020). Circular Databank. Retrieved from: https://miljoeportal.dk/projekter/cirkulaer-økonomi-ved-danmarks-miljoeportal/
Danish Environmental Protection Agency (2015). The potential of RFID-technology to secure information flow between producers of electronics and waste processors, Environmental project No. 1631, The Danish Environmental Protection Agency, Copenhagen. Retrieved from: https://www2.mst.dk/Udgiv/publications/2015/01/978-87-93283-49-7.pdf) accessed 13 October 2020.
Danish Government (2018). Strategi for cirkulær økonomi: https://www.regeringen.dk/media/5626/strategi-for-cirkulaer-oekonomi_web.pdf
Danish Government (2020). Aftale mellem regeringen (Socialdemokratiet) og Venstre, Radikale Venstre, Socialistisk Folkeparti, Enhedslisten, Det Konservative Folkeparti, Liberal Alliance og Alternativet om ”Klimaplan for en grøn affaldssektor og cirkulær økonomi”: https://www.regeringen.dk/media/9591/aftaletekst.pdf
DBA (2020). Genbrugsindekset. Retrieved from: https://guide.dba.dk/publikationer/genbrugsindekset/2021/
Demestichas, D. and E. Daskalakis (2020). Information and Communication Technology Solutions for the Circular Economy. Retrieved from: https://www.researchgate.net/publication/344558836_Information_and_Communication_Technology_Solutions_for_the_Circular_Economy
EC (2018a). Directive (EU) 2018/851 of the European Parliament and of the Council of 30 May 2018 amending Directive 2008/98/EC on waste. Retrieved from: https://eur-lex.europa.eu/legal-content/EN/TXT/?uri=celex%3A32018L0851
EC (2018b). Towards a common European data space. Retrieved from: https://eur-lex.europa.eu/legal-content/EN/TXTtemanord2022-536.pdf?uri=CELEX:52018DC0232&from=EN
EC (2019). Commission delegated decision 2019/1597. Retrieved from: https://eur-lex.europa.eu/legal-content/EN/TXTtemanord2022-536.pdf?uri=CELEX:32019D1597&from=EN
EC (2020a). Categorisation system for the circular economy – A sector-agnostic approach for activities contributing to the circular economy. Independent expert report
EC (2020b). Green Deal: Sustainable batteries for a circular and climate neutral economy. Retrieved from: https://ec.europa.eu/commission/presscorner/detail/en/ip_20_2312
EC (2020c). Guidance of reporting of data on food waste and food waste prevention. Retrieved from: https://ec.europa.eu/eurostat/documents/342366/351811/Guidance+on+food+waste+reporting/5581b0a2-b09e-adc0-4e0a-b20062dfe564
EC (2020d). The new Circular Action Plan – for a cleaner and more competitive Europe. Retrieved from: https://ec.europa.eu/environment/strategy/circular-economy-action-plan_da
EC (2021a). Waste Law. Retrieved from: https://ec.europa.eu/environment/topics/waste-and-recycling/waste-law_en
EC (2021b). Proposal for a Directive of the European Parliament and of the Council amending Directive 2013/34/EU, Directive 2004/109/EC, Directive 2006/43/EC and Regulation (EU) No 537/2014, as regards corporate sustainability reporting. Retrieved from: https://eur-lex.europa.eu/legal-content/EN/TXTtemanord2022-536.pdf?uri=CELEX:52021PC0189&from=EN
EC (2021c). A European Strategy for data. Retrieved from: https://digital-strategy.ec.europa.eu/en/policies/strategy-data
EEA (2016). Overview of national waste prevention programmes in Europe - Iceland
EEA (2017). Waste prevention in Europe - policies, status and trends in reuse in 2017
EMF (2019). Artificial intelligence and the circular economy. Retrieved from: https://archive.ellenmacarthurfoundation.org/explore/artificial-intelligence-and-the-circular-economy
EUR-Lex, document C(2020) 8976. Retrieved from: https://eur-lex.europa.eu/legal-content/EN/TXTtemanord2022-536.pdf?uri=CELEX:32021D0019&rid=3
EUR-Lex, document C(2020) 8976. Retrieved from: https://eur-lex.europa.eu/legal-content/EN/TXTtemanord2022-536.pdf?uri=CELEX:32021D0019&rid=3
European Policy Centre (2019). Creating a digital roadmap for a circular economy. Retrieved from: https://www.climate-kic.org/wp-content/uploads/2019/07/DRCE.pdf
Eurostat (2021a). Circular economy indicators. Retrieved from: https://ec.europa.eu/eurostatcircular-economy/indicators/monitoring-framework
Eurostat (2021a). Circular economy indicators. Retrieved from: https://ec.europa.eu/eurostatcircular-economy/indicators/monitoring-framework
Eurostat (2021b). Hazardous substances. Retrieved from: https://ec.europa.eu/eurostatenvironment/hazardous-substances
Finnish Ministry of the Environment (2018). From Recycling to a Circular Economy – National Waste Plan to 2023. Retrieved from: https://julkaisut.valtioneuvosto.fi/bitstream/handle/10024/160889/SY_01en_18_WEB.pdf?sequence=1&isAllowed=y
Finnish Ministry of the Environment (2018). From recycling to a circular economy: national waste plan to 2023
Finnish Ministry of the Environment and Ministry of Employment and the Economy (2021). Government resolution on the strategic programme for circular economy. Retrieved from: https://ym.fi/documents/1410903/42733297/Government+resolution+on+the+Strategic+Programme+for+Circular+Economy+8.4.2021.pdf/309aa929-a36f-d565-99f8-fa565050e22e/Government+resolution+on+the+Strategic+Programme+for+Circular+Economy+8.4.2021.pdf?t=1619432219261
Finnish Ministry of the Environment. Jäte- ja tuotetietojärjestelmä -hanke. Retrieved from: https://ym.fi/hankesivu?tunnus=YM051:00/2020, https://api.hankeikkuna.fi/asiakirjat/cd878090-31c8-4877-ae33-d65d4bb15167/98e22dca-81a1-439f-ac37-0cbd93c9efe2/SUUNNITELMA_20210624114604.pdf
Finnish Ministry of the Environment. Jäte- ja tuotetietojärjestelmä -hanke. Retrieved from: https://ym.fi/hankesivu?tunnus=YM051:00/2020, https://api.hankeikkuna.fi/asiakirjat/cd878090-31c8-4877-ae33-d65d4bb15167/98e22dca-81a1-439f-ac37-0cbd93c9efe2/SUUNNITELMA_20210624114604.pdf
French Ministry of the Environment, Energy and Marine Affairs (2017). 10 Key Indicators for Monitoring the Circular Economy
Government of Luxembourg (2020). Product Circularity Data Sheet. Retrieved from: https://pcds.lu/the-audit-system/
High-Level Expert Group on Business-to-Government data sharing (2019). Towards a European strategy on business-to-government data sharing for the public interest
Ingemarsdotter, E. et al. (2019). Circular strategies enabled by the internet of things – a framework and analysis of current practice, Sustainability 11, p.1–37.
IVL (2021). Samarbete för minskat matsvinn. Retrieved from: https://www.ivl.se/projektwebbar/samarbete-for-minskat-matsvinn.html
Jørgensen, M. S. (2018). Citizens science møder cirkulær økonomi: Kan det give mere demokrati?
Kick, M. et al. (2021). Making Circular Economy count – What you can’t measure, you can’t manage. Retrieved from: https://www.systemiq.earth/wp-content/uploads/2021/04/CE-Metrics-Report-1404.pdf
Kristoffersen, E. et al. (2020). Smart Circular Economy: CIRCit Workbook 4
Kristoffersen, E. et al. (2020). The smart circular economy: A digital-enabled circular strategies framework for manufacturing companies. Retrieved from: https://reader.elsevier.com/reader/sd/pii/S0148296320304987?token=FBCED76543AD42B1037F726FB51EC39FDC118FE329543F639827404B576FC50A8A60D6AAEBDBE26DBE1759725A9E2510&originRegion=eu-west-1&originCreation=20220113134654
Lakhan, C. (2017). Factors influencing waste generation, and guidance for how to measure waste reduction – An empirical approach. York University, Canada. Draft
myEcoCost (2012). myEcoCost. Retrieved from: https://myecocost.eu/
National Food Administration, the Swedish Board of Agriculture and the Swedish Environmental Protection Agency (2018). Fler gör mer – Handlingsplan för minskat matsvinn 2030: https://www.livsmedelsverket.se/globalassets/matvanor-halsa-miljo/matsvinn/fler-gor-mer-handlingsplan-for-minskat-matsvinn_20180618.pdf?AspxAutoDetectCookieSupport=1
Naturvårdsverket (2018). Att göra mer med mindre
NORSUS (2020). Kartlegging av brukte tekstiler og tekstilavfall i Norge. Retrieved from: https://norsus.no/publikasjon/kartlegging-av-brukte-tekstiler-og-tekstilavfall-i-norge/
Norwegian Environmental Agency (2020). Avfallsplan 2020-2025. Retrieved from: https://www.miljodirektoratet.no/publikasjoner/2019/desember-2019/avfallsplan-2020-2025/
Norwegian government (2013). Ny strategi: Fra avfall til ressurs, chapter 4 on waste prevention
Norwegian Government (2021). Metodologi og format for rapportering av ombruk. Retrieved from: https://www.regjeringen.no/no/sub/eos-notatbasen/notatene/2021/feb/metodologi-og-format-for-rapportering-av-ombruk/id2844293/
Norwegian Government (2021). Nasjonal strategi for ein grøn, sirkulær økonomi. Retrieved from: https://www.regjeringen.no/no/dokumenter/nasjonal-strategi-for-ein-gron-sirkular-okonomi/id2861253/
OECD (2019). Going Digital: Shaping Policies, Improving Lives. Retrieved from: https://www.oecd-ilibrary.org/science-and-technology/going-digital-shaping-policies-improving-lives_9789264312012-en?itemId=/content/component/58ee7fe5-en&_csp_=489848dd2a09959e17511494b5e661ea&itemIGO=oecd&itemContentType=chapter
OECD (2021). Assessing and unlocking the circular economy in Valladolid, Spain. Retrieved from: https://www.oecd-ilibrary.org/sites/51787938-en/index.html?itemId=/content/component/51787938-en
OECD (2021). Assessing and unlocking the circular economy in Valladolid, Spain. Retrieved from: https://www.oecd-ilibrary.org/sites/51787938-en/index.html?itemId=/content/component/51787938-en
OECD (2021). The OECD Inventory of Circular Economy Indicators
OECD (2021). The OECD Inventory of Circular Economy Indicators
PACE (2021). Circular Indicators for Governments. Retrieved from: https://pacecircular.org/sites/default/files/2021-04/CircularIndicatorsForGovernments_FINAL.pdf
Pagoropoulos, A. et al. (2017). The emergent role of digital technologies in the Circular Economy: A review, Procedia CIRP 64, p. 19–24.
PBL (2019). Circular economy: What we want to know and can measure. Retrieved from: https://www.pbl.nl/sites/default/files/downloads/pbl-2018-circular-economy-what-we-want-to-know-and-can-measure-3217.pdf
PBL (2021). Integrale Circulaire Economie Rapportage 2021. Retrieved from: https://www.pbl.nl/sites/default/files/downloads/pbl-2021-integrale-circulaire-economie-rapportage-2021-4124.pdf
Research study on holistic indicators for waste prevention
Schibsted (2021). The second-hand effect
Sharp, V et al. (2010). Methods to monitor and evaluate household waste prevention. Waste Management & Research 2010: 28: 269–280
Swedish Environmental Protection Agency (2020). Att göra mer med mindre – Nationell avfallsplan och avfallsförebyggande program 2018–2023. Retrieved from: https://www.naturvardsverket.se/Om-Naturvardsverket/Publikationer/ISBN/6900/978-91-620-6946-9/
Swedish Government (2021). Cirkulär ekonomi - Handlingsplan för omställning av Sverige: https://www.regeringen.se/informationsmaterial/2021/01/cirkular-ekonomi---handlingsplan-for-omstallning-av-sverige/
Takeshi, M. et al. (2017). Monitoring environmental burden reduction from household waste prevention [in Koyoto]. Waste Management 71 (2018) 2–9
Technopolis group (2016). Text and opinion mining for policy making. Retrieved from: http://media.wix.com/ugd/c04ef4_df6e2eedb7f74ac8b58e0bbc060a45d2.pdf
The Wholy Grail (2020). Pioneering Digital watermarks for smart packaging recycling in the EU. Retrieved from: https://www.gs1.eu/news/holy-grail-2-0-pioneering-digital-watermarks-for-smart-packaging-recycling-in-the-eu
Tololytics (2020). Wastemap for waste producers. Retrived from: https://topolytics.com/wastemap-for-waste-producers/
Waste Act 646/20211. https://www.finlex.fi/fi/laki/ajantasa/2011/20110646
Watson, D. et al. (2013). European Topic Centre for Sustainable Consumption and Production: Proposals for targets and indicators for waste prevention in four waste streams. Nordic Council of Ministers.
WBCSD, Circular Transition Indicators V2.0 – Metrics for business, by business. Retrived from: https://www.wbcsd.org/contentwbc/download/11256/166026/1
WhyWaste. (2021). Whywaste. Retrieved from: https://whywaste.com/
Wilts, H. et al (2019). Research study on holistic indicators for waste prevention
Woodsense (2021) Om. Retrieved from: https://www.woodsense.dk/om
Annex 1 – National factsheet – Sweden
National policy on waste prevention
The Swedish national policy on waste prevention is outlined in the National Waste Management Plan and Waste Prevention Program 2018–2023 ‘Att göra mer med mindre’[1]Swedish Environmental Protection Agency (2020). Att göra mer med mindre – Nationell avfallsplan och avfallsförebyggande program 2018–2023., which is an integrated strategy for the management of waste in Sweden. The National Plan was revised in 2020 to reflect the new requirements by the revised EU waste package[2]EC (2021a). Waste Law. and the constitutional amendments made for their implementation. The revised EU waste package came into force in July 2018 and its implementation meant that a number of changes were needed in Swedish laws and ordinances. The relevant constitutional amendments entered into force on 1 August 2020. In the revised EU waste package, the obligation for Member States to take waste prevention measures has been strengthened, inter alia, by the extensions in Article 9(1) of the Waste Framework Directive[3]EC (2018a). Directive (EU) 2018/851 of the European Parliament and of the Council of 30 May 2018 amending Directive 2008/98/EC on waste.. The waste prevention programs shall include a description of the contributions to waste prevention from the instruments and measures set out in the revised Annex with examples of waste prevention measures (Article 29(2) and Annex IV of the Waste Directive). Within the waste prevention program, a special program for the prevention of food waste must also be adopted. Here, the Swedish Environmental Protection Agency assumes that the Action Plan for Reduced Food Waste in 2030, ‘Fler gör mer’[4]National Food Administration, the Swedish Board of Agriculture and the Swedish Environmental Protection Agency (2018). Fler gör mer – Handlingsplan för minskat matsvinn 2030., which was decided in 2018 by the National Food Administration, the Swedish Board of Agriculture and the Swedish Environmental Protection Agency can be adopted as a special program. According to Article 9(3) of the Waste Framework Directive, Member States shall monitor and assess waste prevention measures through appropriate qualitative or quantitative indicators and targets. Article 29(1) also requires that waste prevention objectives be set out in the waste prevention program.
In the same year, in July 2020, the government presented the National Strategy for Circular Economy[5]The Swedish Government (2020). Cirkulär ekonomi - strategi för omställningen i Sverige, which points out the direction for the work that needs to be done to switch to circular production, consumption and business models, as well as non-toxic and circular material cycles. Waste prevention is integral part of the circular economy and as such the National Strategy for Circular Economy plays a critical role in the direction the Swedish consumption and production develops in relation to resource use and waste. A circular economy is a tool for reducing society's use of resources and the environmental impact that results from this. The strategy identifies four focus areas where efforts are necessary:
Footnotes
- ^ Swedish Environmental Protection Agency (2020). Att göra mer med mindre – Nationell avfallsplan och avfallsförebyggande program 2018–2023.
- ^ EC (2021a). Waste Law.
- ^ EC (2018a). Directive (EU) 2018/851 of the European Parliament and of the Council of 30 May 2018 amending Directive 2008/98/EC on waste.
- ^ National Food Administration, the Swedish Board of Agriculture and the Swedish Environmental Protection Agency (2018). Fler gör mer – Handlingsplan för minskat matsvinn 2030.
- ^ The Swedish Government (2020). Cirkulär ekonomi - strategi för omställningen i Sverige
- Circular economy through sustainable production and product design
- Circular economy through sustainable consumption and use of materials, products and services
- Circular economy through non-toxic and circular material use
- Circular economy as a driving force for business and other actors through measures that promote innovation and circular business models.
In January 2021, the government decided on the first Action Plan[1]The Swedish Government (2021). Cirkulär ekonomi - Handlingsplan för omställning av Sverige linked to the circular economy. The Action Plan contains more than one hundred measures in areas such as industrial conversion, material supply, technology development and waste management, that would enable the transition to a circular economy and will render operational the National Strategy for Circular Economy.
The National Waste Management Plan and Waste Prevention Program 2018–2023 and the Action Plan for circular economy contain a number of new milestones – connected to the national environmental targets of Sweden – that are specifically targeting waste prevention:
- Reduction of the amount of food waste per capita by at least 20 percent per capita from 2020 to 2025
- Increase the proportion of produced food reaches stores and consumers in 2025.
- The proportion of reusable packaging placed on the market will increase gradually from 2022 by at least 30 percent by 2030.
- Partially linked to waste prevention through the ‘preparation for reuse’ component, the milestone to gradually increase the proportion of municipal waste that is recycled and prepared for reuse. The milestone has an increasing level of ambition until the year 2035, when at least 65 percent by weight of municipal waste must be prepared for reuse or recycled. Target year and weight percentage are the same as in the Waste Framework Directive.
As well as the afore mentioned legislation and strategy documents, there are also a number of other policy initiatives that aim to promote waste prevention. Initiatives that contribute to this agenda include municipal waste plans, the collaboration program for a bio-based economy, the strategy for sustainable consumption, the action plan for a non-toxic everyday life and the food strategy[2]The Swedish Environmental Protection Agency (2020). There are also working groups that cooperate to find new solutions on how to reduce waste, including the collaboration group for reduced food waste[3]IVL (2021 Samarbete för minskat matsvinn.
In Sweden, the municipalities have a very important role to play in waste prevention work. Among other things, they have the task of informing households about waste prevention measures to reduce the generation of waste. The Swedish Environmental Protection Agency begun work in 2021 to produce guidance for municipalities on how they can work with waste prevention measures and information for households. Moreover, several municipalities with the contribution of their municipal-owned waste management enterprises (e.g. SÖRAB, SYSAV etc.) have started drawing circular economy strategies and action plans, introducing specific targets for waste prevention at the local level[4]e.g. SYSAV, 2021. Från avfall till resurs – Gemensam kretsloppsplan 2021–2030: https://www.kretsloppsplanen.se/.
Footnotes
- ^ The Swedish Government (2021). Cirkulär ekonomi - Handlingsplan för omställning av Sverige
- ^ The Swedish Environmental Protection Agency (2020)
- ^ IVL (2021 Samarbete för minskat matsvinn
- ^ e.g. SYSAV, 2021. Från avfall till resurs – Gemensam kretsloppsplan 2021–2030: https://www.kretsloppsplanen.se/
Indicators on waste prevention
There are no indicators for measuring waste prevention specified in any policy document. However, there is a variety of available indicators that could potentially be used to measure progress against the milestones presented above. None of the indicators are digitalised as such:
- Amount of waste (tonnes)
- Amount of food waste (in each step of the value chain, tonnes)
- Consumption of plastic carrier bags (number/capita/year)
- Consumption of textiles (kg/capita/year)
- Percentage of environmentally certified authorities (EMAS and ISO14000)
Each of which is described briefly below.
| Amount of waste in Sweden | |
| Sector | All economic sectors and households |
| Description | Final treatment of waste in Sweden excluding mining waste. Quantities are given in tonnes (rounded values) |
| Frequency | Bi-yearly |
| Status | In use |
| Data source | Swedish EPA: https://www.naturvardsverket.se/data-och-statistik/avfall/avfallsmangder/ |
| Amount of food waste in Sweden | |
| Sector | All food-related economic sectors and households |
| Description | Food waste quantities in Sweden distributed by stage in the food chain (tonnes). The food waste statistics for 2012 do not include food waste that is dumped via the sewage in households or food waste from primary production, i.e. agriculture and fishing. No update has been made on the quantities for primary production since 2014. Method change for the calculation of the amount of food waste from grocery stores was made in 2018. |
| Frequency | Bi-yearly |
| Status | In use |
| Data source | Swedish EPA: https://www.naturvardsverket.se/dokumentation/sidstruktur/startsida/statistik/matavfallsmangder-i-sverige/ |
| Consumption of plastic carrier bags | |
| Sector | Production-based/manufacturers and importers of plastic bags |
| Description | Number of reported plastic carrier bags per person and year. The data points for 2017 and 2018 are based on data from 12 large companies that together accounted for about 95 percent of all plastic bags on the Swedish market. Data for 2019-2020 are based on all reported companies. Data per person are calculated by population on the 31st December of each year. |
| Frequency | Yearly |
| Status | In use |
| Data source | Swedish EPA: https://www.naturvardsverket.se/data-och-statistik/plast/plastbarkassar/ |
| Consumption of textiles | |
| Sector | Private sector |
| Description | Net inflow (import minus export) of new textiles (kg) per person. The source of data on textiles is the foreign trade statistics by Statistics Sweden (SCB), where there is information on imports and exports of textiles. Data come from two sources: trade within the EU (intra-EU) and outside the EU (extra-EU). Data are reported by CN codes. The CN codes used in the indicator are: all CN codes in the category 61, all CN codes in the category 62, and all CN codes in the category 63 with the exception of 630510-630720 (sacks, tents, etc.) and 630900-631090 (used clothing and rags). |
| Frequency | Bi-yearly |
| Status | In use |
| Data source | Swedish EPA: https://www.naturvardsverket.se/data-och-statistik/textil/textil/ |
| Percentage of environmentally certified authorities | |
| Sector | Public sector |
| Description | The indicator is based on the authorities' reported data in accordance with Ordi-nance (2009:907) on environmental management in state authorities. According to the Ordinance, an authority whose activities have a significant environmental impact should register in accordance with EMAS or certify in accordance with the ISO 14001 standard. |
| Frequency | Yearly |
| Status | In use |
| Sources | Swedish EPA: https://www.naturvardsverket.se/Sa-mar-miljon/Statistik-A-O/Miljoledning-andel-certifierade-myndigheter/ |
Meeting EU requirements of monitoring reuse as described in Commission Implementing Decision (EU) 2021/19
Sweden expects to meet the EU’s requirement of monitoring reuse. The concrete methods have however not yet been chosen, nor is the data collection been initiated.
Annex 2 – National Factsheet – Denmark
National policy on waste prevention
In 2021, the Danish Environmental Ministry launched the Action Plan for Circular Economy[1]Danish Environmental Ministry (2021). Handlingsplan for cirkulær økonomi – national plan for forebyggelse og håndtering af affald 2020-2032, which contains both the national plan of waste prevention and waste treatment (2020–2032). The strategy is based upon the political agreement of a Climate Plan for a Green Waste Sector and a Circular Economy[2]The Danish Government (2020). Aftale mellem regeringen (Socialdemokratiet) og Venstre, Radikale Venstre, Socialistisk Folkeparti, Enhedslisten, Det Konservative Folkeparti, Liberal Alliance og Alternativet om ”Klimaplan for en grøn affaldssektor og cirkulær økonomi”: together with earlier initiatives including the strategy for circular economy (2018)[3]The Danish Government (2018). Strategi for cirkulær økonomi, and the implementation of waste framework directives (2018). The action plan is to support the Danish climate objective of reducing carbon emission with 70% in 2030 compared with 1990-levels.
The Danish Action Plan Circular Economy among others aims to reduce waste and increase reuse through setting reduction targets. Such waste prevention targets however await steps taken by the EU. The Action Plans points at product design as a key focus to ensure waste prevention. The Danish government will therefore work to strengthen the EU Eco-design Directive to include more products and provide minimum requirements of products by applying Product Environmental Footprints (PEF) and that these are developed into digital product passports that enable tracing materials and products.
Footnotes
- ^ Danish Environmental Ministry (2021). Handlingsplan for cirkulær økonomi – national plan for forebyggelse og håndtering af affald 2020-2032
- ^ The Danish Government (2020). Aftale mellem regeringen (Socialdemokratiet) og Venstre, Radikale Venstre, Socialistisk Folkeparti, Enhedslisten, Det Konservative Folkeparti, Liberal Alliance og Alternativet om ”Klimaplan for en grøn affaldssektor og cirkulær økonomi”:
- ^ The Danish Government (2018). Strategi for cirkulær økonomi
Indicators on waste prevention
The Action Plan includes indicators to monitor waste prevention (less waste and better use of resources), but these are not digitalised as such:
- Municipal waste/capita
- Resource productivity (GDP/RMC)
- Number and revenue from products and services certified with the Nordic Swan
- Amount of food waste (from all chains in the value chain, 1000 tons)
- Share of construction certified with the Swan, DGNB, LEED or BREEAM)
- Amount of plastic package put on market[1]Danish Environmental Ministry (2021). Handlingsplan for cirkulær økonomi – national plan for forebyggelse og håndtering af affald 2020-2032.
Each of which is described briefly below.
Footnotes
- ^ Danish Environmental Ministry (2021). Handlingsplan for cirkulær økonomi – national plan for forebyggelse og håndtering af affald 2020-2032
| Municipal waste/capita (kg) | |
| Sector | Household |
| Description | The amount of municipal waste/capita (kg) includes all waste from households, which ends up at recycling centres (except construction and demolition waste). It can in-clude some waste from companies. |
| Frequency | Yearly |
| Status | In use |
| Data source | Waste data system, Danish EPA: https://www2.mst.dk/Udgiv/publikationer/2020/12/978-87-7038-249-6.pdf |
| Resource productivity (RMC/GDP) | |
| Sector | Consumption-based/all sectors |
| Description | Resource productivity informs about how many resources (kg) are used to produce one unit of GDP (kr). Resources are measured as Raw Material Consumption (RMC) being the resource use from the final consumption, but is estimated through a range of assumptions about the resource use of specific production processes that makes the data a little uncertain. |
| Frequency | Yearly |
| Status | In use |
| Data source | Danish Statistics: https://www.statistikbanken.dk/10520 |
| Number of product and services certified with the Nordic eco-label | |
| Sector | Consumption-based/all sectors |
| Description | As the Nordic eco-label sets out requirements related to more sustainable and reduce use of resources and long lifetime, this can contribute to waste prevention |
| Frequency | Yearly |
| Status | In use |
| Data source | Eco-labelling Denmark: https://miljøtilstand.nu/temaer/produktion-forbrug-og-affald/forbrug-og-udbud-af-miljoemaerkede-produkter-og-services/ |
| Revenue from the Nordic eco-label | |
| Sector | Private sector |
| Description | As the Nordic eco-label sets out requirements related to more sustainable and re-duce use of resources and long lifetime, this can contribute to waste prevention |
| Frequency | Yearly |
| Status | In use |
| Data source | Eco-labelling Denmark: https://miljøtilstand.nu/temaer/produktion-forbrug-og-affald/forbrug-og-udbud-af-miljoemaerkede-produkter-og-services/ |
| Share of constructions certified with the Swan, DGNB, LEED or BREEAM) | |
| Sector | Private sector |
| Description | The indicator measures the share of construction that are certified with a sustainable label including the Swan, DGNB, LEED or BREEAM |
| Frequency | Yearly |
| Status | In use |
| Sources | Byggefakta: https://miljøtilstand.nu/temaer/produktion-forbrug-og-affald/forbrug-og-udbud-af-miljoemaerkede-produkter-og-services/ |
| Amount of food waste in the value chain (primary production; industry; retail; restaurant industry; households) | |
| Sector | Cross-sector |
| Description | Five indicators, data is limited |
| Frequency | Yearly |
| Status | Not continually measured, but will be due to EU requirements |
| Sources | Refer to report from 2017 |
Meeting EU requirements of monitoring reuse as described in Commission Implementing Decision (EU) 2021/19
Denmark expects to meet the EU’s requirement of monitoring reuse through a triangulation of several methods in line with those the EU has suggested. The concrete methods have however not yet been chosen, nor is the data collection been initiated.
Annex 3 – National Factsheet – Norway
National policy on waste prevention
Norway’s “National strategy for a green, circular economy”[1]Norwegian Government (2021). Nasjonal strategi for ein grøn, sirkulær økonomi was launched in 2021. This encompasses plans for waste prevention and reuse alongside broader issues of sustainable production and consumption, and policies for circular value creation, including specific reference to digitisation, although not specifically in the context of measuring waste prevention or reuse. In addition, Norway’s “Waste Plan 2020–2025”[2]Norwegian Environmental Agency (2020). Avfallsplan 2020-2025. was last updated at the end of 2019. These documents highlight several overarching policy goals and targets (50–55% reduction of 1990 climate emissions by 2030, and 90%+ by 2050; a halving in food waste by 2030; 65% of household waste prepared for reuse or recycled by 2030; 70% of all packaging recovered by 2030). The Waste Plan makes specific reference to preparation for reuse for textiles, EE products and wooden pallets / packaging.
Indicators for waste prevention and specifically reuse
Waste prevention in a broad and indirect sense is more readily captured by available statistics than is specific preparation for reuse. The latter is not routinely captured in official data. For example, the volume of textiles collected in Norway via established schemes (identified in the Waste Plan as a specific example of preparation for reuse) recently required a specific mapping exercise[1]NORSUS (2020). Kartlegging av brukte tekstiler og tekstilavfall i Norge. rather than being measured / captured routinely. (Preparation for) reuse is apparently accounted for in producer responsibility data for electronics, but it is doubtful these figures capture the totality of electronics reuse, particularly that which occurs upstream of the producer responsibility scheme. Data on preparation for reuse in other product areas appears sketchy at best.
Footnotes
- ^ NORSUS (2020). Kartlegging av brukte tekstiler og tekstilavfall i Norge.
Indicator(s) currently used for measuring waste prevention broadly:
| National waste accounts | |
| Sector | Varied (households, building and construction, manufacturing industries, service in-dustries) |
| Description | Varied data for waste generation, collection and treatment from different sources |
| Frequency | Yearly |
| Status | In use |
| Data source | Statistics Norway, https://www.ssb.no/en/natur-og-miljo/avfall |
| Food waste statistics | |
| Sector | Varied |
| Description | National statistics for food waste |
| Frequency | Yearly |
| Status | In use |
| Data source | Matvett (sector organisation for prevention / reduction of food waste) https://www.matvett.no/uploads/documents/OR.51.20-Matsvinn-i-Norge-2015-2019-translated.pdf |
Indicator(s) currently used for measuring reuse specifically:
| Electronic waste reuse | |
| Sector | E-waste arising both from households and from businesses |
| Description | The amount of e-waste collected by the producer responsibility schemes that is re-used. |
| Frequency | Yearly |
| Status | In use |
| Data source | Producer responsibility system, Norwegian Environment Agency: https://produsentansvar.miljodirektoratet.no/rapport-behandling-produktgruppe |
Methods that will be applied to comply with Commission Implementing Decision (EU) 2021/19
The Norwegian governmental note on EU 2021/19[1]Norwegian Government (2021). Metodologi og format for rapportering av ombruk reports that discussions are continuing between the Environment Agency, Statistics Norway and the government regarding the approach to data gathering and monitoring. No specific approaches have yet been outlined; the government notes that the minimum requirements for reuse reporting encompasses textiles, electrical and electronic products, furniture and building materials / products.
Footnotes
- ^ Norwegian Government (2021). Metodologi og format for rapportering av ombruk
Annex 4 – National Factsheet – Finland
Finland - National Factsheet on measuring waste prevention and reuse
National policy on waste prevention
Finland has prepared a strategic programme[1]Finnish Ministry of the Environment and Ministry of Employment and the Economy (2021). Government resolution on the strategic programme for circular economy. to promote circular economy. The aim is to transform the economy into one that is based on the principles of circular economy by 2035. The transition into a circular economy also helps achieve the Government's carbon neutrality target by 2035. The Finnish Government adopted the resolution on promoting a circular economy on 8 April 2021.
The strategic programme to promote circular economy defines objectives for the use of natural resources. It lists the objectives and indicators, specifies the measures to be taken and allocates the resources needed to promote circular economy and achieve a systemic change.
The vision of the Circular Economy Programme is “Finland in 2035: Our economic success is founded on a carbon-neutral circular economy society”:
- sustainable products and services are mainstream of the economy and the sharing economy is part of our everyday lives;
- our choices are future-proof and they strengthen our fair welfare society;
- more for less: the use of natural resources is sustainable and materials remain in circulation longer and more safely;
- the breakthrough of a circular economy has been achieved through innovations, digital solutions, smart regulation, and responsible investors, businesses and consumers;
Making this vision reality requires sustainable and efficient use of natural resources. This will be guided by the following steps and objectives:
- The consumption of non-renewable natural resources will decrease and the sustainable use of renewable natural resources may increase to the extent that the total consumption of primary raw materials in Finland in 2035 will not exceed what it was in 2015. Natural resources used to manufacture products for export are not covered by the objective*.
- The productivity of resources will double by 2035 from what it was in 2015.
- The circular material use rate (CMU, share of recycled material of all material use) will double by 2035.
*The objective takes into account Finland’s total consumption that includes the imported products needed to run our everyday lives and infrastructure and the consumption of domestic raw materials. Finland’s total consumption includes raw material consumption in countries where the products are manufactured minus the raw materials used to manufacture Finnish products for export. The total consumption is shown by the Raw Material Consumption (RMC) indicator calculated by using the ENVIMAT tool developed by the University of Oulu and Finnish Environment Institute.
The indicators require further development. At this stage, the following indicators are selected to support the monitoring of the Programme:
- Domestic material consumption DMC (Eurostat)
- Material input required for domestic end-use material-specifically RMC (Statistics Finland and Finnish Environment Institute)
- Resource profitability (GDP/RMC)
- Circular material use rate CMU (Statistics Finland)
- Turnover of circular economy sectors and number of enterprises (Statistics Finland)
- Eco-innovations (Eurostat)
- Innovative public procurements (Eurostat)
- Municipal, packaging and construction waste and recycling rate
- Circular Economy Barometer: A survey and interview-based study for companies and consumers on attitudes and operating models that support the circular economy (commissioned survey for example, every four years)
Finland also has a National Waste Plan[2]Finnish Ministry of the Environment (2018). From Recycling to a Circular Economy – National Waste Plan to 2023., which was last updated in 2018.
The waste plan defines a comprehensive list of indicators (see below) to monitor the development of waste generation and waste management, but most of the indicators describe waste amounts and treatment of waste – not directly the actions taken to achieve lower amounts of waste (e.g. types of economic activity, efficiency of raw material usage etc). None of the indicators utilizes digitalization as such.
The indicators currently in use include:
| Indicator | Unit | Data source |
| Overall development in waste management | ||
| Total waste volume by sector | tonnes / year | Statistics Finland: Waste statistics |
| Waste treatment volumes | tonnes / year | Statistics Finland: Waste statistics |
| Volume of hazardous waste by sector | tonnes / year | Statistics Finland: Waste statistics |
| Hazardous waste treatment volumes | tonnes / year | Statistics Finland: Waste statistics |
| Packaging waste recycling rates by fraction (glass, plastics, paper/cardboard/board, metal, wood) | % / year | Producer responsibility authority (Pirkanmaa ELY centre): Packaging waste statistics |
| Waste volumes permitted, exported and imported in accordance with the Waste Shipments Regulation by type of waste | tonnes / year | Finnish Environment Institute SYKE |
| Prices of waste collection from small properties | year 2015 index=100 | Statistics Finland: Consumer price index |
| Environmental goods and services added value in the waste management and recycling sector | euro / year | Statistics Finland: Environmental goods and services sector statistics |
| Environmental goods and services employment in the waste management and recycling sector | person-years | Statistics Finland: Environmental goods and services sector statistics |
| Monitoring and indicators for targets in the key areas – Municipal waste | ||
| Volume of municipal waste generated | tonnes / year | Statistics Finland: Waste statistics |
| Volume of municipal waste/resident | kg / year | Statistics Finland: Waste statistics and population statistics |
| Municipal waste volume development relative to GDP development | Statistics Finland: Waste statistics and Annual national accounts | |
| Shares of municipal waste treatment | % | Statistics Finland: Waste statistics |
| Monitoring and indicators for targets in the key areas – Construction and demolition waste | ||
| Total volume of construction and demolition waste generated | tonnes / year | Statistics Finland: Waste statistics |
| Number of notifications under the Decree on the recov-ery of certain waste in earth construction and the vol-ume of waste recovered accordingly | number / year tonnes / year | MATTI soil condition information system, YLVA environmental permit and control data system |
| Monitoring and indicators for targets in the key areas – WEEE | ||
| EEE re-use volume | tonnes / year | Producer responsibility authority (Pirkanmaa ELY Centre): WEEE producer responsibility statistics |
| Volume of recovered WEEE | tonnes / year | Producer responsibility authority (Pirkanmaa ELY Centre): WEEE producer responsibility statistics |
| Monitoring and indicators for targets in the key areas – Biodegradable waste | ||
| Volume of biodegradable municipal waste | tonnes / year | Statistics Finland: Waste statistics, calcula-tion Finnish Environment Institute SYKE |
| Volume of composted biodegradable waste | tonnes / year | YLVA environmental permit and control data system |
| Volume of decomposed biodegradable waste | tonnes / year | YLVA environmental permit and control data system |
| Number of biogas facilities | number | University of Eastern Finland: Biogas facility register, and YLVA environmental permit and control data system |
For municipal solid waste, the only indicator somewhat monitoring the reuse and waste prevention is “Municipal waste volume development relative to GDP development”. This indicator monitors decoupling which is affected by actions of reuse and waste prevention but also other issues affect this indicator. Lately this index has been increasing, i.e. no decoupling has been achieved. For reuse, the only direct indicator is the amount (tonnes/year) of EEE devices reused.
The National Waste Plan will be updated during 2021. The new plan will be valid until year 2027. The indicators will be updated but no major indicator changes are being planned. The same indicators described above (decoupling and preparing EEE for reuse) are planned to be used for now to monitor reuse and waste prevention. The amounts of hazardous waste indirectly describe waste prevention from a waste harmfulness perspective.
The waste plan will be reviewed after three years of implementation and the indicators are reviewed and updated then if necessary.
Waste Act
The New Waste Act[1]Finnish Waste Act 646/20211. https://www.finlex.fi/fi/laki/ajantasa/2011/20110646 (renewed in July 2021) states that the purpose of the act is to promote circular economy and the sustainability of the use of natural resources, to reduce the amount and harmfulness of waste, to prevent danger and harm to health and the environment from waste and waste management, to ensure efficient waste management and to prevent littering.
Producers (in the EPR system) are obligated to provide information and advice on measures to reduce the amount and harmfulness of waste and on the actions of reuse and preparing for re-use, as well as on the prevention of littering.
Regarding municipal solid waste management fees, the act states that waste fees must correspond to the level of service provided by the municipality and, as far as possible, encourage the reduction of the amount and harmfulness of waste and priority waste management.
The municipality shall organize counselling, information and education in order to reduce the amount and harmfulness of waste generated, to increase sorting efficiency, to increase separate collection and to carry out waste management properly and to prevent littering from such activities. The advice must pay particular attention to reducing food waste.
The requirements are described in more detail in the National Waste Plan.
Footnotes
- ^ Finnish Waste Act 646/20211. https://www.finlex.fi/fi/laki/ajantasa/2011/20110646
Indicator(s) currently used for measuring waste prevention broadly:
| Municipal waste volume development relative to GDP development | |
| Sector | Household |
| Description | Development of the amount of municipal waste relative to GDP development (as an index, year 2010 = 100) |
| Frequency | Yearly |
| Status | In use |
| Data source | Monitoring of National Waste Plan: https://www.ymparisto.fi/fi-FI/Kulutus_ja_tuotanto/Jatteet_ja_jatehuolto/Jatesuunnittelu/Valtakunnallisen_jatesuunnitelman_seuranta |
| Resource productivity (GDP/RMC) | |
| Sector | All sectors |
| Description | Resource productivity describes the amount of resources (kg) are used to produce one unit of GDP (€). Resources are measured as Raw Material Consumption (RMC). |
| Frequency | Yearly (since 2021) |
| Status | In use |
| Data source | Strategic Programme for Circular Economy: https://ym.fi/documents/1410903/42733297/Government+resolution+on+the+Strategic+Programme+for+Circular+Economy+8.4.2021.pdf/309aa929-a36f-d565-99f8-fa565050e22e/Government+resolution+on+the+Strategic+Programme+for+Circular+Economy+8.4.2021.pdf?t=1619432219261 |
Indicator(s) currently used for measuring reuse specifically:
| Preparing of EEE for reuse | |
| Sector | E-waste arising both from households and from businesses |
| Description | The amount of e-waste prepared for reuse by the producer responsibility organisa-tions. |
| Frequency | Yearly |
| Status | In use |
| Data source | Monitoring of National Waste Plan: https://www.ymparisto.fi/fi-FI/Kulutus_ja_tuotanto/Jatteet_ja_jatehuolto/Jatesuunnittelu/Valtakunnallisen_jatesuunnitelman_seuranta |
Methods that will be applied to comply with Commission Implementing Decision (EU) 2021/19 (common methodology for the measurement of reuse):
There is a development project[1]Finnish Ministry of the Environment (2020). Jäte- ja tuotetietojärjestelmä -hanke. ongoing to develop waste and product data management systems. The project was initiated in spring 2021 and will be finished by the end of 2022. The project will develop national information systems for waste and product data collection and add new components to the existing systems. The aim is a unified waste and product information system with reliable and comprehensive information. The project responds to changes in EU and Finnish waste legislation and development needs identified by the users of the data management systems.
As requested by the Ministry of Environment, Finnish Environment institute has prepared a process of gathering reuse data from second hand shops, recycling centres and similar companies selling used items. The data will be collected through an electronic questionnaire sheet that will sent every three years. The questionnaire has been developed in cooperation with the actors answering the survey. The questionnaire will be sent for the first time in December 2021.
The aim is to gather data on the weight of items sold, although the number of items can also be used to estimate the weight based on average factors. Large actors (with also the largest sold volumes), like the recycling centres in metropolitan areas, already collect very detailed data and are like to be able to provide this (e.g. both kg and pieces of item types sold). Understandably, smaller actors do not have the resources or suitable data collection systems to collect such data. The detailed data from larger actors (e.g. average weight of items in certain category) can help in estimating the total amounts based on the more general level data provided by smaller actors.
There are initial ideas also about consumer surveys. It is possible that, in addition to the above described questionnaires for second hand shops, questions concerning reuse and waste prevention will be added to the consumer survey already in place (performed every 5 years). These questions could be used to estimate the amount of reuse through social media and similar consumer to consumer channels. Attitudes towards waste prevention and reuse could also be surveyed.
There are also plans to gather data on the reuse of packaging as part data collected from the producers of packaging (in the EPR system).
Footnotes
- ^ Finnish Ministry of the Environment (2020). Jäte- ja tuotetietojärjestelmä -hanke.
Annex 5 – informant organisations
Informant organisation:
- Aalborg University
- Ghent university
- Leuven
- State of Green
- Kathart
- Miljøstyrelsen (Danish EPA)
- Euromonitor
- RREUSE
- Ifixit
- Lahti Municipality
- Finnish Ministry of Environment
- Finnish Environment Institute
- French Ministry of Environment
- Fraunhofer Institute
- Department of Environment and Spatial Planning, Iceland.
- Norwegian Environment Agency
- Avfald Sverige
- BIM alliance
- Swedish Nature Protection Agency
- Schibsted
- RISE
- Chalmers Institute
- PBL
- The Repair Alliance
- Marketscape
- GS1
- VITO
- Wuppertal Institute
- Blue City
- SITRA
- Faroe Islands Ministry of Environment
- Statistics Finland
Annex 6 – Case studies
Case 1: Accessibility of reusable textile and WEEE bring banks
| Indicator | Accessibility (distance or time) of bring sites for reusable textiles and WEEE, travelling with car (time) or walking/cycling distance (km) |
| Case | Accessibility of reuse ‘bring sites’ |
| Owner | Finnish Environment Institute (SYKE) |
| Current coverage | FI |
| ToC | Output |
CIRCWASTE is a seven-year (2016–2023) LIFE IP project that promotes efficient use of material flows, waste prevention and new waste and resource management concepts. All actions contribute to implementing the national waste management plan and directing Finland towards a circular economy. CIRCWASTE is a creation of 20 partners and 10 funding organisations. The project is coordinated by the Finnish Environment Institute. CIRCWASTE is funded in large part by the EU LIFE programme.
One of the most important factors influencing households’ reuse behaviour is the availability and accessibility of reuse services: how far away from home the nearest bring sites are and how conveniently the bring sites are located. This indicator uses the average distance from homes to the nearest bring-site to measure the accessibility of reuse sites. The indicator has been developed in the CIRCWASTE project.
Relevance
Social elements play a vital role in the transition to a circular economy. Citizens take part in the circular economy as consumers and users of goods and services and the participation of citizens is required to promote and support sustainable circular production and consumption practices. When a person must decide what to do with goods that they no longer want or need, it is critical that the most circular option is easy and convenient.
Households play a key role in reducing waste generation. One of the most important factors influencing households’ reuse behaviour is the availability and accessibility of reuse services: how far away from home the nearest bring sites are and how conveniently the bring banks are located in terms of people’s everyday mobility practices. The accessibility of waste bring banks is especially important in counties like Finland, a geographically large country with one of the lowest population densities in Europe. In sparsely populated areas the accessibility of bring sites can become a critical factor for people’s behaviour around recycling and donating for reuse.
Method of calculation
The indicator monitors the accessibility of bring sites for two different reusable waste fractions, reusable textiles and WEEE. The accessibility is estimated as the residents’ average distance to the nearest bring site via roads and walkways within a given geographic area. The estimation illustrates how easy and time-consuming source separation is and whether the bring site can be accessed by foot or bike or if a car needed to transport the items.
Data sets used
The residents’ distance to the nearest bring bank via roads and walkways is calculated based on the Digiroad road network dataset[1]Finnish Transport Infrastructure Agency 2020, https://vayla.fi/en/transport-network/data/digiroad/data. The indicator uses the kierratys.info service[2]Suomen kiertovoima ry KIVO 2020, https://www.kierratys.info/, maintained by the Finnish Solid Waste Association, as its main data source. In addition to this, for textiles the data used on reusable textile collection points is maintained by three organisations: UFF[3]UFF 2020, https://uff.fi/kerayspisteet/, Fida[4]Fida 2020, https://www.fida.fi/lahjoita-tavaraa/vaatekerayslaatikot/ and the Finnish Red Cross (SPR)[5]SPR 2020, https://kontti.punainenristi.fi/tavaratalot. For WEEE, retail, electronics and home appliances stores that take back discarded electrical appliances were included (data purchased from the AC Nielsen retail register and the Statistics Finland business register).
Footnotes
- ^ Finnish Transport Infrastructure Agency 2020, https://vayla.fi/en/transport-network/data/digiroad/data
- ^ Suomen kiertovoima ry KIVO 2020, https://www.kierratys.info/
- ^ UFF 2020, https://uff.fi/kerayspisteet/
- ^ Fida 2020, https://www.fida.fi/lahjoita-tavaraa/vaatekerayslaatikot/
- ^ SPR 2020, https://kontti.punainenristi.fi/tavaratalot
Implementing for the Nordic countries
The conceptual backbone of the indicator is valid and can be implemented in all Nordic countries and is especially relevant in sparsely populated countries and regions, where accessibility can become a highly critical factor determining people’s reuse behaviour. The indicator was calculated as a one-time exercise as part of research project CIRCWASTE in Finland, but it is likely that the data is available for the calculations to be updated as needed. The availability of similar data for other Nordic counties should be assessed further, but is likely to be available. This case further demonstrates how various data sources can be integrated to give valuable information about waste prevention.
References
Executing circular economy strategies in practice in Finland - Results and experiences from the Circwaste project. Reports of the Finnish Environment Institute 19/2021. https://helda.helsinki.fi/handle/10138/329090
Accessibility of bring sites for plastic packaging waste, reusable textiles and waste electrical and electronic equipment (WEEE). https://www.materiaalitkiertoon.fi/en-US/Monitoring/Accessibility_of_bring_sites
Case 2: Availability of municipal sharing services
| Indicator | Spaces and products available for lease/borrowing in municipalities |
| Case | Availability of municipal sharing services |
| Owner | Finnish Environment Institute (SYKE) |
| Current coverage | FI |
| ToC | Input |
This indicator describes the availability of public shared resources. The term public shared resources are
used to mean different types of public facilities and goods that can be used by citizens for free or for a small fee. The facilities are typically spaces designed to perform one, but that stand empty for shorter on longer periods of time.
This indicator monitors the use of public school facilities, bike-sharing and library items excluding books and similar traditional library items. These cover different types of shared resources that can be available in municipalities of different sizes and with different needs. The indicators have been developed in the CIRCWASTE project.
Relevance
The availability of shared resources is relevant for circular economy as sharing facilities and items minimises purchases of new items and uses existing resources more efficiently. Shared public spaces and facilities can be used to save significant amounts of resources, such as energy and materials, as well as ensuring existing idle public spaces are used more efficiently.
Bicycle-sharing enables citizens and tourists to rent a bicycle for a small fee. Bicycle sharing helps decrease demand for new bicycles. In addition to this, sharing encourages citizens to avoid using other, more resource intensive modes of transport, such as private cars or even public transport.
Traditionally libraries have loaned out books, magazines, CDs and DVDs. Today they often also loan out other types of items, such tools, equipment for hobbies or musical instruments. The sharing of such items can help to reduce consumption and give people access to resources that they could not otherwise afford to purchase.
Availability of public shared resources is an indicator of the municipally-led practices promoting sharing economy and thus contributing to more efficient use of resources and waste prevention.
Method of calculation
In Finland there is no national data available on public shared resources, so the data was collected individually from the different municipalities. In the CIRCWASTE project, the availability of shared resources was investigated in the capitals of the five project key regions and in one smaller municipality in each of the regions as it would not have been possible to collect data from the whole country comprehensively. To make the number of shared resources comparable between different sized municipalities, the indicator results are presented as values per 1,000 or 10,000 citizens.
Data sets used
Data sets used includes both digital and non-digital sources.
For the public school facilities, the data used in the calculation was collected primarily from the municipalities’ websites and online booking systems. Especially in the larger municipalities, there typically is no centralised information available on all the public facilities in joint use. Although most municipalities have some type of a public facility booking system, all the available school spaces are not listed in the booking system. Apart from sports halls, there was usually no information available online on the school spaces available for the use of citizens. The schools themselves were usually responsible for letting out their spaces. In many municipalities the only way to book a school facility was to contact the school principal or secretary directly.
Data on the number of city bicycles was collected from the municipalities or from the operator managing the bicycle sharing scheme.
The availability of shared non-traditional library items was calculated based on the data from the online systems used in all the public libraries investigated in the CIRCWASTE project. All the case libraries used a similar online management system that allowed users to search for all books and also other items stored in the libraries.
Implementing for the Nordic countries
The values of the indicator were calculated as a one-time exercise as part of research project CIRCWASTE in Finland but it is likely that the data is available for the calculations to be updated as needed. The availability of similar type of information for other Nordic counties should be assessed further. It is anticipated that similar data exists in the Nordic countries that also have similar systems for utilising items/space, but whether these data are available from a single source or would need to be collected individually and collated should be further investigated.
Regarding all the three indicators measuring sharing economy, it should be noted that specific indicators developed in the CIRCWASTE project measure the number of spaces/items on offer, but they do not describe the popularity of the use of the shared spaces/items. The possibilities to develop the indicators further to include data on the utilization rate of the spaces/items should be studied further.
References
Executing circular economy strategies in practice in Finland - Results and experiences from the Circwaste project. Reports of the Finnish Environment Institute 19/2021. https://helda.helsinki.fi/handle/10138/329090
Public shared resources. https://www.materiaalitkiertoon.fi/en-US/Monitoring/Sharing_economy
Case 3: Repair activity
| Indicator | The number/value of repairs by product group |
| Case | Repair activity |
| Owner | Swedish Tax Agency |
| Current coverage | SE |
| ToC | Activity; Outcome |
In 2017 Sweden introduced a tax-break for repair of consumer goods. The reporting of this activity to the tax authorities and Sweden’s open tax records mean that repair activities can be monitored both in terms of the number of repairs divided to product groups, the money spend on repair and the public expenses financing the tax break.
Relevance
Repair contributes to prolonging the lifetime of products, a core component and one of the inner circles of the circular economy. The introduction of a repair tax deduction in Sweden creates an economic incentive for citizens to get broken products repaired rather than disposing them or buying a new product. Only professional repair services qualify for the tax break; repairs undertaken by households themselves are not covered. The repair tax break thus only enables a monitoring of professional repair services in Sweden.
Data sets used
Two types of tax deduction on repair and maintenance services are in place in Sweden placed on the labour costs; ROT and RUT. RUT covers maintenance and cleaning, and ROT covers repair, conversion, and extension.
To get the tax deduction, Swedish companies providing the repair service are to report the following information to the Swedish tax agency; the service provides, working hours, cost of material, other costs, and buyer information. Together that forms a data set of 1) The number of professional repairs divided into specific product groups; 2) The citizens spending of professional repair and 3) the Swedish governments spending on repair deductions.
Method of calculation
Data is automatically collected every evening and available the next data. As contractors are to report themselves, some mistakes in reporting take place. The Swedish Tax Agency follow up on any abnormal data.
Implementing for the Nordic countries
Sweden can use the repair data to monitor the repairs taken place in society. For the other Nordic countries to do so will require an introduction of a similar repair tax break, and a similarly open tax system. The data on professional repair can be compared with statistical data on the size of the repair sector in terms of employment and revenue. Likewise, the data can be combined with data streams informal repair in/by households, product design for repairability, users at repair cafes, the number of repair cafes etc (see cases XX & YY). The Open Repair Alliance, for example, provides a method to measure repair, and applies this method electrical and electronic products taken place at their repair cafes. This data is provided as open source.
References
Skatteverket (2017). ROT and RUT work: https://www.skatteverket.se/servicelankar/otherlanguages/inenglish/businessesandemployers/startingandrunningaswedishbusiness/declaringtaxesbusinesses/rotandrutwork.4.8dcbbe4142d38302d793f.html
Case 4: Materiaalitori
| Indicator | Quantity of waste materials avoided (tonnes) by sectors and material type. |
| Case | ‘Materiaalitori’ |
| Owner | The Ministry of Environment (while the state-owned Motiva is the administrator) |
| Current coverage | FI |
| ToC | Outcome |
Materiaalitori translates to material market.
While you can use the platform as a market to trade materials, it also provides a space to establish more permanent links between companies, where continuous side streams can be cascaded from one company’s production into another company’s production. Materiaalitori is a governmental initiative put in place in 2019 to promote industrial symbioses and the transition towards a circular economy. There is a supply and demand for a wide range of materials, including construction and demolition wastes, metals, textiles, wood wastes and plastics.
Materiaalitori is a web-based transaction platform for the exchange, sale and purchase of waste and by-products. Here, businesses and public organisations can announce both secondary raw materials, continuous side streams, and services connected to waste management and recovery. Materiaalitori differentiates itself from other transaction platforms by being a public service provided by the Ministry of the Environment in Finland and maintained by the state-owned company Motiva Ltd.
As a public service, it is free to use. Additionally, according to the Waste Act[1]https://www.finlex.fi/sv/laki/ajantasa/2011/20110646#L5P33, public waste holders and contracting entities are required to use the platform if they are in need of statutory municipal waste management services exceeding the cost of 2000 EUR per year[2]https://www.motiva.fi/en/solutions/material_efficiency/materiaalitori. Waste holders must first try to find a market-based waste management service through Materiaalitori before it is possible to request waste management by the municipality's waste facilities.
Footnotes
Relevance
Materiaalitori is a public market intervention that in specific cases (when the ‘secondary municipal service’ is needed for more than worth of 2000 euros in a year and when the company or organisation does not already get their services from private waste operators) legally requires companies to make use the service when it comes to finding waste management services. However, this doesn’t mean that companies are required to use the service as a marketplace nor that the service has monopoly on facilitating the sale of secondary raw materials. Therefore, it cannot be assumed that transactions made through the platform would, if they were monitored, represent all transaction of secondary raw materials. At the time of writing, Materiaalitori only has around 1380 registered users from 1100 organisations. However, as a national platform with a legally established foundation of users, the platform has the potential to capture a major market share of transactions related to reuse of materials. Monitoring these transactions would help the national administration to meet EU’s requirement of monitoring reuse. Another advantage of having the service provided by a public entity is that this may enable companies to trust that their data is not misused or collected for financial purposes.
Method of calculation
On Materiaalitori, waste holders can report their location and side streams/by-products, while waste management companies can announce management services. The side streams/by-products are categorised within the national waste statistical categories, while there is room for the inclusion of additional information about the materials. The user can also add attachments such as pictures and is prompted to note whether the biproduct is legally classified as waste. The platform encourages the inclusion of as much information as possible, and in theory all this information can be monitored. The service utilises modern secure cloud technologies (Microsoft Azure) and national services, such as suomi.fi login and map data.
Data sets used
Currently, Motiva cannot monitor if a transaction has happened or not via the platform, and therefore the platform does not monitor the final destination for the materials nor how the quantity of material exchanged: While users can make and accept offers, the actual deals are made outside the platform. The only data collected through the platform is the number and location of registered organisations and the quantities of materials uploaded to the platform categorised by sector. Motiva has stated that next year they will be looking into the possibilities of monitoring the use of the platform. In theory it is possible to monitor how much and what kind of products have been exchanged through the platform, for instance through an inquiry for the users to tell if they actually found a recovery operator for their materials.
Implementing for the Nordic countries
While the success of the platform is to some degree dependent on the Waste act, Motiva argues that the model can be replicated in other member states without such legislation in place. The waste act is based on the European Waste Framework Directive. However, even Materiaalitori still needs to expand the platform much further to get a more comprehensive picture of reuse and recovery within Finland, and thus data from this or similar platforms must reflect their marked share or be aggregated with other datasets.
References
Solita, 2021. Materiaalitori-palvelu vauhdittaa kiertotaloutta: https://www.solita.fi/asiakkaat/materiaalitori-palvelu-vauhdittaa-kiertotaloutta/
Motiva, 2021. Information om tjänsten: https://www.materiaalitori.fi/
Motiva, 2021. Materiaalitori: https://www.motiva.fi/en/solutions/material_efficiency/materiaalitori
FINLEX, 2011. 17.6.2011/646, Avfallslag: https://www.finlex.fi/sv/laki/ajantasa/2011/20110646#L5P33
Case 5: Substances of Very High Concern (SVHCs)
| Indicator | Number of products on the Nordic market containing SVHCs |
| Case | Substances of Very High Concern (SVHCs) |
| Owner | ECHA, other governmental bodies / NGOs |
| Current coverage | EU, DK, SE |
| ToC | Output |
The European Chemicals Agency (ECHA) administers the implementation of the REACH regulation for the registration and control of chemical substances with potentially adverse health or environmental effects.
AskREACH is a European consortium of governmental agencies, NGOs and research organisations focused on implementing the principle of consumers’ “right-to-know” about SVHCs. Both bodies have developed digital entities which support the monitoring and prevention of wastes
SCIP (ECHA) is the database for information on Substances of Concern In articles as such or in complex objects (Products) established under the Waste Framework Directive (WFD).
Scan4Chem (AskREACH) is perhaps the most prominent and enduring of a number of digital applications developed to facilitate consumer requests for information about SVHCs to manufacturers.
Based on the information provided to the SCIP by product manufacturers and importers this indicator informs on the number and type of products containing Substances of Very High Concern (SVHC). Reducing the number of products containing SVHC would be a positive development in waste prevention.
Relevance
The underlying intention is in the “refuse” waste prevention category - the effective elimination of substances of concern, leading to cleaner products which have reduced environmental footprints and much increased scope for recycling and reuse. There are two main mechanisms for this. The first is the substitution of such substances with safer alternatives in the initial manufacture of articles and products. The second is more directly related to the waste handling step - the elimination of such substances from recycled or reused materials. Direct restriction or outright banning is not the first step in the regulatory chain for substances of concern. Instead, both of the strategies depend on (digitally driven) access to and exploitation of relevant data and information.
Data sets used
Consumer-focused digital applications such as Scan4Chem are focused on implementing consumers’ “right to know” about SVHCs, which is embedded in the relevant regulations. Users scan a barcode for a product of interest – any previously gathered SVHC information is displayed and if it is not available, an automated request can be sent to the manufacturer, to which they have a mandatory requirement to respond, albeit not immediately. As such requests are made and fulfilled, the underlying database of SVHC information is developed. The SCIP database is developed from submissions by suppliers of articles which have been mandatory since early 2021. A public search interface is available (https://echa.europa.eu/scip-database) but examples of practical use of SCIP to date appear to focus on professional waste operators (see below).
Method of calculation
Research publications[1]Klaschka, U. (2017). Where are the SVHCs?. Environmental Sciences Europe, 29(1), 1–14., [2]Schenten, J., Brenig, M., Führ, M., & Bizer, K. (2020). Breathing life into consumer rights: smartphone tools facilitating the “right to know” on substances of very high concern in REACH articles. Environmental Sciences Europe, 32(1), 1–14.outline approaches that can be used to interrogate databases of consumer requests from Scan4Chem or similar applications. Different stages of the analysis include classifying consumer requests by the type of article, classifying the responses, identifying particular SVHCs that are identified and classifying where these are likely to be found. Several use case examples[3]Use Case Study - Waste sorting: Identification of articles potentially containing SVHCs in mixed plastic recyclate, https://echa.europa.eu/documents/10162/6205986/use_case_waste_sorting_wood_en.pdf/5c48d48b-f6cb-f4c7-ecd4-b87b95ad1057, [4]Use Case Study – Recyclers: Improved identification of SVHC through the (recycled) plastics value chain https://echa.europa.eu/documents/10162/6205986/use_case_recyclers_wood_en.pdf/9c97a0e3-7cd3-8795-6730-7223e1ee1d9b ,[5]Use Case Study - EEE recyclers: Improved granularity/dismantling in consumer electronics recycling https://echa.europa.eu/documents/10162/6205986/use_case_eee_recyclers_wood_en.pdf/5189b418-70d3-6bfc-14d5-77cec84427ec outline the approaches that waste operators can use to gain useful information.
Footnotes
- ^ Klaschka, U. (2017). Where are the SVHCs?. Environmental Sciences Europe, 29(1), 1–14.
- ^ Schenten, J., Brenig, M., Führ, M., & Bizer, K. (2020). Breathing life into consumer rights: smartphone tools facilitating the “right to know” on substances of very high concern in REACH articles. Environmental Sciences Europe, 32(1), 1–14.
- ^ Use Case Study - Waste sorting: Identification of articles potentially containing SVHCs in mixed plastic recyclate, https://echa.europa.eu/documents/10162/6205986/use_case_waste_sorting_wood_en.pdf/5c48d48b-f6cb-f4c7-ecd4-b87b95ad1057
- ^ Use Case Study – Recyclers: Improved identification of SVHC through the (recycled) plastics value chain https://echa.europa.eu/documents/10162/6205986/use_case_recyclers_wood_en.pdf/9c97a0e3-7cd3-8795-6730-7223e1ee1d9b
- ^ Use Case Study - EEE recyclers: Improved granularity/dismantling in consumer electronics recycling https://echa.europa.eu/documents/10162/6205986/use_case_eee_recyclers_wood_en.pdf/5189b418-70d3-6bfc-14d5-77cec84427ec
Implementing for the Nordic countries
The usefulness of the indicator relies heavily on the comprehensiveness of the underlying dataset. Scan4Chem is currently only available in Sweden, although wider roll-out across the whole region and Europe more generally is anticipated. The usefulness of the application depends on ongoing user engagement through the sending and fulfilment of requests, which in turn helps develop the underlying databases. The SCIP database is more widely available (geographically) but access is currently restricted to waste operators. Scan4Chem and similar applications will remain useful to individuals but of limited scope in deducing any more general information across countries or the region. The SCIP database should, in principle, readily allow broader measurements of the indicator. It will however take time for the sum of producer submissions to constitute a complete picture of SVHCs across the region.
Case 6: Development of car sharing
| Indicator | Number of sharing providers, memberships, vehicles, locations |
| Case | ‘the sharing economy’ |
| Owner | Bundesverband CarSharing e.V. (BCS) |
| Current coverage | DE |
| ToC | Output |
The German branch association of car sharing organisations - Bundesverband CarSharing e.V. (BCS) – ha been monitoring a number of aspects related to car sharing over the years. It provides charts and tabular data on its website[1]https://carsharing.de/presse/fotos/zahlen-daten/carsharing-deutschland-staedte-gemeinden-carsharing-angebot. The data can be downloaded from the BCS website as tables in pdf format and graphs in jpeg format. The statistics offered, show among others:
- Number of subscriptions of car sharing companies
- Number of cities where car sharing platforms are operating
- Number of car sharing vehicles available
Where relevant a distinction between station-based and station independent types is shown.
Footnotes
Relevance
In a circular economy, products are used more intensively. That is why product-service systems are promoted, and shared use can be a part of this vision. Unarguably, the sharing economy can fundamentally reduce the amount of consumer goods in circulation. However, we cannot say that a circular economy is solely aiming for an increase in the use of sharing schemes. Sharing services also cause (greenhouse gas and other) emissions, and more importantly, rebound effects might appear. Car sharing might replace public transportation, for example, or in other ways increase the number of car passenger kilometres.
To properly measure how sharing systems contribute to the goals of the circular economy, one would measure how many private cars have been replaced by a subscription of a car sharing company. In reality, researchers rely on a set of proxies. For example, the increase in memberships of a car-sharing company can indicate that the demand for sharing systems has increased. However, these proxies come with uncertainties. The increase in membership could also be influenced by population growth, for example.
This means that the BCS statistics and similar data, where available, are a useful and reliable source of information for the monitoring of cities with carsharing, user numbers and vehicle fleets. However, caution is advised when it comes to interpreting the data, as could be shown for the case of user numbers.
Method of calculation
While BCS represents 185 out of 228 (=81%) car sharing providers in Germany[1]https://carsharing.de/verband/wir-ueber-uns/mitglieder, the data is not limited to those. The BCS is linked to the Association of German Transport Companies (VDV), the German Transport Club (VCD) and the Federal Association of Fleet Management through mutual membership. Via those networks, data is requested from all providers throughout Germany.
Data sets used
Data downloaded from the Bundesverband CarSharing e.V. (BCS) website and digitised semi-automatically. Further data preparation includes merging and (manual) conversion to CSV files.
Implementing for the Nordic countries
Extending the branch association to all Nordic countries, or to start one in each country of the region.
The association should be collect data from there members and make it freely available online, as BCS does.
Case 6 ANNEX
Overview of the various data offered by the branch association
- Data on the market development of carsharing in Germany from 1999 to 2021 is given as time series plots in jpeg format, see Figure 1. The numbers of registered users and vehicles are given separately for station-based and station-independent carsharing and in total on a yearly base.
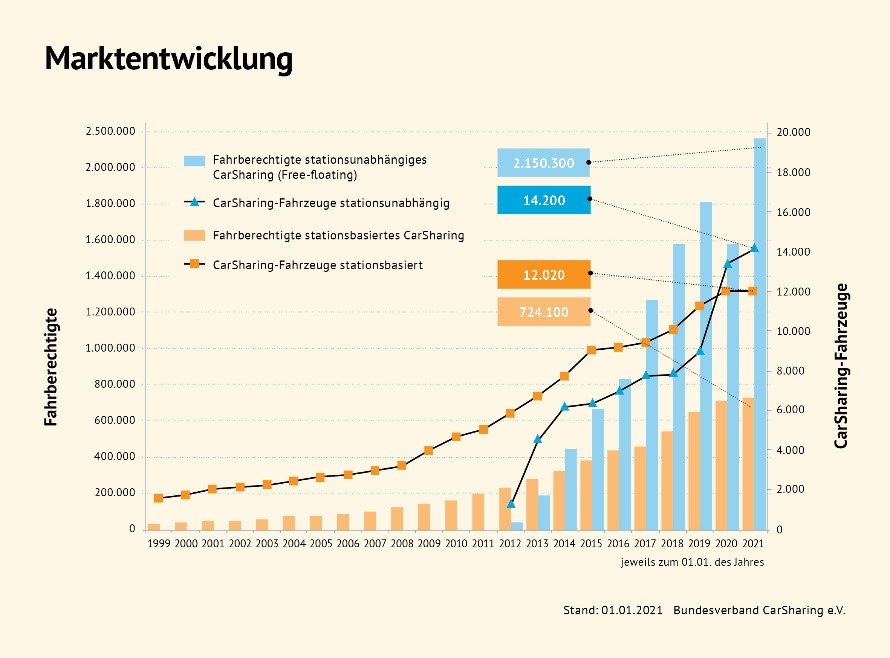
Figure 1. Market development for station-based (orange) and station independent (blue) car sharing in Germany. Registered users (bars, left axis) and vehicles (lines, right axis).
Source: BCS
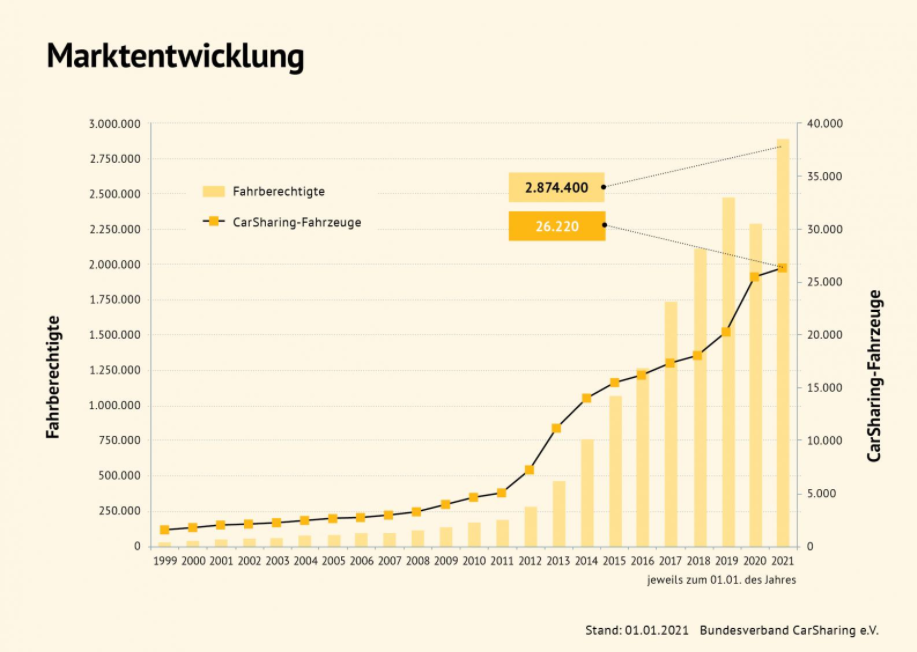
Figure 2. Market development for car sharing (both, station-based and station-independent) in Germany. Registered users (bars, left axis) and vehicles (line, right axis).
Source: BCS
- City rankings are given from 2013 to 2019 bi-annually for cities with 50,000 inhabitants or more (2013: cities with 200,000 inhabitants or more). The ranking is based on the number of car sharing vehicles per 1,000 inhabitants. Also, the absolute number of car sharing vehicles is given per city. Like the market data, the city rankings are given separately for station-based and station-independent car sharing and in total. The data is provided in a tabular format as separate PDF files for each year. See Figure 2 as an example for 2019.
| Ranking of stationsbased offers | Ranking of independent station offers | Ranking of all offers | |||||||||||
| City | CarSharing-vehicles | CarSharing vehicles per 1.000 citizens | City | CarSharing-vehicles | CarSharing vehicles per 1.000 citizens | City | CarSharing-vehicles | CarSharing vehicles per 1.000 citizens | |||||
| 1 | Karlsruhe | 927 | 2,96 | 1 | München | 2400 | 1,63 | 1 | Karlsruhe | 1012 | 3,23 | ||
| 2 | Freiburg | 365 | 1,59 | 2 | Berlin | 5200 | 1,43 | 2 | München | 3133 | 2,13 | ||
| 3 | Tübingen | 110 | 1,21 | 3 | Hamburg | 2575 | 1,4 | 3 | Hamburg | 2968 | 1,61 | ||
| 4 | Heidelberg | 166 | 1,04 | 4 | Düsseldorf | 600 | 0,97 | 4 | Berlin | 5814 | 1,6 | ||
| 5 | Darmstadt | 142 | 0,89 | 5 | Köln | 893 | 0,82 | 5 | Freiburg | 365 | 1,59 | ||
| 6 | Göttingen | 105 | 0,88 | 6 | Stuttgart | 470 | 0,74 | 6 | Köln | 1542 | 1,42 | ||
| 7 | Aachen | 182 | 0,74 | 7 | Frankfurt am Main | 440 | 0,58 | 7 | Stuttgart | 886 | 1,4 | ||
| 8 | Münster | 226 | 0,72 | 8 | Darmstadt | 60 | 0,38 | 8 | Heidelberg | 205 | 1,28 | ||
| 9 | Marburg | 52 | 0,68 | 9 | Hannover | 200 | 0,37 | 9 | Darmstadt | 202 | 1,27 | ||
| 10 | Mannheim | 206 | 0,67 | 10 | Leipzig | 199 | 0,34 | 10 | Tübingen | 110 | 1,21 | ||
| 11 | Bremen | 375 | 0,66 | 11 | Mainz | 60 | 0,28 | 11 | Frankfurt am Main | 894 | 1,19 | ||
| 12 | Stuttgart | 416 | 0,66 | 12 | Karlsruhe | 85 | 0,27 | 12 | Göttingen | 136 | 1,14 | ||
| 13 | Leipzig | 368 | 0,63 | 13 | Göttingen | 31 | 0,26 | 13 | Düsseldorf | 689 | 1,11 | ||
| 14 | Augsburg | 184 | 0,62 | 14 | Heidelberg | 39 | 0,24 | 14 | Hannover | 533 | 0,99 | ||
| 15 | Hannover | 333 | 0,62 | 15 | Sindelfingen | 15 | 0,23 | 15 | Leipzig | 567 | 0,96 | ||
| 16 | Frankfurt am Main | 457 | 0,61 | 16 | Wiesbaden | 60 | 0,22 | 16 | Mannheim | 264 | 0,85 | ||
| 17 | Köln | 649 | 0,6 | 17 | Mannheim | 58 | 0,19 | 17 | Mainz | 167 | 0,77 | ||
| 18 | Halle an der Saale | 142 | 0,59 | 18 | Osnabrück | 27 | 0,16 | 18 | Aachen | 182 | 0,74 | ||
| 19 | Dresden | 315 | 0,57 | 19 | Esslingen | 15 | 0,16 | 19 | Münster | 226 | 0,72 | ||
| 20 | Kassel | 113 | 0,56 | 20 | Böblingen | 6 | 0,12 | 20 | Halle an der Saale | 167 | 0,7 | ||
| 21 | Lüneburg | 41 | 0,54 | 21 | Halle an der Saale | 25 | 0,1 | 21 | Marburg | 52 | 0,68 | ||
| 22 | Jena | 59 | 0,53 | 22 | Friedrichshafen | 6 | 0,1 | 22 | Bremen | 375 | 0,66 | ||
| 23 | München | 733 | 0,5 | 23 | Offenbach | 8 | 0,06 | 23 | Augsburg | 193 | 0,65 | ||
| 24 | Mainz | 107 | 0,49 | 24 | Koblenz | 6 | 0,05 | 24 | Osnabrück | 104 | 0,63 | ||
Figure 3. City ranking 2019 for station-based (left), station-independent (center) and total (right) car sharing vehicles in Germany. Absolute numbers (white columns) and relative numbers per 1,000 inhabitants (green, blue and yellow columns), cropped to top 24.
Source: BCS
Case 7: Number of companies communicating about circular economy
| Indicator | Number of companies communicating about circular economy |
| Case | Circular companies |
| Owner | PBL (Dutch EPA) |
| Current coverage | NL |
| ToC | Input |
This indicator shows the number and share of companies (economy wide and sector specific) that communicate about aspects of the circular economy on their public web pages. Companies are categorised based on what circular economy concepts – drawn from the circular ladder – are communicated, including waste prevention. The data is generated though a web-scrape of company web pages based on the official Dutch business register.
Relevance
The Dutch government wanted to collect data about business engagement in the circular economy, as this is critical for the circular transition. Existing statistics detail the number of companies, employment and revenue engaged in waste management, repair, and selected service sectors, but not about engagement with the circular economy in the wider economy. The indicator addresses all aspects of the circular economy including waste prevention and reuse. The indicator only informs about communication rather than action, which means that the indicator cannot inform about the level or impact of engagement, and only covers companies that have an internet presence.
The ambition is to use machine learning to link this data with statistical data, to be able to also revise the revenue and employment in companies working with circular economy.
Method of calculation/collection
A comprehensive typology translates circular economy strategies (in line with the circularity ladder) into concrete search words. Different spellings of the same word and different wording of the same concepts were considered. The development of the typology was initially supported by a google trend analysis, collecting data about the trends related to circular economy in specific sectors and for specific material streams.
When the circular economy taxonomy was fully calibrated, a web-scrape was initiated to search the web pages of Dutch companies based on the taxonomy. All circular strategies were assigned a certain weight, and only companies with a score over a certain threshold was categorised as “circular”. Samples were taken to clean the data for obvious outliers e.g. a nail salon communicating about “nail repairs”.
Additional conceptual questions arose such as whether a company working towards efficiency (reduce) can be categorised as “circular”. This list of companies communicating about circular economy at their webpage was compared with the national statistics engaged in circular economy (derived from certain industry code related to repair, recycling and reuse), and all duplicates were removed.
Circular companies in the Netherlands
From the statistics, 65 000 companies were identified as circular. From the web-scrape, 46 000 companies were identified as circular. After removing duplicates, approximately 100 000 Dutch companies were identified as circular, corresponding to 6% of the total number of Dutch firms.
Data sets used
A web-scrape of company webpages created a comprehensive dataset of companies’ communications around the circular economy.
A database of Dutch companies was used to steer the web-scrape.
In the Nordic context
The data covers Dutch businesses, and as such the dataset is not directly useful for the Nordic countries. However, the approach could be reproduced by individual Nordic countries or as a region.
A similar web-scrape method was used by the data bureau, Analyse og Tal, to map innovative start-ups on the Danish island of Bornholm[1]https://strapi.ogtal.dk/uploads/3a76bce918aa49d5897bfa1bba3e391a.pdf. For this study, the Danish company register was applied using P-numbers. The data in the company register includes company name, ownership, number of employees etc. and the information in the CVR can be matched with additional data sources such as companies’ webpages and communication on social media to get a more comprehensive understanding of the data. Furthermore, the data in CVR are close to real-data, and does not suffer from the same time delay as statistics.
Footnotes
Case 8: Expiration date on food
| Indicator | Expiration date on food |
| Case | Barcodes entail information on expiration date |
| Owner | GS1 owns the system; Producers/retailers own the data |
| Current coverage | DK |
| ToC | Activity; Outcome |
All food products have a barcode somewhere on the packaging. Data about the expiration date (or ‘best before’ date) can be added to this barcode. This facilitates more accurate monitoring of shelved products, which in turn helps identify products approaching ‘best before’ dates, enabling activities food waste minimising initiatives such as discounting the products. In the longer run, this information can help improve supply management.
The data can also be used to form an indicator.
In Norway, the retail company NorgesGruppen has done this on a test-scale, adding barcodes with expiration date to selected meat products in the retail shop ‘Meny’. The expiration date also informs about the lifetime of food products. The information can further be given to consumers to lower food waste after the point of sale.
Relevance
The Nordic Region together throw out 3.5 million tonnes of food every year[1]NCM (2021). Halving food waste. The sustainable development goals include a target (12.3) to halve food waste in 2030. The retail sector is responsible for a significant share of the food waste, as an example the retail sector is responsible for 40% of the food waste in Norway. By adding the ‘best before’ date to products through bar codes, it is possible to limit food waste. NorgesGruppen has increased their revenue on minced pork (14 selected products) from 1.1% to 2.9%, and reduced the food waste by 18%.
Footnotes
- ^ NCM (2021). Halving food waste
Data sets used
All minced pork under NorgesGruppens own label, Norfesk, has been attributed with dynamic bar codes (GS1 bar code) that include information on the product number, weight, batch number and expiration date. To read the bar codes, the scanners in the shops have been reprogrammed. Barcodes were selected over QR-codes as the current scanners could read these dynamic bar-codes, while RFID-codes cannot tolerate liquid nor moisture and are therefore not suitable for food products.
When a product is soon to expire a discount is added to the product. I the future, the expiration can be noted at the check-out to ensure that costumers do not unconsciously buy expired food products. By adding the expiration date to barcodes, a new data stream is obtained. This data stream can inform about the life time of food product (calculating the time from production to expiration).
Method of calculation
The amount of food waste in the retail sector is measured before and after the barcodes have been added allowing the impact of the initiative to be estimated. The data generated by the use of the expanded bar codes allows for better understanding and management of waste within retail.
Implementing for the Nordic countries
Food waste is a challenge across all the Nordic countries. Common industry standards that are used by both suppliers and retailers would make is possible to scale-up the pilot project to cover more product groups and all Nordic countries. A smaller scale project has been carried out by GS1 in Denmark looking at young consumers and the expiration date notified through an app can help them limit their food waste.
References
Interview 12/10/21 med Mads Kibsgaard, GS1
Matvett (2021). Dato inkludert i strekkoden for første gang: https://www.matvett.no/bransje/suksesshistorier/dato-inkludert-i-strekkoden-for-f%C3%B8rste-gang
Matvett (2021). Mindre madspild med datoen inkluderet i stregkoden: https://www.matvett.no/bransje/aktuelt/mindre-matsvinn-med-datoen-inkludert-i-strekkoden
https://www.gs1.dk/hvad-goer-vi-for-dig/madspild-og-datostyring/
Case 9: The second-hand effect
| Indicator | Weight of sold second-hand goods from online platforms (t) |
| Case | ‘the second hand effect’ |
| Owner | Schibsted |
| Current coverage | SE, FI, NO |
| ToC | Output |
Blocket is the largest online second-hand platform in Sweden with more than five million visitors weekly. Blocket facilitates exchange of among others used electronics and furniture.
Finn is Norway’s largest online second-hand platform of Norway with six million visitors weekly, exchanging among other used electronics, furniture, and clothing.
Tori is a leading marketplace in Finland with 2.4 million weekly visitors facilitating exchange of among others used furniture and clothing.
DBA is the market leading second-hand platform in Denmark across product groups.
The Norwegian company Schibsted owns second-hand platforms in Sweden (Blocket), Norway (Finn), Finland (Tori), and Denmark (DBA and Bilbasen). Schibsted and Adevinta (a spin-off from Schibsted that owns six European second-hand platforms) have initiated the ‘second-hand effect’ indicator, where the impact of reuse is calculated based upon the estimation of the average weight of sold second-hand goods at their second-hand platforms. The weight of second-hand goods as well as the methodology can potentially contribute to measure reuse from other online platforms. The methodology applied has been developed in cooperation with the Swedish Environmental Research Institute (IVL).
Relevance
Reuse is a central strategy of waste prevention, which in theory can replace the production of a new products and reduce use of raw materials. However, rebound effects can occur as the consumption of a second-hand often is cheaper than consuming a new product, and the saving can be used to consume additional products. The Second-hand Effect assumes that the consumption of a second-hand products replaces the consumption of a new products, and that disposal emissions are avoided. Ideally, the replacement rate was taken into account to identify if any rebound effects are taken place. The calculation of the second-hand impact is based on estimations of weights of specific product groups sold at the forementioned online second-hand platform, and the weight of sold second-hand goods can contribute to measure reuse nationally (when aggregated).
Method of calculation
Schibsted and Adevinta have identified relevant product categories on their platforms and for each these a sample of 5 to 10 ads are assessed, depending on the complexity of the product category. The material composition of a product category is estimated based on these samples, and the weight of each of the materials in the product category is calculated. Based on the samples, the average weight and carbon emissions from each product category is calculated and multiplied by the number of reused goods sold on the online second-hand platforms. The assessment represents 50% of the ads on the platforms. Ads from professionals are excluded as these are often new products (and therefore not reuse). Likewise, service categories are excluded from the calculation.
Data sets used
The second-hand effect is based upon data of the number of transactions of second-hand goods facilitated by the online platforms owned by Schibsted. A sample of ads further contribute to calculate the resource- and carbon footprint of different product groups, which is multiplied with the number of transactions. The data stream moreover contributes to calculate the amount of specific material streams (plastic, steel, and aluminium).
Implementing for the Nordic countries
The weight of sold second-hand goods from online platforms can be used nationally to inform the degree of reuse taking place in society. This can help meet EU’s requirement of monitoring reuse. In order to achieve that, however, the market share of the online platform included needs to be calculated to get an aggregated picture of reuse (or combined with data from other relevant online platforms). By including only sold second-hand goods, the risk that one case of exchanging reuse occur twice is limited. The indicator is produced annually, and Schibsted shows interest in further collaboration to improve (monitoring of) reuse.
References
Adevinta and Schibsted (2020). The Second Hand Effect – Calculating the environmental benefits of second-hand trade: https://static.schibsted.com/wp-content/uploads/2020/07/06152559/200703_schibsted-adevinta_second-hand-effect_finale.pdf
Adevinta and Schibsted (2021). The Second Hand Effect 2020 report – Calculating the environmental benefits of second-hand trade: https://static.schibsted.com/wp-content/uploads/2021/04/13192400/schibsted-adevinta_second-hand-effect_2020.pdf
Case 10: Reuse activity
| Indicator | Several such as the share of Danes buying/selling second hand goods |
| Case | Reuse activity |
| Owner | DBA (bought by Schibsted in 2021) |
| Current coverage | DK |
| ToC | Input; Activity |
“Den Blå Avis” (DBA) is Danish market-leading online platform for second hands goods in Denmark, covering most product groups including textiles, electronics, furniture and construction materials. In 2020, 15 mio. different products were put up for sale. Every month, 2.1 unique users are visiting the DBA, and the Danes are in average visiting DBA 8 times a month, almost using 3 hours. In 2021, DBA was bought by the Swedish company Schibsted owning second hand platforms across the world (see case 7 about the ‘secondary effect’).
The Danish online DBA produces an annual ‘reuse index’, which consists of several indicators including the share of Danes having sold or bought second hand goods; on which second hand platforms; motivation and barriers to buy second hand; opinions on second-hand gifts; as well as the number of ads from private actors. Consumers are divided into five segments; Fiery soul, novice, climate activist, speculator and the offer hunter. The second-hand index therefor informs not only about activity on second-hand platforms, but also given more insights into why people are buying second-hand.
The reuse index is constructed on the basis of data from ads, a survey and qualitative interviews. The reuse index has been produced annually since 2016.
Relevance
The digital available indicator on the number of ads posted by individuals can be applied as a proxy indicator of reuse. The number of ads does not necessarily reflect the actual reuse, but rather an interest in selling second-hand goods and thus the availability across product groups. DBA has, however, recently added a question to users that takes down their add on whether the item was sold, which will allow DBA to estimate the actual reuse. When combined with survey data, the data gets more insightful, as it can indicate whether the exchange of second-hand goods replaces the consumption of new products and thus lower the environmental impact. The survey is based on self-reporting, with the associated risk of social desirability bias, whereby the respondents overestimate how often they buy and sell second hands goods.
Data sets used
The reuse index consists of web- and survey data as well as qualitative interviews. The web data includes the number of ads posted and the activity on DBA (users and searches). The survey is collected through a representative sample of 2000 Danes. Qualitative interviews are gathered to create communicative cases.
Method of calculation
The indicator is presented as final and no additional calculations are necessary. The index consists of several indicators that are reported yearly. The raw data are not publicly available.
Implementing for the Nordic countries
Online platforms facilitate a significant portion of the reuse taking place in the Nordic countries. This example shows what the data held within these platforms can be used as the basis to inform on reuse, as well as how this data can these triangulated with other data sources to get a better insight into the actual amount of reuse. When the consumer is asked whether the add was sold, then they are taking it down, one- or two additional questions could be added to get a deeper insight into the attitude towards second hand. The question could either be whether the consumer had tried to sell the product on other platforms; how long it took to sell; why the person chose to sell the product.
References
DBA (2021). DBA Genbrugsindeks 2021. https://guide.dba.dk/publikationer/genbrugsindekset/2021/#
Interview med DBA, Julie Schoen: 2877 7506.
Case 11: Concular
| Indicator | Estimated waste reductions from sold second-hand goods from online platform (t) |
| Case | ‘Concular’ |
| Owner | Concular UG |
| Current coverage | DE, CH, AT (planning to enter FR, UK and the Nordics) |
| ToC | Output |
Concular is a start-up founded in 2020 with approximately 20 employees. Concular provides a transaction platform, also known as a digital matchmaker, where the primary service is mediation between buyer and seller. The seller can announce sale of either used building products, or services related to preparation of reuse such as certification, sorting or transport. Additionally, Concular offers its own services including the recording and evaluation of building materials in building stock and the production of material passports for buildings. Concular has won prizes such as the Circular Innovation City Challenge.
The German based company Concular provides a link between the demand and supply side of used construction materials. Concular provides solutions for digitalising materials in deconstruction projects prior to demolition including the production of material passports for buildings which can then be used to find a potential buyer.
One barrier to reusing building materials is that the owner of a building is often not fully aware of the material composition of the building until demolition – however, it is then too late to find a buyer and prohibitively expensive to find storage for materials that that could potentially be reused.
Relevance
Reusing building materials extends the service life of the products and thus in theory can replace the production of new materials as well as reduce waste production. Given that one third of all European waste is produces within the construction sector, there are still enormous potentials to cascade the materials from deconstruction projects[1]https://ec.europa.eu/environment/levels_en. These enormous quantities of waste are often expensive to get rid of in Europe due to waste management fees, and solutions such as the Concular platform therefore serves as a double economic incentive for the owner of used materials.
Footnotes
Method of calculation
Based on the data it has on reused materials, Concular reports on CO2 savings, costs, and most importantly in this context, the waste reductions associated with the reuse or recycling of building materials. These metrics are produced on product and project level and can be used by the customers to inform ESG reporting on CO2 savings, waste and costs. These calculations are based on the Life cycle assessment (LCA) methodology.
The data collected during the production of material passports uses block-chain technology to log transaction history and thus enhance transparency and data robustness. AI is used to increase the matching rate between supply and demand.
Data sets used
The calculations are based on GABI and Ökobaudat – both of which are internationally recognised databases widely being used for conducting LCAs.
Implementing for the Nordic countries
The metrics from Concular are only provided on a product and project level. Furthermore, the company is still a start-up. Therefore, the potential of the metrics as a national indicator is currently limited. It would be interesting to explore potentials for aggregating and combining data across similar platforms. Combined with data on trade and transactions, aggregated data from Concular and similar platforms, could provide an important input to national indicators on the total numbers of reused building materials. The calculations and reports produced by Concular follow accepted standards, which means it could be combined with similar data on other platforms to inform the degree of reuse taking place in society and thus to meet EU’s requirement of monitoring reuse. In order to do so, the market share of the online platform included needs to be calculated to get an aggregated picture of reuse.
References
F6S Network Limited, 2021. Concular: https://www.f6s.com/concular
European Circular Economy Stakeholder Platform, 2021. Concular - Digital platform enabling circular construction: https://circulareconomy.europa.eu/platform/en/good-practices/concular-digital-platform-enabling-circular-construction
European Commission, 2021. Level(s). https://ec.europa.eu/environment/levels_en
Case 12: Circular public procurement
| Indicator | Product lifetimes of procured goods; Waste generated from procured goods |
| Case | Circular economy in GPP |
| Owner | Konsido is system owner; Public authorities own their procurement data |
| Current coverage | DK |
| ToC | Activity; Outcome |
Konsido has developed a system that can recognise products groups on electronic invoices. Combined with data drawn from the Danish company register (CVR), the system gives a full overview of a municipalities procurement divided into product categories. In collaboration with the municipality of Århus, Konsido has identified 1000 product categories corresponding to what the municipality procure. These 1000 product categories have been assigned a range of attributes such as average product lifetime (the time between procurement and disposal) and the average amount of waste, which each product category generates. The system can be fed with additional data that can monitor any strategic objectives of a procurement unit and thus support the prioritisation of sustainable procurement.
Relevance
Public procurement makes up 14% of European GDP[1]EC (2021). European Semester Thematic Factsheet: Public Procurement. Retrieved from: https://ec.europa.eu/info/sites/default/files/file_import/european-semester_thematic-factsheet_public-procurement_en_0.pdf, and more in the Nordic countries, as they have some of the most extensive public services across EU member states. Public authorities can use the market power of their procurement activities to support waste prevention by procuring products and services that actively minimise waste generation. This includes procurement of products as service models, reuse and repair, but also through demanding fewer and smarter products and packaging. Better understanding of current procurement patterns can help guide and align it with strategic priorities such as lowering the environmental footprint.
The system developed in collaboration with the municipality of Århus estimates – among other - product lifetimes and waste amounts, which can indicate whether a municipality is decreasing its overall waste generation. The system can be combined with additional data sets in the future to inform, for example, about environmental impacts.
Footnotes
- ^ EC (2021). European Semester Thematic Factsheet: Public Procurement. Retrieved from: https://ec.europa.eu/info/sites/default/files/file_import/european-semester_thematic-factsheet_public-procurement_en_0.pdf
Data sets used
The system makes use of invoices and data from the Danish company register (company name and industry code) to classify all public procurement into 1000 product groups. Each product group is assigned a range of attributes: the time between procurement and disposal, waste produced, and the impact on the SDG’s. These attributes are based on estimates and assumptions.
The quality of the data on the invoices is far from perfect, and occasionally very poor. For example, some invoices have undefined or very broad product description, which prevents automatic or even manual assignation to a product group.
Method of calculation
An algorithm has been trained to categorise invoice information (“line items”) into one of the 1000 defined product categories. The algorithm has been trained manually since no data source linked line items and defined product groups.
The attributes used to provide sustainability assessment – product lifetime, waste amount, impact on the SDG’s – have been manually added to each product group based on accessible information and assumptions.
Implementing for the Nordic countries
Since 2020, electronic invoices have been mandatory in the EU, enabling the system to be used in all the Nordic countries. The procurement patterns of the Nordic municipalities are alike, implying that the product group categorisation only will need minor adjustments to be applied in other Nordic countries. The system can be improved by combining it with validated data on the environmental impact of product groups, such as Product Environmental Footprint (PEF) data as prepared by the EU as of 2021, or data from certification schemes (limited to eco-labelled products). To enable comparison and benchmarking, a common understanding of circular procurement should be developed and recognised by public authorities.
References
Circular City Challenge (2021). The winners: https://www.circularinnovation.city/winners
Konsido ApS (2021). https://www.konsido.dk
Interview with CEO Thomas Schultz, the 5th of October, 2021.
Case 13: Vakansa
| Indicator | Use of buildings/hours |
| Case | ‘Vakansa’ |
| Owner | Vakansa AB |
| Current coverage | SE |
| ToC | Activity |
On Vakansa’s online peer-to-peer platform, it is possible to rent out a variety of premises and facilities ranging from music and theater studios to office hubs and conference halls. One advantage of leasing these places is that additional services are often included such as access to coffee machines, WIFI, whiteboards, printers, and other basic supplies. Examples of services included with more long-term leases are permanent address and mail solutions, and access to expert networks and partners. Vakansa also helps with contracts, insurance, hosting, management, key handling, and cleaning, and since 2021, it has been providing its own office hubs. Vakansa was founded in 2019.
The Swedish company Vakansa is an online platform that facilitates co-using premises when not in use by tenants. This includes co-using for schools, civil society, and NGOs, as well as co-working spaces for companies. This is an important support and facilitation tool for the sharing economy. On the platform you can rent or co-use spaces for both extended or brief periods depending on availability. On the site, you can search for available premises within specific time span, or you can see when a specific location is available.
The data generated by this service can provide useful information for monitoring the status of sharing economy for the built environment. This can be, for example, m2/hours.
Relevance
Sharing economies increases resource efficiency by intensifying the use of already existing goods and services, and thus in theory decreasing the need for additional material and services. By providing a digital platform to utilise existing vacant space, Vakansa decreases the need for additional building stock and associated emissions and wastes. Thus, intensity of use is closely related to reuse, although the time of use is overlapping instead of sequential.
One of the ideas behind Vakansa is to provide cheaper leasing opportunities. Therefore, there is a minor risk that the service may result in rebound effects since some companies or individuals may achieve savings that offsets consumption to elsewhere.
Method of calculation
Here, Vakansa extracts the number of square meters in relation to leased hours. Vakansa keeps track of how many square meters per hour are leased out via their platform. In theory it is also possible to extract other information such as price, type of facility, and number of seating available.
Datasets used
The data behind the indicator is extracted directly from the sales statistics on the online platform, including the data about individual buildings.
Implementing for the Nordic countries
Data from these platforms can be used to monitor the intensity of use of facilities and premises. This provides information that could support EU’s requirement of monitoring reuse.
Data from the variety of sharing platforms, not necessarily exclusively housing and premises, can be nationally aggregated to inform on the use intensity of the existing commercial building stock. The platform is currently only active in Sweden and has limited coverage, but similar platforms are available in other Nordic countries (although not all provide national coverage), which could provide similar data.
References
Vakansa AB, 2021. Vi främjar liv och rörelse i stadens byggnader. https://vakansa.se/sa-fungerar-tjansten
Case 14: Business engagement in waste prevention and reuse
| Indicator | Industry benchmarks of material flows |
| Case | Circulytics |
| Owner | Ellen MacArthur Foundation |
| Current coverage | Global |
| ToC | Input; Activity; Output; Outcome |
Ellen MacArthur Foundation has developed a standard to monitor the level of circular economy available to companies to assess how far they are to achieve a circular company. Called “Circulytics”, the tool demands that companies provide a range of key data points – some of which are sector specific – that are used to compile indicators on the company’s position within their industry with regards to circular economy, and also to develop the industry benchmarks themselves. Some of the indicators ask about the maturity to take-up a circular transition (in terms of resources allocated and activities carried out), some about the outcomes. Industry benchmarks are available when +10 companies in an industry have signed up for Circulytics.
Relevance
Circulytics provides a standardised way of monitoring how circular a company is, which in turn enables comparison and benchmarking within industries. Circulytics further assists companies in understanding their strengths and weaknesses to become more circular to promote a circular economy. The industry average however only represents the companies that have voluntarily applied Circulytics and are thus not representative for the entire industry, as companies not engaged with the circular economy agenda likely will not assess their circular performance.
Data sets used
Circulytics generate industry averages of all indicators (where more than 10 companies have applied Circulytics) including the inflow and out outflow of materials that inform about the use of circular materials, design for circularity, and disposal of products. The numeric score ranges from 0–100. The industry categorisation includes overall groups of 1) consumer/end products, 2) intermediate products, 3) upcycling processing, 4) agriculture, forestry, and fishing, 5) infrastructure, 6) transportation, 7) finance and insurance, 8) services, and 9) institution, governments, and cities. For all these overall groups, are several more detailed industries described[1]Ellen MacArthur Foundation (2021). Circulytics – Industry List. Retrieved from: https://emf.thirdlight.com/link/9g7rl4pj7ye-xbtu5n/@/preview/1.
Footnotes
- ^ Ellen MacArthur Foundation (2021). Circulytics – Industry List. Retrieved from: https://emf.thirdlight.com/link/9g7rl4pj7ye-xbtu5n/@/preview/1
Method of calculation
Circulytics is based on a survey comprising 37 questions. Each question is related to a specific indicator with a score and a weight from which an overall score is calculated. The theme ‘Products and materials’ is highly relevant to inform on waste prevention. This theme is only displayed for companies that have substantial material flows (administrative materials such as office building and IT equipment are not included, while packaging is included). The companies indicate whether they maintain ownership of the material flows, to differentiate questions between product as a service models and regular product-based business models.
- Material inflow mass: Annual mass of all inflow of products and materials (metric tonnes) including the share of the total inflow material mass that are: A) Non-virgin, B) Sourced from by-products/ waste streams, C) Virgin, but renewable/regeneratively products, D) Virgin, but sustainably produced or E) None of the above.
- Material outflow mass: Annual mass of products/materials/by-products designed to be consumed/used/ (metric tonnes) including the share of the total outflow material mass that A) Go to landfill or incineration (and therefore recirculated), B) Are designed along circular economy principles:
- During use (designed for longevity/reuse/repair or regeneratively)
- End of functional life (designed for disassembly/modular design/recycling/nutrient recirculation)
- Enabling a circular economy: Providing systems, tools and resources that enable a longer lifetime of product (only in cases, where the product does not meet the circular product design described under 1) and 2).
- Chemical substances: Share of product that contain substances from EU REACH Candidate List or ChemSec Sin List in quantities over 0.1% w/w or contain a high concentration of Cradle-to-Cradle Certified Products Program Restricted Substances List (RSL) than what the list allows.
- Share of products/materials that are recirculated in practice (require product tracking, otherwise average recirculation rates should be applied (as developed by EMF) divided into reuse; refurbishment; recycling; nutrient recirculation and none of the above (landfill/incineration)
- How many times a product is reused on average before reaching the end of functional life.
All submitted information is anonymised and aggregated to calculate industry benchmarks. EMF will not publish individual company information.
Implementing for the Nordic countries
Circulytics provide a free of charge method for assessing individual companies and enables comparison and benchmarking across companies. 1250 companies have signed up to apply Circulytics, most of these are active in the Nordic region. Also, larger Nordic companies such H&M, IKEA, Novo Nordisk are also engaged. The Nordic countries can use the standard to monitor circular companies and/or use the benchmarks to see the development of how circular the most ambitious companies are.
References
Ellen MacArthur Foundation (2021). Indicators – Circulytics
Ellen MacArthur Foundation (2021). Method – Circulytics
Ellen MacArthur Foundation (2021). Circulytics – Industry List. Retrieved from: https://emf.thirdlight.com/link/9g7rl4pj7ye-xbtu5n/@/preview/1
Case 15: Waste reduction in food retail
| Indicator | Weight of retail food waste avoided |
| Case | Waste reduction in food retail |
| Owner | WhyWaste + food retailers |
| Current coverage | Region-wide |
| ToC | Reduce |
WhyWaste is a Swedish food technology company focusing on digital solutions to problems of food waste in the retail sector. The most basic functionality is to facilitate the date-checking, identification and repricing (discounting) items with short expiration dates, so as to limit wastage. This can include locating items in the store, efficient printing and labelling of items or of shelves, and generation of promotional or marketing content, for example via dynamic information screens. Supporting technologies work on more “intelligent” pricing and discounting, with dynamic algorithms based on a range of environmental factors, and the possibility of discounting in an ongoing / real-time perspective. Other functionality includes the monitoring and tracking of perishable items in a food safety perspective (for instance at delicatessen counters), and back-office operations including forecasting / production planning, possibly in conjunction with existing inventory management tools.
The Swedish company WhyWaste has developed a suite of digital tools for supporting retailers in analysing and reducing food waste at the retail stage. This produces and uses a vast amount of data about products in food retail, although this data is currently proprietary, held by the individual retail stores of chains.
Relevance
Reduction of food waste is an obvious part of a waste prevention strategy, and the retail stage is no different to almost any other stage in the food value chain in terms of its vulnerability to waste. Avoiding / reducing food waste is a key strategic goal across all Nordic countries, and digital tools to support these initiatives have an obvious basis in policy and strategic developments.
Some care should be taken with respect to indirect / rebound effects or problem shifts. For example, the purchase of discounted close-date items should actually reduce consumer demand for equivalent items at full price, but does not necessarily do so, at least fully. This highlights the potential for a food waste problem shift from the retailer to the consumer. It has also been claimed that savings or waste reduction at retail (or at consumer level) has little overall effect on the value chain unless these savings are manifest in reductions in food production at source – which is only very weakly connected to the retail or consumer stage.
Method of calculation
Individual retailers have access to huge databases of food production and sales data, and it is relatively straightforward for individual stores to account / report their food loss statistics. There are some doubts concerning the accuracy of such reporting, and there appears to be little regulatory obligation for accuracy. Nonetheless, it should be straightforward in principle for the actors to access the relevant data, although these are obviously proprietary. A true picture of the indicator “weight of food waste avoided” probably implies a means of accounting for indirect or rebound effects – these are less straightforward than simple masses of food waste, both in terms of data gathering and of query formulation – for example the secondary demand effect example given above.
Implementing for the Nordic countries
Widespread implementation of this and other waste prevention tools across the Nordics is already in evidence. Many major retailers are already using WhyWaste tools, although in at least some cases it appears to be the decision of individual store managers rather than a broader implementation. Patchy coverage coupled with the dependence on proprietary information makes this seem rather unlikely as a means of measuring food waste avoidance on a national level. However, it may be possible to extrapolate reasonably well from selected data sets, and/or build consortia for effective pooling of information whilst maintaining commercial sensitivity.
References
About this publication
Measuring waste prevention and reuse: digital opportunities
Using the digitalisation of society to inform policy
David McKinnon, Nina Lander Svendsen, Bjørn Bauer, John Baxter, Leonidas Milios, Pauliina Saari
ISBN 978-92-893-7349-4 (PDF)
ISBN 978-92-893-7350-0 (ONLINE)
http://dx.doi.org/10.6027/temanord2022-536
TemaNord 2022:536
ISSN 0908-6692
© Nordic Council of Ministers 2022
Cover photo: Cultura Creative / Johnér
Published: 15/6/2022
Disclaimer
This publication was funded by the Nordic Council of Ministers. However, the content does not necessarily reflect the Nordic Council of Ministers’ views, opinions, attitudes or recommendations.
Rights and permissions
This work is made available under the Creative Commons Attribution 4.0 International license (CC BY 4.0) https://creativecommons.org/licenses/by/4.0.
Translations: If you translate this work, please include the following disclaimer: This translation was not produced by the Nordic Council of Ministers and should not be construed as official. The Nordic Council of Ministers cannot be held responsible for the translation or any errors in it.
Adaptations: If you adapt this work, please include the following disclaimer along with the attribution: This is an adaptation of an original work by the Nordic Council of Ministers. Responsibility for the views and opinions expressed in the adaptation rests solely with its author(s). The views and opinions in this adaptation have not been approved by the Nordic Council of Ministers.
Third-party content: The Nordic Council of Ministers does not necessarily own every single part of this work. The Nordic Council of Ministers cannot, therefore, guarantee that the reuse of third-party content does not infringe the copyright of the third party. If you wish to reuse any third-party content, you bear the risks associated with any such rights violations. You are responsible for determining whether there is a need to obtain permission for the use of third-party content, and if so, for obtaining the relevant permission from the copyright holder. Examples of third-party content may include, but are not limited to, tables, figures or images.
Photo rights (further permission required for reuse):
Any queries regarding rights and licences should be addressed to:
Nordic Council of Ministers/Publication Unit
Ved Stranden 18
DK-1061 Copenhagen
Denmark
pub@norden.org
Nordic co-operation
Nordic co-operation is one of the world’s most extensive forms of regional collaboration, involving Denmark, Finland, Iceland, Norway, Sweden, and the Faroe Islands, Greenland and Åland.
Nordic co-operation has firm traditions in politics, economics and culture and plays an important role in European and international forums. The Nordic community strives for a strong Nordic Region in a strong Europe.
Nordic co-operation promotes regional interests and values in a global world. The values shared by the Nordic countries help make the region one of the most innovative and competitive in the world.
The Nordic Council of Ministers
Nordens Hus
Ved Stranden 18
DK-1061 Copenhagen
pub@norden.org
Read more Nordic publications on www.norden.org/publications