
- Front page
- Table of contents
- 1. Introduction
- 2. Definitions and data
- 2.1. Definitions of protected areas
- 2.2. Data on protected areas
- 2.3. Data on land cover
- 2.4. Data on administrative boundaries
- 2.5. Data on bioclimatic zones
- 2.6. Data on elevation zones
- 2.7. Data on high conservation value forests
- 3. Changes in the protected area coverage in the Barents Region 2013-2020
- 3.1. Protected area coverage in the Norwegian study area
- 3.2. Protected area coverage in the Swedish study area
- 3.3. Protected area coverage in the Finnish study area
- 3.4. Protected area coverage in the Russian study area
- 4. Ecosystem diversity and protection in the Barents Region
- 4.1. Ecosystem diversity in the Barents Region
- 4.2. Ecosystem protection in the Barents Region
- 5. Protection of high conservation value forests (HCVFs)
- References
- About this publication
MENU
Contents
This publication is also available online in a web-accessible version at https://pub.norden.org/temanord2022-535.
1. Introduction
Author: Anna Kuhmonen
The Barents Region displays one of the largest and relatively intact forest ecosystems that remains still on Earth. Forest ecosystems have a crucial role in mitigation of and adaptation to the climate change. The benefits that biodiversity provides are fundamental to human well-being and health in the Barents Region. Mainstreaming biodiversity is one of the main components in safeguarding nature values.
Boreal forests and protected areas are a priority in the Barents Euro-Arctic Council’s (BEAC) Working Group on Environment (WGE) and its Subgroup on Nature and Water (SNW). The Ministers of the Environment of the Barents Region stressed the need for further co-operation to protect the intact forests in their meeting in February 2020.
All BEAC Member States are Parties to the UN Convention on Biological Diversity (CBD) and have been committed to the Aichi Biodiversity Targets to halt the loss of biodiversity by 2020. This report presents the results of the Forest biodiversity protection in the Barents Region in 2020 and beyond -project, which was funded by the Nordic Council of Ministers. The aim of the project was to study the status of coverage and representativeness of the protected area network in the Barents Region to estimate how the region has achieved the CBD Aichi Biodiversity Target 11 to conserve 17% of the terrestrial and inland water areas by 2020. The target also states that the conserved areas should be protected through effectively and equitably managed, ecologically representative and well-connected systems of protected areas and other effective area-based conservation measures, and integrated into the wider landscapes and seascapes (Convention on Biological Diversity, 2010).
Also, in the framework of the project, the representatives of the BEAC Working Group on Environment and the Working Group on Barents Forest Sector started a dialogue on mainstreaming biodiversity into forestry in the Barents Region. The Post-2020 Global biodiversity framework is under negotiations between the parties of the CBD, and it will provide new targets and a framework for halting the loss of biodiversity at the global level. The results achieved by this project can be utilised to assist reaching the Post-2020 Global biodiversity framework, including its goals and targets in the Barents Region. A lot of effort will be needed to reach these by the countries in the Barents Region, and they will provide the guidelines for future co-operation in the Barents biodiversity protection.
In this study, the coverage of protected areas was analysed based on updated and unified GIS data and representativeness of the protected area network, based on comparing the existing protected areas to the prevalence of ecosystem cover and high conservation value forests (HCV) in the region. The results were compared with correspondent analysis results that were prepared under the Barents Protected Area Network -project in 2011–2014 (Aksenov et al., 2015) and the analysis on HCV forests in 2015–2017 (Kuhmonen et al., 2017).
The Barents Euro-Arctic Region (later Barents Region or BEAR) consists of 14 regions in the northernmost areas of Norway (Nordland, Troms and Finnmark), Sweden (Norrbotten, Västerbotten), Finland (Lapland, Northern Ostrobothnia, Kainuu, and North Karelia) and northwest Russia (Murmansk Region, Republic of Karelia, Arkhangelsk Region, Republic of Komi, and Nenets Autonomous District) (Map 1). Most of the thematic maps that are shown in this publication, as well as statistics, include only the mainland of the Barents Region (Map 2), excluding the Russian Arctic islands of Franz Josef Land and Novaya Zemlya, as our focus is on the boreal forest ecosystem. In 2020, the Norwegian Finnmark and Troms Regions were united as one region, but they will probably be separated again in 2024. Therefore, in this study, we show them separately in the maps and statistics, also for comparability reasons.
Map 1. Barents Euro-Arctic Region.

Map 2. Barents Euro-Arctic Region, excluding Franz Josef Land and the northern part of Novaya Zemlya.

The Barents Region consists of those national administrative regions that have joined the Barents Euro-Arctic Council. Therefore, in this report the regional definitions are administrative, and they are not based on any geographical feature (e.g., the drainage area of the Barents Sea). The newest member, North Karelia, joined the Barents Council in November 2016 and is included for the first time in the maps and analysis of the protected area network of the Barents Region. As the report discusses the change in the protected areas between 2013 and the end of 2020, it is important to note that these figures, at the whole Barents Region level, are not fully comparable, as the area of the Barents Region has expanded. Still, we see that they help us to understand the common picture.
In the Barents Region, the bioclimatic zones vary from the high Arctic zone in the north to the southern boreal zone in the south (Maps 3–4). Map 5 shows the bioclimatic zones in existing protected areas. In this study, the bioclimatic zones were updated to cover also North Karelia for the first time. Also, the elevation zone map was updated to cover North Karelia (Map 6).
Map 3. Bioclimatic zones in the Barents Region.

Map 4. Bioclimatic zones in the Barents Region, excluding Franz Josef Land and the northern part of Novaya Zemlya.

Map 5. Bioclimatic zones in existing protected areas in the Barents Region, excluding Franz Josef Land and the northern part of Novaya Zemlya.

Map 6. Elevation zones in the Barents Region, excluding Franz Josef Land and the northern part of Novaya Zemlya.

Map 7. Elevation zones in existing protected areas in the Barents Region, excluding Franz Josef Land and the northern part of Novaya Zemlya.

2. Definitions and data
Authors: Anna Kuhmonen, Jyri Mikkola, Denis Dobrynin
To make a comparable analysis on protected areas between four separate countries, it is very important to use unified definitions and criteria in defining protected areas and other information used. In this report, we compare the state of the protected area network in the Barents Region with the CBD Aichi Biodiversity Targets. We also describe the process of development of the protected area’s network from 2013 up until the results prepared in the current study. Thus, we use the CBD and IUCN definitions for protected areas, and the same methods used in the Barents Protected Area Network (BPAN) project in 2011–2014 (Aksenov et al., 2015).
The protected area datasets were updated in this study, but in the protected area analysis many background datasets used are the same as those used in the BPAN project, to guarantee the comparability of the results.
2.1. Definitions of protected areas
This study used the United Nations (UN) Convention on Biological Diversity (CBD) definition for a protected area:
“Protected area means a geographically defined area, which is designated or regulated and managed to achieve specific conservation objectives.”
As the definition states, a protected area is designated or regulated and managed to achieve specific conservation objectives; areas protected for other purposes are not included.
International Union for Conservation of Nature (IUCN) defines a protected area as follows:
“A clearly defined geographical space, recognized, dedicated and managed, through legal or other effective means, to achieve the long-term conservation of nature with associated ecosystem services and cultural values.”
Protected areas in the Barents Region differ from each other by legislative basis and management regulations; therefore, it is necessary to compare different kinds of protected areas (PAs) using a unified method. The experts of the BPAN project in 2011–2014 created a classification system for protected areas. It is based on the de jure protection status that PAs provide for terrestrial ecosystems, including inland waters (Tables 1 and 2). The focus in the classification is habitat protection that is provided by national legislation, either in certain PA categories wherever sufficient information has been available or in individual PAs. The region of North Karelia in Finland became a member of the Barents Region only in 2016 and has not been included in the previous studies. Thus, the protected area dataset for North Karelia was created in this study, including classifying North Karelia’s protected areas.
Table 1. The national categories of protected areas in the countries of the Barents Region, divided in classes according to the classification system for protected areas developed by the BPAN project in 2011–2014 (Aksenov et al. 2015).
| General classification | Detailed classification | |
| Norway | Class 1 Strong protection (general) = Class 1c Strong protection (detailed): – Officially established national parks, nature reserves, wildlife conservation areas (Nature Diversity Act) and natural monuments | |
| Class 2 Medium level protection (general) = Class 2 Medium level protection (detailed): – Officially established protected landscapes, protected landscapes with botanical and/or zoological protection of species, and other wildlife conservation areas | ||
| Class 3 Weak protection (general) = Class 3 Weak protection (detailed): – Officially established areas with botanical and/or zoological protection of species, i.e. but not protected landscapes. | ||
| Sweden | Class 1 Strong protection (general) = Class 1c Strong protection (detailed): – All established national parks – Officially established nature reserves with strong or medium-level protection regimes, according to national classification – All newly established PAs (since 01/01/2012) – All Natura 2000 areas, except protected rivers | |
| Class 2 Medium level protection (general) = Class 2 Medium level protection (detailed): – SNUS Project areas (for Norrbotten and Västerbotten) protected on state land, managed by the National Property Board of Sweden (Fastighetsverket) and the Swedish Fortification Agency (Fortificationverket) | ||
| General classification | Detailed classification | |
| Finland | Class 1 Strong protection: – All officially established PAs on state land, established under the Nature Conservation Act – All the other protected state lands, reserved to be officially established as class 1 PAs (already managed by Parks & Wildlife Finland, Metsähallitus) – Most of officially established PAs on private land, except for PAs that are classified as IUCN category V PAs in the official PA data. All areas reserved under national Nature Conservation Programmes, except for the Shoreline Protection Programme, the Esker Protection Programme, and the waters and mineral soil areas belonging to the Mire Protection Programme – Natura 2000 areas protecting habitats under the Nature Conservation Act (except for areas belonging to the Shoreline Protection Programme) or the Wilderness Act | Class 1a Full protection: – 2 strict nature reserves – 1 strict restriction zone of a national park Class 1b Strict protection: – 10 strict nature reserves – Strict restriction zones of 4 national parks – 2 special nature reserves Class 1c Strong protection: – All officially established PAs that are not class 1a or 1b, established under the Nature Conservation Act (except for PAs that are classified as IUCN category V PAs in the official PA data) – National parks, excluding strictly protected zones – Other protected areas on state lands, apart from those in classes 1a and 1b – Natura 2000 areas, protecting habitats under the Nature Conservation Act (except for areas belonging to the Shoreline Protection Programme) or the Wilderness Act – Other state land reserved for class 1c PAs (managed by Parks and Wildlife Finland) – All areas reserved under national nature conservation programmes, except for the Shoreline Protection Programme, the Esker Protection Programme, and the waters and mineral soil areas belonging to the Mire Protection Programme. |
| Class 2 Medium level protection (general) = Class 2 Medium level protection (detailed): – Officially established PAs on private land that are classified as IUCN category V PAs in the official PA data. – Areas protected under the Wilderness Act that are not Natura 2000 areas - waters and mineral soil areas belonging to the Mire Protection Programme. – Areas reserved under the national Shoreline Protection Programme or the Esker Protection Programme – Natura 2000 areas, protecting habitats under legislation other than the Nature Conservation Act or the Wilderness Act | ||
| General classification | Detailed classification | |
| Russia | Class 1 Strong protection: – Strict nature reserves (zapovednik) – Zones of full, strict or strong protection in national parks – Nature reserves and nature monuments, established under separate regulations, meeting the criteria above – 1 botanical garden – 1 protected landscape – Local PAs, established under separate regulations, meeting the criteria above | Class 1a Full protection: – Several parts of 7 strict nature reserves – Zones of full protection in 7 national parks – Part of 1 nature monument Class 1b Strict protection: – Several parts of 3 strict nature reserves – Zone of strict protection in 2 national parks – 2 nature reserves and parts of 2 nature preserves Class 1c Strong protection: – Zones of strong protection in national parks – Nature reserves and nature monuments, established under separate regulations, meeting the criteria above – 3 botanical gardens – 1 protected landscape – Local PAs, established under separate regulations, meeting the criteria above |
| Class 2 Medium level protection (general) = Class 2 Medium level protection (detailed): – Zones of national parks that do not have strict or strong regulations, according to the criteria above – The only nature park in the BEAR part of Russia – Nature reserves and nature monuments, established under separate regulations, meeting the criteria of class 2 but not class 1 protection – Local PAs, established under separate regulations, meeting the criteria above | ||
| Class 3 Weak protection (general) = Class 3 Weak protection (detailed): – Nature reserves and nature monuments established under separate regulations, meeting the criteria of class 3 but not class 1 or 2 protection (for example, game reserves that often prohibit only hunting) – Some zones of national and nature parks could be classified in this class (although none in the Barents Region) – 2 genetic reserves – 1 health resort– 1 historical and natural museum – Local PAs, established under separate regulations that don’t meet the criteria of classes 1 and 2 | ||
Table 2. In the BPAN classification system of protected areas, different classes have been defined according to legal regulations regarding various activities, such as mining, logging, or public access. The classification system was developed by the BPAN project in 2011–2014 (Aksenov et al. 2015).
| BPAN class | Logging | Mining/drilling | Construction, draining, ploughing natural grasslands etc. | Fishing, hunting, berry picking, mushroom picking, reindeer herding, and associated access | General public access | Access restricted to special cases |
| Class 1a | Prohibited unless the PA is treeless | Prohibited | Prohibited | Prohibited | Prohibited or limited to certain roads, trails and/or visitor centre | Allowed |
| Class 1b | Prohibited unless the PA is treeless | Prohibited | Prohibited | One or more of these activities are allowed, but only for indigenous people and/or the local population | Prohibited or limited to certain roads, trails and/or the visitor centre | Allowed |
| Class 1c | Prohibited unless the PA is treeless (though, for example, limited use of timber for firewood etc. inside the PA can be allowed in large PAs) | Prohibited | Prohibited | Allowed/ regulated/ prohibited; different combinations possible | Allowed/ regulated | Allowed |
| Class 2 | One or two of the three types of activities are prohibited, while the rest are either fully allowed or insufficiently restricted | Varies | Varies | Varies | ||
| Class 3 | Allowed or insufficiently restricted | Allowed or insufficiently restricted | Allowed or insufficiently restricted | Varies | Varies | Varies |
The BPAN protected area classification provides a unified way to describe and compare the actual conservation situation in different parts of the Barents Region, and a tool to evaluate the representativeness of the protected area network. This classification was used in the BPAN project in 2011–2014 and in a follow-up project in 2015–2017. The data of classified protected areas were used as such, and only newly established protected areas were classified in this study. Exception was Finland, where the whole situation was updated due to more accurate data available than in 2013. However, in some cases the status of individual protected area has changed, and, in these cases, the protected areas were re-classified. An overview of existing and planned PAs in the Barents Region, including classification, is provided in Chapter 3. As the protected areas of Russian regions vary from a weak to a strong protection level, their classification is described in Chapter 3 as better than Nordic protected areas, which are mostly strongly protected.
2.2. Data on protected areas
In Nordic countries, the datasets of protected areas were compiled from national datasets, which are mostly open data.
The dataset of Norwegian protected areas is prepared by the Norwegian Environment Agency (NEA) and Norwegian Mapping Authority. It was downloaded from Geonorge.no. The dataset includes protected areas that were established or officially planned by the 1st of January 2021.
The Swedish dataset on protected areas was compiled and classified by the County Administrative Boards of Norrbotten and Västerbotten, using the protected area datasets prepared by the Swedish Environmental Protection Agency and the County Administrative Boards of Norrbotten and Västerbotten. The dataset includes protected areas that were established or officially planned by the 1st of January 2021.
The Finnish dataset on protected areas was compiled and classified in the Finnish Environment Institute, utilising several datasets, including protected areas and wilderness areas of Finland (Source: Metsähallitus), Natura 2000 areas of Finland (Source: Finnish Environment Institute), national nature conservation programmes of Finland (Source: Finnish Environment Institute), Finnish State property for nature conservation purposes (Source: Metsähallitus) and Finnish State property managed by Parks & Wildlife Finland (Source: Metsähallitus). Planned protected areas were compiled using the datasets on regional land-use planning of Lapland, Northern Ostrobothnia, Kainuu and North Karelia (Source: Regional Councils of Lapland, Northern Ostrobothnia, Kainuu and North Karelia). Due to technical issues, the Finnish data are dated as autumn 2021. However, this different date does not greatly affect the results.
The Russian dataset on protected areas was compiled by the Finnish Environment Institute, using as a basis the datasets compiled in the previous study on PA network. The dataset on the Russian protected areas was updated based on an analysis of legal acts and available spatial data, with support from consultations with Russian regional experts. The consultations were conducted with representatives of the following institutions: Kola Biodiversity Conservation Centre, Karelia Nature Conservancy SPOK, Centre Nature Management Environmental protection of the Arkhangelsk Region, WWF-Russia, Silver Taiga Foundation, Centre for the Functioning of Protected Areas and Nature Management of the Republic of Komi. Each newly created, protected area was assigned a class in accordance with the BPAN classification of protected regimes. The dataset includes protected areas that were established or officially planned by the 1st of January 2021.
2.3. Data on land cover
In the BPAN project in 2011–2014 experts carried out an analysis on how various biotope groups or ecosystems were represented in the protected area network, and a similar up-to-date analysis is presented in this report. For this purpose, harmonised GIS data on ecosystems, unified for the whole study territory, was prepared. The two key demands for the unified dataset were A) spatial accuracy (the maps created should be detailed enough and have the spatial resolution equal to or better than that of the PA boundaries) and B) a compatible system of land cover classes covering the whole region should be available. (Aksenov et al. 2015)
In this study the unified land cover data, harmonised from the BPAN project in 2011–2014, were used for Norway and Russia. For Sweden and Finland, the more accurate data already used in the 2015–2017 study, were used also in this study. Additionally, the data for North Karelia were prepared in a similar way, using the same national CORINE Land Cover dataset as for the other Finnish regions.
In the unified land cover dataset for Norwegian regions, the vectorised and nationally verified CORINE Land Cover 2006 (CLC2006) product (CORINE Land Cover is one of four land cover maps - AR5, AR50, AR250 and CLC - published by Skog og Landskap), with the scale of 1:100 000, was used already in the 2011–2014 study. CLC was produced with support from the European Environmental Agency (EEA), which has a joint ownership of the product.
For the Finnish regions the national CORINE Land Cover 2012 (CLC2012) product with a scale of 1: 100 000 and spatial resolution of 20 metres was used in this study. The Finnish national CLC2012 is based on a satellite image interpretation combined with information from GIS-databases on land use and soil types. Note, that in the BPAN project in 2011–2014 the national CORINE Land Cover 2006 (CLC2006) product with spatial resolution of 25 metres (e.g., with a wider set of classes, distinguishing more types of forests) was used, and thus, the analysis of representativeness of the ecosystems is not fully comparable for Finnish regions between 2013 and 2020.
For Sweden, the preliminary version of the Exhaustive Biotope Mapping of Sweden (Heltäckande Naturtypkartering KNAS6, Metria 2014) was used in this study, as well as in the previous study in 2015–2017 (Kuhmonen et al., 2017). It is based on 10-metre resolution satellite image data, combined with an elevation model and information obtained from 1: 50 000 and 1: 100 000 maps, and data from previous KNAS mapping projects. Areas representing individual ecosystems were created by generalisation of pixel groups. However, in the BPAN project in 2011–2014, the standard CORINE 250-metre resolution data (data of the European Topic Centre on Land Use and Spatial Information, 2010) was used, as the more accurate data was not available for the project use. The CORINE data 250 m are not so accurate, and therefore the analysis of representativeness of the ecosystems between 2013 and 2020 is not fully comparable in the Swedish regions.
For the Russian regions, the land cover data produced by the project “Ecological Gap Analysis of Northwest Russia” (Kobyakov 2011, Kobyakov & Jakovlev 2013), and later updated by the BPAN and other projects (Aksenov et al. 2015) were used. The data were produced with Landsat TM/ETM+ data and scale 1: 200 000.
2.4. Data on administrative boundaries
Correct and accurate national and regional administrative boundaries, including the marine coastline, are important for creating accurate maps and analysing reliable statistics. The same datasets were used as in previous studies; border for North Karelia was added using the same Finnish dataset as for the other Finnish regions.
For Norway, Sweden and Finland, this study used the administrative boundary datasets of basic topography maps, which are open data. They are detailed and accurate enough in 1: 25 000 – 1: 50 000 scales. The delineation of the state border between Finland and Russia was taken from the Finnish basic topography maps, as they are noticeably more accurate and detailed than their Russian counterparts. Similarly, the delineation of the Russian-Norwegian state border was extracted from the Norwegian basic topography map. The marine coastline for Norway was composed using the satellite-derived land cover dataset (N250 Kartdata som landsdekkende filbasert geodatabase). The marine coastlines for Sweden were composed based on the CORINE BIOTOPE dataset. The Finnish coastline was composed according to the Finnish Environment Institute’s MERI 10 dataset.
For Russian administrative boundaries, this study used the dataset that was prepared in the “Ecological Gap Analysis of Northwest Russia” project (Kobyakov 2011, Kobyakov & Jakovlev 2013). The terrestrial boundaries between the Russian regions were based on the most detailed boundaries of forest management units available at the time. Their accuracy is satisfactory for the 1: 200 000 scale. The delineation of the marine coastlines of Russia are presented according to recent Landsat satellite data.
Re-classification of each national dataset into unified classification is described in table 3.
Table 3. Re-classification scheme for land cover in Norway, Sweden, Finland, and Russia.
| General landcover class of this study | CLC2006 class, Norway | Sweden, KNAS6 class | Finland, national CLC 2012 class | Russian dataset landcover class | |
 | Coniferous forest | 3.1.2 - Coniferous forest | 2, 32 - Spruce forest 102 - Spruce forest on fells 1, 31 - Pine forest 3, 33 - Mixed coniferous forest 101 - Pine forest on fells 103 - Mixed coniferous forest on fells 11 - Non-productive forest 22, 55 Non-productive forest on peatland 133 - Vegetation with higher structure (mire) | 3121 - coniferous forests on mineral soils 3122 - coniferous forests on peatland 3123 - Coniferous forests on rocky areas 3243 - Sparsely wooded areas, canopy cover 10-30%, on peatland 3244 - Sparse forests, canopy cover 10-30%, on rocky areas | 1 - Forests dominated by dark conifer species 2 - Green moss pine forests 3 - Dry pine forests 4 - Sphagnum pine forests |
 | Mixed forest | 3.1.3 - Mixed forest | 5 - Mixed coniferous - deciduous forest 4, 34 - Forest on peatland, proportion of deciduous trees < 70% 105 - Mixed coniferous - deciduous forest on fells 10, 40 - Young forests, including areas of final felling | 3131 - Mixed coniferous - deciduous forest on mineral soil 3132 - Mixed coniferous - deciduous forest on peatland 3133 - Mixed coniferous - deciduous forest on rocky areas | 6 - Mixed decidious - coniferous forests |
 | Deciduous forest | 3.1.1 - Broad-leaved forest 3.2.4 - Transitional woodland/shrub | 6, 36 - Deciduous small-leaved forest 106 - Mountain birch forest 132 - Vegetation with higher structure (not mire) | 3111 - Deciduous small-leaved forest on mineral soil 3112 - Deciduous small-leaved forest on peatland 3242 - Sparsely wooded areas, canopy cover 10-30%, on mineral soil 3246 - Sparsely wooded areas, underneath electric power lines | 5 - Deciduous small-leaved forests 10 - Clearcut areas 11 - Fire scars 12 - Windfalls (wind throw areas) 19 - Bare clearcut areas |
 | Open wetland | 4.1.1 - Inland marshes 4.1.2 - Peatbogs 35 - Inland marshes | 12 – Wetland 13 - Other wetland 131 -Wegetation with low structure (mire) 131 - Wetland on fells (open) 133 - Wetland on fells (with bushes/individual trees) | 4111 - Freshwater wetlands on ground 4112 - Freshwater wetlands on water 4121 - Open mires and fens 4211 - Coastal wetlands on ground 4212 - Coastal wetlands on water | 7 - Sphagnum-dominated bogs 8 - Sedge and grass mires and fens 9 - Wet fens and mires with open water surface |
 | Grassland | 3.2.1 - Natural grassland 2.3.1 - Pastures | 18 - Pasture 20 - Other open land | 2311 - Pastures 2312 - Natural pastures 3211 - Natural meadows | 17 - Grasslands |
 | Tundra vegetation | 3.2.2 - Moors and heath land 3.3.3 - Sparsely vegetated areas | 130 - Vegetation with low structure (not mire), open vegetated land on fells | 3221 - Heath and shrub 3241 - Sparsely wooded areas, canopy cover < 10% 3331 - Mineral soils with sparse vegetation | 14 - Sparse tundra- and mountain vegetation |
 | Natural lack of vegetation | 3.3.1 - Beaches, dunes and sand plains 4.2.3 - Intertidal flats 3.3.2 - Bare rock | 19 - Bare ground 129 - Bare ground on fells | 3311 - Shoreline sands and dunes 3321 - Bare rocks | 18 - Beaches, bare rock and other naturally bare ground |
 | Glacier | 3.3.5 - Glaciers and perpetual snow | 126 - Perpetual snow and ice | 20 - Snow and ice | |
 | Agricultural lands | 2.1.1 - Non irrigated arable land 2.4.2 - Complex cultivation 2.4.3 - Land principally occupied by agriculture, with significant areas of natural vegetation | 16 - Cultivated land 17 Meadow | 2111 - Fields 211 - Mosaic of fields and meadows 2221 - Fruit tree and berry plantations 2431 - Abandoned agricultural land | 16 - Cropland |
 | Developed area | 1.1.1 - Continuous urban fabric 1.1.2 - Discontinuous urban fabric 1.2.1 - Industrial or commercial units 1.2.2 - Road and rail networks and associated land 1.2.3 - Port areas 1.2.4 - Airports 1.3.1 - Mineral extraction sites 1.3.2 - Dump sites 1.3.3 - Construction sites 1.4.1 - Green urban areas 1.4.2 - Sport and leisure facilities | 21 - Developed area 15 - Peat quarry | 1111 - Block house areas 1112 - Small house areas 1211 - Service areas 1212 - Industrial areas 1221 - Traffic areas 1231 - Harbors 1241 - Airfields 1311 - Quarries 1312 - Mines 1321 - Dumps 1331 - Construction sites 1421 - Summer cottages 1422 - Other sports and leisure time activity areas 1423 - Golf courses 1424 - Horse racing tracks 4122 - Peat quarries | 15 - Converted areas with no vegetation |
 | Water | 5.1.1 - Water courses 5.1.2 - Water bodies 5.2.3 - Sea and ocean | 23 - Freshwater 25 - Sea | Rivers Lakes Sea | 13 - Water |
2.5. Data on bioclimatic zones
In this study, the data on bioclimatic zones were used to prepare map 3, presented in Chapter 1. The unified data used were prepared in the BPAN project in 2011–2014, and similar data were prepared for North Karelia.
While preparing the data, Transparent World and Finnish Environment Institute utilised the Arctic atlas (www.arcticatlas.org/about/), Finnish National Atlas (Hämet Ahti zones map for the whole Barents Region) and the National Atlas of Norway Vegetation (Norwegian Mapping Authority). The detailed description of the data is published in the previous studies (Aksenov et al., 2015).
2.6. Data on elevation zones
In this study, data on elevation zones were used to prepare map 4, presented in Chapter 1. Data on elevation zones were prepared by the Finnish Environment Institute for this study. Merit DEM was used as the basis for the preparation of the maps on elevation zones. Merit DEM is a high-precision global elevation matrix, obtained by removing major errors from previous digital elevation models. Merit DEM improves data using multiple satellite datasets and filtering methods. Significant improvements were found in flat regions, where height errors in the previous digital elevation models exceeded topography variability and landscapes, such as river networks, hills, and valley structures. The original Merit DEM section was trimmed with borders of the Barents Region and divided into 9 elevation zones: 0–50m, 50–100m, 100–150m, 150–200m, 200–300m, 300–500m, 500–750m, 750–1000m, >1000m.
2.7. Data on high conservation value forests
In this study, data on high conservation value forests were used to study the development in conservation of high conservation value forests between 2016 and 2020. The data used were prepared in the previous study in 2015–2017 for Swedish, Finnish, and Russian regions belonging to the Barents Region. Method and source data used are described in detail in the published report (Kuhmonen et al., 2017). For Norway and North Karelia, Finland, such data do not exist; therefore, figures concerning HCV forest protection in Norway and North Karelia are not included in this study.
3. Changes in the protected area coverage in the Barents Region 2013–2020
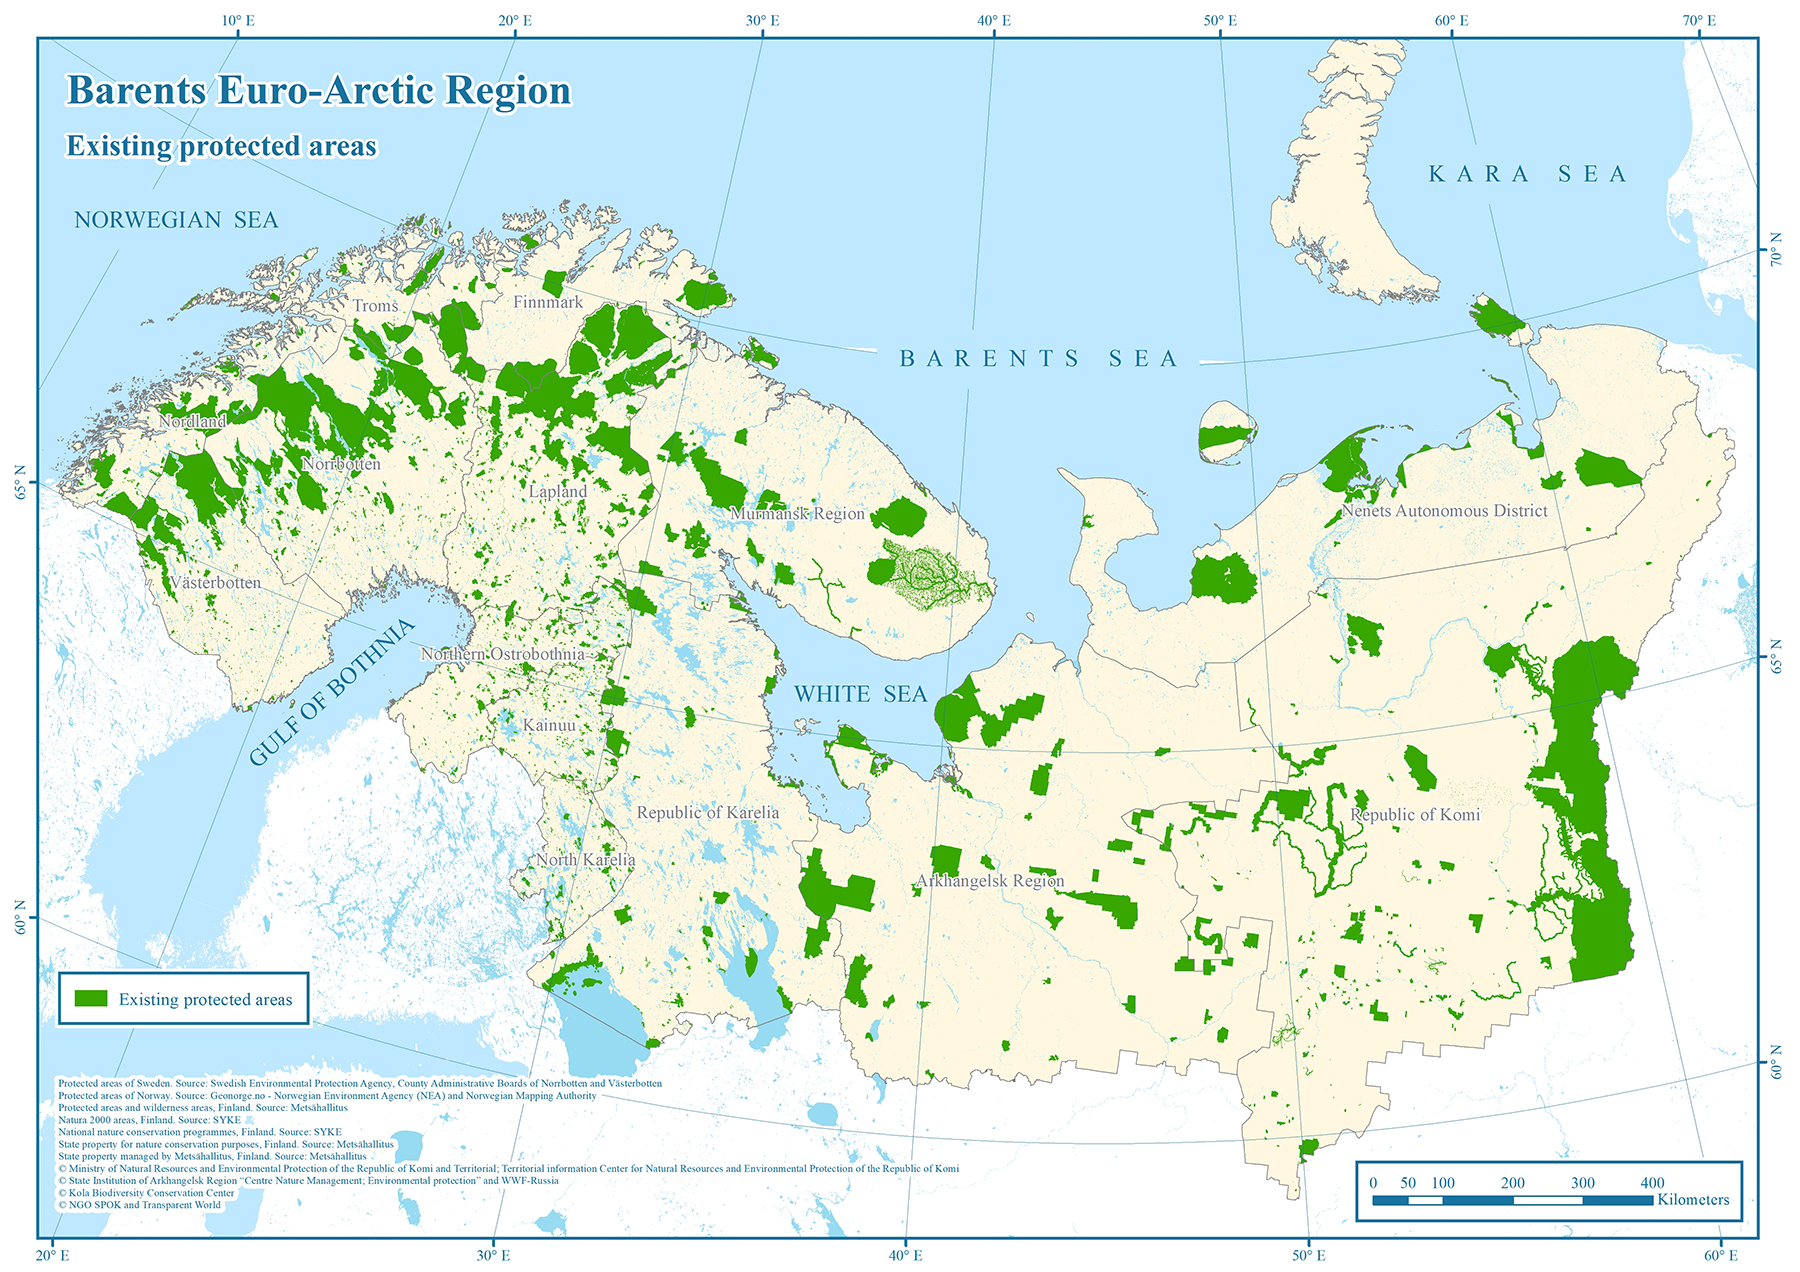
The progress in development of the protected area network, from 2013 to the end of 2020, is discussed in this chapter. The coverage of the protected areas in the Barents Region was studied by the BPAN project in March 2013 (Aksenov et al. 2015). As we do not have comparable data for 2013 for North Karelia, the newest member of the Barents Region, we exclude it from the comparisons in some cases. The protected areas are shown in Map 8 for the Barents Region, excluding Franz Josef Land and the northern part of Novaya Zemlya, and in Map 9 also planned protected areas are included. The protected areas cover 258 181 km2, or 14,5%, of the whole terrestrial part of the Barents Region (Map 9, Table 4).
Map 8. Existing protected areas in the Barents Region, excluding Franz Josef Land and the northern part of Novaya Zemlya.
Map 9. Existing and planned protected areas in the Barents Region, excluding Franz Josef Land and the northern part of Novaya Zemlya.

In the Barents Region, the coverage of protection has increased between 2013 and the end of 2020, from 231 112 km2 to 256 350 km2, when we exclude North Karelia and the Russian Arctic islands of Franz Josef Land and Novaya Zemlya (Map 8, Table 4). At the same time, the protection level has increased from 13,1% to 14,5% (Table 4). If we compare the situation with the 17% threshold of the CBD Aichi Biodiversity Target, the protection level remains 2,5% units below the threshold (Table 4).
Finnish and Swedish study areas exceed the 17 % threshold and at the same time Norwegian and Russian study areas remain under it (Table 4, Figure 2). The progress with the highest increase in the protection level (% units) was in the Finnish study area (excluding North Karelia), from 23,2% to 25,5% (2,3% units). The progress in the Russian study area (excluding Novaya Zemlya and Franz Josef Land) increased from 9,6% to 11,2% (1,6% units), in the Swedish study area from 22,7% to 23,7% (1,0% units), and in the Norwegian study area from 14,6% to 15,1% (0,5% units). (Table 4, Figures 2 and 3)
The progress with the largest protection area (km2) has been 19 573 km2 in the Russian study area (including Franz Josef Land and northern part of Novaya Zemlya, from 139 704 km2 to 159 277 km2), following with the Finnish study area 3 614 km2 (from 37 326 km2 to 40 940 km2), the Swedish study area 1 533 km2 (from 37 588 km2 to 39 121 km2), and the Norwegian study area 518 km2 (from 16 494 km2 to 17012 km2) (Table 4, Figures 1 and 4).
Table 4. Total area of existing protected areas in the study area in 2013 and 2020, by country, (km2, %).
| Existing protected areas, km2 | Progress in protection, km2 | Coverage of existing protected areas, % of the total terrestrial BEAR area of each country | Progress in protection, % units | |||
| 2013 | 2020 | 2013 | 2020 | |||
| Norway | 16 494 | 17 012 | 518 | 14,6 | 15,1 | 0,5 |
| Sweden | 37 588 | 39 121 | 1 533 | 22,7 | 23,7 | 1,0 |
| Finland (excluding North Karelia) | 37 326** | 40 940 | 3 614 | 23,2 | 25,5 | 2,3 |
| Finland * | - | 42 771 | - | - | 23,3 | - |
| Russia (excluding Franz Josef Land and Novaya Zemlya) | 116 860 | 136 433 | 19 573 | 9,6 | 11,2 | 1,6 |
| Russia | 139 704 | 159 277 | 19 573 | 10,6 | 12,1 | 1,5 |
| Barents Region (excluding North Karelia, Franz Josef Land and Novaya Zemlya) | 231 112 | 256 350 | 25 238 | 13,1 | 14,5 | 1,4 |
| Barents Region* | - | 258 181 | - | - | 14,5 | - |
| * In 2013 North Karelia was not a member of the Barents Region and the figures for 2013 do not include North Karelia. ** PA area of Finland in 2013 has been corrected from statistics published in Aksenov et al. 2015, and shown as corrected in Kuhmonen et al. 2017. | ||||||
Figure 1. Total area of existing protected areas (km2) in the study area in 2013 and 2020, by country.
| * In 2013, North Karelia was not a member of the Barents Region, and the figures for 2013 do not include North Karelia. ** PA area of Finland in 2013 has been corrected from statistics published in Aksenov et al. 2015 and shown as corrected in Kuhmonen et al. 2017. | ||
Figure 2. Protected area coverage (%) in the study area in 2013 and 2020, by country.
| * In 2013, North Karelia was not a member of the Barents Region, and the figures for 2013 do not include North Karelia. ** PA area of Finland in 2013 has been corrected from statistics published in Aksenov et al. 2015 and shown as corrected in Kuhmonen et al. 2017. | ||
Figure 3. Progress in protection level (% units) in the study area 2013–2020, by country.
| * In 2013, North Karelia was not a member of the Barents Region, and the figures for 2013 do not include North Karelia. ** PA area of Finland in 2013 has been corrected from statistics published in Aksenov et al. 2015 and shown as corrected in Kuhmonen et al. 2017. | ||
Figure 4. Progress in total protected area (km2) in the study area 2013–2020, by country.
| * In 2013, North Karelia was not a member of the Barents Region, and the figures for 2013 do not include North Karelia. ** PA area of Finland in 2013 has been corrected from statistics published in Aksenov et al. 2015 and shown as corrected in Kuhmonen et al. 2017. | ||
The largest total areas under protection at the end of 2020 were in the Republic of Komi (60 539 km2), Lapland (34 256 km2), the Arkhangelsk Region (27 026 km2) and Norrbotten (28 153 km2) (Table 5, Figure 5).
At the end of 2020, four of the 14 regions belonging to the Barents Region have exceeded the 17% threshold stated in the CBD Aichi Biodiversity Target 11. These regions are Lapland (34,6%), Norrbotten (26,6%), Nordland (19,4%) and Västerbotten (18,5%). Of these four, in 2013 Västerbotten was below the 17% threshold. The Russian Arctic islands of Novaya Zemlya and Franz Josef Land, which belong to the Arkhangelsk Region, have their protection level at 23,6%. They cover only Arctic areas and as in this study the focus is on boreal forests, the Arctic islands are presented separately in the regional figures. Ten other regions have their protection level below 17%, varying from 5,8% in the Republic of Karelia to 15,7% in Troms (Table 5, Figure 6).
The largest regional progress in increasing the protection level has been 6,5% units in Nenets Autonomous District, following with 3,8% units in Northern Ostrobothnia, 2,3% units in the Murmansk Region, 1,6% units in Västerbotten, 1,5% units in Lapland and 1,1% units in both the Republic of Karelia and Nordland (Table 5, Figure 7).
The region with the highest increase in protected area (km2) was the Nenets Autonomous District (11 401 km2), followed by the Murmansk Region (3260 km2), the Arkhangelsk Region (2 500 km2, excluding Franz Josef Land and Novaya Zemlya), Lapland (1 951 km2), the Republic of Karelia (1 932 km2) and Northern Ostrobothnia (1 432 km2) (Table 5, Figure 8).
Table 5. Total area (km2) and the regional coverage (%) of the existing protected areas in the Barents Region in 2013 and 2020 and the progress of protection, by region.
| Existing protected areas, km2 | Progress in protection, km2 | Coverage of existing protected areas, % of the total terrestrial area of each region | |||
| 2013 | 2020 | 2013 | 2020 | ||
| Troms | 3 981 | 4 075 | 94 | 15,4 | 15,7 |
| Finnmark | 5 495 | 5 502 | 7 | 11,3 | 11,3 |
| Nordland | 7 017 | 7 435 | 418 | 18,3 | 19,4 |
| Norrbotten | 27 587 | 28 153 | 566 | 26,0 | 26,6 |
| Västerbotten | 10 001 | 10 968 | 967 | 16,9 | 18,5 |
| Lapland | 32 305** | 34 256 | 1 951 | 33,1 | 34,6 |
| Northern Ostrobotnia | 3 034 | 4 466 | 1 432 | 8,1 | 11,9 |
| Kainuu | 1 987 | 2 220 | 233 | 8,1 | 9,1 |
| North Karelia* | - | 1 829 | - | - | 8,0 |
| Murmansk Region | 16 255 | 19 515 | 3 260 | 11,3 | 13,6 |
| Republic of Karelia | 8 056 | 9 988 | 1 932 | 4,7 | 5,8 |
| Arkhangelsk Region (excluding Franz Josef Land and Novaya Zemlya) | 24 526 | 27 026 | 2 500 | 8,0 | 8,8 |
| Franz Josef Land and Novaya Zemlya | 22 844 | 22 844 | 0 | 23,6 | 23,6 |
| Nenets Autonomous District | 7 963 | 19 364 | 11 401 | 4,5 | 11,0 |
| Republic of Komi | 60 060 | 60 539 | 479 | 14,4 | 14,5 |
| Barents Region (excluding North Karelia, Franz Josef Land and Novaya Zemlya) | 108 897** | 117 068 | 8 171 | 13,1 | 14,5 |
| Barents Region* | - | 112 887 | - | - | - |
| * In 2013, North Karelia was not a member of the Barents Region, and the figures for 2013 do not include North Karelia. ** PA area of Finland in 2013 has been corrected from statistics published in Aksenov et al. 2015 and shown as corrected in Kuhmonen et al. 2017. | ||
Figure 5. Total area of existing protected areas (km2) in 2013 and 2020 in the study area, by region.
Figure 6. Protected area coverage (%) in the Barents Region in 2013 and 2020, by region.
Figure 7. The increase in the protected area coverage (% units) in the Barents Region 2013–2020, by region.
Figure 8. The increase of protected areas (km2) in the Barents Region 2013–2020, by region.
There was a total of 38 294 km2 of planned protected areas in the Barents Region at the end of 2020, and the largest areas were in the four regions of the Russian study area (Republic of Karelia, Nenets Autonomous District, Murmansk Region and Arkhangelsk Region) and in Norrbotten, Sweden (Table 6, Figure 9).
The biggest % of the total area of each region were in the Republic of Karelia (7,5%), Murmansk Region (5,7%), Nenets Autonomous District 4,8% and Norrbotten 2,6% (Table 6, Figure 10). If the protection plans of the Murmansk Region will be implemented, its protection level will increase above the 17% threshold (Figure 10).
The area of the planned protected areas decreased by 20 871 km2 in the Barents Region (excluding North Karelia), from 59 167 km2 to 38 270 km2, and from 3,4% to 2,2% between 2013 and the end of 2020 (Table 6). In some cases, the decision made about the implementation or adoption of the previously planned protection measures has been negative, and these areas have been removed from the protection plans. On the other hand, some areas have been established fully or partly as protected areas, which has changed their status from a planned protected area into a statutory protected area.
Table 6. Total area (km2) and the coverage (%) of the planned protected areas in the study area in 2013 and 2020, by region.
| Planned protected areas, km2 | Coverage of planned protected areas, % of total area of each region | |||
| 2013 | 2020 | 2013 | 2020 | |
| Troms | 80 | 3 | 0,3 | 0,0 |
| Finnmark | 1 599 | 0 | 3,3 | 0,0 |
| Nordland | 1 261 | 127 | 3,3 | 0,3 |
| Norrbotten | 2 702 | 2 758 | 2,5 | 2,6 |
| Västerbotten | 818 | 726 | 1,4 | 1,2 |
| Lapland | 11 | 116 | 0,0 | 0,1 |
| Northern Ostrobotnia | 6 | 3 | 0,0 | 0,3 |
| Kainuu | 4 | 29 | 0,0 | 0,1 |
| North Karelia* | - | 24 | - | 0,1 |
| Murmansk Region | 12 442 | 8 217 | 8,7 | 5,7 |
| Republic of Karelia | 14 759 | 12 969 | 8,7 | 7,5 |
| Arkhangelsk Region | 13 267 | 4 934 | 4,3 | 1,6 |
| Nenets Autonomous District | 11 731 | 8 388 | 6,6 | 4,8 |
| Republic of Komi | 488 | 0 | 0,1 | 0,0 |
| Barents Region (excluding North Karelia) | 59 167 | 38 270 | 3,4 | 2,2 |
| Barents Region* | - | 38 294 | - | - |
| * In 2013, North Karelia was not a member of the Barents Region, and thus the figures for 2013 do not include North Karelia. | ||||
Figure 9. The joint area of existing and planned protected areas (km2) in the study area, by region.
Figure 10. The joint coverage of existing and planned protected areas (%) in the study area, by region.
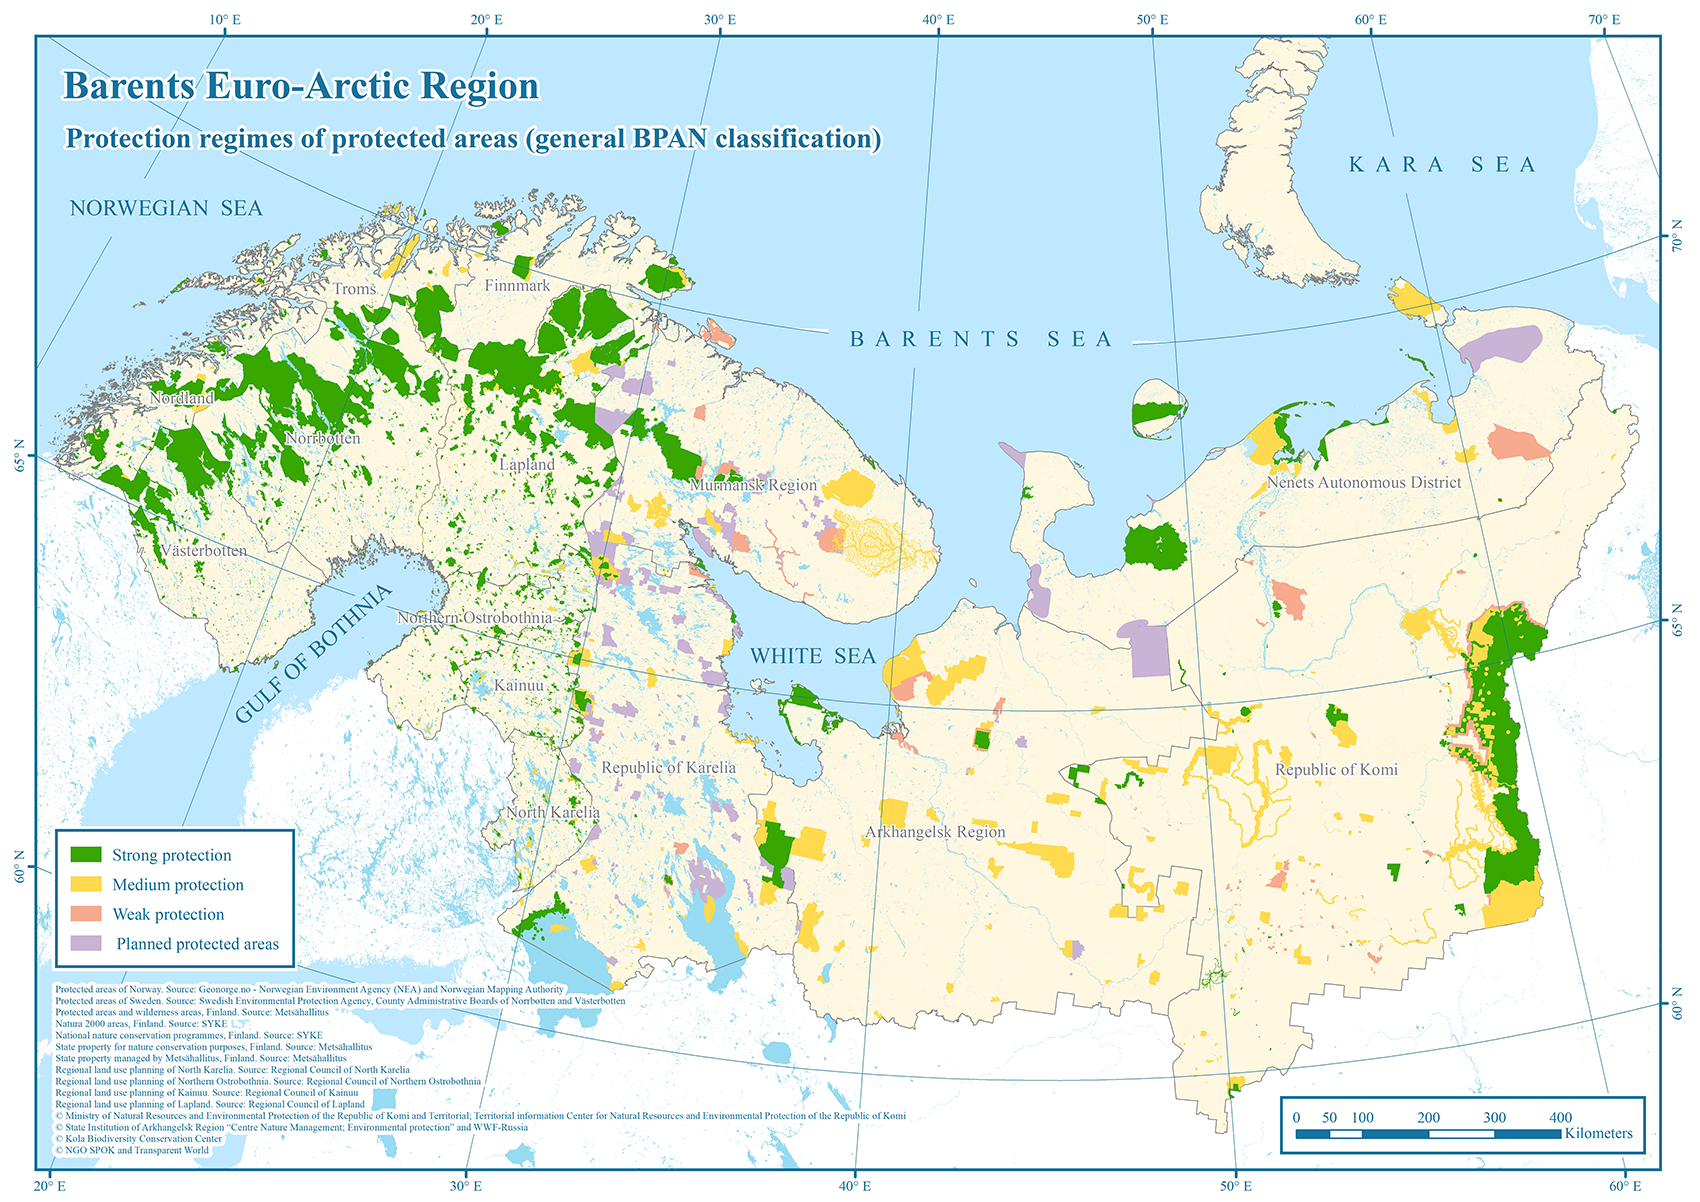
Protection strength according to the general BPAN classification and the detailed BPAN classification is presented in Maps 10 and 11 and in Tables 7 and 8. The detailed analysis of classified protected areas is presented in Aksenov et al. (2015) and the general picture remains still the same. In Nordic countries most of the protected areas are strongly protected (class 1c), whereas the regimes of Russian protected areas vary much more being mostly protected under medium protection (class 2) or full protection (class 1c).
Map 10. Protection regimes of protected areas in the Barents Region, excluding Franz Josef Land and the northern part of Novaya Zemlya (general BPAN classification).
Map 11. Protection regimes of protected areas in the Barents Region, excluding Franz Josef Land and the northern part of Novaya Zemlya (detailed BPAN classification).
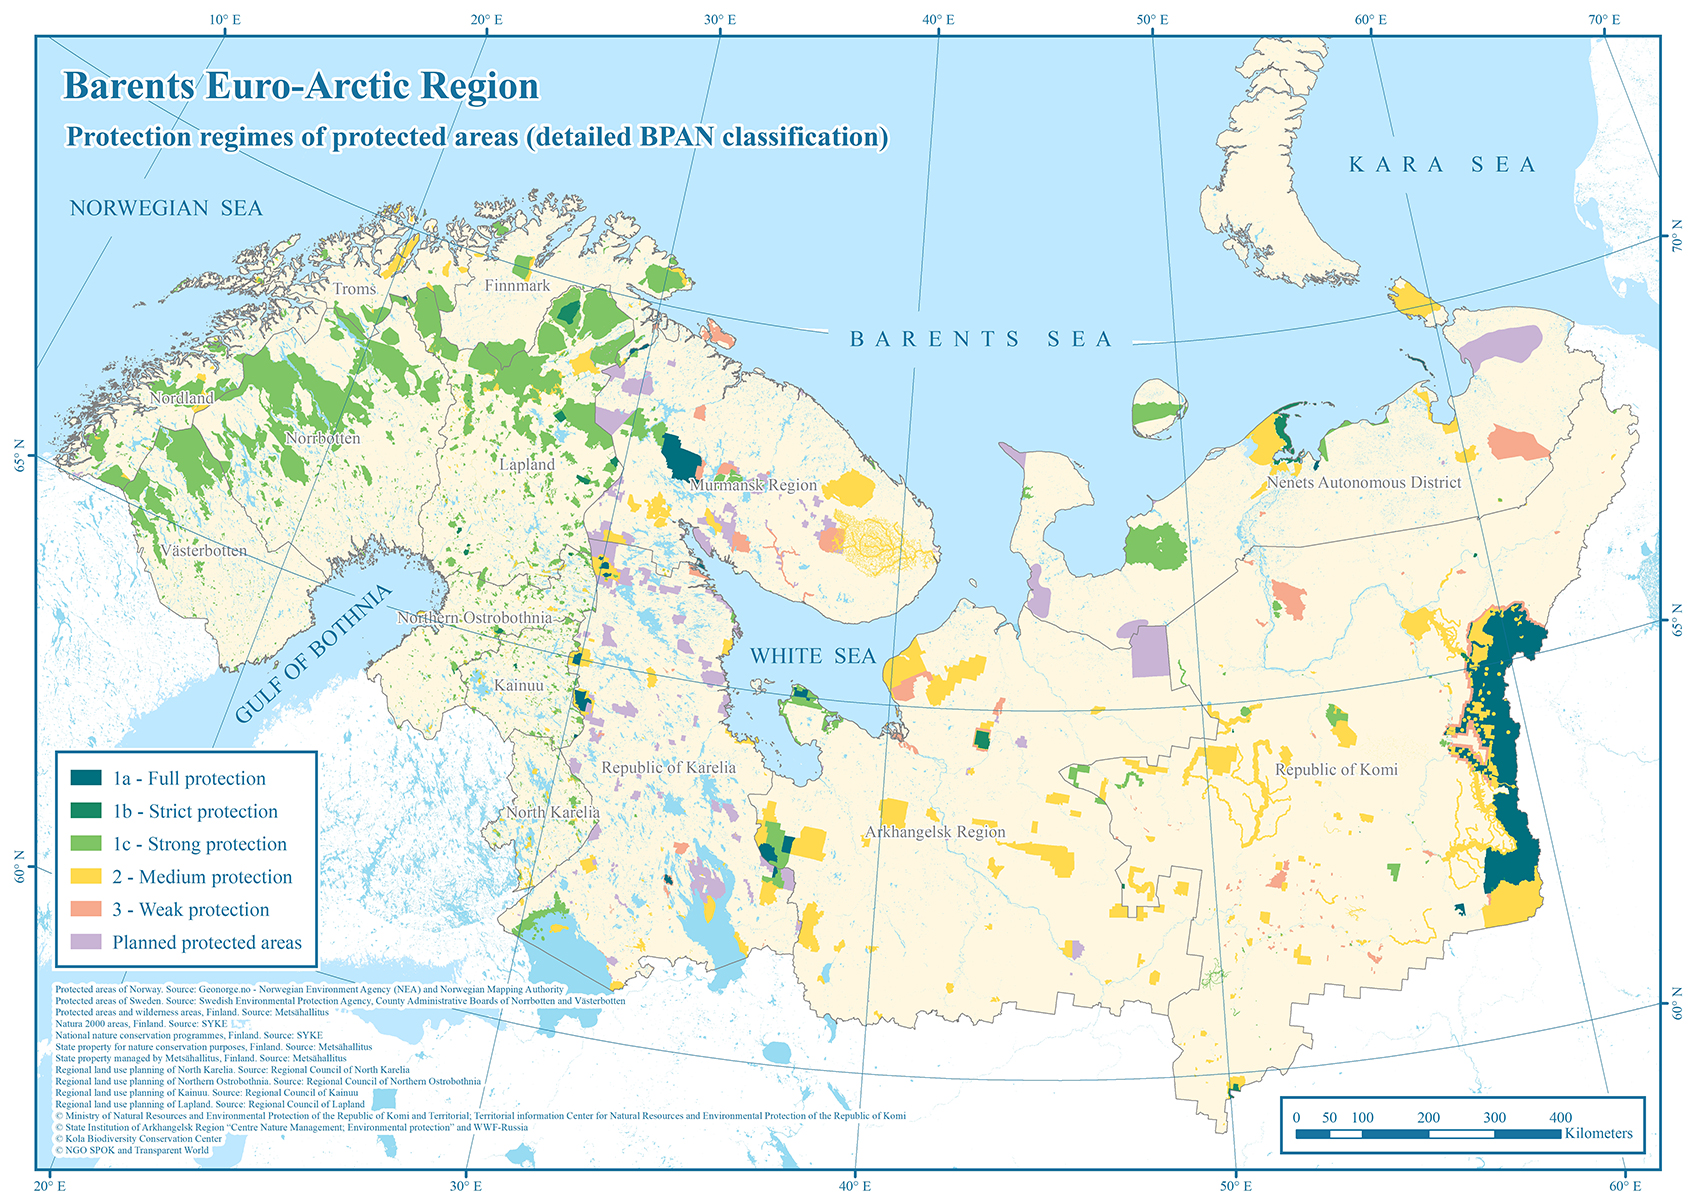
Table 7. The distribution of existing protected areas (km2) in relation to the detailed BPAN classification, by region.
| Norway | Sweden | Finland | Russia | |||||||||||||
| BPAN Class | Troms | Finnmark | Nordland | Norrbotten | Västerbotten | Lapland | Northern Ostrobothnia | Kainuu | North Karelia | Murmansk Region | Republic of Karelia | Arkhangelsk Region (excluding Novaya Zemlya and Franz Josef Land) | Nenets Autonomous District | Republic of Komi | Novaya Zemlya and Franz Josef Land | |
 | 1a - Full | 0 | 0 | 0 | 0 | 0 | 31 | 0 | 25 | 0 | 3 085 | 1 055 | 1 139 | 244 | 21 750 | 6 484 |
 | 1b - Strict | 0 | 0 | 0 | 0 | 0 | 1 298 | 115 | 29 | 22 | 16 | 2 | 517 | 1 190 | 381 | 0 |
 | 1c - Strong | 2 483 | 4 823 | 6 572 | 28 153 | 10 968 | 29 735 | 3 701 | 1 896 | 1 042 | 2 956 | 2 054 | 3 156 | 7 559 | 2 954 | 0 |
 | 2 - Medium | 1 592 | 619 | 859 | 0 | 0 | 3 193 | 650 | 269 | 765 | 9 556 | 5 904 | 20 302 | 7 033 | 29 037 | 16 360 |
 | 3 - Weak | 0 | 60 | 4 | 0 | 0 | 0 | 0 | 0 | 0 | 3 904 | 972 | 1 911 | 3 339 | 6 418 | 0 |
Table 8. The distribution of existing protected areas (km2) in relation to the detailed BPAN classification, by country.
| BPAN Class | Norway | Sweden | Finland | Russia (excluding Novaya Zemlya and Franz Josef Land) | |
| 1a - Full | 0 | 0 | 56 | 33 756 |
| 1b - Strict | 0 | 0 | 1 464 | 2 106 |
| 1c - Strong | 13 878 | 39 121 | 36 373 | 18 679 |
| 2 - Medium | 3 070 | 0 | 4 878 | 88 192 |
| 3 - Weak | 64 | 0 | 0 | 16 544 |
3.1. Protected area coverage in the Norwegian study area
Protected area system in Norway
The Norwegian protected area (PA) system is based on the Nature Diversity Act (Act of 19 June 2009 No. 100 Relating to the Management of Biological, Geological and Landscape Diversity). Most PA designations had already been adopted under the former Nature Conservation Act (1970) and other legislation. These designations have been formally reinforced in the legislation of the Nature Diversity Act.
Protected areas on land, in river systems and in the sea promote the conservation of landscapes, habitats, species and genetic diversity (the listing is not exhaustive). Individual sites are protected according to five main protection categories: national parks, protected landscapes, nature reserves, habitat management areas and marine protected areas (Table 9).
Table 9. The protected areas of the Norwegian study area by form of protection (km2, %).
| Form of protection | Number of PAs in total | Protected areas in total (km²) | Protected terrestrial areas (km²) | Share of protected terrestrial area (%) | Marine protection (km²) | Share of protected marine area of territorial waters (%) |
| All forms of protection | 3.170 | 61.962 | 56.799 | 17,5 | 5.162 | 3,5 |
| National park | 40 (18 in BEAR[1]) | 33.070 | 31.614 | 9,8 | 1.456 | 1 |
| Nature reserve | 2.457 | 9.159 | 7.554 | 2,3 | 1.606 | 1,1 |
| Protected landscape | 196 | 18.320 | 17.247 | 5,3 | 1.073 | 0,7 |
| Marine PA | 15 | 1.081 | 0 | 0 | 1.081 | 0,7 |
| Other forms of protection | 462 | 643 | 393 | 0,1 | 250 | 0,2 |
| * 18 national parks are located in the Norwegian regions belonging to the Barents Region (BEAR): Nordland, Troms and Finnmark Counties. | ||||||
| Note: Some areas fall into more than one protection scheme. That is why the total protected area sum is less than the sum of each different class put together. Note: These figures do not include protected areas in the Svalbard archipelago (including Bjørnøya/ Bear Island) or Jan Mayen Island, which do not belong to the Barents Region. All data presented in this table source Norway Statistics, SSB. | ||||||
Establishment of protected areas in Norway
Processes for the establishment of protected areas in Norway is described in detail in Aksenov et al. 2015 and has not been changed. Up until 2010, there were many ongoing processes for establishing new national parks, protected landscapes, and other PAs in Norway (i.e., mire and wetland protection, rich deciduous forest protection, etc.). Large areas were also investigated in connection to already protected areas, to include and cover connectivity issues between existing PAs. In the Finnmark region, in 2013, 1 599 km2 were suggested to be protected. Due to strong local resistance towards nature protection, the suggested areas were not protected[1]Suggested areas to be protected, Muvrrešáhpi, including Goahteluoppal in the Kautokeino municipality, the extension of Upper Anarjohka National Park in the Karasjok municipality, and a mire and wetland protection plan in the Finnmark region. All processes ended with no new protection due to local resistance. . Hence, the 0 km2 in the 2020 planned areas, in the study period 2013–2020, there have been no new protected areas on land in the Finnmark Region (Table 6).
In Troms, the planned protection areas in 2013 include 80 km2, mostly areas of rich deciduous forest, and are a part of a process that started in 2005 (Table 6). A letter from the County Governor, and a forest owners association called Allskog, dated 17.12.2007, concluded that 22 private forest areas in this plan were taken out and given to the forest owners association in order to proceed with the process in a project called Voluntary Protection. Many of these areas were not protected in 31.12.2021, as the process was not finalised due to local resistance. Part of the plan, which consisted of planned protection of forest areas owned by the State or the Church, were fulfilled and several areas were protected. Of these, 18 areas or ca. 140 km2 were proposed to be protected from the County Governor in 2011 and 2013. In the end, 15 new forest areas owned by the State and the Church were protected: one in 2016 and 14 in 2018, in total ca. 89 km2. In addition, two forest areas have been protected due to voluntary protection, in 2015, 2017 and one extension in 2019 (ca. 3 km2). At the end of 2020, there were only 3 km2 of planned protected areas on land left, and the protected areas on land in the region had increased by 94 km2 (Tables 5 and 6).
In Nordland, the planned protected areas in 2013 included 1 261 km2. At the end of 2020, the county of Nordland had increased its protected areas by 418 km2, to 7 435 km2 and 19,4% (Tables 5 and 6).
One of the big proposed national parks, Tysfjord-Hellemobotn (1 035 km2), never started the formal process, and the plans were withdrawn by the Environmental Agency due to local resistance in 2016. New protected areas between 2013–2020 in this region include one national park, Lofotodden (99 km2), desired by the local municipalities, an extension of another national park, Saltfjellet og Svartisen (85 km2), and the rest were the protection of biologically very important forest areas owned by the State in southern Nordland.
Changes in the protected area coverage in the Norwegian regions
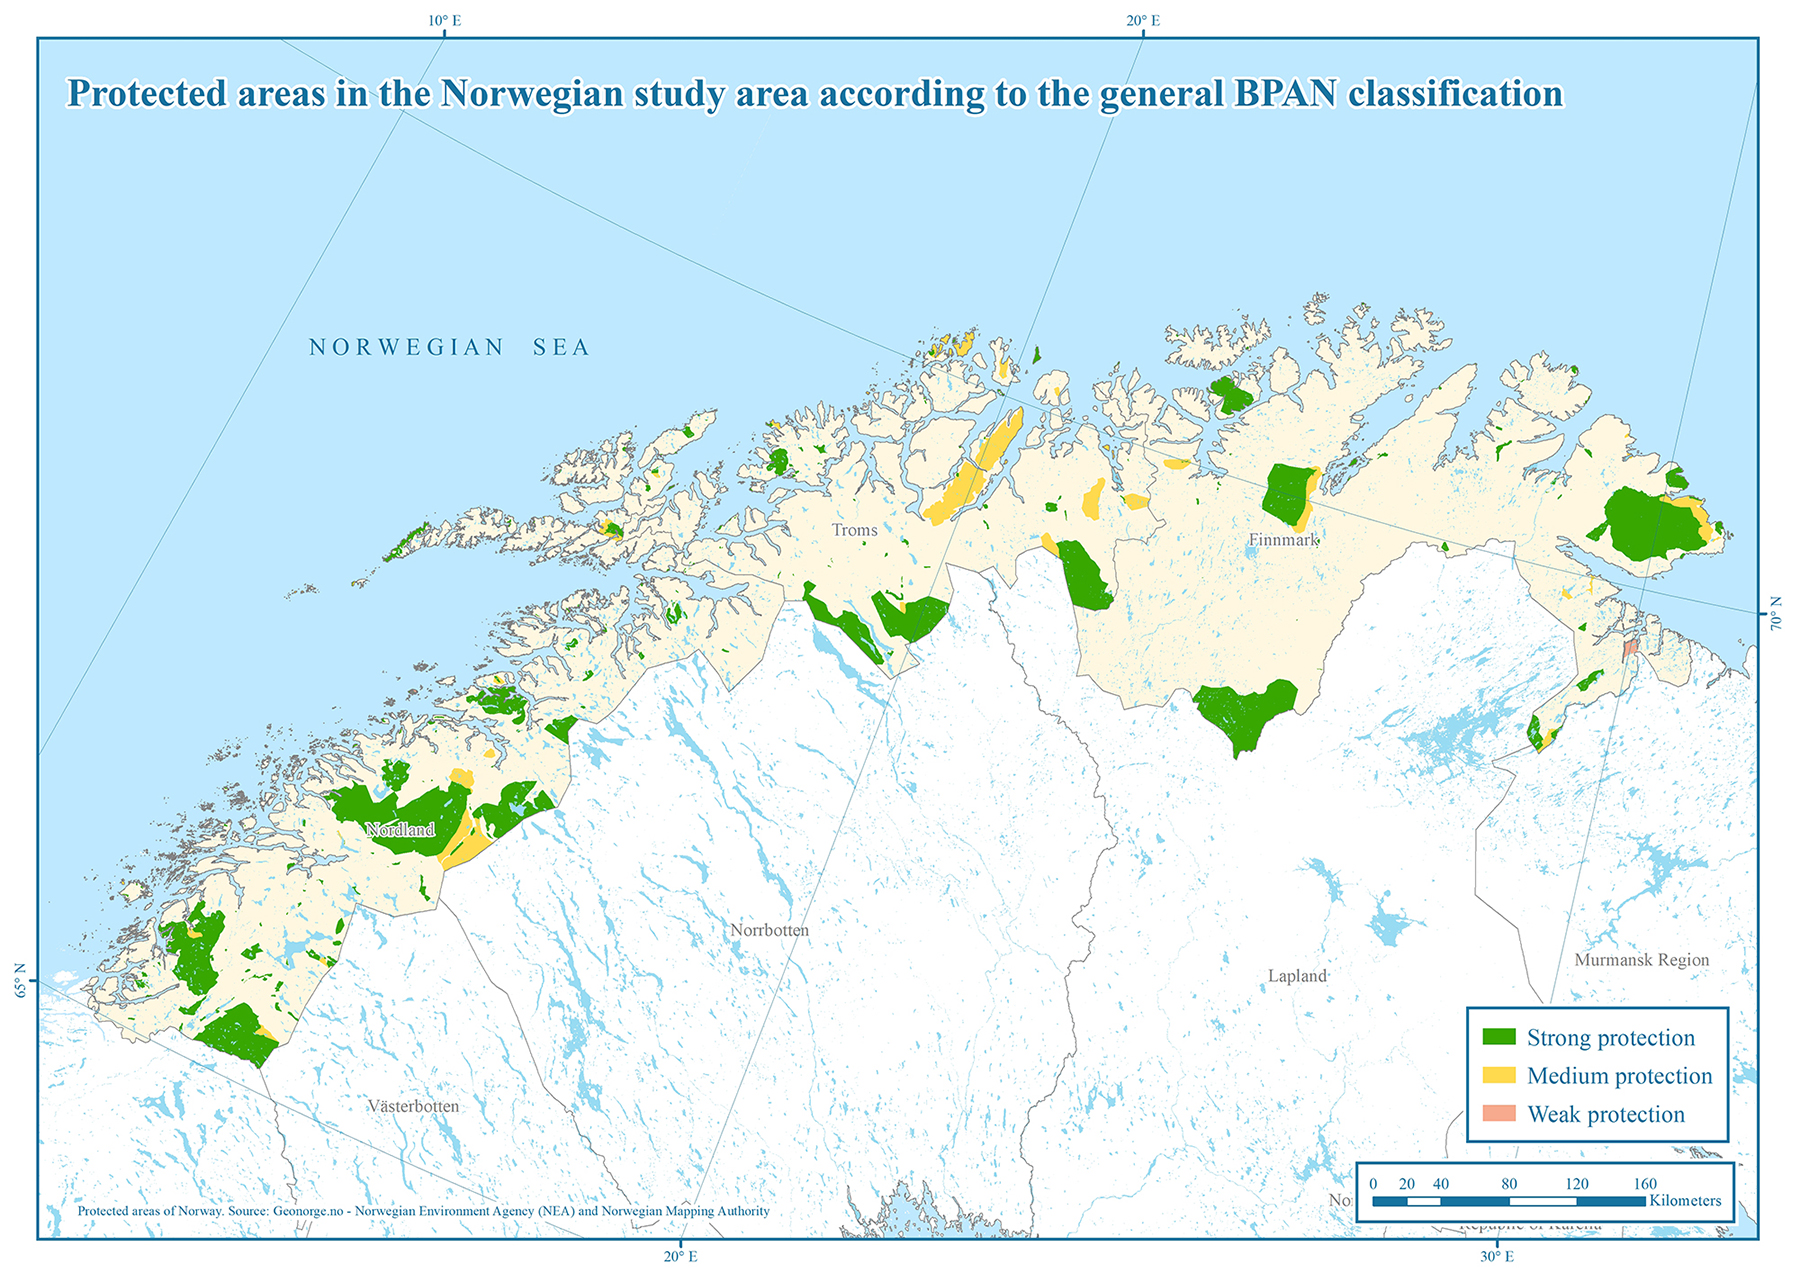
The protected areas in the Norwegian study area are presented in Map 12. The area of protection has not notably increased in Norway. The protection level has increased from 14,6% to 15,1% (Table 4), and at the regional level, only Nordland County fulfils the CBD Aichi Biodiversity Target with regards to the aim of the 17% of terrestrial area covered by protection. Of the 518 km2 change in protected areas, Nordland increased its protected area by 418 km2, Troms 94 km2 and Finnmark by 7 km2. (Table 5)
After 2014, marine protection processes are implemented in the Finnmark region. In the voluntary forest protection process, forest owners offer selected sites for protection. The natural values of these sites are investigated and assessed in a manner comparable to other potential forest protection sites. On this basis, the environmental authorities decide whether the offered sites have the necessary qualities to make them relevant for forest protection. If so, the sites are implemented in a formal protection process, and adopted the same way as other protected sites.
Footnotes
- ^ Suggested areas to be protected, Muvrrešáhpi, including Goahteluoppal in the Kautokeino municipality, the extension of Upper Anarjohka National Park in the Karasjok municipality, and a mire and wetland protection plan in the Finnmark region. All processes ended with no new protection due to local resistance.
Map 12. Protected areas in the Norwegian study area according to the general BPAN classification.
Management of protected areas in Norway
Every protected area in Norway has a formal management authority. The primary tasks for the management authority are to execute the regulations and to establish a management plan for the site. Management authorities are also the primary contact for communication with property owners, the general public, organisations, etc. Since 2010, national parks and large protected areas (i.e., protected landscapes) have been locally managed. Intermunicipal management boards, including representatives from Sámi Parliament (relevant for Sápmi area) and the relevant County Council are established. Most of the total area of PAs is now managed by the local national park boards.
The County Governors still manage most of the smaller PAs, i.e., nature reserves (including Ramsar-sites) and special habitat PAs. If counted by the number of PAs, most PAs are still managed by the County Governors. In addition, for some PAs, the management authority has been delegated directly to the municipality.
The State Nature Inspectorate (SNO) was established in 1996. It is a division of the Norwegian Environment Agency (NEA), performing the operational fieldwork related to nature management. Its primary task is to supervise the state of the nature and to ensure that public behaviour is in accordance with national environmental legislation. Giving general guidance and information to the public is also a very important task. The tasks of the State Nature Inspectorate are applicable outside the PAs as well, but it is specifically responsible for supervision within all the protected areas. It also performs registration, surveillance, and management in protected areas, as directed by the management authority.
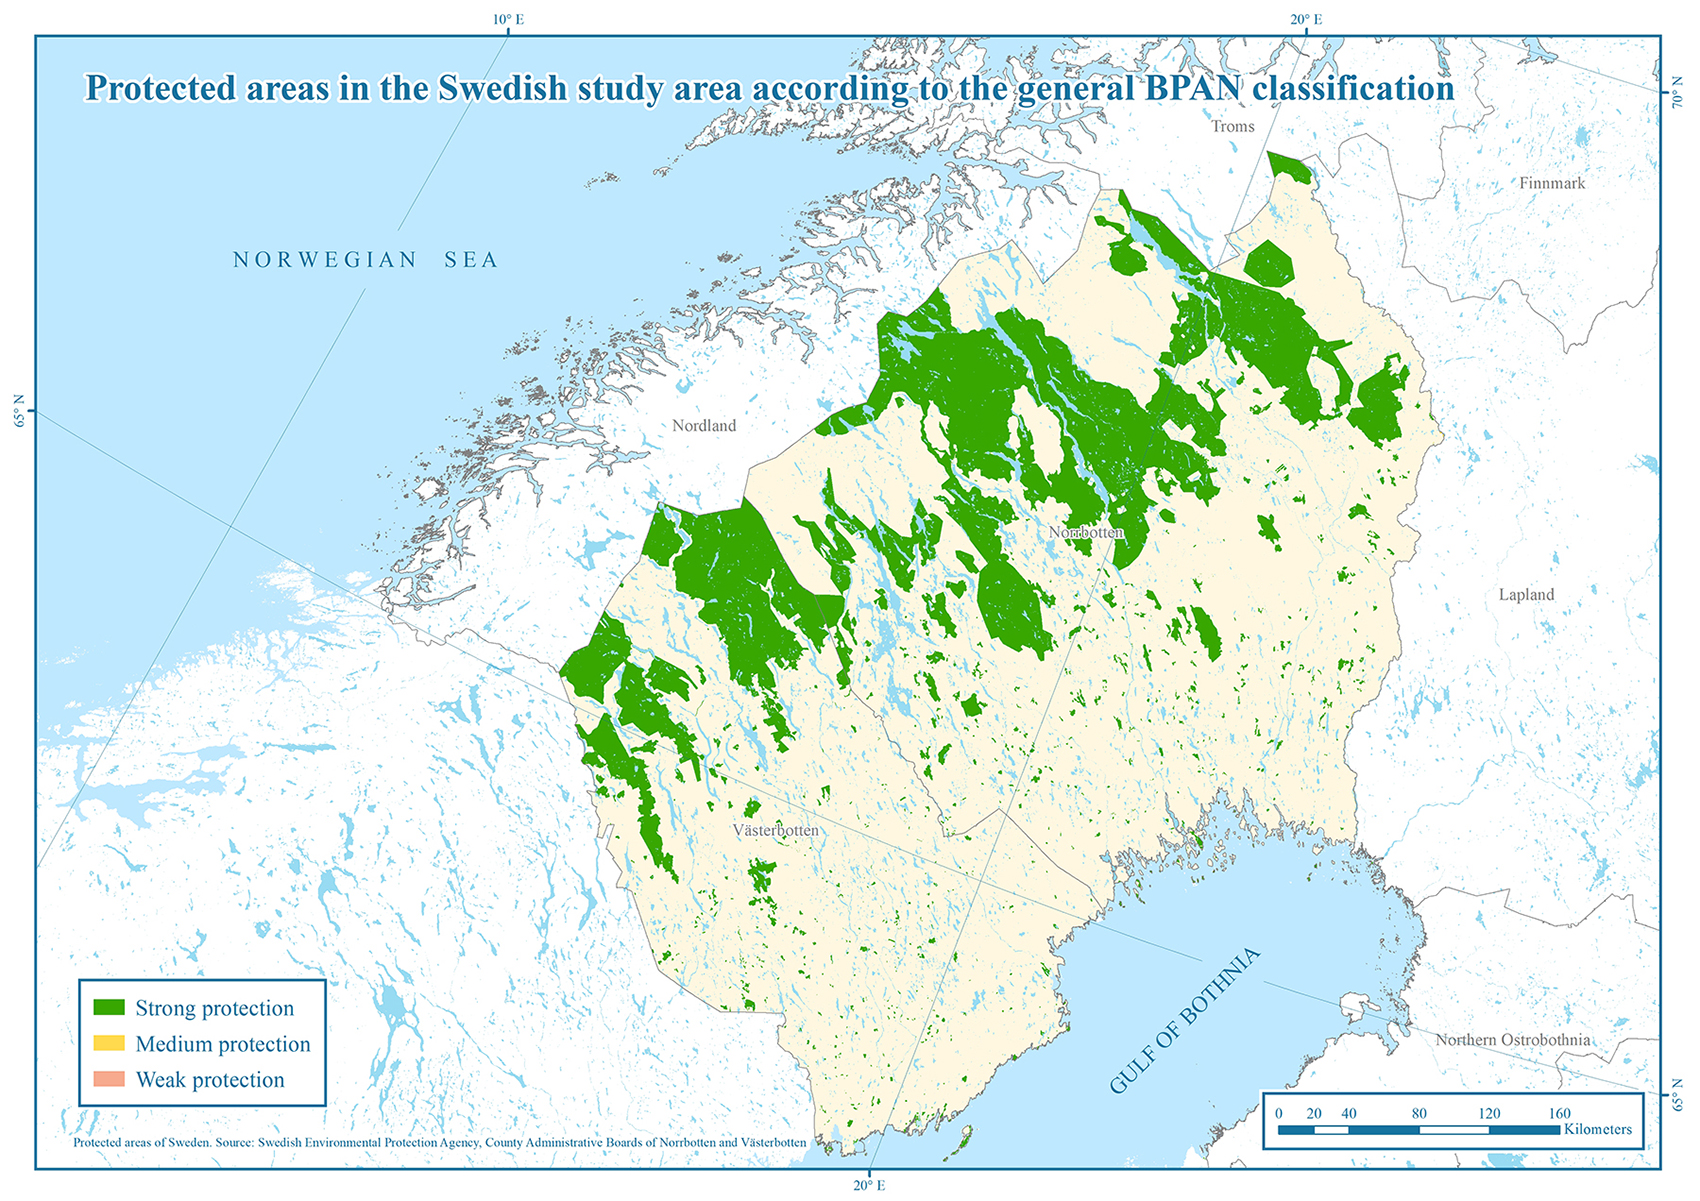
3.2. Protected area coverage in the Swedish study area
Written description of the changes in the protected area coverage in the Swedish study area was not available for this report. Full analysis of the changes in the Swedish study area is nevertheless presented in the tables, figures and maps.
Map 13. Protected areas in the Swedish study area according to the general BPAN classification.
3.3. Protected area coverage in the Finnish study area
Protected areas of the Finnish study areas are presented in Map 14 according to the general BPAN classification.
Map 14. Protected areas in the Finnish study area according to the general BPAN classification.
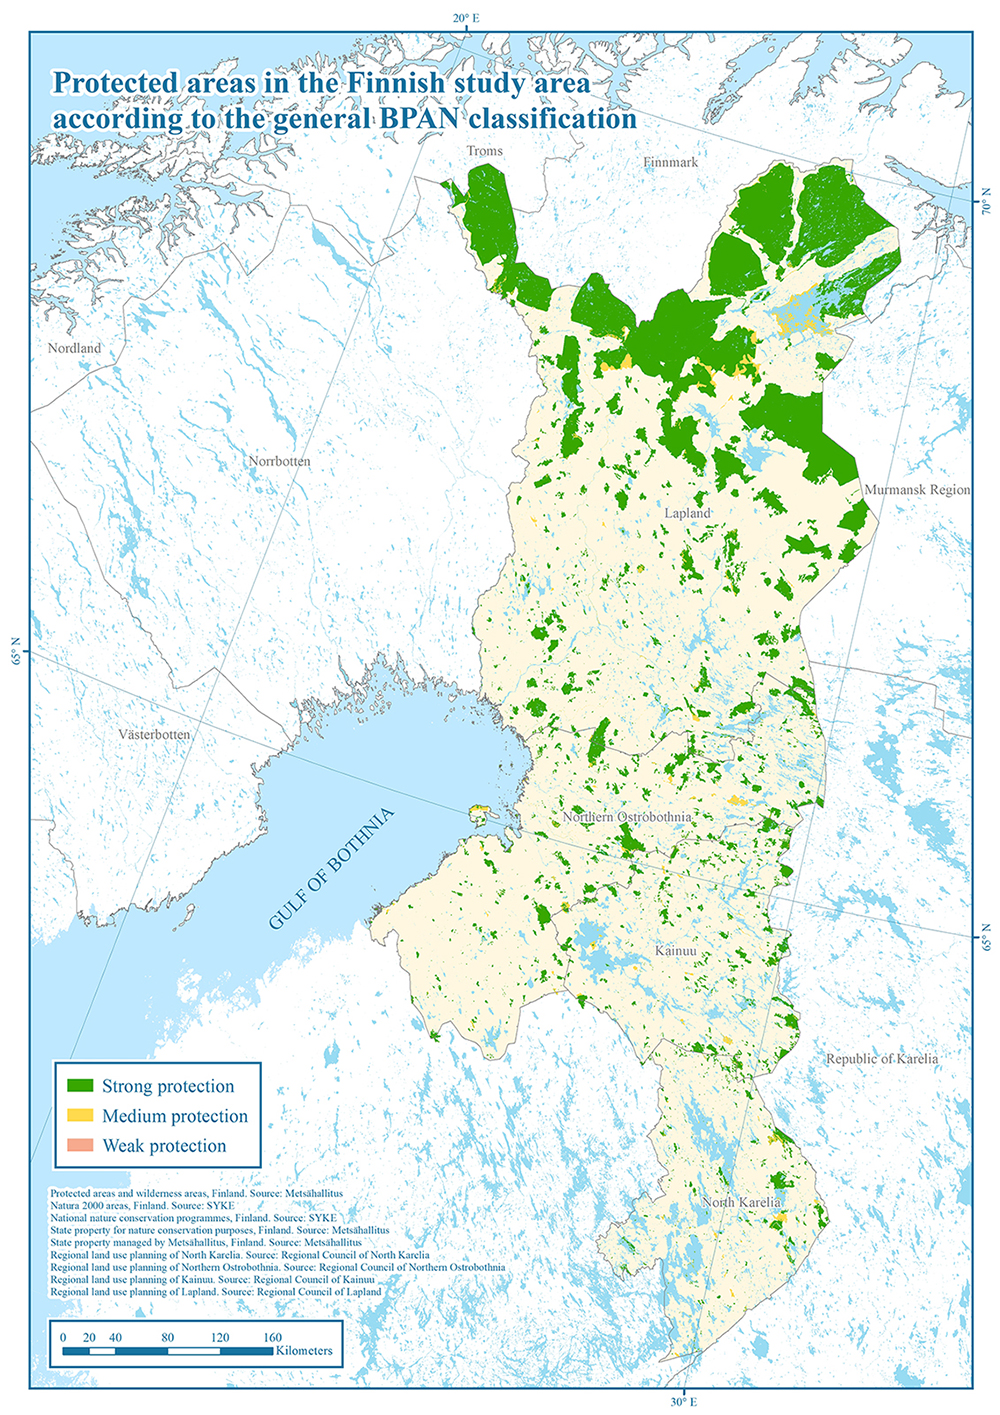
In Lapland, Northern Ostrobothnia and Kainuu combined, the coverage of protected terrestrial areas (including protected inland waters) has increased from 37 326 km2 to 40 940 km2 between 2013 and the end of 2020, a total increase of 3 614 km2. This means that the PA coverage on the terrestrial areas increased from 23,2% to 25,5% of the total area. North Karelia is excluded from these figures, as it was not yet member of the Barents Region in 2013 (Table 4). At the end of 2020, the Finnish study area, including North Karelia, had a total of 42 771 km2 protected areas, meaning 23,3% protected area coverage (Table 4, Figures 1 and 2).
Since 2013, one new national park was established in the Finnish part of the Barents Region – Hossa National Park in 2017. However, the main part of the area was already protected under another type of protection mode and therefore, the creation of the park did not greatly affect the coverage of protected areas in our figures. Finland is preparing to establish a new Salla National Park in 2022. Both these national parks are also a part of the Green Belt of Fennoscandia, close to the border area between Finland, Russia and in the northern part also Norway.
Since 2013, completely new Finnish protected areas have been protected in several different processes, mainly on a voluntary basis, e.g., in the METSO programme. The process of implementation of the regional zoning plans has resulted in new protected areas, as some areas, reserved for protection in the regional land-use planning by regional councils, were established as statutory protected areas.
Near the city of Oulu, there is a new Sanginjoki protected area (25 km2), of which only a small part was previously protected as a statutory protected area, owned by the municipality. Sanginjoki protected area is a good example of the joint efforts of the state, a municipality and private sector in protecting a larger area that nowadays is managed by Parks & Wildlife Finland (Metsähallitus).
The Government of Finland had a campaign for celebrating the 100th anniversary of the Republic of Finland in 2017, in which the government promised to establish new protected areas on state land, an equal number of hectares to what private actors established on their lands without any compensation from the state. This resulted in a total of 170 new private protected areas with an area of 31 km2 in the whole of Finland. Each Finnish region in the Barents Region received at least some such new PAs, 17 of those are in North Karelia and 16 in Northern Ostrobothnia. Also, part of the correspondent new PAs on state land are located in the Finnish part of the Barents Region.
Some new areas were protected under the METSO programme, that mainly focuses on protecting forests of Southern Finland, western parts of Northern Ostrobothnia and the southwestern part of Lapland.
In addition, there was also a decision by the Government of Finland to designate additional funding to protect new forest areas in the northern half of Finland, outside of the focus areas of the METSO-programme, in the regions of Kainuu, Northern Ostrobothnia and Lapland.
The Finnish Natural Heritage Foundation buys valuable forest areas and protects them as statutory protected areas. It has also created new protected areas in the Barents Region.
In addition to these, some increase in the figures of this study resulted from the use of more accurate (compared to the situation in 2013) data, that allowed us to take into analysis such freshwater areas protected by Natura 2000 for which there were no exact borders available earlier in GIS format, and therefore were not included into the 2013 figures. Thus, the inclusion of them in the study gives a rise for the area of protected freshwaters (compared to the 2013 figure), but this rise does not represent rise in de facto protection, and only shows us a more accurate coverage of protected freshwaters.
At the regional level, the total area covered by PAs in the end of 2020 varies a lot between the regions, being 34 256 km2 in Lapland, 4 466 km2 in Northern Ostrobothnia, 2 200 km2 in Kainuu and 1 829 km2 in North Karelia (Table 5 and Figure 5). The highest increase from 2013 to the end of 2020 was in Lapland (1 951 km2) and Northern Ostrobothnia (1 432 km2) (Table 5, Figure 8). Some of this increase is explained by improvement in the quality of available data, not by increase of protected area.
PA coverage increased in Lapland, from 33,1% to 34,6% of the total terrestrial area, in Northern Ostrobothnia, from 8,1% to 11,9%, and in Kainuu, from 8,1% to 9,1%. Thus, the percentual increase of PA coverage was biggest in Northern Ostrobothnia (3,8% units). (Table 5, Figures 6 and 7)
In Finland, planned protected areas are included in the regional land-use zoning plans as areas reserved for protection. The total area of planned terrestrial protected areas increased in Lapland, from 11 km2 to 116 km2, in Kainuu, from 4 km2 to 29 km2, and decreased in Northern Ostrobothnia, from 6 km2 to 3 km2. However, in Northern Ostrobothnia, at the same time, there were quite a few new protected areas established, 1 432 km2, including many planned protected areas being established as statutory PAs. In North Karelia, at the end of 2020, there were a total of 24 km2 of planned protected areas. (Tables 5 and 6, Figure 5)
Protected areas in North Karelia
North Karelia, the newest member in the Barents Region, joined in 2017 and became the 14th region of the Barents Region. Due to this, comparable data gathered with the same methods for PAs is not available from 2013 for this region.
In the literature, it is stated that in 2013 in North Karelia, protected areas covered a total of 850 km2 or 3,9% of the region (Luotonen 2013). These areas are most likely roughly comparable only to class 1 (strict and strong protection level areas, Tables 1 and 2) of this report. Half of the PAs were protected under the nature protection programmes, and more than a half of those were targeted in mire protection. There were 10 km2 of PAs protecting old-growth forests. In 2011, there were 19 km2 of PAs protected in the METSO Forest Biodiversity Programme, which accounted for 0,1% of the forest area in North Karelia (Laita et al. 2012).
Due to the lack of comparable data from 2013, only a general description of changes can be made. The area of PAs has increased, and the level of protection has changed due to a change in protection regimes stronger in North Karelia. The METSO programme has been popular, and the regional target areal goal has already been reached. Since 2013, the region has gained new PAs, including part of the Kolovesi National Park, as Heinävesi municipality joined North Karelia in 2021 (previously, it was part of the South Savo region). The same year, with new regulations, 365 km2 of state-owned areas reserved for protection were protected as statutory PAs.
In North Karelia, protected areas, when including also PAs with a medium-level protection regime, cover 1 829 km2 or 8,0% of the region (Table 5). There are four national parks (NP) in North Karelia: Patvinsuo NP (105 km2), Koli NP (29 km2), Petkeljärvi NP (7 km2) and Kolovesi NP (total area 61 km2), which is located partly in South Savo (outside the study area). There is also Koivusuo Strict Nature Reserve (22 km2), with its large, raised bog and old forests. Other significant PAs are the Kesonsuo PA cluster (88 km2) and the last roadless forest wilderness in Eastern Finland, the Ruunaa nature reserve (73 km2). There were 90 km2 of PAs protected in the METSO programme in North Karelia (Anttila et al. 2021).
In the Regional land-use plan of North Karelia, phase 1, that is in preparation, 44 km2 of new PAs have been planned for North Karelia (Regional land-use plan of North Karelia, phase 1). These areas mainly target mire protection. When the Regional land-use plan of North Karelia, phase 1, is accepted, the local Centre for Economic development, transport and environment will have five years to implement and protect the planned areas.
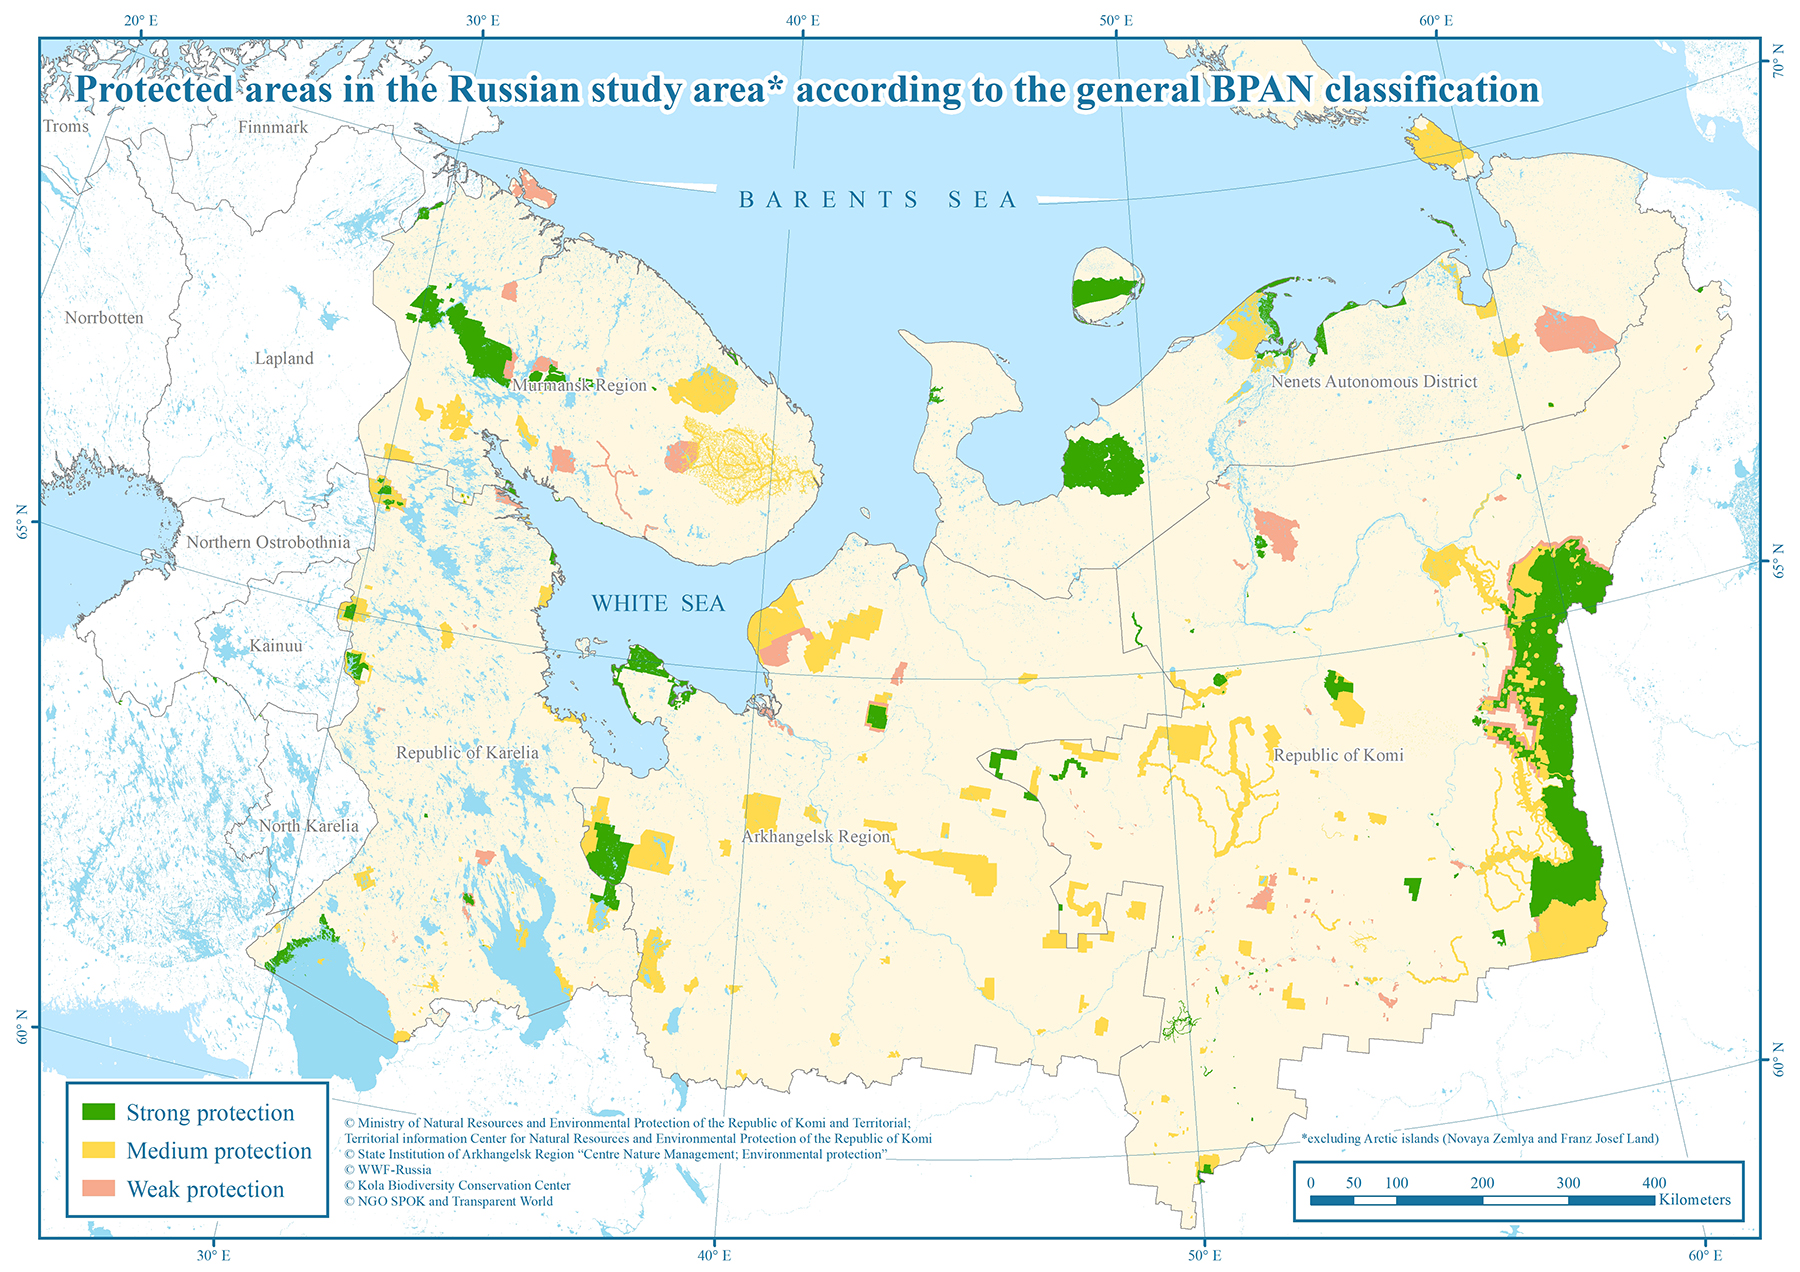
3.4. Protected area coverage in the Russian study area
Protected areas in the Russian study area are presented in Map 15. In the Russian part of the Barents Region, 12,1% is covered with protected areas (Table 4).
Compared to the Nordic countries, the Russian part of the Barents Region is characterised by a more significant contrast and diversity in terms of protection modes of protected areas of the BPAN classification, which is presented in Chapters 2 and 3 (Tables 1, 2, 7 and 8). Of the total area of protected areas in the Russian study area, 21,2% is covered by Full Protection (class 1a) protected areas, while 10,4% is represented by Weak Protection (class 3). More than half (55,3%) of the total area of protected areas are protected as Medium Protection (class 2).
Map 15. Protected areas in the Russian study area, excluding Franz Josef Land and the northern part of Novaya Zemlya, according to the general BPAN classification.
Key changes in protected area network in the Russian study area
Murmansk Region
The total area of existing protected areas in the Murmansk Region at the end of 2020 was 19 515 km2, which is 13,6% of the Murmansk Region (Table 5). During the analysed period, the following protected areas were created in the region: the Kaita nature reserve in 2014 (class 2), the Rybachy and Sredny Peninsulas nature park in 2014 (class 3), the Korablekk nature park in 2017 (class 1c) as well as Khibiny National Park in 2018 (class 1c). The new protected areas have resulted in an increase in the coverage of protected areas by 3 260 km2 or 2,3% of the area of the region. Khibiny National Park became an especially important conservation achievement because the idea of its creation was first put forward in the early 20th century and became the subject of difficult negotiations in the 1990s and 2000s. The area of official planned protected areas in the Murmansk Region at the end of 2020 was 8 217 km2 (Table 6).
Republic of Karelia
The total area of existing protected areas in the Republic of Karelia at the end of 2020 was 9 988 km2, which is 5,8% of the area of the region (Table 5). During the analysed period, the following protected areas were created in the region: the Boloto Yupyauzhsuo nature reserve (class 2) in 2015, the Keretsky nature reserve (class 2) in 2017, and Ladozhskiye Shkhery National Park (class 1c) in 2017. The creation of the national park is a result of long-term research and negotiation that began in the middle of the 1990s. Several nature monuments were also created, including Khaapalampi, Severnoye Priladozhye, Vargachno-Korbozerskoye, Chukozero, Uslovno Korennyye Lesa Zaonezhya, Khitoostrov and Yelovyye Lesa Zaonezhya nature monuments. New protected areas have resulted in an increase in the coverage of protected areas by 1 932 km2 or 1,1% of the Republic of Karelia (Table 5). The area of official planned protected areas in the Republic of Karelia, as of the end of 2020, was 12 969 km2 (Table 6).
Arkhangelsk Region
The total area of existing protected areas in the Arkhangelsk Region at the end of 2020 was 27 026 km2, which is 8,8% of the Arkhangelsk Region without the Arctic islands of Novaya Zemlya and Franz Josef Land (Table 5). During the analysed period, two protected areas were created in the region: the Lekshmokh nature reserve and the Dvina-Pinega nature reserve, both in 2019. The borders of one protected area, the Zheleznyye Vorota nature reserve, were extended. The borders of two protected areas, the Soyanskiy nature reserve and the Primorsky nature reserve, were reduced, and the protection regimes of these reserves were changed (which led to a decrease in the degree of conservation of its ecosystems and potential harm by mining activities). In the Belomorskiy nature reserve, the developed areas (settlement territory) were excluded from the protected area. In Onezhskoye Pomorye National Park (created in 2013), a functional zoning was adopted, which was the most significant conservation success in the Arkhangelsk Region.
During the analysed period, the Dvina-Pinega nature reserve was created to protect the core area (3 000 km2) of one of Europe's largest intact forest landscapes. It is dominated by old-growth spruce forests. The creation of the nature reserve is the outcome of the efforts of environmental NGOs and research institutions undertaken since the early 2000s.
The above-mentioned changes in the protected areas network of the region have resulted in an increase in the coverage of protected areas in the region by 2 500 km2 or 0,8% of the area of the region (Table 5). The progress in nature conservation is less than the total area of newly established protected areas because of the reduction of the borders of existing protected areas. The area of official planned protected areas in the Arkhangelsk Region, as of the end of 2020, was 4 934 km2, which is 8 334 km2 less than in 2013 (Table 6). The decrease in the planned protected areas is caused by the exclusion of a number of planned PAs from official planning documents at the regional level.
Nenets Autonomous District
The total area of existing protected areas in the Nenets Autonomous District at the end of 2020 was 19 364 km2, which is 11,0% of the Nenets Autonomous District (Table 5). During the analysed period, the following protected areas were created in the region: the Severnyy Timan nature park in 2017, the Pakhancheskiy nature reserve in 2017, the Khaypudyrskiy nature reserve in 2017, the Vashutkinsky nature reserve in 2018, the Kolguevsky nature reserve in 2019 and the buffer zone of the Pym-Va-Shor nature monument in 2020.
Newly established protected areas have resulted in an increase in the coverage of protected areas in the region by 11 401 km2 or 6,5% of the area of the region (Table 5). Based on the more than doubling of the area of protected areas over the analysed period, the Nenets Autonomous District has made the most successful progress in the Barents Region in nature conservation, both in absolute and relative terms. The progress in the development of protected area network in the region has especially strengthened the conservation of tundra ecosystems in the Barents Region. The area of official planned protected areas in the Nenets Autonomous District at the end of 2020 was 8 388 km2 (Table 6).
Republic of Komi
The total area of existing protected areas in the Republic of Komi at the end of 2020, was 60 539 km2, which is 14,5% of the area of the region (Table 5). During the analysed period, the following protected areas were created in the region: Koygorodsky National Park, as well as the Ochenyrd, Bolshaya Lagorta, and Bolshaya Rogovaya nature reserves. All these protected areas were created in 2019.
Koygorodsky National Park, with an area of 567 km2, covers the most southern intact forest landscape in the Barents Region. The protection regime of one of the protected areas, the Ilychsky nature reserve, was changed, which led to a decrease in the degree of conservation of its ecosystems (in the reserve, mining is allowed). Several protected areas in the Republic of Komi were abolished by the regional authorities during the analysed period in the process of inventorying and reformation of the regional network of protected areas. The changes that have taken place during the analysed period have led to an increase in the total area of protected areas in the region by 479 km2 or 0,1% of the area of the region (Table 5). Since the official document on planned protected areas, Scheme for the Development and Placement of Protected Areas of the Republic of Komi, was not approved at the end of 2020, the planned protected areas indicated in this document are not reflected in the analysis.
4. Ecosystem diversity and protection in the Barents Region
4.1. Ecosystem diversity in the Barents Region
The dominant type of ecosystem in the Barents Region is forests, which together cover 56,3% of the total area of the region. Coniferous forests cover 27,2%, mixed forests 14,1% and deciduous forests 15,0% of the total land area (including inland waters) of the region. The inclusion of North Karelia in the Barents Region has increased the share of coniferous forests by 0,4% unit. Open wetlands cover 14,4%, and tundra ecosystems cover 16,1% of the terrestrial Barents Region. The share of freshwater ecosystems is 5,7%. Glaciers and other lands having a natural lack of vegetation (such as dunes, sands, and rocks) cover 2,1% and 3,5% respectively. Grasslands cover 0,3%. The share of human-transformed lands, agricultural lands and developed areas, together is 1,6% of the total terrestrial area of the Barents Region. Proportions of landcover classes in the Barents Region are shown in Table 10 and Figure 11.
Key relative indicators of representation of various types of ecosystems within the boundaries of the Barents Region by country are as follows: In the Norwegian part of the Barents Region, 50,8% is covered by tundra vegetation, 25,6% by forest ecosystems, 10,8% is represented by lands of natural lack of vegetation and 5,8% by open wetlands. In the Swedish part of the Barents Region, 61,7% is covered by forest ecosystems, 15,7% by tundra vegetation, and 11,3% by open wetlands. In the Finnish part of the Barents Region, 69,9% is covered by forest ecosystems, 13,3% by open wetlands, and 3,5% by tundra vegetation. In the Russian part of the Barents Region, 56,3 % is covered by forest ecosystems, 15,7% by open wetlands and 14,9% by tundra vegetation. The Finnish part of the Barents Region is characterised by the largest share of freshwater ecosystems (8,0%) and human-transformed lands, including agricultural lands (2,6%) and developed areas (1,7%). The Russian part of the Barents Region, including the Arctic islands of Novaya Zemlya and Franz Josef Land, has the largest share of glaciers (2,8%). Proportions of landcover classes in the Barents Region by country are shown in Table 10 and Figure 11.
Map 16. Landcover in the Barents Region.
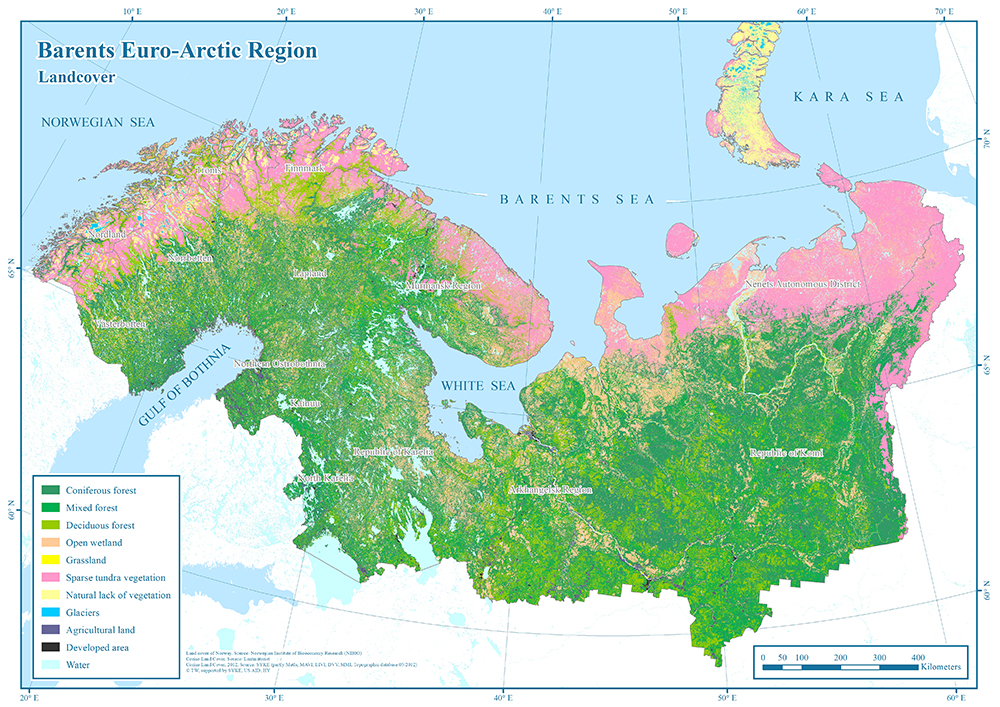
Table 10. Proportions (%) of land cover classes within the terrestrial part of the Barents Region, by country.
| Norway | Sweden | Finland | Russia | Barents Region | ||
| Coniferous forest | 3,2% | 38,4% | 40,2% | 26,0% | 27,2% |
| Mixed forest | 0,8% | 3,5% | 11,5% | 17,0% | 14,1% |
| Deciduous forest | 21,6% | 19,8% | 18,2% | 13,3% | 15,0% |
| Open wetland | 5,8% | 11,3% | 13,3% | 15,7% | 14,4% |
| Grassland | 0,0% | 1,1% | 0,4% | 0,2% | 0,3% |
| Tundra vegetation | 50,8% | 15,7% | 3,5% | 14,9% | 16,1% |
| Natural lack of vegetation | 10,8% | 2,0% | 0,7% | 3,5% | 3,5% |
| Glacier | 1,0% | 0,2% | 0,0% | 2,8% | 2,1% |
| Agricultural lands | 1,9% | 0,9% | 2,6% | 0,8% | 1,0% |
| Developed area | 0,3% | 0,3% | 1,7% | 0,5% | 0,6% |
| Water | 3,8% | 6,8% | 8,0% | 5,4% | 5,7% |
Figure 11. Proportions (%) of land cover classes within the Barents Region, by country.
Key absolute indicators of representation of the dominant types of ecosystems within the boundaries of the Barents Region by country are shown below. As mentioned above, the Barents Region is to a large extent covered by forests. The total amount of forests in the Barents Region are the following: Norway 28 907 km2, Sweden 101 856 km2, Finland 128 404 km2, and Russia 735 547 km2. The total area of forests in the Barents Region is 995 000 km2. In the Finnish part of the Barents Region, the joining of North Karelia resulted in an increase in the total area of forests. The total amount of areas covered by tundra vegetation in the Barents Region are the following: Norway 57 296 km2, Sweden 25 856 km2, Finland 6 355 km2, and Russia 194 881 km2. The total areas of open wetlands within the borders of the Barents Region by country are the following: Norway 6 549 km2, Sweden 18 615 km2, Finland 24 421 km2, and Russia 205 388 km2. The total areas of land cover classes by country are shown in Figure 12.
Figure 12. The total areas (km2) of landcover classes in the terrestrial Barents Region, by country.
4.2. Ecosystem protection in the Barents Region
To understand the features of a protected area network, it is necessary to consider not only the total area and protection regimes of protected areas as indicators, but also the representativeness — the representation of the ecosystem diversity within protected areas. Ecosystem diversity and the existing network of protected areas can be assessed in two ways: an inside view and an outside view. The view from the inside of the protected areas allows assessing the distribution (proportions) of various ecosystems within the borders of the protected area network and their areas. The view from the inside helps to answer the question "how much?" while analysing a protected area network. However, to answer the question "so what?", it is necessary to consider a protected area network from the outside. The view from outside of the protected areas provides a possibility to estimate how well the ecosystem diversity of a region or a country is represented in the protected area network. In other words, the view from the outside shows the share of each ecosystem’s type covered by protected areas (i.e., relative coverage of ecosystems by protected areas, or representativeness of a protected area network in relative values). Obviously, giving any ecosystem the status of a protected area does not alone guarantee its conservation in practice. The efficiency of the implementation of protection regimes of national parks or nature reserves varies greatly in different countries of the world. However, the assessment of the enforcement of the regimes of protected areas, and the frequency of their violations, were not included in the tasks of this analysis.
At the end of 2020, the total area of forests in the existing protected areas in the Barents Region was 121 291 km2 (Figure 14), whereas in 2013 it was 111 700 km2 (Aksenov et al. 2015). This difference is caused by both the inclusion of a new administrative unit (North Karelia, Finland) in the Barents Region and by the establishment of new protected areas during 2013–2020. However, the relative share of forests in the existing protected area network in the Barents Region has decreased by 0,7%, from 48,2% in 2013 to 47,5% in 2020 (Table 11, Figure 13). Thus, newly established protected areas include more non-forest ecosystems than forests. For instance, the share of areas of tundra vegetation within existing protected areas has increased by 1,5% units, from 20,2% in 2013 (Aksenov et al. 2015) to 21,7% in 2020 (Table 11). In absolute figures, the increase in tundra protection is 8 668 km2, from 46 700 km2 in 2013 (Aksenov et al. 2015) to 55 368 km2 at the end of 2020 (Figure 14). This is mainly caused by the establishment of a number of new protected areas in the Nenets Autonomous District, Russia, between 2013 and 2020. The detailed data on distribution (proportions) of land cover classes within existing protected areas in the terrestrial Barents Region as a whole and by its national sub-parts is shown in Table 11 and Figure 13. Total areas of land cover classes within existing protected areas by region are shown in Figure 15.
Map 17. Landcover within existing protected areas in the Barents Region.
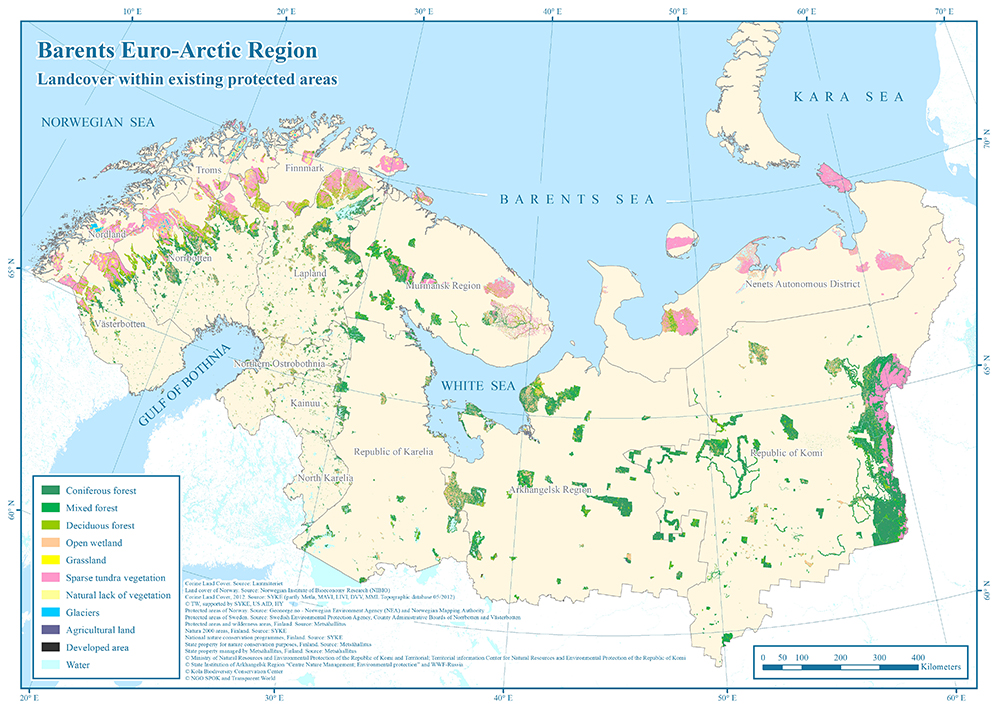
Map 18. Landcover within existing and planned protected areas in the Barents Region.
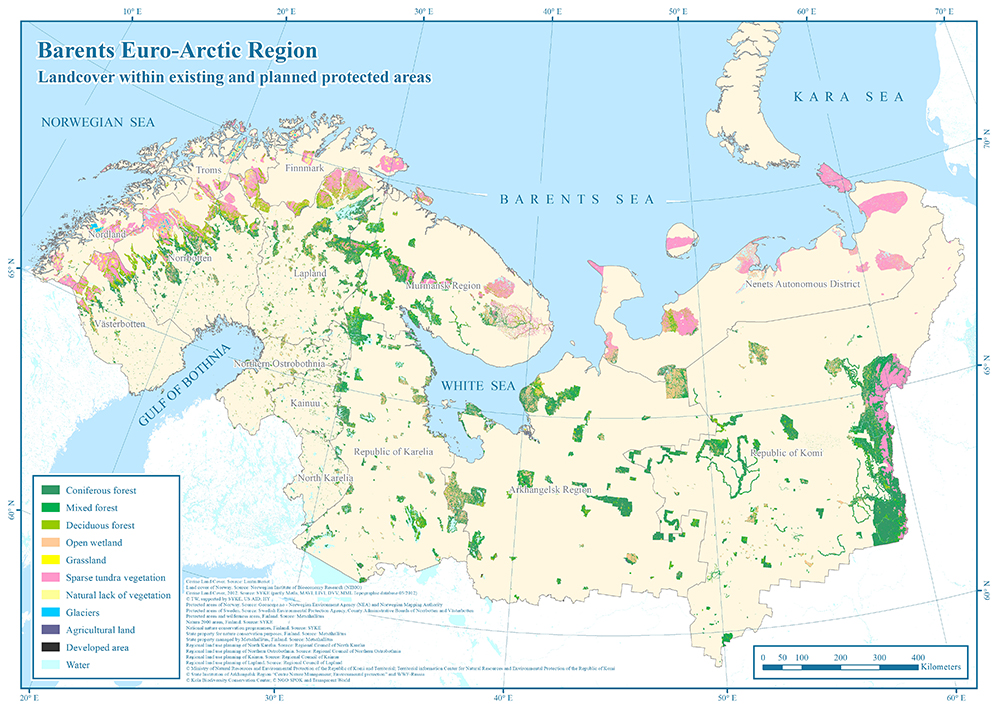
Figure 13. Proportions (%) of land cover classes within existing protected areas by country.
Table 11. Proportions (%) of land cover classes within existing protected areas in terrestrial part of the Barents Region, by country and Barents Region as a whole.
| Norway | Sweden | Finland | Russia | Barents Region | ||
| Coniferous forest | 2,3% | 23,4% | 27,9% | 29,1% | 26,2% |
| Mixed forest | 0,4% | 2,9% | 5,5% | 13,5% | 9,7% |
| Deciduous forest | 12,1% | 19,3% | 17,9% | 7,9% | 11,5% |
| Open wetland | 5,1% | 12,4% | 21,9% | 12,8% | 13,7% |
| Grassland | 0,0% | 2,1% | 0,4% | 0,1% | 0,4% |
| Tundra vegetation | 57,4% | 30,9% | 14,3% | 17,5% | 21,7% |
| Natural lack of vegetation | 17,4% | 3,7% | 2,4% | 2,2% | 3,5% |
| Glacier | 3,0% | 0,5% | 0,0% | 11,0% | 7,1% |
| Agricultural lands | 0,1% | 0,0% | 0,0% | 0,3% | 0,2% |
| Developed area | 0,1% | 0,0% | 0,1% | 0,2% | 0,1% |
| Water | 2,2% | 4,7% | 9,6% | 5,5% | 5,8% |
Figure 14. Areas (km2) of land cover classes within existing protected areas in terrestrial part of the Barents Region, by country and Barents Region as a whole.
As shown in Figure 14, most of the forest ecosystems, especially coniferous forests, within the protected areas of the Barents Region are in Russia. As shown in Figure 15, the regions with the largest total area of forest ecosystems in existing protected areas are Norrbotten, Sweden (13 330 km2), Lapland, Finland (16 695 km2), the Arkhangelsk Region (19 384 km2) and the Komi Republic, Russia (44 002 km2).
Figure 15. Areas (km2) of land cover classes within existing terrestrial protected areas, by region.
To understand the level of protection of ecosystem diversity in the Barents Region, we must estimate the coverage of each type of ecosystem with existing protected areas, i.e., to apply an outside view on the protected area network. This approach makes it possible to measure the success of progress in relation to nature conservation and the development of protected areas based on a benchmark or a target. Thus, the Aichi Biodiversity Target 11 of the Convention on Biological Diversity requires the protection of at least 17% of terrestrial and inland water ecosystems by ecologically representative protected area systems. To assess the progress towards the Aichi Biodiversity Target 11 in the Barents Region considering representativeness of the protected area network, the relative coverage provided for each type of ecosystem by the existing protected area network has been calculated. The results are shown in Figure 16, Table 12.
Figure 16. Proportion of PA coverage in total (%), in total area of each land cover class, by country and Barents Region as a whole.
Table 12. Proportion of PA coverage in total (%) in total area of each land cover class, by country and Barents Region as a whole.
| Norway | Sweden | Finland | Russia | Barents Region | ||
| Coniferous forest | 10,8% | 14,5% | 15,3% | 13,6% | 14,0% |
| Mixed forest | 7,0% | 19,9% | 10,4% | 9,7% | 10,0% |
| Deciduous forest | 8,4% | 23,1% | 21,5% | 7,2% | 11,1% |
| Open wetland | 13,2% | 26,0% | 36,3% | 9,9% | 13,7% |
| Grassland | 0,0% | 44,7% | 23,4% | 7,3% | 23,9% |
| Tundra vegetation | 17,0% | 46,8% | 90,7% | 14,2% | 19,5% |
| Natural lack of vegetation | 24,3% | 43,8% | 71,6% | 7,8% | 14,3% |
| Glacier | 45,8% | 74,4% | 0,0% | 48,2% | 48,3% |
| Agricultural lands | 0,5% | 0,9% | 0,2% | 4,8% | 2,8% |
| Developed area | 3,3% | 0,4% | 1,4% | 4,4% | 3,2% |
| Water | 8,7% | 16,6% | 30,2% | 12,4% | 15,1% |
In 2013, in the Barents Region, only grasslands (24,4%) and glaciers (48,3%) reached the 17% conservation target. Experts do not consider these indicators as major achievements in nature conservation for two reasons: First, these ecosystems cover an insignificant share of the Barents Region. Second, ecosystems such as glaciers are the least important for economic activity and therefore the easiest to include in protected areas without much effort. In 2020, one more type of ecosystem, tundra vegetation, exceeded the 17% conservation target. The share of protected tundra increased by 3,5% units, from 16,0% in 2013 (Aksenov et al. 2015) to 19,5% in 2020 (Figure 16, Table 12). This increase in the protection occurred during the analysed period mainly due to the creation of a number of large, protected areas in the Nenets Autonomous District, Russia.
Compared to the situation in the Barents Region in 2013 (Aksenov et al. 2015), the share of protected forests in 2020 has increased by 1% unit in coniferous forests, by 0,6% units in mixed forests and by 0,7% units in deciduous forests (Figure 16, Table 12). Changes in the total area of protected forest are caused by both the creation of new protected areas and the expansion of the Barents Region through the inclusion of North Karelia into the Barents Region. If we consider all three forest types in aggregate, then the analysis shows that at the end of 2020, 12,2% of forests in the Barents Region were covered by protected areas. Thus, to achieve the Aichi Biodiversity Target 11 on the protection of 17% of ecosystems, the share of forests covered by protected areas in the Barents Region should still be increased by 4,8% units. To achieve the Aichi Target, the share of coniferous forest covered by protected areas should increase by 3,0% units, mixed forest by 7,0% units and deciduous forest by 5,9% units.
Considering the Barents Region by country, we can see that the conservation threshold of 17% has been overcome for forest and wetland ecosystems in some cases (Figure 16). Thus, the coverage of mixed and deciduous forests by protected areas in the Swedish part of the Barents Region is 19,9% and 23,1%, respectively. The coverage of mixed forests by protected areas in the Finnish part of the Barents Region is 21,5%. The shares of protected open wetlands in the Swedish and Finnish parts of the Barents Region are 26,0% and 36,3%, respectively (Figure 16).
Figure 17. Proportion of PA coverage in total (%), in total area of each land cover class, by region.
Comparing Figures 14 and 16, as well as Figures 15 and 17, we can see the contrast between the Russian and Nordic parts of the Barents Region. As shown in Figure 14 and Figure 15, the Russian part of the Barents Region has high absolute figures, as the region is large in area. In Russia, significantly vast areas of ecosystems are included in protected areas in comparison with the Nordic countries, while Figure 16 and Figure 17 illustrate an inverse relationship in relative values. In the Nordic countries, the share of ecosystems included in protected areas, in the total area of these ecosystems within the region, is significantly higher than the same indicator in Russia. For instance, for coniferous forests, the conservation threshold of 17% has been overcome in the following regions: Finnmark (23,4%), Norrbotten (19,9%), Lapland (22,9%) and the Republic of Komi (17,3%). For the protection of areas of tundra vegetation, the 17% threshold has been overcome in the following regions: Nordland (24,5%), Troms (19,0%), Västerbotten (77,0%), Norrbotten (38,7%), Lapland (90,8%) and the Republic of Komi (22,5%). Proportion of PA coverage in total, in total area of each land cover class, by region (%) are shown in Table 13. Protection of land cover classes within existing protected areas, by region (km2) is shown is Table 14.
Table 13. Proportion of PA coverage, % in total area of each land cover class, by region
| Norway | Sweden | Finland | Russia | ||||||||||||
| Troms | Finnmark | Nordland | Norrbotten | Västerbotten | Lapland | Northern Ostrobothnia | Kainuu | North Karelia | Murmansk Region | Republic of Karelia | Arkhangelsk Region (excluding Novaya Zemlya and Franz Josef Land) | Nenets Autonomous District | Republic of Komi | ||
| Coniferous forest | 8,4% | 23,4% | 5,4% | 19,9% | 7,6% | 22,9% | 7,8% | 9,5% | 6,0% | 14,1% | 6,9% | 12,4% | 0,7% | 17,3% |
| Mixed forest | 7,1% | 5,2% | 7,5% | 24,2% | 10,1% | 18,2% | 3,1% | 3,1% | 2,8% | 14,2% | 5,1% | 6,6% | 6,8% | 11,8% |
| Deciduous forest | 8,4% | 7,3% | 10,1% | 26,8% | 17,4% | 32,6% | 6,4% | 5,4% | 3,9% | 12,1% | 4,4% | 4,8% | 35,2% | 7,5% |
| Open wetland | 13,3% | 13,6% | 12,1% | 27,6% | 22,1% | 40,7% | 26,8% | 23,1% | 32,3% | 11,8% | 4,9% | 9,3% | 10,2% | 13,6% |
| Grassland | 0,0% | 0,0% | 0,0% | 35,1% | 79,0% | 36,4% | 21,2% | 0,4% | 1,8% | 0,0% | 0,0% | 4,6% | 1,9% | 10,5% |
| Tundra vegetation | 19,0% | 11,0% | 24,5% | 38,6% | 77,0% | 90,7% | 0,0% | 0,0% | 0,0% | 16,4% | 0,0% | 0,2% | 11,3% | 22,5% |
| Natural lack of vegetation | 20,7% | 21,3% | 29,9% | 38,5% | 94,9% | 74,3% | 19,7% | 9,3% | 7,4% | 0,0% | 11,5% | 0,5% | 81,9% | 2,3% |
| Glacier | 56,7% | 33,8% | 44,4% | 74,3% | 100,0% | 0,0% | 0,0% | 0,0% | 0,0% | 0,0% | 0,0% | 0,0% | 0,0% | 0,0% |
| Agricultural lands | 0,3% | 0,7% | 0,5% | 0,0% | 1,3% | 0,3% | 0,1% | 0,1% | 0,5% | 0,3% | 8,0% | 5,1% | 0,0% | 1,6% |
| Developed area | 0,1% | 15,2% | 0,0% | 0,6% | 0,2% | 2,4% | 1,1% | 0,8% | 1,2% | 3,8% | 4,9% | 4,0% | 6,5% | 4,6% |
| Water | 11,3% | 5,4% | 10,5% | 19,8% | 10,7% | 42,6% | 16,1% | 10,5% | 18,3% | 8,7% | 6,3% | 16,4% | 20,6% | 15,0% |
Table 14. Protection of land cover classes within existing protected areas, by region (km2).
| Norway | Sweden | Finland | Russia | ||||||||||||
| Troms | Finnmark | Nordland | Norrbotten | Västerbotten | Lapland | Northern Ostrobothnia | Kainuu | North Karelia | Murmansk Region | Republic of Karelia | Arkhangelsk Region (excluding Novaya Zemlya and Franz Josef Land) | Nenets Autonomous District | Republic of Komi | ||
| Coniferous forest | 28 | 239 | 124 | 7 049 | 2 121 | 8 360 | 1 240 | 1 076 | 609 | 2 880 | 3 723 | 12 260 | 51 | 27 333 |
| Mixed forest | 11 | 11 | 43 | 963 | 180 | 1 877 | 155 | 93 | 79 | 3 411 | 1 490 | 4 033 | 183 | 12 353 |
| Deciduous forest | 535 | 779 | 743 | 5 319 | 2 235 | 6 459 | 396 | 229 | 127 | 3 345 | 953 | 3 091 | 792 | 4 316 |
| Open wetland | 122 | 562 | 182 | 3 678 | 1 167 | 6 855 | 1 266 | 474 | 262 | 2 250 | 1 567 | 6 337 | 4 323 | 5 947 |
| Grassland | 0 | 0 | 0 | 498 | 316 | 118 | 47 | 0 | 1 | 0 | 0 | 49 | 2 | 113 |
| Tundra vegetation | 2 419 | 2 941 | 4 400 | 7 880 | 4 210 | 5 767 | 0 | 0 | 0 | 6 605 | 0 | 1 | 11 497 | 9 645 |
| Natural lack of vegetation | 773 | 853 | 1 334 | 1 169 | 299 | 946 | 7 | 1 | 1 | 0 | 7 | 1 | 167 | 8 |
| Glacier | 103 | 20 | 394 | 198 | 2 | 0 | 0 | 0 | 0 | 0 | 0 | 0 | 0 | 0 |
| Agricultural lands | 2 | 2 | 7 | 0 | 14 | 2 | 3 | 0 | 5 | 0 | 120 | 329 | 0 | 30 |
| Developed area | 0 | 9 | 0 | 2 | 0 | 21 | 11 | 3 | 9 | 22 | 47 | 65 | 3 | 132 |
| Water | 80 | 87 | 209 | 1 425 | 429 | 2 551 | 292 | 300 | 735 | 979 | 2 064 | 838 | 2 179 | 662 |
5. Protection of high conservation value forests (HCVFs)
As of the end of 2020, in the Barents Region, 12,2% of forest ecosystems are covered by existing protected areas. Analysing the same indicator by country within the Barents Region, we found that, in Norway 8,7% of forests are covered by protected areas, in Sweden 17,5%, in Finland (including North Karelia) 16,1%, and in Russia 10,9% (Figure 18). Thus, the Aichi Biodiversity Target conservation threshold of 17% for forests has been overcome in the Barents Region only in Sweden. To achieve the 17% threshold for forests in the Barents Region as a whole, the share of protected forests should be increased by 4,8% units.
Figure 18. Share (%) for protected forests of all forests within the Barents Region, by country.
Various forest areas have different conservation values, including the level of biodiversity and natural ecosystem processes. As the BPAN project recommended (Kuhmonen et al. 2013), “In particular, large intact areas need to be prioritised for protection as they are crucial in maintaining ecological processes and ecosystem functions, and are under pressure from intensified land use.” Taking this into account, the situation with the protection of high conservation value forests (HCVFs) in the Barents Region is presented below. Within the framework of this publication, we apply to HCVFs and their boundaries the approach developed under the Barents Protected Area Network (BPAN) project (Suominen and Storrank 2017). Information on HCVFs protection is presented only for Sweden, Finland, and Russia, because data from Norway were not included in such analysis in 2015–2017. Data on HCVFs in Finland does not include North Karelia either.
As shown in Figure 19, the area of HCVFs in existing protected areas in Sweden is 17 518 km2, in Finland 17 711 km2, and in Russia 56 823 km2. As shown in Figure 20, the existing protected areas cover in Sweden is 75,2%, in Finland 56,9%, and in Russia 21,4% of the HCVFs. This means that the biggest potential for further protection of HCVFs is in Russia, but also Sweden and Finland have still much to protect.
Figure 19. Total area of HCVFs (km2) in existing protected areas in the Barents Region, by country.
Figure 20. The share of HCVFs covered with existing protected areas in the Barents Region, by country, % of total amount of the known HCVFs.
In Russia, in absolute figures, the area of HCVFs located in protected areas significantly exceed those in Finland and Sweden. However, relative values, the share of protected HCVFs in their total area, significantly prevails in Finland and Sweden (Figure 20). In other words, within the Barents Region, in Nordic countries, there are fewer HCVFs due to the intensive logging history, but they are better protected compared to Russia.
The effectiveness of HCVF protection provided by the protected areas can vary from one protected area to another. These variations are caused by differences in the protection regimes of individual nature reserves and national parks. Some protected areas can provide effective protection for HCVFs while protection regimes of other protected areas may allow logging or mining, i.e., and thus cannot ensure the protection of HCVFs. This must be taken into consideration for gaining a deeper understanding of how well HCVFs are protected. To do this we analyse coverage of HCVFs with protected areas, considering various levels of protection regimes (full, strict, strong, medium-level and weak protection), based on the classification of protected areas elaborated within the BPAN project (Aksenov et al. 2014, Kuhmonen et al. 2017). The protected area classification used is described shortly in chapter 2 and Table 2, and with all details in Aksenov et al. 2015 and Kuhmonen et al. 2017. It is also important to note, that within the framework of this publication, we only consider the situation with the effectiveness of protection regimes de jure, i.e., implying that protection regimes are always and everywhere implemented into practice. However, in reality, protection regimes may be violated or only partially implemented. This varies greatly from country to country. An assessment of the situation with the protection of HCVFs within protected areas de facto was not included in the list of our tasks in this study.
Figure 21 and Table 15 show the coverage of HCVFs by protected areas, considering their protection regime, by region. Weaker protection regimes do not protect biological diversity of HCVFs from activities such as logging, mining, or construction. In Finland and Sweden, HCVFs are better protected because most protected areas have strong protection regimes. In Nordic countries, there are no protected areas with weak protection regimes. On the other hand, except for Kainuu, in the regions of Finland, there are practically no full protection regime areas with forests; and in Sweden, there are no protected areas with full protection regimes, which means that, e.g., recreational use and reindeer herding are allowed. In Russia, the situation looks much more contrasted than in the Nordic countries. There is a significant share of protected areas with medium and weak protection regimes that cannot provide protection for HCVFs, as they do not prohibit human activities, such as logging, mining, or construction. On the other hand, in Russia, HCVFs are covered with a number of protected areas with full protection regimes that forbid, e.g., recreational use and reindeer herding. Within the Barents region, the share of HCVFs covered with protected areas is highest in Norrbotten (75,6%) and lowest in the Murmansk region (17,1%). However, in Russia, the coverage of HCVFs within protected areas, excluding protected areas of category 3, is as follows: Murmansk region 14,2%, Karelia Republic 25,0%, Arkhangelsk region 18,4%, Komi Republic 21,7%.
Figure 21. The coverage of HCVFs by protection regimes of protected areas, by region (%).
Table 15. The coverage of HCVFs by protection regimes of protected areas, by region (%).
| Sweden | Finland | Russia | ||||||||
| Norrbotten | Västerbotten | Lappland | Northern Ostrobothnia | Kainuu | Murmansk Region | Republic of Karelia | Arkhangelsk Region | Republic of Komi | ||
| HCVFs in 1a PAs - Full (%) | 0,0 | 0,0 | 0,0 | 0,0 | 1,1 | 4,1 | 5,9 | 0,8 | 7,7 |
| HCVFs in 1b PAs - Strict (%) | 0,0 | 0,0 | 1,9 | 2,2 | 1,4 | 0,0 | 0,0 | 0,6 | 0,2 |
| HCVFs in 1c PAs - Strong (%) | 75,6 | 74,4 | 49,8 | 51,4 | 64,5 | 4,5 | 3,2 | 2,5 | 1,1 |
| HCVFs in 2 PAs - Medium (%) | 0,0 | 0,0 | 3,6 | 8,0 | 6,0 | 5,6 | 15,9 | 14,4 | 12,8 |
| HCVFs in 3 PAs - Weak (%) | 0,0 | 0,0 | 0,0 | 0,0 | 0,0 | 2,8 | 1,4 | 1,1 | 1,2 |
 | HCVFs in planned PAs (%) | 9,4 | 3,5 | 0,1 | 0,0 | 0,3 | 12,5 | 31,3 | 2,7 | 0,0 |
| HCVFs in all existing PAs in each region (%) | 75,6 | 74,4 | 55,2 | 61,6 | 73,1 | 17,1 | 26,5 | 19,5 | 22,9 | |
| HCVFs in all existing PAs in each country (%) | 75,2 | 56,9 | 21,4 | |||||||
When analysing the HCVFs in the Barents region (Maps 19 and 20), it is also important to look at the situation with the protection of intact forest landscapes (IFLs). IFLs are a specific category of high conservation value forests. IFLs are a global concept that addresses the last large, unfragmented primary forests (Yaroshenko et al. 2001; Potapov et al. 2017). The concept of intact forest landscapes is institutionalised under the Forest Stewardship Council (FSC) forest certification standards. IFLs are partly overlapping with the abovementioned HCVFs. However, in addition to HCVFs, IFLs also contain non-forest ecosystems, such as open wetlands. As shown in Figure 22, the area of IFLs in existing protected areas in Sweden is 7 045 km2, in Finland 8 425 km2, and in Russia is 65 576 km2. Thus, the vast majority of IFLs in the Barents Region is in its Russian part. As shown in Figure 23, the share of IFLs covered by existing protected areas is in Sweden 83,0 %, in Finland 86,6%, and in Russia is 37,9%. The coverage of IFLs by protection regimes of protected areas, by region, is shown in Figure 24 and Table 16. In absolute terms, the total IFL area covered by protected areas is larger in the Russian part of the Barents Region than in Sweden and Finland. However, in relative terms, in the Nordic countries, the share of IFLs covered by protected areas in relation to the total area of IFLs is much higher than that in Russia. This significant proportion of protected IFLs in the Nordic countries is due to their small (in comparison to that of Russia) area and relatively low economic value for the forestry industry. In Russia, the situation is reversed: IFL areas are mostly very vast, and a large proportion of them are commercially valuable forests, which makes their protection more difficult.
Figure 22. Area of IFLs (km2) in all existing protected areas in the Barents Region, by country.
Figure 23. The share (%) of IFL area covered by existing protected areas in the Barents Region, by country.
Figure 24. The coverage of IFLs by protection regimes of protected areas, by region (%).
Table 16. The coverage of IFLs by protection regimes of protected areas, by region (%).
| Sweden | Finland | Russia | ||||||||
| Norrbotten | Västerbotten | Lapland | Northern Ostrobothnia | Kainuu | Murmansk Region | Republic of Karelia | Arkhangelsk Region | Republic of Komi | ||
| IFLs in 1a PAs - Full (%) | 0,0 | 0,0 | 0,0 | 0,0 | 0,0 | 5,8 | 13,5 | 1,4 | 12,4 |
| IFLs in 1b PAs - Strict (%) | 0,0 | 0,0 | 1,7 | 1,9 | 0,0 | 0,0 | 0,0 | 0,6 | 0,3 |
| IFLs in 1c PAs - Strong (%) | 82,2 | 94,9 | 82,5 | 96,3 | 95,4 | 4,8 | 7,0 | 3,3 | 0,6 |
| IFLs in 2 PAs - Medium (%) | 0,0 | 0,0 | 3,2 | 0,0 | 0,0 | 4,4 | 24,6 | 14,4 | 15,6 |
| IFLs in 3 PAs - Weak (%) | 0,0 | 0,0 | 0,0 | 0,0 | 0,0 | 3,9 | 0,9 | 1,4 | 1,7 |
| IFLs in planned PAs (%) | 0,0 | 0,0 | 0,3 | 0,0 | 0,0 | 9,1 | 38,1 | 5,5 | 0,0 |
| Total area of IFLs in all existing PAs in each region (%) | 82,2 | 94,9 | 87,4 | 98,2 | 95,4 | 18,9 | 46,0 | 21,1 | 30,7 | |
| Total area of IFLs in all existing PAs in each country (%) | 83,0 | 87,6 | 37,9 | |||||||
Map 19. Known HCV forest areas in Sweden, Finland and NW Russia, excluding North Karelia.
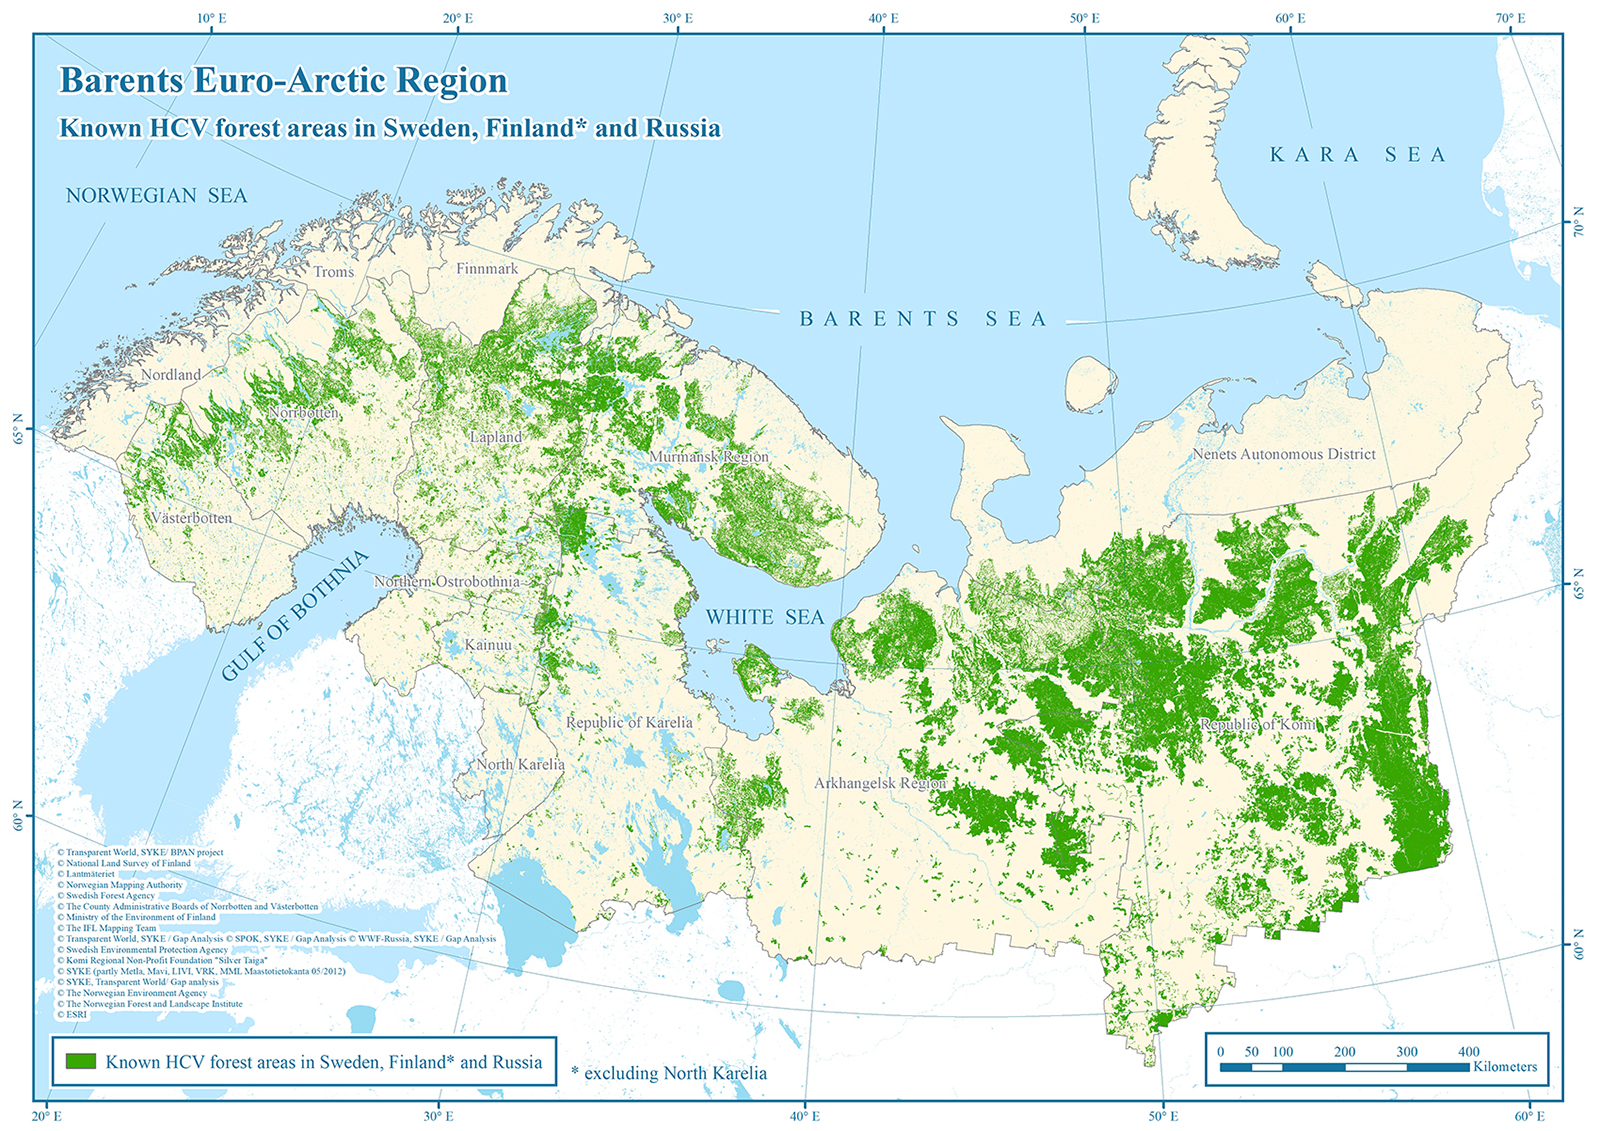
Map 20. Known HCV forest areas on existing protected areas in Sweden, Finland and NW Russia, excluding North Karelia.
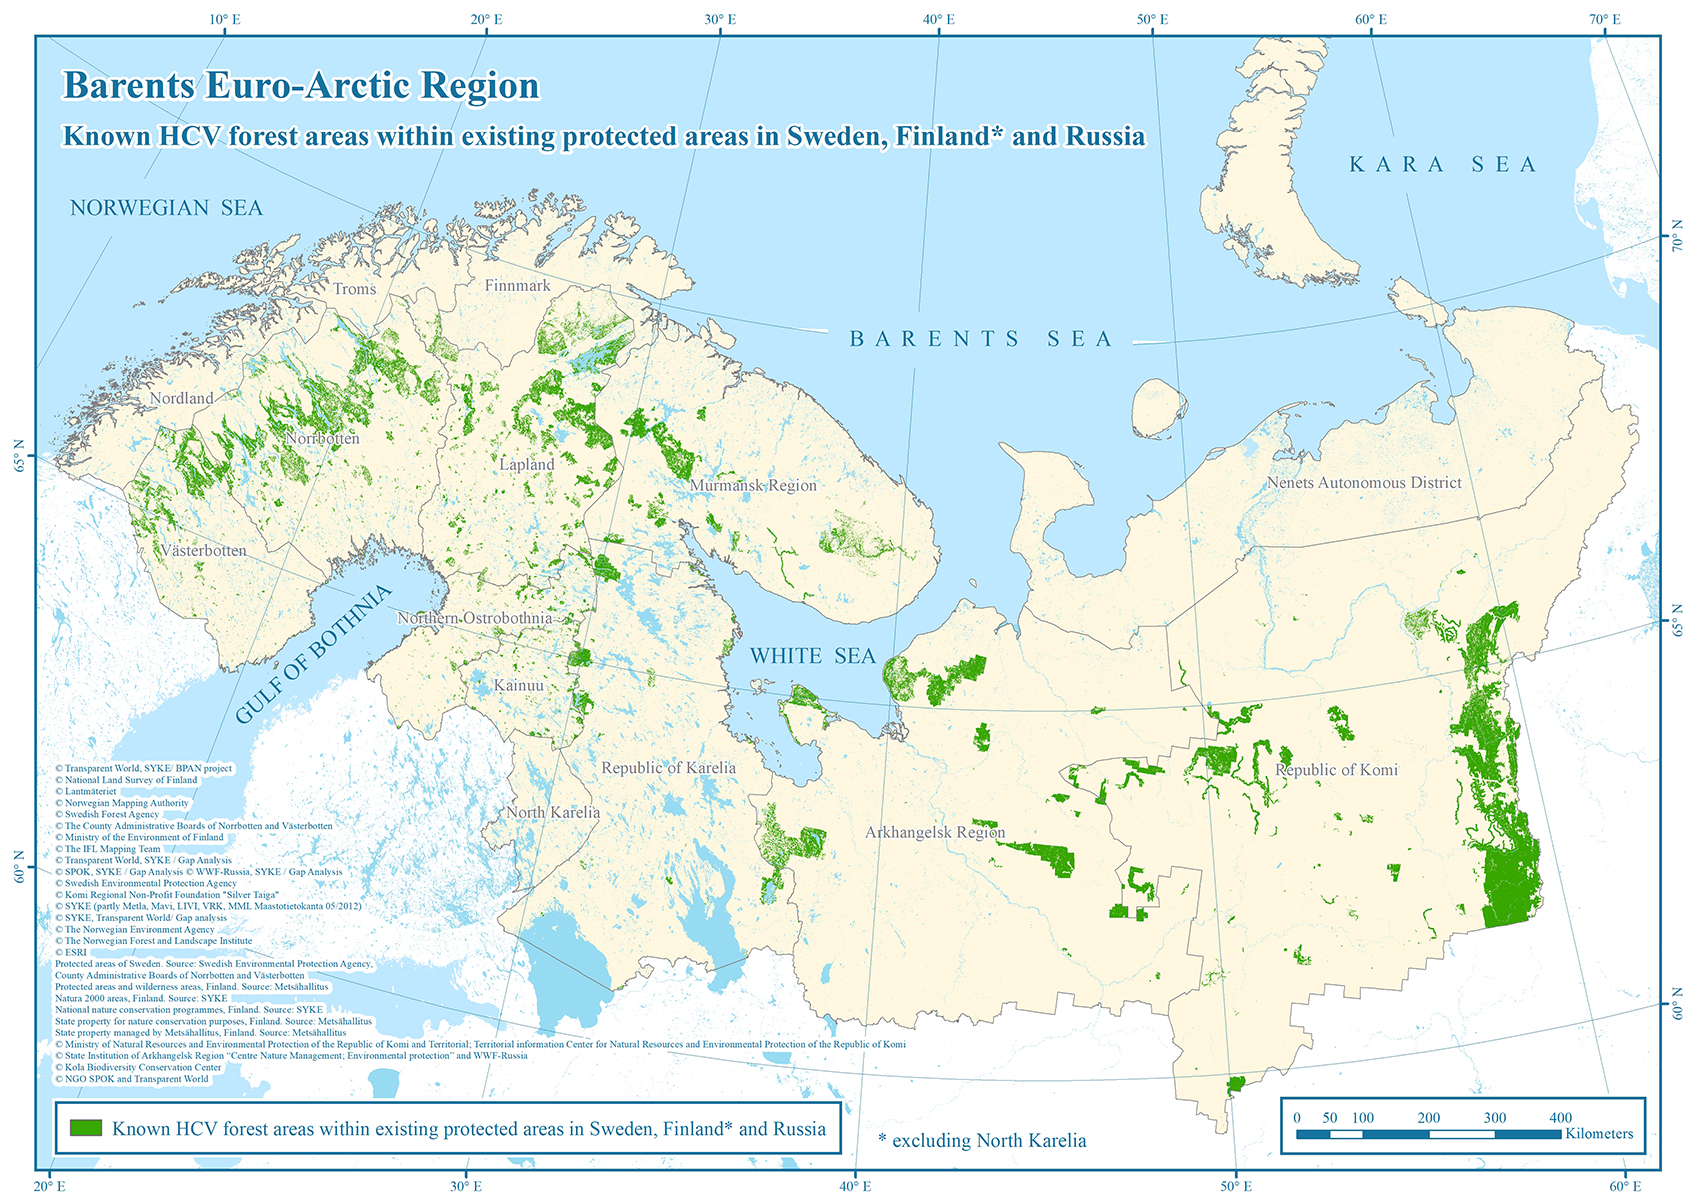
References
Aksenov, D., Kuhmonen, A., Mikkola, J. and Sobolev, N. (eds.) 2015: The Characteristics and Representativeness of the Protected Area Network in The Barents Region. Reports of the Finnish Environment Institute 29/2014. 189 p. Available at: http://hdl.handle.net/10138/156287
Anttila, S., Koskela, T., Simkin, J., & Aapala, K. (eds.) 2021. METSO-tilannekatsaus 2020. Etelä-Suomen metsien monimuotoisuuden toimintaohjelma 2008–2025. Luonnonvara- ja biotalouden tutkimus 36/2021. Luonnonvarakeskus. 30 p. Available at: http://urn.fi/URN:ISBN:978-952-380-213-1
Convention on Biological Diversity 2010. UNEP/CBD/COP/DEC/X/2. The Strategic Plan for Biodiversity 2011-2020 and the Aichi Biodiversity Targets. 13 p.
Kobyakov, K. (kollektiv avtorov pod. red. Kobyakova) 2011. Sokhranenie tsennykh prirodnykh territoriy Severo-Zapada Rossii. Analiz reprezentativnosti seti OOPT Arkhangelskoi, Vologodskoi, Leningradskoi i Murmanskoi oblastei, Respubliki Karelii, Sankt-Peterburga. Sankt-Peterburg. 506 s.
Kobyakov, K. & Jakovlev, J. (eds.) 2013. Atlas of high conservation value areas, and analysis of gaps and representativeness of the protected area network in northwest Russia: Arkhangelsk, Vologda, Leningrad and Murmansk Regions, Republic of Karelia, and City of St. Petersburg. Finnish Environment Institute. Helsinki. 517 p.
Kuhmonen,A., Aksenov, D., Dobrynin, D., Fossum, K., Höjer, O., Johnsson, B., Juvonen, S., Khrustaleva, Y., Lindholm, T., Petrov, V., Shibeko, V., Sobolev, N., Sutkaitis, O., Tyupenko, T. 2013. Barents Protected Area Network - Recommendations for Strengthening the Protected Area Network in the Barents Region. Finnish Environment Institute. Available at: https://helda.helsinki.fi/bitstream/handle/10138/159009/PolicyBrief_BPAN_ENG_5_12_2013.pdf?sequence=1&isAllowed=y
Kuhmonen, A., Mikkola, J., Storrank, B. and Lindholm, T. (eds.) 2017: Protected areas and high conservation value forests in the Barents Euro-Arctic Region – Sweden Finland and Russia. Reports of the Finnish Environment Institute 33/2017. 164 p. Available at: http://hdl.handle.net/10138/229432
Laita, A., Horne, P., Kniivilä, M., Komonen, A., Kotiaho, J., Lahtinen, M., Mönkkönen, M., Rämö Anna-Kaisa, 2012. METSO-ohjelman väliarvio 2012. Metsonpolku.fi. 63 s. https://metsonpolku.fi/documents/115183005/124715770/METSO-ohjelman_valiarvio_2012.pdf/cc190ee2-a05c-9e40-91ea-26c4b4fd96a1/METSO-ohjelman_valiarvio_2012.pdf?t=1655809356812 (Referenced 09.04.2022).
Luotonen, H. 2013 (ed). Ympäristön tila 2013. Pohjois-Karjala. Centre for Economic Development, Transport and the Environment of North Karelia. 38 p. Available at: https://www.doria.fi/handle/10024/96469
Potapov, P., M.C. Hansen, L. Laestadius, S. Turubanova, A. Yaroshenko, C. Thies, W. Smith, I. Zhuravleva, et al. 2017. The last frontiers of wilderness: Tracking loss of intact forest landscapes from 2000 to 2013. Science Advances 3.
Regional land use plan of North Karelia, phase 1. 2022. Pohjois-Karjalan maakuntaliitto. Available at: https://pohjois-karjala.fi/vaihekaava1/
Suominen, M. & Storrank, B. 2017. Protected areas and high conservation value forests in the Barents Region: Sweden, Finland and Russia. Available at: http://hdl.handle.net/10138/229434
Yaroshenko, A.Y., P.V. Potapov, & S.A. Turubanova. 2001. Last intact forest landscapes of Northern European Russia. Global Forest Watch.
About this publication
Changes in the protected area network and forest biodiversity protection in the Barents Region 2013–2020
Editor: Anna Kuhmonen
Authors: Anna Kuhmonen, Denis Dobrynin, Jyri Mikkola, Tiia Kalske, Vilma Lehtovaara, Cathrine Amundsen, Mia Husdal, Jukka Nykänen and Sveinung Råheim
Spatial data analysis: Denis Dobrynin
Map design: Denis Dobrynin
Experts on GIS datasets:
Cathrine Amundsen, County Governor of Troms and Finnmark, Norway
Frédéric Forsmark, County Administrative Board of Norrbotten, Sweden (preparation of dataset for Swedish protected areas)
Carlos Paz Von Friesen, County Administrative Board of Västerbotten, Sweden
Jyri Mikkola, Finnish Environment Institute (preparation of dataset for Finnish protected areas)
Tomi Heilala, Finnish Environment Institute (preparation of dataset for Finnish protected areas)
Minna Kallio, Finnish Environment Institute
Denis Dobrynin (preparation of dataset for Russian protected areas)
Olga Petrova, Yuri Pautov, Elena Smirennikova, Olga Ilina (data on Russian new protected areas)
ISBN 978-92-893-7347-0 (PDF)
ISBN 978-92-893-7348-7 (ONLINE)
http://dx.doi.org/10.6027/temanord2022-535
TemaNord 2022:535
ISSN 0908-6692
© Nordic Council of Ministers 2022
Cover photo: Unsplash.com
Published: 22.09.2022
Disclaimer
This publication was funded by the Nordic Council of Ministers. However, the content does not necessarily reflect the Nordic Council of Ministers’ views, opinions, attitudes or recommendations.
Rights and permissions
This work is made available under the Creative Commons Attribution 4.0 International license (CC BY 4.0) https://creativecommons.org/licenses/by/4.0.
Translations: If you translate this work, please include the following disclaimer: This translation was not produced by the Nordic Council of Ministers and should not be construed as official. The Nordic Council of Ministers cannot be held responsible for the translation or any errors in it.
Adaptations: If you adapt this work, please include the following disclaimer along with the attribution: This is an adaptation of an original work by the Nordic Council of Ministers. Responsibility for the views and opinions expressed in the adaptation rests solely with its author(s). The views and opinions in this adaptation have not been approved by the Nordic Council of Ministers.
Third-party content: The Nordic Council of Ministers does not necessarily own every single part of this work. The Nordic Council of Ministers cannot, therefore, guarantee that the reuse of third-party content does not infringe the copyright of the third party. If you wish to reuse any third-party content, you bear the risks associated with any such rights violations. You are responsible for determining whether there is a need to obtain permission for the use of third-party content, and if so, for obtaining the relevant permission from the copyright holder. Examples of third-party content may include, but are not limited to, tables, figures or images.
Photo rights (further permission required for reuse):
Any queries regarding rights and licences should be addressed to:
Nordic Council of Ministers/Publication Unit
Ved Stranden 18
DK-1061 Copenhagen
Denmark
pub@norden.org
Nordic co-operation
Nordic co-operation is one of the world’s most extensive forms of regional collaboration, involving Denmark, Finland, Iceland, Norway, Sweden, and the Faroe Islands, Greenland and Åland.
Nordic co-operation has firm traditions in politics, economics and culture and plays an important role in European and international forums. The Nordic community strives for a strong Nordic Region in a strong Europe.
Nordic co-operation promotes regional interests and values in a global world. The values shared by the Nordic countries help make the region one of the most innovative and competitive in the world.
The Nordic Council of Ministers
Nordens Hus
Ved Stranden 18
DK-1061 Copenhagen
pub@norden.org
Read more Nordic publications on www.norden.org/publications