
- Full page image w/ text
- Table of contents
- Foreword
- Preface – Covid measures
- Summary
- Sammendrag
- 1 Introduction
- 1.1 Definitions and limitations
- 2 Review on green stimulus measures
- 2.1 The understanding of green stimulus
- 2.2 Assessments of stimulus measures
- 3 Nordic stimulus measures in response to covid-19
- 3.1 Overview of Nordic financial stimulus measures
- 3.2 Comparison of total stimulus measures granted
- 4 Identification of sectors with green stimulus potential
- 4.1 Step 1: Identify impact of Covid-19 pandemic on Nordic economic sectors
- 4.2 Step 2: Identify impact of economic sectors on CO2 emissions
- 4.3 Step 3: Identify impact of economic sectors on the environment
- 4.4 Step 4: Identify economic sectors with the largest green stimulus potential
- 5 The impact of the Nordic financial stimulus measures on the climate and environment
- 5.1 Method for analysing impact of financial stimulus measures
- 5.2 Stimulus measures with potential impact on climate/environment
- 5.3 Climate impact of stimulus measures with direct budgetary impact
- 5.4 Environmental impact of Covid-19 stimulus measures with direct budgetary impact
- 5.5 Impact of guarantees and loans
- 6 Summary and discussion
- Main findings
- Discussion
- Policy implications
- References
- Appendix A – NACE sectors
- Appendix B – Stimulus measures by country
- Appendix C – Sectors with largest negative economic impact per country
- Appendix D - Contribution to total CO2 emissions by sector
- Appendix E – Emission intensive sectors
- Appendix F – Method for analysing effect on climate and environment
- Appendix G – Environmental effect of Covid-19 stimulus per country
- About this publication
MENU
Contents
Foreword
Since the winter of 2020, the spread of covid-19 has affected economic activity in the Nordic region. All the Nordic countries introduced fiscal policy measures to counteract the economic downturn and the negative effects the lockdown has on economic output and employment. At the same time, the Nordic countries are concerned with the more long-term crisis related to global warming, and the national targets for reducing greenhouse gas emissions and environmental degradation. The financial stimulus measures may exacerbate or positively impact challenges related to the environment and to greenhouse gas emissions.
In this project we have assessed the economic stimulus measures that have been introduced in the Nordic region, and their impact on climate and the environment.
The project is a cooperation between Menon Economics, Friðrik Már Baldursson, Professor of Economics at Reykjavik University and Erik Dahlberg at HBS Economics. We are grateful for all comments from the members of The Nordic Group on Environment and Economy (NME).
March 2022
Annegrete Bruvoll
Project responsible
Menon Economics
Nina Bruvik Westberg
Erika Karttinen
Operative project leaders
Menon Economics
Preface – Covid measures
During the coronavirus disease 2019 (COVID-19) the Nordic governments have all launched powerful economic stimulus packages to protect businesses and households from losses of production and employment, and to avoid a deep recession. In the spring 2020 the climate and environment ministers issued a joint statement where they emphasized the need to exploit synergies between economic recovery and green transition.
The purpose of this project has been to map and analyze the stimulus measures in our countries that have impacts on climate and the environment. How “green” or “brown” have these measures been? Part of the task has been to identify the sectors of greatest relevance, i.e. the sectors significantly affected by the economic disruptions resulting from COVID-19, and at the same time relevant because they have substantial impact on climate or the environment. One interesting finding is that stimulus measures having a positive or negative climate and environmental impact seem to constitute a relatively small part of the overall economic stimulus. Overall, this could indicate that the synergies mentioned by the climate and environment ministers are either not so large or have not been utilized. This is one issue that the consultants have commented on in the study.
The report has been prepared by Menon Economics, in cooperation with Fridrik Már Baldursson, Professor of Economics at Reykjavik University and Erik Dahlberg at HBS Economics. Members of the Nordic group for Environment and Economy (NME) have provided comments on draft reports during the project. But the authors of the report are responsible for the content, and any views and recommendations presented in the report do not necessarily reflect the views and positions of the Nordic governments or of NME.
April 2022
Bent Arne Sæther
the Nordic working group for Environment and Economy
Summary
This report assesses the “green stimulus” relevance of the covid-19 stimulus measures in the Nordic region. By green stimulus we mean measures that can achieve economic stimulus while also reducing greenhouse gas emissions and enhancing environmental and natural resource quality.
All Nordic countries implemented comprehensive covid-19 stimulus packages after the outbreak of the pandemic, amounting to between 2000 euro per capita in Finland to 4400 euro per capita in Denmark. We have identified that at least 6–21 percent of the measures suit the definition as green stimulus in terms of decreasing greenhouse gas emissions. A lower share, at least 2–13 percent, contributes to increase greenhouse gas emissions. The picture is almost the same for the environment. This is in line with a similar study covering the G20 economies.[1]Nahm, Miller and Urpelainen (2022) Hence, we do not find strong evidence of green stimulus in the covid-19 packages. However, neither do we find evidence that the net effects of the Nordic covid-19 packages on climate gas emissions and the environment were negative; the remaining measures are either assessed as not having any significant impact on emissions or the environment, i.e., schemes directed at sectors with low emission intensity or low environmental impact, or they are not possible to evaluate.
Most measures target several sectors or the economy in general, such as business cost support. For these support schemes, more comprehensive analyses for each measure are needed to conclude on the climate and environmental effects.
The main argument for green stimulus programs is that they can achieve economic stimulus targets while also improving the environment. This does, however, not agree with economic theory on policy design, which states that to achieve two separate policy targets efficiently, one separate instrument for each goal is needed. Our literature review supports this. For example, Chen et al. (2020) states that to put limited government funds to the best use, most of the pandemic-related stimulus should initially focus on investments that get people back to work quickly. This may be said to correspond to most of the Nordic stimulus measures.
Any public project of a certain size should undergo a cost-benefit analysis, where climate and environmental effects are considered in line with the positive benefits to employment and economic growth. In this approach, both elements in green stimulus - stimulating the economy while reducing greenhouse gas emissions and enhancing environmental and natural resource quality - are balanced. Direct instruments counteracting climate and environmental costs are generally more efficient than scaling down the measure to stimulate the economy.
For most of the covid-19 support measures undertaken by the Nordic governments, there is a lack of information enabling analysis of green effects. This reflects the urgency of getting the economic support schemes in place, where pre-evaluations based on full cost-benefit analyses were probably not prioritized. Our impression is that the short-term measures supporting companies and households were mostly appropriate in that they prevented a catastrophic downturn in the economy and household incomes.
Some green stimulus measures can also reduce market failures, such as support for technology development, R&D and market introduction. Detailed, ex-post evaluations of the largest support schemes could bring insight into which instruments provide the most efficient green stimulus. This could be valuable information in future economic crises with little time to analyse the effects of the measures before implementation.
Footnotes
- ^ Nahm, Miller and Urpelainen (2022)
Sammendrag
Denne rapporten vurderer i hvilken grad de økonomiske støtteordningene i Norden i forbindelse med covid-19 har vært grønne støtteordninger. Med grønne støtteordninger mener vi tiltak som stimulerer økonomisk aktivitet og samtidig bidrar til reduserte klimagassutslipp og bedret miljø.
Alle nordiske land implementerte omfattende stimuleringspakker etter utbruddet av pandemien, som beløper seg til mellom 2000 euro per innbygger i Finland til 4400 euro per innbygger i Danmark. Vi har identifisert at minst 10–20 prosent av tiltakene virker til reduserte klimagassutslipp, mens en lavere ande, minst 2–13 prosent, stimulerer til økte utslipp. Bildet er nesten det samme for miljøet (henholdsvis 2–13 og 2–13 prosent). Disse funnene er i samsvar med en lignende studie av G20-landene.[1]Nahm, Miller and Urpelainen (2022) Selv om vi ikke finner sterke indikasjoner på grønn stimulans i de nordiske covid-19-pakkene, finner vi heller ikke at tiltakene samlet sett har hatt negativ innvirkning på klimagassutslipp og miljø; de resterende tiltakene vurderes enten å ikke ha noen vesentlig påvirkning på utslipp eller miljø, eller de er ikke mulig å vurdere.
De fleste tiltak retter seg mot flere sektorer eller økonomien generelt, for eksempel støtte til bedrifter for å opprettholde sysselsettingen. Det vil være nødvendig med mer detaljerte analyser for å anslå klima- og miljøeffekter av slike tiltak.
Hovedargumentet for grønne stimuleringsprogrammer er at de både kan støtte økonomisk vekst og ha positive klima- og miljøeffekter. Å oppnå flere mål med ett virkemiddel samstemmer imidlertid ikke med økonomisk teori, som sier at effektiv måloppnåelse krever ett virkemiddel per mål. Vår litteraturgjennomgang av covid-19-analyser støtter dette, der for eksempel Chen et al. (2020) påpeker at mesteparten av støtteordningene i pandemien bør fokusere på investeringer som får folk raskt tilbake i arbeid. Vi finner at dette også er i samsvar med de fleste av de nordiske stimuleringstiltakene.
Ethvert offentlig prosjekt av en viss størrelse bør gjennomgå en nytte-kostnadsanalyse, hvor klima- og miljøeffekter vurderes i tråd med de positive virkningene for sysselsetting og økonomisk vekst. Denne tilnærmingen balanserer begge elementene i grønn stimulans, både økonomisk stimulans og klimagassutslipp/miljø. Direkte virkemidler som motvirker klima- og miljøkostnader er generelt mer effektive enn å trappe ned tiltaket som skal stimulere økonomien for å nå alt med ett instrument.
For de fleste covid-19-støttetiltakene mangler informasjon som muliggjør analyser av grønne effekter. Dette viser at det har hastet å få på plass den økonomiske støtten, og forhåndsevalueringer basert på fulle nyttekostnadsanalyser kunne ikke prioriteres. Vårt inntrykk er at de kortsiktige tiltakene til støtte for bedrifter og husholdninger stort sett har nådd sine mål ved bygge unngå en vedvarende nedgang i økonomien og husholdningenes inntekter.
Støtteordninger som bygger ned markedssvikt, som støtte til teknologiutvikling, FoU og markedsintroduksjon vil både kunne representere grønne støtteordninger og være kostnadseffektive. Etter-evalueringer av de største støtteordningene kan gi innsikt i hvilke virkemidler som mest effektivt kan stimulere både økonomien og klima/miljø positivt. Dette kan være verdifull informasjon i fremtidige økonomiske kriser, med knapp tid til å analysere tiltakseffekter før implementering.
Footnotes
- ^ Nahm, Miller and Urpelainen (2022)
1 Introduction
Since the winter of 2020, the spread of covid-19 has affected economic activity in the Nordic region.[1]All Nordic countries have introduced national measures to limit the spread of infection. In addition, changes in other countries' economic activity have affected the Nordic countries. All Nordic countries have introduced fiscal policy measures to counteract the economic downturn and the negative effects the lockdown has on economic output and employment. At the same time, the Nordic countries are concerned with the more long-term crisis related to global warming, and the national targets for reducing greenhouse gas emissions and environmental degradation. Lockdown measures and the economic downturn led to reductions in greenhouse gas emissions during 2020. The Nordic countries’ ability to reduce their emissions will depend on the type and strength of the financial stimulus measures, which may exacerbate or positively impact challenges related to the environment and to greenhouse gas emissions.
The first fiscal policy measures that were introduced were mainly aimed at limiting the number of bankruptcies and securing jobs, as well as providing financial security for the laid-off and the unemployed. In the changing pandemic situation after the spring of 2020, the countries have continuously adjusted the measures to counteract the negative economic effects of lockdowns. In the beginning of 2022, we may face the end of the pandemic, but are still in an uncertain stage. It is likely that there will be long-term needs for financial support to bring the economy back to a more stable path. Most measures are designed independently of climate and environmental goals, but some are labelled as causing double positive effects: both stimulating GDP growth and the transition to low-emission economies.
Facing the multiple challenges, it is of great importance to identify fiscal instruments that at the same time contribute to the achievement of climate targets and reduce the pressure on the environment. The variation in the implemented instruments in the pandemic offers a broad set of measures to be analysed for this purpose. The question of interest is to identify which measures have the favourable property of serving both policy goals, and which stimulus measures should be less used if they undermine the environment and contribute to increased global warming.
The Nordic Working Group for Environment and Economy (NME) at the Nordic Council of Ministers (NCM) has requested a survey and an assessment of stimulus measures that have been introduced or are considered in the Nordic region, and their impact on climate and the environment. The target groups for the results are Nordic and international decision-makers, civil servants and politicians who prepare and execute the stimulus measures and coordinate fiscal and climate and environmental policy.
Footnotes
- ^ All Nordic countries have introduced national measures to limit the spread of infection. In addition, changes in other countries' economic activity have affected the Nordic countries.
In the announcement, the NME outlines four main questions:
Question 1: Identify and briefly summarize the knowledge base, including theory, about measures that have both a stimulus effect and that in the short and long term have a positive impact on the environment and climate.
Question 2: Identify sectors where stimulus measures are most relevant in light of the current economic crisis and which can lead to particularly large and positive environmental and climate impacts.
Question 3: Describe which measures the Nordic countries have implemented or plan to implement, which can be classified as environmental and climatic measures, or which counteract this development.
Question 4: Analyse whether there are any measures that can be effective in terms of economic activity, but which risk making it difficult for the Nordic countries to achieve their climate goals, and whether they can be designed in a different way so that they have so little negative impact on the environment as possible and contribute to the fulfilment of climate goals.
1.1 Definitions and limitations
The Nordic countries have introduced a wide range of measures and policies, including financial stimulus measures, mandates, bans and regulations. In this project we focus on the financial stimulus measures. When relevant, we refer to other policies that may impact economic growth and/or the climate/environment. In line with the tender requirements, we do not focus on EU’s financial stimulus measures under the EU Green Deal.
We assume that all implemented covid-19 stimulus measures have the anticipated short-term positive effects on the economy. Hence, we do not focus further on the effects on employment and economic growth.
The measures are based on information in the respective country’s state budget for 2020 and 2021 and cover the central government’s stimulus measures only. We do not capture local stimulus measures unless the state transfers funds to this purpose.
We define positive climate impacts as impacts that reduce greenhouse gas emissions or adapts to climate change, compared to a scenario with the economic consequences of the pandemic but without the stimulus measures.
Positive environmental impacts are impacts that enhance environmental and natural resource quality, such as reduced pollution and preservation of biodiversity and ecosystem services, compared to a scenario with the economic consequences of the pandemic but without the stimulus measures.
The analysis is based on observations and data available up to the fall of 2021.
2 Review on green stimulus measures
2.1 The understanding of green stimulus
Even though there are several definitions of green stimulus in the literature, the definitions seem to be conceptually similar. The formulation by Strand and Toman (2010), in a working paper for the World Bank, represents a standard definition of green stimulus:
"the application of policies and measures to stimulate short run economic activity while at the same time preserving, protecting and enhancing environmental and natural resource quality both near-term and long-term”.
Agrawala et al. (2020) argues that what separates green stimulus from green policies in general is that it is aimed at buffering an economic shock in addition to having environmental benefits. The literature includes several other terms used to describe similar concepts to green stimulus, e.g., green recovery[1](OECD, 2021) or sustainable recovery[2]Hepburn et al. (2020).
The definition of green varies, as exemplified in the definition from Strand and Toman (2010), and is often context specific. The greenness of a measure can for instance be connected to carbon emission targets, environmental clean-up targets, biodiversity, air pollution, material usage efficiency, water usage, or investments in environmental R&D.[3](OECD, 2020) When we use the term green in this report, we mean any type of effect that can be said to preserve, protect, or reach targets related to the environment or climate.
The short-term or long-term economic benefit of stimulus measures is often measured as a change in employment[4]Popp et al. (2020), or change in gross domestic product (GDP)[5](IEA, 2020).
The main argument for green stimulus programs is that they can achieve economic stimulus targets while also reducing climate gas emissions and improving the environment. Hence, these measures are argued to have a double effect compared to non-green stimulus measures, as they can both assist with recovery from the covid-19 crisis and steer society onto a more sustainable path. While this sounds like a compelling argument, it does not coincide with economic theory on policy design, which states that to achieve two separate policy targets efficiently, one separate instrument for each goal is needed. Policies aiming to achieve two targets at once, in this case short- or long-term environmental benefits and economic gains, are difficult to design efficiently. Hence, we cannot take as a given that the first argument for green stimulus holds.
Another argument is that green stimulus can increase long-term competitiveness, as the global demand of green goods, services, and processes are believed to increase in coming years.[6]Strand and Toman (2010) An economic crisis can result in less focus on environmental questions and climate change, and thus offset needed structural change. For instance, recovery measures in support of carbon intensive technologies risk creating lock-in effects which holds back the green transition.[7]Strand and Toman (2010), Hepburn et al. (2020) Green stimulus may be an opposing force. An example of stimulus based on this argument is the European Green Deal[8](European Commission , 2021b), which combines covid-19 recovery with long-term greenhouse gas emission and resource-efficiency goals.
Both economic and environmental effects can be short- and long-term. Pollution clean-up is an example of a measure with primarily short-term effects, while infrastructure investments have more of a long-run impact.
2.2 Assessments of stimulus measures
In our search for empirical studies of efficient green stimulus measures, we find that the literature is scant in this field.[1]This is in contrast to the literature on double dividend effects of environmental taxes. This refers to the notion that taxes can both reduce pollution and reduce the overall economic costs associated with the tax system. If using the revenue generated from the environmental taxes to displace more distortionary taxes, economic growth may also be stimulated. The same is reflected in Agrawala et al. (2020), who evaluates green stimulus packages in response to the global financial crisis 2007–08 and draws lessons for the covid-19. They conclude that evaluations of macroeconomic, labour market and environmental effects of the green stimulus measures are relatively scarce, and point to the difficult task of defining a suitable counterfactual to compare the impacts against.
We do, however, find some qualitative evaluations of green stimulus measures, and studies of economic stimulus on the environment and the economy.
Based on survey answers from 231 experts, including central bank officials, finance ministry officials, and other economic experts from G20 countries, Hepburn et al. (2020) identified policies with large potential for both economic recovery and positive climate impact. The experts were asked to assess recovery-policy types based on speed of implementation, long-run economic multipliers, and positive or negative climate impact potential. The results are shown in Figure 2.1. The authors identified five policies that can have both a positive climate impact as well as an impact on long-run economic multipliers:
- clean physical infrastructure investment in the form of renewable energy assets, storage (including hydrogen), grid modernisation and CCS technology
- building efficiency spending for renovations and retrofits including improved insulation, heating, and domestic energy storage systems
- investment in education and training to address immediate unemployment from COVID-19 and structural shifts from decarbonisation
- natural capital investment for ecosystem resilience and regeneration including restoration of carbon-rich habitats and climate-friendly agriculture
- clean R&D
Footnotes
- ^ This is in contrast to the literature on double dividend effects of environmental taxes. This refers to the notion that taxes can both reduce pollution and reduce the overall economic costs associated with the tax system. If using the revenue generated from the environmental taxes to displace more distortionary taxes, economic growth may also be stimulated.
All the above-mentioned policies are assessed to be relatively slow to implement, implying that they are not suitable as rapid responses to economic crises. The paper does not identify any quickly implementable policy measures with a positive climate impact.
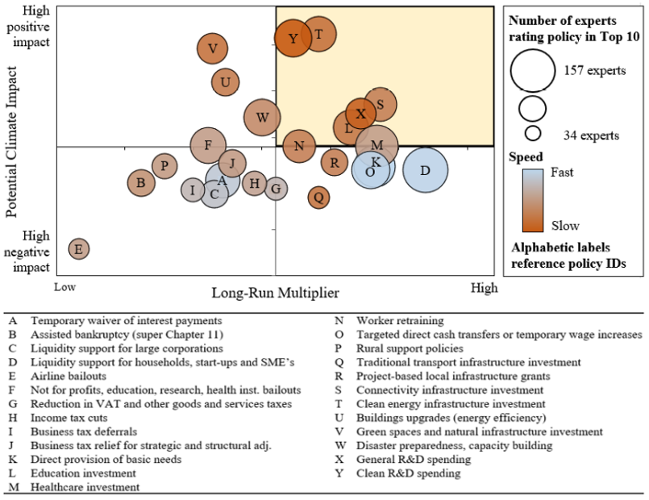
Figure 2.1 Categorization of policy measures based on potential climate impact, long-run multiplier, and speed of implementation.
Source: Hepburn et al. (2020)
Strand and Toman (2010) gives a qualitative assessment of expected economic and environmental effects from a variety of stimulus measures, see Table 2.1. Many of these policies align with the policies suggested by Hepburn et al. (2020). The column “short-term stimulus” considers short-term economic effects, whereas the three other columns consider longer term effects.[1]Strand and Toman (2010) present effects both for developed and developing countries. We present here the effects for developed countries. Overall, the more labour-intensive a measure is, the higher is the expected economic effect (in terms of increased employment). Short- or long-term depend on how quickly different types of projects can be launched and the first- and second order effects. The effects on greenhouse gas emissions or other environmental factors vary between policies.
Footnotes
- ^ Strand and Toman (2010) present effects both for developed and developing countries. We present here the effects for developed countries.
Table 2.1 Policies categorized based on short- and long-term stimulus effect, in addition to greenhouse gas (GHG) and environment and resource “co-benefits”[1]The co-benefits comprise, e.g., of internalization of otherwise non-corrected external effects. These can be environmental but can also include effects such as reduced accident rates and congestion from road traffic following increased fuel prices..
Source: Adapted based on Strand and Toman (2010)
Footnotes
- ^ The co-benefits comprise, e.g., of internalization of otherwise non-corrected external effects. These can be environmental but can also include effects such as reduced accident rates and congestion from road traffic following increased fuel prices.
| Policy category | Short-term stimulus | Long-term growth | GHG emission reductions | Environment and resource “co-benefits” |
| Quickly implemented, labour intensive, activities | ||||
| Non-hazardous environmental clean-up | High | Low | Low | High |
| Natural resource maintenance, monitoring and policing | Medium | Low | Variable | High |
| Energy efficiency retrofits | High | Medium | Medium | Medium |
| Expansion of currently cultivated bio-energy | Medium | Low | Variable | Variable |
| Expanded biological carbon sequestration | Medium | Low | Medium | Variable |
| Capital investments in environmental and natural resources | ||||
| Conventional pollution control/prevention | Low | Medium | Variable | High |
| Increased renewable electricity production | Low | Variable | High | Medium |
| Introduction of new forms of bio-energy | Low | Variable | Medium | Variable |
| Energy efficiency improvements in new capital | Low | Low | High | Medium |
| Green transport infrastructure | Low | Low | Medium | Medium |
| Investment to strengthen resilience of natural resources to climate change | Medium | Medium | Variable | High |
| Other specific programs with “green” characteristics | ||||
| “Cash for clunkers”* | Medium | Low | Low | Low |
| Development and expansion of recycling systems | Low | Low | Low | Variable |
| Congestion reduction measures | Low | Medium | High | Medium |
| Altered urban forms for greater density and mixed use | Low | Medium | Medium | Low |
| Power grid expansion | Low | Medium | Low | Variable |
| *Incentive programs to trade in old, less fuel-efficient cars for new, more fuel-efficient ones. | ||||
Strand and Toman (2010) argue that infrastructure investments in sectors like transport, energy, supply, and water could be compatible with long-term growth and environmental targets. While they conclude that these investments are important for long-term economic activity, they also note that measures categorised as green within these sectors are often large projects with long time horizons, making them less suitable for short-term stimuli. This is especially true for investments in the transport sector. The authors argue that investments in the energy sector could instead provide shorter-term economic gains.
Pollitt (2011) assessed the green elements of the fiscal stimulus packages in response to the financial crisis in 2008 in nine EU and four other countries. According to their evaluation, optimal recovery packages must include a balance between policies that provide short and long-term benefits (both economic and environmental). They also underline that the short-term economic benefits of green stimulus can be limited. They find that the short-term benefits are largely economic and could hence be equally met by non-green policies. Further, green R&D and innovation measures also bring long-term economic benefits from greater energy efficiency, reduced imports of fossil fuels and reduced exposure to volatile global energy prices.
2.2.1 Economic effects
Based on the empirical literature, green stimulus measures appear to have mostly long-term rather than short-term effects on the economy, even if there are some studies contradicting this conclusion. Even if the short-term effect of green stimulus is limited, the stimulus could still play an important role in economic recovery through its effects on long-term growth and employment.
Strand and Toman (2010) argue that green stimulus measures may have a limited effect economically, at least in the short run, compared to other available alternatives. Especially, they argue that government support for renewable energy is not an efficient way to increase employment in the short-term, since stimulating other sectors would create more employment. The conclusion is based on a literature review of papers studying economic effects of green stimulus in the EU overall in addition to country-specific studies on Denmark and Spain as well as the US. The effects of renewable energy investments could be different today, as unit costs for renewable energy have decreased and the investments required today are proportionately lower. Nevertheless, Agrawala et al. (2020) also conclude that the evidence of job creation from renewable energy policies is still mixed.
Popp et al. (2020) also conclude that “while a green stimulus can help reshape the economy, it is less likely to help restart the economy”. They study the US American Recovery and Reinvestment act of 2009 (ARRA) and find that each 1 mill. dollars of green stimulus created 15 new jobs. However, these job gains are found in years 2013–2017, and they find little evidence of employment gains before this. Green stimulus, based on this study, does increase employment, but works more slowly than non-green stimulus. This is in line with the efficiency argument that two policy targets require two separate instruments. To put limited government funds to the best use, the authors argue that most of the pandemic-related stimulus should initially focus on investments that get people back to work quickly.[1]This argument is presented in a published paper in 2020, Chen et al. (2020)
Similar to other scholars, Brahmbatt (2021) states, based on a literature review of theoretical and empirical studies on green recovery, that the win-win situation that green stimulus is argued to represent is unlikely to work in practise: “Green recovery would yield more environmental benefits, especially in the medium and long term, but would generate a relatively slower and smaller recovery from the COVID crisis”.
On the other hand, a study by Pollitt (2011) for the European Commission finds that the green stimulus after the 2008–09 crisis did have a positive short-run impact on the EU economy.[2]See Pollitt (2011) The impact on short-term economic multipliers from green investments ranged from around 0.6 percent to 1.1 percent of GDP at the national level, and up to 1.5 percent of GDP at the European level. An important finding in this study is that co-ordinated green stimulus measures delivered greater short-term economic impact than green measures implemented by individual countries. The study also finds that the effects from green investments are similar to those from other investments.[3]Estimate is based on the short-term multiplier effect, the ratio of the boost to GDP. See Pollitt (2011).
Further, Chen et al. (2020) argue that there is a place for green stimulus in a pandemic recovery even if it would not have significant short-run effects, as the long-run benefits of green stimulus on the economy are clear. The authors argue that green recovery measures should be seen as assisting in the inevitable transition to a greener economy, but that these may need to be combined with other policies that are better at tackling the pressing economic realities of the crisis. This is also supported by the findings from the expert interviews in Hepburn et al. (2020).
In their study for the European Commission, Pollitt (2011) claims that an optimal recovery package should include a balance between long- and short-term policies. They also argue that short-term benefits of green policies could be enhanced. They believe this could be done by using already prepared business plans that are quick to implement, or by increasing the use of “co-financing” from the private sector. An example of co-financing projects is vehicle scrappage schemes, where consumers are incentivized to exchange old cars for newer, more fuel-efficient ones. In this scheme, consumers are incentivized to purchase a new car and spend money they most likely would have saved otherwise, creating a larger short-term economic boost than would have been possible with public spending alone.
Additionally, combining green stimulus with training programmes could improve the stimulating effect. Popp et al. (2020) find that skill availability, that workers have the skills needed for the green economy, is crucial for the success of green stimuli. Hence, countries where the workers already have the skills needed will benefit more from green stimulus than countries that do not.[4]This is consistent with the theories on the cost of job reallocation in labour economics. The larger the green skill gap in the community and the more non-green jobs that will be lost, the higher the cost of transitioning to a green economy will be. See Chen et al. (2020) for more. Building on these findings in another study, later in 2020, the authors provide suggestive evidence that combining green stimulus with training programmes improves the effectiveness of green subsidies on economic recovery.[5]Chen et al. (2020). The green stimulus programs assessed were a part of the ARRA green package. The ARRA package, amongst other things, provided funding for energy efficiency retrofits and the renewable energy industry. The training programmes were also directed at these activities.
Footnotes
- ^ This argument is presented in a published paper in 2020, Chen et al. (2020)
- ^ See Pollitt (2011)
- ^ Estimate is based on the short-term multiplier effect, the ratio of the boost to GDP. See Pollitt (2011).
- ^ This is consistent with the theories on the cost of job reallocation in labour economics. The larger the green skill gap in the community and the more non-green jobs that will be lost, the higher the cost of transitioning to a green economy will be. See Chen et al. (2020) for more.
- ^ Chen et al. (2020). The green stimulus programs assessed were a part of the ARRA green package. The ARRA package, amongst other things, provided funding for energy efficiency retrofits and the renewable energy industry. The training programmes were also directed at these activities.
2.2.2 Environmental effects
In the following, we summarize the effects of green stimulus measures on different green outcomes, specifically reduced greenhouse gas emissions through:
- investments in or subsidies for renewable energy,
- tax incentives and grants aimed at increasing building energy efficiency and/or reducing household energy consumption, and
- scrappage schemes incentivizing consumers to swap old vehicles for newer less fuel-intensive vehicles.
The reason for a focus on reduced greenhouse gas emissions is that the green measures after the 2008–2009 financial crisis, which most empirical studies within this topic are based on, were mainly targeted towards energy efficiency and climate change mitigation, both in Europe and the US.[1]Pollitt (2011) and Chen et al. (2020)
In general, there is evidence that green stimulus and green policy measures achieve environmental targets to some extent. However, the evidence is mixed, and green incentives, e.g., for vehicle scrappage or increased energy efficiency in buildings, can have unintended consequences that make them less efficient.
Green stimulus has been successful in accelerating the shift to renewable energy. A study by the US Council of Economic Advisors in 2016 shows that stimulus programmes in response to the 2008 financial crises increased renewable energy generation: solar electricity in the US increased 30 times from 2008 to 2015, and wind generation increased more than threefold. This development is to a large extent attributed to the deployments made possible by the US American Recovery and Reinvestment act of 2009 (ARRA). The ARRA program allocated $90 bill. of the stimulus to renewable energy projects, which funded a variety of different projects through differing funding mechanisms.[2]Around 30 percent of the stimulus package was in the form of tax incentives, while 70 percent was in the form of spending. The funding was directed towards the following categories: renewable generation, energy efficiency, grid modernization, advanced vehicles and fuels, transit, carbon capture and storage, green innovation and job training, and clean energy manufacturing. Additionally, ARRA contributed to dramatic cost reductions, increasing the viability of renewable energy as an alternative to fossil fuels.[3]Council of Economic Advisors (2016)
Stimulus measures have also been directed to increasing building energy efficiency and reducing energy consumption. Energy efficiency stimulus includes tax incentives and grants for investing in insulation, installation of energy efficient lights, and retrofitting buildings. Installing smart meters, that inform consumers of their energy consumption, has been shown to stimulate reduced energy consumption.[4]See Agrawala et al. (2020) for a more detailed discussion of the literature
Incentives may also have unintended consequences as shown in Alberini et al. (2016). In the study, the effect on energy consumption from a new heat pump is measured on two groups, one which received an incentive to install it and one which did not. On average, household energy consumption is reduced by eight percent when a new, more energy-efficient pump is installed. However, among the incentive receivers (households) the effect is small, and the larger the incentive, the smaller the reduction in energy usage. Hence, environmental benefits might not increase in proportion to the size of the investment or could even be offset by behavioural rebound effects. Based on this, Agrawala et al. (2020) conclude with that energy-efficiency programmes might need to be combined with measures that account for behavioural responses to improve policy design.
The environmental impact of scrappage schemes, which provide financial incentives to trade in vehicles with low fuel efficiency, are mixed.[5]Agrawala et al. (2020) In the US, the CARS programme introduced in 2009 is estimated to have reduced CO2 emissions,[6]Li et al. (2013) and a European study found that the scrappage schemes increased fuel efficiency of new cars during the financial crisis.[7]Grigolon et al. (2016) On the other hand, a German scrappage scheme resulted in people trading in smaller vehicles for medium-sized ones. Even though the new vehicles were more fuel-efficient, larger cars use more fuel than smaller cars, cancelling out some of the benefits from the scheme.[8]OECD/ITF (2011) Additionally, based on a Pollitt (2011), the post financial crises scrappage schemes had limited environmental benefits as many vehicles would have been replaced soon with or without the schemes.
The effects from investing in green R&D are also mixed. Agrawala et al. (2020) have primarily looked at studies on investments in carbon capture technology. They conclude that projects in recovery packages in both Europe and the US had a low success rate, even though several other carbon capture projects have been successful in the same period. Agrawala et al. (2020) conclude that direct public R&D can create problems as governments need to try and pick winners for the investment to pay off, and that governments instead should try and encourage competitive selection to direct the investments better.
The mixed experiences do not disqualify green stimulus packages but point to the classical argument that separate instruments are needed to achieve separate policy targets efficiently.
Footnotes
- ^ Pollitt (2011) and Chen et al. (2020)
- ^ Around 30 percent of the stimulus package was in the form of tax incentives, while 70 percent was in the form of spending. The funding was directed towards the following categories: renewable generation, energy efficiency, grid modernization, advanced vehicles and fuels, transit, carbon capture and storage, green innovation and job training, and clean energy manufacturing.
- ^ Council of Economic Advisors (2016)
- ^ See Agrawala et al. (2020) for a more detailed discussion of the literature
- ^ Agrawala et al. (2020)
- ^ Li et al. (2013)
- ^ Grigolon et al. (2016)
- ^ OECD/ITF (2011)
3 Nordic stimulus measures in response to covid-19
3.1 Overview of Nordic financial stimulus measures
The Nordic countries have introduced a wide range of measures and policies, including financial stimulus measures, mandates, bans and regulations. The stimulus can be roughly categorized into the following groups of instruments:
- Tax deferrals
- Permanent tax reduction or exemption
- Loan guarantees
- Grants and subsidies
- Investments
The instruments have different aims, and target either specific sector(s) or the general economy.
Tax deferrals and tax reductions/exemptions are given to increase companies and households’ liquidity, at the expense of forgone or postponed revenue to the government. Most of the tax deferrals or tax reductions/exemptions target companies, yet there are also examples of tax exemption given to households, e.g., Iceland’s VAT refunds covering leisure housing, design and supervision of construction, car repairs, etc.
Loan guarantees are given in order relieve credit constraints in the financial market. The loan guarantees are given to companies regardless of sector or target specific companies, such as airlines.
Grants or subsidies either 1) compensate for loss of income for companies or households or 2) target specific sectors to stimulate activity. In the first case, the grants/subsidies either compensate for proven income loss or expected future income loss, for example through purchase of transportation services. In the second case, the receiving party is not necessarily experiencing an income loss. The aim is instead to increase activity and thus raise current or future employment. Examples of this are grants to the construction sector or grants to research projects/funds.
3.2 Comparison of total stimulus measures granted
By stimulus measures, we mean all measures that the national governments have labelled a response to the economic consequences of the pandemic. Further, we have included all measures with a direct budgetary impact and excluded support to activities related directly to handling the pandemic, like support to hospitals and testing stations.
The Covid-19 stimulus packages differ both in composition and in total stimulus, amounting to between 1 bill. euros (Iceland) and 26 bill. euros (Denmark). All countries have agreed on large stimulus packages, and in all countries a significant share of this has been directed as immediate support to all companies and households affected by the pandemic. Figure 3.1 shows the total stimulus per capita in all Nordic countries during 2020–2021.[1]We have only included stimulus measures that, to the best of our knowledge, were planned for 2020 and 2021. We have based our analyses on planned implementation of measures, and the actual implementation might differ. We collected data during the fall of 2021, and hence we have not included any of the stimulus implemented due to new restrictions in December 2021 in several Nordic countries.
Footnotes
- ^ We have only included stimulus measures that, to the best of our knowledge, were planned for 2020 and 2021. We have based our analyses on planned implementation of measures, and the actual implementation might differ. We collected data during the fall of 2021, and hence we have not included any of the stimulus implemented due to new restrictions in December 2021 in several Nordic countries.
Figure 3.1 Total covid-19 stimulus measures during 2020–2021 per country, specified and unspecified stimulus.[1]Danish stimulus had not yet been specified in terms of which initiative and sector the money should be directed to in October 2021 In euro per capita.
Footnotes
- ^ Danish stimulus had not yet been specified in terms of which initiative and sector the money should be directed to in October 2021
Based on our mapping, Denmark and Iceland have agreed upon the most generous stimulus packages measured per capita. Both countries have chosen to introduce large infrastructure projects running over several years as a response to the economic repercussions. Given that projects like these undergo long time investigation and processing before they are launched, it is likely that the infrastructure projects were planned, before the pandemic. There is a good chance that some of these packages would have been realized even without the pandemic. Still, we do not surmise on this matter, as they have been labelled corona stimulus by the respective national governments. Further, it is possible that the adoption of some of these measures were speeded up, and/or increased in size, because of the pandemic. To compare, Finland in late 2019 agreed upon a program called One-off future-oriented investments which runs from 2020–22 and totals 3 bill. euro. As this was agreed upon before the pandemic, it is not included as stimulus measures, even though it in practise could have had a stimulating effect.
The total amount of covid-19 stimulus granted is reported differently in all Nordic countries, and a direct comparison is therefore difficult. The total amounts per capita presented in Figure 3.1 hence be viewed with care. For example, even though Denmark has agreed upon the largest amount of stimulus of all the Nordic countries, over two thirds of this was, to the best of our knowledge, not yet specified when we conducted this analysis[1]Danish stimulus had not yet been specified in terms of which initiative and sector the money should be directed to in October 2021 in terms of which initiative and sector the money should be directed to. Whether the stimulus will eventually be paid out or not, it most likely has not be distributed within 2020–2021, which is our period of observation. If we exclude the stimulus that is yet to be specified, Denmark goes from highest to lowest stimulus per capita in the Nordic countries.
For a more detailed description of the financial stimulus packages that have been implemented in response to the covid-19 pandemic in all Nordic countries, see Appendix B.
Footnotes
- ^ Danish stimulus had not yet been specified in terms of which initiative and sector the money should be directed to in October 2021
4 Identification of sectors with green stimulus potential
The purpose of this chapter is to identify economic sectors in the Nordic economies in need of stimulus following the Covid-19 pandemic, and where stimulus has green potential, e.g., a positive impact on the climate/environment (Question 2).[1]As described in section 2.1, the term green in this report refers to any type of effect that can be said to preserve, protect, or reach targets related to the climate and the environment, the latter including biodiversity, pollution, waste, land use, water use and ecosystem services.
This is done stepwise:[2]This framework is based on a method developed for categorizing the state budget items by greenhouse gas emissions. (Menon and CICERO, 2020).
- Step 1: Identify impact of Covid-19 pandemic on the Nordic economic sectors (section 4.1)
- Step 2: Identify impact of the economic sectors on the climate in terms of CO2 emissions (section 4.2)
- Step 3: Identify impact of the economic sectors on the environment (section 4.3)
- Step 4: Identify economic sectors with the largest green stimulus potential (section 4.4)
In Step 1, we present and analyse how the various sectors[3]The identification of sectors follows NACE Rev. 2, the European standard classification of productive economic activities. of the Nordic economies have been impacted by the pandemic in terms of gross value added (GVA), employment and the total number of hours worked. This provides an intuition of which sectors that have been/are in most need of stimulus measures, to mitigate the negative impacts of the pandemic. We primarily use data from Eurostat, which has comparable data for all Nordic countries.[4]However, one should note that it is the respective national statistical offices that provide Eurostat with data. We use data for the latest year available for all the Nordic countries. The national statistical offices of the Nordic countries provide more detailed data, which complement the analysis when needed.
In Step 2, we present and analyse the total greenhouse gas (GHG) emissions from the activity in each sector, as well as their emission intensities. This provides an intuition of the expected climate impacts of the stimulus measures directed for each sector.
In Step 3, we categorize the impact of different sectors on the environment. In contrast to greenhouse gas emissions (Step 2) there is no common unit for measuring environmental outcomes. Hence, we follow a more qualitative approach to identify sectors that may impact the environment.
In Step 4 we combine information from the three previous steps. Sectors in need of stimulus (from Step 1) that negatively impact either the climate (from Step 2) and/or the environment (from Step 3) are most relevant in a stimulus perspective.
Footnotes
- ^ As described in section 2.1, the term green in this report refers to any type of effect that can be said to preserve, protect, or reach targets related to the climate and the environment, the latter including biodiversity, pollution, waste, land use, water use and ecosystem services.
- ^ This framework is based on a method developed for categorizing the state budget items by greenhouse gas emissions. (Menon and CICERO, 2020).
- ^ The identification of sectors follows NACE Rev. 2, the European standard classification of productive economic activities.
- ^ However, one should note that it is the respective national statistical offices that provide Eurostat with data.
4.1 Step 1: Identify impact of Covid-19 pandemic on Nordic economic sectors
The pandemic and the restrictive measures have impacted most, if not all, sectors of the Nordic economies. However, some sectors have clearly been more severely impacted than others. In principle, one can expect that the stimulus measures to sup|port economic activity would primarily target the sectors that have seen the largest negative impact during the pandemic, while sectors that have been more mildly impacted should be in less need of stimulus measures. The sectoral economic growth from pre Covid-19 up to the end of 2021 also reflect the support measures made available for struggling companies (in all sectors) relatively early during the pandemic.[1]For example, the Swedish government proposed measures for tax deferment and financial support for furloughing employees in March 2019. (Finansdepartementet, 2020). These measures have reduced the negative impacts on companies and employees, e.g., by enabling companies to furlough, instead of laying off, their workforce.
The impact on GVA, employment and hours worked differed substantially across sectors and, perhaps more surprisingly, across the Nordic countries. The impact on the total economy and eleven broad sectors in 2020 is presented in Table 4.1. The table also includes the average annual growth rate during 2017–2019 in parentheses, for comparison. To help visualise the magnitude of the impacts for the different sectors and countries, a growth rate of –5 percentage points or lower in 2020 compared to the average annual growth rate in 2017–2019 is coloured red, a growth rate of 0 percent to –4.9 percentage points is coloured yellow, and a growth rate of 0.1 percentage points or higher is coloured green.
Each Nordic country experienced negative growth in total gross value added (GVA) during 2020 compared to 2019, although the magnitude of the impacts varied substantially. While Icelandic GVA decreased by 6.3 percent, Norwegian GVA decreased by a more limited 0.6 percent. For Denmark, Finland and Sweden, the decrease was between 2.4 percent and 3.1 percent. However, Iceland also experienced a higher average annual growth rate during the three years preceding 2020 (4 percent) than the other Nordic countries (1.4–2.3 percent).
For the EU27, GVA decreased by 5.9 percent from 2019 to 2020. Hence, except for Iceland, the Nordic countries had a clearly lower economic recession compared to the EU27.
Iceland was also the hardest hit Nordic country in terms of employment, with a decrease of 4.6 percent in employment and a decrease of 7.2 percent in total hours worked. Denmark was the Nordic country with the lowest decrease in employment (-0.7 percent), while Norway experienced the lowest decrease in total hours worked (-2.2 percent). For all Nordic countries, the number of hours worked decreased more than the number of employed persons. This suggests that a large portion of the furloughs were used by companies to avoid having to lay off employees. For example, at one point during 2020, the three largest vehicle manufacturers in Sweden (AB Volvo, Volvo Cars and Scania) had fully stopped their production and more than 60,000 employees were furloughed. By October 2020, all employees had returned to work.[2](Sveriges Radio, 2020)
For the EU27, employment decreased by 1.4 percent, similar to the Nordic countries, except for Iceland. The total number of hours worked decreased by 6.4 percent, which is a larger decrease than in the Nordic countries, except for Iceland.
Table 4.1 Economic impact per sector and country in 2020. Percentage change in Gross Value Added (GVA), persons employed (PE), and hours worked (HW) in 2020 compared to 2019, fixed index values. (Average annual change during 2017–2019 for comparison).
Source: Eurostat.[1]Gross value added and income by A*10 industry breakdowns and Employment by A*10 industry breakdowns
Footnotes
- ^ Gross value added and income by A*10 industry breakdowns and Employment by A*10 industry breakdowns
| The colors indicate the difference in growth in 2020 and average growth 2017–2019: | > 0.1 percentage points | -4.9 – 0 percentage points | -5 < percentage points |
| Sector | Denmark | Finland | Iceland | Norway | Sweden |
| TOTAL – all sectors of the economy | GVA: -2.4 (2.3) | GVA: -3.0 (2.0) | GVA: -6.3 (4.0) | GVA: -0.6 (1.4) | GVA: -3.1 (2.3) |
| PE: -0.7 (1.4) | PE: -2.1 (1.8) | PE: -4.6 (2.4) | PE: -1.2 (1.5) | PE: -1.3 (1.5) | |
| HW: -2.8 (0.5) | HW: -3.0 (1.4) | HW: -7.2 (1.5) | HW: -2.2 (1.2) | HW: -3.2 (1.0) | |
| A - Agriculture, forestry and fishing | GVA: 6.1 (10.9) | GVA: -2.8 (3.4) | GVA: -0.5 (4.2) | GVA: 0.2 (2.6) | GVA: 1.1 (0.2) |
| PE: 3.0 (-1.3) | PE: -1.4 (-2.3) | PE: -2.8 (-1.3) | PE: -1.5 (0.5) | PE:3.4 (-0.7) | |
| HW: 2.8 (-3.0) | HW: -1.1 (-2.0) | HW: -1.7 (-2.2) | HW: -1.0 (0.3) | HW: 1.3 (-1.4) | |
| B-E - Industry (except construction) | GVA: -1.2 (4.0) | GVA: -0.4 (2.1) | GVA: -5.8 (2.0) | GVA: 5.5 (-0.9) | GVA: -5.2 (1.3) |
| PE: -2.4 (1.5) | PE: -0.4 (0.7) | PE: -4.1 (-0.3) | PE: -0.3 (0.7) | PE: -1.8 (1.5) | |
| HW: -4.0 (0.3) | HW: -1.4 (0.8) | HW: -4.7 (-1.2) | HW: -0.4 (0.5) | HW: -6.1 (0.5) | |
| C – Manufacturing | GVA: -0.3 (6.5) | GVA: -0.9 (2.1) | GVA: -5.0 (0.8) | GVA: -2.5 (1.6) | GVA: -6.3 (1.4) |
| PE: -2.6 (1.5) | PE: -0.7 (0.6) | PE: -5.0 (-0.6) | PE: -1.8 (0.5) | PE: -2.4 (1.4) | |
| HW: -4.5 (0.3) | HW: -1.8 (0.7) | HW: -5.5 (-1.7) | HW: -2.2 (0.1) | HW: -7.4 (0.5) | |
| F – Construction | GVA: 1.2 (1.9) | GVA: 4.1 (-0.4) | GVA: -6.8 (7.6) | GVA: -3.1 (2.9) | GVA: 1.0 (3.7) |
| PE: 1.6 (2.9) | PE: -2.4 (2.1) | PE: -7.3 (8.8) | PE: 0.0 (3.8) | PE: -0.8 (3.6) | |
| HW: 1.7 (1.8) | HW: -2.5 (1.4) | HW: -8.3 (7.6) | HW: -0.5 (2.7) | HW: -4.4 (2.3) | |
| G-I - Wholesale and retail trade, transport, accommodation and food service activities | GVA: -7.6 (3.0) | GVA: -10.1 (2.1) | GVA: -23.8 (2.5) | GVA: -6.3 (1.8) | GVA: -7.6 (1.8) |
| PE: -2.1 (1.7) | PE: -7.5 (1.0) | PE: -14.8 (1.7) | PE: -3.9 (0.4) | PE: -3.9 (1.2) | |
| HW: -6.1 (0.3) | HW: -10.0 (0.8) | HW: -20.2 (1.0) | HW: -6.3 (-0.2) | HW: -6.2 (0.8) | |
| J - Information and communication | GVA: 3.1 (2.7) | GVA: 4.6 (3.8) | GVA: -2.0 (8.4) | GVA: -1.0 (5.4) | GVA: 2.3 (8.6) |
| PE: 1.6 (2.1) | PE: 2.1 (3.8) | PE: -1.2 (0.0) | PE: -2.0 (3.2) | PE: 5.0 (3.1) | |
| HW: 0.6 (1.1) | HW: 1.7 (3.1) | HW: -2.1 (0.2) | HW: -0.6 (2.7) | HW: 4.0 (3.4) | |
| K - Financial and insurance activities | GVA: 3.2 (2.3) | GVA: -1.3 (-0.5) | GVA: 5.8 (4.8) | GVA: 3.4 (2.6) | GVA: 3.2 (2.2) |
| PE: -1.4 (2.3) | PE: -4.0 (0.1) | PE: -3.6 (-1.7) | PE: 2.1 (0.0) | PE: 2.3 (1.6) | |
| HW: -2.3 (1.8) | HW: -3.8 (-0.6) | HW: -3.6 (-2.7) | HW: 2.6 (-0.4) | HW: 1.7 (-0.7) | |
| L - Real estate activities | GVA: 1.5 (2.0) | GVA: 0.7 (2.4) | GVA: 1.7 (3.4) | GVA: 1.2 (1.3) | GVA: 0.6 (4.3) |
| PE: 0.8 (1.3) | PE: 7.5 (1.7) | PE: -6.2 (7.4) | PE: 0.0 (1.1) | PE: 1.6 (2.6) | |
| HW: -0.3 (-0.7) | HW: 5.8 (1.3) | HW: -4.5 (6.5) | HW: 0.0 (0.0) | HW: 0.9 (3.1) | |
| M-N - Professional, scientific and technical activities; administrative and support service activities | GVA: 1.5 (1.0) | GVA: -3.7 (5.7) | GVA: -20.8 (6.0) | GVA: -7.6 (4.8) | GVA: -5.0 (3.0) |
| PE: -1.5 (2.3) | PE: -2.4 (4.4) | PE: -15.5 (4.6) | PE: -3.8 (3.9) | PE: -1.5 (3.1) | |
| HW: -2.5 (1.2) | HW: -3.3 (3.9) | HW: -18.3 (3.3) | HW: -5.7 (3.3) | HW: -3.2 (2.6) | |
| O-Q - Public administration, defence, education, human health and social work activities | GVA: -3.8 (0.7) | GVA: -3.5 (0.6) | GVA: 4.5 (3.9) | GVA: -1.0 (1.4) | GVA: -2.5 (0.1) |
| PE: 0.6 (0.7) | PE: 0.6 (2.1) | PE: 6.2 (3.0) | PE: 0.8 (1.0) | PE: -0.8 (0.8) | |
| HW: -1.5 (0.3) | HW: 0.8 (1.9) | HW: 4.0 (2.2) | HW: 0.0 (1.0) | HW: -1.0 (0.4) | |
| R-U - Arts, entertainment, recreation; oth. service activities; household activ., extra-territorial organizations/bodies | GVA: -18.3 (1.2) | GVA: -8.1 (1.4) | GVA: 0.2 (5.0) | GVA: -25.7 (1.5) | GVA: -5.0 (1.7) |
| PE: -2.0 (1.1) | PE: -4.3 (0.9) | PE: 3.1 (4.0) | PE: -4.5 (3.9) | PE: -3.1 (1.5) | |
| HW: -5.6 (-0.2) | HW: -6.0 (0.1) | HW: -0.7 (2.9) | HW: -6.5 (3.7) | HW: -6.8 (1.1) |
Three broad sectors stand out by being severely negatively impacted in almost all Nordic countries:
- The aggregated sector of Wholesale and retail trade, transport, accommodation and food service activities,
- The aggregated sector of Arts, entertainment and recreation; other service activities; activities of households and extra-territorial organizations and bodies,
- The aggregated sector of Professional, scientific and technical activities; administrative and support service activities - hereunder Travel agency, tour operators and other reservation service and related activities.
All these sectors, and especially the first two, are characterised by being highly dependent on human contact and interaction. For example, lockdown measures had a large impact on the day-to-day operations of retail stores, hotels, restaurants and cafes, as well as on the cultural sectors. While the specific types and levels of restrictions differed across the Nordic countries, such business activities were wholly or partially shut down for periods of time, due to the restrictions.
4.1.1 Sectors with largest negative impacts per country
The national statistical offices provide more detailed information of how the pandemic impacted the various sectors of the Nordic economies. Table 4.2 provides an overview of the three sectors in each Nordic country that experienced the largest negative impact in 2020 compared to 2019.
Accommodation and food service activities were among the most negatively impacted in all Nordic countries. As above these activities are characterised by being highly dependent on human interaction. Similarly, Arts, entertainment and recreation were among the most negatively impacted.
Transportation and storage was also generally negatively affected in all countries. In Norway, this sector was not among the three most affected. Unlike the other Nordic countries, manufacturing was also among the hardest hit sectors in Sweden. For a more detailed description per country, see Appendix C.
Table 4.2 The three sectors in each country with the largest negative impact in 2020 compared to 2019, in terms of Gross Value Added (GVA), Persons employed (PE) and Hours worked (HW).
Source: Statistics Denmark, Statistics Finland, Statistics Iceland, Statistics Norway, and Statistics Sweden.
| Denmark | Arts, entertainment and recreation | Accommodation and food service activities | Transportation and storage |
| GVA | -36.4 | -35.4 | -21.2 |
| Persons employed | -4.6 | -8.7 | -3.5 |
| Hours worked | -11.2 | -19.3 | -7.0 |
| Finland | Accommodation and food service activities | Transportation and storage | Arts, entertainment and recreation |
| GVA | -33.5 | -25.8 | -12.6 |
| Persons employed | -22.2 | -8.7 | -9.4 |
| Hours worked | -25.1 | -11.8 | -9.8 |
| Iceland | Accommodation and food service activities | Administrative and support service activities | Transportation and storage |
| GVA | -50.8 | -38.5 | -35.7 |
| Persons employed | -27.6 | -27.5 | -19.3 |
| Hours worked | -37.3 | -31.3 | -23.7 |
| Norway | Accommodation and food service activities | Arts, entertainment and recreation | Administrative and support service activities |
| GVA | -29.8 | -25.7 | -19.3 |
| Persons employed | -10.9 | -4.5 | -7.9 |
| Hours worked | -21.0 | -6.4 | -11.1 |
| Sweden | Accommodation and food service activities | Manufacturing of motor vehicles | Manufacture of other transport equipment |
| GVA | -29.0 | -17.7 | -14.4 |
| Persons employed | -15.4 | -5.1 | 0.0 |
| Hours worked | -18.5 | -12.3 | -3.4 |
| *Manufacture of motor vehicles, trailers and semi-trailers ** Manufacture of other transport equipment | |||
4.1.2 Åland, Greenland, and the Faroe Islands
For the autonomous region Åland and the autonomous territories Greenland and the Faroe Islands, we do not have access to as detailed data. The number of hotel nights serves as an indicator to the impact on inbound tourism, which is an important industry in these areas. The data reveals significant negative consequences to this sector from 2019 to 2020, and varying degree of recovery in 2021, see Figure 4.1.
Figure 4.1 Number of hotel nights in Åland, Greenland and the Faroe Islands, YTD 2018–2021.
Source: Ålands Statistik- och Utredningsbyrå, Grønlands Statistik, Hagstova Føroya.[1]Based on latest available data for each respective geography.
Footnotes
- ^ Based on latest available data for each respective geography.
The general picture is that the economies of Åland, Greenland and the Faroe Islands faced a significant recession after the outbreak of the pandemic in 2020. However, the recovery in terms of tourism indicators was obvious during the first part of 2021.
Åland experienced the largest decrease in number of hotel nights of the three geographies. In 2020, the number of hotel nights in Åland were 56 percent lower than in 2019. In April 2020, the registered hotel nights in Åland were 94 percent lower than in April 2019. During the most popular tourist month of the year, July, the decrease was 40 percent compared to the year before. The total year-to-date (January-October, latest data available) number of hotel nights in 2021 was 18 percent lower than in 2019. While the number of hotel nights in Åland decreased for almost all nationalities, the decrease was much larger for Swedish visitors. In 2019, Swedish nationals made up 41 percent of the hotel nights in Åland, while in 2020 they only made-up 11 percent. In contrast, visitors from Finland made up 49 percent of the hotel nights in 2019, but 83 percent in 2020. Still, the total number of hotel nights from Finnish nationals decreased by 27 percent in 2020 compared to 2019.
In Greenland, the number of hotel nights decreased by 34 percent in 2020 compared to 2019. As in Åland, April was the month with the largest relative decrease of 83 percent from April 2019. As in Åland, the Greenlandic tourism is still far from its pre-pandemic levels, with the year-to-date (January-September, latest data available) number of hotel nights being 20 percent lower in 2021 than in 2019.
In the Faroe Islands, the number of hotel nights decreased by 43 percent in 2020 compared to 2019. The largest decrease, 90 percent, was in April. Unlike Åland and Greenland, the year-to-date (January-October, latest data available) number of hotel nights in 2021 surpasses that of 2019 by 3 percent. Thus, it appears that the Faroese tourism sector has managed to recover more swiftly than its counterparts in Åland and Greenland.
4.2 Step 2: Identify impact of economic sectors on CO2 emissions
To identify the impact of the economic sectors on CO2 emissions we focus on two measures:
- Sectors’ contribution to total CO2-equivalent emissions
- Sectors’ greenhouse gas emission intensities, e.g., CO2 equivalents per euro of gross value added (GVA)
By combining information on these measures, we find that the following sectors have the largest negative impact on CO2 emissions:
- A - Agriculture, forestry and fishing
- B - Mining and quarrying / D – Electricity, gas, steam and air conditioning supply / E – Water supply, sewerage, waste management and remediation activities
- C - Manufacturing
- F - Construction
- G-I - Wholesale and retail trade, transport, accommodation and food service activities
In the following, we describe in detail the sectors’ contribution to total CO2-equivalent emissions in each country, and the sectors’ greenhouse gas emission intensities.
4.2.1 Sectors’ contribution to total CO2 emissions
The country profiles of greenhouse gas (GHG) emissions, measured in CO2 equivalents, differ across the countries, due to varying size and sectoral composition of the Nordic economies. Furthermore, while there are international standards and instructions for national statistical offices’ reports on CO2 emissions, there are nonetheless differences in how the data is collected and classified.
In 2018 (the latest year where Eurostat presents data on GHG emissions for all Nordic countries[1]Eurostat, Air emissions accounts by NACE Rev. 2 activity [env_ac_ainah_r2].) Denmark reported the highest total emissions of GHG, at 81 mill. tonnes[2]More than half (56 percent) of total Danish GHG emissions emanate from the transport sector. 90 percent of those emissions originate from international transport by Danish ships, airplanes, and vehicles (e.g., international shipping with Danish flagged ships).. Iceland was the Nordic country with lowest total GHG emissions, at 7 mill. tonnes. Emissions from Norway amounted to 69 mill. tonnes, from Finland 54 mill. tonnes, and from Sweden 48 mill. tonnes.
Figure 4.2 presents the relative distribution of GHG emissions per sector in each country, measured as GHG emissions per sector as share of total GHG emissions, excluding GHG emissions from households. We have only included the four most emitting sectors for each country in the figure, the rest are summed into the category “other sectors”.
As the figure shows, there are some relatively marked differences in the sectoral composition of the GHG emissions across the countries. The transportation and storage sector (H) is a large source of emissions in all Nordic countries, but especially so in Denmark. The agricultural sector (A) is also amongst the 4 most emitting sectors in all Nordic countries. So is manufacturing, but to a varying degree. Not surprisingly mining and quarrying (B) is the second most emitting sector after transport in Norway, due to petroleum production. For more details by country, see Appendix D.
Footnotes
- ^ Eurostat, Air emissions accounts by NACE Rev. 2 activity [env_ac_ainah_r2].
- ^ More than half (56 percent) of total Danish GHG emissions emanate from the transport sector. 90 percent of those emissions originate from international transport by Danish ships, airplanes, and vehicles (e.g., international shipping with Danish flagged ships).
Figure 4.2 Share of total emissions of greenhouse gases from economic activity, CO2 equivalents, by sector and country, 2018. Four largest emitting sectors specified per country. The rest are under “Other sectors”.[1]For a more detailed description of emissions per sector, see Appendix C.
Footnotes
- ^ For a more detailed description of emissions per sector, see Appendix C.
4.2.2 Sectors’ greenhouse gas emission intensities
Sectoral emission intensities measure the sector’s emissions with respect to its economic size. This allows for comparison of GHG emissions across sectors and countries, see Table 4.3. We measure emission intensities by emissions of greenhouse gas (GHG) measured in CO2 equivalents per euro of gross value added (GVA).
The weighted average emission intensity of the Nordic economies is 212 grams of GHG emissions per euro of GVA, in 2017.[1]The latest year with available Eurostat data on emission intensity across sectors for all Nordic countries Iceland has the highest average emission intensity, with 353 grams of GHG emissions per euro of GVA, i.e., almost two thirds higher than the Nordic average. Sweden has the lowest average emission intensity, with 114 grams of GHG emissions per euro of GVA, i.e., almost half of the average Nordic emission intensity.
Footnotes
- ^ The latest year with available Eurostat data on emission intensity across sectors for all Nordic countries
Table 4.3. GHG emission intensity, grams of GHG emissions (CO2 equivalents) per euro of GVA, by sector and country, 2017.[1]Note: J-U: All other sectors, such as information and communication, finance and insurance, professional services, arts and entertainment, etc. The emission intensity for sector J-U is calculated as the simple average for all these sectors, per country. All these sectors have very low emission intensities: the highest emission intensity is 43 percent lower than the national average (the Norwegian “Other service activities” sector).
Source: Eurostat, Air emissions intensities by NACE Rev. 2 activity
Footnotes
- ^ Note: J-U: All other sectors, such as information and communication, finance and insurance, professional services, arts and entertainment, etc. The emission intensity for sector J-U is calculated as the simple average for all these sectors, per country. All these sectors have very low emission intensities: the highest emission intensity is 43 percent lower than the national average (the Norwegian “Other service activities” sector).
| Lower emission intensity than the national average | Average emission intensity for each country | 0 to 99 percent higher emission intensity than the national average | 100 percent or higher emission intensity than the national average |
| NACE | Denmark | Finland | Iceland | Norway | Sweden |
| TOTAL - Total - all NACE activities | 308 | 270 | 353 | 221 | 114 |
| A - Agriculture, forestry and fishing | 3.265 | 1.572 | 1.377 | 765 | 1.318 |
| B - Mining and quarrying | 618 | 469 | 65 | 301 | 430 |
| C – Manufacturing | 156 | 347 | 1.040 | 548 | 239 |
| D - Electricity, gas, steam and air conditioning supply | 2.390 | 3.861 | 222 | 272 | 711 |
| E - Water supply; sewerage, waste management and remediation activities | 1.251 | 1.338 | 1.459 | 913 | 611 |
| F – Construction | 110 | 95 | 137 | 101 | 64 |
| G - Wholesale and retail trade; repair of motor vehicles and motorcycles | 34 | 28 | 47 | 42 | 35 |
| H - Transportation and storage | 3.110 | 1.131 | 2.262 | 1.775 | 414 |
| I - Accommodation and food service activities | 34 | 59 | 7 | 29 | 10 |
| J - U (see table note) | 14 | 19 | 14 | 14 | 12 |
In all Nordic countries, three sectors stand out by being more than twice (i.e., more than 100 percent) as emission intensive compared to the national average: 1) agriculture, forestry and fishing, 2) transportation and storage, and 3) water supply, sewerage, waste management and remediation activities. More details per country can be found in Appendix E.
For three other sectors, there are at least two Nordic countries where the sectors’ emission intensities are more than twice as high as the national average: 1) mining and quarrying, 2) manufacturing, and 3) electricity, gas, steam, and air conditioning supply.
Emission intensity in transport
The aggregated sectoral analysis conceals important variation within the sector. This is especially relevant in the transport sector. A study from the European Environment Agency (EEA)[1](European Environment Agency, 2021b) shows a clear hierarchy of passenger and freight transport modes based on historical averages for the EU-27. Based on this study, passenger flights and passenger cars have clearly higher CO2 emissions per passenger kilometre than busses, ferries, and trains. The same hierarchy applies for freight transport, with air cargo and heavy goods vehicles having the highest emissions per tonne kilometre.
Footnotes
- ^ (European Environment Agency, 2021b)
4.3 Step 3: Identify impact of economic sectors on the environment
There is no common unit for environmental outcomes, and we need to use other indicators to identify sectors that positively or negatively impact the environment.
The environmental state is closely linked to land and water use. Economic sectors that require land or water are thus expected to have a more negative impact on the environment compared to other sectors. To identify which sectors are relevant it is useful to consider the main factors of production in each sector. The production factors are broadly defined as land, labour, capital or entrepreneurship, where land includes water and other natural resources. Further, it is relevant to identify pollution intensive sectors.
Our assessment of the environmental impact by sector is presented in Table 4.4. The assessment of land and/or capital intensity is based on a qualitative assessment, while statistics are used to assess the impact on local air pollution[1]We have looked primarily at impact on nitrogen oxides, particulates < 2.5µm, and particulates < 10µm..
Footnotes
- ^ We have looked primarily at impact on nitrogen oxides, particulates < 2.5µm, and particulates < 10µm.
Table 4.4. Economic sectors (Nace Rev. 2) that are land- and/ capital-intensive.
Source: Qualitative assessment and Eurostat air emissions accounts by NACE Rev. 2 activity
| Sector (Nace Rev. 2) | Land- and/or -capital intensive | Source of local air pollution |
| A - Agriculture, forestry and fishing | Yes | Yes |
| B-E - Industry (except construction and manufacturing)* | Yes | Yes |
| C – Manufacturing | Yes | Yes |
| F – Construction | Yes | Yes |
| G-I - Wholesale and retail trade, transport, accommodation and food service activities | Partly | Partly |
| J - Information and communication | No | No |
| K - Financial and insurance activities | No | No |
| L - Real estate activities | No | No |
| M-N - Professional, scientific and technical activities; administrative and support service activities | No | No |
| O-Q - Public administration, defence, education, human health and social work activities | No | No |
| R-U - Arts, entertainment and recreation; other service activities; activities of household and extra-territorial organizations and bodies | No | No |
| *The B-E - Industry (except construction and manufacturing) includes B- Mining and quarrying, D – Electricity, gas, steam and air conditioning supply and E - Water supply, sewerage, waste management and remediation activities. | ||
The sector A- Agriculture, forestry and fishing requires considerable land and water resources, thus impacting the environment negatively. Negative impacts may include soil degradation and water depletion, which further impact biodiversity. The sector is also a major source of air pollution, even though the air pollution levels vary within the Nordic countries. This is most likely explained by differences in both the size of sector and type of produce.
Sectors B-E - Industry (except construction), C – Manufacturing, and F – Construction also require land and water resources and are major sources of pollution and waste. These sectors are also a major source of air pollution, even though it varies. Iceland, for example, has limited mining activity and hence almost no air pollution from B – Mining and quarrying. For Norway this sector is on the other hand a large source of air pollution (especially nitrogen oxides). C – Manufacturing is a large source of air pollution in all countries.
Transportation, a subsector of G-I Wholesale and retail trade, transport, accommodation and food service activities, requires land and also divides up the landscape. This has negative consequences for nature, affects wildlife and biodiversity etc. The transport sector is also a significant source of local air pollution. It, e.g., contributes to around 80 percent of all nitrogen oxide emissions in the Nordic countries[1]This varies by country, and Denmark is the highest emitter of nitrogen oxides overall and also in the transport sector. as well as contributing to noise pollution.
The other sectors in G-I Wholesale and retail trade, transport, accommodation and food service activities are smaller sources of local air pollution. Wholesale and retail trade contribute more to pollution than accommodation and food services, especially in Sweden, but in general these sectors contribute with less than 2 percent of total air pollution.
The remaining sectors are less land- and capital-intensive and rely to a larger extent on labour as input. They also contribute less to air pollution. In total, these sectors account for 1–3 percent of total air pollution in the Nordic countries, depending on the metric used.[2]Nitrogen oxides, particulates < 2.5µm, or particulates < 10µm.
4.4 Step 4: Identify economic sectors with the largest green stimulus potential
In Step 4, we identify the economic sectors with the largest green stimulus potential based on the three previous mapping activities of:
- Step 1: the impact of the pandemic on the sectors, measured in terms of declines in gross product and employment / working hours closed
- Step 2: the sectors' impact on climate, measured in terms of emissions and emission intensity
- Step 3: the sectors' impact on the environment, based on qualitative assessments
In Table 4.5 we have compiled information from these mapping activities and color-coded the degree of negative impact. The colour coding provides a rough average of the impact found across the five Nordic countries. Green indicates low impact, yellow indicates medium impact, and red indicates large impact.
Table 4.5. Overview of sectors with green stimulus potential based on Step 1–3.
| Low | Medium | High |
| Sector (Nace Rev. 2) | Column 1: Affected by the pandemic | Column 2: Impacts the climate | Column 3: Impacts the environment | Column 4: Green stimulus potential |
| A - Agriculture, forestry, and fishing | None | |||
| B-E - Industry (except construction)* | Low | |||
| C – Manufacturing | Low | |||
| F – Construction | Low | |||
| G-I – Wholesale& retail trade, transport, accommodation, food service activities | High | |||
| J - Information and communication | None | |||
| K - Financial and insurance activities | None | |||
| L - Real estate activities | None | |||
| M_N - Professional, scientific, technical activities; administrative and support service activities | None | |||
| O-Q - Public adm., defence, education, human health, social work activities | None | |||
| R-U - Arts, entertainment, recreation; other service activities; activities of household and extra-territorial organizations and bodies | None | |||
| *The B-E - Industry (except construction) includes B- Mining and quarrying, D – Electricity, gas, steam and air conditioning supply and E - Water supply, sewerage, waste management and remediation activities. | ||||
As seen from Column 1, sectors G–I (wholesale& retail trade, transport, accommodation, food service activities), M–N (professional, scientific, technical activities; administrative and support service activities), and R–U (arts, entertainment, recreation; other service activities; activities of household and extra-territorial organizations and bodies) are the most affected by the pandemic. The sectors marked yellow are negatively affected by the pandemic to varying degrees in the different countries.
Column 2 shows the sectors with the largest emissions and highest emission intensities. The sectors A (agriculture) and C (manufacturing) and the subsector H (transportation) stand out in several countries. There are also differences between the countries, for example the extraction of oil and gas, a part of sector B (mining and quarrying), is a large emitter in Norway.
Column 3 shows the sectors with the largest impact on the environment. The sectors A (agriculture), C (manufacturing) and F (construction), as well as the subsector H (transportation) are considered to have the largest environmental impact.
We assess the green potential of the various sectors in columns 4, based on information in columns 1–3. This is done following a stepwise approach, where we gradually eliminate sectors that are not deemed relevant:
- Sectors that are not significantly negatively affected by the pandemic, i.e., those that are green in the first column, are not deemed as relevant for green stimulus measures. Regardless of these sectors’ impact on the climate and/or the environment, these do not need stimuli. This applies, among other, to the agricultural and public sectors.
- Sectors negatively affected by the pandemic, but that do not have a significant impact on the environment nor climate, are not deemed relevant for green stimulus measures. This includes the culture sector, among other.
The remaining sectors are deemed to have green stimulus potential:
- B – Mining and quarrying / D – Electricity, gas, steam, and air conditioning supply / E – Water supply, sewerage, waste management and remediation activities
- C – Manufacturing
- F – Construction
- G–I – Wholesale and retail trade, transport, accommodation, and food service activities
The subsector transportation stands out as the sector with the largest green potential, as it is both heavily affected by the pandemic and has considerable negative impact on the climate and the environment.
This framework is used for the analysis of the impact of green stimulus measures in chapter 5.
5 The impact of the Nordic financial stimulus measures on the climate and environment
5.1 Method for analysing impact of financial stimulus measures
To analyse the impact on climate and/or environment from the stimulus packages in the Nordic countries, we have assessed all the measures following the steps described in Chapter 4:
- Step 1: Identify which economic sector(s) the measures target
- Step 2: Evaluate the impact of the measures on the climate
- Step 3: Evaluate the impact of the measures on the environment
Several of the measures target specific sectors, sometimes also with strings specifying how funds should be spent or conditional on other changes being made by the receiving party. By identifying the receiving sector (Step 1), we assess the expected impact on the climate/environment (Step 2–3).
Instruments that are considered relevant for climate are subject to further analysis. We separate between short- and long-term impact and the direction of the impact (negative or positive). The total impact on climate is the combined short- and long-term impacts. In most cases, the short- and long-term impacts point in the same direction, e.g., both are presumed either positive or negative, and thus the total climate impact is easy to assign. When the short- and long terms are assumed to point in different directions, we assess their relative strengths before signing the total impact.[1]For example, grants for building charging infrastructure for vehicles may result in increased emissions in the manufacturing sector (if produced within the country) in the short-term but is expected to reduce emissions in the transport sector in the long-term. We have here assumed that the combined short- and long-term effects are positive, i.e., that the long-term effect outweighs the short-term effect. Not all instruments are expected to have both short- and long-term impacts. For instance, increased funds to climate research as a stimulus measure are primarily expected to have long- term climate impacts.
Many instruments do not target specific sectors, like business cost support, but rather target companies across several sectors, or households. Unless there are strings attached, stipulating how funds are to be used, we do not know what the funds are spent on and thus cannot assess the expected impact on the climate/environment through first-order nor second-order effects. The impact of these instruments on the climate/environment is hence not assessed in this study. This is, for example, the case for the general furloughing schemes, where employers can receive compensation for sending employees home without having to lay them off (the sectoral use of these schemes is described in more detail in Appendix B).
Step 2 and Step 3 builds on comparison of the actual development with the reference path. The reference path is defined as the most realistic development, without the investigated instrument. In this case, the reference path is then the situation with the economic consequences of the covid-19 pandemic, and without the stimulus measures.
We have based the analysis in Step 2 on the following principles:
- Emission intensity of the receiving sector: If stimulus is directed to sectors with low (high) emission intensity per euro, compared to the average economy, this is considered to decrease (increase) emissions.
- Substitution to alternatives with lower (higher) emissions: If stimulus leads to substitution to activities with lower (higher) emissions, we consider emissions to decrease (increase). Note that this applies also if the activity receiving stimulus is in a sector with high emission intensity (see principle i).
- Specifications regarding climate effects of the stimulus measures: Stimulus measures aimed specifically to reduce emissions either short- or long-term, are considered to reduce emissions. Note that this applies even if the activity is in a high emission intensity sector, or if no sector can be specified.
Considering i), it may seem counterintuitive that support to sectors with large emissions, such as the construction sector, is considered as climate friendly. The logic is that alternative public spending would either increase public support to other activities, or it induces more private spending (by lower need for taxation). Our approach is that support to activities with lower than national average emissions per euro/national currency ontribute to lower the national emission intensity, and hence to reduced national emissions.
For assessing environmental impacts in Step 3, we need to rely on a more qualitative assessment, as the impact on the environment is more complex and spread over a multitude of effects. For the environmental effects, we have considered the potential effects from the economic activity on land use, water use, waste, pollution, and biodiversity, see Appendix F for more details.
Support schemes which trigger activities in sectors with low emission intensity or low environmental impact, and which are not covered by ii) or iii), are not part of this study. This applies, for example, to support schemes targeting the health, education, or culture sector, and in principle may also include support for building activities, industry and parts of the transport sector.
Footnotes
- ^ For example, grants for building charging infrastructure for vehicles may result in increased emissions in the manufacturing sector (if produced within the country) in the short-term but is expected to reduce emissions in the transport sector in the long-term. We have here assumed that the combined short- and long-term effects are positive, i.e., that the long-term effect outweighs the short-term effect.
5.2 Stimulus measures with potential impact on climate/environment
We have identified the share of total Covid-19 stimulus measures where we can assess climate/environment effects. Most measures target several sectors or the economy in general, such as business cost support. For these support schemes, it has not been possible to evaluate the climate and environmental effects. Additionally, we do not consider support schemes directed at sectors with low emission intensity or low environmental impact as relevant (explained in section 5.1). As a result, between 9–25 percent of the total stimulus measures are evaluated as relevant green stimulus measures in this analysis, see Figure 5.1.
Figure 5.1. Total Covid-19 stimulus measures 2020–2021 per capita in all Nordic countries, in euro, and separated by whether climate/environment relevance has been possible to assess.[1]Note: This overview excludes measures that do not have a direct budgetary impact, like loans and guarantees.
Footnotes
- ^ Note: This overview excludes measures that do not have a direct budgetary impact, like loans and guarantees.
Other factors also impact the share of measures we have been able to analyse. In Denmark, for example, over two thirds of the agreed stimulus is yet to specified in terms of which initiative and sector the money should be directed to. Hence, we cannot assess the climate or environmental effects.
This overview only includes stimulus measures with a direct budgetary impact, like grants and tax reduction. Guarantees, loans, and tax deferrals are not included in Figure 5.1. Both categories could be combined if a financial cost for the state would be calculated for each of the measures without a direct budgetary impact. This cost would depend, among other things, on the perceived risk of the measure compared to an alternative investment the state could make. In lack of estimates of these costs for most measures, we treat them separately and examine the full guarantee/loan amounts. Measures where these estimates have been reported, like for example a tax deferral for the Norwegian petroleum industry[1](Ministry of Finance Norway, 2020), are included in the further analyses.
Figure 5.2 shows the potentially climate or environment relevant stimulus by instrument. Most of the stimulus measures which are potentially climate or environment relevant have been given as grants and are hence subject to further analyses. Most of the guarantee or tax deferral measures have been directed towards the transport sector.
Footnotes
- ^ (Ministry of Finance Norway, 2020)
Figure 5.2. Potentially climate/environment relevant Covid-19 stimulus measures, by instrument, for all Nordic countries combined. Million euro.
5.3 Climate impact of stimulus measures with direct budgetary impact
According to our data, more of the covid-19 stimulus measures evaluated in this analysis have had a positive than a negative climate impact, see Figure 5.3. Given that this excludes the effects of guarantees and loans given mostly to the high emission intensity aviation sector, it needs to be viewed in context with the measures presented in section 5.5.
Figure 5.3. Covid-19 stimulus measures by impact on climate in all Nordic countries, euro per capita.
The stimulus given to the construction and the transport sector had the largest impact on climate, see Figure 5.4.
Figure 5.4. Measures by impact on climate and target sector in all Nordic countries combined, euro per capita
In the transport sector, a majority of stimulus had a negative climate impact. There are, however, also several stimulus measures directed towards the transport sector with a positive climate impact, even though the sector has a high emission intensity. We have assessed the climate impact of the transport sector based on average emission intensities per subsector from the European Environment Agency (see also section 4.2.2).[1](European Environment Agency, 2021b) Based on the average emission intensities, stimulus directed towards air and road transport are categorized as having negative effects on the climate while rail and water have a positive climate impact. Even if there are emissions from all transportation, supporting alternatives with lower emission intensities can support substitution from higher emission alternatives and reduce emissions from the transport sector in total. Further, all stimulus directed towards public transportation is also categorized with a positive climate impact, as it is assessed against the alternative of private road transportation.
We have classified stimulus to the construction sector as positive for climate, as the construction sector has relatively low emission intensity in all Nordic countries (see Table 4.3 in section 4.2.24.2.2). Hence, stimulating this sector has less of an impact on climate than activities in other parts of the economy. Nevertheless, the long-term indirect effects of the activity in the construction sector might still increase emissions. This could for example be increased emissions due to deforestation and land use. The potential effect from this is not considered in the analysis. It is also true for example for investment in transportation infrastructure, of which there are examples in Finland, Iceland, and Sweden. E.g., if investing in new roads leads to more emissions from road transportation in the future, the total effects from the stimulus could in fact be negative.
Figure 5.5 compares the climate impact for construction of transport infrastructure and the transport sector, divided by subsectors. It might seem counterintuitive, that while air transportation has a mostly negative effect on emissions, support to the construction of airports has a positive effect. Likewise, the construction of roads is seen as positive, while stimulus directed towards road transportation would have been assigned a negative climate impact based on relative emission intensities. For this classification, we have put weight on the short-term impacts of construction on climate, compared to other sectors of the economy. Hence, we have not considered whether the activity the construction initiative supports will emit more or less than the economy on average.
Footnotes
- ^ (European Environment Agency, 2021b)
Figure 5.5. Covid-19 stimulus measures for construction of transport infrastructure and the transport sector, by impact on environment and subsector. All Nordic countries combined, mill. euro.
It is important to remember that our assessments are based on historical emission intensities of sectors and subsectors, and that these may change in the coming years. For example, transportation of people and goods on rail pollutes less than transportation on road today, but the planned electrification of road transportation could change the relative intensities in favour of road transportation in the future. Our analysis is based on the current emission intensities.
5.3.1 Denmark
In Denmark, the large package for green renovation of public housing represents most of the climate impact. As construction is a sector with a lower emission intensity than the national average, this is categorized as reducing emissions in the short run. Additionally, funds will be explicitly prioritized for measures that increase energy efficiency. Hence, the measure can contribute positively to emission reductions also in the long run through reduced energy consumption.
Further positive impacts are expected from the stimulus fundings directed to green research and preservation of nature and biodiversity, both categorized under sector M in Figure 5.6. The negative environmental impacts are expected from the various stimulus efforts towards the emission-intensive air transport sector which, as far as the official communication reveals, do not contain any specific environmental conditions or “strings attached”.
Figure 5.6. Covid-19 stimulus measures by impact on climate in Denmark, mill. euro. Measures with no climate impact have been excluded.
5.3.2 Finland
In Finland, most stimulus with a positive climate impact have been directed towards the construction sector. This includes, e.g., highway construction projects, interest rate subsidies for state-subsidised housing production, investment in cycling and walking infrastructure and investments in increased use of timber in construction. As mentioned in the start of section 5.3, we have classified all construction measures as having positive climate impact, due to the low emission intensity of the sector, independent of whether the activity potentially increased emissions from other sectors in the long run. This is, of course, a simplification, as different parts of the sector have different emission levels.
Figure 5.7. Covid-19 stimulus measures by impact on climate in Finland, mill. euro. Measures with no climate impact have been excluded.
Stimulus to the research (sector M in Figure 5.7) also has a large positive climate effect. This positive effect mainly comes from a capitalization of the newly established Finnish climate fund.[1](Ministry of Finance Finland, 2020) Its operations focus on combating climate change, boosting low-carbon industry and promoting digitalisation. Another source of positive impacts on emissions is the category B-E industry, which is a Venture capital investment to the Finnish Minerals Group that works for responsible lithium-battery production.
The manufacturing and transport sectors have the largest negative climate effects. Initiatives in the manufacturing sector are classified as having a negative climate effect as the sector is relatively emission intensive in Finland (see Table 4.3 in section 4.2.2). In the transport sector, support packages for the national airline Finnair and the airport company Finavia constitute most of the stimulus with a negative impact. On the other hand, compensation of fair revenue in the public transportation system is classified as having a positive climate impact.
Footnotes
- ^ (Ministry of Finance Finland, 2020)
5.3.3 Iceland
In Iceland, the Covid-19 stimulus measures with a climate impact that can be assessed have been combined into large stimulus packages. In particular, the Icelandic government announced large infrastructure investments in 2020, which will be implemented during the time period 2020–2025. In this overview, we have only included the measures that are planned to be spent in 2020–21.
The positive climate effect from the infrastructure investment scheme is twofold. Firstly, it comes from measures directed towards the construction sector, as this sector has relatively low emission intensity. This includes both housing construction and transportation infrastructure investments. Depending on which type of transportation the investment is directed towards, the long run effects on the climate could be negative. As for construction investments in the other Nordic countries, we have still here placed weight on the short run effects of investing in the construction sector which has a relatively low emission intensity.
Secondly, it comes from funds set aside for energy transition, green solutions, and environmental projects. The funds will go to support to municipalities for improved sewage infrastructure; transition to renewable energy, increased carbon capture; infrastructure development for the circular economy. We have viewed the measure as positive for reducing emissions.
Figure 5.8. Covid-19 stimulus measures by impact on climate in Iceland, mill. euro. Measures with no climate impact have been excluded.
5.3.4 Norway
The largest positive climate effect in Norway comes from a NOK 3.6 bill. green transition package (En pakke for grønn omstilling[1](Nærings- og fiskeridepartementet, 2020)), which was announced in May 2020. This included measures directed towards, among other things, research, technological development, transition towards a more circular economy, and funds directed towards green shipping. In our categorisation, most of this fall under research (sector M in Figure 5.9), and some under manufacturing[2]For example emission-free speedboats, see (Miljødirektoratet, 2020). Additionally, some initiatives within the transport sector and construction sector have a positive climate effect. This includes support to public transportation and passenger rail transportation.
Figure 5.9. Covid-19 stimulus measures by impact on climate in Norway, mill. euro. Measures with no climate impact have been excluded.
The largest negative climate effect comes from the mining and quarrying and transport sectors. For mining and quarrying, the stimulus represents the estimated cost for the state from deferring taxes for the mining and quarrying industry in 2020. In total, the Norwegian petroleum companies are estimated to have had around EUR 11 bill. in increased liquidity in 2020 and 2021 due to the tax deferrals. This is estimated to cost the state EUR 800 bill.[1]This is based on an estimate of the net present value from April 2021. (Finansdepartementet, 2021) The negative effects on climate in the transport sector mostly arise from different types of support to the aviation industry, including support to Avinor, purchase of domestic flights and reduced aviation charges.
Footnotes
- ^ This is based on an estimate of the net present value from April 2021. (Finansdepartementet, 2021)
5.3.5 Sweden
The largest stimulus measures that are expected to have a climate effect relate to the over 1,400 mill. euro of stimulus directed to the transport sector. Here, we estimate that the funding will mostly have a positive effect on the climate, since a substantial share of the funds are directed to, e.g., public transport and to freight rail transport – we therefore assume that those efforts will contribute to divert transport activity from more emission-intensive forms of transport.
Furthermore, we also assign a positive climate effect from the 500 mill. euro recapitalisation of SAS, which was coupled with more ambitious climate goals: SAS are to reduce their CO2 emissions by 25 percent by 2025, instead of the original goal of the same reduction by 2030. Thus, although air transport is emission-intensive, we assign a positive impact since we compare it to a scenario where the recapitalisation would not have come with any stricter environmental requirements. The negative climate impacts of stimulus to the transport sector in Sweden relate to other support measures to the air transport sector that did not come with any climate-related requirements.
Figure 5.10. Covid-19 stimulus measures by impact on climate in Sweden, mill. euro. Measures with no climate impact have been excluded.
The second largest climate impact is expected from stimulus measures directed to construction-related activities. The largest measure is that of renovation of buildings to increase their energy efficiency, maintenance of railroads (expected to divert transportation activities towards rail from more polluting forms of transportation) and support for the setting up of the charging infrastructure for electric cars.
The positive impact expected from stimulus to industry is related to “Industriklivet”, which contribute to develop solutions that reduce emissions from industrial activity. The negative impact assigned to measures targeting all sectors refer to the paused GDP-indexation of fuel taxes, which is expected to lead to increased use of fossil fuels than what would otherwise have been the case.
5.4 Environmental impact of Covid-19 stimulus measures with direct budgetary impact
Overall, the environmental impacts have been more difficult to assess than the climate impacts. We had to rely more on qualitative assessments. Keeping this in mind, we see that the overall environmental impact differs between the counties. Denmark has only measures with a positive environmental impact, while both Norway and Iceland have mostly implemented measures with a negative environmental impact. Sweden has the lowest amount of stimulus with identified environmental impact.
Figure 5.11. Covid-19 stimulus measures by impact on environment in all Nordic countries, euro per capita. Measures with no environmental impact have been excluded.[1]Does not include environmental effects of the transport sector
Footnotes
- ^ Does not include environmental effects of the transport sector
In Figure 5.11, we have not taken into consideration the environmental effects of the transport sector. This is a sector that has large environmental effects, through for example air, water, and noise pollution. If we include these effects, the environmental effects increase as illustrated in Figure 5.12.[1]All countries have had stimulus packages directed towards the transport sector. For Iceland this has been only in the form of guarantees, which are not analysed here. See section 5.5. All modes of transportation affect the environment, but to differing degrees. Here, we have classified rail transportation and water transportation as positive, as they have smaller environmental impacts than road and air transportation. Additionally, public transportation has also been classified as positive as it has a lower environmental impact per passenger than private transportation.
Footnotes
- ^ All countries have had stimulus packages directed towards the transport sector. For Iceland this has been only in the form of guarantees, which are not analysed here. See section 5.5.
Figure 5.12. Covid-19 stimulus measures by impact on environment in all Nordic countries including effect from stimulus to the transport sector, euro per capita. Measures with no environmental impact have been excluded.
As with climate effects, the stimulus given to the construction and the transport sector have the largest impact on the environment, see Figure 5.13. For an overview by country and sector, see Appendix G.
Figure 5.13. Measures by impact on environment and target sector in all Nordic countries combined, euro per capita. Measures with no environmental impact have been excluded.
Many of the initiatives that have a positive or negative environmental impact, also have a similarly positive or negative climate impact. These have already been discussed in detail in section 5.3. There are, however, some exceptions, where the climate and environmental impacts differ. These are discussed below.
Initiatives which we have categorized under sector R – Arts, entertainment, and recreation have positive environmental effects but, for most initiatives, no climate effects. Stimulus to this sector mostly constitutes of measures related to nature restoration and conservation. For example, Finland has agreed on funds to support water rehabilitation and migratory fish projects and will also improve flood risk management. Denmark has agreed on a package to improve biodiversity, which will be achieved through establishing more nature reserves and allowing for more forest to remain untouched.[1](Finansministeriet, 2020) Norway has agreed to direct funds for example towards helping endangered species and combatting invasive species,[2](Klima- og miljødepartementet, 2020) and Sweden has directed funds for example towards restoration of wetlands.[3](Regeringskansliet, 2020)
Some of the manufacturing stimulus in Finland which has a negative impact on climate, is considered to have a positive impact on the environment in the long run. This is for example the case for the investment in two multi-purpose offshore vessels, which are a part of the Defence Forces but will also be capable of responding to oil and chemical spills. Nevertheless, in this case, the positive environmental effects only materialize if there is an oil or chemical accident.
Stimulus directed towards the construction sector, which has a positive effect on climate, has a mixed effect on the environment. If the construction stimulus for instance affects land use, like construction of new housing of transportation infrastructure, this has a negative environmental impact. For example, the Icelandic construction stimulus is viewed to have a negative impact on the environment as it affects land-use. In Sweden, support to charging infrastructure of electric vehicles, although it most likely will have a positive impact on the climate in the long run, is viewed to have a negative impact on the environment since it is likely to increase land use.
Some construction stimulus is nevertheless categorized as positive for the environment. This is mostly initiatives which include environmental objectives. The largest share of this is connected to the green renovations in Denmark, mentioned in section 5.3.1. There are also several other, smaller initiatives. In Finland, for example, there are initiatives to use more timber in construction and phasing out oil heating in both households and municipal buildings.
5.5 Impact of guarantees and loans
The guarantees and loans given out during the Covid-19 pandemic in the Nordic countries has been primarily directed towards the aviation industry. All countries have provided some type of support for air transport, e.g., Iceland has supported Icelandair, Finland has supported Finnair, Denmark and Sweden have supported SAS, and Norway has supported both the airport company Avinor as well as made available large loan and guarantee packages for aviation companies. None of these initiatives contained any specific climate or environmental conditions or “strings attached” and are therefore categorized as having a negative climate and environmental impact[1]Compared to a situation with the economic consequences of the pandemic, but without the economic stimulus measures., since the air transport sector is relatively emission intensive compared to other sectors (see section 4.2.2).
Some other loan guarantees have also been introduced: one in Finland for shipping companies, and the other in Sweden for industrial investments. Both have been classified as having a positive climate and environmental impact. The first is classified as positive as the stimulus is directed towards water transport, which has lower CO2-emissions and lower levels of air and noise pollution compared to air or road transport. The second is classified as positive as the purpose of the loan guarantees is to support the green transformation of industry (so called green credit guarantees). The scheme will only guarantee loans for industrial investments in Sweden which support the achievement of environmental and climate goals.[2](Riksgälden, 2021)
Figure 5.14. Guarantees and loans given out as Covid-19 stimulus measures by country and impact on climate and environment, mill. euro.
6 Summary and discussion
This report assesses the “green stimulus” relevance of the covid-19 stimulus measures in the Nordic region. By green stimulus we mean measures that can achieve economic stimulus while also reducing greenhouse gas emissions and enhancing environmental and natural resource quality.
The analysed measures include the covid-19 stimulus measures as described in the state budgets of the Nordic countries for 2020 and 2021. needed to conclude on the climate and environmental effects.
Main findings
All countries implemented comprehensive covid-19 stimulus packages after the outbreak of the pandemic, in a range from 2000 euro per capita in Finland to 4400 euro per capita in Denmark. When comparing these numbers, it is important to keep in mind that what are announced as covid-19 measures within each country may differ, so that these figures are not a full picture of the countries’ fiscal measures to counteract the recession following the pandemic. Also, for some of the projects needing long-term planning, such as the infrastructure projects, there is a good chance they would have been realized sooner or later without the pandemic. Both Denmark and Iceland introduced large infrastructure projects running over several years as a response to the economic downturn.
The majority of measures (76–92 percent depending on country) are either assessed as not having any significant impact on emissions or the environment, i.e., schemes directed at sectors with low emission intensity or low environmental impact, or they are not possible to evaluate. Most measures target several sectors or the economy in general, such as business cost support. For these support schemes, more comprehensive analyses for each measure would have been needed to conclude on the climate and environmental effects. Additionally, over two thirds of the agreed stimulus in Denmark was, to the best of our knowledge, not yet specified, when this analysis was conducted, in terms of which initiative and sector the stimulus should be directed to.
When it comes to the effects on greenhouse gas emissions and the environment, we have identified that at least 6–21 percent of the stimulus measures fit our definition of a green stimulus in terms of decreasing greenhouse gas emissions. At least 2–13 percent of the economic stimulus packages contribute to increased greenhouse gas emissions. The picture is almost the same for the environment. The effects on the environment is very similar to those for greenhouse gas emissions. Hence, we focus on the effects on greenhouse gas emissions in this summary.
Figure 6.1. Total stimulus per country in 2020 and 2021, euro per capita, by assessed negative or positive climate impact in percent
Of the measures assessed to impact greenhouse gas emissions and the environment, we find that Iceland stands for the highest financial support per capita. The entire share falls under the definition as green stimulus. A large share is directed towards the construction sector. The emission intensity in the construction sector is relatively low compared to national average. We define support to activities with a lower than the average emission intensities as green in the sense as impacting emissions and the environment less than the alternative public or private spending. Also, Iceland has set aside funds for energy transition, green solutions, and environmental projects.
In Denmark, funds to renovation of public housing represents the largest share of green stimulus. Further, funds are prioritized for measures that increase energy efficiency, and to green research and preservation of nature and biodiversity. The negative impacts are expected from the various stimulus efforts towards the emission-intensive air transport sector which, as far as the official communication reveals, do not contain any specific environmental conditions.
In Finland, most stimulus with a positive climate impact are directed towards the construction sector, including, e.g., highway construction projects, interest rate subsidies for state-subsidised housing production, investment in cycling and walking infrastructure and investments in increased use of timber in construction. Other sources are stimulus to research related to climate change, low-carbon industry and digitalisation and investment responsible lithium-battery production. Support to relatively emission intensive manufacturing and to the transport sectors, including aviation, have the largest negative effects.
The largest positive climate effect in Norway comes from a green transition package, including measures directed towards, among other things, research, technological development, transition towards a more circular economy, and funds directed towards green shipping. Some initiatives within the transport sector and construction sector, including support to public transport, are assessed to have positive effects. In Norway, the share of the measures with negative climate and environmental effects is higher than the share defined as green stimulus. This is overall support in terms of tax deferrals to the mining and quarrying industry, and support to the aviation industry.
In Sweden, stimulus directed to the transport sector will mostly have a positive effect on the climate, since a substantial share of the funds are directed to public transport and rail transport, and hence a substitution from more transport with higher emission intensities. Furthermore, large funds were directed to recapitalisation of SAS with strings attached to more ambitious climate goals. Thus, although air transport is emission-intensive, we assign a positive impact since we compare it to a scenario where the recapitalisation would not have come with any stricter environmental requirements. Further, stimulus measures to renovation of buildings to increase their energy efficiency, charging infrastructure for electric cars and stimulus to emission reducing development in industrial activities. The negative impact assigned to measures targeting all sectors refer to the paused GDP-indexation of fuel taxes, which is expected to lead to increased use of fossil fuels than what would otherwise have been the case, and measures to the air transport sector that did not come with any climate-related requirements.
Figure 6.2. Covid-19 stimulus measures by impact on climate in all Nordic countries, euro per capita. Measures with no climate impact have been excluded.
Discussion
The construction sector constitutes the main share of the green stimulus measures. It may seem counterintuitive that support to construction is considered as climate friendly. Road projects contribute to a large share of the national emissions. However, so do economic stimuli in general. Alternatively, lower public spending to covid-19 measures would either increase public support to other activities, or, alternatively, more private spending (by lower need for taxation). Our approach is that support to activities with lower than national average emissions per euro/national valuta contribute to lower the national emission intensity, and hence to reduced national emissions.
This analysis is based on an aggregated sector level. The construction sector is very broad and covers a wide spectrum of activities, where some obviously have higher emission intensity than the national average. This clearly also applies to the transport sector. We have corrected for this in the classification of the stimulus measures when relevant information has been available.
Further, we consider measures aimed to lower emissions as positive, even if the emission intensities in the receiving sector are higher than average. This may also seem counterintuitive when it relates to, e.g., road traffic or aviation. Most transport is emission intensive and environmentally damaging, including parts of public transport. We have chosen to define support to reduce the climate and environmental pressure as positive, irrespective of the activity in question, when it promotes substitution to lower emissions within the sector. For some large support schemes, e.g., to the aviation sector, more detailed analysis could give more insight into if the measures contribute to significant changes, or if the measures are more-or-less renaming of already planned changes in technologies.
Other complicating aspects are the short/long term perspective and valuation of first/second order effects. In support to transport infrastructure, the construction phase is positive due to low emission intensity, but the usage may be negative (if running on fossil fuels) or positive (if running on renewable energy). Our approach is to assess the direct effects, hence in this example the construction phase. If the support incentivises substitution from more to less emission intensive activities, we assess the measure as emission reducing. This may be more relevant for the long run.
Figure 6.3. Measures with positive and negative impact on climates by target sector in all Nordic countries combined, euro per capita. Measures with no climate impact have been excluded.
It is important to bear in mind that our assessments are based on historical emission intensities of sectors and subsectors, and that these may change in the coming years. For example, transport of people and goods on rail pollutes less than transport on road today, but the planned electrification of road transport could change the relative intensities in favour of road transport in the future. Except for the effect of the stimulus measures, we have not taken such underlying technological changes into account.
Further, we have based our analyses on the value of the stimulus, not on expected reductions/increases in greenhouse gasses. The value of the stimulus cannot be expected to correspond to the actual level of emission reduction/increase, and hence the overview should not be viewed as stating how much emissions have been affected by the stimulus directed to different sectors. For this reason, we also cannot conclude with the net greenhouse gas impact of the stimulus.
Policy implications
Stimulation of the construction sector has been most important to lower the overall emission intensities in the Nordic countries. The emission intensities are lower than average in this sector. (Note that the long-term effects depend on the type of construction.) A learning for potential later economic crises is to stimulate activities with generally low emission intensities, and high labour intensities, if the main political goal of the stimulus is to counteract unemployment.
The main argument for green stimulus programs is that they can achieve economic stimulus targets while also reducing climate gas emissions and improving the environment. This does, however, not agree with economic theory on policy design, which states that to achieve two separate policy targets efficiently, one separate instrument for each goal is needed. Our literature review on covid-19 analyses supports this. For example, Chen et al. (2020) states that to put limited government funds to the best use, most of the pandemic-related stimulus should initially focus on investments that get people back to work quickly. This may be said to correspond to most of the Nordic stimulus measures.
Any public project of a certain size should undergo a cost-benefit analysis, where climate and environmental effects are considered in line with the positive benefits to employment and economic growth. In this approach, both elements in green stimulus - stimulating the economy while reducing greenhouse gas emissions and protecting the environment - are balanced. Direct instruments counteracting climate and environmental costs are generally more efficient than scaling down the measure meant to stimulate the economy.
For most of the covid-19 support measures undertaken by the Nordic governments, there is a lack of information enabling analysis of green effects. This reflects the urgency of getting the economic support schemes in place, where pre-evaluations based on full cost-benefit analyses were probably not prioritized. Our impression is that the short-term measures supporting companies and households were mostly appropriate in that they prevented a catastrophic downturn in the economy and household incomes.
Some green stimulus measures can also reduce market failures, such as support for technology development, R&D and market introduction. Detailed, ex-post evaluations of the largest support schemes could bring insight into which instruments provide the most efficient green stimulus. This could be valuable information in future economic crises with little time to analyse the effects of the measures before implementation.
References
Agrawala, S., Dussaux, D., & Monti, N. (2020). What policies for greening the crisis response and economic recovery? OECD Environmental Working Paper.
Alberini, A., Gans, W., & Towe, C. (2016). Free Riding, Upsizing, and Energy Efficiency Incentives in Maryland Homes. The Energy Journal, International Association for Energy Economics.
Brahmbhatt, M. (2021). Criticizing green stimulus for COVID recovery. Wiley interdisciplinary reviews: Climate Change 12(4).
Chen, Z., Marin, G., Popp, D., & Vona, F. (2020). Green Stimulus in a Post-pandemic Recovery: the Role of Skills for a Resilient Recovery. Environ Resource Econ 76, 901–911.
Council of Economic Advisors. (2016). A retrospective assessment of clean energy investments in the recovery act. Executive Office of the President of the United States.
European Commission . (2021b, December). A European Green Deal. Striving to be the first climate-neutral continent. Retrieved December 20, 2021, from ec.europa.eu: https://ec.europa.eu/info/strategy/priorities-2019-2024/european-green-deal_en
European Environment Agency. (2021b, June 21). Rail and waterborne — best for low-carbon motorised transport. Retrieved December 20, 2021, from https://www.eea.europa.eu/: https://www.eea.europa.eu/publications/rail-and-waterborne-transport
Eurostat. (2021). Statistical Classification of Economic Activities in the European Community, Rev. 2 (2008) . Retrieved from Eurostat: https://ec.europa.eu/eurostat/ramon/nomenclatures/index.cfm?TargetUrl=LST_NOM_DTL&StrNom=NACE_REV2&StrLanguageCode=EN&IntPcKey=&StrLayoutCode=HIERARCHIC
Finansdepartementet. (2020, March 19). Extra ändringsbudget för 2020 - Åtgärder med anledning av coronaviruset. Prop. 2019/20:132. . Retrieved from https://www.regeringen.se/rattsliga-dokument/proposition/2020/03/prop.-201920132/
Finansdepartementet. (2021). Meld. St- 2 (2020-2021) Revidert nasjonalbudsjett 2021.
Finansministeriet. (2020, December 04). Aftale om biodiversitet giver historisk løft til Danmarks natur. https://fm.dk/nyheder/nyhedsarkiv/2020/december/aftale-om-biodiversitet-giver-historisk-loeft-til-danmarks-natur/
Grigolon, L., Leheyda, N., & Verboven, F. (2016). Scrapping subsidies during the financial crisis — Evidence from Europe. International Journal of Industrial Organization, Vol. 44.
Hepburn, C., O’Callaghan, B., Stern, N., Stiglitz, J., & and Zenghelis, D. (2020). Will COVID-19 fiscal recovery packages accelerate or retard progress on climate change? Oxford Smith School of Enterprise and the Environment, Working Paper 20-02.
IEA. (2020, June 29). Green stimulus after the 2008 crisis. Learning from successes and failures. Retrieved September 29, 2021, from iea.org: https://www.iea.org/articles/green-stimulus-after-the-2008-crisis
Klima- og miljødepartementet. (2020, May 29). Vil setje i stand natur- og friluftslivsområde. Retrieved December 17, 2021, from regjeringen.no: https://www.regjeringen.no/no/dokumentarkiv/regjeringen-solberg/aktuelt-regjeringen-solberg/kld/nyheter/2020-nyheter/vil-setje-i-stand-natur--og-friluftslivsomrade/id2704464/
Li, S., Linn, J., & Spiller, E. (2013). Evaluating “Cash-for-Clunkers”: Program effects on auto sales and the environment. Journal of Environmental Economics and Management.
Miljødirektoratet. (2020, november 26). Retrieved december 10, 2021, from https://www.miljodirektoratet.no/aktuelt/nyheter/2020/november-2020/89-millioner-til-utvikling-av-utslippsfrie-hurtigbater/
Ministry of Finance Finland. (2020, June 03). Government reaches agreement on fourth supplementary budget proposal for 2020. Retrieved December 17, 2021, from https://valtioneuvosto.fi/en/-/10616/hallitus-paatti-vuoden-2020-neljannesta-lisatalousarvioesityksesta
Ministry of Finance Norway. (2020, June 08). Economic measures in Norway in response to Covid-19 as of June 2020. Retrieved December 20, 2021, from regjeringen.no: https://www.regjeringen.no/en/historical-archive/solbergs-government/fin/economic-measures-in-norway-in-response-to-covid-19/id2703484/
Nahm, J. M., Miller, S. M., & Urpelainen, J. (2022). G20’s US$14-trillion economic stimulus reneges on emissions pledges. Nature 603, 28-31.
Nærings- og fiskeridepartementet. (2020, May 29). En pakke for grønn omstilling. Retrieved October 29, 2021, from https://www.regjeringen.no/no/dokumentarkiv/regjeringen-solberg/aktuelt-regjeringen-solberg/nfd/pressemeldinger/2020/ny-side5/id2704503/
OECD. (2020, October 06). Making the green recovery work for jobs, income and growth. Retrieved December 20, 2021, from oecd.org: https://www.oecd.org/coronavirus/policy-responses/making-the-green-recovery-work-for-jobs-income-and-growth-a505f3e7/
OECD. (2021). Retrieved 12 20, 2021, from oecd.org: https://www.oecd.org/coronavirus/en/themes/green-recovery
OECD/ITF. (2011). Car Fleet Renewal Schemes: Environmental and Safety Impacts.
Pollitt, H. (2011). Assessing the Implementation and Impac of Green Elements of Member States' National Recovery Plans. European Commission (DG Environment).
Popp, D., Vona, F., Marin, G., & Chen, Z. (2020). The employment impact of green fiscal push: evidence from the American Recovery Act. . National Bureau of Economic Research Working Paper #27321.
Regeringskansliet. (2020, September 14). Grön återhämtning i budgetpropositionen för 2021. Retrieved December 20, 2021, from https://www.regeringen.se/4a6530/contentassets/0a093ebf8c5c4488945f63d790746202/gron-aterhamtning-i-budgetpropositionen-for-2021-i-siffror.pdf
Riksgälden. (2021, September 8). Regeringen föreslår höjd garantiram för statens gröna kreditgarantier. Retrieved December 20, 2021, from https://www.riksgalden.se/sv/press-och-publicerat/pressmeddelanden-och-nyheter/nyheter/2021/regeringen-foreslar-hojd-garantiram-for-statens-grona-kreditgarantier/
Strand, J., & Toman, M. (2010, January). "Green Stimulus," Economic Recovery, and Long-Term Sustainable Development. Policy Research Working Paper.
Sveriges Radio. (2020, October 9). Volvo avslutar alla coronapermitteringar. Retrieved from https://sverigesradio.se/artikel/7571490.
Swedish Government. (2021, September 20). Ekonomiska åtgärder med anledning av pandemin 2020–2021. https://www.government.se/articles/2021/09/economic-measures-on-account-of-the-pandemic-20202021/
Teknikföretagen. (2021, April 14). Experten: Därför är det halvledarbrist i fordonsindustrin. Retrieved December 20, 2021, from https://t.teknikforetagen.se/forskning-innovation/experten-darfor-ar-det-halvledarbrist-i-fordonsindustrin/
The programme of Marin's Government. (2019, December 10). Annex 2. One-off future-oriented investments. Retrieved from valtioneuvosto.fi: https://valtioneuvosto.fi/en/marin/government-programme/one-off-future-oriented-investments
Työ- ja elinkeinoministeriö. (2021). Yritystukien tutkimusjaoston raportti 2021. Työ- ja elinkeinoministeriön julkaisuja • Yritykset • 2021:25.
Valtiovarainministeriön. (2021). Taloudellinen katsaus Syksy 2021. Valtiovarainministeriön julkaisuja – 2021:51.
YLE. (2021, October 1). Koronatukia on jaettu jo miljardeja suomalaisfirmoille – tarkastusviraston tyly arvio: Tukea meni yrityksille, jotka eivät olisi tukea tarvinneet. Retrieved December 20, 2021, from https://yle.fi/uutiset/3-12115110
Appendix A – NACE sectors
| NACE Rev. 2 Economic sector | |
| A | Agriculture, Forestry And Fishing |
| B | Mining And Quarrying |
| C | Manufacturing |
| D | Electricity, Gas, Steam and Air Conditioning Supply |
| E | Water Supply; Sewerage, Waste Management and Remediation Activities |
| F | Construction |
| G | Wholesale And Retail Trade; Repair of Motor Vehicles And Motorcycles |
| H | Transportation And Storage |
| I | Accommodation And Food Service Activities |
| J | Information And Communication |
| K | Financial And Insurance Activities |
| L | Real Estate Activities |
| M | Professional, Scientific and Technical Activities |
| N | Administrative And Support Service Activities |
| O | Public Administration and Defence; Compulsory Social Security |
| P | Education |
| Q | Human Health and Social Work Activities |
| R | Arts, Entertainment And Recreation |
| S | Other Service Activities |
| T | Activities Of Households as Employers; Undifferentiated Goods- And Services-Producing Activities Of Households For Own Use |
| U | Activities Of Extraterritorial Organisations and Bodies |
Table A.1. NACE Rev. 2 Economic sector.
Source: Eurostat (Eurostat, 2021)
Appendix B – Stimulus measures by country
In the following we briefly describe the measures each country has implemented or plans to implement. Each country’s measures are identified based on information in the respective country’s state budgets for 2020 and 2021.
Denmark
To the best of our knowledge, there has been no official communication from the Danish government regarding the total aggregated value of financial stimulus measures launched as a response to the pandemic. However, by looking at the various financial packages that have been agreed, at least a total amount of approximately DKK 167 bill. has been agreed. This includes various types of funding, loans, guarantees, subsidies, and deferred taxes, directed at specific sectors, private consumers/homeowners, or specific companies. Of these 167 bill., 128 bill. is yet to specified in terms of which initiative and sector the money should be directed to.
One of the larger initiatives launched by the Danish government is labelled “Green restart” (in Danish, Grøn Genstart), with an overall contribution of DKK 55 bill. DKK 24 bill. of those are payments to individuals for two weeks of holiday (that were originally intended to be “frozen” until people reach retirement, following a shift in the Danish holiday system). However, at the time of writing, only a small part of the remaining 31 bill. of the "Green restart” package has been specified in more detail such that it is possible to identify which sectors the funds have been directed to. Those funds are analyzed in more detail in the following sections.
In total, at the time of writing, only DKK 37.6 bill. of the DKK 167 bill. has been specified – out of those, DKK 6.3 bill. have been directed to a specific recipient sector (or a specific company, and thus it is possible to identify the sector). 88 percent of those DKK 6.3 bill. have been directed towards the air transport sector (NACE rev. 2 H51) and 12 percent to the arts, entertainment, and recreation sector (NACE rev. 2 R).
However, the DKK 167 bill. does not include the general schemes of compensation (e.g., to cover companies’ wages and fixed costs) made available for businesses, regardless of sector. Currently, DKK 19 bill. have been paid out in wage compensations to Danish businesses across sectors. The wholesale and retail trade and accommodation and food services sectors have been the largest receivers of these funds. Furthermore, approximately DKK 16 bill. has been paid out as compensations for fixed costs.
Figure B.1. Share of approved furlough money in Denmark by sector, 2020 and 2021. Source: Erhvervsstyrelsen, Statistik for kompensationsordninger, as of 7 October 2021.
Finland
Finland has increased the state budget by a total of EUR 15 bill. to cover pandemic related expenses during the period of 2020–2022.[1]Based on estimates published 27.09.2021 in (Valtiovarainministeriön, 2021) In addition to this there are several measures that are not estimated to have a direct budgetary impact have been put in place to tackle the consequences of the pandemic. This includes 3,1 bill. to support municipalities, 0,6 bill. in support for different social services, and 0,5 bill. as a cost for tax deferrals. Additionally, Finnvera (financing company owned by the State of Finland) has also been given a mandate for loans and guarantees of up to EUR 10,8 bill.[2](Työ- ja elinkeinoministeriö, 2021), (Valtiovarainministeriön, 2021)
Based on our understanding of the measures, the total cost of stimulus measures for Finland in 2020–21 is at least 10.8 bill. This includes 8.2 bill. in increased budgeted costs, 1.5 bill. in financial investments, and 1.1 bill. in cost of tax deferrals and support to children and elderly.[3](Valtiovarainministeriön, 2021)
Nevertheless, not all the granted stimulus has been distributed to businesses. For example, by March 2021 only 2.9 bill. of the loans and guarantees from Finnvera had been used.[4](Työ- ja elinkeinoministeriö, 2021) During 2020 and 2021 in total EUR 2.4 bill. have been paid in support measures to Finnish businesses.[5](YLE, 2021)
One of the large stimulus packages in Finland during the Covid-19 crisis has been the business cost support, intended for companies with significantly reduced revenue because of the Covid-19 pandemic. The service and retail sectors have been large recipients of this stimulus.
Figure B.2. Business cost support by sector in Finland during 2020 and 2021, EUR mill. Source: Työ- ja elinkeinoministeriö (2021)
In addition to the Covid-19 stimulus measures, Finland has also in parallel had increased governmental expenses related to a program called One-off future-oriented investments. The program runs through 2020–22 and was agreed upon in 2019. The investments total 3 bill. euro, of which 0,5 bill. are directed towards a program called “Carbon neutral Finland that protects biodiversity”.[1](The programme of Marin's Government, 2019) Even if these investments are one-off and coincide with the pandemic, they are not motivated by the economic consequences of the pandemic and, hence, cannot be categorized as stimulus. They are therefore not included in our analysis.
Footnotes
- ^ (The programme of Marin's Government, 2019)
Iceland
The Covid-19-related financial support measures introduced by the Icelandic government so far have been announced in four stages, starting in March 2020. Direct measures (government expenditures or reduced taxes) over 2020–2021 are estimated to amount in total to ISK 149 bn or 5.1 percent of 2020 GDP. Indirect support measures without direct impact on the government budget (loan guarantees, tax deferrals, access to third-pillar savings, etc.) amount to an additional ISK 75 bn or 2.6 percent of 2020 GDP. In total, the support measures amount to ISK 225 bn or 7.6 percent of GDP. The government has also announced plans for increased investment over 2022–2025 in infrastructure and R&D amounting in total to 2.5 percent of 2020 GDP, or 0.6 percent per year over these four years.
Most of the measures are general and needs based rather than sector specific, totalling 139 bn (4.7 percent of GDP). The largest share of support has gone to households (72 bn, 2.4 percent of GDP), mostly in the form of partial unemployment benefits in relation to reduced employment and access to third-pillar private pension savings. General support for industries amounts to 67 bn (1.9 percent of GDP). A third of these measures come in the form of indirect support (tax deferrals and loan guarantees). The largest forms of general direct support, in total 33 bn, are payment of wages during dismissal period and subsidies to entities (including self-employed individuals) sustaining large losses in revenues.
Direct stimulus measures for the construction industry in 2020–2021 amount to 42 bn (1.4 percent of GDP). Most of this comes in the form of a plan for increased investment in infrastructure. Most of the 20.5 bn in support for tourism came in the form of loan guarantees for Icelandair and the Travel Guarantee Fund. Finally, the government increased funding for universities (to support increased enrolment), and subsidised sports clubs (to meet fall in revenues due to closures); in total this support amounted to 10 bn. Investment attributed to Covid-related stimulus in R&D, IT infrastructure, as well as investment in the clean energy transition and environmental infrastructure amounted to 13 bn over 2020–2021.
Only partial Information exists on how financial stimulus measures were distributed onto industries. Most measures were general rather than sector specific so a correlation between the impact of the pandemic and support might be expected. The tourism industry has no doubt been one of the hardest hit, so it is not surprising that 87 percent of wages during dismissal period as well as 60–70 percent of direct revenue-related support went to firms in that sector. Moreover, approximately half of partial unemployment benefits went to individuals who had been working in tourism. Firms in the tourist sector also received most loan guarantees (61 percent of “support loans” and 97 percent of "bridge loans”) with the remainder mostly spread over service-oriented sectors. The construction industry also received a large amount of stimulus.
Norway
During 2020 and 2021, Norway has in total budgeted almost NOK 230 bill. for handling of the coronavirus pandemic.[1]The estimate is from April 2021 and is based on a granted budget for the stimulus measures. The total amount spent might be lower or higher. This includes NOK 104 bill. in total for the private sector, NOK 69 bill.
in 2020 and NOK 35 bill. in 2021, as well as funds directed towards households (NOK 39 bill. in total), critical sectors (NOK 76 bill.), and culture and sports (NOK 10 bill.). This calculation only includes measures with a direct budgetary impact, and hence changes to the petroleum taxation, deferral of tax payments and loans and guarantees are not included.[2](Finansdepartementet, 2021)
Of the budgeted measures, over 75 NOK bill. have been directed towards critical sectors, like the welfare system. These measures are difficult to categories as stimulus measures.
Additionally, a large share of the measures has been handled through general compensation schemes, both to companies struggling with the restrictions and to workers who were temporarily laid off due to the crisis. The sector that has received the largest amount of funding through Covid-19 stimulus measures is manufacturing, followed by professional, scientific, and technical activities. In total, these sectors have received over half of the approved stimulus measures to private enterprises, see Figure B.3.[3]The statistic includes the following types of instruments: grants, loans, guarantees, and equity investments. The statistic includes policy instruments administered by Brønnøysundregistrene, Eksportfinansiering Norge, Enova, Forskningsrådet, Fylkeskommunene, Horisont 2020, Innovasjon Norge, Investinor, NAV, Nysnø, Siva, Skatteetaten, SkatteFUNN.
Footnotes
- ^ The estimate is from April 2021 and is based on a granted budget for the stimulus measures. The total amount spent might be lower or higher.
- ^ (Finansdepartementet, 2021)
- ^ The statistic includes the following types of instruments: grants, loans, guarantees, and equity investments. The statistic includes policy instruments administered by Brønnøysundregistrene, Eksportfinansiering Norge, Enova, Forskningsrådet, Fylkeskommunene, Horisont 2020, Innovasjon Norge, Investinor, NAV, Nysnø, Siva, Skatteetaten, SkatteFUNN.
Figure B.3. Approved stimulus to private enterprises in Norway 2020 and 2021 by sector.
Source: Koronadata (2021)
One of the initiatives that is especially interesting for this report is the NOK 3.6 bill. green transition package (En pakke for grønn omstilling), which was announced in May 2020. This included measures directed towards, among other things, research, technological development, transition towards a more circular economy, and funds directed towards green shipping.
Sweden
The Swedish government has launched Covid-19 related financial support measures with a direct budgetary impact, amounting to almost SEK 400 bill. in total during 2020 and 2021 (corresponding to approximately 7 percent of Sweden’s 2021 GDP). To that, the Swedish government has made available loans, guarantees and tax deferrals for companies, amounting to almost SEK 1,000 bill. in total (corresponding to approximately 19 percent of Sweden’s 2021 GDP).[1](Swedish Government, 2021) The latter measures may not have a direct budgetary impact, insofar as the loans and deferred taxes (with interest) are paid back at a later stage.
Of the 400 bill. with a direct budgetary impact, approximately 130 bill. have been directed to the welfare system and to limit the spread of the virus. Those measures can hardly be viewed as “stimulus” measures. Of the remaining 255 bill., 146 bill. have been directed to “saving” Swedish jobs and companies, 35 bill. to support unemployed persons, and 74 bill. have been directed to boosting economic activity. In the latter category, SEK 14 bill. fall under the label “Green economic recovery”, though it is not further specified which specific measures that fall under this category.
In total, the amount for which we can identify a specific recipient sector amounts to approximately SEK 15 bill. Approximately 80 percent of these are directed to the transport sectors (NACE rev. 2 H, spread across land, water and air transport). The remaining 20 percent have been directed to the manufacturing or the construction sectors.
The individually largest budgetary post is that of wage compensation for short-term furloughing of employees (in Swedish, korttidspermittering), whereby companies can apply for money from the government to pay wages to employees despite the employees being fully or partially sent home from work. The Swedish government has estimated that the budgetary impact of the furlough money will amount to SEK 45 bill. in 2020 and 2021 – as of early October 2021, approximately SEK 37 bill. in furlough support has been approved. There is data available on the division of approved furlough money across sectors, in the Swedish economy, presented in Figure B.4.
Footnotes
- ^ (Swedish Government, 2021)
Figure B.4. Share of approved furlough money in Sweden by sector, 2020 and 2021.
Source: Tillväxtverket, Statistik om korttidsarbete, as of 6 October 2021.
The manufacturing sector has received almost one quarter of the furlough money in Sweden. As previously discussed, the Swedish manufacturing sector was one of the most negatively impacted sectors during the pandemic – the use of furlough money most likely contributed to limit the decrease in persons employed to 2.4 percent, while total hours worked decreased by 7.4 percent, in the manufacturing sector. The furlough money encompassed 191,000 people employed in the Swedish manufacturing sector.
The accommodation and food service sector also experienced a relatively strong negative impact during the pandemic, and it received 13 percent of the total furlough money, encompassing 86,000 employees.
Unlike the manufacturing and the accommodation and food service sectors, the wholesale & retail, and the professional services sectors in Sweden did not stand out by experiencing relatively larger negative impacts during 2020, compared to other sectors of the economy. However, each sector received approximately 15 percent of the total furlough money. In the wholesale & retail sector, this encompassed 125,000 employees, and the furlough money to the professional services sector encompassed 71,000 employees.
Appendix C – Sectors with largest negative economic impact per country
Denmark
In Denmark, the sectors with the largest negative impacts were arts, entertainment and recreation, accommodation and food service activities, and transportation and storage. All these sectors had substantially lower growth rates during 2020 compared to the average annual growth rates during 2017–2019. It is in this aspect worth noticing that the sector mining and quarrying had a very poor growth rate of –24 percent in GVA during 2020 – however, the average annual growth rate during 2017–2019 was –17 percent. Thus, while substantially lower in 2020 than in the three preceding years, the sector had experienced a shrinking GVA also prior to the pandemic.
Furthermore, it is also worth noting that GVA in the wholesale and retail sector grew by 1.4 percent in 2020 compared to 2019. Employment in the sector grew by 0.2 percent, but the total hours worked decreased by 2.8 percent. Thus, even though the growth during 2020 was lower than the average annual growth rate during 2017–2019 across all three parameters, it appears that the overall impact on the Danish wholesale and retail sector was not nearly as negative as for some of the other service sectors.
Finland
The same three sectors (arts, entertainment and recreation, accommodation and food service activities, and transportation and storage) were the most negatively impact in Finland as in Denmark, although with a different internal order in terms of the magnitude of the negative impact.
With data from Statistic Finland, we have been able to analyse the transport sector in more detail. The travel restrictions put in place had a severe impact on the Finnish transport sector. The air transport sector experienced a drop in GVA of 132 percent, a drop in employment of 23 percent and in hours worked of 48 percent. The water transport sector decreased 41 percent measured in GVA, 13 percent measured in employment and 31 percent measured in hours worked.
For the Finnish arts, entertainment and recreation sector, the cultural activities and gambling sector had the largest negative impact. GVA decreased by 17 percent, employment by 9 percent and hours worked by 12 percent. Regarding the employment and hours worked variables, the gambling and betting sector experienced the sharpest decline (22 percent and 31 percent, respectively), while the cultural sector saw a milder, yet substantial, decrease of 7 percent and 9 percent, respectively. A similar breakdown in terms of GVA is not available.
Furthermore, the travel agency, tour operator and other reservation service and related activities, experienced a decrease in GVA of 50 percent, in employment of 17 percent and hours worked of 28 percent. As with the transport sector, it is not surprising that the travel restrictions had a negative impact on this sector.
It is also worth noting that the manufacturing of motor vehicles, trailers and semi-trailers sector saw a decrease in GVA of 17 percent, compared to an average annual growth in 2017–2019 of 15 percent. However, the annual growth in the sector was much higher in 2017 and 2018 (21 percent and 23 percent, respectively), while in 2019 the growth was much lower at 1 percent. During 2020, employment in the sector decreased by 6 percent and hours worked by 11 percent.
Lastly, GVA in the Finnish wholesale and retail sector grew by 3.2 percent during 2020 compared to 2019, which was higher than the average annual growth during 2017–2019 (2.1 percent). However, both employment and hours worked decreased in the Finnish wholesale and retail sector by 4–5 percent, respectively, during 2020.
Iceland
Unlike in Denmark and Finland, the administrative and support service activities sector was among the three most negatively impacted sectors, along with accommodation and food services and transportation and storage.
In the administrative and support service activities sector, the sub-sector for travel agencies and tour operators[1]Travel agency, tour operator and other reservation services and related activities sector was the most negatively affected, with GVA decreasing by 76 percent (compared to an average annual growth of 6.2 percent in 2017–2019). Employment in the sector decreased by 54 percent and hours worked by 62 percent. The sub-sector employment activities experienced a decrease in GVA of 46 percent (although, in 2019 GVA decreased by 29 percent) and the rental and leasing sector experienced a decrease of 26 percent.
There is no further breakdown of the impact in the accommodation and food service sector, but there is a breakdown of the transport sector available. As in Finland, the GVA decreased the most in the air transport sector, by 62 percent, employment decreased by 30 percent and hours worked by 32 percent. Thus, the decrease in employment and hours worked are very similar, suggesting that furloughing was not used extensively in the Icelandic air transport sector. The water transport sector decreased its GVA by 20 percent, but there is no detailed breakdown of employment or hours worked available.
GVA in the Icelandic wholesale and retail trade sector decreased by 3.6 percent during 2020 compared to an average annual growth of 2 percent during 2017–2019. Employment and hours worked decreased by 4 percent and 8 percent, respectively.
Footnotes
- ^ Travel agency, tour operator and other reservation services and related activities
Norway
to Iceland, the administrative and support service activities sector was among the three most negatively impacted sectors, along with accommodation and food services and arts, entertainment and recreation.
The negative impact on GVA in the accommodation and food service sector was somewhat milder in Norway (-30 percent) than in Denmark, Finland, and Iceland (between 34 percent and 51 percent), and it was substantially milder in terms of the employment impact than in Finland and Iceland (but more negative than in Denmark). There is no further breakdown of the specific sub-sectors that were most negatively impacted in Norway beyond what is listed above.
It is worth noting that the sea transport sector in Norway experienced a decrease in GVA of 5 percent, while employment and hours worked decreased by 7 percent and 9 percent, respectively. Data for the air transport sector is not explicitly reported, but the sector “Transport activities excluding ocean transport” experienced a decrease in GVA of 17 percent (employment and hours worked decreased less, 4 percent and 6 percent, respectively).
In Norway, the printing and reproduction of recorded media, such as printing of books and newspapers, experienced a decrease in GVA of 18 percent during 2020, after three years of an average annual growth of 3.8 percent. Employment in the sector decreased by 11 percent and hours worked decreased by 14 percent.
GVA in the Norwegian wholesale and retail sector grew by 0.1 percent during 2020 – however, this was lower than the average annual growth during 2017–2019, which was 2.5 percent. Employment in the sector decreased by 1.5 percent and total hours worked decreased by 2.4 percent.
Sweden
As in the other Nordic countries, the accommodation and food service and transportation and storage sectors were among the most negatively impacted sectors during 2020. However, unlike the other Nordic countries, manufacturing was also among the hardest hit sectors.
As previously discussed, it is not surprising that the various restrictions that were imposed had a negative impact on the accommodation and food service sector. In Sweden, as in Norway, the negative impact on the sector was somewhat milder than in the other three Nordic countries, in terms of GVA (-29 percent). However, employment decreased more in Sweden than in Norway (-15 percent in Sweden, -11 percent in Norway), while hours worked decreased less in Sweden than in Norway (-19 percent and -21 percent).
However, unlike in the other Nordic countries, two manufacturing sectors were among the hardest hit sectors in Sweden. GVA in the manufacturing of motor vehicles, trailers and semi-trailers sector decreased by 18 percent in 2020 (in 2017–2019, the average annual GVA growth was 1.5 percent), and in the manufacturing of other transport equipment sector by 14 percent (0.3 percent average annual growth in 2017–2019). In the vehicle sector, employment decreased by 5 percent and hours worked by 12 percent, while in the other transport sector employment remained unchanged and hours worked decreased by 3 percent. Thus, while GVA dropped significantly in these sectors, it appears that the effects on employment were somewhat mitigated (as previously mentioned, furloughing was used for around 60,000 workers in the sector). Unlike in the accommodation, transport, and cultural sectors, the primary reasons for the negative development for 2020 in these sectors were input shortages (e.g. from China) and weakened global demand, rather than local restrictions (although the material shortages and weakened demand were also to a large extent related to the pandemic).[1]See, for example (Teknikföretagen, 2021)
Similarly, the manufacturing of machinery and equipment sector experienced a decrease in GVA of 12 percent during 2020, following three years of average annual growth of 4 percent. Employment decreased by 3 percent, but hours worked decreased by 12 percent. Here, too, it was rather related to material shortages and weaker demand, rather than local restrictions.
One can also note that the Swedish transport sector experienced a decrease in GVA of 14 percent during 2020, in employment of 5 percent and in hours worked of 8 percent. A further breakdown of sectors is not available, but it is reasonable to expect that it was primarily the air transport sector that experienced the largest decrease, as in the other Nordic countries where more detailed data is available.
Lastly, GVA in the Swedish wholesale and retail sector decreased by 2.4 percent during 2020, compared to an average annual growth of 1.5 percent during 2017–2019. Employment in the sector increased by 0.3 percent (average annual growth during 2017–2019 was 1 percent), and total hours worked decreased by 2 percent.
Footnotes
- ^ See, for example (Teknikföretagen, 2021)
Appendix D - Contribution to total CO2 emissions by sector
The figure below presents the relative distribution of GHG emissions per sector in each country, measured as GHG emissions per sector as share of total GHG emissions, excluding GHG emissions from households.
Figure D.1. Share of total emissions of greenhouse gases from economic activity, CO2 equivalents, by sector and country, 2018.
Source: Eurostat, Air emissions accounts by NACE Rev. 2 activity
A: Agriculture, forestry and fishing
B: Mining and quarrying
C: Manufacturing
D: Electricity, gas, steam and air conditioning supply
E: Water supply; sewerage, waste management and remediation activities
F: Construction
G: Wholesale and retail trade; repair of motor vehicles and motorcycles
H: Transportation and storage
I–U: All other sectors, such as information and communication, finance and insurance, professional services, arts and entertainment, etc.
Denmark
More than half (56 percent) of total Danish GHG emissions emanate from the transport sector. 90 percent of those emissions originate from international transport by Danish ships, airplanes, and vehicles (e.g., international shipping with Danish flagged ships). A more detailed breakdown shows that the water transport sector represents 48 percent of total Danish emissions (i.e., 85 per cent of the emissions from the transport sector), while the air transport sector represents 5 percent, and the land transport sector represents 4 percent. Thus, the fact that Danish GHG emissions are the highest in the Nordics is primarily due to the emissions from international water transport by Danish ships.
The second largest source sector of Danish GHG emissions is agriculture, forestry, and fishing sector. The total GHG emissions from the sector represent 15.3 percent of total Danish GHG emissions; 14.7 percent are emitted from the sub-sector Crop and animal production, hunting and related service activities, while the remaining 0.6 percent are emitted from the forestry and logging, and fishing and aquaculture sub-sectors.
The third largest source sector of Danish GHG emissions is the Electricity, gas, steam and air conditioning supply sectors. However, no further breakdown of emissions of sub-sectors is available at Eurostat, but data from Statistics Denmark show that 80 percent of the sector’s emissions come from electricity supply.[1]Danmarks Statistik, Drivhusgasregnskab (i CO2-ækvivalenter) efter emissionstype, branche og tid.
Together with the manufacturing sector (7 percent of total Danish GHG emissions), these three sectors represent 89 percent of total Danish GHG emissions.
Footnotes
- ^ Danmarks Statistik, Drivhusgasregnskab (i CO2-ækvivalenter) efter emissionstype, branche og tid.
Finland
Almost one third, 31 percent, of total Finnish GHG emissions are emitted from the electricity, gas, steam and air conditioning supply sectors.
The second largest source of Finnish GHG emissions is the manufacturing sector, emitting 22 percent of total Finnish GHG emissions. Several manufacturing sub-sectors have a relatively large share of total GHG emissions. The largest sub-sector in terms of GHG emissions, is the manufacturing of basic metals sector, which emits 7 percent of Finland’s GHGs. The sector includes inter alia the manufacturing and casting of iron, steel, aluminium, and other metals, both basic production as well as finished or semi-finished products. The manufacturing of paper and paper products sector emits 5 percent of total Finnish GHG emissions, and the manufacturing of coke and refined petroleum products sector emits 4 percent of total Finnish GHG emissions (including inter alia petroleum refineries).
The transport sector is the third largest source of Finnish GHG emissions, emitting 19 percent of Finland’s GHG emissions. The largest sub-sector is land transport and transport via pipelines, with 8 percent of total Finnish GHG emissions. The sector includes both passenger and freight transport by trains, trucks, buses, taxi, tramways, etc. 7 percent of total Finnish GHG emissions come from the air transport sector.
Together with the agriculture, forestry, and fishing sector (15 percent of total Finnish GHG emissions), these three sectors represent 88 percent of total Finnish GHG emissions.
Iceland
As in Denmark, the transport sector is (by far) the largest source sector of GHG emissions in Iceland (44 percent of total Icelandic GHG emissions). However, unlike in Denmark, the air transport sector represents the bulk of the emissions, 35 percent of total GHG emissions in Iceland, while the water transport sector emits 8 percent of Iceland’s total GHG emissions.
The second largest source sector of Icelandic GHG emissions is the manufacturing sector, with 29 percent of total GHG emissions in Iceland. As in Finland, the manufacturing of basic metals sector is the largest source of GHG emissions in Iceland; this mostly comes from the production of aluminium. However, unlike in Finland, the GHG emissions from this sub-sector is almost exclusively the source of manufacturing emissions in Iceland: 27 percent of total Icelandic GHG emissions are emitted from this sector.
The third largest source sector of GHG emissions in Iceland is the agriculture, forestry and fishing sector, representing 16 percent of total Icelandic GHG emissions. 9 percent of the emissions come from Crop and animal production, hunting and related service activities, and 7 percent of the emissions come from Fishing and aquaculture.
Together, these three sectors represent 88 percent of total Icelandic GHG emissions.
Norway
As in Denmark and Iceland, the transport sector is the largest source sector of GHG emissions in Norway, with 41 percent of total Norwegian GHG emissions. In Norway, the water transport sub-sector is the largest source, with 31 percent of total Norwegian GHG emissions, while the air transport sub-sector represents 5 percent of total GHG emissions.
Unlike in the other Nordic countries, the second largest source sector of GHG emissions in Norway is mining and quarrying, representing 23 percent of total Norwegian GHG emissions.[1]Statistics Norway, 09288: Greenhouse gases from Norwegian economic activity, by industry, contents, and year.
The third largest source sector in Norway is the manufacturing sector, with 18 percent of total Norwegian GHG emissions. The largest source sub-sector is the manufacturing of coke and refined petroleum products sector, with 8 percent of total Norwegian GHG emissions. As previously described, this sector includes inter alia petroleum refineries. The manufacturing of basic metals sector[2]As previously described, the sector includes inter alia the manufacturing and casting of iron, steel, aluminium, and other metals, both basic production as well as finished or semi-finished products. emits 6 percent of Norway’s total GHG emissions.
Together with the agriculture, forestry and fishing sector (8 percent of total Norwegian GHG emissions), these three sectors represent 89 percent of total Norwegian GHG emissions.
Footnotes
- ^ Statistics Norway, 09288: Greenhouse gases from Norwegian economic activity, by industry, contents, and year.
- ^ As previously described, the sector includes inter alia the manufacturing and casting of iron, steel, aluminium, and other metals, both basic production as well as finished or semi-finished products.
Sweden
Sweden is the only Nordic country where the manufacturing sector represents the largest share of total GHG emissions, with 31 percent of total emissions emanating from manufacturing activities. The largest sub-sector in terms of GHG emissions is the manufacturing of basic metals sector[1]As previously described, the sector includes inter alia the manufacturing and casting of iron, steel, aluminium, and other metals, both basic production as well as finished or semi-finished products., accounting for 9 percent of Sweden’s total GHG emissions. The second largest sub-sector in terms of GHG emissions is the manufacturing of other non-metallic mineral products sector, with 7 percent of total Swedish GHG emissions. The sector includes cement production and other types of manufacturing related to a single substance of mineral origin. The manufacturing of coke and refined petroleum products sector accounts for 6 percent of total Swedish GHG emissions.
The second largest emitting sector in Sweden is the transport sector, with 20 percent of total Swedish GHG emissions. Air transport generates 8 percent of Swedish GHG emissions, water transport accounts for 7 percent, while 4 percent comes from land transport.
The third largest sector in terms of GHG emissions in Sweden is the agriculture, forestry and fishing sector, with 18 percent of total emissions. The sector’s total emissions are dominated by emissions from Crop and animal production, hunting and related service activities, emitting 16 percent of Sweden’s total GHG emissions.
Together with the electricity, gas, steam and air conditioning supply sectors (14 percent of total Swedish GHG emissions), these three sectors represent 83 percent of total Swedish GHG emissions. Thus, the top four emitting sectors represent a somewhat lower share of total GHG emissions in Sweden, than they do in the other Nordic countries. In other words, the data suggests that GHG emissions are somewhat more evenly distributed across sectors in Sweden.
Footnotes
- ^ As previously described, the sector includes inter alia the manufacturing and casting of iron, steel, aluminium, and other metals, both basic production as well as finished or semi-finished products.
Appendix E – Emission intensive sectors
Three sectors stand out by being more than twice (i.e., more than 100 percent) as emission intensive than the national average, in all Nordic countries:
- Agriculture, forestry and fishing
- In Sweden and Denmark, the emission intensity is approximately 1,000 percent higher in this sector than the national average, while it is almost 300 percent higher in Iceland and Norway. In Finland, the emission intensity is almost 500 percent higher than the national average.
- In all Nordic countries, except for Norway, the emission intensity is more than 1,000 grams of GHG emissions per euro of GVA – in Denmark, it is more than 3,000 grams per euro of GVA.
- In all Nordic countries, the by far highest emission intensity is found in the sub-sector Crop and animal production, hunting and related service activities (NACE rev. 2 A01). In Sweden and Finland, the emission intensity is more than 2,000 percent higher than the national average, in Denmark and Norway it is 1,100 percent higher, and in Iceland more than 900 percent higher.
- The emission intensity of the sub-sector Forestry and logging (NACE rev. 2 A02) is lower than the national average in all Nordic countries, except in Sweden where it is 120 percent higher.
- Transportation and storage
- In Denmark, the emission intensity of the transport sector is more than 900 percent higher than the national average, and in Norway it is more than 700 percent higher. In Finland and Sweden, it is approximately 300 percent higher, and in Iceland almost 550 percent higher.
- In Denmark, the transport sector emits over 3,000 grams of GHG per euro of GVA, and in Iceland it emits over 2,000 grams per euro of GVA. In Sweden, the sector emits over 400 grams, in Finland over 1,100 grams, and in Norway almost 1,800 grams, per euro of GVA.
- In Denmark and Norway, the water transport sub-sector (NACE rev. 2 H50) has the highest emission intensity (2,700 percent higher than the national average in Denmark, 2,000 percent higher in Norway). In Sweden, the air transport sub-sector (NACE rev. 2 H51) has the highest emission intensity (4,100 percent higher than the national average) - however, the Swedish water transport sector’s emission intensity is 3,400 percent higher than the national average (i.e. a higher relative emission intensity than in Denmark and Norway). In Finland, the emission intensity is almost 1,500 percent higher than the national average for both the water and the air transport sub-sectors. Data is missing for the water transport sector in Iceland, but the Icelandic air transport sector has an emission intensity of just above 1,300 percent higher than the national average.
- In fact, the emission intensity for the air transport sector is similar in all Nordic countries, ranging from 3,862 grams per euro of GVA in Norway to 4,961 grams per euro of GVA in Iceland. For water transport, the emission intensity is approximately 4,000–4,500 grams per euro of GVA in Finland, Norway and Sweden, but more than twice as high in Denmark with 8,700 grams per euro of GVA (again, no data available for Iceland).
- For land transport, the emission intensity is approximately 180 grams per euro of GVA in Iceland and Sweden, 330 grams in Norway, 635 grams in Denmark and 849 grams in Finland.
- Water supply, sewerage, waste management and remediation activities
- The emission intensity in this sector is approximately 300–400 percent higher than the national average in all Nordic countries.
- The sub-sectors with the highest emission intensity are sewerage, waste management, and remediation activities (NACE rev. 2 E37-E39, no further breakdown available at Eurostat), with approximately 400–550 percent higher emission intensity than the national average, in all Nordic countries.
For three other sectors, there are at least two Nordic countries where the sectors’ emission intensities are more than twice as high as the national average:
- Mining and quarrying
- In Sweden, the mining and quarrying sector has an emission intensity that is almost 300 percent higher than the national average, and in Denmark the emission intensity almost exactly 100 percent higher. In Finland, the emission intensity is 74 percent higher and in Norway it is 36 percent higher, while in Iceland, it is actually 82 percent lower than the national average.
- There is no further breakdown available regarding the mining and quarrying sector’s emission intensities. However, data from Statistics Norway show that the emission intensity of Norwegian “oil and gas extraction, including service activities and transport via pipelines” is 98 percent higher than the national average emission intensity.
- Manufacturing
- The emission intensity of the manufacturing sector is almost 200 percent higher than the national average in Iceland, 150 percent higher in Norway and 100 percent higher in Sweden. In Finland, it is “only” 29 percent higher, and in Denmark it is 49 percent lower than the national average emission intensity. There are four sub-sectors that stand out with relatively high emission intensities.
- In Sweden, Iceland, and Norway, the emission intensities of manufacturing of basic metals (NACE rev. 2 C24) are approximately 1,200–1,300 percent higher than the national averages, while in Finland it is approximately 600 percent higher. In absolute terms, the emission intensity is particularly high in Iceland, with more than 4,750 grams of GHG emissions per euro of GVA (in Norway it is 2,780 grams, in Sweden and Finland approximately 1,700 grams, respectively). The sector’s emission intensity in Denmark is 10 percent lower than the national average.
- The emission intensity of the manufacturing of coke and refined petroleum products sector (NACE rev. 2 C19) is 2,400 percent higher in Sweden than the national average, and around 750 percent higher than the national average in Denmark and Finland. The emission intensity for this sector is not available for Norway (due to confidentiality of the sector’s GVA), but data from Statistics Norway shows that the emission intensity of the aggregated sector “Refined petroleum products, chemicals and chemical products, pharmaceutical products” is 250 percent higher than the national average. In Denmark, Finland and Sweden, the sector emits approximately 2,300–2,800 grams of GHGs per euro of GVA.
- In Sweden, the emission intensity of the manufacturing of other non-metallic mineral products (NACE rev. 2 C23), such as cement production, is 1,600 percent higher than the national average emission intensity. In Finland, Denmark and Norway, it is between 400–700 percent higher. In Iceland, however, it is 72 percent lower than the national average. In Norway, Sweden and Denmark, the sector emits approximately 1,700–2,100 grams of GHGs per euro of GVA, and approximately 1,400 grams per euro in Finland.
- The Finnish, Norwegian and Swedish manufacturing of paper and paper products sectors (NACE rev. 2 C17) have emission intensities that are approximately 100–200 percent higher than the national average. In absolute terms, the Norwegian and Finnish sectors emit approximately 600–800 grams of GHGs per euro of GVA, while the corresponding emission intensity in Sweden is approximately 270 grams. In Denmark, the sector has an emission intensity that is 50 percent lower than the national average.
- Except for the Finnish manufacturing of chemicals and chemical products (NACE rev. 2 C20, emission intensity 152 percent higher than the national average – however, no data available for this sector in Sweden, Iceland and Norway), Swedish manufacturing of food products, beverages and tobacco products sectors (NACE rev. 2 C10-C12, emission intensity 30 percent higher than the national average) and the Icelandic manufacturing of furniture and other products sectors (NACE rev. 2 C31-C32, 11 percent higher emission intensity than the national average), all other manufacturing sectors in all Nordic countries have emission intensities that are lower than the national averages.
- Electricity, gas, steam and air conditioning supply
- The sector includes the operation of electric and gas utilities, which generate, control and distribute electric power or gas, as well as steam and air conditioning.
- In Finland, the emission intensity of the sector is more than 1,300 percent higher than the national average, while in Denmark it is almost 700 percent higher and in Sweden more than 500 percent higher. In Norway, the emission intensity is “only” 23 percent higher than the national average, and in Iceland it is 37 percent lower than the national average.
- However, there is no further breakdown of emission intensities by sub-sectors available either via Eurostat or the national statistical offices.
Appendix F – Method for analysing effect on climate and environment
As described in Appendix E, the Nordic countries have implemented a wide array of financial stimulus measures. To ease analysis, we have recorded information on the Nordic financial instruments in an Excel-tool. For each instrument we enter instrument’s name, a short description of the instrument, the country where it is implemented and total amount in Euros in 2021-prices.
Below we describe in more detail how we have assessed the impact on climate and environment from the Nordic stimulus measures. This is based on the three steps described in section 5.1:
- Step 1: Identify which economic sector(s) the measure targets
- Step 2: Evaluate the impact of the measures on the climate
- Step 3: Evaluate the impact of the measures on the environment
Step 1: Identify the economics sectors targeted by financial stimulus measures
All financial stimulus measures identified are sorted according to which sector(s) they are assumed to target, i.e., the sector that receives funds or stimulus according to national budget proposals. Sectors are recorded according to Eurostat’s division of economics sectors (NACE Rev. 2 A10), see Appendix A.
Based on our qualitative assessments, we find that the Covid-19 financial instruments target the sectors listed in Table F.1.
| NACE Rev. 2 Economic sector | |
| A | Agriculture, Forestry and Fishing |
| B | Mining and Quarrying |
| C | Manufacturing |
| D | Electricity, Gas, Steam and Air Conditioning Supply |
| E | Water Supply; Sewerage, Waste Management and Remediation Activities |
| F | Construction |
| G | Wholesale and Retail Trade; Repair of Motor Vehicles and Motorcycles |
| H | Transportation and Storage |
| I | Accommodation and Food Service Activities |
| M | Professional, Scientific and Technical Activities |
| N | Administrative and Support Service Activities |
| O | Public Administration and Defence; Compulsory Social Security |
| P | Education |
| R | Arts, Entertainment and Recreation |
Table F.1. Economic sectors in Nordic countries that are stimulated using Covid-19 financial instruments
Step 2: Analyse impact of Nordic financial stimulus measures on the climate
In Step 2 we categorize the instruments according to expected impact on the climate.
Firstly, we sort instruments according to whether they may be relevant for climate, using the following categories:
- Yes
- No
Instruments that target sectors where stimulus is expected to have negligible impacts on the climate (emissions) are categorized as “No”. This assessment is based on the qualitative assessments in section 4.2. In some cases, the funds are first channelled to sectors that are not deemed relevant for climate, e.g., have low emission intensity and/or emissions, yet the funds are expected to impact emissions in emission-intensive sectors in the long-term. This holds for the following types of funds:
- Research funds with a climate profile. Research funds generally target institutions in the sector “M - Professional, Scientific and Technical Activities”, yet is expected to induce activity in other sectors, such as the industry, in the long-term. Funds that are marked as relevant to the climate in the state budgets is categorized as relevant for climate
- Funds to public administration or organizations with a climate profile: Funds to activities that increase knowledge on emission-reducing measures, etc.
These funds are categorized as “Yes”. Further, instruments that target sectors where stimulus is expected to impact the climate (emissions) are categorized as “Yes”.
Following this approach, we find that instruments targeting sectors shown in Table F.2 may impact the climate.
| NACE Rev. 2 Economic sector | |
| A | Agriculture, Forestry and Fishing |
| B | Mining and Quarrying |
| C | Manufacturing |
| D | Electricity, Gas, Steam and Air Conditioning Supply |
| E | Water Supply; Sewerage, Waste Management and Remediation Activities |
| F | Construction |
| G | Wholesale and Retail Trade; Repair of Motor Vehicles and Motorcycles |
| H | Transportation and Storage |
| M | Professional, Scientific and Technical Activities |
| O | Public Administration and Defence; Compulsory Social Security |
| R | Arts, Entertainment and Recreation |
Table F.2. Economic sectors that received financial stimulus in 2020–2021 that may impact climate
Secondly, we assess the direction of the climate impact, which we have separated into three categories:
- Positive
- Negative
- Uncertain
The direction of the climate impact is qualitatively assessed as follows:
- Emission intensity of the receiving sector: If stimulus is directed to sectors with high (low) emission intensity per euro, compared with the average economy, this is considered to increase (decrease) emissions.
- Substitution to alternatives with lower emissions: If stimulus leads to substitution to activities with higher (lower) emissions, we consider emissions to increase (decrease). Note that this applies also if the activity receiving stimulus is in a sector with high emission intensity (see principle i).
- Specifications regarding climate effects of the stimulus measures: Stimulus measures aimed specifically to reduce emissions either short- or long-term, are considered to reduce emissions. Note that this applies even if the activity is in a high emission intensity sector, or if no sector can be specified.
In some cases, the budget does not provide sufficient information for us to consider the direction of the impact on climate. The climate impact of these instruments is categorized as “Uncertain”.
Step 3: Analyse impact of Nordic financial stimulus measures on the environment
In Step 2 we categorize the instruments according to expected impact on the environment.
Firstly, sort instruments according to whether they may be relevant for climate, using the following categories:
- Yes
- No
Based on information on whether sectors are land- and or capital-intensive or affect local air pollution, from section 4.3, we sort out the sectors where stimulus is expected to have negligible impacts on the environment. Again, we also keep instruments that may impact the environment in the long term, through research funds or public administration (see Step 2). Additionally, sector R Arts, Entertainment and Recreation is kept as some nature conservation measures are categorized in this sector.
Instruments that target sectors where stimulus is expected to impact the environment are categorized as “Yes”. Instruments that are expected to target the environment in the long-run, are categorized as “Yes”.
This leaves us with instruments that target the sectors shown in the table below.
| NACE Rev. 2 Economic sector | |
| A | Agriculture, Forestry And Fishing |
| B | Mining And Quarrying |
| C | Manufacturing |
| D | Electricity, Gas, Steam And Air Conditioning Supply |
| E | Water Supply; Sewerage, Waste Management And Remediation Activities |
| F | Construction |
| G | Wholesale And Retail Trade; Repair Of Motor Vehicles And Motorcycles |
| H | Transportation And Storage |
| I | Accommodation And Food Service Activities |
| M | Professional, Scientific and Technical Activities |
| O | Public Administration and Defence; Compulsory Social Security |
| R | Arts, Entertainment and Recreation |
Table F.3. Sectors that may impact the environment
Secondly, we categorize based on type of environmental effect expected. The type of environmental effects primarily considered are land use, water use, waste, pollution, and biodiversity.
Thirdly, we assess the direction of the climate impact, which we have separated into three categories:
- Positive
- Negative
- Uncertain
The direction of the environmental impact is qualitatively assessed as follows:
- Substitution to alternatives with less environmental impact: If stimulus leads to substitution to activities with more (less) environmental impact, we consider the environment to be worse (better) off.
- Specifications regarding environmental effects of the stimulus measures: Stimulus measures aimed specifically to make the environment better off either short- or long-term, are considered to have a positive effect on the environment. Note that this applies even if no sector can be specified.
In some cases, the budget does not provide sufficient information for us to consider the direction of the impact on the environment. The climate impact of these instruments is categorized as “Uncertain”.
Appendix G – Environmental effect of Covid-19 stimulus per country
Figure G.1. Covid-19 stimulus measures by impact on environment in Denmark, mill. euro. Measures with no environmental impact have been excluded.
Figure G.2. Covid-19 stimulus measures by impact on environment in Finland, mill. euro. Measures with no environmental impact have been excluded.
Figure G.3. Covid-19 stimulus measures by impact on environment in Iceland, mill. euro. Measures with no environmental impact have been excluded.
Figure G.4. Covid-19 stimulus measures by impact on environment in Norway, mill. euro. Measures with no environmental impact have been excluded.
Figure G.5. Covid-19 stimulus measures by impact on environment in Sweden, mill. euro. Measures with no environmental impact have been excluded.
About this publication
COVID-19 POLICY RESPONSES AND GREEN RECOVERY IN THE NORDIC REGION
Friðrik Már Baldursson, Annegrete Bruvoll, Erik Dahlberg, Erika Karttinen og Nina Bruvik Westberg
ISBN 978-92-893-7317-3 (PDF)
ISBN 978-92-893-7318-0 (ONLINE)
http://dx.doi.org/10.6027/temanord2022-527
TemaNord 2022:527
ISSN 0908-6692
© Nordic Council of Ministers 2022
Cover photo: South_agency / Unsplash
Published: 20/5/2022
Disclaimer
This publication was funded by the Nordic Council of Ministers. However, the content does not necessarily reflect the Nordic Council of Ministers’ views, opinions, attitudes or recommendations.
Rights and permissions
This work is made available under the Creative Commons Attribution 4.0 International license (CC BY 4.0) https://creativecommons.org/licenses/by/4.0.
Translations: If you translate this work, please include the following disclaimer: This translation was not produced by the Nordic Council of Ministers and should not be construed as official. The Nordic Council of Ministers cannot be held responsible for the translation or any errors in it.
Adaptations: If you adapt this work, please include the following disclaimer along with the attribution: This is an adaptation of an original work by the Nordic Council of Ministers. Responsibility for the views and opinions expressed in the adaptation rests solely with its author(s). The views and opinions in this adaptation have not been approved by the Nordic Council of Ministers.
Third-party content: The Nordic Council of Ministers does not necessarily own every single part of this work. The Nordic Council of Ministers cannot, therefore, guarantee that the reuse of third-party content does not infringe the copyright of the third party. If you wish to reuse any third-party content, you bear the risks associated with any such rights violations. You are responsible for determining whether there is a need to obtain permission for the use of third-party content, and if so, for obtaining the relevant permission from the copyright holder. Examples of third-party content may include, but are not limited to, tables, figures or images.
Photo rights (further permission required for reuse):
Any queries regarding rights and licences should be addressed to:
Nordic Council of Ministers/Publication Unit
Ved Stranden 18
DK-1061 Copenhagen
Denmark
pub@norden.org
Nordic co-operation
Nordic co-operation is one of the world’s most extensive forms of regional collaboration, involving Denmark, Finland, Iceland, Norway, Sweden, and the Faroe Islands, Greenland and Åland.
Nordic co-operation has firm traditions in politics, economics and culture and plays an important role in European and international forums. The Nordic community strives for a strong Nordic Region in a strong Europe.
Nordic co-operation promotes regional interests and values in a global world. The values shared by the Nordic countries help make the region one of the most innovative and competitive in the world.
The Nordic Council of Ministers
Nordens Hus
Ved Stranden 18
DK-1061 Copenhagen
pub@norden.org
Read more Nordic publications on www.norden.org/publications