
- Frontpage
- Table of contents
- Executive summary
- Preface
- Terms and abbreviations
- 1 Introduction
- 1.1 Background to the study
- 1.1 Background to the study
- 1.2 Focus and aim of the study
- 1.3 Methodology
- 1.4 Structure of the report (“guidance for the reader”)
- 1.5 Challenges and observations
- 2 Adaptation needs of the T/Dp for ashes for the assessment of aquatic toxicity
- 2.1 Introduction
- 2.2 T/Dp principle
- 2.3 Adaptation needs for ashes due to ash characteristics
- 2.4 Identification of critical test conditions
- 3 Hazard classification of ecotoxic properties according to the CLP
- 3.1 Ecotoxicological reference values, ERV
- 3.2 Assessment scheme according to the CLP
- 3.3 Bridging principle
- 4 Results from the evaluation of critical test conditions in the T/Dp
- 4.1 Grain size
- 4.2 Management of pH during test
- 4.3 Decisions for final test conditions for 28 days
- 4.4 Extrapolation of concentrations to load 1 mg/L from load 100 mg/L
- 5 Testing of MIBA with the adapted method: assessment of the applicability
- 5.1 Aim
- 5.2 Test programme, materials and used methods
- 5.3 Discussion of results
- 6 Conclusions and suggestions for further studies
- 6.1 General issues
- 6.2 Proposed adapted T/Dp test method
- 6.3 Assessment approaches
- 6.4 Lessons learned during testing
- 6.5 Next steps
- APPENDIX 1: Chemical composition of ash samples (replicate analysis)
- APPENDIX 2: Supplement information: pH management systems with continuous CO2 flow according to Annex 10 (OECD description)
- APPENDIX 3 Results from nine ashes tested with the adapted method with the load 100 mg/L
- APPENDIX 4: Adapted T/Dp – method description
- About this publication
MENU
Executive summary
Background
Hazardous waste classification significantly influences the entire management and recycling chain of waste. Numerous EU regulations set special requirements for waste defined as hazardous waste. The classification of waste as hazardous may in the future create conflicts with targets for resource efficiency (including the Circular Economy) as the handling of hazardous waste is more restricted and complex than for non-hazardous waste.
The classification of waste as non-hazardous or hazardous is regulated by the Waste Framework Directive (WFD) and the classification is primarily based on the European List of Waste (2014/955/EU). In some cases, a particular type of waste on the list can be either hazardous or non-hazardous depending on the specific properties of the waste, and in these cases the correct classification has to be assessed based on their hazardous properties. If the waste is to be assessed based on its properties, all 15 hazardous properties (HP) must be evaluated, and additionally some specific substance limit values must be analyzed.
Both EU and Nordic guidance documents on hazardous waste classification have been compiled. However, in the hazardous waste classification, especially on how to assess hazard property "Ecotoxic" (HP14), there is a lack of clear guidance on how to perform the testing. As the waste classification is being aligned with the Chemicals regulation (CLP regulation), an option is to use the testing method called Transformation/dissolution protocol (T/Dp), which is referred to in the ECHA´s guidance document for the regulation on classification, labelling and packaging for determination of the aquatic hazard class. Here it is assumed that the bottom ashes do not contain any other hazardous substances than metals that can render them hazardous for the ecotoxic properties.
Both in Sweden and Finland, projects have previously been conducted on the use of the T/D protocol for assessing the HP14 property. Based on the experience gained from earlier studies, this study focuses on specific open questions in testing and interpretation of results.
The project was initiated by Avfall Sverige and co-financed by 12 stakeholders. Furthermore, representatives of authorities participated in the steering group meetings. A workshop was arranged and also consultation of the final report was undertaken with funding from the Nordic Working Group for Chemicals, Environment and Health (NKE) under the Nordic Council of Ministers. Within the duration of the project, several experts (authority representatives, test providers, scientists, and consultants) were contacted for correct understanding of the test method and the assessment of the test results.
Principles and challenges in using the T/Dp for waste ashes
In the assessment, the released metal concentration from the T/Dp conducted with a load of 1 mg/L and with 28 days’ test duration are compared to chronic ecotoxicological reference values (ERV) representing no or a low effect on aquatic organisms. All harmful metals in the ashes need to be considered. First, for each metal the ratio (called Toxic unit value) between the measured concentrations from the T/Dp and the respective chronic ERV is calculated, and after this the individual TU values are summed up to a TU index for indication of the additive effects from several metals. If the TU index exceeds 1, the material tested is considered to exhibit the HP14 aquatic ecotoxic property (i.e. the ash is classified as hazardous for the HP14 property). If the sum of the TU values is <1, the ash is considered non-hazardous with respect to HP14 aquatic ecotoxic properties.
The main challenge is the difficulty to conduct a test at a load of 1 mg/L due to the heterogeneity of ashes. First, the milling of the ashes to a fine powder to enable testing would change the ash characteristics. Secondly, it is not possible to mill a sample to fine powder due to the uncrushable fraction in the ashes (the fine fraction alone is not representative of the total content because ash particles have different chemical composition). It was therefore decided to conduct the test with ash with a maximum particle size of below 1 mm at the load of 100 mg/L for 28 days.
The T/Dp operates with the use of buffer media (here pH 6 is used for ashes) and the use of a 0.5% CO2 gas to simulate conditions occurring in the environment and especially to maintain the pH of the test solution near pH 6. This is done either by a CO2 flow through the headspace of the test vessel or by a CO2 flow bubbling in the test solution; however, there is no need to force the pH value to 6 if the material has high buffering properties. An adapted test was developed for aged ashes in which, instead of continuous CO2 flow, a pre-determined amount of CO2 gas was injected at certain time intervals into the headspace of the test vessel (corresponding to 0.5% CO2 in headspace) in order to lower the pH of the test solutions to approximately pH 6. The sufficiency of the CO2 additions was controlled through measurements of pH in blanks. In the adapted test, the control of the pH value in test solution was regarded as most critical for aged (carbonated) ashes, not the actual CO2 gas dissolved in the test solution (which actually is difficult to control and not specified in the T/Dp). For two ash samples, the pH values in test solutions were compared to a 7-day test performed with continuous CO2 flows. In the system with injections of CO2, similar pH values were obtained.
Also other test conditions were evaluated and specified in the adapted method.
The measured concentrations from the 28-day test with a load of 100 mg/L was extrapolated to the load 1 mg/L by dividing the concentration with the dilution factor of 100 and then multiplying with a safety factor as the release most likely is not linear. For setting a safety factor, published data from test results from the T/D protocol was analyzed and a safety factor of 5 was recommended to be used and later possibly modified if more data is available. When setting the safety factors, the total content in the ashes will indicate the upper limit (typically 5 for Zn and 10 for Cu).
Testing of Nordic ashes
In the study, 9 Nordic ash samples were studied for the 7-day test. For 3 samples, a full 28-day test was conducted for comparison of release at 7 days and 28 days. An important part of the testing was the preparation of the test portion (100 mg) for testing. Here the laboratory sample was split down to a subsample of 1 g using an automatic sample divider. In the test of metals present in ashes, only Cu and Zn and for a few ashes also Pb were of concern. The repeatability of the test for concentrations measured in test solutions was for Cu in the range 8–26% and for Zn in the range 7–26%.
The calculated toxic unit values for the extrapolated 28-day test were all below the value 1 using different safety factors of 5, 10 and 15 (meaning that the tested ash is not to be classified as hazardous waste for the HP14 property).
Also the indicative result from the 7-day test resulted in a value below 1 for the Nordic ashes studied.
Next steps
The adapted test method needs to be validated, e.g. by circulating the same sample to several laboratories, and if necessary, further specifications in test performance need to be set.
The adapted test method has been developed especially for aged ashes and cannot without further laboratory checks be used for other materials.
Preface
This document is a final draft report on the project entitled: “Adaptation of transformation/dissolution (T/D) protocol for the assessment of ecotoxic (HP14) testing of waste ashes – development of test method for classification: HP14-project” financed by Avfall Sverige, Swedish Askprogrammet, Finnish Environmental Pool and some Nordic stakeholders (Afatek, Avfall Norge, Fortum Waste Solutions Oy, KIVO, Renova AB, Stockholm Exergi, Suomen Erityisjäte Oy, Sysav, Tekniska Verken Linköping, Umeå Energi, Öresundskraft Helsingborg). The project was initiated in September 2020 and was finished in February 2022.
The main objective of the project was to develop a test method based on CLP principles for testing the ecotoxicity property of ashes for waste classification. An important part was also to gain experiences from the testing of potential methods for the assessment of ecotoxicity properties of certain wastes. Funding has also been received from the Nordic Working Group for Chemicals. Environment and Health (NKE) under the Nordic Council of Ministers for consultation and dissemination of the developed test method. A webinar where the project results were presented and discussed was arranged on January 19, 2022 with 100 registered participants.
The project work was overseen by a reference group consisting of the following members representing the financiers:
Kim Crillesen, Vestforbrænding, Denmark
Erik Dahlén, Stockholm Exergi, Sweden
Johan Fagerqvist, Avfall Sverige
Anders Friberg, Umeå Energi, Sweden
Raoul Grönholm, Sysav, Sweden
Øyvind Holm, Avfall Norge
Arto Iivonen, Suomen Erityisjäte Oy, Finland
Jens Kallesøe, Afatek, Denmark
Raziyeh Khodayari, Energiföretagen, Sweden
Anne Kulmala, Fortum Waste Solutions, Finland (also presenting Finnish Environmental Pool)
Kristina Lassing, Öresundskraft Helsingborg, Sweden
Karin Larsson, Tekniska Verken i Linköping, Sweden
Markus Lehtonen, Suomen Erityisjäte Oy, Finland
Camilla Nilsson, Avfall Sverige
Renja Rautiainen, HSY/KIVO, Finland
Annika Sormunen, Fortum Waste Solutions, Finland
Stig-Olov Taberman, Tekniska Verken i Linköping, Sweden
Additionally, an advisory expert group followed the work consisting of the members:
Ole Hjelmar, Danish Waste Solutions ApS
Eevaleena Häkkinen, Finnish Environment Institute
John Lotoft, Swedish Environmental Protection Agency
Patrick van Hees, Eurofins, Sweden
Eva Weidemann, Umeå University, Sweden
The project was coordinated by VTT Technical Research Centre of Finland Ltd. The project group consisted of the following persons:
Margareta Wahlström, VTT, Finland (project manager)
Charlotta Tiberg, Swedish Geological Institute
Karin Karlfeldt Fedje, Renova and Chalmers University of Technology
Tuomo Mäkelä, VTT, Finland
Johannes Kikuchi, Swedish Geological Institute
Amir Saeid Mohammadi, Chalmers University of Technology
The project group would especially like to acknowledge Tony Brouwers from ECTX bv for valuable advice and concrete support in the correct understanding of the T/D protocol. Additionally, the project team expresses their gratitude for all the numerous experts (authority representatives, consultants, and scientists) contacted during the project work who gave their time for constructive discussions and advice on the assessments of the test results from the T/D protocol.
March 2022
Authors
Terms and abbreviations
| Annex III | Annex III to Directive 2008/98/EC of the European Parliament and of the Council on waste and repealing certain Directives, as amended by Commission Regulation (EU) No 1357/2014 and Council Regulation (EU) 2017/997 |
| ASTM | American Society for Testing and Materials |
| C&L inventory | ECHA database containing classification and labelling information on notified and registered substances received from manufacturers and importers |
| CEN | European Committee for Standardization |
| CEWEP | Confederation of European Waste-to-Energy Plants |
| CLP | Regulation (EC) No 1272/2008 of the European Parliament and of the Council of 16 December 2008 on classification, labelling and packaging of substances and mixtures, amending and repealing Directives 67/548/EEC and 1999/45/EC, and amending Regulation (EC) No 1907/2006 (Classification, Labelling and Packaging regulation) |
| Cut-off value | Lowest concentration to be considered in the assessment |
| DM | Dry matter |
| DOC | Dissolved organic carbon |
| DSD | Dangerous Substances Directive (67/548/EEC) |
| ECHA | European Chemicals Agency |
| EN | European Norm |
| EC50 | The concentration expected to produce an effect (e.g. lethal) in 50% of the test organisms |
| ERV | Ecotoxicological reference values e.g. EC50 or NOEC for the free and dissolved metal ion |
| FINETOX | A Finnish study on the use of T/D protocol carried out during 2018–19 |
| Hazard statement | A phrase assigned to a hazard class and category that describes the nature of the hazards of a hazardous substance or mixture, including, where appropriate, the degree of hazard |
| Hazard property (HP) | Set of physical, health and environmental properties that render waste hazardous (HP) |
| LOI | Loss of ignition |
| LoW | European List of Waste (2014/955/EU: Commission Decision of 18 December 2014 amending Decision 2000/532/EC on the list of waste pursuant to Directive 2008/98/EC of the European Parliament and of the Council) |
| MIBA | Mineral fraction of bottom ash |
| MSWI | Municipal Solid Waste Incinerator |
| NOEC | No Observed Effect Concentration |
| OECD | Organisation for Economic Co-operation and Development |
| PNEC | Predicted no-effect concentration |
| REACH | Regulation (EC) No 1907/2006 - Registration, Evaluation, Authorisation and Restriction of Chemicals (REACH) |
| SD | Standard deviation |
| SI | Saturation Index |
| T/Dp | Transformation/Dissolution protocol |
| TU | Toxic unit |
| UN GHS | United Nation Globally Harmonized System of Classification and Labelling of Chemicals |
| WFD | Directive 2008/98/EC of the European parliament and of the council of 19 November 2008 on waste and repealing certain Directives (directive amended by EU 2018/851) |
1 Introduction
1.1 Background to the study
Hazardous waste classification significantly influences the entire management and recycling chain of waste. Numerous EU regulations set special requirements for waste defined as hazardous waste. Additional requirements may be set in the national legislations of the Member States. Examples of influence are legal procedures in waste handling (permit, taxation, inspections), requirements on waste storage, transportation, reuse/recycling and disposal of waste (e.g. landfilling), traceability from production to the final destination, and ban on the mixing of hazardous waste. The classification of waste as hazardous may in the future create conflicts with targets for resource efficiency (including the Circular Economy) as the handling of hazardous waste is more restricted and complex than for non-hazardous waste.
The classification of waste as non-hazardous or hazardous is regulated by the Waste Framework Directive (WFD). The criteria set in Annex III of the WFD, together with the List of Waste (LoW) (issued by Commission Decision 2014/955/EU), establish a harmonized classification system for wastes, including a list of hazardous and non-hazardous wastes. The waste list has three types of waste entries, specified with 6-digit codes: absolute hazardous entries, absolute non-hazardous entries and mirror entries (i.e. the same waste has both a hazardous and a non-hazardous entry). Waste material with a mirror entry is classified as either non-hazardous or hazardous depending on its hazardous properties and/or content of hazardous substances, typically assessed by testing. For waste with an absolute entry, no testing is needed. For ashes that have a mirror entry, especially the hazardous property for ecotoxicity (HP14) is challenging and a critical property for waste management.
Annex III of the WFD does not stipulate how the HP14 property for waste should be assessed by testing. Thus, different initiatives to develop assessment methods have been taken in Europe, including methods based on speciation of metals, biotests, calculation models, and leaching. There is a need for a harmonized approach for hazardous waste assessment and clear guidelines for how to apply test methods in Europe, but so far this work has not begun on the EU level.
In the Waste Framework Directive, links are given to the methods for classification of substances and mixtures in the CLP-regulation (EU, 2014; UN, 2011; OECD, 2001) or other internationally recognized test methods and guidelines. For testing of ecotoxic properties, the CLP refers to a test method described in the “Transformation-Dissolution protocol” (T/Dp) (UN GHS Annex 10 and 9[1]UN GHS (2019) Globally Harmonized System of Classification and Labelling of Chemicals, Annex 10 Guidance on Transformation/Dissolution of Metals and Metal Compounds in Aqueous Media (GHS, Rev.8, 2019) https://unece.org/fileadmin/DAM/trans/danger/publi/ghs/ghs_rev08/ST-SG-AC10-30-Rev8e.pdf). The T/Dp was developed for metals and metal compounds in aqueous media. It has also been used for more complex matrices as alloys and ores but not for ashes. Previous studies trying to apply the T/Dp for municipal solid waste incineration (MSWI) ashes (Finnish study FINETOX[2]Margareta Wahlström, Tommi Kaartinen, Suvi Jokinen, Jutta Laine-Ylijoki. 2019. Hazardous waste classification - Assessment of hazardous property “ecotoxic” with focus on ashes. Finnish Environmental Pool 2019, Avfall Sverige study (Hälldal et al 2019[3]Hälldal et al. 2019, Development of a test method for evaluation of ecotoxicity (HP14) in municipal solid waste incineration bottom ashes, Avfall Sverige rapport 2019:31.) have identified ambiguities in the method description, possibly associated with differences in the chemical and physical properties between the chemicals (for which the protocol was developed) and MSWI ashes (e.g. heterogeneity, buffering capacity, and particle size distribution). These challenges are further described in Section 2.4. It is clear that some conditions in the T/Dp must be further specified, or even adjusted, to make it possible to use the T/Dp in the classification of MSWI ashes.
Information on key legislation and links to published hazardous waste guidelines are compiled in Box 1. Box 2 summarizes the different approaches for classification by testing, with links to published reports on other methods. Approaches for the HP14 assessment are summarized in Box 3.
Footnotes
- ^ UN GHS (2019) Globally Harmonized System of Classification and Labelling of Chemicals, Annex 10 Guidance on Transformation/Dissolution of Metals and Metal Compounds in Aqueous Media (GHS, Rev.8, 2019) https://unece.org/fileadmin/DAM/trans/danger/publi/ghs/ghs_rev08/ST-SG-AC10-30-Rev8e.pdf
- ^ Margareta Wahlström, Tommi Kaartinen, Suvi Jokinen, Jutta Laine-Ylijoki. 2019. Hazardous waste classification - Assessment of hazardous property “ecotoxic” with focus on ashes. Finnish Environmental Pool 2019
- ^ Hälldal et al. 2019, Development of a test method for evaluation of ecotoxicity (HP14) in municipal solid waste incineration bottom ashes, Avfall Sverige rapport 2019:31.
Box 1: Key legislation and examples of published guidelines for hazardous waste classification (not only HP14)
Key legislation for assessment of hazardous waste status:
- 2014/955/EU: Commission Decision of 18 December 2014 amending Decision 2000/532/EC on the list of waste pursuant to Directive 2008/98/EC of the European Parliament and the Council Text with EEA relevance [1]http://eur-lex.europa.eu/legal-content/EN/TXT/?uri=celex:32014D0955.
- Regulation No 1357/2014 of 18 December 2014 replacing Annex III to Directive 2008/98/EC of the European Parliament and the Council on waste and repealing certain Directives (revised Annex III). [2]https://eur-lex.europa.eu/legal-content/EN/TXT/?uri=CELEX:32014R1357
- (EU) 2017/997 of 8 June 2017 amending Annex III to Directive 2008/98/EC of the European Parliament and the Council as regards the hazardous property HP 14 ‘Ecotoxic’.[3]https://eur-lex.europa.eu/legal-content/EN/TXTtemanord2022-525.pdf?uri=CELEX:32017R0997&from=RO
The following guidelines have been published:
- EC: Commission notice on technical guidance on the classification of waste (2018/C 124/01). [4]https://eur-lex.europa.eu/legal-content/EN/TXT/?uri=uriserv:OJ.C_.2018.124.01.0001.01.ENG
- Finland: Finnish Ministry of the Environment. 2019. Classification of waste as hazardous waste – updated guide. [5]https://julkaisut.valtioneuvosto.fi/bitstream/handle/10024/161316/YM_2019_02.pdf?sequence=5&isAllowed=y
- Denmark: Vejledning i klassificering af farligt affald (Guidance on classification of hazardous waste) [6]https://mst.dk/media/93596/vejledning-i-klassificering-af-farligt-affald_april-2017.pdf (does not include HP14) & Vejledende udtalelse fra Miljøstyrelsen om klassificering af farligt affald for så vidt angår den farlige egenskab HP 14 ”Økotoksisk”.[7]https://mst.dk/media/170896/hp14_vejledende-udtalelse_fra_miljoestyrelsen_december_2018-endelig.pdf
- Sweden: Naturvårdsverket. 2021. Avfallsklassificering[8]https://www.naturvardsverket.se/globalassets/vagledning/avfall-och-kretslopp/farligt-avfall/klassificering-och-kodning/210530_vgl_2_kap_avfallsforordningen_om_avfallsklassificering.pdf
Footnotes
- ^ http://eur-lex.europa.eu/legal-content/EN/TXT/?uri=celex:32014D0955.
- ^ https://eur-lex.europa.eu/legal-content/EN/TXT/?uri=CELEX:32014R1357
- ^ https://eur-lex.europa.eu/legal-content/EN/TXTtemanord2022-525.pdf?uri=CELEX:32017R0997&from=RO
- ^ https://eur-lex.europa.eu/legal-content/EN/TXT/?uri=uriserv:OJ.C_.2018.124.01.0001.01.ENG
- ^ https://julkaisut.valtioneuvosto.fi/bitstream/handle/10024/161316/YM_2019_02.pdf?sequence=5&isAllowed=y
- ^ https://mst.dk/media/93596/vejledning-i-klassificering-af-farligt-affald_april-2017.pdf (does not include HP14)
- ^ https://mst.dk/media/170896/hp14_vejledende-udtalelse_fra_miljoestyrelsen_december_2018-endelig.pdf
- ^ https://www.naturvardsverket.se/globalassets/vagledning/avfall-och-kretslopp/farligt-avfall/klassificering-och-kodning/210530_vgl_2_kap_avfallsforordningen_om_avfallsklassificering.pdf
Box 2: Nordic reports published related to hazardous waste classification
- Wahlström, M., Laine-Ylijoki, J., Wik, O., Oberender, A., Hjelmar, O. 2016. Hazardous waste classification. Amendments to the European Waste Classification regulation - what do they mean and what are the consequences? TemaNord 2016:519,
https://norden.diva-portal.org/smash/get/diva2:927423/FULLTEXT01.pdf
Avfall Sverige has published following reports:
- 2019:31 Development of a test method for evaluation of ecotoxicity (HP14) of municipal solid waste incineration bottom ashes https://www.avfallsverige.se/kunskapsbanken/rapporter/rapportera/article/development-of-a-test-method-for-evaluation-of-ecotoxicity-hp14-of-municipal-solid-waste-incinerat/
- 2019:30 Provtagningsplan i samband med klassificering av förbränningsrester (Sampling plan in according to classification of incineration residues) https://www.avfallsverige.se/kunskapsbanken/rapporter/rapportera/article/provtagningsplan-i-samband-med-klassificering-av-forbranningsrester/
- 2018:23 Tester av bottenaskor från avfallsförbränning för bedömning av irriterande och frätande egenskaper (Tests of bottom ash from waste incineration for assessment of irritating and corrosive Characteristics https://www.avfallsverige.se/kunskapsbanken/rapporter/rapportera/article/tester-av-bottenaskor-fran-avfallsforbranning-for-bedomning-av-irriterande-och-fratande-egenskaper/
- 2018:26 Zink- och kopparformer i bottenaskor från avfallsförbränning (Zinc and copper forms in bottom ash from waste incineration) https://www.avfallsverige.se/aktuellt/nyhetsarkiv/artikel/zink-och-kopparformer-i-bottenaskor-fran-avfallsforbranning/
- 2018:13 Vägledning för klassificering av förbränningsrester med beräkningsmetoder (Guidance for the classification of incineration residues using calculation methods) https://www.avfallsverige.se/kunskapsbanken/rapporter/rapportera/article/vagledning-for-klassificering-av-forbranningsrester-med-berakningsmetoder/
- 2018:22 Förekomstformer av bly, koppar och zink i askor från avfallsförbränningsanläggningar (Occurrence forms of lead, copper and zinc in ashes from waste incineration plants) http://www.diva-portal.org/smash/record.jsf?pid=diva2%3A1298722&dswid=-7595
- 2018:03 Klassning av förbränningsrester som farligt eller icke farligt avfall (Classification of incineration residues as hazardous or non-hazardous waste) http://www.klassning.se/rappopres/rapporter/2018-03.pdf
Box 3: Approaches for HP14 assessment
The assessment can be necessary in the case of mirror entries in the European List of wastes or for re-evaluation of existing waste classification. Following approaches can (officially) be used:
- Use of summation formulas based on hazardous substance with an ecotoxic property (including geochemical speciation methods for metals)
- Use of ecotoxicity testing methodologies (used in some member states)
- Use of CLP test methods for determination of ecotoxic properties in products
Principles are presented in Nordic TemaNord report 2016:519.
The lack of guidance regarding test methods combined with a requirement to assess HP14 has led to a range of initiatives in different parts of the EU.
1.2 Focus and aim of the study
The overall aim of this study was to develop and to give specifications/ complementary recommendations for a robust classification procedure for ash based on testing principles presented in the CLP for the assessment of HP14.
The work also included recommendations for the interpretation of test results.
Specifically, the aim was to suggest adaptions of the T/Dp so it can be used for HP14 classification of aged, carbonated MSWI bottom ashes (further on in the text called Mineral Fraction of Bottom Ash or MIBA) at labs with good lab practice. Furthermore, the aim was also to provide input to discussion at EU level on suitability of T/D protocol as one method.
1.3 Methodology
Together with a thorough literature review, laboratory studies formed the main part of the work. The method conditions were fine-tuned based on contacts with research organizations and laboratories with experience in relevant testing and results reported in scientific literature. A base for the work was also the significant experience within the project group from earlier projects on HP14 testing in Finland and Sweden.
An important part of the work was discussions with authorities on the choices for testing, i.e. mainly variations from T/Dp and evaluation of results. The work progress was followed up and discussed in the reference group meeting.
1.4 Structure of the report (“guidance for the reader”)
This report consists of six chapters (Fig. 1.1):
Chapter 1 presents the background, scope, and challenges of the project.
Chapter 2 presents the principles and background of the T/Dp and addresses the adaptation needs for ashes. The chapter also includes an analysis of critical and open testing conditions that need to be defined especially for ashes.
Chapter 3 gives an overview of the assessment approach in CLP based on results from the T/Dp.
Chapter 4 summarizes the results from the experimental work for the specification of test conditions for ashes and discusses the rationales for the adaptation of the T/|Dp for ashes.
Chapter 5 examines the applicability of the adapted T/Dp for ashes and presents how the test results can be interpreted for the classification of the HP14 property.
Chapter 6 concludes the work with recommendations.

Fig. 1.1. Structure of the report
1.5 Challenges and observations
One of the main challenges in the development of the test method was the lack of scientific reports on actual test conditions to be used in the T/Dp and also the rationales for different choices in the testing. Additionally, experience and potential adaptation needs for testing various materials have not been published or are not easily available. Clear guidelines on how to apply the CLP test methods are missing too.
The T/Dp test method for assessment of aquatic toxicity has been developed for chemicals, which typically have a constant and homogenous composition. Ashes have several characteristics that make it challenging to obtain reproducible test results when testing according to the T/Dp. Challenges in testing ash with the T/Dp are summarized in Section 2.4.
Owing to the heterogenic nature of MIBA, a specific challenge is the small test portion to be used in the testing. This challenge was acknowledged from the start and special attention was paid to sample preparation.
The following observations were made during the literature study:
- Overall, there is little experience of ash testing with the T/Dp.
- Various understanding of testing conditions in the T/Dp (e.g. how to manage pH in testing different materials).
- Information on test conditions, e.g. particle size, size of test vessels, and background correction are reported with various levels of detail in the literature, but from the test conditions described, it is clear that different test conditions have been used.
- The laboratories performing testing are not doing test interpretation.
2 Adaptation needs of the T/Dp for ashes for the assessment of aquatic toxicity
2.1 Introduction
The EU regulation 2017/997 sets out the rules for the assessment of the HP 14 property and makes references to methods for classification of substances and mixtures in the CLP-regulation or other internationally recognized test methods and guidelines. The base of the CLP approach is the assignment of material for any of the following hazard statement codes related to aquatic toxicity: H400, H410, H411, H412, H413 which describe different aquatic risks.
Besides the use of the summation formulas based on the hazardous statement codes, the aquatic toxicity of a material can be predicted with a CLP test method called the Transformation Dissolution (T/D) protocol (as presented in Box 4). If the waste is, based on testing results, classified as aquatic toxic according to any of the hazardous statement codes mentioned above, it is also classified as hazardous waste (regardless of the code).
2.2 T/Dp principle
The test method for determining aquatic ecotoxicity properties of metals was developed by Canadian researchers at CanmetMINING (Government of Canada). Canada is an important metal exporter for, e.g. metal concentrates and needed a hazard classification tool in order to access the international markets. CanmetMINING played a leading role in the development, validation and application of the Transformation/Dissolution (T/D) protocol, which has been widely adopted as the accepted approach to determine the T/Dp characteristics of metals and sparingly soluble inorganic metal compounds. The method was published as an OECD method[1]OECD no.29 2001. GUIDANCE DOCUMENT ON TRANSFORMATION/DISSOLUTION OF METALS AND METAL COMPOUNDS IN AQUEOUS MEDIA in 2001, and in 2011 with a few modifications it was also published as a method[2]UN GHS (2019) Globally Harmonized System of Classification and Labelling of Chemicals, Annex 10 Guidance on Transformation/Dissolution of Metals and Metal Compounds in Aqueous Media (GHS, Rev.8, 2019) (https://www.unece.org/fileadmin/DAM/trans/danger/publi/ghs/ghs_rev08/ST-SG-AC10-30-Rev8e.pdfl under the United Nations Globally Harmonized System for the Classification and Labelling of Chemicals.
The key principles in the method which aim to measure the intrinsic properties of metal substances for aquatic hazard classification are as follows and as illustrated in Figure 2.1:
- Substance in contact with “infinite water amount.”
- Excess of oxygen to enable transformation of oxides and sulphides into a soluble form and then dissolution to the water phase.
- Test aims to mimic environmental conditions for the pH range of 5.5–8.5 (but in practical testing limited to the pH range 6–8).
The test method is described to be applicable for metals and metal compounds, e.g. metal oxides and sulphides as in the test description explained as follows (OECD 2001, UN GHS 2011/Annex 10):
- “metals, M0, in their elemental state are not soluble in water but may transform to yield the available form. This means that a metal in the elemental state may react with the media to form soluble cationic or anionic products, and in the process the metal will oxidize, or transform, from the neutral or zero oxidation state to a higher one.
- in a simple metal compound, such as an oxide or sulphide, the metal already exists in an oxidized state, so that further metal oxidation is unlikely to occur when the compound is introduced into an aqueous medium. However, while oxidation state may not change, interaction with the media may yield more soluble forms. A sparingly soluble metal compound can be considered as one for which a solubility product can be calculated, and which will yield small amount of the available form by dissolution. However, it should be recognized that the final solution concentration may be influenced by a number of factors, including the solubility product of some metal compounds precipitated during the transformation/dissolution test, e.g. aluminium hydroxide.”
The T/Dp was initially developed for metals and metal compounds[3]However, the applicability for metallic nanoparticles has been questioned, but this is not relevant for bottom ashes.. Later, the field of application of the T/Dp has been extended to other materials. This is mentioned in the available ECHA recommendations[4]UVCB guidance: https://echa.europa.eu/documents/10162/23821863/misa_4_ws_summary_en.pdf/56e67ed4-e8fd-41f7-b1d4-738fade88b6c but without any specific instructions on how to address, e.g. heterogenous materials. Very little information on experiences in testing has been published in the literature, even if testing for classification has been performed with various types of materials. In Europe, there are only a few commercial laboratories and a few universities performing testing according to the T/Dp.
Bottom ashes are formed under high temperature and oxygen excess, which have some implications for the general description of metal solubility above. Metal sulphides (i.e. Cu, Zn and Pb) are oxidized during combustion and have rarely been identified in bottom ashes. Sulphides are otherwise oxidized, mainly to metal sulphates, in contact with an aerobic aqueous medium. The main forms of Cu in bottom ash are often metallic Cu and Cu(II) oxide, while the main Zn forms suggested are Zn(II) oxide and silicates, for example willemite, Zn2SiO4, (Tiberg et al. 2021[5]Tiberg, C., Sjöstedt, C, & Karlfeldt Fedje, K. Speciation of Cu and Zn in bottom ash from solid waste incineration studied by XAS, XRD, and geochemical modelling. Waste Management Volume 119, 1 January 2021, Pages 389–398. https://www.sciencedirect.com/science/article/pii/S0956053X20305948). The solubility of these, and cationic metal species, are often very pH-dependent and more soluble at low pH.
As the pH is one key parameter for metal release to the water phase, the test should be conducted at a pH where maximum transformation and dissolution can appear. However, the pH in the T/Dp range is limited to 6–8.5 (short-term test) or 5.5–8.5 (long-term test) based on the pH that can occur in the environment. The test is conducted under aerobic conditions using buffer media and CO2 gas to adjust the pH to desired value.
A short description of the T/Dp is given in Box 4.
Footnotes
- ^ OECD no.29 2001. GUIDANCE DOCUMENT ON TRANSFORMATION/DISSOLUTION OF METALS AND METAL COMPOUNDS IN AQUEOUS MEDIA
- ^ UN GHS (2019) Globally Harmonized System of Classification and Labelling of Chemicals, Annex 10 Guidance on Transformation/Dissolution of Metals and Metal Compounds in Aqueous Media (GHS, Rev.8, 2019) (https://www.unece.org/fileadmin/DAM/trans/danger/publi/ghs/ghs_rev08/ST-SG-AC10-30-Rev8e.pdfl
- ^ However, the applicability for metallic nanoparticles has been questioned, but this is not relevant for bottom ashes.
- ^ UVCB guidance: https://echa.europa.eu/documents/10162/23821863/misa_4_ws_summary_en.pdf/56e67ed4-e8fd-41f7-b1d4-738fade88b6c
- ^ Tiberg, C., Sjöstedt, C, & Karlfeldt Fedje, K. Speciation of Cu and Zn in bottom ash from solid waste incineration studied by XAS, XRD, and geochemical modelling. Waste Management Volume 119, 1 January 2021, Pages 389–398. https://www.sciencedirect.com/science/article/pii/S0956053X20305948

Fig. 2.1. Schematic illustration of the principle for the T/Dp.
Box 4: Description of the T/Dp (source: UN GHS 2019, see Annex 10 and 9)
In the T/Dp, the test substance is agitated in a pH-buffered aqueous transformation/ dissolution media reflecting different water compartments. The buffer media of pH 6 reflects surface water (fresh water) and pH 8 marine waters of different composition. There is a short-term test (with loadings of 1, 10, and 100 mg/l) with a maximum duration of 7 days and a long-term test (with 1 mg/l loading) with a maximum duration of 28 days. The chemical composition of the buffer media is based on the desired pH (see Table below); the test should be carried out at a pH that maximizes the concentration of the dissolved metal ions in the solution. The test prescribes a pH in the range of 6-8.5 for the short-term test and 5.5-8.5 for the long-term test.– Note! In practice, tests are only performed at pH 6 and 8. Testing at pH 5.5 is not validated and not generally conducted even if described in the test procedure.
For maximizing the concentration of dissolved metal ions from ashes the buffer media with the lowest pH should be chosen. It is well known that concerning ashes, the release of many contaminants, such as Cu and Zn, increases with a pH change from 8.5 towards 6 (or pH 5.5) (e.g. Komonweeraket et al. 2015; Dijkstra et al. 2008).
| Test-pH | 6 *) | 7 *) | 8 *) | 8.5 *) |
| Chemical composition of the buffer media. mg/l | ||||
| NaHCO3 | 6.5 | 12.6 | 64.75 | 194.25 |
| KCl | 0.58 | 2.32 | 5.75 | 5.74 |
| CaCl2 • 2H2O | 29.4 | 117.6 | 294 | 29.4 |
| MgSO4 • 7H2O | 12.3 | 49.2 | 123.25 | 123.25 |
| pH of the leachant (theoretical) | 6.09 | 7.07 | 7.98 | 8.5 |
| CO2 concentration in test vessel (balance is air) | 0.50% | 0.10% | 0.038% (air) | 0.038% (air) |
| *) according to the test description: during most tests, pH in solution will remain + 0.2 units, although some short-term pH variations have been encountered at loadings of 100 mg/L of reactive fine powder | ||||
Table: Recommended chemical composition of the buffer media in the transformation/dissolution test protocol. The buffer media are equilibrated with CO2 gas prior to the test. Other buffer media may be used, especially if biotests are performed on eluates. Leachant pH 6 was used in this study for ashes.
The 7-day test is executed with at least three replicates (several sample batches included in case variations expected). During the agitation the temperature, pH and dissolved oxygen concentrations are measured and subsamples for metal analysis taken from each test vessel at established time intervals (e.g. 2 h, 6 h, 1 d, 4 d, 7 d). The test can be stopped in advance if three subsequent total dissolved metal concentration data points vary no more than 15%. After the agitation, the eluate and the solid are separated by filtration. The T/Dp recommends membrane filters with 0.2 µm pore size.
Additionally, for the 28 day test (long term test), the 7 day test with the load 1 mg/L is prolonged to 28 days.
Collected eluate samples are analyzed for metal concentrations. The results are compared to ecological reference values (ERVs): acute (7-day test) and chronic (28-day toxicity) ERVs.
References:
- Dijkstra, J.J., Meeussen, J.C.L., Van der Sloot, H.A., Comans, R.N.J. 2008. A consistent geochemical modelling approach for the leaching and reactive transport of major and trace elements in MSWI bottom ash. Applied Geochemistry 23 (2008) 1544–1562
- Komonweeraket, K., Cetin, B., Aydilek, A.H., Benson, C.H., Edil, T.B. 2015. Effects of pH on the leaching mechanisms of elements from fly ash mixed soils. Fuel 140 (2015) 788–802
- UN GHS. 2019. Globally Harmonized System of Classification and Labelling of Chemicals, Annex 10 Guidance on Transformation/Dissolution of Metals and Metal Compounds in Aqueous Media (GHS, Rev.8, 2019) https://unece.org/fileadmin/DAM/trans/danger/publi/ghs/ghs_rev08/ST-SG-AC10-30-Rev8e.pdf
2.3 Adaptation needs for ashes due to ash characteristics
2.3.1 Comparison of ashes to chemicals tested under REACH
The T/Dp was originally developed for chemicals, which are quite different from waste ashes. The most challenging issue is that a chemical is produced according to well-defined processes with known proportions of the defined feedstocks, whereas waste ash is generated according to a known process but with different fractions of various feed materials that are not fully known. Consequently, while chemicals and mixtures of chemicals are generally totally homogenous in their composition, waste ash is naturally more heterogenous, depending on variations in the waste composition. However, the variation in ash is generally not as large as could be expected, and the major compounds, i.e. silicates and (hydr)oxides are similar between different ash samples. Additionally, research on the speciation of Cu and Zn in bottom ash has shown that there are large similarities between ash samples from different plants (Tiberg et al., 2021).
Another difference between ash and chemicals is that, while chemicals usually have well-defined particle sizes, the bottom ash contains particles from several centimetres down to micrometre size. In addition, the composition of the particles might differ with size, leading to different properties in e.g. release. This means that testing of different ash size fractions separately is not possible, whereas for chemicals with homogenous composition in particles of different sizes, test results derived from defined size fractions can be extrapolated. According to the T/Dp, grinding of test portions prior to testing should be avoided if possible, because grinding opens new surfaces not exposed to ageing. However, for ashes, grinding before testing cannot be avoided as a certain size fraction cannot be tested separately and used for assessment.
2.3.2 Buffering properties and reactions of ashes in water media
An important issue to be aware of in laboratory work with MIBA is its ability to act as a buffering material. The naturally weathered and sorted bottom ash, i.e. MIBA has somewhat other properties than the wet bottom ash that is collected directly after waste incineration. The major difference is, except that metal pieces are sorted out and removed, that important chemical reactions, i.e. carbonation (and oxidation) are taking place during the aging. During the carbonation process, CO2 is absorbed by alkaline compounds in the ash, such as Ca(OH)2, and carbonates, mainly CaCO3, are formed (Freyssinet et al., 2002[1]Freyssinet, P., Piantone, P., Azaroual, M., Itard, Y., Guyonnet, D., Baubron, J.C., 2002. Chemical changes and leachate mass balance of municipal solid waste bottom ash submitted to weathering 22, 159–172.).
The metal content does not decrease through this process, but the release is generally reduced as the pH decreases from highly to slightly alkaline, and metals can transform into less soluble species (Arickx et al., 2006[2]Arickx, S., Van Gerven, T., and Vandecasteele, C. 2006. Accelerated carbonation for treatment ofMSWI bottom ash. Journal of Hazardous Materials, 137(1), 235–243.). This makes MIBA less reactive and more suitable for construction purposes. During neutral and slightly alkaline pH values, the mobility of most metals in MIBA is low, while acidic conditions can increase the release. However, owing to the presence of the carbonates that are formed during the aging, the MIBA itself acts as a buffering material, i.e. carbonates are released from the ash to keep the slightly alkaline pH if the environment around the ash for some reason is acidic (pH<7). This could lead to temporary fluctuations in pH, which might influence metal release until equilibrium is reached. It is important to note that, if MIBA is kept in its natural environment, the slightly alkaline pH is stable for a long time with limited metal release.[3]Wahlström, M. et al. 2009. Guidance on the evaluation of acid neutralization capacity of waste - specification of requirement stated in landfill regulations. 2009. TemaNord: 580. Nordic Council of Ministers. http://www.diva-portal.org/smash/get/diva2:702816/FULLTEXT01.pdf
2.3.3 Minimum test portion requirements for ashes
Tests with a load of 1 mg/L have been performed both in Sweden and Finland in previous studies (Hälldal et al 2019[4]Hälldal et al. 2019, Development of a test method for evaluation of ecotoxicity (HP14) in municipal solid waste incineration bottom ashes, Avfall Sverige rapport 2019:31. and Wahlström et al 2019[5]Margareta Wahlström, Tommi Kaartinen, Suvi Jokinen, Jutta Laine-Ylijoki. 2019. Hazardous waste classification - Assessment of hazardous property “ecotoxic” with focus on ashes. Finnish Environmental Pool 2019). Based on these experiences, the leached amounts were very low at the load of 1 mg/L, generally below or near the ERV values to be considered. However, there were problems with, e.g. contaminations from chemicals and equipment and variations in analyzed concentrations, pointing out the difficulties using such diluted setups for a complex material as ash.
It is easy to understand that representative sampling of ash is much more complex than sampling from more homogenous materials like chemicals. This is especially important regarding such small samples as used for the smallest load (1 mg/L) in the T/Dp. Just increasing the sample mass to more than 1 mg is not practical as, e.g. an increase in ash mass to 1 g would require a vessel of 1 000 L. In some Canadian studies, test vessels of 100 L were used for the load 1 mg/L (i.e. 0.1 g/100 L) but that too seems to overshoot for waste classification and would require selected laboratories with specialized equipment (Skeaff, 2008)[6]Skeaff JM, Hardy D, King P. 2008. A new approach to the hazard classification of alloys based on Transformation/Dissolution. Integr Environ Assess Manag 4:75–93..
The standard EN 15002 about the preparation of test portions from laboratory samples of waste relates the test portion of a sample to particle size. Significantly higher amounts than 1 mg of the sample are proposed for the preparation of test portions of particles with a diameter of 1 mm or 0.2 mm. Examples of ranges of sample size for two different particle sizes are collated in Table 2.1. The minimum sample size is to be based on maximum particle size and homogeneity of waste. Also, the fraction of interest in the sample influences the sample size (for minor constituents larger samples are required).
Footnotes
- ^ Freyssinet, P., Piantone, P., Azaroual, M., Itard, Y., Guyonnet, D., Baubron, J.C., 2002. Chemical changes and leachate mass balance of municipal solid waste bottom ash submitted to weathering 22, 159–172.
- ^ Arickx, S., Van Gerven, T., and Vandecasteele, C. 2006. Accelerated carbonation for treatment ofMSWI bottom ash. Journal of Hazardous Materials, 137(1), 235–243.
- ^ Wahlström, M. et al. 2009. Guidance on the evaluation of acid neutralization capacity of waste - specification of requirement stated in landfill regulations. 2009. TemaNord: 580. Nordic Council of Ministers. http://www.diva-portal.org/smash/get/diva2:702816/FULLTEXT01.pdf
- ^ Hälldal et al. 2019, Development of a test method for evaluation of ecotoxicity (HP14) in municipal solid waste incineration bottom ashes, Avfall Sverige rapport 2019:31.
- ^ Margareta Wahlström, Tommi Kaartinen, Suvi Jokinen, Jutta Laine-Ylijoki. 2019. Hazardous waste classification - Assessment of hazardous property “ecotoxic” with focus on ashes. Finnish Environmental Pool 2019
- ^ Skeaff JM, Hardy D, King P. 2008. A new approach to the hazard classification of alloys based on Transformation/Dissolution. Integr Environ Assess Manag 4:75–93.
| d95 = 1 mm | d95 = 0.2 mm | |
| Very heterogenous (minor constituents) | 24 g | 270 mg |
| Heterogenous (major constituents) | 1.7 g | 10 mg |
| Rather homogenous (major constituents) | 300 mg | 2 mg |
Table 2.1. Examples of minimum sample sizes– NB only indicative information (see EN 15002 “Characterization of waste – preparation of test portion from laboratory sample). d95 = maximum particle size (defined as the 95 percentile)
2.4 Identification of critical test conditions
In the literature survey, only a few articles and reports with a detailed description of the test conditions were found. The project group also contacted experts at CanmetMINING for additional information on the test conditions. It is evident that, even though the same legislation is concerned, the tests performed in Europe have been conducted with different interpretations of the described test conditions. One potential reason that test conditions are not very fixed can be that the initial aim with the test description has been to allow material specific interpretations of the protocol for certain test material with varying characteristics to assure accurate classification results.
Box 5: Challenges with CLP method (T/Dp) for assessment of aquatic toxicity of ashes
The challenges concern both the assessment and the performance of the test. The following key challenges in the testing have been identified in this study:
- The heterogeneity of ashes setting requirements for minimum test portions
- Size reduction of ashes changes the properties of ashes
- A high buffering capacity of ashes in pH management
- Reactivity of ashes in contact with water (achievement of steady-state conditions)
- Low concentrations in test eluates (need for background correction from blank results) lead to challenges in reproducibility
- Reference values to be used in test interpretation might change with time and lead to changes in classification (see further Section 3.1)
- The test description leaves several test conditions open
- Acceptable deviations in test performance for ashes
The project group has identified several test conditions that need to be specified for testing of MSWI ashes with the T/Dp, mainly owing to the differences between chemicals and ashes as discussed above. In a study (Hedberg, 2012[1]Hedberg, Y & Odnevall Wallinder; I. 2012.Transformation/dissolution studies on the release of iron and chromium from particles of alloys compared with their pure metals and selected metal oxides. Materials and Corrosion 2012, 63, No. 6. DOI: 10.1002/maco.201005943) on the applicability of the T/D protocol for alloys, critical test conditions have been identified for testing. Several unspecified test conditions (e.g. CO2 gas rate in testing, volumes of solutions that can be withdrawn during testing) can influence the reproducibility of the T/D protocol used for the testing of alloys. Here, especially, concern about the filtration step is highlighted as experimental studies had shown that particle separation by membrane filtration is non-reproducible and that measured metal concentrations were largely influenced by this separation process.
Key test conditions in the T/Dp are summarized in Table 2.2 together with suggestions for how they should be specified in the testing of ashes and rationales for the choices. Needs for further specification or deviation were identified especially for grain size and pH adjustment.
Footnotes
- ^ Hedberg, Y & Odnevall Wallinder; I. 2012.Transformation/dissolution studies on the release of iron and chromium from particles of alloys compared with their pure metals and selected metal oxides. Materials and Corrosion 2012, 63, No. 6. DOI: 10.1002/maco.201005943
Table 2.2. Key test conditions in T/Dp and identified needs for further specifications in the experimental work.
| Condition | T/Dp | Our suggestions | Rationale |
| Grain size | Smallest on market*) | Test 0.25 and 1 mm | 1 mm more representative size, small particles of uncrushable metals are included (see 4.1). Test also 0.25 mm. |
| Target pH**) | pH 6–8.5***) | pH 6, a few different pH adjustment options studied | Additional information from CanmetMINING on how to understand the test description (see 4.2). |
| Sample amount in test (”load”) | 100, 10, 1 mg/L | 100 mg/L | Testing at loads of 1 mg/L and 10 mg/L is not suitable for testing of heterogenous waste (But extrapolation to load 1 mg/L is needed for assessment.) |
| Test duration | 7 or 28 days | 7 days and 28 days | Linked to load, prolongation of test time to 28 days needed for assessing chronic toxicity |
| Test vessel size | 1 or 2 Litre | 2 Litre | 2 Litre recommended by consultants. Also 1 Litre tested. |
| Temperature | 20–23 oC | 19–25 oC | Same as in waste testing, diffusion release is not crucial for ashes. Initially, T/Dp first specified 20–25 oC 24 , but later changed to 20–23 oC 25) |
| Test medium (buffer media) | Buffer solution | no changes | For ash characterization only buffer media at pH 6 relevant (see box 4) |
| Oxygen in test solution | Min 6 mg/L | no changes | > 6 mg/L (according to measurements in FINTOX-project 26)) |
| Dissolved organic carbon in buffer media | Max 2 mg/L | no changes | |
| Agitation | Gentle (e.g. orbital shaker) | no changes | Avoidance of agglomeration/abrasion |
| Subsampling of eluate after 2 h, 6 h, 24 h, 4 d and 7 d (7-days test) and additionally 14 d, 21 d and 28 d (28-days test) | 12–15 ml of liquid withdrawn from test solution at each time for subsampling. | Subsampling of all replicates but not all parameters are analyzed in all replicates. | pH analysis from all replicates. Metal analysis only from eluates from one replicate and additionally after 7 d and 28 d from the eluates from other replicates for cost savings No additions of fresh test solution to compensate liquid withdrawn (due to risk for contamination) |
| Filtration | 0.2 µm | 0.2 µm | The influence of membrane pore size was decided not to be in focus in this study. It can later be studied separately. In CEN test methods for study on release from waste, normally filters of 0.45 µm are used. |
| Replicates | At least 3 replicates from test material and during test performance at least two sub-samples from eluates (test solutions) at the point of subsampling of eluates | 5 | According to T/Dp method description: at least 3 replicates of the test material. At least two sub-samples of eluates (within each vessel) are taken for analysis and analyzed separately during test performance at each time. The within vessel variation should be below 10%. For ash testing, within vessel variations were here seen as less important compared to the use of 5 replicates and therefore not applied. In CEN test methods for waste characterization of release, requirements are not given for the number of replicates. Potential requirements are given in other documents for test interpretations (e.g. legislation, guidance documents) 5 replicates are recommended to be used for interpretation of test result in this study due to small size of test portion. This number might be decreased when more data is available. |
| Blanks | required | 1 /test set | For check on pH management and detection of contamination. For simplicity, no blank corrections for testing at load 100 mg/L as the measured concentrations of key metals generally are significantly higher than background concentrations. However, in case of very low ERV value****) (e.g. for lead) a correction might be needed. |
| *) for powders, for solids the TDp states “representative for normal handling and use” (UN 2019) **) For ashes: pH 6 maximize the concentration of dissolved metal ions in solution ***) for load 1 mg/l: the lower pH range is set to pH 5.5 in the T/D protocol, but this is not generally conducted as this has not been validated. See further core text. ****) ERV values explained in Section 3.1 | |||
[1]OECD no.29 2001. GUIDANCE DOCUMENT ON TRANSFORMATION/DISSOLUTION OF METALS AND METAL COMPOUNDS IN AQUEOUS MEDIA [2]OECD 2008 No. 98 Considerations Regarding Applicability of the Guidance on Transformation/Dissolution of Metals Compounds in Aqueous Media (Transformation/Dissolution Protocol) (2008) [3]Margareta Wahlström, Tommi Kaartinen, Suvi Jokinen, Jutta Laine-Ylijoki. 2019. Hazardous waste classification - Assessment of hazardous property “ecotoxic” with focus on ashes. Finnish Environmental Pool 2019
Footnotes
- ^ OECD no.29 2001. GUIDANCE DOCUMENT ON TRANSFORMATION/DISSOLUTION OF METALS AND METAL COMPOUNDS IN AQUEOUS MEDIA
- ^ OECD 2008 No. 98 Considerations Regarding Applicability of the Guidance on Transformation/Dissolution of Metals Compounds in Aqueous Media (Transformation/Dissolution Protocol) (2008)
- ^ Margareta Wahlström, Tommi Kaartinen, Suvi Jokinen, Jutta Laine-Ylijoki. 2019. Hazardous waste classification - Assessment of hazardous property “ecotoxic” with focus on ashes. Finnish Environmental Pool 2019
3 Hazard classification of ecotoxic properties according to the CLP
3.1 Ecotoxicological reference values, ERV
For the classification of the ecotoxic property, the T/D results (dissolved metal in aqueous media) are compared against the ecotoxicological reference values (ERVs) for each substance. Examples of ecotoxicological reference values (ERV) for Cu, Pb, and Zn are given in Table 3.1. For the aquatic hazard assessment from the 7-day test results, the LC50 (or EC50)[1]the concentration expected to produce an effect (e.g. lethal) in 50% of the test organisms is used as acute ERV and compared to the measured concentration from T/Dp eluate at a load of 100 mg/L. For the long-term aquatic hazard assessment from the 28-day test results, the NOEC[2]NOEC is No Observed Effect Concentration or EC10 values are used as chronic ERV and compared to the measured metal concentrations at a load of 1 mg/L (Skeaff 2011[3]Skeaff, J. et al. 2011, Advances in Metals Classification Under the United Nations Globally Harmonized System of Classification and Labeling Integrated Environmental Assessment and Management — Volume 7, Number 4—pp. 559–576, UN GHS Annex 9).
In the selection of ERV values, preferences are given to the ECHA´s risk reports for different metal compounds. As ERV values, the lowest toxicity values reported for acute and chronic toxicity for aquatic species (e.g. algae) are chosen.
For the selection of ERVs, an easier option than checking on dossiers provided by ECHA is to use the MECLAS tool (see Box 6). The MECLAS tool has been developed jointly by EUROMETAUX and ARCHE Consulting. The classification tool is constantly updated to the latest ERVs whereas there is a delay in the updates of the ECHA dossiers.
Footnotes
- ^ the concentration expected to produce an effect (e.g. lethal) in 50% of the test organisms
- ^ NOEC is No Observed Effect Concentration
- ^ Skeaff, J. et al. 2011, Advances in Metals Classification Under the United Nations Globally Harmonized System of Classification and Labeling Integrated Environmental Assessment and Management — Volume 7, Number 4—pp. 559–576
Table 3.1. Ecotoxicological reference values for Cr, Cu, Ni, Pb, and Zn presented in selected ECHA documents. Values are in µg/l.
| pH range | Acute | Chronic | Remark | |
| Cu a) | 5.5 – 6.5 | 12.1 (Pimephales promelas) | 8.7 (Danio rerio) | RAC document for granulated copper presents ERVs normalized to a DOC level of 2 mg/L (e.g. slightly higher chronic ERV values for pH range 5,5–6,5 and pH 6,5–7,5) In Copper GHS classification document: For Chronic ERV reported 13 µg/L f) |
| 6.5 – 7.5 | 11.7 (Danio rerio) | 5.9 (Pimephales promelas) | ||
| 7.5 – 8.5 | 40 (Ceriodaphnia dubia) | 12.6 (Daphnia magna) | ||
| Pb b) | 20.5 (Pseudo-kirchneriella subcapitata) | 1.7 (Ceriodaphnia dubia) | ||
| Zn c) | 80 (Ceriodaphnia dubia) | 17 (Pseudo-kirchneriella subcapitata) | ||
| Cr d) | 3700 (for Cr(III)), C. dubia) | PNEC: 6,5 | ||
| Ni e) | pH 6 | 286 (Pseudokirchneriella subcapitata) | 2.3 (Daphnia magna) | |
| a ECHA 2018. Committee for Risk Assessment RAC Opinion proposing harmonized classification and labelling at EU level of Granulated copper. Adopted June 8, 2018. https://echa.europa.eu/documents/10162/a24da89e-b62f-a4f4-890b-d88f392c3ec8. Accessed 2018-11-26 b Chemicals Department Danish Environmental Protection Agency. 2017. CLH report - Proposal for Harmonized Classification and Labelling - Lead metal. ECHA. https://echa.europa.eu/documents/10162/64622b48-8e0b-edfa-df73-12c104ee894c Accessed 2018-11-26 c Committee for Risk Assessment. 2015. Opinion proposing harmonized classification and labelling at EU level of Silver zinc zeolite. Adopted 4 December 2015. ECHA Committee for Risk Assessment //https://echa.europa.eu/documents/10162/ce343f0e-623b-7678-586e-613dffbcfe06. Accessed 2018-11-26 d ECHA dossier for Chromium (III) oxide: https://echa.europa.eu/registration-dossier/-/registered-dossier/15477/6/2/1, ECHA dossier for Chromium: https://echa.europa.eu/registration-dossier/-/registered-dossier/15551/6/1 e ECHA dossier for Nickel: https://echa.europa.eu/fi/registration-dossier/-/registered-dossier/15544/6/1 (accessed 2022-02-09) f Technical Guidance for the Classification of Copper Metal Under the Globally Harmonized System for Classification and Labelling of Chemicals (GHS). Prepared with International Copper Association (ICA)//January 21, 2020 https://copperghs.org/wp-content/uploads/2020/01/Hazard-Classification-of-Copper_Report_Condensed_FINAL.pdf | ||||
Box 6: MECLAS tool for hazard classification
A tool “MECLAS (Metals CLASsification tool)” has been developed by Arche and Eurometaux for classification of inorganic materials (e.g. ores, concentrates, alloys) for hazard classification fulfilling the EU CLP requirements. In ECHA registrations for metal compounds or streams, often the tool is mentioned as a reference in interpretation. The tool is freely available and has a license-based extension.
This tool can be used also for the HP14 classification of waste. The ERV values are constantly updated in the MeClas tool.
Input data on material composition, speciation data (if available) and results from T/Dp are introduced and the outcome is a datasheet on the classification according to different legislation (e.g. EU CLP).
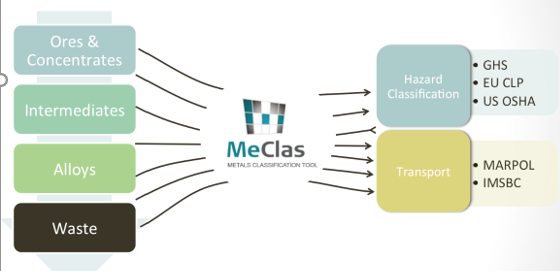 Source: Metals CLASsification tool. http://www.meclas.eu/
3.2 Assessment scheme according to the CLP
In the CLP guidance[1]ECHA 2017. Guidance on the Application of the CLP Criteria, general principles for the HP14 assessment are presented. For further details on testing, a reference is given to Annex 10 of UN GHS [2]UN GHS. 2019. Globally Harmonized System of Classification and Labelling of Chemicals, Annex 10 Guidance on Transformation/Dissolution of Metals and Metal Compounds in Aqueous Media (GHS, Rev.8, 2019) https://unece.org/fileadmin/DAM/trans/danger/publi/ghs/ghs_rev08/ST-SG-AC10-30-Rev8e.pdf for the test description (T/Dp). Further on, for the assessment of the T/Dp results, Annex 10 refers to an assessment scheme presented in Annex 9. The assessment is based on testing with three loadings and the test results from different loads are evaluated by comparing the leached concentrations to relevant ecotoxicological reference values (ERVs), e.g. LC50 or EC50 or NOEC for the dissolved metal ion. The connection between the CLP guidance and the UN GHS documents is illustrated in Fig. 3.1.
Footnotes
- ^ ECHA 2017. Guidance on the Application of the CLP Criteria
- ^ UN GHS. 2019. Globally Harmonized System of Classification and Labelling of Chemicals, Annex 10 Guidance on Transformation/Dissolution of Metals and Metal Compounds in Aqueous Media (GHS, Rev.8, 2019) https://unece.org/fileadmin/DAM/trans/danger/publi/ghs/ghs_rev08/ST-SG-AC10-30-Rev8e.pdf
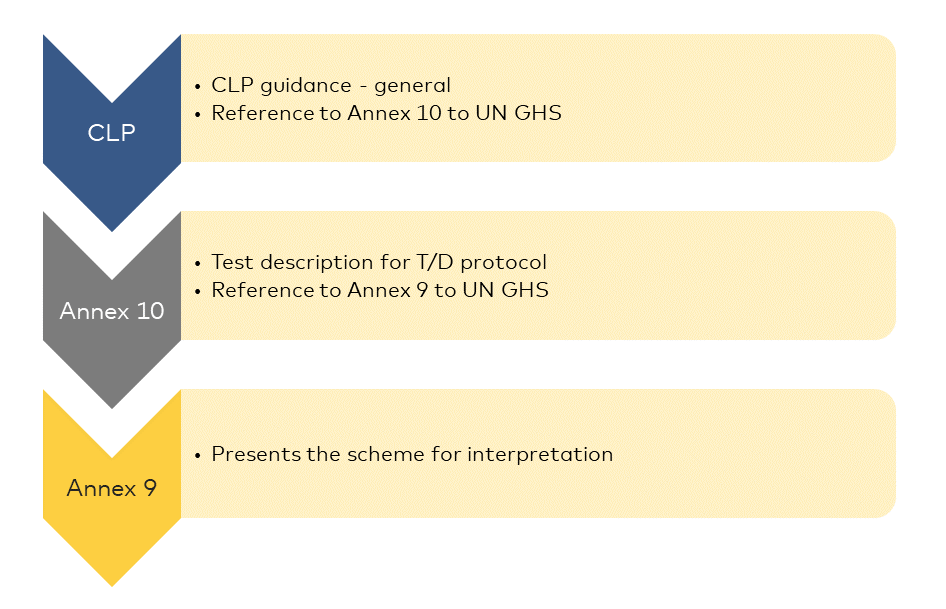
Fig. 3.1 Assessment of aquatic toxicity under CLP/REACH.
The scheme for the assessment is presented in Fig. 3.2. Different ERVs are used in the assessment depending on which hazardous statement code, i.e. H4XX, is to be evaluated. Table 3.2 summarizes the loadings and ERVs relevant for different hazard codes.
For test materials with poorly soluble metal compounds, the T/Dp prescribes only testing at the load of 100 mg/L. According to the assessment scheme, the load 100 mg/L is connected to the hazard statement code H412. However, H413 still remains open (see Fig 3.2). This means that a material can be classified as H413 owing to safety precautions even if the metal concentrations at load 100 mg/l do not exceed the ERVs (Reinhard et al. 2008[1]Reinhard Meister & Jonas Falck 2008. Environmental hazard classification of metals and metal compounds - A Probabilistic Assessment of Classification Power for Data Generated by the T/Dp. TemaNord 2008:518). The hazard statement H413 is a precautionary statement and this classification does not set high information needs on safety measures according to REACH, but for waste classification, this leads to hazardous waste classification.
It is important to note that if the H413 classification is removed, also H412 (as well as H411) can be removed. This means that the removal of H413 is crucial. Consequently, a test at the load 1 mg/L for 28 days is required and the released concentration is compared to ERVs for chronic toxicity. In the comparison to ERVs, the toxic unit index approach is used taking into account all harmful metals (see Box 7). First, for each metal the ratio (called Toxic unit (TU) value) between the measured concentrations from the T/Dp and the respective chronic ERV is calculated, and after this the individual TU values are summed up to a TU index for indication of the additive effects from several metals. If the TU index exceeds 1, the material tested is considered to exhibit the HP14 aquatic ecotoxic property (i.e. the ash is classified as hazardous for the HP14 property). If the sum of the TU values is <1, the ash is considered non-hazardous with respect to HP14 aquatic ecotoxic properties.
For ashes, only H412 and H413 are relevant based on the total content (i.e. it is not theoretically possible that concentrations exceeding ERVs for H410 and H411 can occur).
Footnotes
- ^ Reinhard Meister & Jonas Falck 2008. Environmental hazard classification of metals and metal compounds - A Probabilistic Assessment of Classification Power for Data Generated by the T/Dp. TemaNord 2008:518
| Short test: 7 days (comparison to acute ERV) | Long test: 28 days (comparison to chron ERV) | |||
| Load | 1 mg/L | 10 mg/L | 100 mg/L | 1 mg/L |
| Hazard classification | H400, H410 | H411*) | H412*) | H413 |
| Base for assessment **) | ERV-Acute | ERV-Acute | ERV-Acute | ERV-Chron |
| Relevance for ash classification | Not relevant for poorly soluble metals. Also based on total content not relevant even if 100% release. | Not relevant for poorly soluble metals. Also based on total content not relevant even if 100% release. | Yes | Yes |
| *) classification can be removed if the waste is not classified for H413 **) concentrations in test solution at end of the test compared to either acute or chronic ERV | ||||
Table 3.2. Summary of ERV values used in the assessment procedure.
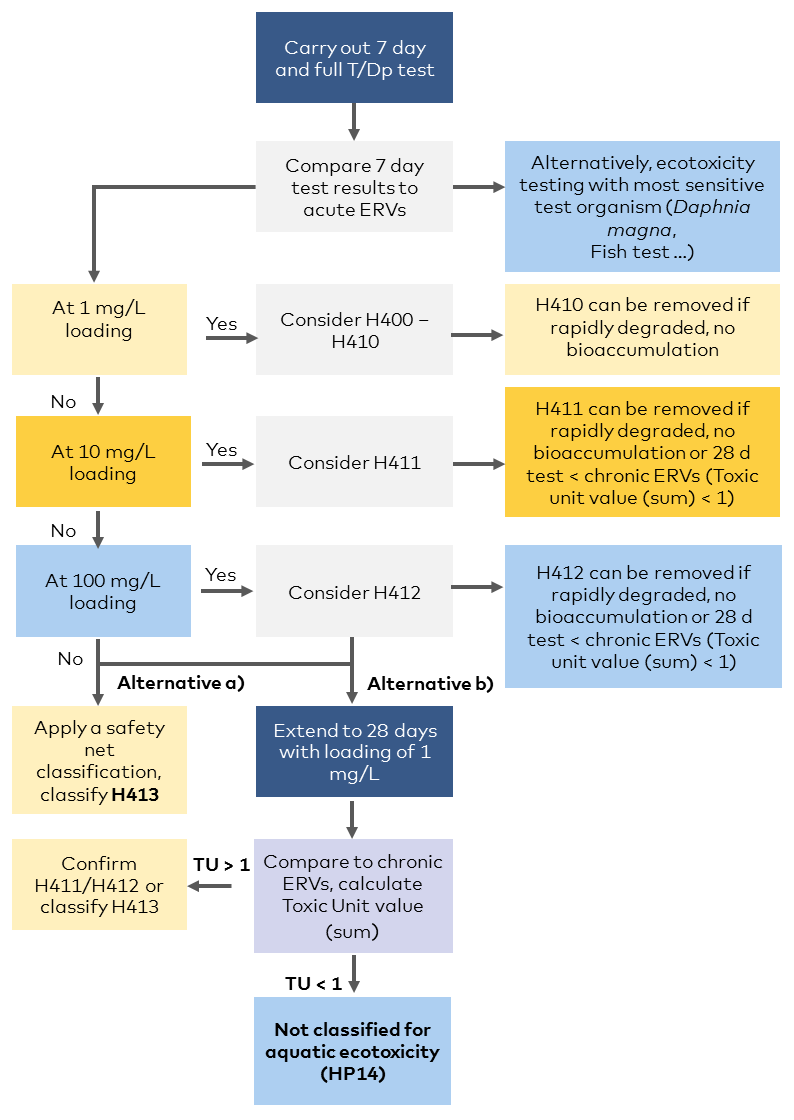
Fig. 3.2. CLP scheme for assessment of aquatic toxicity using the T/Dp. Abbreviations: H400* – very toxic to aquatic life; H410 – Very toxic to aquatic life with long-lasting effects; H411 – Toxic in aquatic life with long-lasting effect; H412 – Harmful to aquatic life with long-lasting effects; H413 – May cause lasting harmful effects to aquatic life.
Source: Euromines. 2017. Ores and Concentrates. An industry approach to EU Hazard Classification, http://www.euromines.org/files/publications/an-industry-approach-to-eu-hazard-classification-of-ores-concentrates.pdf
Box 7: TU index
To take into account the toxicity of several metals, the toxic unit’s (TU) approach has been applied by several scientists in the literature (Skeaff, 2008; Euromines 2017) The toxic unit index (TU index) is based on “concentration addition”, the assumption that metals/elements are toxic in the same way (have the same “mode of action”), and that the toxic effects of different elements can be added on the basis of their respective concentrations. The TU index is calculated as the sum of contributions from individual metals according to eq. (1).
eq. (1)
Where the aquatic hazard assessment for one metal (TUi) is calculated as follows:
for 7-day test results:
eq. (2)
or for 28-day test results:
eq. (3)
If the TU index is below 1, no hazardous classification for ecotoxicity is needed. For the aquatic hazard assessment from the 7-day test results, the LC50 (or EC50) used as acute ERV is compared to the measured concentrations CMe,7d from the T/Dp eluate at load 100 mg/L, according to eq. (2). For the long-term aquatic hazard assessment from the 28-day test results, the NOEC or EC value used as chronic ERV is compared to the measured metal concentrations CMe,28 d at load 1 mg/L (eq. (3)). For hazardous waste classification, i.e. H413 assessment, the test results from the 28-day test at load 1 mg/L are used in the TU index calculation.
The established ERVs are based on different organisms (the most sensitive organism/ endpoint of all that has been tested) for different metals. It may be argued that it is not correct to sum TUi calculated for different species. The TU index calculation is based on the assumption that the metals burden a target organism in the same way. It is plausible that, for example, Cu and Zn toxicity can be added for a certain organism, but it may be more questionable to sum TUi for different species. A rationale to still use the established ERVs in TU calculations may be the “precautionary principle”, the principle to adopt precautionary measures to avoid risks. There are other options, for example, to calculate TU indices for different species and/or trophy levels (Nowell et al. 2014). However, a lot of ecotoxicological data would be required for such calculations, which may not be available for all metals of interest.
Also the MeClas tool is available for calculation and interpretation of T/D results (see Box 6).
Reference: Nowell, L.H., Norman, J.E., Norman, P.W., Martin, J.D. & Stone, W.W. 2014. Pesticide Toxicity Index—A tool for assessing potential toxicity of pesticide mixtures to freshwater aquatic organisms. Science of the Total Environment 476–477 (2014) 144–157. https://doi.org/10.1016/j.scitotenv.2013.12.0883.3 Bridging principle
The CLP mentions the derivation of health or environmental classification of mixtures based on available data on similar tested mixtures and the ingredient substances. For example for ores and concentrates, the use of the bridging principle is mentioned as a tool for aquatic toxicity classification based on T/Dp results[1]Euromines. 2017. Ores and Concentrates. An industry approach to EU Hazard Classification, http://www.euromines.org/files/publications/an-industry-approach-to-eu-hazard-classification-of-ores-concentrates.pdf:
“If sufficient information is available on similar tested mixtures, including relevant ingredients of the mixtures, it is possible to determine the hazardous properties of an untested mixture by applying certain rules known as ‘bridging principles’. Those rules allow characterization of the hazards of the mixture without performing tests on it, but rather by building on the available information on similar tested mixtures.”
Two cases might be relevant for the classification of ashes:
- Application of bridging principles (i.e. T/Dp, composition) to untested materials from similar materials for which GHS information is already available. Here untested material needs to fulfil the requirements on concentration ranges in composition based on the initial concentration of the constituent (see Table 3.3).
- A batch of a tested mixture is produced under controlled conditions and it can be assumed that the hazards of each new batch are equivalent to those of previous batches and no change of classification can be assumed.
These approaches can be further developed in discussion on testing need for untested waste.
Footnotes
- ^ Euromines. 2017. Ores and Concentrates. An industry approach to EU Hazard Classification, http://www.euromines.org/files/publications/an-industry-approach-to-eu-hazard-classification-of-ores-concentrates.pdf
| Initial concentration range of the constituent | Permitted variation in initial concentration of the constituent |
| < 2.5% | + 30% |
| 2.5 < c < 10% | + 20% |
| 10 < c < 25% | + 10% |
| 25 < c < 100% | + 5% |
Table 3.3. Guidance in CLP for use on bridging principles – “permitted” change in composition of a mixture for use of bridging principles
4 Results from the evaluation of critical test conditions in the T/Dp
Key test conditions for ashes are identified as the maximum grain size of ash sample, management of pH during test duration, and test conditions related to the 28-day test. The conclusions for these key parameters are compiled in Sections 4.1–4.3 and are based on the experimental work and discussions in the project group.
4.1 Grain size
In the T/Dp, the particle size of the material to be tested is not specified except that the "smallest representative particle size on the market" (powders) or "particle size representative for normal handling and use" (solids) should be used. In the case of the absence of information, a default diameter of 1 mm is suggested.
In the case of bottom ash, there is for natural causes no specific (smallest) representative particle size as particles of various sizes are present in the ash. Particle size distribution analyses show that about 20–40% of MIBA is usually <1___mm[1]Hälldal et al. 2019, Development of a test method for evaluation of ecotoxicity (HP14) in municipal solid waste incineration bottom ashes, Avfall Sverige rapport 2019:31., which was also found for the ashes used in the present project, see further Table 5.1.
Our first choice would therefore be to grain representative ash sample particles that originally are >1 mm down to <1 mm particle size and mix them with the particles that originally were < 1mm (i.e. 100% of the final ash sample that is used for the test is < 1 mm). This ensures that the potential release from larger particles is included in the test but also that the suggested default diameter is used. An argument for using a smaller particle size would be that it could give a more homogenous sample composition with enough particles. For this reason, as well as the heterogeneity of ashes, it is important to analyze replicate samples and have detailed subsampling instructions to ensure representative samples also when not crushing the sample into very small particle sizes. Skeaff (2008)[2]Skeaff JM, Hardy D, King P. 2008. A new approach to the hazard classification of alloys based on Transformation/Dissolution. Integr Environ Assess Manag 4:75–93. proposes using a critical surface area approach, where the particle surface area is related to a representative particle size of the material and the release in the T/Dp. However, this approach cannot be used for ashes, as different particle size fractions cannot be tested separately, e.g. owing to the different composition of the particles.
A particle size of maximum <1 mm would also keep the tested material relatively similar to the original material and include small particles of uncrushable metals and particles, which would not be the case if a smaller maximum particle size is used (as such samples would be less representative of the ash). In theory, grinding could both increase the release of metals owing to increased contact between previously incapsulated metals and leaching solution and decrease the release owing to increased sorption as the grinding increases the surface area and exposes new surfaces. The grinding of fly ash has been shown to decrease the release of metals like Zn and Pb[3]Karlfeldt Fedje, K. and Steenari B-M. 2007. Assessment of metal mobility in MSW incineration ashes using water as the reagent, Fuel (86) 1983-1993. https://doi.org/10.1016/j.fuel.2006.12.011. However, earlier studies on bottom ash do not indicate any correlation between particle size and released amounts[4]See reference 34 (Hälldal, 2019).
Even though there are several arguments to use <1 mm as maximum particle size, the possible difference in metal release at a smaller particle size was experimentally studied. The influence of 2 different grain sizes on metal release (0.25 mm and 1 mm) was tested with two MIBAs (Figure 4.1). The pH at the end of the test was very similar regardless of particle size. It could not be established that the release of Cu, Pb or Zn was higher or varied less using the 0.25 mm grain size. Therefore, the recommendation was to use samples with a maximum grain size of 1 mm, i.e. all particles >1 mm were ground to <1 mm.
Footnotes
- ^ Hälldal et al. 2019, Development of a test method for evaluation of ecotoxicity (HP14) in municipal solid waste incineration bottom ashes, Avfall Sverige rapport 2019:31.
- ^ Skeaff JM, Hardy D, King P. 2008. A new approach to the hazard classification of alloys based on Transformation/Dissolution. Integr Environ Assess Manag 4:75–93.
- ^ Karlfeldt Fedje, K. and Steenari B-M. 2007. Assessment of metal mobility in MSW incineration ashes using water as the reagent, Fuel (86) 1983-1993. https://doi.org/10.1016/j.fuel.2006.12.011
- ^ See reference 34 (Hälldal, 2019)

, Pb (μg/L) and Zn (μg/L)")
Fig. 4.1. Results from tests with different particle sizes. Cu and Pb concentrations in leachates from BA6 <0.25 mm were below detection limits in all replicates and are not shown in the figure. Error bars are SD.
4.2 Management of pH during test
How to manage the pH is not very clearly described in the T/Dp. In the literature review, it was found that several different systems for pH management had apparently been applied but test conditions were not clearly reported (e.g. final pH of test solutions and blank controls, used gas systems, and flow rates). The addition of acid and base to control pH during the test is forbidden. The test prescribes the use of blanks, but the acceptable variance of pH values in blanks is not stated in any references.
The project group contacted CanmetMINING to discuss pH management. They provided important information: the test is seen to be conducted at the target pH (MIBA target is here pH 6) regardless of actual pH at the end of the test, if the pH change is caused by the sample itself. Consequently, there is no need to force the pH to the target pH if the prescribed test conditions do not keep pH at the pH of the buffer solution (e.g. owing to the high content of buffering compounds in the ashes).
In the previous FINETOX study[1]Margareta Wahlström, Tommi Kaartinen, Suvi Jokinen, Jutta Laine-Ylijoki. 2019. Hazardous waste classification - Assessment of hazardous property “ecotoxic” with focus on ashes. Finnish Environmental Pool 2019, VTT conducted tests at the load 100 mg/L using buffer solutions at pH 6 without further actions for pH reduction (i.e. only mixing the sample with pH 6 buffer solution) as well as various trials with CO2 gas addition in the headspace of the test vessels to keep pH around 6. In cases where only the buffer solution was used, the pH value increased to pH 6.8. Consequently, the ash itself increased the pH value but by less than one unit. Only with the addition of a high level of CO2 gas (for the bottom ash sample up to 10% CO2 in the headspace of the test bottle on the first two days of the test), was it possible to reach or maintain the value at pH 6 in the test, but several trials were needed to find the right doses and timing of CO2 additions. Several approaches for pH management were studied in this project, see Table 4.1 and Figure 4.2.
Footnotes
- ^ Margareta Wahlström, Tommi Kaartinen, Suvi Jokinen, Jutta Laine-Ylijoki. 2019. Hazardous waste classification - Assessment of hazardous property “ecotoxic” with focus on ashes. Finnish Environmental Pool 2019
Table 4.1. Different options for pH management. Methods found in the literature and additional methods suggested.
| Option (references to previous studies) | Remark | Impact |
| No CO2 addition during test performance (Wasmuth et al. 201639). Not tested in the current study. | CO2 additions to reach target pH in the buffer solution is explicitly stipulated in the T/Dp, but not CO2 addition during the test. Use of CO2 additions presented in references and used in validation study. The importance of CO2 for managing the pH is probably highly material dependent and perhaps CO2 additions will not significantly influence the release for some materials. | Easy to perform. Robust test condition. pH may increase significantly if buffering samples are tested. |
| Introduction of 0.5% CO2 in the headspace of test vessels (new gas introduced when eluate is sampled). Test0 (1 L bottle with headspace 12 % of test bottle size:) and Test1 (2 L bottle with headspace 57 %) in the current study. | Own interpretation of the T/Dp. Simplification compared to the bubbling of CO2. To increase the headspace 2 L vessels with 1 L solution can be used. | Relatively easy to perform. Should produce robust test results. |
| Test performed with 0.5% CO2 in air overflowing leachant media during the test. Test2 in the current study. | Simplification compared to the bubbling of CO2. | Complex set-up but easier than bubbling CO2 through test solution. May result in significant differences between laboratories. |
| Test performed with air containing 0.5% CO2 bubbling through leachant media during the test (Skeaff et al. 201140). Test3 in the current study. | Flow rate not prescribed in T/Dp. References to the method include information on different flow rates used by laboratories participating in the validation study. | Complex and sensitive to sample and test setup (gas flow, gas composition). Difficult to keep a constant low gas flow. It likely results in significant differences between laboratories. |
[1]Wasmuth, C. 2016. Assessing the suitability of the OECD 29 guidance document to investigate the transformation and dissolution of silver nanoparticles in aqueous media. Chemosphere 144:2018-2023DOI:10.1016/j.chemosphere.2015.10.101 [2]Skeaff, J. et al. 2011, Advances in Metals Classification Under the United Nations Globally Harmonized System of Classification and Labeling Integrated Environmental Assessment and Management — Volume 7, Number 4—pp. 559–576
Footnotes
- ^ Wasmuth, C. 2016. Assessing the suitability of the OECD 29 guidance document to investigate the transformation and dissolution of silver nanoparticles in aqueous media. Chemosphere 144:2018-2023DOI:10.1016/j.chemosphere.2015.10.101
- ^ Skeaff, J. et al. 2011, Advances in Metals Classification Under the United Nations Globally Harmonized System of Classification and Labeling Integrated Environmental Assessment and Management — Volume 7, Number 4—pp. 559–576

Fig. 4.2. Schematic overview of pH management systems tested in the current study.
The criterion for the choice of method in this project was set such that the end pH of the blank test should be within 6±0.2[1]This was chosen as a practical approach. In the T/Dp no strict pH limit is set, but it is stated that the pH meter used in the test must show acceptable results within 0.2 units. According to T/D protocol, the pH of buffert medium is 6.09 (see Box 4). A stricter pH range for blanks sets requirements for additional injections especially if the intervals exceed 3–4 days).. In the comparison of different options, Test1 was seen as the most robust method for fulfilling the blank criterion. In Test1, a specific quantity of CO2 gas[2]For calculation of quantity of CO2 to be injected using a syringe: first the headspace in the test bottle containing the required test solution quantity is estimated, and based on this information the pure CO2 quantity to equal a concentration of 0.5% CO2 in the headspace is calculated. was injected into the headspace of a 2L test bottle at specific time intervals (in connection with the sampling of the test solution). The aged MIBA ashes were carbonized during storage and therefore it can be assumed that reactions of minerals with CO2 have occurred, and one of the major parameters influencing the release is the pH value in the test solution. CO2 additions in the test solution are here only used to control the pH of the test solution. For other materials, the concentrations of dissolved CO2 in the test solution may play a role to be checked.
The indicative results from pre-tests with 2 ash samples (BA2 and BA4) are shown in Figure 4.3. The following observations were made during the pre-tests for the management of pH:
- in Test0, where 0.5% CO2 gas was injected into the headspace of the test bottle (1 litre) during the test performance, the ashes increased the pH of the buffered test solution at the start to near pH 7 and at the end of the test (day 7), the pH value had decreased to about 6.5.
- in Test1 (with larger headspace than Test0), the pH of the test solution increased at the start of the test but decreased to a range of 6.1–6.4 at the test end.
- management of bubbling CO2 gas in head space (Test2) or test solutions (Test3) set the need for well-controlled systems to ensure constant CO2 concentration and flow. In the pretesting, it was noted that better control of flows were needed owing to variations in pH values between the replicates – and the results in Figure 4.3 are therefore indicative
- it is important to check that the blanks during the test performance are near the desired pH range to ensure that the pH value at the end of the test time fulfils the blank criterion.
Footnotes
- ^ This was chosen as a practical approach. In the T/Dp no strict pH limit is set, but it is stated that the pH meter used in the test must show acceptable results within 0.2 units. According to T/D protocol, the pH of buffert medium is 6.09 (see Box 4). A stricter pH range for blanks sets requirements for additional injections especially if the intervals exceed 3–4 days).
- ^ For calculation of quantity of CO2 to be injected using a syringe: first the headspace in the test bottle containing the required test solution quantity is estimated, and based on this information the pure CO2 quantity to equal a concentration of 0.5% CO2 in the headspace is calculated.


Fig. 4.3. Indicative data from pre-testing of different pH management systems in BA2 and BA4. The standard deviation (3 replicates) was between 0 and 0.22. NB. Data in this figure is not directly comparable to Figure 4.4 due to different conditions and timing of testing. Test0: test performed with 1L bottles and CO2 injections in headspace at sampling of test solution. Test1: tests performed with 2L bottles and CO2 injections in the headspace at the sampling of test solution. Test2: tests performed with 1L bottles with CO2 flow in the headspace (NB. no control of flow and actual CO2 concentration) and Test3: tests performed with 1L bottle with CO2 bubbling in test solution (NB. no control of flow and actual CO2 concentration). In all cases presented in the figures, the pH of the test solution was measured on a separate sample withdrawn from the test solution and not from the test solution in the test vessel owing to the contamination risk.
In addition to the tests conducted in this study, a test series with continuous CO2 flows as described in OECD 98[1]OECD 2008 No. 98 Considerations Regarding Applicability of the Guidance on Transformation/Dissolution of Metals Compounds in Aqueous Media (Transformation/Dissolution Protocol) (2008) was also conducted for samples BA2 and BA4 by a Belgian test laboratory, ECTX bv (report attached as Appendix 2). The final test (Test1) with the chosen pH management system used with MIBA samples is shown in Figure 4.4 compared to a system described in OECD 98 based on continuous CO2 flow in either bottle headspace or test solution. The results from Test1 fitted well with the results from the Belgian laboratory using CO2 flows for buffering of the test solution.
Footnotes
- ^ OECD 2008 No. 98 Considerations Regarding Applicability of the Guidance on Transformation/Dissolution of Metals Compounds in Aqueous Media (Transformation/Dissolution Protocol) (2008)


Fig. 4.4. Comparison of pH management systems in BA2, BA4 and blanks. Standard deviation (3-5 replicates) is shown as black bars. Test1: tests performed with 2 L bottles and CO2 injections in the headspace at the sampling of test solution (results from own testing in the HP14 project). Test2: tests performed with 1 L bottles with CO2 flow in headspace (results from ECTX bv, see Appendix 2) and Test3: tests performed with 1 L bottle with CO2 bubbling in the test solution (results from ECTX bv).
4.3 Decisions for final test conditions for 28 days
For removal of the hazard classification H413 (and subsequently also H411 and H412) a full 28-day test is needed. The 28-day test should be conducted with the load of 1 mg/L at the pH that gives maximum release of metals in the pH range of 5.5-8.5 (compared to pH range 6-8.5 for the 7-day test). In the MERAG report (2007[1]MERAG. Fact sheet 08. 2007. Classification: Classification for effects on the aquatic environment of metals/metal compounds and alloys. https://www.arche-consulting.be/wp-content/uploads/2017/08/MERAG-FS-08-Jan-07.pdf), it is mentioned that “the OECD Transformation/ Dissolution Validation Management Group recommended restricting the pH range for the 28 days full test to the pH range of 6.0-8.5 for the present time, since no suitable system could be recommended that could maintain the pH constant at the lower range (pH = 5.5) of the test, without influencing the transformation/dissolution or ecotoxicity properties of the metal, alloy or the sparingly soluble metal compounds". Also, in the literature review, no studies conducted at pH 5.5 using a buffering solution and CO2 gas flows were found. Validation studies of the full 28-day test have only been performed at pH 6. In conclusion, testing at pH 5.5 is not suggested owing to the lack of instructions for robust testing conditions.
The T/Dp does not set any requirements on the use of finely ground material, but only states that abrasion of particles during the agitation should be avoided to prevent the creation of new surfaces. On the other hand, sampling of a test portion of 1 mg means that the test material needs to be a powder for obtaining a representative test portion[2] It can also be argued that it is not possible to obtain a representative sample of 1 mg from a powder due to few particles in test portion (see Table 2.1). Of course, testing can be performed with a higher leachant amount, but this is not very practical.. However, milling of the ashes to a powder would change the ash properties as discussed in Section 4.1. Additionally, when crushing to very fine particle sizes, a larger proportion of uncrushable material also needs to be removed, which means that a test portion of 1 mg would not represent the ash material.[3]In the FINETOX project, a subsample of MSWI ash was milled to less than 0.063 mm for testing at the load 1 mg/L. However, the oversized material was not included in the T/D testing. As the released amounts in the test performed at the load 1 mg/L were significantly higher than the total content, this clearly means that the fraction included in the fine fraction tested had a different composition than the whole sample.
As a solution to this, a sample of 100 mg/L is suggested to be used instead of 1___mg/___L with a testing time of 28 days, i.e. prolonging the 7-day test to 28 days and extrapolation of the results to 1 mg/L. However, it is important to note that the maximum metal release might differ between the 100 mg/L and 1 mg/L loads. To account for potential differences, a safety factor can be introduced. A prerequisite for extrapolation is to assure that no metal release at the higher load is inhibited by saturation, i.e. precipitation of solids. This can be evaluated by the calculation of saturation indices (SI) for the metals of interest, in this case, Cu, Pb, and Zn (see Box 8).
Footnotes
- ^ MERAG. Fact sheet 08. 2007. Classification: Classification for effects on the aquatic environment of metals/metal compounds and alloys. https://www.arche-consulting.be/wp-content/uploads/2017/08/MERAG-FS-08-Jan-07.pdf
- ^ It can also be argued that it is not possible to obtain a representative sample of 1 mg from a powder due to few particles in test portion (see Table 2.1). Of course, testing can be performed with a higher leachant amount, but this is not very practical.
- ^ In the FINETOX project, a subsample of MSWI ash was milled to less than 0.063 mm for testing at the load 1 mg/L. However, the oversized material was not included in the T/D testing. As the released amounts in the test performed at the load 1 mg/L were significantly higher than the total content, this clearly means that the fraction included in the fine fraction tested had a different composition than the whole sample.
Box 8: Calculation of SI
In this study, the SIs were calculated for the eluates from the 28-day test with the load 100 mg/L, which were conducted with three ashes (BA2, BA7, BA9). pH is an important parameter for precipitation/dissolution of minerals as most minerals precipitate more easily at high pH, i.e. lower release. The pH in eluates from the 28-day test was between 6.2 and 7.
The SI calculations were based on analyzed concentrations of Al, Si, Fe, Cu, Pb, and Zn in leachates and the chemical composition of the leaching medium (see Box 4) and performed in Visual Minteq (Gustafsson 2013[1]Gustafsson JP. 2013. Visual MINTEQ 3.1, http://vminteq.lwr.kth.se/.). The calculations are limited to Cu, Pb and Zn minerals containing the elements in the leachate and included in the Visual Minteq database plus the minerals willemite (Zn2SiO4) and franklinite (ZnFe2O4) which were added to the database. Therefore, most of the Cu, Pb and Zn minerals suggested in the literature as possible mineral species or precipitates in bottom ash were covered (Tiberg et al 2021). However, the dissolution/formation constants were not available for all species. Therefore, the SIs for, e.g. hardystonite and hemimorfite could not be calculated.
A saturation index 0 and higher indicates possible saturation or oversaturation. All the calculated SIs except for franklinte were below -1 (i.e. undersaturation). Consequently, the results do not indicate saturation of any common Cu, Pb or Zn minerals for which saturation indices could be calculated, except franklinite. However, the solubility of franklinite is very low, and calculations indicate that the dissolution of franklinite would only give Zn concentrations far below the ERV value for Zn at pH 6 and even lower concentrations at higher pH.
Reference:
Tiberg, C., Sjöstedt, C, & Karlfeldt Fedje, K. Speciation of Cu and Zn in bottom ash from solid waste incineration studied by XAS, XRD, and geochemical modelling. Waste Management. Vol. 119, 1 January 2021, 389-398.
Footnotes
- ^ Gustafsson JP. 2013. Visual MINTEQ 3.1, http://vminteq.lwr.kth.se/.
4.4 Extrapolation of concentrations to load 1 mg/L from load 100 mg/L
The released concentrations at 1 mg/L can be estimated by applying a dilution factor of 100 to the test results from a 100 mg/L load. Applying this dilution factor gives a linear extrapolation of the results from 100 mg/L to 1 mg/L. However, the concentration is not necessarily linearly related to the load, as different processes may influence the release at 1 mg/L compared to 100 mg/L (experimental setup otherwise equal). It is not clear if the extrapolation leads to an over- or underestimation of metal release. For example, the pH may not be the same at 100 and 1 mg/L load. The pH would probably be lower at a lower load owing to less buffering capacity with a smaller amount of ash, which could increase the metal release. In addition, the agglomeration and sedimentation of particles during the experiment may be smaller at 1 mg/L load, thus leading to a larger surface area exposed to the solution, while a smaller abrasion would give a lower surface area. The results from the load 100 mg/L are therefore proposed to be divided by a factor of 100 and then corrected by using a safety factor to cover the potential situation where more metals are released in the more dilute solutions than expected from a linear extrapolation. As a definition of the estimated safety factor, we here use the ratio between the actual concentration measured at load 1 mg/L and the concentration calculated from 100 mg/L by dividing the concentration with a factor of 100.
In order to estimate and determine a safety factor, examples of available published data on the release with the loading of 100 mg/L and 1 mg/L are collated in Table 4.2. The focus was on metals relevant for MIBA. However, in many studies, other pH management systems were used, e.g. in some cases, end pH increased to pH 7–8 in the test solutions where no actions were taken for buffering the test solution with CO2 gas addition. This data is therefore not suitable for comparison in our case, and consequently, the amount of useful data is limited. T/Dp data has especially been retrieved from ECHA registrations, but only part of the registration documents are freely available.
The ratio between the concentrations varied with material type and metal (Table 4.2). Only for a few materials, have the release at loading 100 mg/L and a test time of 28 days been published. Therefore, Table 4.2 includes data for load 100 mg/L for testing at 7 days, which can lead to a higher conversion factor compared to data from 28-day testing at load 100 mg/L[1]One challenge in release comparison is that the data on the release at load 100 mg/L and 1 mg/l are related to different test durations (7 and 28 days respectively). Often the release is higher at 28 days than at 7 days for load 100 mg/L. This leads to higher conversion ratios in Table 4.2 where mainly results from the 7-day test for load 100 mg/L was used.. Generally, the ratio between the measured concentrations at load 1 mg/L and the calculated concentrations derived from load 100 mg/L varied in the range below value <1 and up to a value of 5, depending on the material and metal and released metal level. An exception is the Cu release data at load 1 mg/l for two materials (Ni matte and silica fume powder). Here it can be noted that the Cu release from Ni matte had a significant spread in concentrations, and the release was dominated by Ni (released in high concentration). The other material with a high ratio (silica fume powder) had been tested at pH 5.5 and not pH 6. According to one reference in Table 4.2, it is stated for Cu scale (“by-product produced in the rolling of copper wire”) that a safety factor of 4 can be used for extrapolation of the results. As rationale, it is presented in the registration dossier that copper release is linearly related to the surface area and time, and therefore such linear extrapolation is considered as a good approximation. For Pb and Ni, the concentration levels are very low (no saturation effect) and the concentration levels decrease as a function of time (likely passivation of the material), and therefore this is expected to be a conservative approach.
In this discussion, parallels can be drawn to cases where dilution factors have been used for the classification of mixtures according to the CLP rules where so-called M-factors need to be considered in the hazard classification. This means that data for very low loads, e.g. 0.1 mg/L or 0.01 mg/L is needed. As the testing is not feasible at such very small loads, extrapolation is allowed from the results of 7 and 28-day tests with load 1 mg/L either by using dilution factors with cautions or extrapolation equations in a precautionary way[2]ECHA 2017. Guidance for application of CLP criteria. https://echa.europa.eu/documents/10162/23036412/clp_en.pdf/58b5dc6d-ac2a-4910-9702-e9e1f5051cc5. For example, in the dossier[3]International Copper Association, 2021. Technical Guidance for the Classification of Copper Metal Under the Globally Harmonized System for Classification and Labelling of Chemicals (GHS), https://copperghs.org/wp-content/uploads/2021/03/Hazard-Classification-of-Copper_Report_Condensed_2021.pdf for copper flakes, the results obtained for copper flakes tested at load 1 mg/L were used to predict the concentrations released at lower mass loading rates of 0.1 and 0.01 mg/L by dividing them by 10 and 100, respectively. With this in mind, and in view of the discussion above, it seems reasonable to extrapolate results from 100 mg/L to 1 mg/L when testing MIBA for HP14. For extra cautiousness, a safety factor can be added.
Based on literature review the project group proposes the following principles:
- a common safety factor for metals released from MIBA is simple and transparent;
- based on the ratios in Table 4.2 a safety factor of 5 covers the different published data;
- the total content constitutes a boundary condition for the release and needs to be taken into account in the choice of the safety factor.
A final proposal for choosing a safety factor for MIBA testing is presented in Section 5.3.6, which takes into account the results from the experiments in this work.
Footnotes
- ^ One challenge in release comparison is that the data on the release at load 100 mg/L and 1 mg/l are related to different test durations (7 and 28 days respectively). Often the release is higher at 28 days than at 7 days for load 100 mg/L. This leads to higher conversion ratios in Table 4.2 where mainly results from the 7-day test for load 100 mg/L was used.
- ^ ECHA 2017. Guidance for application of CLP criteria. https://echa.europa.eu/documents/10162/23036412/clp_en.pdf/58b5dc6d-ac2a-4910-9702-e9e1f5051cc5
- ^ International Copper Association, 2021. Technical Guidance for the Classification of Copper Metal Under the Globally Harmonized System for Classification and Labelling of Chemicals (GHS), https://copperghs.org/wp-content/uploads/2021/03/Hazard-Classification-of-Copper_Report_Condensed_2021.pdf
Table 4.2. Correlation in release from load 100 mg/l and 1 mg/l at pH 6. The safety factor is here defined as the deviation from the linearly extrapolated value from load 100 mg/L to load 1 mg/L. Units: µg/L.
| Test material | Metal | 1 mg/L, 7 days | 10 mg/L, 7 days | 100 mg/L, 7 days | 1 mg/L, 28 days, background correction | extra: 100 mg/L, 28 d | Ratio (safety factor) | Remark | Reference (see below Table) |
| SRF (ash from combustion of solid recovered fuel) (number of replicates: 3 for load 100 mg/L and 5 for load 1 mg/L) | Cu | 2.22 | 70 | 2.64 | 3.8 | pH adjusted to 6.0 during test solution using HNO3 for 1 mg/L | FINETOX, 2019 i) | ||
| Cu | 80 | see above | 3.3 | pH adjusted to 6.0 during test solutions using HNO3 for both loads | |||||
| Zn | 4 | 150 | 3.2 | 2.1 | pH adjusted to 6.0 during test using HNO3 for 1 mg/L | ||||
| Zn | 143 | see above | 2.2 | pH adjusted to 6.0 during test using HNO3 for both loads | |||||
| Ba | 1.31 | 72 | 1.35 | 1.9 | pH adjusted to 6.0 during test using HNO3 for 1 mg/L | ||||
| Ba | 96 | see above | 1.4 | pH adjusted to 6.0 during test using HNO3 for both loads | |||||
| Pb | (<0.46) | 28 | (<0.32) no background correction | < 1.2 | pH adjusted to 6.0 during test using HNO3 for 1 mg/L | ||||
| Pb | 7 | see above | <5 | pH adjusted to 6.0 during test using HNO3 for both loads | |||||
| Cuprios oxide powder, lab 1 (number or replicates: 3) | Cu | 64.8 | 773 | 3,262 | 175.4 | 5.4 | from report it can be seen that load 100 mg/L was not in steady state at 7 d - NB Ratio 2.0 for comparison of loadings 1 and 100 mg/L from 7 days testing | Skeaff, 2011 ii) | |
| Cuprios ox.powder, lab 2 (3 replicates) | Cu | 206 | 1619 | 4,891 | 574 | 11.7 | load 100 mg/L not steady state at 7 d - NB Ratio 4.2 for comparison of loadings 1 and 100 mg/L from 7 days testing | ||
| Cuprios ox.powder, lab 3 (3 replicates) | Cu | 113 | 869 | 3,797 | 410 | 10.8 | load 100 mg/L not steady state at 7 d - NB Ratio 3.0 for comparison of loadings 1 and 100 mg/L from 7 days testing | ||
| Ni powder, lab 1 (3 replicates) | Ni | 2.5 | 46 | 541 | 1.8 | 0.3 | |||
| Ni powder, lab 2 | Ni | 4.1 | 61.6 | 694 | 6.4 | 0.9 | |||
| Ni powder, lab 3 | Ni | 2.3 | 51 | 444 | 3.9 | 0.9 | |||
| Nickel Matte (Nickel concentrate from ore processed in high temperature process) (triplicates) | Ni | 40.4 | 151 | 754 | 154 | 3,020 | 20.4 | Note calculation can also be made with 28 d results. Ratio is 5.10 using 28 d data for load 100 mg/L | Skeaff, 2015 iii) |
| Cu | 3 | 12.9 | (23) | Data not considered. High spread of triplicate results especially for the load 1 mg/L | |||||
| Nickel concentrate, C132 | Ni | 11 | 183 | 2,330 | 41 | 1.8 | |||
| Nickel concentrate, C133 | Ni | 7.2 | 83 | 842 | 16 | 1,450 | 1.9 | ratio: 1.1 using 28 d data for load 100 mg/L | |
| Nickel concentrate, C134 | Ni | 36 | 307 | 3,400 | 0.5 | 3,260 | 0.01 | ratio: 0.02 using 28 d data for load 100 mg/L | |
| Silica fume, low grade (triplicates for load 100 mg/L) | Cu | <dl | 2.38 | 6.3 | 2.59 | 41.0 | Load 1 mg/L tested at pH 5.5 using HNO3 in pH management. Unclear: number of replicates for load 1 mgL. | Lilliscrap, 2014 iv) | |
| Zn | 9.32 | 54.3 | 532 | 4.56 | 0.9 | see above | |||
| Pb | 0.4 | 6 | 63.5 | 0.642 | 1.0 | see above | |||
| Concentrates of lead and zinc compounds with sulphur resulting from hydro-metallurgy (hot acid leaching, super-hot acid leaching and flotation) | Pb | 12,333 | 362 | 2.9 | ECHA registration dossierv) | ||||
| Zn | 91.4 | 3.2 | 3.5 | ||||||
| Cu | 15.6 | < dl* | |||||||
| Ag | 31.4 | < dl | |||||||
| Cd | 0.056 | < dl | |||||||
| Ni powder | Ni (pH 6) | 24 | 350 | 2.3 | 0.7 | ECHA registration dossier vi) | |||
| Antimony nickel titanium oxide yellow | Ni | 0.6 | 2.8 | 24.6 | 0.48 | 2.0 | ECHA registration dossier vii) | ||
| Copper scale (By-product produced in the rolling of copper wire either in a conventional rod mill or a continuous cast rod mill. Consists of metallic copper, cuprous oxide and cupric oxide) | Cu | 978.8 | 4 | The acute transformation/ dissolution was linearly extrapolated (to 28 days and 1 mg/L loading = divided by 100 and multiplied by 4). | ECHA registration dossier viii) | ||||
| Pb | 1.63 | ||||||||
| *detection limit Sources: i) FINETOX, 2019 ii) Skeaff, J. et al. 2011, Advances in Metals Classification Under the United Nations Globally Harmonized System of Classification and Labelling. Integrated Environmental Assessment and Management — Vol. 7, Number 4, 559–576 iii) Skeaff et al 2015. Transformation/Dissolution Characteristics of a Nickel Matte and Nickel Concentrates for Acute and Chronic Hazard Classification. Integrated Environmental Assessment and Management — Volume 11, Number 1—pp. 130–142 iv) Lillicrap, A., Friede, B., Garmoa, Ø., Macken, A. 2014. Is the transformation/dissolution protocol suitable for ecotoxicity assessments of inorganic substances such as silica fume? Science of the Total Environment 468–469 (2014) 358–367 v) https://echa.europa.eu/bg/registration-dossier/-/registered-dossier/16558/6/2/1 (accessed 14.12.2021) vi) https://echa.europa.eu/fi/registration-dossier/-/registered-dossier/15544/6/1 (accessed 14.12.2021) vii) https://echa.europa.eu/fi/registration-dossier/-/registered-dossier/14367/6/1 (accessed 14.12.2021) viii) https://echa.europa.eu/fi/registration-dossier/-/registered-dossier/14999/6/2/1 (accessed 14.12.2021) | |||||||||
5 Testing of MIBA with the adapted method: assessment of the applicability
5.1 Aim
The applicability of the adapted T/Dp for MIBA was assessed by testing several Nordic ashes. The work also included an interpretation of the test results related to the HP14 classification. Furthermore, the aim was to give suggestions for a final protocol for testing.
5.2 Test programme, materials and used methods
Test programme:
- Testing of the adapted T/Dp with several ashes for the assessment of the applicability of the method. All 9 ash samples were studied for the 7-day test. For 3 samples, a full 28-day test was conducted for comparison of release at 7 days and 28 days.
- Analysis of correlations between the release in the T/Dp and total content for the assessment of HP14 property.
- Evaluation of the repeatability of the protocol by performing chemical analysis of the eluates from all 5 replicates.
Preparation of samples:
- Nine aged MIBA ashes (BA) from Nordic waste-to-energy incineration plants were collected using a detailed sampling scheme to assure representative samples of about 3 kg each. The MIBA sample (henceforth referred to as laboratory sample) was initially homogenized and divided by quartering and using a riffle box to generate representative sub-samples of 100–200 g DM (constituting 5–10% of the original laboratory sample).
- Subsampling: Sub-samples of BA1 to BA5 were sieved to < 1 mm. During sieving, visible pieces of plastic, rubber, steel wires and other scrap were sorted out and removed. The weight of the removed material and the initial sample was recorded. Material too large to pass the sieve mesh was crushed in a ring mill and sieved again. This was repeated until all of the sub-sample passed the mesh. Uncrushable particles were removed and weighed. Subsamples of BA6 to BA9 were divided into two portions of equal size (in mass) and then sieved and crushed as described above, except that a jaw crusher was used instead of a ring mill, and one of the portions was sieved and crushed to <0.25 mm.
To obtain adequate representative test portions, the subsample of 100–200 g was further divided in a centrifugal divider, splitting the sample into eight similarly sized portions. Splitting was carried out until each portion of the centrifugal divider was around 1 g dry matter (DM). From these test samples of ~ 1 g DM, the final sample loads of 100 mg DM were taken (constituting around 10% of a representative size-reduced sub-sample).
Test methods:
- Analysis of the ash composition was done with 2 methods with 2 replicates analysis for each ash sample using the following methods:
- main components (using a lithium borate fusion prior to acid dissolution and ICP analysis according to ASTM D3682: 2013 and ASTM D4503: 2008): Si, Al, Ca, Fe, K, Mg, Mn, Na, P, Ti and additionally Ba, Be, Co, Cr, Nb, Sc, Sr, U, V, Zr
- minor components (using microwave digestion with ICP analysis according to EN 13656:2020): As, Cd, Cu, Hg, Mo, Ni, Pb, S, Sb, Se, Sn, Tl, W, Zn,
- The adapted T/Dp was conducted at the loading 100 mg/L and pH 6 using a buffer medium (see Box 4). Tests were performed with 5 replicates (in a few cases only 3 replicates). For the management of the pH of the test solutions, CO2 injections were added to the test bottle headspace at the start, 2 h, 6 h, 24 h, 4 days, and for the 28-day test additionally at 7 days, 14 and 21 days (after the first tests, a few additional CO2 injections were added after 7 days to secure a final pH of the blank within the pH range 6 + 0.2). The added CO2 was calculated to equal 0.5% of pure CO2 gas in the test bottle headspace. The same pH adjustment methods were used on the ash test samples as for the blanks; however, in ash testing, the alkaline buffering capacity of the ash material pH will steer the pH of the test solution. A photo of the test set up is shown in Figure 5.1.
- A subsample of 15 ml of test solutions was collected at 2 h, 6 h, 24 h, 4 days, and 7 days, and for the prolonged 28-day test also at 14 days, 21 days and 28 days prior to the CO2 injections. No addition of fresh buffer solution was done to adjust the volume. The pH was measured in all the collected subsamples (not in the test vessel owing to the contamination risk). For each ash tested, one replicate was analyzed for Cu, Pb and Zn in all the eluates collected, and from the last collected eluate fraction also Cr, Ni, Fe, Al, Si were additionally analyzed. For the other replicates only Cu, Pb and Zn were analyzed from the eluates collected after 7 and 28-day testing.
- The metal concentrations in the eluates metals were as followed: Al, Cr, Cu, Fe, Ni, Pb, and Zn by mass spectrometer (ICP-MS) according to standard SFS-EN ISO 17294-2 and for Si by optical emission spectrometer (ICP-OES) according to standard SFS-EN ISO 11885. Dissolved oxygen content was not measured, because in the previous FINETOX project with the testing of bottom ashes, it was shown that the dissolved oxygen concentration did not exceed 6 mg/l.
The chemical composition of the tested materials is shown in Annex 1.
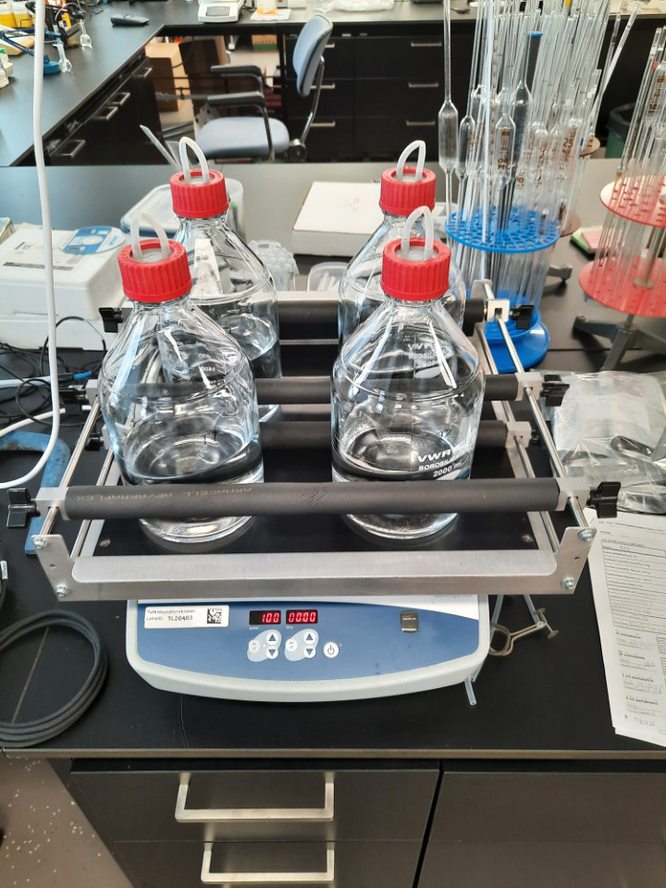
Fig. 5.1 Test apparatus for T/Dp. Photo: VTT. 2021.
The full tests were conducted in three labs as follows: lab 1 (BA samples 1–5); lab 2 (BA samples 6 and 9), and lab 3 (BA samples 7 and 8). Differences in the laboratory practice might influence the results, e.g. quality of ultra-pure water, chemicals, test equipment used (especially gas tightness of bottle cap with gas inlet tubes). The chemical analysis of composition was performed in one laboratory and all eluate analyses in another laboratory (accredited for the analysis).
5.3 Discussion of results
5.3.1 Characterization of original MIBA samples
The average percentage of particles <1 mm for all 9 original MIBA samples was 34%, while the average percentage of particles <0.25 mm was 9.3% (4 MIBA samples) (see Table 5.1). This is comparable to earlier studies (Hälldal 2019[1]Hälldal et al 2019, Development of a test method for evaluation of ecotoxicity (HP14) in municipal solid waste incineration bottom ashes, Avfall Sverige rapport 2019:31.). The average percentage of removed particles >1 mm that was not included in the tests was 1.9%.
The total content of most metals (e.g. As, Co, Cd, and W) that are of importance for classification were low (<100 mg/kg). The calculated theoretical concentration, assuming 100% release, would not exceed any ERVs for these metals. Therefore, the test eluates were analyzed only for metals of concern in the assessment of results from the T/Dp. These metals are Cr, Cu, Ni, Pb, and Zn, all of them exceeding 100 mg/kg. Especially Cu and Zn appeared in high concentrations, over 1 000 mg/kg, in the samples. One ash (BA5) had a higher Pb content than other ashes (Figure 5.2). The results from all the total content analyses are presented in Annex 1.
Footnotes
- ^ Hälldal et al 2019, Development of a test method for evaluation of ecotoxicity (HP14) in municipal solid waste incineration bottom ashes, Avfall Sverige rapport 2019:31.
| Ash sample | <1 mm [%] | <0.25 mm [%] |
| BA1 | 27 | NA*) |
| BA2 | 23 | NA |
| BA3 | 71 | NA |
| BA4 | 62 | NA |
| BA5 | 25 | NA |
| BA6 | 16 | 4.6 |
| BA7 | 28 | 11 |
| BA8 | 34 | 13 |
| BA9 | 21 | 8.5 |
| Average ash | 34 (17) | 9.3 (3) |
| *) not analyzed | ||
Table 5.1. Percentage of particles < 1 mm and < 0.25 mm in original MIBA samples. Standard deviations (SD) are given in brackets.
Fig. 5.2. Content of Cu, Pb, Zn and Cr in tested ashes. All amounts are given in mg/kg dry substance.
5.3.2 28-day test with the loading of 100 mg/L
Two sets of 28-day tests were performed: first, one set within total 8 CO2 injections (BA2:1, BA7 and BA9) and then for ash sample BA2 another with 12 CO2 injections (BA2:2) during the testing time.
The following experience was obtained for the first set: for one blank performed at the same time as the sample testing (here: BA7), the blank criteria was fulfilled (i.e. pH range 5.8–6.2 at the end of the test), whereas for the two other blanks (here blank testing connected to BA2:1 and BA9) the pH values of the blank solutions did not fulfil the blank criteria. The injected amounts of CO2 gas were not sufficient to keep the pH sufficiently low. This can be because some CO2 slowly escaped from the test vessel caps, and as the CO2 injection interval was sparser after 7 days, subse|quent|ly the pH increased. It was concluded that the blanks need to be controlled more often when prolonging the test to 28 days to ensure enough CO2 gas addition.
A new 28-day test with 12 CO2 injections (i.e. 4 extra injections after day 7) was performed for sample BA2[1]Sample code BA2:1 is used for the testing conducted in July 2020 (first set-run) and sample code BA2:2 for the test conducted in December 2021 (second test run), Subsamples BA2:1 and BA2:2 are from different subsamples tubes (containing 1 g sample) collected in the sample division.. The blank (performed during testing of BA2:2) was then within the criteria range.
In the prolonged 28-day test, the pH of the test solutions containing the ash samples increased with time for all three samples tested owing to the buffering capacity of the ashes. At the start of the test, the pH was around 6 in all test solutions. The final pH was 6.5 (BA2:2) and 6.4–6.6 (BA7) with acceptable blank performance and pH around 6.6–6.8 (BA2:1) and 6.7–7.0 (BA9) for tests with insufficient CO2 additions. This means that, with more CO2 additions to BA2-1 and BA9, lower final pH values would likely have been reached, which might result in a somewhat higher metals release.
Footnotes
- ^ Sample code BA2:1 is used for the testing conducted in July 2020 (first set-run) and sample code BA2:2 for the test conducted in December 2021 (second test run), Subsamples BA2:1 and BA2:2 are from different subsamples tubes (containing 1 g sample) collected in the sample division.

Fig. 5.3. pH as a function of time in the T/Dp with the loading of 100 mg/l and 28 days.
Fig. 5.4. Blank testing related to BA2 testing: Management of pH in blank by 3 and 4 additional CO2 injections after 7 days. pH of the blank with 8 and 12 additions at 168 h had the same value and is therefore not visible in the figure.
The release of Cu and Zn in the 28-day full test is illustrated in Fig. 5.5 for three ashes tested with prolonged testing time.
The following conclusions can be drawn:
- blank testing: differences were noted between blanks performed in different laboratories potentially owing to the quality of chemicals in the preparation of buffer solutions and the systems for sealing bottles (potentially leading to small CO2 leakage through the caps). The pH increased with time particularly after 7 days’ test time especially for BA2-1, and BA9 is due to an insufficient amount of CO2 in the test bottle. The blank performed in connection with BA7 had pH values staying in the range of 5.7–5.8, potentially owing to a more closed system. The reasons for differences need to be verified in a follow-up study.
- sample BA2 (both BA2:1 and BA2:2) had higher metal release than BA7 and 9.
- BA7 and BA9: the Cu and Zn concentrations were almost stable after a test duration of 7 days. For BA9, the insufficient CO2 injections (and consequently rise in pH) is therefore assessed not to influence significantly the release of Cu and Zn.
The release of Pb was low (often near detection limit) as well as the concentrations of Ni and Cr measured from the eluates collected after a test duration of 28 days and are not further evaluated.


Fig. 5.5. Leaching kinetics for one replicate in the short-term T/Dp with the load 100 mg/l for sample BA2:2, BA7, and BA9. NB The results in Figure 5.5 cannot be directly compared to chronic ERV for Cu for calculation of TU index values. For comparison to chronic ERVs, the results from the load 100 mg/L need to be extrapolated to the load of 1 mg/L.
5.3.3 Comparison of end pH and metal release from all ash samples
The variations in blank pH between laboratories noted in the 28-day testing indicated that the test set performance influenced the pH values to some extent. Owing to the buffering capacity of the ashes, it is not clear to what extent these differences affected the pH in test solutions with ash samples. It is also unclear if the metal release was affected. The metal release is not only affected by the final pH value of the solution but also by the speciation of metals in the solid phase (e.g. Cu as CuO or Cu metal) and the presence of other minerals in the bottom ashes. To further evaluate this, cross-checking by analyzing the same sample at different laboratories could be performed.
Figure 5.6 shows the pH in the test solutions at the end of the tests. For all ashes, the pH of the test solutions increased during the test duration of 7 days. The pH was in the range of 5.8–6.2 during the first days of the test but typically raised to pH 6.3–6.6 at the end of the test (with two exceptions for samples BA1 and BA7 with a final pH around pH 6.1–6.2). The buffer capacity of the MIBA samples influences the pH values in the test solutions.
In the following paragraphs, only the release of Cu and Zn are discussed, as the measured concentrations of Pb, Ni and Cr were usually near the detection limits.

Fig. 5.6. End pH in test solution replicates. Results from 7-day and 28-day tests included. BA2 sample in Figure corresponds to sample BA2:2. NB Insufficient CO2 additions for BA9-28d
5.3.3.1 Copper
The concentrations of Cu in the test solutions at the end of all the tests are shown in Fig. 5.7. For three ashes, the copper level was around 20–40 µg/l and for the other six ashes below 10 µg/l. There is no clear correlation between the Cu solubility and the total content (Fig. 5.8). The solubility of copper was below 10% with the exception of sample BA2, in which a slightly higher solubility was measured (assessed for 7-day test results) (Table 5.2).

Fig. 5.7. Copper concentration in the test solution (results from 7-day and 28-day tests included. NB The results in the figure cannot be directly compared to ERV for calculation of TU index values. For comparison to chronic ERVs, the results from the load 100 mg/L needs to be extrapolated to the load 1 mg/L. The BA2 sample in the figure corresponds to sample BA2:2.
Fig. 5.8. Correlation between Cu concentration in 7-day and 28-day test solutions and total content.
| Total Cu content, mg/kg*) | Cu concentration in test solution at 7 days (µg/L) | Solubility of Cu (%) (share of total content **) | |
| BA1 | 4,200 | 28 | 7 |
| BA2:2 | 2,600 | 30 | 12 |
| BA3 | 2,600 | 5 | 2 |
| BA4 | 3,400***) | 8 | 2 |
| BA5 | 3,500 | 25 | 7 |
| BA6 | 4,800 | 3 | 1 |
| BA7 | 2,100 | 7 | 3 |
| BA8 | 3,400 | 10 | 3 |
| BA9 | 2,400***) | 10 | 4 |
| *) average content (Appendix 1) **) calculated: released Cu content (considering the liquid-to-solid ratio) divided by the total content. ***) big variations in the two replicates: here only the lower value in the replicate analysis is considered in the calculations. | |||
Table 5.2. Total contents, test concentration and calculated solubility of Cu from different ashes (7-days test).
5.3.3.2 Zinc
The concentrations of Zn in the test solutions at the end of all tests are shown in Fig. 5.9. The Zn concentrations were in the range of 80–300 ug/l. Of the nine studied ashes, six had Zn concentrations <150 ug/l. There is no clear correlation between the Zn solubility and the total content (Fig. 5.10).
Generally, the solubility of Zn was higher than the solubility of Cu. Several ashes exceeded a Zn solubility of 20% but all were < 40%. (Table 5.3)

Fig. 5.9. Zn concentration in the replicate test solutions. Results from both 7-day and 28-day tests included. NB The results in the figure cannot be directly compared to ERV for calculation of TU index values. For comparison to chronic ERVs, the results from the load 100 mg/L need to be extrapolated to the load of 1 mg/L. The BA2 sample in the figure corresponds to sample BA2:2.
Fig. 5.10. Correlation between Zn concentration in 7-day and 28-day test solutions and total content.
| Total content, mg/kg *) | Zn concentration in test solution at 7 days (µg/L) | Solubility of Zn (%) (share of total content **) | |
| BA1 | 3,400 | 98 | 29 |
| BA2-2 | 3,100 | 122 | 39 |
| BA3 | 5,300 | 140 | 27 |
| BA4 | 5,800 | 118 | 21 |
| BA5 | 4,600 | 168 | 36 |
| BA6 | 3,800 | 54 | 14 |
| BA7 | 2,900 | 48 | 20 |
| BA8 | 4,000 | 100 | 25 |
| BA9 | 3,300 | 60 | 19 |
| *) average concentration **) calculated: released Zn content (considering the liquid-to-solid ratio) divided by the total content. | |||
Table 5.3. Solubility of Zn from different ashes.
5.3.4 Repeatability of method
The repeatability calculated as relative standard deviations[1]here: standard deviation divided with mean value is expressed as percentage was analyzed only for the selected elements (Cu, Pb, and Zn ) as these elements are the most important in the classification. As the results for released Pb concentrations were near the detection limit for several ash samples, only results for Cu and Zn are included in Table 5.4. Additionally, only the test results from testing with five replicates are shown.
The results show that the relative standard deviation was under 30%, and for many ashes/elements also under 20% (here test results from replicates taken from the same subsample of 1 gram). Table 5.4 shows the results for tests from two different subsamples from BA2. Otherwise, the variation between subsamples was not tested as the primary focus of the work was to analyze the influence of a few key test conditions.
Footnotes
- ^ here: standard deviation divided with mean value is expressed as percentage
| Sample | Cu (concentration range in bracket, ug/l) | Zn (concentration ranges in bracket, ug/l) |
| BA1 | 8% (25–31) | 14% (85–120) |
| BA2 (7 day test) | 10% (27–35) | 11% (110–140) |
| BA2 (28 day test) | 17% (35–53) | 10% (110–140) |
| BA3 | 12% (4.5–6.2) | 7% (130–150) |
| BA4 | 19% (6.1–9.6) | 11% (110–140) |
| BA5 | 19% (18–30) | 20% (130–220) |
| BA9 (7 day test) | 26% (7–12) | 26% (44–85) |
| BA9 (28 day test) | 26% (5.6–11) | 20% (50–82) |
Table 5.4. Repeatability results (relative standard deviation) for the release of selected elements in the T/Dp with the load 100 mg/l (L/S 10 000) at pH 6 (only results from tests performed with five replicates are included.
In comparison, Skeaff (2011)[1]Skeaff, J. et al. 2011, Advances in Metals Classification Under the United Nations Globally Harmonized System of Classification and Labeling Integrated Environmental Assessment and Management — Volume 7, Number 4—pp. 559–576 has published results from a validation study with three participating laboratories and testing of several samples at different loads and target pH. For example, in the testing of Cu2O at pH 6 with the load of 100 mg/___L, the average relative standard deviation was 21%[2]a sample representing a narrow particle size distribution was tested with three replicates. Analyses have been performed from duplicate eluates withdrawn from test solutions.. The following laboratory-specific data for the relative standard deviation (also called coefficient of variation CV) was reported:
- lab 1: CV 20.1% (mean Cu concentration: 3 300 ug/L)
- lab 2: CV 3.4% (mean Cu concentration 4 900 ug/L)
- lab 3: CV 7.0% (mean Cu concentration 3 800 ug/L)
- Between Labs 1–3: CV 21%, mean Cu concentration 4 000 ug/L)
Ash sample BA2 was analyzed twice owing to an insufficient amount of CO2 injected after 7 days’ testing. This enables comparisons of test results from two subsample tubes from the ash sample division. According to Table 5.5, the pH of the test solutions was identical, probably governed by the high buffering properties of ashes (also concluded in Appendix 2). The Cu and Pb concentrations were in a similar range, whereas for Zn a higher release was measured in the testing of BA2:1. The higher average release for Zn is owing to two replicates (subsample BA2:1; R1 and R4) deviating with a high release level. This high Zn level of the replicate R4 corresponds to almost a 100% release from the total content. The reason for the higher release in one sample not clear, it might be due to contamination or sample heterogeneity.
Footnotes
- ^ Skeaff, J. et al. 2011, Advances in Metals Classification Under the United Nations Globally Harmonized System of Classification and Labeling Integrated Environmental Assessment and Management — Volume 7, Number 4—pp. 559–576
- ^ a sample representing a narrow particle size distribution was tested with three replicates. Analyses have been performed from duplicate eluates withdrawn from test solutions.
| pH in test solution at 7d | Cu conc. in test solution at 7 d, µg/L | Pb conc. in test solution at 7 d, µg/L | Zn conc. in test solution at 7 d, µg/L | |||||
| Subsample BA2:1 | Subsample BA2:2 | Subsample BA2:1 | Subsample BA2:2 | Subsample BA2:1 | Subsample BA2:2 | Subsample BA2:1 | Subsample BA2:2 | |
| R1 | 6.40 | 6.37 | 33 | 29 | 0.7 | 0.5 | 230 | 110 |
| R2 | 6.36 | 6.44 | 38 | 29 | 1.8 | 1.9 | 150 | 140 |
| R3 | 6.43 | 6.36 | 39 | 35 | 1 | 0.8 | 200 | 110 |
| R4 | 6.42 | 6.45 | 35 | 29 | 1.3 | 0.6 | 300 | 120 |
| R5 | 6.44 | 6.41 | 31 | 27 | 1.8 | 0.6 | 130 | 130 |
Table 5.5. Test results from two subsamples from BA2. (BA2-1 performed in July 2021 and test BA2-2 in December 2021, samples taken from different sample tubes in sample division)
5.3.5 Calculation of TU index for considering additive effects
For assessment of the aquatic toxicity related to H413, the concentration corresponding to the load 1 mg/L is divided with the chronic ERV value. The authorities (representatives for national agencies for chemicals) recommend the use of the TU index to account for the additive effects of different loads of metals when assessing the results of the T/Dp. The calculation equations are presented in Section 3.3.
The total analysis based on the use of microwave acid (HNO3/HCl/HF) digestion (EN 13656:2020) is regarded to represent the upper limit of released metals in the test conditions.
5.3.5.1 The use of composition data for calculation of theoretical maximum TU index
The simplest approach is to use the composition data of the material of interest, here MIBA, for the calculation of the TU index (see Eq. 1 in Box 7). In these calculations, it is assumed that metals are released to 100%. This is unrealistic but offers a simple way to predict the theoretical maximum concentrations at the load 1 mg/L.
In this context, the need to include also other metals than the ones in focus in the present study was evaluated. The evaluation was based on available data from another study on chemical composition of bottom ashes. Theoretical calculations based on the same approach (i.e. assuming 100% metal release) were done using data for a very conservative bottom ash (95% percentile of >1 500 fresh or aged bottom ash samples for Cr, Cu, Ni, Pb, and Zn among other metals reported by Hjelmar et al. (2013[1]Hjelmar et al., HP classification of European incinerator bottom ash. Part 1: Compilation of data on IBA composition and leaching properties. Part 2: Assessment of hazardous properties of IBA; 2013.)) and indicate that the theoretical concentrations would induce a classification as hazardous waste. This is not surprising as this was calculated for conservative ash with high total amounts. However, from this calculation, it is also clear that most elements would not much influence the classification, even though assuming 100% release. Only, Cu, Pb, and Zn, and to some extent, Ni and potentially Cr, are the metals of concern. To get information about the potential mobility of different metals, data from actual release in extreme conditions could be used, e.g. from extractions in low-pH values (Hälldal 2019[2]Hälldal et al 2019, Development of a test method for evaluation of ecotoxicity (HP14) in municipal solid waste incineration bottom ashes, Avfall Sverige rapport 2019:31.). This likely overestimates the actual release at pH 6, i.e. the pH used in the T/Dp, but gives indications about the maximum release.
The calculated theoretical TU index values for the samples used in this study are compiled in Table 5.6. Based on the total composition data, i.e. assuming 100% release, the calculated TU indices for two ashes (BA7 and BA9) do not exceed 1 and the ashes are not classified as ecotoxic (and consequently not hazardous based on ecotoxic properties). If assuming that 80% of the total metal contents are released, then in total, three out of nine ashes have TU index values below 1 (i.e. non-hazardous waste concerning HP14), and if assuming 50% release, eight ashes pass the limit and one ash BA5 has a TU value of exactly 1,0.
Table 5.6. Theoretical toxic unit values for different ash samples based on total content and assuming release between 50 and 100%. Results with TU<1 means non-hazardous waste classification for HP14 and are marked with bold text.
Example of calculation for sample BA9: Zn content in the ash (3 300 mg/kg) gives the maximum eluate concentration of 3.3 µg/l in case of 100% release of Zn. The theoretical maximum individual toxic unit value for Zn is calculated by dividing the maximum concentration with the chronic ERV for Zn (17 µg/l) giving the value 0.19.
| Individual TU index | Sum TU index (assuming 100% release) | Sum TU index (assuming 80% release) | Sum TU index (assuming 50% release) | |||||
| Cr | Cu | Ni | Pb | Zn | ||||
| Ecological reference values (chron ERV),µg/l | Cr(III) oxide not toxic(ref 1) PNEC 6.5 (ref 2) | 8.7 (ref 3) | 2.3 (ref 4) | 1.7 (ref 5) | 17 (ref 6) | |||
| BA1 | 0.17 | 0.49 | 0.32 | 0.55 | 0.20 | 1.7 | 1.4 | 0.9 |
| BA2 | 0.10 | 0.36 | 0.07 | 0.54 | 0.18 | 1.3 | 1.01 | 0.6 |
| BA3 | 0.09 | 0.30 | 0.08 | 0.45 | 0.31 | 1.2 | 0.97 | 0.6 |
| BA4 | 0.13 | 0.67*) | 0.14 | 0.50 | 0.34 | 1.8 | 1.4 | 0.9 |
| BA5 | 0.14 | 0.40 | 0.19 | 1.03 | 0.27 | 2.0 | 1.6 | 1.02 |
| BA6 | 0.08 | 0.56 | 0.12 | 0.39 | 0.22 | 1.4 | 1.1 | 0.7 |
| BA7 | 0.11 | 0.24 | 0.09 | 0.32 | 0.17 | 0.9 | 0.7 | 0.5 |
| BA8 | 0.16 | 0.54*) | 0.10 | 0.51 | 0.24 | 1.6 | 1.2 | 0.8 |
| BA9 | 0.08 | 0.28 | 0.06 | 0.28 | 0.19 | 0.9 | 0.7 | 0.4 |
| *) both replicates in Cu analysis noted, even if high differences in concentrations in replicates See Appendix 1. 1) https://echa.europa.eu/registration-dossier/-/registered-dossier/15477/6/2/1 2) https://echa.europa.eu/registration-dossier/-/registered-dossier/15551/6/1 3)ECHA 2018. Committee for Risk Assessment RAC Opinion proposing harmonized classification and labelling at EU level of Granulated copper. Adopted June 8, 2018. https://echa.europa.eu/documents/10162/a24da89e-b62f-a4f4-890b-d88f392c3ec8. Accessed 2018-11-26 4)ECHA dossier for Nickel: https://echa.europa.eu/fi/registration-dossier/-/registered-dossier/15544/6/1 5)Committee for Risk Assessment. 2015. Opinion proposing harmonized classification and labelling at EU level of Silver zinc zeolite. Adopted 4 December 2015. ECHA Committee for Risk Assessment https://echa.europa.eu/documents/10162/ce343f0e-623b-7678-586e-613dffbcfe06. Accessed 2018-11-26 6)Committee for Risk Assessment. 2015. Opinion proposing harmonized classification and labelling at EU level of Silver zinc zeolite. Adopted 4 December 2015. ECHA Committee for Risk Assessment https://echa.europa.eu/documents/10162/ce343f0e-623b-7678-586e-613dffbcfe06. Accessed 2018-11-26 | ||||||||
5.3.5.2 Extrapolation of data from 100 mg/L to 1 mg/L
As discussed above, testing of MIBA using the load 1 mg/L is not feasible and thus extrapolation of the results from load 100 mg/L is an alternative. The extrapolation and the assessment of the results from the load 100 mg/L to 1 mg/L were done as follows:
- Check that solutions were not saturated concerning anticipated Cu, Pb and Zn (see Box 8) at the higher 100 mg/L load. The calculations did not indicate that mineral saturation should be a problem for extrapolation. The measured concentrations from the load 100 mg/L were divided by a dilution factor of 100 to reach the theoretical concentration of 1 mg/L.
- A safety factor was included when estimating the concentration at 1 mg/L to consider the potential higher mobility at the lower load. Safety factors of 5, 10, and 15 have been used for assessment. The value of the safety factor is further discussed in Section 4.4.
- The calculated concentrations were compared to the ERV values (i.e. chronic toxicity using NOEC values for respective metals). For Cu, the target pH (and not the end pH) was used in the selection of ERV value as the ERVs differ with pH.
5.3.5.3 Use of data from the adapted T/Dp
In the present project, the calculated TU index values for the ashes tested for 28 days are compiled in Table 5.7 using different safety factors ranging from 5 to 15. The chosen safety factors correspond to the calculated correlations in concentrations, as shown in Table 4.2. When using the highest safety factors, in some cases, e.g. for Zn and Cu, the extrapolated values needed to be corrected as the calculated concentrations at load 1 mg/L are higher than theoretically possible if assuming 100% release due to the total contents, i.e. the total amount of each metal sets the theoretically highest value for the safety factor. This indicates the upper limits in using a too high safety factor to account for the uncertainty in leaching properties in very diluted solutions compared to less diluted, i.e. 1 mg/L vs 100 mg/L.
For simplicity, the project group proposes the use of a common safety factor for all elements. A reasonable value would be 5 or 10. The rationale for this is as follows:
- in Table 4.2, the available published data varied generally between <1 and 5, and
- a safety factor above 5 or 10 leads to concentrations over the total content (especially for Zn and sometimes for Cu)
On this basis, the project group suggests the use of a safety factor of 5 for the full 28-day test. Based on our results, the release at 7 days is in general similar to the release at 28 days. However, data is limited. It is therefore proposed that a safety factor of 10 could be indicatively used for the extrapolation of the 7-day test results to cover the potentially higher release after 28 days. The choice of safety factors could be re-evaluated when more experience is available. The results in Table 5.7 and 5.8 show that all the calculated TU results using a safety factor of 5 and 10 are below value 1, which means that none of the ashes is classified for aquatic toxicity or as hazardous based on the HP14 property.
| Suggested safety factor | Individual TU index | Sum TU index | |||||
| Cr | Cu | Ni | Pb | Zn | |||
| Results from 28-day test | |||||||
| BA2:2-28 d | 5 | <0.01 | 0.24 | 0.07 | 0.02 | 0.18 | 0.5 |
| BA2:2-28 d | 10 | <0.01 | 0.36 | 0.07 | 0.03 | 0.18 | 0.7 |
| BA2:2-28 d | 15 | <0.02 | 0.36 | 0.07 | 0.05 | 0.18 | 0.7 |
| BA7-28 d | 5 | < 0.01 | 0.04 | 0.05 | <0.01 | 0.17 | 0.3 |
| BA7-28 d | 10 | < 0.01 | 0.08 | 0.09 | 0.01 | 0.17 | 0.4 |
| BA7-28 d | 15 | < 0.01 | 0.13 | 0.09 | 0.01 | 0.17 | 0.4 |
| BA9- 28 d | 5 | < 0.01 | 0.05 | 0.01 | 0.07 | 0.19 | 0.3 |
| BA9- 28 d | 10 | < 0.01 | 0.10 | 0.03 | 0.15 | 0.20 | 0.5 |
| BA9- 28 d | 15 | < 0.01 | 0.15 | 0.04 | 0.22 | 0.20 | 0.6 |
Table 5.7. Calculated toxicity units (TU) for results from the 28-day test at load 100 mg/L converted to load 1 mg/L (by using a dilution factor of 100 and different safety factors, i.e. 5-15). Numbers in yellow are from Table 5.6 (boundary condition; 100% release calculated from total content).
| Safety factor | Individual TU index | Sum TU index | |||||
| Cr | Cu | Ni | Pb | Zn | |||
| ”Indicative results from 7 days test” | |||||||
| BA1 | 5 | 0.00 | 0.16 | 0.04 | 0.02 | 0.20 | 0.4 |
| BA1 | 10 | 0.00 | 0.32 | 0.07 | 0.05 | 0.20 | 0.6 |
| BA1 | 15 | 0.00 | 0.48 | 0.11 | 0.07 | 0.20 | 0.9 |
| BA2:2 | 5 | NA*) | 0.17 | NA | 0.03 | 0.18 | 0.4 |
| BA2:2 | 10 | NA | 0.34 | NA | 0.05 | 0.18 | 0.6 |
| BA2:2 | 15 | NA | 0.36 | NA | 0.08 | 0.18 | 0.6 |
| BA3 | 5 | 0.00 | 0.03 | 0.01 | 0.01 | 0.31 | 0.4 |
| BA3 | 10 | 0.01 | 0.06 | 0.03 | 0.01 | 0.31 | 0.4 |
| BA3 | 15 | 0.01 | 0.09 | 0.04 | 0.02 | 0.31 | 0.5 |
| BA4 | 5 | 0.01 | 0.04 | 0.02 | 0.01 | 0.34 | 0.4 |
| BA4 | 10 | 0.01 | 0.09 | 0.05 | 0.01 | 0.34 | 0.5 |
| BA4 | 15 | 0.01 | 0.13 | 0.07 | 0.02 | 0.34 | 0.6 |
| BA5 | 5 | 0.00 | 0.15 | 0.03 | 0.09 | 0.28 | 0.5 |
| BA5 | 10 | 0.00 | 0.29 | 0.07 | 0.17 | 0.28 | 0.8 |
| BA5 | 15 | 0.01 | 0.40 | 0.10 | 0.26 | 0.28 | 1.03 |
| BA6 | 5 | NA | 0.02 | NA | 0.01 | 0.16 | 0.2 |
| BA6 | 10 | NA | 0.04 | NA | 0.01 | 0.22 | 0.3 |
| BA6 | 15 | NA | 0.06 | NA | 0.02 | 0.22 | 0.3 |
| BA7 | 5 | 0.00 | 0.04 | 0.05 | 0.00 | 0.17 | 0.3 |
| BA7 | 10 | 0.00 | 0.08 | 0.09 | 0.00 | 0.17 | 0.3 |
| BA7 | 15 | 0.00 | 0.12 | 0.09 | 0.01 | 0.17 | 0.4 |
| BA8 | 5 | NA | 0.06 | NA | 0.01 | 0.24 | 0.3 |
| BA8 | 10 | NA | 0.11 | NA | 0.01 | 0.24 | 0.4 |
| BA8 | 15 | NA | 0.17 | NA | 0.02 | 0.24 | 0.4 |
| BA9 | 5 | NA | 0.01 | NA | 0.03 | 0.18 | 0.3 |
| BA9 | 10 | NA | 0.11 | NA | 0.06 | 0.20 | 0.4 |
| BA9 | 15 | NA | 0.17 | NA | 0.08 | 0.20 | 0.4 |
| *) not analyzed | |||||||
Table 5.8. Calculated toxicity units (TU) based on results from 7-day test with load 100 mg/L. Values marked with yellow are values calculated from total content. The value marked in bold exceeds the TU value of 1.
6 Conclusions and suggestions for further studies
6.1 General issues
In the assessment of aquatic toxicity, it is important to consider both
- the applicability and modification needs of the T/Dp in addition to a correct understanding of the test conditions, and
- the interpretation of the UN GHS Annex 9 scheme for ashes, especially with focus on the load.
As presented in Section 3.2, the assessment scheme (Fig 3.2) is connected to the load in the testing. For poorly soluble metals and metal compounds, the T/Dp only recommends the testing with the load of 100 mg/L for assessment of H412 classification, but it leaves the need for H413 classification open. For the removal of H413, test results related to the load of 1 mg/L are needed. A load of 1 mg/L is not suitable for MIBA, as discussed in several contexts in this report.
6.2 Proposed adapted T/Dp test method
An adapted T/Dp test method has been developed as one tool for the assessment of MIBA as non-hazardous or hazardous according to HP14 (aquatic toxicity).
The proposed adapted test method is based on studying the release using a load of 100 mg/L. In Sections 2.3 and 2.4, critical issues related to the testing of ashes are reviewed. The choices for the test conditions are selected from the experimental work described in Section 4.
The most critical choices are the pH management system, the grain size of the ash and the choice of a safety factor for extrapolation of the results from load 100 mg/L to load 1 mg/L.
A summary of the test conditions is presented in Table 6.1 and a full description of the adapted T/Dp is presented in Annex 4.
Table 6.1. Test conditions in the adapted T/Dp.
| Condition | Adapted T/Dp | Rationale |
| Grain size | 1 mm | 1 mm more representative size, small particles of uncrushable metals are included (see 4.3). |
| Target pH in test solution | pH 6 | Maximum release of metals within the stipulated pH range. |
| Sample amount in test (“load”) | 100 mg/L | Testing at loads 1 mg/L and 10 mg/L is not suitable for testing heterogeneous waste. Results from load 100 mg/L are together with a safety factor used to extrapolate concentration to load 1 mg/L for assessment. |
| Test duration | 7 or 28 days | Prolonging of test time to 28 days is linked to the test time required for 1 mg/L for removal of H413. Later a correlation between 7 and 28-day testing will be further studied to shorten the test time if possible. According to the T/Dp: test time can be shortened if a steady-state condition is fulfilled or it can be proven that a maximum release is achieved earlier than 28 days. |
| Test vessel size | 2 L | 2 L gives more stable test conditions compared to a 1 L vessel |
| Temperature | 19–25 oC | Same temperature range as in waste testing, diffusion release is not crucial for ashes. |
| Test medium (buffer medium) | Buffer solution pH 6 adding CO2 in headspace with certain time intervals during test duration | CO2 additions in connection with start and test solution sampling 2 h, 6 h, 1 d, 4 d, 7 d, 14 d, 21 d and additional CO2 additions if required owing to potential increase in pH in blanks (e.g. CO2 additions around 11 d, 17 d, 24 d and potentially one to two other additions if needed) |
| Oxygen in test solution | Min 6 mg/L | > 6 mg/L in VTT earlier study, FINETOX-project58 |
| DOC in buffer media | Max 2 mg/L | Not relevant, pro analysis chemicals used in preparation of buffer solutions |
| Agitation | Gentle | Avoidance of agglomeration/abrasion. In the study, gentle agitation with an orbital shaker (100 rpm) was used |
| Subsampling of eluate | 12 ml/ 4 times (7 days) or 7 times (28-day test) | No compensation for withdrawn eluates. pH values measured from all collected eluates and metal concentrations in eluates from replicates corresponding to 7 and 28-day testing. Recommended that key metal concentrations analyses from all eluates are collected from one replicate. |
| Replicates | 5 replicates | The number of replicates might be decreased when more data is available. |
| Blanks | 1 /test set | pH measured from blanks during test duration from subsamples collected for metal analysis to ensure that sufficient CO2 was added in the headspace. Blank testing to check contamination. The acceptable pH variance of blank test solution at the end of the test 6 + 0.2 |
[1]Margareta Wahlström, Tommi Kaartinen, Suvi Jokinen, Jutta Laine-Ylijoki. 2019. Hazardous waste classification - Assessment of hazardous property “ecotoxic” with focus on ashes. Finnish Environmental Pool 2019
Footnotes
- ^ Margareta Wahlström, Tommi Kaartinen, Suvi Jokinen, Jutta Laine-Ylijoki. 2019. Hazardous waste classification - Assessment of hazardous property “ecotoxic” with focus on ashes. Finnish Environmental Pool 2019
6.2.1 Scope of the methods
The test method has been developed for sorted and aged MSWI bottom ashes, i.e. MIBA containing sparingly soluble metal compounds.
The focus of the adapted T/Dp is on metals that may occur as compounds which can be classified as H400, H410-413. The term "sparingly soluble metal compounds" is by OECD defined as compounds for which solubility product can be calculated. It can also from Figure 3.2 be linked to cases where the release from a sample at loads 1 mg/L and 10 mg/L do not trigger the acute ERVs.
6.2.2 Limitations
This work has been focused on the development of a test method for the HP14 classification of MIBA ashes. Consequently, the project group lacks knowledge of whether the proposed method can be directly applied for other waste streams, such as other ash fractions from energy production, organic wastes, or metallurgical sludges. For these streams, the whole method must be reviewed before using it. As the focus in this HP14 project was on MIBA ashes, the data mapping on T/Dp results in the literature and ECHA registration dossiers for setting the safety factor was limited only to metals potentially critical in the MIBA ashes. Further studies need to be conducted to check the correlations for additional metals present in other materials.
The described method only considers the release of metals. The potential release of other substances (organic pollutants) in the HP14 assessment is not considered here, as only the metal release has been considered critical for MSWI bottom ashes.
6.3 Assessment approaches
For the HP14 assessment, the final results are presented as the toxic unit (TU) index, where the waste is classified as ecotoxic if the TU value exceeds 1. The TU index is calculated from the single released metal concentrations, either theoretically calculated (approach A) or measured (approach B), divided by the corresponding ERVs, which are summed up to reach the final TU value. Future changes in ERVs might influence the classification.

Fig. 6.1. Approaches in the assessment of HP14 properties using CLP methodology.
6.3.1 Approach A
Probably the easiest but also the most conservative approach in the assessment of H413 is to perform calculations based on the total amounts of the metals of interest (As, Be, Cd, Cr, Cu, Hg, Ni, Pb, Sb, Se, Ti, Tl, U, and Zn), assuming 100% release of all metals at different loads (here: 1 mg/L – 100 mg/L). These concentrations can be compared to ERVs to identify the metals of concern. To analyze the total content, the project group suggests the use of microwave acid (HNO3/HCl/HF) digestion (EN 13656: 2020). Metals that are not released in the acid digestion are not considered to be available for release in the T/Dp. When using this approach for the MIBA samples in this study, two out of nine ashes could directly be classified as non-hazardous according to HP14 owing to their relatively low total amounts. If 80% release were assumed, three out of nine ashes resulted in TU<1. To conclude, a direct calculation based on theoretical release is an easy approach but would strongly overestimate the hazardous properties of the ash.
6.3.2 Approach B
For the assessment of H413, released concentrations from load 1 mg/L are needed. As testing at load 1 mg/L is not feasible, the concentrations are suggested to be extrapolated from a test conducted with the load of 100 mg/L with a prolonged test duration of 28 days (instead of the test duration time of 7 days used for H412). The test can be stopped earlier if a steady-state condition is fulfilled, or it can be proven that a maximum release is achieved earlier. The adapted T/Dp is presented in detail in Annex 4. Here the knowledge from the literature review has been considered together with experience from the ash testing presented in Sections 4 and 5.
The result from the 28-day test is divided by 100, but owing to the elimination of uncertainty related to the potential non-linear correlation between releases from loads of 100 and 1 mg/L, a safety factor of 5 is suggested to be used (for a shorter test of 7 days, a safety factor of 10 is indicatively proposed). For the TU index value calculation, the extrapolated release values for load 1 mg/L are compared to chronic ERV. If the sum of single TU value is below the value 1, then the H413 classification can be removed, and the waste is classified as non hazardous for HP14 (aquatic toxicity).
Approach B requires that minerals containing the hazardous elements are not saturated or oversaturated. In Chapter 5, the saturation index-values (SIs) were checked from the test eluate collected at the end of the test. All the minerals investigated were undersaturated except for franklinite. The solubility of franklinite is very low and calculations of franklinite solubility in leachates give concentrations well below ERV values at pH 6. However, the possible saturation/oversaturation of additional minerals may need to be evaluated.
6.4 Lessons learned during testing
During the experimental work, the following observations of high importance were made:
- Owing to the measurement of low concentrations (e.g. requirement on detection limit for 0.2 µg/l for Pb and Cu, and 2 µg/l for Zn), high purity and quality of all equipment and material used in the experiments are crucial.
- Analyses of metals in blank tests are important. In the buffer medium preparation, contamination of low levels of Zn was detected in some cases. This can result from impurities in the salts added when preparing the buffer media. The same observations have been reported previously, e.g. by Lillicrap (2014)[1]Lillicrap, A., Friede, B., Garmoa, Ø., Macken, A. 2014. Is the transformation/dissolution protocol suitable for ecotoxicity assessments of inorganic substances such as silica fume? Science of the Total Environment 468–469 (2014) 358–367. Low concentrations of elements such as Zn can also be a result of contamination from the filter membrane (see Hedberg et al 2011)[2]Risks of using membrane filtration for trace metal analysis and assessing the dissolved metal fraction of aqueous media – a study on zinc, copper and nickel, by Y. Hedberg, G. Herting, and I. Odnevall Wallinder, Environmental Pollution, 159(5), 1144–1150, (2011).
- It is important that a blank test is performed prior to sample testing to check on the appropriate intervals for CO2 gas addition in the 28-day test (e.g. owing to gas leakage through tubes in the cap of the test bottle a few additional injections might be needed).
- The adapted T/Dp is a rather simple, however time consuming, test method but requires good laboratory practice owing to high contamination risks (e.g. extensive cleaning procedures of test equipment prior to testing, or always use of new glass bottles to avoid contamination).
- Guidance needed on sample preparation: especially the small sample portion is critical and requires a lot of attention during sample preparation. Here material-specific guidelines are needed.
- Transparency in method discussion and test methodology selection creates trust and also fair competition in waste management.
Footnotes
- ^ Lillicrap, A., Friede, B., Garmoa, Ø., Macken, A. 2014. Is the transformation/dissolution protocol suitable for ecotoxicity assessments of inorganic substances such as silica fume? Science of the Total Environment 468–469 (2014) 358–367
- ^ Risks of using membrane filtration for trace metal analysis and assessing the dissolved metal fraction of aqueous media – a study on zinc, copper and nickel, by Y. Hedberg, G. Herting, and I. Odnevall Wallinder, Environmental Pollution, 159(5), 1144–1150, (2011)
6.5 Next steps
In this project, the T/Dp has been adapted for ashes, specifically MIBA, following the CLP principles. The study also provides a knowledge base upon which a harmonized approach in the HP14 classification can be built.
The next step is to validate the adapted method by testing the same ash in several laboratories to get information on potential deviations in test performance, and if needed include further specifications in the test procedure. From the results and experience gained from the validation study, the test method conditions can be finalized. Attention needs to be paid to the potential slow leakage of CO2 from test bottles, which is believed to have caused variations in the pH values of the blanks. At the same time, the undersaturation of minerals containing the metals of concern could be further confirmed to ensure that this is not a problem for extrapolation. Such calculations should, if possible, include additional minerals to the ones checked in this study.
In addition to including further ash samples in the testing for more data on the performance of ashes using the adapted T/Dp in the waste classification, more data on metal release after 7 vs 28 days is needed to verify if the shorter testing time is sufficient or not. Further discussions are also needed on the benefits of regular testing and the need for the development and adoption of simpler methods for regular controls. Here the composition analysis in combination with a targeted speciation method can provide sufficiently reliable information for hazardous waste classification.
Hazardous waste classification is linked to regulatory measures, and often wastes are transported across borders for treatment or recycling. Here comparisons to methods created in other countries could be valuable to understand what types of risks are covered by different methods.
Not only the method but also the procedures for collection and preparation of representative samples need attention.
The applicability of the test method for other wastes than MIBA is to be considered.
APPENDIX 1: Chemical composition of ash samples (replicate analysis)
Major elements (mg/kg)
| ELEMENT | SAMPLE | BA1-1 | BA1-2 | BA2-1 | BA2-2 | BA3-1 | BA3-2 | BA4-1 | BA4-2 | BA5-1 | BA5-2 | BA6-1 | BA6-2 | BA7-1 | BA7-2 | BA8-1 | BA8- | BA9 1 | BA9-2 |
| Dry matter | % | 99.1 | 99.1 | 98.8 | 98.8 | 94.5 | 94.2 | 88.8 | 88.6 | 98.1 | 98.2 | 98.7 | 98.7 | 97.4 | 97.6 | 92.5 | 92.3 | 89.3 | 89.2 |
| SiO2 | % DM*) | 43.8 | 44.8 | 41.7 | 41.1 | 36.2 | 35.7 | 36.8 | 34 | 39.6 | 40 | 39.5 | 41.1 | 47.6 | 43.8 | 46.4 | 44.7 | 35.3 | 39 |
| Al2O3 | % DM | 10.5 | 10.8 | 8.65 | 8.86 | 11 | 10.8 | 11.7 | 11 | 8.98 | 9.26 | 9.65 | 10.3 | 7.47 | 6.88 | 10.5 | 10.2 | 9.12 | 10.1 |
| CaO | % DM | 10.9 | 10.3 | 17.7 | 17 | 17 | 15.8 | 14.9 | 14.1 | 14.7 | 14.2 | 14.3 | 15.1 | 15.8 | 14.3 | 17 | 16.6 | 14.4 | 15.9 |
| Fe2O3 | % DM | 16.4 | 15.4 | 14.3 | 13.2 | 10.4 | 10.6 | 15.2 | 14.6 | 15.5 | 15.1 | 12.6 | 13.1 | 14.5 | 13.6 | 16 | 15.5 | 15.8 | 17 |
| K2O | % DM | 1.47 | 1.46 | 0.831 | 0.907 | 1.45 | 1.34 | 1.35 | 1.32 | 1.06 | 1.04 | 1.44 | 1.54 | 1.08 | 1.03 | 1.32 | 1.27 | 1.34 | 1.38 |
| MgO | % DM | 1.86 | 1.88 | 1.93 | 1.89 | 2.02 | 1.93 | 1.71 | 1.59 | 2.29 | 2.3 | 1.83 | 1.95 | 1.63 | 1.49 | 2.13 | 2.09 | 1.63 | 1.82 |
| MnO | % DM | 0.147 | 0.171 | 0.151 | 0.153 | 0.158 | 0.157 | 0.17 | 0.187 | 0.271 | 0.245 | 0.151 | 0.146 | 0.141 | 0.144 | 0.196 | 0.182 | 0.169 | 0.189 |
| Na2O | % DM | 2.74 | 2.81 | 2.7 | 2.71 | 2.36 | 2.29 | 2.43 | 2.28 | 4.25 | 4.24 | 2.52 | 2.67 | 2.3 | 2.12 | 3.48 | 3.68 | 3.28 | 3.62 |
| P2O5 | % DM | 0.904 | 0.957 | 0.811 | 0.824 | 1.37 | 1.4 | 1.15 | 1.28 | 0.886 | 0.891 | 0.981 | 1.02 | 0.716 | 0.756 | 0.94 | 0.874 | 1.21 | 1.27 |
| TiO2 | % DM | 1.69 | 1.63 | 1.29 | 1.22 | 1.5 | 1.44 | 1.19 | 1.12 | 1.23 | 1.24 | 1.17 | 1.24 | 1.05 | 0.922 | 1.92 | 1.86 | 1.17 | 1.22 |
| Sum | % DM | 90.4 | 90.2 | 90.1 | 87.9 | 83.5 | 81.5 | 86.6 | 81.5 | 88.8 | 88.5 | 84.1 | 88.2 | 92.3 | 85 | 99.9 | 97 | 83.4 | 91.5 |
| LOI 1000oC **) | % DM | 2.5 | 2.6 | 3 | 3.1 | 8.3 | 8.4 | 7.5 | 7.4 | 2.8 | 2.7 | 5 | 5 | 5.3 | 5.3 | 4.6 | 4.7 | 6.2 | 6.3 |
| *) DM = dry matter, **) LOI = Loss of ignition | |||||||||||||||||||
Appendix 1, cont.
Minor elements (mg/kg)
| ELEMENT | SAMPLE | BA1-1 | BA1-2 | BA2-1 | BA2-2 | BA3-1 | BA3-2 | BA4-1 | BA4-2 | BA5-1 | BA5-2 | BA6-1 | BA6-2 | BA7-1 | BA7-2 | BA8-1 | BA8-2 | BA9 1 | BA9-2 |
| As | mg/kg DM | 23.5 | 21.4 | 29.4 | 29.2 | 14.5 | 17.3 | 17.8 | 17 | 22.3 | 29 | 31.6 | 30.7 | 26.5 | 26.8 | 38.6 | 39.4 | 18.8 | 20 |
| Ba | mg/kg DM | 3200 | 3240 | 1680 | 1580 | 2170 | 2120 | 2130 | 1940 | 2290 | 2350 | 1620 | 1770 | 1800 | 1620 | 2880 | 2490 | 1420 | 1620 |
| Be | mg/kg DM | 2.21 | 1.7 | 4.26 | 2.8 | 2.3 | 1.83 | 5.33 | 2.03 | 0.833 | <0.5 | 1.15 | 1.68 | 1.29 | 1.41 | <0.5 | 2.05 | 1.75 | 1.5 |
| Cd | mg/kg DM | 3..02 | 2..15 | 3.68 | 4.44 | 8.4 | 3.99 | 10.6 | 9.55 | 5.4 | 4.54 | 5.95 | 2.79 | 9.08 | 2.87 | 6.12 | 5.14 | 2.84 | 2.15 |
| Co | mg/kg DM | 325 | 268 | 33.5 | 53.5 | 396 | 91.6 | 134 | 87.5 | 99.3 | 107 | 46.4 | 63.5 | 45.1 | 38.8 | 72.5 | 57.5 | 96.2 | 68.6 |
| Cr | mg/kg DM | 977 | 1170 | 637 | 723 | 580 | 533 | 928 | 751 | 987 | 831 | 517 | 553 | 720 | 679 | 890 | 1130 | 465 | 578 |
| Cu | mg/kg DM | 3960 | 4490 | 3700 | 2580 | 2560 | 2610 | 3410 | 8230 | 3670 | 3240 | 5520 | 4150 | 1960 | 2150 | 7290 | 3370 | 2720 | 2120 |
| Hg | mg/kg DM | <0.05 | 0.132 | <0.05 | <0.05 | <0.05 | <0.05 | <0.05 | <0.05 | <0.05 | <0.05 | <0.05 | 0.0845 | <0.05 | 0.0938 | <0.05 | <0.05 | 0.0651 | <0.05 |
| Mo | mg/kg DM | 45.4 | 177 | 14.7 | 13.3 | 15.8 | 14 | 18.9 | 20.9 | 53.9 | 35.6 | 27.7 | 33.7 | 18.9 | 17.1 | 23.1 | 25.2 | 11.2 | 12.3 |
| Nb | mg/kg DM | 14.2 | 14.1 | 9.74 | 9.48 | 19.3 | 11.9 | 17.9 | 10.4 | 11.2 | 10.8 | 13.3 | 13.9 | 11.1 | 10.4 | 16.1 | 14.6 | 12.1 | 13.1 |
| Ni | mg/kg DM | 470 | 988 | 175 | 137 | 166 | 187 | 351 | 310 | 440 | 441 | 390 | 173 | 196 | 226 | 242 | 254 | 116 | 141 |
| Pb | mg/kg DM | 934 | 928 | 931 | 910 | 769 | 755 | 864 | 831 | 1860 | 1650 | 848 | 484 | 544 | 558 | 842 | 901 | 537 | 411 |
| S | mg/kg DM | 2560 | 2710 | 5510 | 5180 | 8060 | 8580 | 3940 | 4180 | 4070 | 3980 | 2640 | 2780 | 6520 | 6390 | 5210 | 5170 | 5240 | 5030 |
| Sb | mg/kg DM | 98 | 95.2 | 76.1 | 70.9 | 87.6 | 100 | 81.2 | 79.9 | 113 | 123 | 62.6 | 58.1 | 59.2 | 54.3 | 104 | 94.6 | 65.5 | 62.7 |
| Sc | mg/kg DM | 3.78 | 4.56 | 2.58 | 2.94 | 4.53 | 3.66 | 3.14 | 3.31 | 5.47 | 5.09 | 4.94 | 4.52 | 3.51 | 2.91 | 3.81 | 4.19 | 4.61 | 4.12 |
| Se | mg/kg DM | <2 | <2 | <2 | <2 | <2 | <2 | <2 | <2 | <2 | <2 | <2 | <2 | <2 | <2 | <2 | <2 | <2 | <2 |
| Sn | mg/kg DM | 140 | 134 | 144 | 195 | 163 | 185 | 196 | 220 | 147 | 176 | 158 | 117 | 67.2 | 67.8 | 141 | 141 | 177 | 169 |
| Sr | mg/kg DM | 310 | 315 | 536 | 490 | 353 | 357 | 340 | 315 | 398 | 420 | 308 | 326 | 342 | 318 | 409 | 370 | 311 | 348 |
| Tl | mg/kg DM | 0.183 | 0.185 | 0.0945 | 0.0898 | 0.182 | 0.162 | 0.203 | 0.174 | 0.155 | 0.135 | 0.172 | 0.176 | 0.131 | 0.124 | 0.124 | 0.145 | 0.194 | 0.191 |
| U | mg/kg DM | 2.86 | 2.9 | 1.66 | 1.6 | 1.78 | 1.91 | 2 | 1.83 | 1.53 | 1.22 | 1.92 | 2.12 | 1.86 | 1.64 | 2.17 | 2.43 | 1.89 | 2.07 |
| V | mg/kg DM | 59.3 | 61.3 | 61.2 | 61.3 | 45.3 | 39.8 | 40 | 37.5 | 53.3 | 53.6 | 55.8 | 57.3 | 50.7 | 47.4 | 65.4 | 59.6 | 40.9 | 45.9 |
| W | mg/kg DM | 113 | 115 | 40.5 | 38.7 | 24.1 | 18.7 | 20.2 | 22.4 | 38.1 | 37.1 | 60 | 64.9 | 66 | 69 | 74.6 | 87.6 | 91.2 | 94.3 |
| Y | mg/kg DM | 15.8 | 15.7 | 10.8 | 11.3 | 11.8 | 12.7 | 11.4 | 11.7 | 14.9 | 14 | 24.9 | 28.3 | 10.7 | 9.92 | 14 | 15.2 | 11.2 | 11.2 |
| Zn | mg/kg DM | 3100 | 3620 | 3270 | 2950 | 5410 | 5120 | 5420 | 6090 | 4540 | 4740 | 3650 | 3900 | 2950 | 2890 | 4380 | 3690 | 3330 | 3220 |
| Zr | mg/kg DM | 282 | 274 | 241 | 237 | 240 | 322 | 173 | 162 | 194 | 197 | 148 | 205 | 175 | 193 | 339 | 265 | 200 | 220 |
APPENDIX 2: Supplement information: pH management systems with continuous CO2 flow according to Annex 10 (OECD description)
(supplement test results from Tony Brouwers, ECTX bv – presented data extracted from test report)
Test programme:
The influence of pH management system on the pH values of the test solutions was analyzed for two samples.
Test conditions studied:
Test leachant at pH 6: pH 6 (0.5% CO2-in-air is added in the headspace overnight, while shaking at 100rpm to adjust/equilibrate the pH of the buffer medium to pH 6.0±0.1.
Leachant amount and size of test bottle used: 1 000 mL of leachant in Simax borosilicate bottle of 1 000 mL
The temperature in the test chamber: remained constant between 21.4 – 22.2°C during the test.
Test samples: BA2 and BA4, additions of 100.0±0.1 mg to all test replicates with samples
pH measurements: measurements performed at 0 h, 2 h, 6 h, 24 h, 96 h and 168 h after the start of the test with a calibrated pH meter. The pH measurement was carried out directly in the test bottles with a horizontal circular movement of the test bottles.
Test programme
| Test | Condition | Set up | Specification |
| Test-no gas | No additional CO2 buffering during the test. |
| The bottles were closed with a screw cap. |
| Test2 | 0.5% CO2-in-air buffering in the headspace | See above | About 3 L/h at the start of the test. The amount of buffer gas added was increased to about 10 L/h after the 2 h pH measurement. The pH of the test including sample was higher than the blank, therefore CO2 gas flow rate was increased. The higher flow rate of 10L/h was maintained for the remainder of the test. |
| Test3 | 0.5% CO2-in-air buffering by bubbling into the solution | See above | See above about CO2 flow |
| Extra Tests at pH 8 | Leachant pH 8, air buffering | See above |
Discussion of the results
In general, replicates gave rather similar test pH results. This indicates that a 100 mg/L loading can lead to reproducible data with respect to pH. A high variation between replicates would have indicated different compositions of the test solution and subsequently likely variations in released concentrations.
It should be noted that 1 000 ml test bottles were used. Here it can be assumed that a 2 000 ml bottle (subsequently more headspace volume) would have improved the stability of the test system. The results reflect a more worst-case.
Test-no gas: (no additional buffering during the test) shows that buffering is necessary to keep the pH somewhat stable (also for the blank). It seems that some of the buffering capacity disappeared during the first 6 h (potentially due to shaking). Afterwards, the pH values flatten out more.
| Test-BA2, no CO2 additions | ||||||
| Hours from start | 0 | 2 | 6 | 24 | 96 | 168 |
| Blank (no sample) | 6.01 | 6.14 | 6.32 | 6.34 | 6.41 | 6.42 |
| T1 | 6.22 | 6.46 | 6.66 | 6.80 | 7.06 | 7.17 |
| T2 | 6.23 | 6.42 | 6.66 | 6.78 | 7.05 | 7.15 |
| T3 | 6.22 | 6.47 | 6.70 | 6.87 | 7.10 | 7.24 |
| Test-BA4, no CO2 additions | ||||||
| Hours from start | 0 | 2 | 6 | 24 | 96 | 168 |
| Blank (no sample) | 6.01 | 6.14 | 6.32 | 6.34 | 6.41 | 6.42 |
| T1 | 6.14 | 6.34 | 6.54 | 6.76 | 7.27 | 7.43 |
| T2 | 6.13 | 6.34 | 6.57 | 6.72 | 7.25 | 7.40 |
| T3 | 6.12 | 6.32 | 6.55 | 6.74 | 7.25 | 7.39 |
Test2: (0.5% CO2-in-air buffering in the headspace): The blank remains relatively stable around pH6. The test materials do affect the pH in a way that cannot be corrected with headspace buffering, even with 3.3x higher 0.5% CO2 flow from the 2 h measuring point.
| Test2, BA2, no CO2 flow in headspace of test bottle | ||||||
| Hours from start | 0 | 2 | 6 | 24 | 96 | 168 |
| Blank (no sample) | 6.00 | 6.01 | 6.00 | 6.04 | 6.02 | 6.04 |
| T1 | 6.23 | 6.22 | 6.21 | 6.34 | 6.47 | 6.49 |
| T2 | 6.21 | 6.30 | 6.22 | 6.39 | 6.46 | 6.55 |
| T3 | 6.22 | 6.31 | 6.21 | 6.42 | 6.47 | 6.54 |
| Test2, BA4, no CO2 flow in headspace of test bottle | ||||||
| Hours from start | 0 | 2 | 6 | 24 | 96 | 168 |
| Blank (no sample) | 6.00 | 6.01 | 6.00 | 6.04 | 6.02 | 6.04 |
| T1 | 6.14 | 6.21 | 6.19 | 6.45 | 6.52 | 6.64 |
| T2 | 6.14 | 6.20 | 6.23 | 6.49 | 6.59 | 6.72 |
| T3 | 6.14 | 6.21 | 6.21 | 6.47 | 6.55 | 6.67 |
Test3: (0.5% CO2-in-air buffering in the solution): The blank remains relatively stable around pH6 (slightly lower than the headspace buffering). The test materials affect the pH in a way that cannot be corrected within solution buffering, even with a 3.3x higher 0.5% CO2 flow rate from the 2 h measuring point.
| Test3, BA2, CO2 bubbling in test solution | |||||||
| Hours from start | 0 | 2 | 6 | 24 | 96 | 168 | *168 |
| Blank (no sample) | 6.00 | 5.99 | 5.94 | 5.97 | 5.97 | 5.99 | 5.93 |
| T1 | 6.21 | 6.36 | 6.05 | 6.21 | 6.28 | 6.38 | 6.37 |
| T2 | 6.21 | 6.32 | 6.14 | 6.22 | 6.32 | 6.41 | 6.39 |
| T3 | 6.23 | 6.34 | 6.19 | 6.20 | 6.30 | 6.41 | 6.37 |
| Test3, BA4, CO2 bubbling in test solution | |||||||
| Hours from start | 0 | 2 | 6 | 24 | 96 | 168 | *168 |
| Blank (no sample) | 6.00 | 5.99 | 5.94 | 5.97 | 5.97 | 5.99 | 5.93 |
| T1 | 6.13 | 6.21 | 6.17 | 6.27 | 6.35 | 6.45 | 6.40 |
| T2 | 6.14 | 6.20 | 6.15 | 6.26 | 6.40 | 6.51 | 6.43 |
| T3 | 6.14 | 6.21 | 6.14 | 6.31 | 6.38 | 6.49 | 6.41 |
At the end of this test, the blank and test item bottles were extremely intensively aerated (±100 L/h) for 10 minutes per bottle and the pH was measured again to see if the pH can be lowered with the CO2 buffering. However, this does not appear to be possible. This is potentially because the released compounds from the test materials introduce a buffering effect (e.g. HPO4, PO4, compounds).
Test4: (natural air buffering during the test): Despite the higher buffering capacity of the medium at pH 8, the test materials provide a limited increase in pH.
| Test4, BA2, Use of leachant pH 8 | ||||||
| Hours from start | 0 | 2 | 6 | 24 | 96 | 168 |
| Blank (no sample) | 7.99 | 7.99 | 8.01 | 8.00 | 8.01 | 8.03 |
| T1 | 8.08 | 8.21 | 8.27 | 8.29 | 8.26 | 8.28 |
| T2 | 8.11 | 8.20 | 8.28 | 8.28 | 8.29 | 8.30 |
| T3 | 8.09 | 8.22 | 8.26 | 8.28 | 8.29 | 8.28 |
| Test4, BA4, Use of leachant pH8* | ||||||
| Hours from start | 0 | 2 | 6 | 24 | 96 | 168 |
| Blank (no sample) | 7.99 | 7.99 | 8.01 | 8.00 | 8.01 | 8.03 |
| T1 | 8.02 | 8.10 | 8.20 | 8.19 | 8.21 | 8.21 |
| T2 | 8.01 | 8.11 | 8.18 | 8.20 | 8.19 | 8.20 |
| T3 | 8.03 | 8.09 | 8.21 | 8.18 | 8.19 | 8.20 |
Conclusive remarks:
Based on the tests performed, it is likely that the pH in the test solutions with sample could not be kept within the desired range of pH 6.0±0.1. The influence on pH in the ash test solutions is the property of the respective test materials.
It is important that the pH of the blanks is stable during the test. A limited excess of CO2 (higher flow) does not have much effect.
APPENDIX 3 Results from nine ashes tested with the adapted method with the load 100 mg/L
Measured metal concentrations (average) after 7days or 28 days test. Variation ranges in bracket. Unit µg/l.
| blank at test end | pH in test solution at test end | Cr *) | Cu | Ni*) | Pb | Zn | |
| BA1 – 7 days | 6.13 | 6.17–6.26 | 0.1 | 27.6 (25–31) | 1.7 | 0.8 (0.7–0.9) | 98.4 (85–120) |
| BA2-2 – 7 days | 6.20 | 6.36–6.44 | 29.8 (27–35) | 0.9 (0.5–1.9) | 122 (110–140) | ||
| BA2-2 – 28 days | 6.10 | 6.6.44–6.53 | 0.50 | 42.6 (35–53) | 4 | 0.7 (0,6–0.9) | 128 (110–140) |
| BA3 – 7 days | 6.13 | 6.46–6.53 | 0.36 | 5.5 (4.5–6.2) | 0.60 | 0.2 (0.2) | 140 (130–150) |
| BA4 – 7 days | 6.15 | 6.56–6.61 | 0.33 | 7.8 (6.1–9.8) | 1.10 | 0.2 (0.2) | 118 (110–140) |
| BA5 – 7 days | 6.15 | 6.32–6.50 | 0.25 | 25.4 (18–30) | 1.50 | 2.9 (2.3–3.3) | 168 (130–220) |
| BA6 – 7 days | 5.95 | 6.41–6.45 | 3.2 (0.2–9.2) | 0.2 (0.2) | 53.7 (21–110) | ||
| BA7 – 7 days | 5.67 | 6.25–6.41 | 6.8 (5.0–8.9) | 0.17 (0.1–0.2) | 59.7 (43–83) | ||
| BA7 – 28 days | 6.82 | 6.43–6.57 | 0.11 | 7.3 | 2.2 | 0.13 | 103 (74–150) |
| BA8 – 7 days | 5.79 | 6.14–6.34 | 9.7 (6.3–13) | 0.2 (<0.1–0.93) | 100 (81–120) | ||
| BA9 – 7 days | 6.05 | 6.32–6.53 | 9.6 (7–10) | 0.94 (0.2–4) | 60.2 (44–85) | ||
| BA9 – 28 days | 6.41 | 6.73–7.04 | 0.18 | 8.8 (5.6–11) | 0.50 | 2.50 (0.1–4.9) | 63.6 (50–82) |
| *) single data only for check | |||||||
APPENDIX 4: Adapted T/Dp – method description
The base of the adapted method is the test description in UN GHS Annex 10. The testing principles of the adapted T/Dp are briefly described below with references to conditions described in Annex 10.
NB The main difference in the adapted T/Dp relates to the use of CO2 injections in test vessel headspace instead of continuous CO2 flow in test vessels, which is the reference procedure.
1. Scope of method
The test determines the release of sparingly soluble metals from waste material in test conditions simulating infinite contact with water and where an excess of oxygen enables the transformation of oxides and sulphides into a soluble form and then dissolution to the water phase. The metal concentrations in the test solution are measured at the end of the test time. From the released concentrations, values can be extrapolated and compared to ecological reference values for waste classification.
2. Application
The test method is suitable for determination of release of metals which may appear as compounds with the hazard statement codes H400, H410-H413 in a bottom ash.
The test method is not applicable for organic pollutants.
NB The applicability of the test method for other wastes (mineral and organic waste) has not been assessed and probably sets a requirement for different pre-treatment methods.
3. References
UN GHS (2019) Globally Harmonized System of Classification and Labelling of Chemicals, Annex 10 Guidance on Transformation/Dissolution of Metals and Metal Compounds in Aqueous Media (GHS, Rev.8, 2019)
(https://www.unece.org/fileadmin/DAM/trans/danger/publi/ghs/ghs_rev08/ST-SG-AC10-30-Rev8e.pdf)
EN15002:2015. Characterization of waste - Preparation of test portions from the laboratory sample
4. Principle of adapted method
In the T/Dp, the test substance is gently agitated in a pH-buffered aqueous transformation/ dissolution leaching medium.
The adapted test procedure is conducted with the load 100 mg/l using a test portion with a grain size of less than 1 mm. The target pH is 6 using a buffer leachant and the test time is 28 days. A test time of 7 days is sufficient in case of steady-state release, or if it can be demonstrated that sufficient information is achieved for waste classification. A short test time of 7 days can also be used for indicative information of release.
NB Steady-state release in the T/Dp is described in Annex 10. Test duration can also be reduced to 7 days if sufficient correlation between a test time of 7 days and 28 days can be demonstrated, or the level of release is very low compared to ERV to which the metals are compared.
5. Apparatus and reagent
Glass bottles of 2 L are used. The tight caps of the bottles should have inlet holes for gas injections. The bottles should be sealed as well as possible to minimize leakage of CO2.
The leachant pH 6 is used in the test and prepared as described in Annex 10. The quality of the ultra-pure water needs to be analyzed for background concentrations, as very low concentrations are to be measured.
Pure CO2 gas is used instead of a gas mixture containing 0.5% CO2 prescribed in Annex 10.
Important: all equipment and test bottles need to be rinsed with acids to minimize potential contaminations (alternatively new glass bottles should be used for each test). Only pro-analysis reagents are to be used.
6. Sample preparation
Special attention is needed in sample preparation of a very small subportion. General guidance for sample preparation is given in EN 15002 by using coning/quartering/ homogenization and applying sieving and crushing of oversized materials. An appropriate way to reduce the subsample size further into representative subsample portions is by dividing it with a centrifugal divider. Centrifugal division can be performed successively until appropriate subsample portions are obtained.
It is important that the weight of oversized materials (> 1 mm) that are removed before crushing is recorded and assessed in the test interpretation.
The test material should be divided down to such a small size that the final sample portion taken for the test constitutes about 10% of the split sample. This means that, for the test performance with 5 replicates, the test sample amount of 1 g is prepared using a sample divider enabling 5 subsamples of 100 mg to be obtained.
Note 1: If the subsample cannot be subjected to sample size reduction, sample particle size reduction or sieving because of its moisture content, the subsample should be dried at room temperature (EN 15002). The subsample should only be dried to such an extent that will allow for subsequent sample treatment (i.e. sample size reduction, particle size reduction, sieving etc).
7. Procedure
The test is performed with a few deviations to Annex 10:
7.1 Test is carried out at a temperature of 22 °C ± 3 °C.
NB This temperature range is prescribed in the CEN test methods for testing of release from waste material (e.g. surface related release in, e.g. CEN/TS 16637-2:2014 from construction products).
7.2 Prior to start of the test, the headspace of the test bottle is measured (taking into account the leachant solution used in the test). This information is used to calculate the quantity of pure CO2 to be added to the headspace.
7.3 Instead of using a 0.5% CO2 gas constantly flowing to the bottle headspace or to the test solution, as described in OECD document no 98, a predetermined amount of CO2 is added to the headspace at certain time intervals during the test duration. The predetermined quantity of pure gas is injected into the head space of the test bottle through the gas inlet using a syringe and resulting in a CO2 gas concentration of 0.5%. The buffered pH 6 leachant is also preferably the day before start of the test saturated with CO2 using this procedure in order to achieve the target pH in Annex 10 (multiple additions may be needed).
NB For injections of CO2 gas, a Tedlar bag is, e.g. half-filled with pure CO2. (overpressure needs to be avoided). From the gas phase, a predetermined volume is withdrawn with a syringe and injected into the headspace of the test vessel.
7.4 Addition of test sample and agitation are performed as described in Annex 10.
The pH of the blank tests is followed to ensure that sufficient CO2 amounts have been added and to keep the pH near the range 5.8–6.2 during the test performance. At the end of the test, the pH of the blank needs to be within the range of 5.8–6.2.
NB It is recommended that first a blank test series is performed to check that sufficient CO2 injections are added. Leakages through the cap of the test bottle may lead to pH values slightly exceeding pH 6.2 after a few days.
7.5 Sampling from test solution is done according to Table 1 by withdrawing a small volume of 20 ml. No fresh leachant is added. The addition of CO2 is done at the same time.
Eluate sampling during testing time and addition of CO2 amount in headspace (Table includes proposals for acceptable deviation in timing of CO2 addition)
| Test | Steps | CO2 injections in headspace of bottle from start of test, hours*) | Remarks |
| 7-day test | 1 | 2 + 15 min | |
| 2 | 6 + 15 min | ||
| 3 | 24 + 45 min | ||
| 4 | 96 + 75 min | ||
| 5 | 168 + 30 min | 7-day test stopped | |
| Additional steps for 28-day test | 6 | 264 + 24 hours) | pH measurement only |
| 7 | 336 + 24 hours | ||
| 8 | 432 + 24 hours | pH measurement only | |
| 9 | 504 + 24 hours | ||
| 10 | 576+ 24 hours | pH measurement only | |
| 11 | 672 + 1 hours | 28 days test stopped | |
| *) if the pH of the blank slightly exceeds pH 6.2 (e.g. pH 6.2–6.3) after 7 days during the test performance, a few extra additions can be made, e.g. 1–2 days before the planned subsequent CO2 injections. If the pH is significantly exceeded, then actions need to be taken to hinder gas leakage or assess influence of the ultra-pure water quality used. | |||
8. Analysis of eluates
The eluates and blanks are sent to an analytical laboratory with reliable test methods for metals of interest.
Metal concentrations in test eluates are not corrected for metal concentrations in blanks.
NB Background correction can be considered in case of very low concentrations near background (e.g. for Pb), especially if the ERV is considerably lower.
Guidance for interpretation of test results is presented in Annex 10.
About this publication
Ecotoxic properties of ashes in hazardous waste classification
Adaption of the tranformation/ dissolution (T/D) protocol for assessment of ecotoxic properties of waste ashes
Margareta Wahlström, Charlotta Tiberg, Karin Karlfeldt Fedje , Tuomo Mäkelä, Johannes Kikuchi, Amir Saeid Mohammadi
ISBN 978-92-893-7311-1 (PDF)
ISBN 978-92-893-7312-8 (ONLINE)
http://dx.doi.org/10.6027/temanord2022-525
TemaNord 2022:525
ISSN 0908-6692
© Nordic Council of Ministers 2022
Cover photo: Sysav Utveckling AB
Published: 24/6/2022
Disclaimer
This publication was funded by the Nordic Council of Ministers. However, the content does not necessarily reflect the Nordic Council of Ministers’ views, opinions, attitudes or recommendations.
Rights and permissions
This work is made available under the Creative Commons Attribution 4.0 International license (CC BY 4.0) https://creativecommons.org/licenses/by/4.0.
Translations: If you translate this work, please include the following disclaimer: This translation was not produced by the Nordic Council of Ministers and should not be construed as official. The Nordic Council of Ministers cannot be held responsible for the translation or any errors in it.
Adaptations: If you adapt this work, please include the following disclaimer along with the attribution: This is an adaptation of an original work by the Nordic Council of Ministers. Responsibility for the views and opinions expressed in the adaptation rests solely with its author(s). The views and opinions in this adaptation have not been approved by the Nordic Council of Ministers.
Third-party content: The Nordic Council of Ministers does not necessarily own every single part of this work. The Nordic Council of Ministers cannot, therefore, guarantee that the reuse of third-party content does not infringe the copyright of the third party. If you wish to reuse any third-party content, you bear the risks associated with any such rights violations. You are responsible for determining whether there is a need to obtain permission for the use of third-party content, and if so, for obtaining the relevant permission from the copyright holder. Examples of third-party content may include, but are not limited to, tables, figures or images.
Photo rights (further permission required for reuse):
Any queries regarding rights and licences should be addressed to:
Nordic Council of Ministers/Publication Unit
Ved Stranden 18
DK-1061 Copenhagen
Denmark
pub@norden.org
Nordic co-operation
Nordic co-operation is one of the world’s most extensive forms of regional collaboration, involving Denmark, Finland, Iceland, Norway, Sweden, and the Faroe Islands, Greenland and Åland.
Nordic co-operation has firm traditions in politics, economics and culture and plays an important role in European and international forums. The Nordic community strives for a strong Nordic Region in a strong Europe.
Nordic co-operation promotes regional interests and values in a global world. The values shared by the Nordic countries help make the region one of the most innovative and competitive in the world.
The Nordic Council of Ministers
Nordens Hus
Ved Stranden 18
DK-1061 Copenhagen
pub@norden.org
Read more Nordic publications on www.norden.org/publications