
- Full page image w/ text
- Table of contents
- Preface
- Summary
- 1 Background
- 1.1 Selected compounds
- 1.2 Selected sample types
- 2 Methods
- 2.1 Sampling
- 2.2 Chemical Analysis
- 2.3 Limit of detection
- 2.4 Uncertainties
- 3 Results and Discussion
- 3.1 UV-filters
- 3.2 Dechloranes
- 3.3 Chlorinated paraffins
- 4 Conclusions
- 5 Acknowledgements
- 6 References
- Appendix A
- Appendix B
- Appendix C
- NILU – Norwegian Institute for Air Research
- About this publication
MENU
Contents
This publication is also available online in a web-accessible version at https://pub.norden.org/temanord2022-519.
Preface
The aim of the Nordic Screening Group is to increase knowledge of the occurrence and distribution of hazardous substances in the Nordic environment in order to provide supporting information on contaminants of emerging concern, that may serve as fundament and/or support for regulatory action. To this end, the group regularly plans screening studies in order to obtain a snapshot of the occurrence of potentially hazardous substances, both in regions most likely to be polluted as well as in some very pristine environments. The focus is on less known, anthropogenic substances and their derivatives, which are either used in high volumes or are likely to be persistent and hazardous to humans and other organisms.
In 2019, the project steering group decided to perform a screening on chlorinated paraffins, dechloranes and UV-filters. The following Nordic countries and self-governing areas are included in the project: Finland, Sweden, Norway, Denmark, Faroe Islands, Iceland and Greenland.
The matrices selected for analyses are:
- Air
- Pine needles
- Bird eggs
- Marine and freshwater fish
- Marine and terrestrial mammals
The Nordic screening project is run by a steering group with representatives from the Danish Centre for Environment and Energy, Aarhus University, Denmark, the Finnish Environment Institute, the Environment Agency of Iceland, the Environment Agency of the Faroe Islands, the Climate and Pollution agency in Norway, the Swedish Environmental Protection Agency, and the Swedish Chemicals Agency. The project is financed and supported by the Nordic Council of Ministers through the Nordic Chemicals Group and the Aquatic Ecosystems Group as well as the participating institutions.
The chemical analyses in this project have been carried out jointly by NILU – Norwegian Institute for Air Research and Norwegian Institute for Water Research (NIVA). The participating Nordic countries organised sample selection, collection and transport of samples based on a sample protocol and manuals provided by the analytical laboratories.
The national representatives in the Nordic Screening group have been responsible for collection of the samples. Acknowledgements can be found in chapter 5.
Summary
In 2019, the Nordic screening group decided to perform a Nordic screening on chlorinated paraffins, dechloranes and UV-filters. These compounds are used in a wide range of applications. They all have long range transport characteristics and can potentially be regulated under the Stockholm POP convention. However, there are still huge data gaps, which need to be addressed in order to fulfill regulation requests.
Several topics and questions were in focus for more measurements and a deeper understanding: (1) importance of long-range atmospheric transport and deposition, (2) differences/similarities in terrestrial versus marine food chains, and (3) variations between the Nordic countries and between urban and remote areas. Based on these priorities, availability of samples, and other practical reasons, samples from different Nordic countries, different environments, and both urban and remote places were selected. This study includes analysis of the compounds in air, marine and freshwater fish and marine mammals and bird eggs, but as the chlorinated paraffins also have been found to accumulate in the terrestrial food web, terrestrial mammals and bird eggs were included as well. Additionally, samples of pine needles were analysed both to look at the possibility for long range transport and to investigate it as a possible source of chlorinated paraffins for the terrestrial mammals.
Table 1: Detection frequency (as %) of the different compounds in the selected sample types (REM: Samples from remote site; URB: Samples from urban sites).
| Matrix | Bird Eggs REM+URB | Trout REM | Perch REM | Perch URB | Cod Liver REM+URB | Grey seal REM | Terr. mammal REM | Air REM | Air URB | Pine needles REM | Pine needles URB |
| Number of samples | 13+1 | 3 | 9 | 6 | 3+2 | 2 | 9 | 8 | 3 | 10 | 5 |
| BP3 | 0 | 0 | 0 | 0 | 20 | 0 | 0 | na | na | na | na |
| EHMC-E | 14 | 0 | 0 | 0 | 0 | 0 | 0 | na | na | na | na |
| EHMC-Z | 0 | 0 | 0 | 0 | 0 | 0 | 0 | na | na | na | na |
| OC | 21 | 0 | 0 | 0 | 0 | 0 | 0 | na | na | na | na |
| ODPABA | 0 | 0 | 0 | 0 | 0 | 0 | 0 | na | na | na | na |
| UV-320 | 21 | 0 | 0 | 17 | 60 | 100 | 0 | na | na | na | na |
| UV-326 | 7 | 0 | 0 | 0 | 0 | 0 | 0 | na | na | na | na |
| UV-327 | 50 | 0 | 0 | 17 | 60 | 50 | 0 | na | na | na | na |
| UV-328 | 43 | 0 | 0 | 17 | 80 | 50 | 0 | na | na | na | na |
| UV-329 | 0 | 0 | 0 | 0 | 60 | 0 | 0 | na | na | na | na |
| DBA | 0 | 0 | 0 | 0 | 0 | 0 | 0 | 0 | 0 | 0 | 0 |
| Dec-602 | 100 | 100 | 0 | 67 | 100 | 100 | 78 | 0 | 0 | 0 | 0 |
| Dec-603 | 71 | 0 | 0 | 0 | 60 | 50 | 0 | 0 | 0 | 0 | 0 |
| Dec-604 | 0 | 0 | 0 | 0 | 0 | 0 | 0 | 0 | 0 | 0 | 0 |
| Dec-601 | 0 | 0 | 0 | 0 | 0 | 0 | 0 | 0 | 0 | 0 | 0 |
| DPsyn | 7 | 0 | 0 | 0 | 0 | 50 | 0 | 25 | 67 | 0 | 0 |
| DPanti | 29 | 0 | 0 | 17 | 0 | 50 | 0 | 63 | 100 | 0 | 0 |
| SCCPs | 100 | 67 | 100 | 83 | 100 | 50 | 100 | 100 | 100 | 50 | 100 |
| MCCPs | 100 | 67 | 100 | 83 | 100 | 50 | 100 | 63 | 100 | 60 | 100 |
| LCCPs | 21 | 67 | 22 | 83 | 60 | 50 | 56 | 63 | 100 | 30 | 80 |
| na: UV-compounds were not analyzed in air and pine needles. | |||||||||||
In total, 6 out of 10 selected UV-compounds could be detected: EHMC-E, OC, UV-320, UV-326, UV-327, and UV-328. No spatial trend could be observed. Herring gull sample from Inner Oslofjord was the most contaminated sample with the highest number of UV-compounds above LoD. In this sample, UV-328 was significantly higher than in all remote samples. In only one sample of freshwater fish (liver of perch from lake Mjøsa in Norway), it was possible to detect some UV-filters above LoD. Four UV-filters could be detected frequently in cod liver samples. Samples taken in the open sea around Faroe Islands, showed the lowest concentrations close to LoD, whereas both the Skagerrak and Aarhus Bay samples showed slightly elevated concentrations of UV-320, 327, 328, and 329. Highest concentrations, especially of UV-328, were detected in the cod liver from Inner Oslofjord. Three UV-filters (UV-320, UV-327, and UV-328) could be detected in grey seal samples from Denmark. None of the selected UV-filters could be detected in samples of the selected terrestrial mammals.
Dechlorane 602 was detected very frequently in nearly all type of biota samples, closely followed by dechlorane 603. However, the two parent compounds DPsyn and DPanti were only detected in herring gull eggs, urban perch, and grey seal. DPsyn was detected at Birkenes and Reykjavik stations, whereas DPanti was detected at Råö, Birkenes, and Reykjavik. There was no significant difference observed between the urban and remote sites for these compounds. None of the selected dechloranes could be detected in pine needles.
1 Background
In 2016 AMAP published the report “Chemicals of Emerging Arctic Concern” which included lists of chemicals in commerce identified with P, B and LRTP characteristics and for which no information on occurrence in Arctic environmental matrices was available at the time. These substances were later found in significant concentrations in Norwegian environmental samples (Norwegian Environment Agency, Screening Programme 2017: M1080, 2018 (Sakhi et al., 2019, Schlabach et al., 2018, Schlabach et al., 2017b, Schlabach et al., 2017a, Van Bavel et al., 2016, Krogseth et al., 2013)).
In 2019, the Nordic screening group therefore decided to perform a Nordic screening on chlorinated paraffins, dechloranes and UV filters. These compounds all have long range transport characteristics and can potentially be regulated under the Stockholm POP convention.
1.1 Selected compounds
1.1.1 UV-filters
The group of compounds named UV-filters are designed to protect human skin and technical products from UV radiation. They are found in sun screen products, plastics, textiles, furniture, etc. Their use in sunscreens for skin protection has been increasing in last centuries due to rising awareness to the chronic and acute effects of UV radiation. Some UV-filters have triggered significant concerns in the latter years for their enormous usage, persistent input and potential threat to ecological environment and human health. UV-compounds usually end up in wastewater. Since wastewater treatment plants are not efficient enough to remove UV-compounds, the lipophilic UV-compounds tend to sorb onto sludge and hydrophilic UV-compounds end up in river water. Both types can potentially contaminate aquatic biota (Sanchis et al., 2019). UV328 has recently been nominated to the Stockholm convention (Persistent Organic Pollutants Review Committee, 2020).
Several Norwegian screening studies performed by the project group on behalf of the Norwegian environment agency has proven the widespread contamination of waste water (Krzeminski et al., 2017), general environment (Thomas et al., 2014, Langford et al., 2015), and Arctic environment (Schlabach et al., 2018, Lucia et al., 2016) with UV-filters. NIVA’s environmental analytical lab is world-wide leading in the analysis of UV-filters. UV-filters are well separated by GC-MS into the different individual compounds, relevant standards are commercially available and quantification can be done with an estimated measurement uncertainty around ± 25% (Langford et al., 2015).
| Name | Acronym | Structure | CAS | Log KOW |
| Benzophenone-3 | BP3 |  | 131-57-7 | 3.5 |
| EHMC-e |  | 5466-77-3 | ||
| EHMC-Z |  | 5466-77-3 | ||
| Octocrylene | OC |  | 6197-30-4 | 6.9 |
| 2-Ethylhexyl-4-dimethyl-aminobenzoate | ODPABA |  | 21245-02-3 | 5.8 |
| UV-320 |  | 3846-71-7 | 6.3 | |
| Bumetrizole | UV-326 |  | 3896-11-5 | 5.6 |
| UV-327 |  | 3864-99-1 | 6.9 | |
| UV-328 |  | 25973-55-1 | ||
| Octrizole | UV-329 |  | 3147-75-9 | 6.2 |
Table 2: UV filter compounds selected for this study
1.1.2 Dechloranes
The environmental occurrence of Dechlorane Plus (DP) was not documented until 2006 (Hoh et al., 2006). This late discovery was surprising, since this high production volume (HPV) chlorinated flame retardant has been produced for at least 40 years. During recent years both DP and other closely related compounds like Dechlorane 601 to 604 were detected in a lot of different environmental samples both in industrial areas (Sverko et al., 2011) and in the most rural Arctic (Carlsson et al., 2018, Verreault et al., 2018, Vorkamp et al., 2017, Schlabach et al., 2017a) and Antarctic environments (Gao et al., 2018). As shown in Figure 1, dechloranes are nicely separated by GC-ECNI-HRMS into the different individual compounds, relevant standards are commercially available and quantification can be done with an estimated measurement uncertainty around ± 25%.
| Name | Acronym | Structure | CAS | Log KOW |
| Dechlorane plus syn | DPsyn |  | 135821-03-3 | 8.85 |
| Dechlorane plus anti | DPanti |  | 135821-74-8 | 8.85 |
| Dechlorane 601 | Dec601 |  | 13560-90-2 | 9.22 |
| Dechlorane 602 | Dec602 |  | 31107-44-5 | 7.37 |
| Dechlorane 603 | Dec603 |  | 13560-92-4 | 8.24 |
| Dechlorane 604 | Dec604 |  | 34571-16-9 | 8.84 |
| Dibromoaldrin | DBALD |  | 20389-65-5 | 5.77 |
Table 3: Dechlorane compounds selected for this study
1.1.3 Chlorinated paraffins
Chlorinated paraffins (CPs) are used in a wide range of applications such as high-pressure additives in metal working fluids, and flame retardants or plasticizers in rubbers, paints, plastics, coatings, sealants and adhesives. CPs are mixtures of different carbon chain lengths and number of chlorine atoms. Based on chain length, CPs can be divided into three groups: short chain (SCCPs: C10–C13), medium chain (MCCPs: C14–C17) and long chain (LCCPs: C18–C28). CPs are manufactured by radical chlorination of n-alkanes by treatment with ultraviolet (UV) light and/or high temperatures in the presence of chlorine gas. These reactions have low positional selectivity and the different technical products are made up by innumerable individual congeners (Tomy et al., 1998). CPs can emit into the environment during production, storage, transportation, use, and disposal of products. Emission can also occur by runoff, leaching, or volatilization from landfills, sludge, and waste burning. CPs are of emerging concern due to their high production volumes (up to 600–1000 ktons/year in China), high persistency (half-life >1 year in sediment and >0.5 d in air), high bioaccumulation potential, and toxicity. Among CPs, short-chain CPs (SCCPs) have received the greatest attention. These compounds are classified as substances of very high concern and are included on the list of the European water framework directive to be monitored in water (van Mourik et al., 2015). SCCPs are also regulated under the Stockholm Convention in Annex A (Elimination). UK has recently submitted a proposal to list chlorinated paraffins with carbon chain lengths in the range C14–17 and chlorination levels ≥45% chlorine by weight as persistent organic pollutant (POP).
Due to the complex mixture of innumerable congeners in each technical product environmental trace analysis of chlorinated paraffins is very difficult. As shown in Figure 1 for dechloranes, the majority of persistent organic pollutants can be analytically separated into single congeners. In most cases there are also isolated and purified standards for these single compounds available and all relevant congeners can be identified and quantified individually.
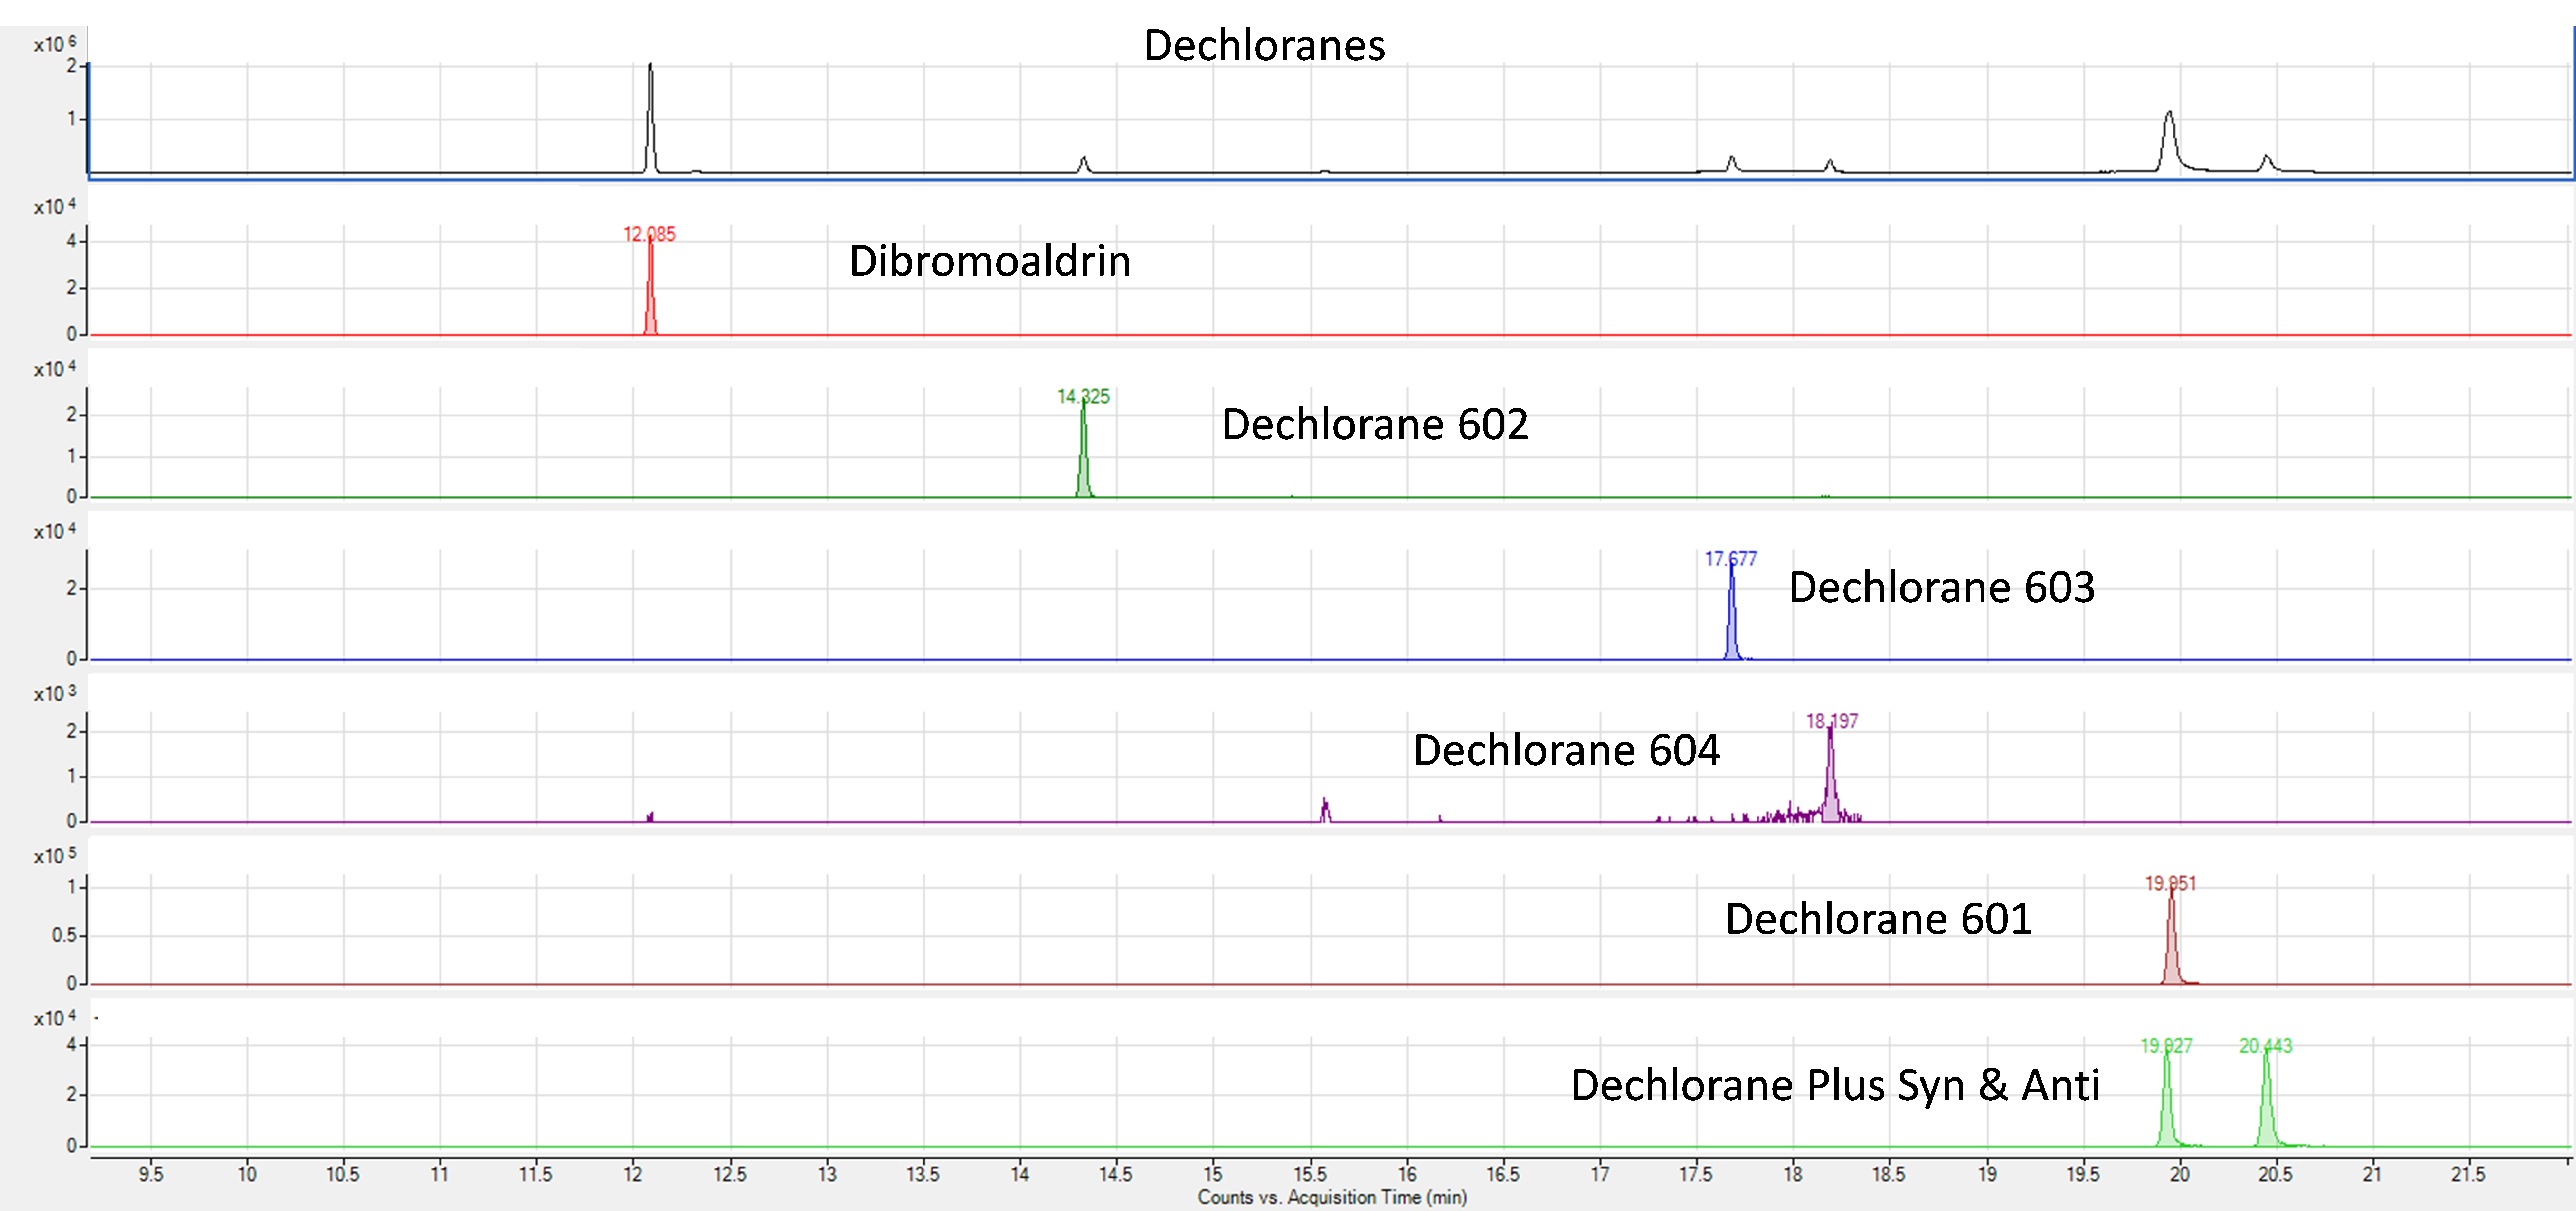
Figure 1: Total ion chromatogram of dechloranes, together with chromatograms of all dechloranes completely separated. The complete separation and the existence of isolated standard material for each compound allow a compound specific analysis.
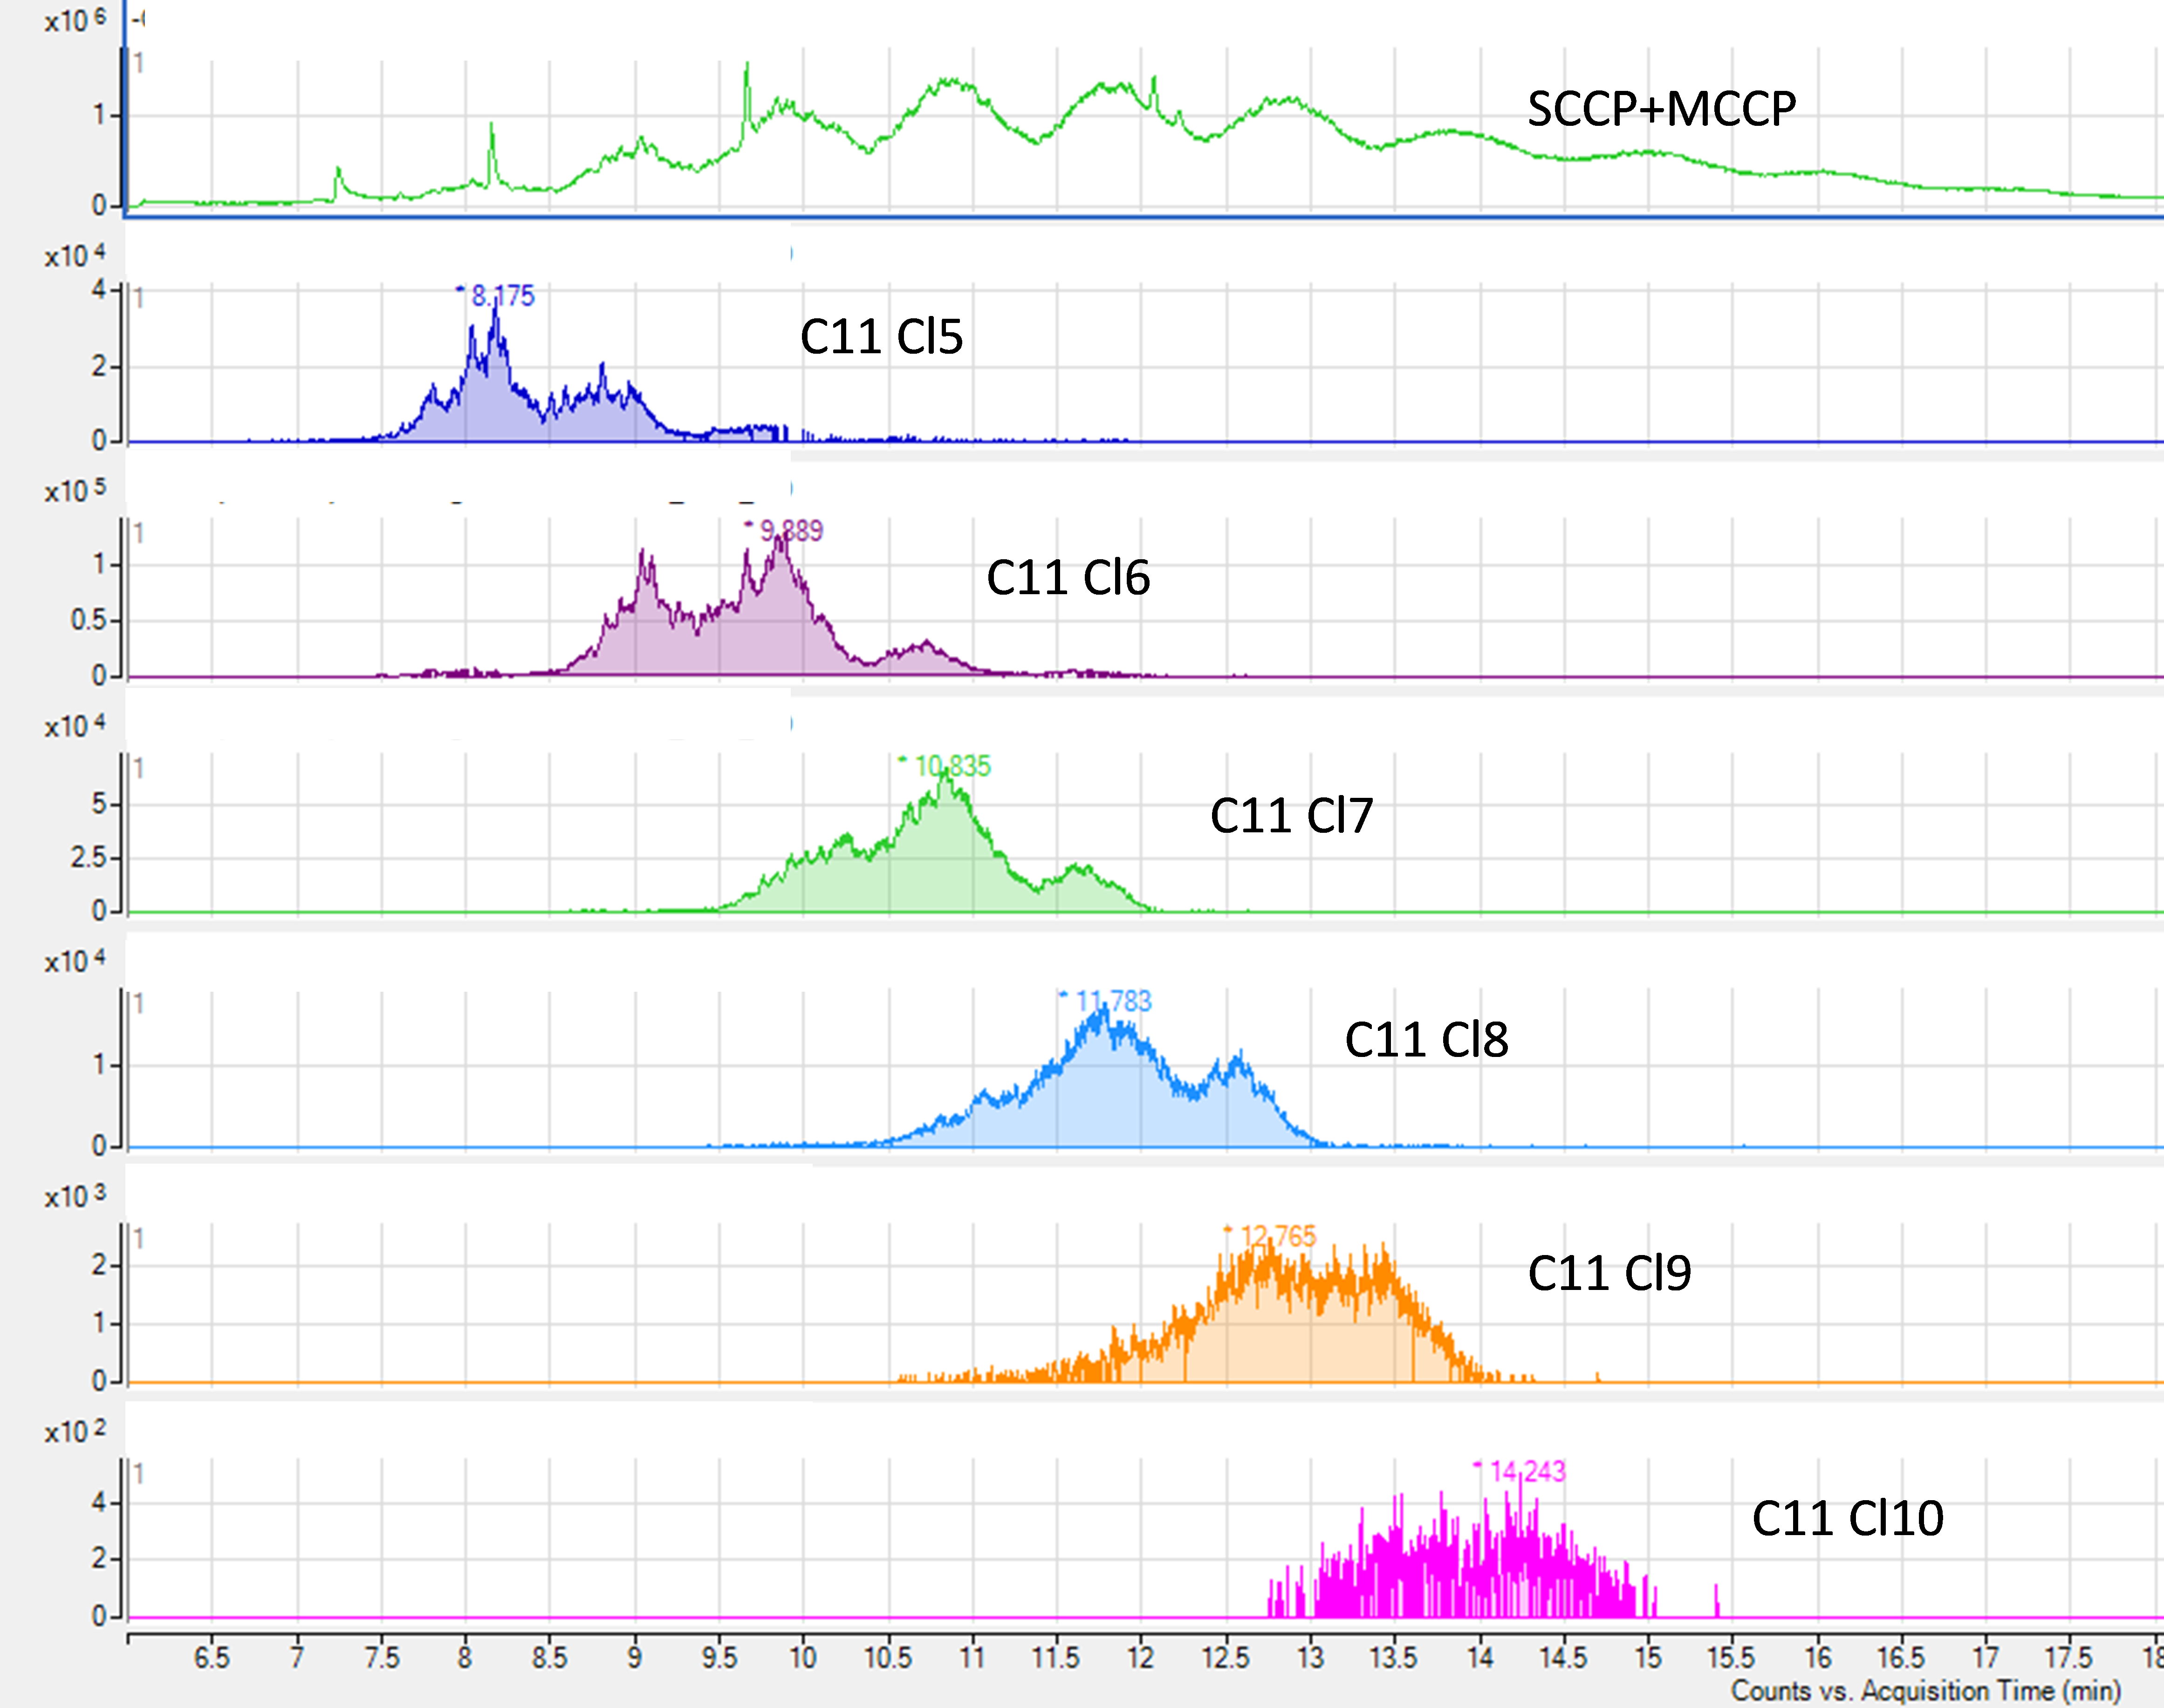
Figure 2: Total ion chromatogram of SCCPs and MCCPs, together with chromatograms of the congener groups C11–Cl5 to C11–Cl10. None of the possible thousands of congeners could be isolated as single peaks. Limited separation and the non-existence of isolated standard material for each congener allow only a mixture analysis.
In contrast to the ideal case of dechloranes or UV-filters, CPs can only be separated into congener groups with the same chain length and number of chlorine atoms, however, the different individual congeners remain unresolved Figure 2. In addition, there are only very few and little representative isolated single congener standards available, which can be used for identification and quantification. These facts make an accurate quantification very difficult. Different methods of highly variable quality have been developed during the last 20 years or so (van Mourik et al., 2015). The method of Tomy (Tomy et al., 1997) was applied by NILU for nearly 20 years. It is based on the use of different technical CP mixtures and the application of GC-HRMS in ECNI-mode. The method has shown to be the most accurate but also most expensive for determination of CPs. Due to the use of high mass resolution in GC/ECNI-HRMS little self-interferences between CPs and other compounds such as chlordanes, toxaphenes and PCBs can occur, which are a common problem for GC/ECNI-LRMS.
Very recently, an alternative technique based on APCI-qToF-HRMS and a deconvolution algorithm have shown promising results (Bogdal et al., 2015). However, even this method is very difficult, time consuming and the outcome is very dependent on the selection of the right combination of technical mixtures used for calibration. Originally, a worldwide intercalibration and certification study was scheduled for 2019/2020 with NILU participating as one of the leading expert labs, which would have given valuable information on accuracy and precision of the different methods. However, this exercise was postponed twice due to COVID restrictions and related logistical problems.
Even with recent advances in the analysis of CPs, limited separation and the non-existence of isolated standard material for each congener allow only a mixture analysis, in contrast to UV-compounds and dechloranes, where complete separation and the existence of isolated standard material for each compound allow a compound specific analysis. The measurement uncertainty for the measurement of CPs is estimated to be much higher than for other POPs and probably much higher than ± 40%.
1.2 Selected sample types
This is not the first time these compounds are measured in the Nordic environment, but a follow up and supplementary study based on earlier findings in Norwegian and Swedish screening studies (Schlabach et al., 2018, Ruus et al., 2019, Schlabach et al., 2017b, Schlabach et al., 2017a, Vorkamp et al., 2019, Yuan et al., 2017, Yuan et al., 2019a) to give a better overview on the environmental threat and the spatial distribution of the selected compounds.
Several topics and questions were in focus for more measurements and a deeper understanding: (1) importance of long-range atmospheric transport and deposition, (2) differences/similarities in terrestrial versus marine food chains, and variations between the Nordic countries and between urban and remote areas. Based on these priorities, availability of samples, and other practical reasons the following samples from different countries and both urban and remote places were selected: Air, marine and freshwater fish and marine mammals and bird eggs. As the chlorinated paraffins also have been found to accumulate in the terrestrial food web, terrestrial mammals and one terrestrial bird species were included as well. Additionally, samples of pine needles were selected, both as a tracer for long-range atmospheric transport and to investigate vegetation as a possible source of chlorinated paraffins for the terrestrial mammals.
2 Methods
2.1 Sampling
The following samples were part of this study (acronyms in brackets): Ambient air (AIR), pine needles (PIN), bird eggs (EGG), marine (MFI) and freshwater fish (FFI), and marine (MMA) and terrestrial mammals (TMA). In air and pine needles only CPs and dechloranes were measured. However, in all other samples both UV-compounds, dechloranes, and CPs were measured.
Sampling was performed by the different countries according to the sampling manual enclosed in the Appendix C of this report. Sampling sites and the selection of sample matrices at each site are shown in Table 4, Figure 3 to Figure 6, and in appendix B.
Table 4: Sampling sites and sample matrices for all participating countries.
Matrix acronyms: FFI: Freshwater fish, MFI: Marine fish, MMA: Marine mammal, PIN: Pine needles, TMA: Terrestrian mammals;
Location type: URB: Urban sites, REM: Remote sites.
Latitude, longitude: All coordinates registered by the participants are converted to decimal coordinates in WGS84 format.
| Country | Matrix acronym | Location type | Location | Species | Sample specification | Latitude | Longitude |
| FIN | AIR | REM | Pallas | Air | 67.973302 | 24.115680 | |
| ICE | AIR | URB | Reykjavík | Air | 64.130115 | -21.874738 | |
| NO | AIR | REM | Birkenes | Air | 58.388446 | 8.252055 | |
| SE | AIR | REM | Råö | Air | 57.393998 | 11.913868 | |
| DK | EGG | REM | Græsholm | Herring gull (Larus argentatus) | Eggs | 57.492000 | 10.604000 |
| FO | EGG | REM | Koltur | Black guillemot (Cepphus grylle) | Eggs | 61.977167 | -6.957383 |
| FO | EGG | REM | Sandoy | Fulmar (Fulmarus glacialis) | Eggs | 61.872133 | -6.913100 |
| NO | EGG | URB | inner Oslofjord | Herring gull | Eggs | 59.853170 | 10.728100 |
| SE | EGG | REM | Stora Karlsö | Common guillemot | Eggs | 57.284967 | 17.971945 |
| SE | EGG | REM | Insjön | Ural owl | Eggs | 60.642323 | 15.116698 |
| DK | FFI | REM | Klokkerholm Møllesø | Perch | Muscle | 57.214200 | 10.162200 |
| DK | FFI | REM | Stadil Fjord | Perch | Muscle | 56.159467 | 9.214378 |
| FIN | FFI | REM | River Juutua | Brown trout | Muscle | 68.906826 | 27.003609 |
| FIN | FFI | REM | Kivilahti | Perch | Whole fish | 68.796311 | 27.508358 |
| FIN | FFI | URB | Vallisaari | Perch | Whole fish | 60.131593 | 24.987946 |
| FO | FFI | REM | Fjallavatn | Brown trout (Salmo trutta) | Muscle | 62.115000 | -7.307333 |
| NO | FFI | URB | Mjøsa | Perch | Liver | 60.756030 | 11.076780 |
| SE | FFI | REM | Krageholmssjön | Perch | Muscle | 55.501152 | 13.744153 |
| SE | FFI | REM | Brännträsket | Perch | Muscle | 65.535092 | 21.396842 |
| DK | MFI | REM | Skagerrak | Cod | Liver | 57.758994 | 9.971547 |
| DK | MFI | URB | Aarhus Bugt | Cod | Liver | 56.141583 | 10.235250 |
| FO | MFI | REM | Mýlingsgrunnur | Cod | Liver | 62.366667 | -7.450000 |
| NO | MFI | URB | Inner Oslofjord | Cod | Liver | 59.832690 | 10.580430 |
| DK | MMA | REM | Horsens Fjord | Grey seal | Blubber | 55.853167 | 10.011667 |
| DK | MMA | REM | Sønderho, Fanø | Grey seal | Blubber | 55.347694 | 8.475139 |
| DK | PIN | REM | Tornby Klitplantage | Pine needles | 57.542878 | 9.918256 | |
| DK | PIN | REM | Låsby | Pine needles | 56.147667 | 9.819111 | |
| FIN | PIN | REM | Hollola | Pine needles | 61.058361 | 25.334975 | |
| FIN | PIN | REM | Inari | Pine needles | 68.905834 | 26.995323 | |
| FIN | PIN | URB | Helsinki | Pine needles | 60.220498 | 25.119256 | |
| FO | PIN | URB | Tórshavn | Pine needles | 62.016533 | -6.780533 | |
| FO | PIN | URB | Tórshavn | Pine needles | 62.016600 | -6.781300 | |
| ICE | PIN | URB | Reykjavík | Pine needles | 64.129973 | -21.876159 | |
| NO | PIN | REM | Birkenes | Pine needles | 58.390590 | 8.248255 | |
| SE | PIN | REM | Råö | Pine needles | 57.393736 | 11.913671 | |
| FIN | TMA | REM | Kurkimäki | Moose | Liver | 62.798703 | 27.499224 |
| FIN | TMA | REM | Kurkimäki | Moose | Muscle | 62.798703 | 27.499224 |
| FIN | TMA | REM | Oraniemi | Reindeer | Muscle | 67.644112 | 27.307775 |
| FIN | TMA | REM | Kutuharju station | Reindeer | Muscle | 68.775225 | 26.818071 |
| NO | TMA | REM | Folldal Einunnfjeller | Red deer | Muscle | 62.202270 | 10.350730 |
| NO | TMA | REM | Folldal Knutshø | Reindeer | Muscle | 62.239830 | 9.891900 |
| NO | TMA | REM | Folldal Sønkletten | Reindeer | Muscle | 62.075170 | 10.052170 |
| SE | TMA | REM | Grimsö | Moose | Muscle | 57.704792 | 15.576077 |
| SE | TMA | REM | Norrkaitum Sameby | Reindeer | Muscle | 68.262938 | 19.857487 |
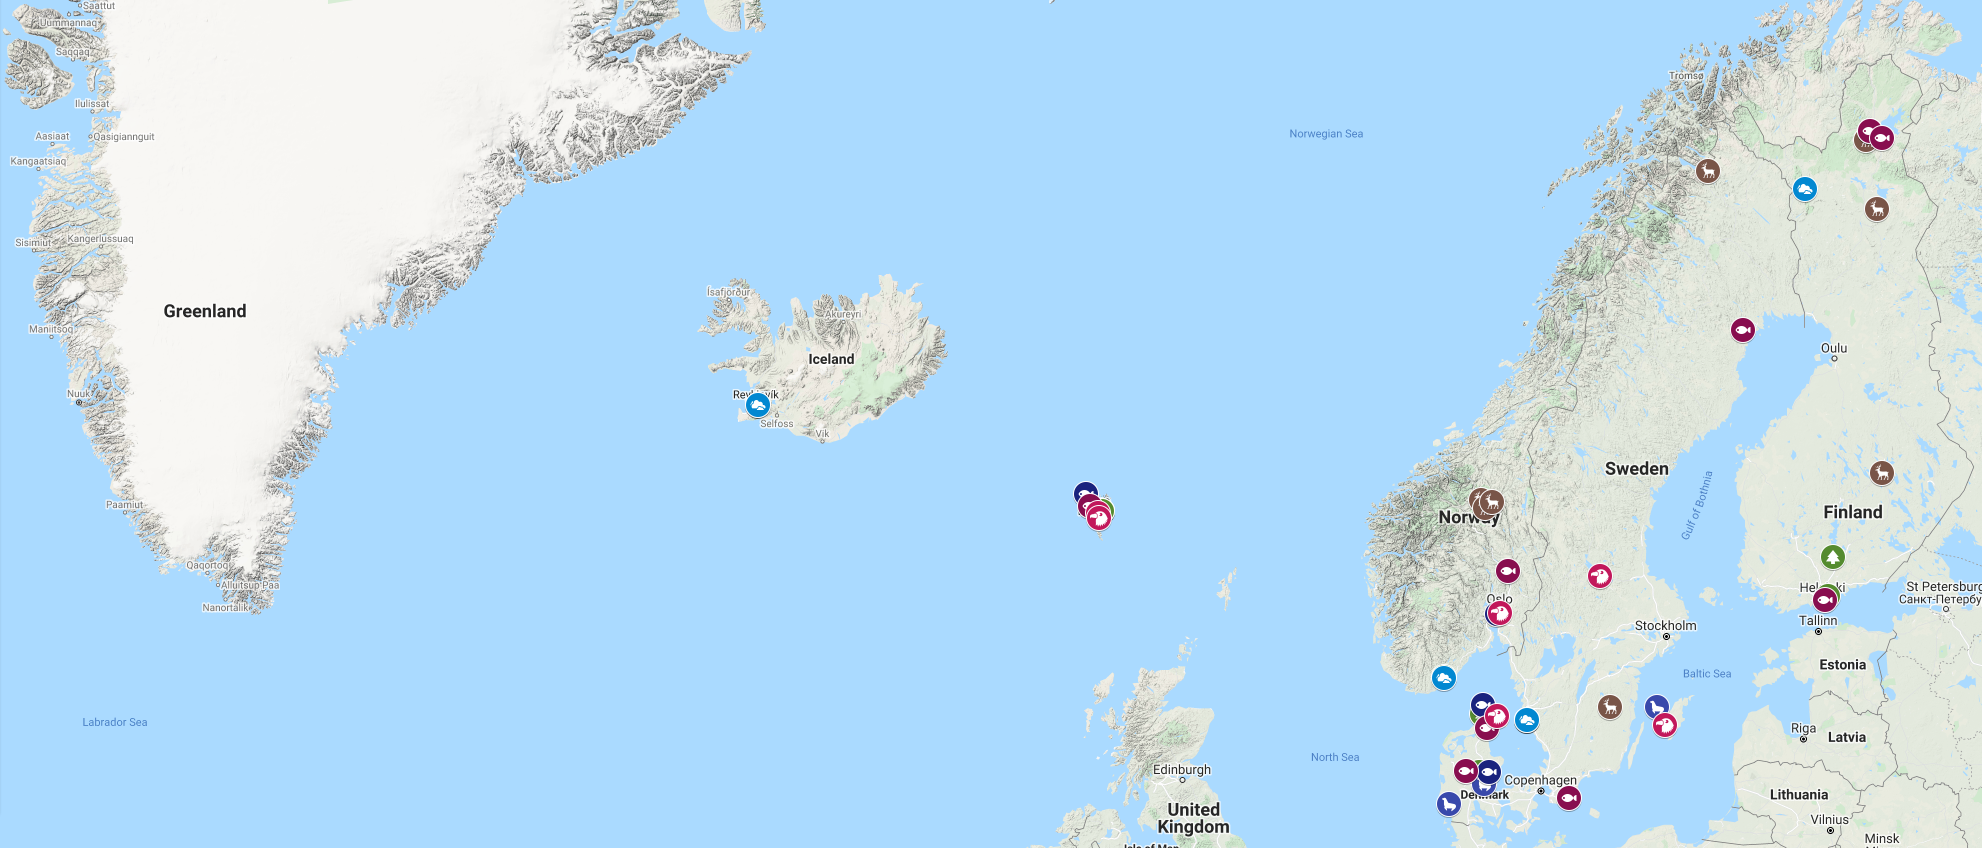
Figure 3: Overview of all sampling sites and sample types of this study.

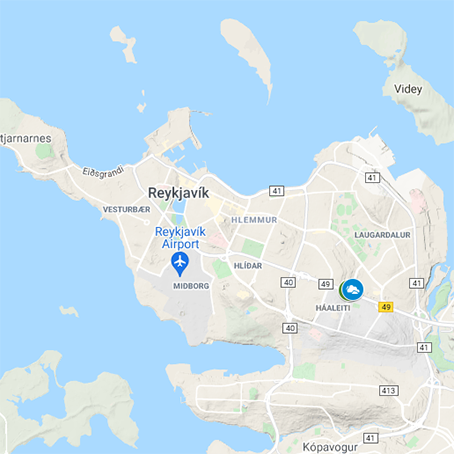
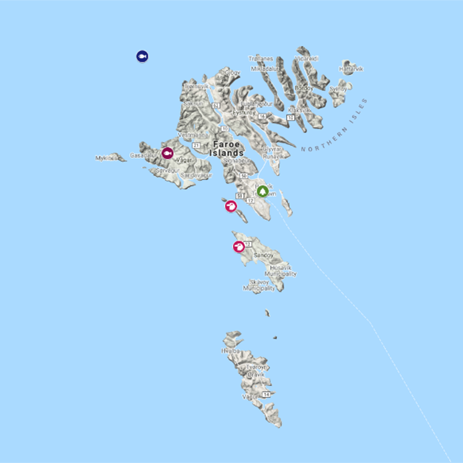
Figure 4: Sampling sites in Reykjavik, Iceland and on Faroe Islands.
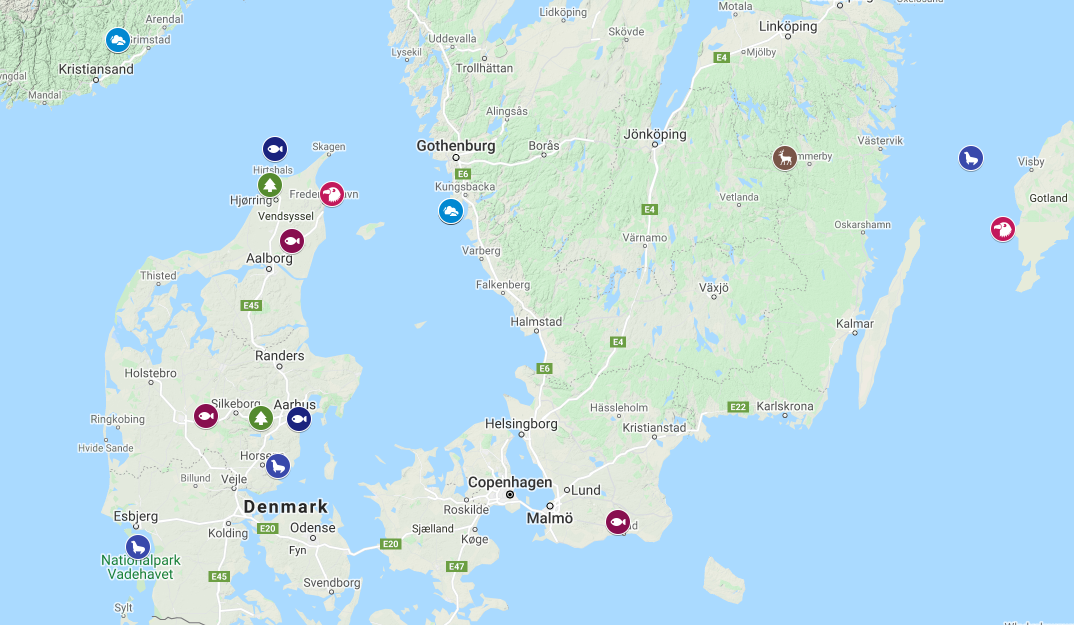
Figure 5: Sampling sites in Southern Scandinavia
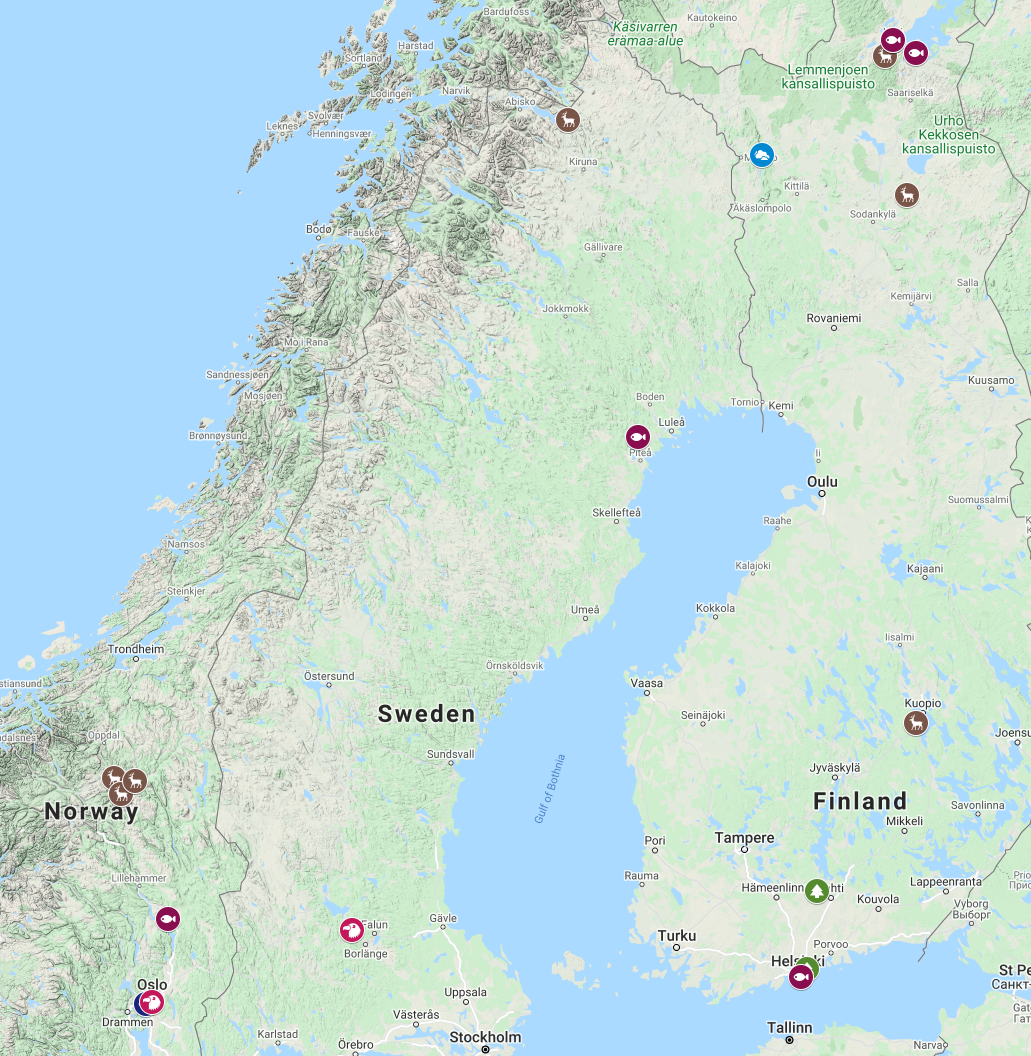
Figure 6: Sampling sites in central and North-eastern Scandinavia.
2.2 Chemical Analysis
2.2.1 UV-filters
2.2.1.1 Sample extraction and clean-up
Samples were spiked with isotopically labelled internal standards before extraction. The samples were also added zinc chloride solution to improve extraction efficiency. Samples were then extracted twice with organic solvents in an ultrasonic bath. The organic-solvent extracts were removed and concentrated with vacuum under nitrogen flow before clean up with gel permeation chromatography (GPC). Most samples were also undergoing a final clean-up step with PSA sorbent to remove interferences. The final extracts were filtered using Spin-X 0.2 µm and concentrated to approximately 0.2 mL prior to the analysis.
2.2.1.2 Instrumental Analysis
Samples from egg, fish and mammals were analysed with Agilent 7890B GC system equipped with two 15-meter HP-5MS-UI columns coupled to an Agilent 7010B GC-MS Triple Quad operated in EI mode.
2.2.2 Dechloranes
2.2.2.1 Sample extraction and clean-up
Prior to extraction, the samples were added a mixture of isotope labelled PCB, SCCP (one single isomer) and dechloranes for quantification purposes. The water-, sediment-and biota-samples were extracted with organic solvents and concentrated under nitrogen flow, followed by a clean-up procedure using concentrated sulphuric acid and a silica column to remove lipids and other interferences prior to analysis.
2.2.2.2 Analysis
Prior to analysis, all samples were concentrated to ~150 µL sample volume. The extracts were injected into an Agilent 7890N GC system coupled to an Agilent 7200 QToF mass spectrometer operated in electron capture negative ionization mode (GC-ECNI-HRMS) and PCB-153 and the dechlorane compounds were quantified based on the use of internal standards.
2.2.3 Chlorinated paraffins
2.2.3.1 Sample extraction and clean-up
Prior to extraction, the samples were added a mixture of isotope labelled PCB, SCCP (one single isomer) and dechloranes for quantification purposes. The water-, sediment-and biota-samples were extracted with organic solvents and concentrated under nitrogen flow, followed by a clean-up procedure using concentrated sulphuric acid and a silica column to remove lipids and other interferences prior to analysis.
2.2.3.2 Analysis
Chlorinated paraffins both SCCPs, MCCPs, and LCCPs are complex mixtures of chlorinated alkanes with varying carbon chain length, varying degree of chlorination and position of the chlorines. The analytical tools available today cannot separate the different structural isomers (congeners) and today only mixtures can be separated and quantified. This is in contrast to UV-compounds and dechloranes which were analysed with a compound specific analytical method. Prior to analysis, all samples were concentrated to ~150 µL sample volume. SCCPs and MCCPs were analyzed using an Agilent 7890B GC, 7200 QToF (GC/HRMS). To achieve a necessary separation, an HP-5MS UI 15 m×0.25 mm id, fused silica capillary column was used with a constant Helium flow of 1.2 mL/min. PTV injection solvent vent mode. The GC temperature program for SCCPs was: 55 ˚C (2 mins), 70 ˚C/min to 200˚C (1 min), 10 ˚C/min to 280˚C (1 min), 10 ˚C/min to 310˚C (0 mins), 70 ˚C/min to 325˚C, 4 mins. The MS was operated in ECNI mode using methane as moderating gas. A selection of [M-Cl]- or [M-HCl]- ions for both SCCPs and MCCPs were extracted and the quantification was performed according to a method described by (Tomy et al., 1997). 13C-labelled hexachlorodecane was used as internal standard. LCCPs were analyzed using an Agilent 1290 UHPLC, 6546 QToF (LC/HRMS). To achieve a necessary separation, an ACE Excel 5 Super C18, 75x2.1 mm column was used with a constant flow of 0.4 mL/min. The mobile phase was at start 70% water and 30% MeOH both containing 0.05mM of tetramethylammonium chloride. After 5 mins the mobile phase was adjusted to 100% of MeOH with 0.05mM of tetramethylammonium chloride. The MS was operated in negative ESI mode. A selection of [M+Cl]- ions were extracted and the quantification was performed according to (Bogdal et al., 2015).
2.3 Limit of detection
The limits of detection (LoD) for both UV-compounds, dechloranes and chlorinated paraffins were calculated for each sample, using a standard method described by IUPAC (IUPAC Goldbook, 2019), i.e. the average of blanks plus 3 times the standard deviation for blanks. As samples are analysed in batches, separate blank samples with various results were relevant for the different batches, which in some circumstances lead to deviating LoD for the same sample type.
2.4 Uncertainties
When performing environmental screening studies for contaminants of emerging concern, all steps in the process, starting with study design, selection of the sampling sites, sampling frequency, time of sampling, performing the sampling, the transport and storage of samples, chemical analysis and data treatment, to some extent generate some degree of uncertainty (Thomas et al., 2014). To quantitatively estimate the contribution of all steps is an extremely difficult task. However, we will discuss the relevance of the different contributions in a qualitative way.
2.4.1 Study design
The concentrations of the different compounds of interest in environmental samples vary considerably due to variations in sample types and by biological, temporal, or local variations. Different important decisions may have an influence on the outcome of the study such as the selection of sample sites, relevant season, relevant selection of sample types, right balance between number of individual samples contra number of different sampling sites.
2.4.2 Sampling and sample handling
Factors with influence on sampling uncertainty are analyte loss due to adsorption to sample containers, contamination (for some compounds), and degradation during transport and storage. An important factor especially for pine needles is the problem in preparation of representative and homogenous sub-samples. Pine needles are very heterogeneous matrices as exposure to the deposition of pollutants is depending on exposure time and also position of the needles on the trees. In theory it is possible to prepare pine needle composite samples in a way that identical subsamples can be taken. However, this would require that needles from all part of the tree are sampled and homogenized for several days with specialized equipment. The complete homogenisation of all samples, aiming for identical subsamples, would consume the whole budget for chemical analysis. In addition extensive sample treatment can have negative impact on the integrity of the true concentration of the analytes, either due to contamination or due to loss by evaporation or adsorption to the homogenisation instruments in use. Therefore, normal practice in a study like this is to find an acceptable balance between homogeneity and limited sample pretreatment. The following example may illustrate the consequence for this study: If it is the case that most of the CP-load of pine needle sample is bound to only five microplastic particles in this sample, it will be impossible to make ten identical sub-samples without disintegrating and milling these particles. This example is obviously quite extreme, but it illustrates that the concentration of particle bound pollutants may vary considerably from sub-sample to sub-sample.
2.4.3 Chemical analysis
The uncertainty of the chemical analysis is governed by sample homogeneity, loss during extraction and clean-up, interference from other compounds, trueness of analytical standards, instrumental parameters, and contamination at all stages of work.
A normal approach to estimate and quantify these factors is the participation in a laboratory intercalibration. However, the analyses of these compounds are still in a developing phase and only a limited number of intercalibration studies are available. The uncertainty is expected to be larger for compounds which are analysed infrequently than for compounds which are analyzed commonly. That means that most compounds will probably have analytical uncertainties in the range of 20 to 40% for the compound specific methods (UV-compounds and dechloranes), where single standards for each compound are available. For the CPs, where only a mixture analysis is possible the uncertainty is estimated to be much higher. SCCPs and MCCPs consists of several thousand different compounds. Further, each congener group will consist of several hundred different isomers where complete chromatographic separation is impossible to achieve with present technology. Hence single congener standards are not possible to isolate from a crude mixture and the ones available are very limited and not chemically representative. The analytical response factors within the different congener groups will then not be possible to determine when the signals of the single congeners are overlapping. The responses will most likely depend greatly on the chlorine positions and are therefore subject to great variations. One of the most common approaches to quantification is to use average response factors from a number of standard mixtures, which are limited, with the closest resemblance to the samples as possible. Another approach which has been widely accepted during the last years is the deconvolution method. This method is based on the linear combination of several standard mixtures to determine response factors which is applied to the samples. The limitations are again the standard mixtures available, but most likely this approach is by now the most promising way to quantify CPs in environmental samples. Another addition to the great uncertainty in GC/MS analysis of CPs is the fact that response factors increase with increasing concentrations. This means that not only is it important to incorporate standards or a combination of standards with pattern resemblance, but also incorporate standards with responses within each congener group according to the samples. The latter is much more important in CP analysis than traditional single compound analysis even when the responses are within the instruments linear area.
For all analytes we consider the analytical uncertainty as adequate for a screening study, however, to use these results for future time trend studies is not advisable.
2.4.4 Overall uncertainty
To test and illustrate some of the above mentioned effects NILU have analyzed parallel subsamples of three pine needle samples for SCCPs, MCCPs, and LCCPs (se Table 5). Pine needles are a matrix, which is expected to be very inhomogeneous due to the fact that needles will be of different age or exposure time, different exposure to deposal and removal mechanisms depending on the position towards wind, rain and solar radiation. In addition the surface area is very large compared to the sample weight and have a high affinity to attract potential contamination during sampling, sample storage, and homogenization. Furthermore, CP analyses are expected to have a much higher analytical uncertainty compared to UV compounds and dechloranes. In contrast to the other sample types and analytes, pine needles and CPs will be a worst case test. The first two parallels were treated as the other pine needle samples. The third parallel of each sample were washed with double-distilled water in order to remove non-bound depositions.
| Country | Sample site | Parallel | SCCPs | MCCPs ng/g dw | LCCPs |
| FIN | Hollola | Normal 1 | 44.5 | 55.3 | 303 |
| Normal 2 | <20 | <20 | <20 | ||
| Extra wash | 23.0 | 123 | <20 | ||
| NO | Birkenes | Normal 1 | <3 | <6 | <20 |
| Normal 2 | <3 | 59.7 | <20 | ||
| Extra wash | <3 | 47.0 | <20 | ||
| ICE | Reykjavík | Normal 1 | 4.03 | 10.5 | 5.90 |
| Normal 2 | 60.1 | 198 | 72.8 | ||
| Extra wash | 61.2 | 174 | 51.2 |
Table 5: Results from parallel analysis of three randomly selected pine needle samples of this study.
The variation of the parallels of each sample are higher than assessed for the chemical measurements only (chapter 2.4.3). A considerable part of the additional uncertainty is related to sample inhomogeneity. Whereas animal tissue of a given type, like muscle, blubber or liver, from one individual animal show little variation in pollutant concentration, this is not the case for needles from pine trees or other conifers. In contrast to animals there are nearly no internal transport of pollutants in most type of plants and the measured level are the result of direct pollutant uptake in the needles or leaves. Uptake is mainly depending on air concentration, particle deposition, temperature, wind speed, and exposure time (Hellstrom, 2003). Whereas air concentration is more or less the same on all places in a canopy, particle deposition is very depending on the density of the vegetation around the individual needles, which results in significant influence of the position on the tree and on the density of the forest on pollutant content in the needles (Kylin et al., 2003). In the context of this study it was not possible to homogenize the complete sample delivered to the lab, only the amount used for each single analysis was mixed before extraction. In order to reduce variation a very strict and rigorous sampling regime for pine needle samples should be applied, as described by the German Environmental Specimen bank (Klein et al., 2018).
3 Results and Discussion
3.1 UV-filters
3.1.1 Bird eggs
Egg samples of black guillemot (Cepphus grylle), common guillemot (Uria aalge), fulmar (Fulmarus glacialis), herring gull (Larus argentatus), and Ural owl (Strix uralensis) from different Nordic countries were analysed for a selected range of UV filters. In this study in total 6 out of 10 selected UV-compounds could be detected: EHMC-E, OC, UV-320, UV-326, UV-327, and UV-328, see Table 6.
| EHMC-E | OC | UV-320 | UV-326 | UV-327 | UV-328 | |
| Sample type (number) | (Min-max) Average Detection frequency | ng/g ww | ||||
| Bird eggs
(14) | (<1.5-1.89) 1.73 14% | (<1.2-1.36) 1.29 21% | (<0.05-0.19) 0.13 21% | (<0.1-0.40) 0.40 7% | (<0.04-0.22) 0.10 50% | (<0.05-1.83) 0.38 43% |
Table 6: Concentration of UV filters in samples of bird eggs (Black guillemot, Common guillemot, Fulmar, Herring gull, and Ural owl).
For the calculation of the average concentration only results above the limit of detection (LoD) are included.
Since there were taken different species in the different areas, no specific spatial trend could be observed. In addition, it was not possible to identify bioaccumulation. It should be mentioned that for herring gull eggs, 8 eggs were collected at the same site (Græsholmen, Denmark) and analysed individually, whereas other species and sites only are represented by single samples or composite samples made from very few subsamples. In consequence, the reported average might be dominated by a single species, from one site.
The herring gull sample from Inner Oslofjord was the most contaminated sample in this study with the highest number of UV-compounds above LoD. In this sample UV-328 was significantly higher than in all remote samples (Figure 7), which could be related to the urban feeding habits of the Inner Oslofjord population.
The concentrations of UV compounds measured in this study are in the same range as earlier findings in the Norwegian screening study of 2017 (Schlabach et al., 2018). However, in the follow up screening study 2018 some Herring gull samples from Inner Oslofjord showed much higher concentrations of UV-328 of up to 60 ng/g w.w. (Schlabach et al., 2019).
Figure 7: UV-328 levels in bird eggs. Results below LoD (0.05 ng/g) are not shown.
With exception of the Ural owl all bird species are related to the marine food web. Interestingly, Ural owl is also one of the species in this study with the lowest detection frequency and contamination level for the UV-compounds.
3.1.2 Freshwater fish
Perch (Perca fluviatilis) and brown trout (Salmo trutta) were selected for this study. For brown trout muscle sample were taken and analysed. For perch both whole fish, muscle and liver samples were taken and analysed. Only in the liver sample of perch from lake Mjøsa in Norway it was possible to detect three UV-filters above LoD, see Table 7.
| UV-320 | UV-327 | UV-328 | |
| Sample type (Number) | (Min-max) Average Detection frequency | ng/g ww | |
| Freshwater fish (19) | (<0.03-0.05) 0.05 5% | (<0.04-0.10) 0.10 5% | (<0.06-0.12) 0.12 5% |
Table 7: Concentration of UV filters in samples of liver, muscle, and whole fish of freshwater fish (Brown trout and perch) .
For the calculation of the average concentration only results above the limit of detection (LoD) are included.
The concentrations of the detected UV compounds in this study are in the same range as earlier findings in the Norwegian screening study of 2017 (Schlabach et al., 2018).
3.1.3 Marine fish
Cod (Gadus morhua) were selected as marine fish for this study and taken in both open sea and in bays/fjords close to urban settlements. Four UV-filters could be detected frequently in cod liver samples, see Table 8. Samples taken in the open sea around Faroe Islands showed the lowest concentration close to LoD, whereas both the Skagerrak and Aarhus sample showed slightly elevated concentrations of UV-320, 327, 328, and 329. Highest concentrations, especially of UV-328 were detected in the cod liver from Inner Oslofjord. The level of UV-328 in cod liver from Inner Oslofjord was in the same range as an earlier measurement from the same area: 16.2 ng/g ww (Ruus et al., 2019).
| BP3 | UV-320 | UV-327 | UV-328 | UV-329 | |
| Sample type (Number) | (Min-max) Average Detection frequency | ng/g ww | |||
| Cod liver (5) | (<0.2-0.29) 0.29 20% | (<0.05-2.15) 0.86 60% | (<0.05-1.83) 0.95 60% | (<0.06-7.53) 2.11 80% | (<0.20-2.78) 1.31 60% |
Table 8: Concentration of UV filters in liver samples of cod.
For the calculation of the average concentration only results above the limit of detection (LoD) are included.
3.1.4 Marine mammals
Two samples of blubber of grey seal (Halichoerus grypus) were delivered by Denmark. Three UV-filters (UV-320, UV-327, and UV-328) could be detected in these samples, see Table 9. In the Norwegian screening study of 2017 (Schlabach et al., 2018) blood plasma samples of polar bear from Svalbard were analyzed, however, the compounds, which were detected in grey seal from Denmark (UV-320, UV-327, and UV-328), were below LoD (~0.3 ng/g ww) in polar bear plasma.
| UV-320 | UV-327 | UV-328 | |
| Sample type (Number) | (Min-max) Average Detection frequency | ng/g ww | |
| Seal blubber (2) | (0.10-0.29) 0.20 100% | (<0.20-0.60) 0.60 50% | (<0.10-0.80) 0.80 50% |
Table 9: Concentration of UV filters in samples of marine mammals.
For the calculation of the average concentration only results above the limit of detection (LoD) are included.
3.1.5 Terrestrial mammals
Moose (Alces alces), red deer (Cervus elaphus), and reindeer (Rangifer tarandus) samples were analysed for UV-filters. None of the selected UV-filters could be detected in samples of the selected terrestrial mammals.
3.2 Dechloranes
3.2.1 Bird eggs
Egg samples of Black guillemot (Cepphus grylle), Common guillemot (Uria aalge), Fulmar (Fulmarus glacialis), Herring gull (Larus argentatus), and Ural owl (Strix uralensis) from different Nordic countries were analysed for selected dechloranes. In this study the dechlorane derivate Dec-602 was detected in all species and Dec603 was detected in most species (Table 10). However, the two parent compounds DPsyn and DPanti were only detected in herring gull eggs.
| Dec602 | Dec603 | DPsyn | DPanti | |
| Sample type | (Min-max) Average Detection frequency | ng/g ww | ||
| Bird eggs | (0.03-0.52) 0.17 100% | (<0.01-0.11) 0.05 71% | (<0.11-0.29) 0.29 7% | (<0.12-0.80) 0.32 29% |
Table 10: Concentration of Dechloranes in samples of bird eggs (Black guillemot, Common guillemot, Fulmar, Herring gull, and Ural owl).
For the calculation of the average concentration only results above the limit of detection (LoD) are included.
Since there were taken different species in the different areas, no clear spatial trend could be observed. In addition, it is difficult to identify bioaccumulation. It should be mentioned that for herring gull eggs, 8 eggs were collected at the same site (Græsholmen, Denmark) and analysed individually, whereas other species and sites only are represented by single samples or composite samples made from very few subsamples. In consequence, the reported average might be dominated by a single species, from one site.
The levels of Dec-602 measured here were in the same range as found in the Norwegian screening study 2017 (Schlabach et al., 2018). The detection frequency and levels of DPsyn and DPanti were higher in the Norwegian study 2017, compared to what is found in the current study. However, different species were selected. In herring gull sample from Inner Oslofjord the concentration of DPsyn and DPanti is significantly higher than in all remote samples (Figure 8), which could be related to the urban feeding habits of the Inner Oslofjord population. These levels are in the same range as earlier reported averages from the same area DPsyn/anti 0.18/0.62 ng/g f.w. (Ruus et al., 2018).
Figure 8: DPsyn and DPanti levels in bird eggs
3.2.2 Freshwater fish
Perch (Perca fluviatilis) and Brown trout (Salmo trutta) were selected for this study. For brown trout muscle sample were taken and analysed. For perch both whole fish, muscle and liver samples were taken and analysed. Only Dec602 were detected in more than one sample. Dec602 was detected in all samples of brown trout and in samples of perch from urban sampling sites (Table 11). The parent compound DPanti was only detected in one sample, namely perch liver from Lake Mjøsa (Table 11).
The levels of Dec-602 measured in Brown trout from Finland were in the same range as in Brown trout from Lake Mjøsa measured in the Norwegian freshwater ecosystem monitoring in 2017 (Jartun et al., 2018).
| Dec602 | DPanti | |
| Sample type (Number) | (Min-max) Average Detection frequency | ng/g ww |
| Brown trout (3) | (0.010-0.019) 0.014 100% | (0.02) 0% |
| Perch URB (6) | (<0.005-0.020) 0.009 67% | (<0.02-0.32) 0.32 17% |
Table 11: Concentration of Dechloranes in samples of muscle of brown trout from remote areas and whole fish or liver of perch from urban areas.
For the calculation of the average concentration only results above the limit of detection (LoD) are included.
3.2.3 Marine fish
Cod (Gadus morhua) were selected as marine fish for this study and taken in both open sea and in bays/fjords close to urban settlements. The two dechlorane derivates Dec602 and 603 could be detected frequently in cod liver samples (Table 12). In contrast to UV-compounds, remote and urban cod liver samples show concentrations in the same order of magnitude.
| Dec602 | Dec603 | |
| Sample type (Number) | (Min-max) Average Detection frequency | ng/g ww |
| Cod liver | (0.06-0.29) 0.013 100% | (<0.01-0.08) 0.04 60% |
Table 12: Concentration of Dechloranes in liver samples of cod (Gadus morhua).
For the calculation of the average concentration only results above the limit of detection (LoD) are included.
The levels of Dec-602 and Dec603 in cod liver samples in this study are lower compared to Norwegian measurements in cod liver from Inner Oslofjord Dec-602/603: 0.68/0.16 ng/g f.w. (Ruus et al., 2018). This difference reflects the higher contamination level in the Inner Oslofjord, which must be described as an urban environment.
3.2.4 Marine mammals
Two samples of blubber of grey seal (Halichoerus grypus) were taken by Denmark. Four Dechloranes could be detected in these samples, see Table 13.
| Dec602 | Dec603 | DPsyn | DPanti | |
| Sample type | (Min-max) Average Detection frequency | ng/g ww | ||
| Seal blubber | (0.33-56-4) 28.4 100% | (<0.04-0.34) 0.34 50% | (<0.21-0.96) 0.96 50% | (<0.23-1.79 1.79 50% |
Table 13: Concentration of Dechloranes in samples of grey seal.
For the calculation of the average concentration only results above the limit of detection (LoD) are included.
The dechlorane levels measured in grey seal blubber from Denmark were significantly higher compared to levels measured in ringed seal liver from Svalbard with DPsyn/anti of 0.10/0.17 ng/g ww (Schlabach et al., 2017a). In addition the grey seal samples showed a different pattern with much higher concentration of Dec602 compared to DPsyn and anti. Dec602 was below LoD (<0.02 ng/g ww) in ringed seal liver.
3.2.5 Terrestrial mammals
Moose (Alces alces), red deer (Cervus elaphus), and reindeer (Rangifer tarandus) samples were analysed for dechloranes. Only Dec602 were frequently detected in samples of the selected terrestrial mammals.
| Dec602 | ||
| Sample type | (Min-max) Average Detection frequency | ng/g ww |
| Terrestrial mammals | (<0.001-0.032) 0.007 78% | |
Table 14: Concentration of Dechloranes in samples of liver and muscle of terrestrial mammals.
Dechloranes were earlier detected in red foxes from urban environments (bigger Oslo area) with around 10 times higher Dec602 concentrations, whereas DPsyn and DPanti were measured above LoD with mean concentrations of syn/anti 0.17/0.19 ng/g ww (Heimstad et al., 2019).
3.2.6 Air
Ambient air samples were taken at four different stations, three remote stations: Råö, Sweden, Birkenes, Norway, and Pallas, Finland; and one urban station: Reykjavik, Iceland. In contrast to all other samples of this study, relevant field blank samples were available for ambient air. None of the dechlorane compounds were detected in the field blank samples.
DPsyn was detected at Birkenes and Reykjavik stations, whereas DPanti was detected at Råö, Birkenes, and Reykjavik. There was no significant difference observed between the urban and remote sites for these compounds. These levels are in the same range as measured at the Norwegian air monitoring observatories Birkenes and Zeppelin (Bohlin-Nizzetto et al., 2020).
| DPsyn | DPanti | |
| Sample type (Number) | (Min-max) Average Detection frequency | pg/m3 |
| Ambient air (11) | (<0.02-0.27) 0.17 36% | (<0.02-0.95) 0.37 73% |
Table 15: Concentration of Dechloranes in ambient air.
For the calculation of the average concentration only results above the limit of detection (LoD) are included.
3.2.7 Pine needles
Pine needles were collected at six remote sites: Tornby Klitplantage, Låsby, Hollola, Inari, Inari, Birkenes, and Råö; and three urban sites: Helsinki, Tórshavn, and Reykjavik. None of the selected dechloranes could be detected above LoD.
3.3 Chlorinated paraffins
3.3.1 Bird eggs
Egg samples of black guillemot (Cepphus grylle), common guillemot (Uria aalge), fulmar (Fulmarus glacialis), herring gull (Larus argentatus), and Ural owl (Strix uralensis) from different Nordic countries were analysed for selected chlorinated paraffins. In this study SCCPs and MCCPs were detected in all species and samples (Table 16). However, LCCPs were only found in two samples of herring gull eggs and in the egg sample from Ural owl.
| SCCPs | MCCPs | LCCPs | |
| Sample type | (Min-max) Average Detection frequency | ng/g ww | |
| Bird eggs (NMR) | (2.46-22.3) 10.4 100% | (11.7-79.6) 31.4 100% | (<10-341) 132 21% |
Table 16: Concentration of chlorinated paraffins in samples of bird eggs (Black guillemot, common guillemot, fulmar, herring gull, and Ural owl).
For the calculation of the average concentration only results above the limit of detection (LoD) are included.
Since there were taken different species in the different areas, no specific spatial trend could be observed. In addition, it was not possible to identify bioaccumulation. It should be mentioned that for herring gull eggs, 8 eggs were collected at the same site (Græsholmen, Denmark) and analysed individually, whereas other species and sites only are represented by single samples or composite samples made from very few subsamples. In consequence, the reported average might be dominated by a single species, from one site.
For nearly all bird egg samples the concentrations of MCCPs were higher than the SCCP concentrations. For the cases where LCCPs were detected, the concentration was as high or higher than the SCCP concentration. It was not possible to identify a spatial trend in this sample set, and no significant difference between remote and urban sample was found. Taking into account that the results in this report are given in ng/g wet weight (ww) and the results in an earlier study in Scandinavia are reported on lipid weight (lw), the concentrations are in the same order of magnitude (Yuan et al., 2019b). However, in bird eggs from the urban terrestrial environment in the Oslo area much higher concentrations of SCCPs and MCCPs were frequently detected (Heimstad et al., 2019). For nearly all samples the concentrations of MCCPs are higher than the SCCP concentration. The same is true for the few cases were LCCPs were detected above LoD.
3.3.2 Freshwater fish
Perch (Perca fluviatilis) and brown trout (Salmo trutta) were selected for this study. For brown trout muscle sample were taken and analysed. For perch both whole fish, muscle and liver samples were taken and analysed. SCCPs and MCCPs were detected in most of the samples. LCCPs were detected in about 50% of all samples (Table 17).
| SCCPs | MCCPs | LCCPs | |
| Sample type (Number) | (Min-max) Average Detection frequency | ng/g ww | |
| Brown trout REM (3) | (<0.25-9.04) 7.27 67% | (<0.65-28.0) 22.5 67% | (<2-9.69) 8.75 67% |
| Perch REM (10) | (<0.25-4.04) 2.40 100% | (<0.65-31.9) 14.6 100% | (<2-5.02) 3.86 22% |
| Perch URB (6) | (<0.60-42.4) 14.8 83% | (<1.52-138) 44.0 83% | (<2-37.8) 16.5 83% |
Table 17: Concentration of chlorinated paraffins in samples of muscle of brown trout and samples of muscle and whole perch from remote areas, and in samples of liver and whole perch form urban areas.
For the calculation of the average concentration only results above the limit of detection (LoD) are included.
For nearly all samples of freshwater fish the concentrations of MCCPs were higher than the SCCP concentrations. For the cases were LCCPs were detected, the concentration was as high as the SCCP concentration. The levels of SCCPs and MCCPs were in the same range as measured in pooled samples of fish liver of brown trout, perch and pike taken at more than 10 different Norwegian lakes (Jartun et al., 2018). To our best knowledge this is the first time LCCPs were detected in freshwater fish from the Nordic environment. For nearly all samples the concentrations of MCCPs are higher than the SCCP concentration. For the cases were LCCPs were detected, the concentration was as high as the SCCP concentration.
3.3.3 Marine fish
Cod (Gadus morhua) were selected as marine fish for this study and taken in both open sea and in bays/fjords close to urban settlements. SCCPs and MCCPs could be detected in all samples (Table 18) and LCCPs were detected in 60% of all samples. Remote and urban samples show concentrations in the same order of magnitude. However, the sample from Inner Oslofjord showed slightly higher concentrations for all three compound groups (Figure 9). For all cod liver samples the concentrations of MCCPs were in the same range as the SCCP concentrations. For the cases where LCCPs were detected, the concentration was as high or higher than the SCCP concentration. The SCCPs and MCCPs levels measured in this study were lower than in cod liver from earlier measurements from Inner Oslofjord (Ruus et al., 2019, Ruus et al., 2018).
| SCCPs | MCCPs | LCCPs | |
| Sample type (Number) | (Min-max) Average Detection frequency | ng/g ww | |
| Cod liver (5) | (15.7-75.4) 33.9 100% | (22.0-106) 52.0 100% | (<10-143) 132 60% |
Table 18: Concentration of chlorinated paraffins in liver samples of cod.
Figure 9: Levels of CPs in cod liver samples.
3.3.4 Marine mammals
Two samples of blubber of grey seal (Halichoerus grypus) were delivered by Denmark. All three compound groups could be detected in one or the other of the two samples (Table 19). The measured levels of SCCPs, MCCPs, and LCCPs are in the same range as measured earlier by (Yuan et al., 2019b).
| SCCPs | MCCPs | LCCPs | |
| Sample type (Number) | (Min-max) Average Detection frequency | ng/g ww | |
| Seal blubber (2) | (<20-166) 166 50% | (<20-48.8) 48.8 50% | (<20-284) 132 50% |
Table 19: Concentration of Chlorinated paraffins in samples of marine mammals.
3.3.5 Terrestrial mammals
Moose (Alces alces), red deer (Cervus elaphus), and reindeer (Rangifer tarandus) samples were analysed for chlorinated paraffins. SCCPs and MCCPs were detected in all samples of selected terrestrial mammals (Table 20). LCCPs were detected in 60% of all selected samples. For nearly all samples of terrestrial mammals the concentrations of MCCPs were as high as the SCCP concentrations. For the cases were LCCPs were detected, the concentration was in the same range as the SCCP concentrations.Taking into account that the concentrations in this study were given on wet weight base and given a very low fat content in muscle of moose and deer, these levels are in the same order of magnitude as measured recently by (Yuan et al., 2019b).
| SCCPs | MCCPs | LCCPs | |
| Sample type (Number) | (Min-max) Average Detection frequency | ng/g ww | |
| Terrestrial mammals (9) | (0.57-11.9) 4.70 100% | (2.55-14.5) 9.68 100% | (<21-13.8) 10.1 60% |
Table 20: Concentration of Chlorinated paraffins in samples of liver and muscle of terrestrial mammals.
3.3.6 Air
Ambient air samples were taken at four different stations, three remote stations: Råö, Sweden, Birkenes, Norway, and Pallas, Finland; and one urban station: Reykjavik, Iceland. In contrast to all other samples of this study for ambient air relevant field blank samples were available (Table 21). The measured levels of CPs were depending on the total amount of air volume sampled and were well below the levels measured in real samples. Field blank concentrations were subtracted, when calculating the ambient air concentration reported here.
SCCPs were found in all samples from all stations (Table 21). MCCPs and LCCPs were found in 73% of all samples. In contrast to most of the biota samples the concentrations of SCCPs, MCCPs, and LCCPs were quite similar for the remote air samples. SCCPs and MCCPs showed significantly higher concentrations in ambient air taken at the urban site in Reykjavik. The levels of SCCPs and MCCPs measured at the remote site were in the same range as measured at the Norwegian air monitoring observatory Birkenes (Bohlin-Nizzetto et al., 2020) and the Swedish air monitoring stations Råö and Aspvreten (Fredricsson et al., 2021).
| SCCPs | MCCPs | LCCPs | |
| Sample type (Number) | (Min-max) Average Detection frequency | ng/g ww | |
| Ambient air REM (8) | (43.6-547) 194 100% | (<1160-2612) 570 63% | (<100-190) 97.0 63% |
| Ambient air URB (3) | (1792-3006) 2473 100% | (1160-1606) 1325 100% | (12452-33548) 21202 100% |
| Field blank air | ~8 | ~12 | ~14 |
Table 21: Concentration of chlorinated paraffins in samples of ambient air from the three remote sites (Råö, Birkenes, and Pallas), from the urban site (Reykjavik), and field blank samples.
The levels of SCCPs and MCCPs measured at the urban site were in the same range as measurements with passive air samplers in Oslo, SCCPs/MCCPs: 300-5900/80-1130 pg/m3 (Heimstad et al., 2018, Heimstad et al., 2019, Heimstad et al., 2020). However, the Oslo sampling sites were not as close to main roads as the Reykjavik site in this study. In addition, passive air sampling often underestimate particle bound pollutants.
In contrast to the biota samples the concentrations of SCCPs, MCCPs, and LCCPs were quite similar for the remote air samples. In the urban air sample from Reykjavik LCCPs were highest and MCCPs lowest.
The higher levels of CPs found in urban air might be caused by tire wear particles (TWP). A recent study measured low but significant levels of all three CP classes in car tires (Brandsma et al., 2019). However, other sources of chlorinated paraffins cannot be excluded.
3.3.7 Pine needles
Pine needles were collected at six remote sites: Tornby Klitplantage, Låsby, Hollola, Inari, Birkenes, and Råö; and three urban sites: Helsinki, Tórshavn, and Reykjavik. All three compound groups were frequently found in all samples (Table 22 to Table 23). To our best knowledge this is the first time SCCPs, MCCPs, and LCCPs were detected in pine needles from the Nordic environment. The SCCP levels found in this study were one or two orders of magnitude lower compared to measurements from Beijing, China: 400-4 010 ng/g dw (Wang et al., 2015) and in the same range as samples from the European Alps: 26-450 ng/g dw (Iozza et al., 2009).
| SCCPs | MCCPs | LCCPs | |
| Sample type (Number) | (Min-max) Average Detection frequency | ng/g ww | |
| Pine needles REM | (<3-297) 112 50% | (<6-72.5) 38.4 60% | (<20-1296) 687 30% |
| Pine needles URB | (3.38-198) 48.9 100% | (10.5-31.8) 22.9 100% | (1<20-1035) 436 80% |
Table 22: Summarized overview over concentration of chlorinated paraffins in samples of pine needles from remote and urban sites.
| SCCPs | MCCPs | LCCPs | |
| ng/g dw | |||
| Tornby REM | 166 | 13.7 | <20 |
| Låsby REM | 297 | 18.5 | <20 |
| Hollola REM | 44.5 | 55.3 | 303 |
| Inari REM | 23.8 | 72.5 | 461 |
| Inari REM | 26.9 | 69.2 | 1296 |
| Birkenes REM | <3 | <6 | <20 |
| Birkenes REM | <3 | <6 | <50 |
| Birkenes REM | <3 | <6 | <20 |
| Råö REM | <3 | <6 | <20 |
| Råö REM | <3 | 1.39 | <20 |
| Helsinki URB | 198 | 27.9 | <20 |
| Tórshavn URB | 30.1 | 31.8 | 1035 |
| Tórshavn URB | 3.38 | 23.4 | 275 |
| Tórshavn URB | 8.82 | 21.1 | 429 |
| Reykjavík URB | 4.03 | 10.5 | 5.90 |
Table 23: Detailed results of chlorinated paraffins in samples of pine needles from remote and urban sites.
As shown in chapter 2.4.4, the overall measurement uncertainty of the CP results of pine needles are very high and much higher than the measurement uncertainty for the other sample types. In contrast to air samples, no clear spatial trend nor remote/urban difference could be identified. Even with this higher uncertainty it is beyond any doubt that pine needles and of course any other vegetation even in very remote areas are contaminated by CPs. The only reasonable pathway for this contamination is atmospheric long range transport and deposition. The accumulation of CPs on pine needles and other vegetation can be an important driver for the elevated levels of CPs in terrestrial animals, which are feeding on these plants.
4 Conclusions
The selected UV-compounds were frequently detected in samples related to the marine food web (bird eggs, cod liver, and grey seal). Freshwater biota is much less polluted with UV-compounds and only the perch liver sample from Lake Mjøsa showed results above detection limit. In samples of terrestrial mammals, it was not possible to detect any of these UV-compounds. The compounds UV‑320, 327, and 328 were most frequently found. The Herring gull sample from Inner Oslofjord was the most contaminated sample in this study with the highest number of UV-compounds above LoD. In this sample, UV-328 was significantly higher than in all remote samples, which could be related to the urban feeding habits of the Inner Oslofjord population. The results of this study confirm earlier findings of the UV-compounds in the Nordic environment and are highly relevant for the ongoing process in the review committee of the Stockholm convention.
In the group of dechloranes, Dec602 was detected most frequently in samples related to the marine, freshwater, and terrestrial food web. Urban samples often showed higher levels of Dec602 than remote samples of the same sample type. The parent compounds DPsyn and DPanti were only occasionally found in biota samples. However, in air samples, only the parent compounds DPsyn and DPanti could be detected.
SCCPs and MCCPs were found in most of the samples, and LCCPs with a slightly lower detection frequency. For nearly all biota samples, the concentrations of MCCPs were higher than the SCCP-concentrations. For the cases were LCCPs were detected, the concentration was as high or higher than the SCCP-concentration. In contrast to the biota samples, the concentrations of SCCPs, MCCPs, and LCCPs were quite similar for the remote air samples. In the urban air sample from Reykjavik, LCCPs were highest and MCCPs lowest.
The results of this study confirm earlier findings of CPs in the Nordic environment. In addition, this study report for the first time detection of LCCPs in freshwater fish and of SCCPs, MCCPs, and LCCPs in pine needles. These results are highly relevant to understand and discuss the fate and environmental hazard of MCCPs and LCCPs. The presence of SCCPs, MCCPs, and LCCPs in both air and pine needles confirm the long-range atmospheric transport potential of these compound groups.
This project has shown that CPs were present in all samples reported above detection limit. However, even with high resolution mass spectrometry and continuous improvements in quantification methods, the measurement uncertainty of CPs is still considerably higher than for most of the other organic pollutants. In addition, CPs together with many other emerging pollutants, are present in many technical products and articles of daily use and the risk for sample contamination is much higher compared to legacy compounds like DDT or PCB, which have been regulated a long time ago. Even with strict sampling protocols, there is a need to monitor and control any risk of contamination at all stages (sampling, transport, storage, homogenization, extraction, clean-up, and instrumental analysis). Field blanks were successfully applied for air samples in this study, but for many other sample types, the selection of potential field blank material is not easy and should be discussed in more detail.
5 Acknowledgements
Denmark
Thanks to Thomas Bregnballe, Institute of Ecoscience, Aarhus Universitet for collecting Herring gull eggs at the little island Græsholmen. Thanks to Peter Mejlhede Andersen, Institute of Ecoscience, Aarhus Universitet for assistance with selection and collection of samples of fish from lakes when he was employed at the Danish EPA. Thanks to Erik Kronkvist, Hirtshals for delivering marine fish from Skagerrak and Arne Bager, Østjysk Lystfisker- og Fritidsforening for delivering marine fish from Aarhus Bay and finally thanks to Line Kyhn, Institute of Ecoscience, Aarhus Universitet for providing samples of marine mammals from research projects including Danish marine mammals run by Line and her colleagues.
Faroe Islands
The sampling of pilot whale was done by staff at the Environment Agency: Katrin Hoydal, Sjúrður Hammer, Birgitta Andreasen and Rakul Mortensen with assistance of Rúna Hoydal Brimnes and Bjørg Hoydal Brimnes in the Hvalvík 2 August 2019 sampling. The sampling of fulmar eggs was done by Sjúrður Hammer with valuable assistance from “Lonin”, and the sampling of black guillemot eggs by Bjørn Patursson is gratefully acknowledged. Thanks are due to Øssur Hansen for field work in providing the samples of brown trout from Fjallavatn. The cod were taken by the R/V Magnus Heinason of the Faroe Marine Research Institute. Sampling of pine needles was done by Maria Dam.
Finland
Thanks to Jaakko Mannio, Finnish Environment Institute, Erno Salonen, Natural Resources Institute Finland, Panu Rantakokko, Finnish Institute for Health and Welfare and Matti Verta for collecting and delivering the samples from Finland.
Iceland
Thanks to Þorsteinn Jóhannsson, Environment Agency of Iceland, for collecting and delivering the air samples from Iceland. Thanks to Eiríkur Þórir Baldursson, former member of the Nordic Screening Group and employee of the Environment Agency of Iceland, for collecting and delivering the samples of pine needles from Iceland as well as being the Icelandic coordinator for this project for Iceland.
Norway
Many different persons have assisted with sample collection and are kindly acknowledged for their contribution: the station personal at Birkenes air monitoring observatory for air sampling, Terje Krognes and Harald Willoch both NILU for pine needles collection, Morten Helberg (UiO) for the collection of herring gull eggs, Kjell Disenbroen, Pål Sindre Svae, Bjørnar Hansen, and Håkon Fredagsvik Sand for the collection of red deer and reindeer, and the Multiconsult team for the collection of cod samples. In addition was Espen Lund from NIVA responsible for the sample preparation of all fish samples in this study.
Sweden
Katarina Hansson from IVL Swedish Environmental Research Institute and Katarina Loso from The Swedish Museum of Natural History are acknowledged for their help with sampling.
6 References
Bogdal, C., Alsberg, T., Diefenbacher, P.S., Macleod, M., Berger, U. (2015) Fast Quantification of Chlorinated Paraffins in Environmental Samples by Direct Injection High-Resolution Mass Spectrometry with Pattern Deconvolution. Anal. Chem., 87, 2852–2860. doi:10.1021/ac504444d
Bohlin-Nizzetto, P., Aas, W., Nikiforov, V. (2020) Monitoring of environmental contaminants in air and precipitation. Annual report 2019. Overvåking av langtransporterte atmosfæriske miljøgifter i luft og nedbør, årsrapport 2019. NILU pp.
Brandsma, S.H., Brits, M., Groenewoud, Q.R., Van Velzen, M.J.M., Leonards, P.E.G., De Boer, J. (2019) Chlorinated Paraffins in Car Tires Recycled to Rubber Granulates and Playground Tiles. Environmental Science & Technology, 53, 7595–7603. doi:10.1021/acs.est.9b01835
Carlsson, P., Vrana, B., Sobotka, J., Borga, K., Nizzetto, P.B., Varpe, O. (2018) New brominated flame retardants and dechlorane plus in the Arctic: Local sources and bioaccumulation potential in marine benthos. Chemosphere, 211, 1193–1202. doi:10.1016/j.chemosphere.2018.07.158
Fredricsson, M., Danielsson, H., Hansson, K., Pihl Karlsson, G., Nerentorp, M., Potter, A., Hansson, H.C., Areskoug, H., Tunved, P., Mellqvist, J., Lindström, B., Nanos, T., Andersson, S., Carlund, T., Leung, W. (2021) Nationell luftövervakning Sakrapport med data från övervakning inom Programområde Luft t.o.m 2019. pp.
Gao, H., Na, G.S., Yao, Y., Li, R.J., Gao, Y.H., Zhang, Z.F., Yao, Z.W. (2018) Distribution Characteristics and Source of Dechloranes in Soil and Lichen of the Fildes Peninsula (Antarctica). International Journal of Environmental Research and Public Health, 15, 2312 12. doi:10.3390/ijerph15102312
Heimstad, E.S., Moe, B., Nygård, T., Herzke, D., Bohlin-Nizzetto, P. (2020) Environmental pollutants in the terrestrial and urban environment 2019. Miljøgifter i terrestrisk og bynært miljø 201. NILU pp.
Heimstad, E.S., Nygård, T., Herzke, D., Bohlin-Nizzetto, P. (2018) Environmental pollutants in the terrestrial and urban environment 2017. Environmental pollutants in the terrestrial and urban environment 2017. NILU pp.
Heimstad, E.S., Nygård, T., Herzke, D., Bohlin-Nizzetto, P. (2019) Environmental pollutants in the terrestrial and urban environment 2018. Miljøgifter i terrestrisk og bynært miljø 2018. NILU pp.
Hellstrom, A. (2003) Uptake of Airborne Organic Pollutants in Pine Needles. PhD PhD, Uppsala.
Hoh, E., Zhu, L.Y., Hites, R.A. (2006) Dechlorane plus, a chlorinated flame retardant, in the Great Lakes. Environmental Science & Technology, 40, 1184–1189.
Iozza, S., Schmid, P., Oehme, M., Bassan, R., Belis, C., Jakobi, G., Kirchner, M., Schramm, K.W., Krauchi, N., Moche, W., Offenthaler, I., Weiss, P., Simoncic, P., Knoth, W. (2009) Altitude profiles of total chlorinated paraffins in humus and spruce needles from the Alps (MONARPOP). Environ. Pollut., 157, 3225–3231. doi:10.1016/j.envpol.2009.05.033
Iupac Goldbook (2019) Limit of Detection in anlysis. URL: https://goldbook.iupac.org/terms/view/L03540 [Accessed 31.08.20212021].
Jartun, M., Fjeld, E., Bæk, K., Løken, K., Rundberget, J.T., Grung, M., Schlabach, M., Warner, N.A., Johansen, I., Lyche, J.L., Berg, V., Nøstbakken, O.J. (2018) Monitoring of environmental contaminants in freshwater ecosystems. Oslp,
Klein, R., Tarricone, K., Teubner, D., Paulus, M. (2018) Guideline for Sampling and Sample Processing Norway Spruce (Picea abies) / Scots Pine (Pinus sylvestris). URL: https://www.umweltprobenbank.de/upb_static/fck/download/SOP_ESB_Spruce_Pine_V2.0.2_2018_en.pdf [Accessed 06.09.20212021].
Krogseth, I.S., Breivik, K., Arnot, J.A., Wania, F., Borgen, A.R., Schlabach, M. (2013) Evaluating the environmental fate of short-chain chlorinated paraffins (SCCPs) in the Nordic environment using a dynamic multimedia model. Environmental Science-Processes & Impacts, 15, 2240–2251. doi:10.1039/c3em00407d
Krzeminski, P., Schwermer, C., Wennberg, A., Langford, K., Vogelsang, C. (2017) Occurrence of UV filters, fragrances and organophosphate flame retardants in municipal WWTP effluents and their removal during membrane post-treatment. J. Hazard. Mater., 323, 166–176. doi:10.1016/j.jhazmat.2016.08.001
Kylin, H., Hellstrom, A., Nordstrand, E., Zaid, A. (2003) Organochlorine pollutants in Scots pine needles-biological and site related variation within a forest stand. Chemosphere, 51, 669–675. doi:10.1016/s0045-6535(03)00101-2
Langford, K.H., Reid, M.J., Fjeld, E., Oxnevad, S., Thomas, K.V. (2015) Environmental occurrence and risk of organic UV filters and stabilizers in multiple matrices in Norway. Environ. Int., 80, 1–7. doi:10.1016/j.envint.2015.03.012
Lucia, M., Gabrielsen, G.W., Herzke, D., Christensen, G. (2016) Screening of UV chemicals, bisphenols and siloxanes in the Arctic. pp.
Persistent Organic Pollutants Review Committee (2020) Proposal to list UV-328 in Annex A to the Stockholm
Convention on Persistent Organic Pollutants. In: Committee, P.O.P.R. (ed.). Geneva, Switzerland, UNEP/POPS/POPRC SC pp. 46.
Ruus, A., Bæk, K., Petersen, K., Allan, I., Beylich, B., Schlabach, M., Warner, N.A., Borgå, K., Helberg, M. (2018) Environmental Contaminants in an Urban Fjord, 2017. The Norwegian Environment Agency pp.
Ruus, A., Bæk, K., Rundberget, T., Allan, I., Beylich, B., Schlabach, M., Warner, N.A., Borgå, K., Helberg, M. (2019) Environmental Contaminants in an Urban Fjord, 2018. Norsk insitutt for vannforskning pp.
Sakhi, A.K., Cequier, E., Becher, R., Bølling, A.K., Borgen, A.R., Schlabach, M., Schmidbauer, N., Becher, G., Schwarze, P., Thomsen, C. (2019) Concentrations of selected chemicals in indoor air from Norwegian homes and schools. Sci. Total Environ., 674, 1–8. doi: https://doi.org/10.1016/j.scitotenv.2019.04.086
Sanchis, Y., Coscolla, C., Yusa, V. (2019) Comprehensive analysis of photoinitiators and primary aromatic amines in food contact materials using liquid chromatography High-Resolution Mass Spectrometry. Talanta, 191, 109–118. doi:10.1016/j.talanta.2018.08.047
Schlabach, M., Gabrielsen, G.W., Herzke, D., Hanssen, L., Routti, H., Borgen, A. (2017a) Screening of PFAS and Dechlorane compounds in selected Arctic top predators. Screening av PFAS og Dekloran forbindelser i utvalgte arktiske toppredatorer. NILU pp.
Schlabach, M., Halse, A.K., Kringstad, A., Nikiforov, V., Bohlin-Nizzetto, P., Pfaffhuber, K.A., Reid, M.J., Rostkowski, P., Vogelsang, C. (2019) Screening program 2018. Volatiles, Gd, BADGE, UV filters, Additives, and Medicines. NILU pp.
Schlabach, M., Van Bavel, B., Baz-Lomba, J.A., Borgen, A., Fjeld, E., Halse, A.K., Nikiforov, V., Nizzetto, P.B., Reid, M.J., Rostkowski, P.M., Vogelsang, C. (2017b) Screening programme 2016 - Selected compounds with relevance for EU regulation. pp.
Schlabach, M., Van Bavel, B., Baz-Lomba, J.A., Borgen, A., Gabrielsen, G.W., Götsch, A., Halse, A.K., Hanssen, L., Krogseth, I.S., Nikiforov, V., Nygård, T., Bohlin-Nizzetto, P., Reid, M.J., Rostkowski, P., Samanipour, S. (2018) Screening Programme 2017 – AMAP Assessment Compounds. pp.
Sverko, E., Tomy, G.T., Reiner, E.J., Li, Y.-F., Mccarry, B.E., Arnot, J.A., Law, R.J., Hites, R.A. (2011) Dechlorane Plus and Related Compounds in the Environment: A Review. Environmental Science & Technology, 45, 5088–5098. doi:10.1021/es2003028
Thomas, K.V., Schlabach, M., Langford, K., Fjeld, E., Øxnevad, S., Rundberget, T., Bæk, K., Rostkowski, P., Harju, M. (2014) Screening programme 2013: New bisphenols, organic peroxides, fluorinated siloxanes, organic UV filters and selected PBT substances. Oslo/Kjeller, Niva/Nilu (M-176/2014) (NIVA-no 6696-2014; NILU OR 26/2014).
Tomy, G.T., Fisk, A.T., Westmore, J.B., Muir, D.C. (1998) Environmental chemistry and toxicology of polychlorinated n-alkanes. Rev.Environ.Contam Toxicol., 158, 53-128.
Tomy, G.T., Stern, G.A., Muir, D.C.G., Fisk, A.T., Cymbalisty, C.D., Westmore, J.B. (1997) Quantifying C 10 - C 13 polychloroalkanes in environmental samples by high-resolution gas chromatography electron capture negative ion high resolution mass spectrometry. Anal. Chem., 69, 2762–2771.
Van Bavel, B., Thomas, K.V., Langford, K., Reid, M.J., Vogelsang, C., Øxnevad, S., Bæk, K., Fjeld, E., Brooks, S., Schlabach, M., Rostkowski, P.M., Warner, N.A., Borgen, A., Halse, A.K., Davanger, K., Gundersen, H. (2016) Screening Programme 2015: Benzothiazoles, siloxanes, pigments & PBT compounds. (M-596/2016) (NIVA 1639-2016
Van Mourik, L.M., Leonards, P.E.G., Gaus, C., De Boer, J. (2015) Recent developments in capabilities for analysing chlorinated paraffins in environmental matrices: A review. Chemosphere, 136, 259–272. doi:10.1016/j.chemosphere.2015.05.045
Verreault, J., Letcher, R.J., Gentes, M.L., Braune, B.M. (2018) Unusually high Deca-BDE concentrations and new flame retardants in a Canadian Arctic top predator, the glaucous gull. Sci. Total Environ., 639, 977–987. doi:10.1016/j.scitotenv.2018.05.222
Vorkamp, K., Balmer, J., Hung, H., Letcher, R.J., Rigét, F.F. (2019) A review of chlorinated paraffin contamination in Arctic ecosystems. Emerging Contaminants, 5, 219–231. doi: https://doi.org/10.1016/j.emcon.2019.06.001
Vorkamp, K., Falk, K., Møller, S., Rigét, F.F., Sørensen, P.B. (2017) Regulated and Unregulated Halogenated Flame Retardants in Peregrine Falcon Eggs from Greenland. Environmental Science & Technology. doi:10.1021/acs.est.7b04866
Wang, T., Yu, J., Han, S., Wang, Y., Jiang, G. (2015) Levels of short chain chlorinated paraffins in pine needles and bark and their vegetation-air partitioning in urban areas. Environmental pollution (Barking, Essex : 1987), 196, 309–312. doi:10.1016/j.envpol.2014.10.025
Yuan, B., Bruchert, V., Sobek, A., De Witt, C.A. (2017) Temporal Trends of C-8-C-36 Chlorinated Paraffins in Swedish Coastal Sediment Cores over the Past 80 Years. Environmental Science & Technology, 51, 14199–14208. doi:10.1021/acs.est.7b04523
Yuan, B., Muir, D., Macleod, M. (2019a) Methods for trace analysis of short-, medium-, and long-chain chlorinated paraffins: Critical review and recommendations. Anal. Chim. Acta, 1074, 16–32. doi:10.1016/j.aca.2019.02.051
Yuan, B., Vorkamp, K., Roos, A.M., Faxneld, S., Sonne, C., Garbus, S.E., Lind, Y., Eulaers, I., Hellström, P., Dietz, R., Persson, S., Bossi, R., De Wit, C.A. (2019b) Accumulation of Short-, Medium-, and Long-Chain Chlorinated Paraffins in Marine and Terrestrial Animals from Scandinavia. Environmental Science & Technology, 53, 3526–3537. doi:10.1021/acs.est.8b06518
Appendix A
Complete data table
| NILU number | NIVA number | Country | Matrix acronym | Location type | Species | Location | Sample specification | Lat | Long |
| 20/0764 | FIN | AIR | REM | Air | Pallas | 67.973302 | 24.115680 | ||
| 20/0766 | FIN | AIR | REM | Air | Pallas | 67.973302 | 24.115680 | ||
| 20/1145 | NO | AIR | REM | Air | Birkenes | 58.388446 | 8.252055 | ||
| 20/1314 | NO | AIR | REM | Air | Birkenes | 58.388446 | 8.252055 | ||
| 20/1589 | NO | AIR | REM | Air | Birkenes | 58.388446 | 8.252055 | ||
| 20/1807 | NO | AIR | REM | Air | Birkenes | 58.388446 | 8.252055 | ||
| 20/0763 | SE | AIR | REM | Air | Råö | 57.393998 | 11.913868 | ||
| 20/0765 | SE | AIR | REM | Air | Råö | 57.393998 | 11.913868 | ||
| 20/0548 | ICE | AIR | URB | Air | Reykjavík | 202702-003 | 64.130115 | -21.874738 | |
| 20/0549 | ICE | AIR | URB | Air | Reykjavík | 202702-004 | 64.130115 | -21.874738 | |
| 20/0550 | ICE | AIR | URB | Air | Reykjavík | 202702-005 | 64.130115 | -21.874738 | |
| 20/1127 | 2019-14662 | FO | EGG | REM | Black guillemot | Koltur | Eggs | 61.977167 | -6.957383 |
| 20/1141 | 2019-14708 | SE | EGG | REM | Common guillemot | Stora Karlsö | Eggs | 57.284967 | 17.971945 |
| 20/1128 | 2019-14663 | FO | EGG | REM | Fulmar | Sandoy | Eggs | 61.872133 | -6.913100 |
| 20/1129 | 2019-14664 | FO | EGG | REM | Fulmar | Sandoy | Eggs | 61.872133 | -6.913100 |
| 19/1470-1484 | 2019-14699 | NO | EGG | URB | Herring gull | inner Oslofjord | Eggs | 59.853170 | 10.728100 |
| 20/1094 | 2019-14614-1 | DK | EGG | REM | Herring gull | Græsholm | Egg | 57.492000 | 10.604000 |
| 20/1095 | 2019-14614-2 | DK | EGG | REM | Herring gull | Græsholm | Egg | 57.492000 | 10.604000 |
| 20/1096 | 2019-14614-3 | DK | EGG | REM | Herring gull | Græsholm | Egg | 57.492000 | 10.604000 |
| 20/1097 | 2019-14614-4 | DK | EGG | REM | Herring gull | Græsholm | Egg | 57.492000 | 10.604000 |
| 20/1098 | 2019-14614-5 | DK | EGG | REM | Herring gull | Græsholm | Egg | 57.492000 | 10.604000 |
| 20/1099 | 2019-14614-6 | DK | EGG | REM | Herring gull | Græsholm | Egg | 57.492000 | 10.604000 |
| 20/1100 | 2019-14614-7 | DK | EGG | REM | Herring gull | Græsholm | Egg | 57.492000 | 10.604000 |
| 20/1101 | 2019-14614-8 | DK | EGG | REM | Herring gull | Græsholm | Egg | 57.492000 | 10.604000 |
| 20/1140 | 2019-14707 | SE | EGG | REM | Ural owl | Insjön | Eggs | 60.642323 | 15.116698 |
| 20/1117 | 2019-14650 | FIN | FFI | REM | Brown trout | River Juutua | Muscle | 68.906826 | 27.003609 |
| 20/1123 | 2019-14657 | FO | FFI | REM | Brown trout | Fjallavatn | Muscle | 62.115000 | -7.307333 |
| 20/1124_rep | 2019-14658 | FO | FFI | REM | Brown trout | Fjallavatn | Muscle | 62.115000 | -7.307333 |
| 20/1102 | 2019-14615 | DK | FFI | REM | Perch | Klokkerholm Møllesø | Muscle | 57.214200 | 10.162200 |
| 20/1107 | 2019-14622 | DK | FFI | REM | Perch | Stadil Fjord | Muscle | 56.159467 | 9.214378 |
| 20/1118 | 2019-14653-1 | FIN | FFI | REM | Perch | Kivilahti | Whole perch | 68.796311 | 27.508358 |
| 20/1119 | 2019-14653-2 | FIN | FFI | REM | Perch | Kivilahti | Whole perch | 68.796311 | 27.508358 |
| 20/1120 | 2019-14653-3 | FIN | FFI | REM | Perch | Kivilahti | Whole perch | 68.796311 | 27.508358 |
| 20/1121 | 2019-14653-4 | FIN | FFI | REM | Perch | Kivilahti | Whole perch | 68.796311 | 27.508358 |
| 20/1122 | 2019-14653-5 | FIN | FFI | REM | Perch | Kivilahti | Whole perch | 68.796311 | 27.508358 |
| 20/1138 | 2019-14705 | SE | FFI | REM | Perch | Krageholms|sjön | Muscle | 55.501152 | 13.744153 |
| 20/1139 | 2019-14706 | SE | FFI | REM | Perch | Brännträsket | Muscle | 65.535092 | 21.396842 |
| 20/1108 | 2019-14643-1 | FIN | FFI | URB | Perch | Vallisaari | Whole perch | 60.131593 | 24.987946 |
| 20/1109 | 2019-14643-2 | FIN | FFI | URB | Perch | Vallisaari | Whole perch | 60.131593 | 24.987946 |
| 20/1110 | 2019-14643-2 | FIN | FFI | URB | Perch | Vallisaari | Whole perch | 60.131593 | 24.987946 |
| 20/1111 | 2019-14643-4 | FIN | FFI | URB | Perch | Vallisaari | Whole perch | 60.131593 | 24.987946 |
| 20/1112 | 2019-14643-5 | FIN | FFI | URB | Perch | Vallisaari | Whole perch | 60.131593 | 24.987946 |
| 20/1131 | 2019-14692 | NO | FFI | URB | Perch | Mjøsa | Liver | 60.756030 | 11.076780 |
| 20/1103 | 2019-14617 | DK | MFI | REM | Cod | Skagerrak | Liver | 57.758994 | 9.971547 |
| 20/1125 | 2019-14659 | FO | MFI | REM | Cod | Mýlings|grunnur | Liver | 62.366667 | -7.450000 |
| 20/1126 | 2019-14660 | FO | MFI | REM | Cod | Mýlings|grunnur | Liver | 62.366667 | -7.450000 |
| 20/1104 | 2019-14618 | DK | MFI | URB | Cod | Aarhus Bugt | Liver | 56.141583 | 10.235250 |
| 20/1130 | 2019-14691 | NO | MFI | URB | Cod | Inner Oslofjord | Liver | 59.832690 | 10.580430 |
| 20/1105 | 2019-14620 | DK | MMA | REM | Grey seal | Horsens Fjord | Seal blubber | 55.853167 | 10.011667 |
| 20/1106 | 2019-14621 | DK | MMA | REM | Grey seal | Sønderho, Fanø | Seal blubber | 55.347694 | 8.475139 |
| 20/0946B | 2019-14616 | DK | PIN | REM | Pine needles | Tornby | 57.542878 | 9.918256 | |
| 20/0947B | 2019-14619 | DK | PIN | REM | Pine needles | Låsby | 56.147667 | 9.819111 | |
| 20/0949b | 2019-14644 | FIN | PIN | REM | Pine needles | Hollola | 61.058361 | 25.334975 | |
| 20/0949 c1 | as above | FIN | PIN | REM | Pine needles | Hollola | 61.058361 | 25.334975 | |
| 20/0949 c2 | with washing | FIN | PIN | REM | Pine needles | Hollola | 61.058361 | 25.334975 | |
| 20/0950b | 2019-14651 | FIN | PIN | REM | Pine needles | Inari | 68.905834 | 26.995323 | |
| 20/0951b | 2019-14652 | FIN | PIN | REM | Pine needles | Inari | 68.905834 | 26.995323 | |
| 20/1935b | NO, Birkenes | NO | PIN | REM | Pine needles | Birkenes | 58.390590 | 8.248255 | |
| 20/1935b | as above | NO | PIN | REM | Pine needles | Birkenes | 58.390590 | 8.248255 | |
| 20/1935b | with washing | NO | PIN | REM | Pine needles | Birkenes | 58.390590 | 8.248255 | |
| 20/1936b | NO, Birkenes | NO | PIN | REM | Pine needles | Birkenes | 58.390590 | 8.248255 | |
| 20/1937b | NO, Birkenes | NO | PIN | REM | Pine needles | Birkenes | 58.390590 | 8.248255 | |
| 20/0761 | 2019-14712 | SE | PIN | REM | Pine needles | Råö | 57.393736 | 11.913671 | |
| 20/0762 | 2019-14713 | SE | PIN | REM | Pine needles | Råö | 57.394572 | 11.914117 | |
| 20/0948b | 2019-14642 | FIN | PIN | URB | Pine needles | Helsinki | 60.220498 | 25.119256 | |
| 20/0952b | 2019-14654 | FO | PIN | URB | Pine needles | Tórshavn | 62.016533 | -6.780533 | |
| 20/0953b | 2019-14655 | FO | PIN | URB | Pine needles | Tórshavn | 62.016433 | -6.780533 | |
| 20/0954b | 2019-14656 | FO | PIN | URB | Pine needles | Tórshavn | 62.016600 | -6.781300 | |
| 20/0955 | 2019-14678 | ICE | PIN | URB | Pine needles | Reykjavík | 64.129973 | -21.876159 | |
| 20/0955 c1 | as above | ICE | PIN | URB | Pine needles | Reykjavík | 64.129973 | -21.876159 | |
| 20/0955 c2 | with washing | ICE | PIN | URB | Pine needles | Reykjavík | 64.129973 | -21.876159 | |
| 20/1113 | 2019-14645 | FIN | TMA | REM | Moose | Kurkimäki | Liver | 62.798703 | 27.499224 |
| 20/1113 | 2019-14646 | FIN | TMA | REM | Moose | Kurkimäki | Muscle | 62.798703 | 27.499224 |
| 20/1135 | 2019-14702 | SE | TMA | REM | Moose | Grimsö | Muscle | 57.704792 | 15.576077 |
| 20/1134 | 2019-14698 | NO | TMA | REM | Red deer | Folldal Einunnfjeller | Muscle | 62.202270 | 10.350730 |
| 20/1115 | 2019-14648 | FIN | TMA | REM | Reindeer | Oraniemi | Muscle | 67.644112 | 27.307775 |
| 20/1116 | 2019-14649 | FIN | TMA | REM | Reindeer | Kutuharju exp. station | Muscle | 68.775225 | 26.818071 |
| 20/1132 | 2019-14696 | NO | TMA | REM | Reindeer | Folldal Knutshø | Muscle | 62.239830 | 9.891900 |
| 20/1133 | 2019-14697 | NO | TMA | REM | Reindeer | Folldal Sønkletten | Muscle | 62.075170 | 10.052170 |
| 20/1136 | 2019-14703 | SE | TMA | REM | Reindeer | Norrkaitum Sameby | Muscle | 68.262938 | 19.857487 |
| Country | Species | Location | Unit | BP3 | EHMC-E | EHMC-Z | OC | ODPABA | UV-320 | UV-326 | UV-327 | UV-328 | UV-329 |
| FO | Black guillemot | Koltur | ng/g | <1.50 | <1.50 | <0.70 | <1.20 | <0.03 | <0.05 | <0.10 | <0.04 | <0.05 | <0.30 |
| SE | Common guillemot | Stora Karlsö | ng/g | <1.50 | <1.50 | <0.70 | 1.19 | <0.03 | <0.05 | <0.10 | 0.12 | <0.05 | <0.30 |
| FO | Fulmar | Sandoy | ng/g | <1.50 | <1.50 | <0.70 | <1.20 | <0.03 | 0.14 | <0.10 | 0.07 | 0.05 | <0.30 |
| FO | Fulmar | Sandoy | ng/g | <1.50 | 1.57 | <0.70 | 1.33 | <0.03 | 0.19 | <0.10 | 0.07 | <0.05 | <0.30 |
| NO | Herring gull | inner Oslofjord | ng/g | <1.50 | 1.89 | <0.70 | 1.36 | <0.03 | 0.06 | 0.40 | 0.22 | 1.83 | <0.30 |
| DK | Herring gull | Græs|holm | ng/g | <1.50 | <1.50 | <0.70 | <1.20 | <0.03 | <0.05 | <0.10 | <0.04 | 0.07 | <0.30 |
| DK | Herring gull | Græs|holm | ng/g | <1.50 | <1.50 | <0.70 | <1.20 | <0.03 | <0.05 | <0.10 | <0.04 | <0.05 | <0.30 |
| DK | Herring gull | Græs|holm | ng/g | <1.50 | <1.50 | <0.70 | <1.20 | <0.03 | <0.05 | <0.10 | <0.04 | <0.05 | <0.30 |
| DK | Herring gull | Græs|holm | ng/g | <1.50 | <1.50 | <0.70 | <1.20 | <0.03 | <0.05 | <0.10 | 0.07 | 0.19 | <0.30 |
| DK | Herring gull | Græs|holm | ng/g | <1.50 | <1.50 | <0.70 | <1.20 | <0.03 | <0.05 | <0.10 | <0.04 | <0.05 | <0.30 |
| DK | Herring gull | Græs|holm | ng/g | <1.50 | <1.50 | <0.70 | <1.20 | <0.03 | <0.05 | <0.10 | 0.09 | 0.07 | <0.30 |
| DK | Herring gull | Græs|holm | ng/g | <1.50 | <1.50 | <0.70 | <1.20 | <0.03 | <0.05 | <0.10 | <0.04 | <0.05 | <0.30 |
| DK | Herring gull | Græs|holm | ng/g | <1.50 | <1.50 | <0.70 | <1.20 | <0.03 | <0.05 | <0.10 | <0.04 | 0.05 | <0.30 |
| SE | Ural owl | Insjön | ng/g | <1.50 | <1.50 | <0.70 | <1.20 | <0.03 | <0.05 | <0.10 | 0.05 | <0.05 | <0.30 |
| FIN | Brown trout | River Juutua | ng/g | <0.20 | <0.05 | <0.02 | <1.00 | <0.02 | <0.03 | <0.06 | <0.04 | <0.06 | <0.40 |
| FO | Brown trout | Fjallavatn | ng/g | <0.20 | <0.05 | <0.02 | <1.00 | <0.02 | <0.03 | <0.06 | <0.04 | <0.06 | <0.40 |
| FO | Brown trout | Fjallavatn | ng/g | <0.20 | <0.05 | <0.02 | <1.00 | <0.02 | <0.03 | <0.06 | <0.04 | <0.06 | <0.40 |
| DK | Perch | Klokker|holm Møllesø | ng/g | <0.20 | <0.05 | <0.02 | <1.00 | <0.02 | <0.03 | <0.06 | <0.04 | <0.06 | <0.40 |
| DK | Perch | Stadil Fjord | ng/g | <0.20 | <0.05 | <0.02 | <1.00 | <0.02 | <0.03 | <0.06 | <0.04 | <0.06 | <0.40 |
| FIN | Perch | Kivilahti | ng/g | <0.20 | <0.05 | <0.02 | <1.00 | <0.02 | <0.03 | <0.06 | <0.04 | <0.06 | <0.40 |
| FIN | Perch | Kivilahti | ng/g | <0.20 | <0.05 | <0.02 | <1.00 | <0.02 | <0.03 | <0.06 | <0.04 | <0.06 | <0.40 |
| FIN | Perch | Kivilahti | ng/g | <0.20 | <0.05 | <0.02 | <1.00 | <0.02 | <0.03 | <0.06 | <0.04 | <0.06 | <0.40 |
| FIN | Perch | Kivilahti | ng/g | <0.20 | <0.05 | <0.02 | <1.00 | <0.02 | <0.03 | <0.06 | <0.04 | <0.06 | <0.40 |
| FIN | Perch | Kivilahti | ng/g | <0.20 | <0.05 | <0.02 | <1.00 | <0.02 | <0.03 | <0.06 | <0.04 | <0.06 | <0.40 |
| SE | Perch | Krage|holmssjön | ng/g | <0.20 | <0.05 | <0.02 | <1.00 | <0.02 | <0.03 | <0.06 | <0.04 | <0.06 | <0.40 |
| SE | Perch | Bränn|träsket | ng/g | <0.20 | <0.05 | <0.02 | <1.00 | <0.02 | <0.03 | <0.06 | <0.04 | <0.06 | <0.40 |
| FIN | Perch | Vallisaari | ng/g | <0.20 | <0.05 | <0.02 | <1.00 | <0.02 | <0.03 | <0.06 | <0.04 | <0.06 | <0.40 |
| FIN | Perch | Vallisaari | ng/g | <0.20 | <0.05 | <0.02 | <1.00 | <0.02 | <0.03 | <0.06 | <0.04 | <0.06 | <0.40 |
| FIN | Perch | Vallisaari | ng/g | <0.20 | <0.05 | <0.02 | <1.00 | <0.02 | <0.03 | <0.06 | <0.04 | <0.06 | <0.40 |
| FIN | Perch | Vallisaari | ng/g | <0.20 | <0.05 | <0.02 | <1.00 | <0.02 | <0.03 | <0.06 | <0.04 | <0.06 | <0.40 |
| FIN | Perch | Vallisaari | ng/g | <0.20 | <0.05 | <0.02 | <1.00 | <0.02 | <0.03 | <0.06 | <0.04 | <0.06 | <0.40 |
| NO | Perch | Mjøsa | ng/g | <0.20 | <0.30 | <0.05 | <2.50 | <0.04 | 0.05 | <0.20 | 0.10 | 0.12 | <0.20 |
| DK | Cod | Skagerrak | ng/g | 0.29 | <0.30 | <0.05 | <2.50 | <0.04 | 0.31 | <0.20 | 0.51 | 0.36 | 2.78 |
| FO | Cod | Mýlings|grunnur | ng/g | <0.20 | <0.30 | <0.05 | <2.50 | <0.04 | <0.05 | <0.20 | <0.10 | 0.12 | 0.38 |
| FO | Cod | Mýlings|grunnur | ng/g | <0.20 | <0.30 | <0.05 | <2.50 | <0.04 | <0.05 | <0.20 | <0.10 | <0.06 | <0.20 |
| DK | Cod | Aarhus Bugt | ng/g | <0.20 | <0.30 | <0.05 | <2.50 | <0.04 | 0.11 | <0.20 | 0.51 | 0.41 | 0.77 |
| NO | Cod | Inner Oslofjord | ng/g | <0.20 | <0.30 | <0.05 | <2.50 | <0.04 | 2.15 | <0.20 | 1.83 | 7.53 | <0.20 |
| DK | Grey seal | Horsens Fjord | ng/g | <0.30 | <0.40 | <0.08 | <5.00 | <0.08 | 0.29 | <0.30 | 0.60 | 0.80 | <0.50 |
| DK | Grey seal | Sønderho, Fanø | ng/g | <0.30 | <0.40 | <0.08 | <5.00 | <0.08 | 0.10 | <0.30 | <0.20 | <0.10 | <0.50 |
| FIN | Moose | Kurkimäki | ng/g | <1.40 | <1.00 | <0.50 | <1.20 | <0.05 | <0.03 | <0.05 | <0.02 | <0.02 | <0.70 |
| FIN | Moose | Kurkimäki | ng/g | <1.40 | <1.00 | <0.50 | <1.20 | <0.05 | <0.03 | <0.05 | <0.02 | <0.02 | <1.70 |
| SE | Moose | Grimsö | ng/g | <1.40 | <1.00 | <0.50 | <1.20 | <0.05 | <0.03 | <0.05 | <0.02 | <0.02 | <0.50 |
| NO | Red deer | Folldal Einunnfjeller | ng/g | <1.40 | <1.00 | <0.50 | <1.20 | <0.05 | <0.03 | <0.05 | <0.02 | <0.02 | <0.50 |
| FIN | Reindeer | Oraniemi | ng/g | <1.40 | <1.00 | <0.50 | <1.20 | <0.05 | <0.03 | <0.05 | <0.02 | <0.02 | <1.00 |
| FIN | Reindeer | Kutuharju exp. station | ng/g | <1.40 | <1.00 | <0.50 | <1.20 | <0.05 | <0.03 | <0.05 | <0.02 | <0.02 | <0.10 |
| NO | Reindeer | Folldal Knutshø | ng/g | <1.40 | <1.00 | <0.50 | <1.20 | <0.05 | <0.03 | <0.05 | <0.02 | <0.02 | <0.50 |
| NO | Reindeer | Folldal Sønkletten | ng/g | <1.40 | <1.00 | <0.50 | <1.20 | <0.05 | <0.03 | <0.05 | <0.02 | <0.02 | <0.60 |
| SE | Reindeer | Norrkai|tum Sameby | ng/g | <1.40 | <1.00 | <0.50 | <1.20 | <0.05 | <0.03 | <0.05 | <0.02 | <0.02 | <0.50 |
| Country | Species | Location | Unit | Dibromo|aldrin | Dechlora|ne 602 | Dechlora|ne 603 | Dechlora|ne 604 | Dechlora|ne 601 | Dechlora|ne plus syn | Dechlora|ne plus anti | SCCPs | MCCPs | LCCPs |
| FIN | Air' | Pallas | pg/m3 | <0.01 | <0.02 | <0.02 | <0.05 | <0.01 | <0.02 | <0.02 | 74.0 | 59.1 | 35.6 |
| FIN | Air' | Pallas | pg/m3 | <0.01 | <0.02 | <0.02 | <0.07 | <0.02 | <0.03 | <0.03 | 105 | 66.9 | 17.3 |
| NO | Air' | Birkenes | pg/m3 | <0.08 | <0.02 | <0.02 | <0.39 | <0.10 | <0.16 | 0.21 | 547 | 2 612 | 190 |
| NO | Air' | Birkenes | pg/m3 | <0.13 | <0.03 | <0.03 | <0.93 | <0.17 | 0.27 | 0.95 | 258 | <1160 | <100 |
| NO | Air' | Birkenes | pg/m3 | <0.12 | <0.03 | <0.03 | <0.90 | <0.16 | 0.13 | 0.34 | 179 | <1160 | <100 |
| NO | Air' | Birkenes | pg/m3 | <0.13 | <0.03 | <0.03 | <0.93 | <0.17 | <0.12 | 0.30 | 280 | <1160 | 130 |
| SE | Air' | Råö | pg/m3 | <0.01 | <0.01 | <0.01 | <0.05 | <0.01 | <0.02 | 0.07 | 66.5 | 45.7 | 112 |
| SE | Air' | Råö | pg/m3 | <0.05 | <0.01 | <0.01 | <0.26 | <0.07 | <0.11 | <0.12 | 43.6 | 67.3 | <50.00 |
| ICE | Air' | Reykjavík | pg/m3 | <0.03 | <0.01 | <0.01 | <0.16 | <0.04 | <0.07 | 0.13 | 3 006 | 1 160 | 17 607 |
| ICE | Air' | Reykjavík | pg/m3 | <0.03 | <0.01 | <0.01 | <0.17 | <0.04 | 0.18 | 0.71 | 2 622 | 1 209 | 12 452 |
| ICE | Air' | Reykjavík | pg/m3 | <0.03 | <0.01 | <0.01 | <0.18 | <0.04 | 0.11 | 0.26 | 1 792 | 1 606 | 33 548 |
| FO | Black guillemot | Koltur | ng/g | <0.05 | 0.03 | <0.01 | <0.25 | <0.06 | <0.11 | <0.12 | 3.22 | 15.6 | <10 |
| SE | Common guillemot | Stora Karlsö | ng/g | <0.05 | 0.52 | <0.01 | <0.25 | <0.06 | <0.11 | <0.12 | 2.68 | 46.0 | <10 |
| FO | Fulmar | Sandoy | ng/g | <0.05 | 0.27 | <0.01 | <0.25 | <0.06 | <0.11 | <0.12 | 12.3 | 13.0 | <10 |
| FO | Fulmar | Sandoy | ng/g | <0.05 | 0.44 | <0.01 | <0.25 | <0.06 | <0.11 | <0.12 | 14.1 | 18.6 | <10 |
| NO | Herring gull | inner Oslofjord | ng/g | <0.07 | 0.09 | 0.05 | <0.19 | <0.03 | 0.29 | 0.8 | 22.0 | 25.0 | <10 |
| DK | Herring gull | Græs|holm | ng/g | <0.05 | 0.05 | 0.04 | <0.25 | <0.06 | <0.11 | 0.12 | 22.3 | 49.5 | <10 |
| DK | Herring gull | Græs|holm | ng/g | <0.05 | 0.04 | 0.04 | <0.25 | <0.06 | <0.11 | <0.12 | 16.4 | 11.7 | <10 |
| DK | Herring gull | Græs|holm | ng/g | <0.05 | 0.06 | 0.06 | <0.25 | <0.06 | <0.11 | <0.12 | 7.28 | 15.9 | <10 |
| DK | Herring gull | Græs|holm | ng/g | <0.05 | 0.15 | 0.04 | <0.25 | <0.06 | <0.11 | 0.19 | 11.9 | 78.2 | 341 |
| DK | Herring gull | Græs|holm | ng/g | <0.05 | 0.06 | 0.05 | <0.25 | <0.06 | <0.11 | <0.12 | 6.35 | 18.1 | <10 |
| DK | Herring gull | Græs|holm | ng/g | <0.05 | 0.26 | 0.11 | <0.25 | <0.06 | <0.11 | 0.17 | 2.46 | 24.0 | 42.3 |
| DK | Herring gull | Græs|holm | ng/g | <0.05 | 0.07 | 0.05 | <0.25 | <0.06 | <0.11 | <0.12 | 6.63 | 27.2 | <10 |
| DK | Herring gull | Græs|holm | ng/g | <0.05 | 0.09 | 0.05 | <0.25 | <0.06 | <0.11 | <0.12 | 14.2 | 17.7 | <10 |
| SE | Ural owl | Insjön | ng/g | <0.05 | 0.23 | 0.05 | <0.25 | <0.06 | <0.11 | <0.12 | 3.82 | 79.6 | 11.5 |
| FIN | Brown trout | River Juutua | ng/g | <0.010 | 0.019 | <0.002 | <0.05 | <0.01 | <0.02 | <0.02 | 9.04 | 17.0 | 7.81 |
| FO | Brown trout | Fjallavatn | ng/g | <0.010 | 0.012 | <0.002 | <0.05 | <0.01 | <0.02 | <0.02 | 5.50 | 28.0 | 9.69 |
| FO | Brown trout | Fjallavatn | ng/g | <0.013 | 0.01 | <0.004 | <0.09 | <0.02 | <0.02 | <0.02 | <0.25 | <0.65 | <2 |
| DK | Perch | Klokker|holm Møllesø | ng/g | <0.010 | <0.002 | <0.002 | <0.05 | <0.01 | <0.02 | <0.02 | 2.67 | 11.0 | <2 |
| DK | Perch | Stadil Fjord | ng/g | <0.127 | <0.026 | <0.034 | <0.70 | <0.16 | <0.21 | <0.23 | 1.47 | 1.82 | <2 |
| FIN | Perch | Kivilahti | ng/g | <0.010 | <0.002 | <0.002 | <0.05 | <0.01 | <0.02 | <0.02 | 4.04 | 12.6 | <2 |
| FIN | Perch | Kivilahti | ng/g | <0.011 | <0.002 | <0.003 | <0.06 | <0.01 | <0.02 | <0.02 | 2.36 | 11.6 | 2.70 |
| FIN | Perch | Kivilahti | ng/g | <0.010 | <0.002 | <0.002 | <0.05 | <0.01 | <0.02 | <0.02 | 1.88 | 9.36 | <2 |
| FIN | Perch | Kivilahti | ng/g | <0.010 | <0.002 | <0.002 | <0.05 | <0.01 | <0.02 | <0.02 | 2.94 | 31.9 | <2 |
| FIN | Perch | Kivilahti | ng/g | <0.010 | <0.002 | <0.002 | <0.05 | <0.01 | <0.02 | <0.02 | 2.94 | 31.9 | 5.02 |
| SE | Perch | Krage|holmssjön | ng/g | <0.010 | <0.002 | <0.002 | <0.05 | <0.01 | <0.02 | <0.02 | 1.37 | 8.06 | <2 |
| SE | Perch | Bränn|träsket | ng/g | <0.010 | <0.002 | <0.002 | <0.05 | <0.01 | <0.02 | <0.02 | 1.89 | 13.1 | <2 |
| FIN | Perch | Vallisaari | ng/g | <0.024 | <0.005 | <0.004 | <0.17 | <0.02 | <0.02 | <0.02 | <0.60 | <1.52 | <2 |
| FIN | Perch | Vallisaari | ng/g | <0.024 | <0.005 | <0.007 | <0.16 | <0.03 | <0.02 | <0.02 | 16.9 | 48.5 | 37.8 |
| FIN | Perch | Vallisaari | ng/g | <0.010 | 0.008 | <0.002 | <0.05 | <0.01 | <0.02 | <0.02 | 4.18 | 7.25 | 4.21 |
| FIN | Perch | Vallisaari | ng/g | <0.010 | 0.004 | <0.002 | <0.05 | <0.01 | <0.02 | <0.02 | 4.77 | 11.6 | 5.61 |
| FIN | Perch | Vallisaari | ng/g | <0.010 | 0.005 | <0.002 | <0.05 | <0.01 | <0.02 | <0.02 | 5.57 | 14.5 | 2.30 |
| NO | Perch | Mjøsa | ng/g | <0.05 | 0.02 | <0.01 | <0.25 | <0.06 | <0.11 | 0.32 | 42.4 | 138 | 32.7 |
| DK | Cod | Skagerrak | ng/g | <0.06 | 0.12 | 0.02 | <0.31 | <0.07 | <0.11 | <0.12 | 28.9 | 38.4 | 25.1 |
| FO | Cod | Mýlings|grunnur | ng/g | <0.06 | 0.06 | <0.02 | <0.32 | <0.08 | <0.11 | <0.12 | 15.7 | 22.0 | <10 |
| FO | Cod | Mýlings|grunnur | ng/g | <0.05 | 0.06 | <0.01 | <0.25 | <0.06 | <0.11 | <0.12 | 16.2 | 58.3 | <10 |
| DK | Cod | Aarhus Bugt | ng/g | <0.05 | 0.13 | 0.02 | <0.29 | <0.06 | <0.11 | <0.12 | 33.1 | 35.1 | 105 |
| NO | Cod | Inner Oslofjord | ng/g | <0.05 | 0.29 | 0.08 | <0.25 | <0.06 | <0.11 | <0.12 | 75.4 | 106 | 143 |
| DK | Grey seal | Horsens Fjord | ng/g | <0.19 | 56.4 | 0.34 | <1.33 | <0.31 | 0.96 | 1.79 | 166 | <20 | 284 |
| DK | Grey seal | Sønderho, Fanø | ng/g | <0.14 | 0.33 | <0.04 | <0.75 | <0.18 | <0.21 | <0.23 | <20 | 48.8 | <20 |
| DK | Pine needles | Tornby | ng/g | <0.15 | <0.03 | <0.04 | <0.99 | <0.25 | <0.13 | <0.16 | 166 | 13.7 | <20 |
| DK | Pine needles | Låsby | ng/g | <0.13 | <0.03 | <0.03 | <0.96 | <0.18 | <0.13 | <0.16 | 297 | 18.5 | <20 |
| FIN | Pine needles | Hollola | ng/g | <0.16 | <0.03 | <0.04 | <1.14 | <0.21 | <0.15 | <0.19 | 44.5 | 55.3 | 303 |
| FIN | Pine needles | Hollola | ng/g | na | na | na | na | na | na | na | <20 | <20 | <20 |
| FIN | Pine needles | Hollola | ng/g | na | na | na | na | na | na | na | 23.0 | 123 | <20 |
| FIN | Pine needles | Inari | ng/g | <0.15 | <0.03 | <0.04 | <1.08 | <0.19 | <0.14 | <0.18 | 23.8 | 72.5 | 461 |
| FIN | Pine needles | Inari | ng/g | <0.14 | <0.03 | <0.04 | <1.04 | <0.19 | <0.14 | <0.18 | 26.9 | 69.2 | 1 296 |
| NO | Pine needles | Birkenes | ng/g | <0.18 | <0.04 | <0.04 | <1.32 | <0.24 | <0.18 | <0.22 | <3 | <6 | <20 |
| NO | Pine needles | Birkenes | ng/g | na | na | na | na | na | na | na | <3 | 59.7 | <20 |
| NO | Pine needles | Birkenes | ng/g | na | na | na | na | na | na | na | <3 | 47.0 | <20 |
| NO | Pine needles | Birkenes | ng/g | <0.41 | <0.08 | <0.10 | <2.98 | <0.54 | <0.40 | <0.50 | <3 | <6 | <50 |
| NO | Pine needles | Birkenes | ng/g | <0.16 | <0.03 | <0.04 | <1.17 | <0.21 | <0.16 | <0.20 | <3 | <6 | <20 |
| SE | Pine needles | Råö | ng/g | <0.17 | <0.03 | <0.04 | <1.22 | <0.22 | <0.16 | <0.20 | <3 | <6 | <20 |
| SE | Pine needles | Råö | ng/g | <0.16 | <0.03 | <0.04 | <1.14 | <0.21 | <0.15 | <0.19 | <3 | 1.39 | <20 |
| FIN | Pine needles | Helsinki | ng/g | <0.14 | <0.03 | <0.06 | <0.98 | <0.35 | <0.13 | <0.23 | 198 | 27.9 | <20 |
| FO | Pine needles | Tórshavn | ng/g | <0.15 | <0.03 | <0.04 | <1.10 | <0.20 | <0.15 | <0.19 | 30.1 | 31.8 | 1 035 |
| FO | Pine needles | Tórshavn | ng/g | <0.16 | <0.03 | <0.04 | <1.17 | <0.21 | <0.16 | <0.20 | 3.38 | 23.4 | 275 |
| FO | Pine needles | Tórshavn | ng/g | <0.17 | <0.03 | <0.04 | <1.19 | <0.21 | <0.16 | <0.20 | 8.82 | 21.1 | 429 |
| ICE | Pine needles | Reykjavík | ng/g | <0.16 | <0.03 | <0.04 | <1.17 | <0.21 | <0.16 | <0.20 | 4.03 | 10.5 | 5.90 |
| ICE | Pine needles | Reykjavík | ng/g | na | na | na | na | na | na | na | 60.1 | 198 | 72.8 |
| ICE | Pine needles | Reykjavík | ng/g | na | na | na | na | na | na | na | 61.2 | 174 | 51.2 |
| FIN | Moose | Kurkimäki | ng/g | <0.050 | 0.032 | <0.012 | <0.25 | <0.06 | <0.11 | <0.12 | 11.9 | 39.4 | <2 |
| FIN | Moose | Kurkimäki | ng/g | <0.005 | <0.001 | <0.001 | <0.03 | <0.01 | <0.01 | <0.01 | 2.10 | 5.92 | 2.95 |
| SE | Moose | Grimsö | ng/g | <0.005 | <0.001 | <0.001 | <0.03 | <0.01 | <0.01 | <0.01 | 7.04 | 200 | 72.5 |
| NO | Red deer | Folldal Einunnfjeller | ng/g | <0.005 | 0.008 | <0.001 | <0.03 | <0.01 | <0.01 | <0.01 | 1.74 | 6.81 | <1 |
| FIN | Reindeer | Oraniemi | ng/g | <0.005 | 0.003 | <0.001 | <0.03 | <0.01 | <0.01 | <0.01 | 2.60 | 10.6 | 13.7 |
| FIN | Reindeer | Kutuharju exp. station | ng/g | <0.005 | 0.001 | <0.001 | <0.03 | <0.01 | <0.01 | <0.01 | 8.07 | 7.74 | 13.8 |
| NO | Reindeer | Folldal Knutshø | ng/g | <0.005 | 0.001 | <0.001 | <0.03 | <0.01 | <0.01 | <0.01 | 0.57 | 2.55 | <1 |
| NO | Reindeer | Folldal Sønkletten | ng/g | <0.005 | 0.003 | <0.001 | <0.03 | <0.01 | <0.01 | <0.01 | 2.33 | 13.0 | <1 |
| SE | Reindeer | Norrkai|tum Sameby | ng/g | <0.005 | 0.002 | <0.001 | <0.03 | <0.01 | <0.01 | <0.01 | 5.91 | 14.5 | 2.70 |
Appendix B
Sample Information Reported by the Countries
Denmark: Screening of Chlorinated Parffins, Deschloranes and UV filters in Nordic countires
Sample list

Faroe Islands: Screening of Chlorinated Parffins, Deschloranes and UV filters in Nordic countires
Sample list

Finland: Screening of Chlorinated Parffins, Deschloranes and UV filters in Nordic countires
Sample list

Sweden: Screening of Chlorinated Parffins, Deschloranes and UV filters in Nordic countires
Sample list

Norway: Screening of Chlorinated Parffins, Deschloranes and UV filters in Nordic countires
Sample list

Iceland: Screening of Chlorinated Parffins, Deschloranes and UV filters in Nordic countires
Sample list

Appendix C
Sampling manual
Sampling manual
Each country is asked to contribute with different samples according to ”sample overview”.
| Sample type | Matrix Acronym MAT |
| Air | AIR |
| Pine needle | PIN |
| Freshwater fish | FFI |
| Marine fish | MFI |
| Bird eggs | EGG |
| Terrestrial mammals | TMA |
| Marine mammal | MMA |
Equipment provided
120 ml glass jars
Al-foil and Plastic bags
Labels
Nitrile gloves Size L
Sampling protocol.
Planning the sampling
Start by opening the provided “Sampling protocol” in excel format. Fill in data for each planned sample, one sample on each row. Use the suggested indication of matrix type or change among the possible choices on the list. This will give each sample a Sample identification in the format CO-MAT where CO indicates country, and MAT indicates matrix. The samples should be labelled with their respective Sample identification.
Example: DK-FFI, the Danish Freshwater fish sample.
Use a printout of the sample list to record sample date and other relevant observations. The extra sheet “Notes” can also be used.
Please give coordinates as LAT and LONG in the WGS84 reference system expressed as degrees and decimal minutes. See example in the sampling protocol. We strongly suggest to cross-check the registered coordinates with an independent geographic tool like Google Earth or similar. Select all six Excel cells containing the coordinates, copy the content with Ctrl-C and paste it into the “fly to” window in the upper-left corner of Google Earth. By clicking onto the magnifier symbol Google Earth should show you the correct sample position.
General precautions to be taken to avoid contamination
Collection and handling of samples and material should be carried out in order to avoid contamination of potential environmental pollutants and protect the samples from any kind of impact that will affect their usages as research materials.
For this project UV filters and Chloroparaffins, know sources are grouting, sealing compounds (eg in mixmaster/handblender), soap, cosmetic, creams and lotions, but there are other potential sources, so we recommend some general good sampling routines. Do not use products such as skin lotions, sun cream or other kind of personal care products which might contain UV filters on the day of sampling. Products of the label “Neutral” are accepted. Only specially cleaned sampling containers provided by the laboratory should be used. There should be NO contact between skin and sample/inside of lid/sample container/alumni foil. Use the glows provided through the process of sampling. There should also be no contact between the sample and plastic of any kinds.
Equipment and cleaning procedures for preparation of the sample.
All surfaces that will be in contact with the sample must be covered with clean aluminum foil. The tissue samples should not be in contact with the same foil as the fish/mammal etc,. Any areas that will get in contact with the tissue samples must be covered with aluminum foil. The sample tubes must be labelled. All tools used for sampling should be of either stainless steel or of glass, quarts or other in-organic ceramic materials. The equipment should be cleaned in accordance with the procedure below.
- Washing with in-organic (base) soap
- Rinsed extra-long time with clean water
- Wash with an organic solvent like methanol, ethanol, acetone or cyclohexane.
Sample glass cleaning: The sample glasses should be un-used, and any organic residues should be burned by heating the glasses for 2 hours at 500 ° C. The glasses are sealed with burned aluminium foil under the lids. (This glass is provided by NILU/NIVA).
A. Sampling of Air
Air sampling should be performed only by personal trained in using the local air sampling device. The air sampling device and the local routines should be in accordance with the requirements given in the EMEP Manual for Sampling and Analysis (https://projects.nilu.no//ccc/manual/index.html). Both sampling material (filter and PUF) and sampling device can be sources for CP contamination, in order to get best possible control on contamination, we suggest to use sampling material supplied by NILU and to take a field blank sample.
B. Sampling of Pine needle
- Put on the supplied gloves.
- Take pine needles shoot from the current year (metal scissor can be used)
- Fill the jar as full as possible with needles.
- Mark the sample with Sample identification.
- Make notes on the sample protocol.
- Store the samples in a freezer (-18°C).
Minimum sample amount: 50 gram
C. Sampling of fish
- Put on the supplied gloves.
- Wrap each fish individually in Al-foil provided.
- Put the Al-foil packages in a plastic bag provided. Mark the samples with Sample identification.
- Make notes on the sample protocol.
- Store the samples in a freezer (-18°C).
Minimum sample amount: 100 gram
D. Sampling of Bird egg
- Put on the supplied gloves.
- Wrap each egg in Al-foil provided.
- Put the Al-foil packages in a plastic bag provided
- Mark the samples with Sample identification
- Make notes on the sample protocol.
- Store the samples in a freezer (-18°C).
Minimum sample amount: 60 gram
E. Sampling of Mammals
- Use gloves in the contact with the sample.
- Fill the jar with the sample (liver, muscle or lipids/blubber).
- Mark the samples with Sample identification
- Make notes on the sample protocol.
- Store the samples in a freezer (-18°C).
Minimum sample amount: 100 gram
Storage and transport
Send all samples to NIVA in Oslo as soon as possible and in such a way that the samples will reach the laboratory as soon as possible (DHL or equivalent courier service). It is most important to reduce the transport time, so a good idea is to send the samples early in the week to prevent samples being stored during the weekend. For the closes big cities an overnight transport is normal possible. If you want to discuss the shipment you can contact Kine Bæk at NIVA. Send samples in the same containers used for providing sampling material. Make sure to insulate glass jars properly to avoid breakage during transport. Include a printout of the Sampling protocol. Send the samples to the address below.
When sending the samples please send also an e-mail with the filled in Sample protocol attached to Kine Bæk (kine.bak@niva.no), Malcolm Reid (malcolm.reid@niva.no), and Martin Schlabach/NILU (martin.schlabach@nilu.no). This is important so we can follow up that the samples actual are arriving the lab.
Address
Norwegian Institute for Water Research (NIVA)
Att Kine Bæk
Gaustadalléen 21
NO-0349 Oslo
Norway
NIVA (+47) 22 18 51 00
Kine Bæk (+47) 98 21 54 09
NILU – Norwegian Institute for Air Research
NILU – Norwegian Institute for Air Research is an independent, non-profit institution established in 1969. Through its research NILU increases the understanding of climate change, of the composition of the atmosphere, of air quality and of hazardous substances. Based on its research, NILU markets integrated services and products within analysing, monitoring and consulting. NILU is concerned with increasing public awareness about climate change and environmental pollution.
NILU’s values: Integrity - Competence - Benefit to society
NILU's vision: Research for a clean atmosphere
NILU – Norwegian Institute for Air Research
P.O. Box 100, NO-2027 KJELLER, Norway
E-mail: nilu@nilu.no
ISBN: 978-82-425-3061-5
ISSN: 2464-3327
About this publication
Screening of Chlorinated Paraffins, Dechloranes and UV-filters in Nordic Countries
Martin Schlabach, Anders Røsrud Borgen, Kine Bæk and Alfhild Kringstad
ISBN 978-92-893-7291-6 (PDF)
ISBN 978-92-893-7292-3 (ONLINE)
http://dx.doi.org/10.6027/temanord2022-519
TemaNord 2022:519
ISSN 0908-6692
© Nordic Council of Ministers 2022
Cover photo: Frederico Di Dio/Unsplashed
Published: 31/3/2022
Disclaimer
This publication was funded by the Nordic Council of Ministers. However, the content does not necessarily reflect the Nordic Council of Ministers’ views, opinions, attitudes or recommendations.
Rights and permissions
This work is made available under the Creative Commons Attribution 4.0 International license (CC BY 4.0) https://creativecommons.org/licenses/by/4.0.
Translations: If you translate this work, please include the following disclaimer: This translation was not produced by the Nordic Council of Ministers and should not be construed as official. The Nordic Council of Ministers cannot be held responsible for the translation or any errors in it.
Adaptations: If you adapt this work, please include the following disclaimer along with the attribution: This is an adaptation of an original work by the Nordic Council of Ministers. Responsibility for the views and opinions expressed in the adaptation rests solely with its author(s). The views and opinions in this adaptation have not been approved by the Nordic Council of Ministers.
Third-party content: The Nordic Council of Ministers does not necessarily own every single part of this work. The Nordic Council of Ministers cannot, therefore, guarantee that the reuse of third-party content does not infringe the copyright of the third party. If you wish to reuse any third-party content, you bear the risks associated with any such rights violations. You are responsible for determining whether there is a need to obtain permission for the use of third-party content, and if so, for obtaining the relevant permission from the copyright holder. Examples of third-party content may include, but are not limited to, tables, figures or images.
Photo rights (further permission required for reuse):
Any queries regarding rights and licences should be addressed to:
Nordic Council of Ministers/Publication Unit
Ved Stranden 18
DK-1061 Copenhagen
Denmark
pub@norden.org
Nordic co-operation
Nordic co-operation is one of the world’s most extensive forms of regional collaboration, involving Denmark, Finland, Iceland, Norway, Sweden, and the Faroe Islands, Greenland and Åland.
Nordic co-operation has firm traditions in politics, economics and culture and plays an important role in European and international forums. The Nordic community strives for a strong Nordic Region in a strong Europe.
Nordic co-operation promotes regional interests and values in a global world. The values shared by the Nordic countries help make the region one of the most innovative and competitive in the world.
The Nordic Council of Ministers
Nordens Hus
Ved Stranden 18
DK-1061 Copenhagen
pub@norden.org
Read more Nordic publications on www.norden.org/publications