
- Full page image w/ text
- Table of contents
- Summary
- Introduction
- Literature review
- 1. Overview of pay systems for commercial fishers
- Denmark
- Faroe Islands
- Greenland
- Iceland
- Norway
- Discussion and conclusion
- References
- Appendix 1. A note on socio-economic returns in fisheries
- 2. Denmark
- Introduction
- Fleet structure
- Wage determination system
- Interviews with relevant persons participating in the negotiations of the Agreement on Working Conditions (AWC) for the Danish Fisheries Sector, 2020 to 2023
- Rent calculations
- References
- Appendix: Hire contract
- 3. Faroe Islands
- Introduction
- Faroese fishery
- Wage determination system
- Resource rent
- Interviews
- Calculation of the size and allocation of the resource rent in the Faroe Islands
- References
- 4. Greenland
- Introduction and background
- Greenlandic fishery
- Employment in Greenlandic fisheries
- Wage determination system
- Salary developments
- Resource rent
- Taxation of commercial fishers
- References
- Appendix
- 5. Iceland
- Introduction
- Fisheries management, catch and the fleet
- Literature review
- Payment system
- Interviews with key players in Iceland
- References
- Rent calculations
- 6. Norway
- Introduction
- Norwegian fishery structure
- Wage determination system
- Interviews
- Resource rent in Norwegian fisheries
- References
- Resource rent
- About this publication
MENU
Contents
This publication is also available online in a web-accessible version at https://pub.norden.org/temanord2022-515.
Summary
Share pay, or lay, for commercial fishers is an old way of sharing both risk and benefits from fishing between boat owner and hired crew. Since time immemorial, such share systems have been part and parcel of the Nordic fisheries sector. Yet, when fisheries management reform was introduced, the share system remained in place, thus ‘institutionalising’ it. With the reform of fisheries management towards market-based economic instruments, fisher pay has augmented this, which suggests that fishers are able to share in the increased rent accruing from more sustainably managed fisheries. Fishers can leverage some of the efficiency gains obtained through investments in better gear and vessels. This is a unique feature of the fisheries sector with share payments. Although minimum wage provisions are in place, they are rarely applied. Commercial fishers are generally well paid compared to other occupations in the economy, albeit with differences between the various fisheries segments. Earlier work on fisher pay systems tends to ignore how the dynamics of the fisheries sector influence production risk. This includes changes to fisheries technology and changes in fisheries management settings. Furthermore, previous studies do not consider that differences in marketing schemes influence the price risk, such as through landings via auction or direct landings to processors, or, as in the notable cases in Greenland and Iceland, through forward integrated companies. The findings in this study suggest that fishers are very well paid compared to other occupations. Although this may reflect several factors, including a risk premium for being a fisher, we also observe that in line with the introduction of new management regimes, the fishers who remain in the sector continue to bring home substantial salaries that are well above the wage levels one might expect from land-based jobs. This is likely to reflect the fact that the increased rent in the fishery is captured by the fishers due to the share system, and not only by the vessel or quota owners. This has implications for resource rent taxation. The interviews carried out as part of this study broadly confirmed that fishers are well paid.
Introduction
As an overarching theme, this work looks at the effects on commercial fisher pay when market-based economic instruments (MBEI) are introduced through fisheries management reforms. Theoretically, the introduction of MBEIs in fisheries characterised by overfishing and overcapacity leads to adjustments to the fishing fleet and fishers with both being reduced to better match capacity with available resources. In principle, this should lead to pressure on the fisheries’ income as derived demand for fishers decreases. Concurrently, the introduction of MBEIs will lead to improvements in the fisheries economy, increase profits and rents, and hence also augment wages for fishers in share systems (Asche et al., 2018). Meanwhile, other factors may also influence the wage level of fishers including the price obtained for the catch and the variable costs of the fishing operation, which are generally deducted before shares are obtained.
Different pay systems (e.g. crew shares and its distribution among participating fisher groups, fixed salary with or without bonus) give rise to different incentive structures and may or may not support overall sustainability objectives for fisheries, or objectives for making the fleet more efficient. Different fisheries participants – that is to say the quota owners, vessel owners and crew – also have different incentive structures. For example, in pay systems based on a share of fishing trip grossing the fishers on board will be interested in maximising the quality and quantity of the fish landed to ensure highest prices and highest pay. The incentive to improve quality, however, depends on the pricing mechanism used to determine the ex-vessel price. On the contrary, fishers in systems based on fixed ‘salaried’ income may not be quite so interested in ensuring quality since their salary is paid regardless of the outcome of the fishing operation.
Differences in fisher pay incentive structures may also be found with respect to discards, since in share pay systems it may be considered better to discard fish to ensure the greatest turnover based on the retention of higher quality fish. Accordingly, there is a direct link between fisher pay systems and whether this works for or against fisheries’ sustainability objectives. Vessel and quota owners also have different incentives. Vessel owners’ investments extend over several decades and in a specialised market for second-hand fishing vessels, which may be very thin. Depending on the nature of the property rights of the quota, the quota can resemble any other financial asset and may be in a market where it can be readily sold. This implies that the participants in the fisheries (crew, vessel owner, quota holder) have different incentives, potentially leading to some principal-agent problems.
It has been observed (Nielsen et al., 2018) that in some countries that have introduced market-based economic instruments (MBEI) in their fisheries management, the pay for fishers has increased less than the pay for quota owners. Likewise, Høst and Christiansen (2018) observe that, in MBEI systems, it may be difficult for fishers to become quota owners or skippers. Consequently, there are issues of social equity and the acceptance of such management systems, which may have their origins in the way the pay/salary system works.
Although the resource rents in Nordic fisheries have been identified based on different assumptions of the opportunity costs of labour (Holland, 2011; Nielsen, Flaaten and Waldo, 2012; Waldo et al., 2016; Nielsen et al., 2017; Flaaten and Heen, 2017; Hammerlund et al., 2018), earlier work does not consider fisher pay systems directly, nor that the fisheries sector in the Nordic countries has undergone profound management reforms over the past decades. Nor is there a discussion to be found on the influence on fisher pay systems depending on whether fish landings are channelled as direct landings to processors or through auction markets. This work seeks to bring these two aspects into the discussion, thus highlighting the dynamic nature of the fisheries sector. While fisher pay systems based on share or lay are the most commonly uses in the Nordic countries, they have also proven very resilient over time considering the major structural changes towards MBEI systems.
This work seeks to map out the pay systems in the fisheries sector of five Nordic countries: Denmark, the Faroe Islands, Greenland, Iceland, and Norway. A key question that arises is whether changes in management regimes across the Nordic Region in recent years have benefitted fishers, considering the use of share-based salary systems. In making the harvesting sector more efficient and sustainable, one would expect that overall fishery grossing will increase for two reasons: firstly, the balance between stock size and capacity ought to improve; and secondly, profitability ought to increase due to technological developments. More specifically, the purpose of this work is to shed light on how changes to fisheries management settings in selected Nordic countries has influenced economic outcomes with an emphasis on fishers’ revenues.
Indeed, the findings in this study suggest that fishers are very well paid compared to other occupations. Although this may reflect several factors, including a risk premium for being a fisher, we also observe that in line with the introduction of new management regimes, the fishers who remain in the sector continue to bring home substantial salaries that are well above the wage levels one might expect from similar land-based jobs. This is likely to reflect the fact that the increased rent in the fishery is captured by the fishers due to the share system, and not only by the vessel or quota owners. This has implications for resource rent taxation policy.
This chapter is structured as follows. The next section reviews the relevant literature for the pay systems for commercial fishers. There is scant published material in this field and, as noted above, the material does not consider the dynamic nature of the fisheries sector against the background of fisheries management reform. The following section provides an overview of the pay systems for commercial fishers in Denmark, the Faroe Islands, Greenland, Iceland, and Norway. Finally, the last section provides a discussion of the results and some concluding observations.
Literature review
(Sutinen, 1979) develops an analytical model for the remuneration of fishers with a view to assessing under which conditions fisher and fisheries entrepreneurs consider the share system to benefit both. He concludes that if the share system were to be replaced with a wage system, then the total number of fishers and their individual incomes would fall. He furthermore observes that fishing entrepreneurs are better off in a share system as that system allows some sharing of the risk involved in fishing operations.
A recent article (Matthiasson, 2020) suggests that the ‘share’ or ‘lay’ system used in most fisheries has its origins in medieval times. He observes that “the lay system in use in medieval times in Scandinavia long predates the industrial revolution and may well reflect the social relations of pre-industrial societies that based their subsistence on hunting”.
In other words, the share system is not new and has deep historical roots. It is therefore interesting to observe that little research has been done in this area. Also, the little research that has been done has been rather selective and consider that the prevalent use of the share or lay system in fisheries is motivated by the vessel owners’ preference to share risk (McConnell and Price, 2006). Meanwhile, the risk-sharing perspective does not consider the dynamics of the fisheries sector, such as the introduction of new fisheries technologies or changes in management settings, and how this alters the production risk (output). Furthermore, previous studies fail to consider that the price risk has altered due to changes to the traditional marketing scheme. For example, landings are now sold via auction or landed directly to processors, possibly through forward integrated companies. In addition, over the past two decades, many countries have reformed their fisheries sector to put their fisheries on a more sustainable footing, while also shrinking the number of vessels and fishers to a size commensurate with the available resources. These changes have implications for fisheries’ revenues defined as a share of earnings from fishing trips and their incentives, such as in order to improve catch quality.
Substantial changes to fisheries management regimes in Nordic fisheries have been introduced over the past several decades in response to the need to put fisheries on a more sustainable footing (Nielsen et al., 2018). In most cases, these changes have been gradual in the Nordic countries. Iceland first introduced MBEIs into its fisheries management in 1984 when a demersal ITQ management system was established. In 1990 a system of ITQ covering almost all fisheries in Iceland was established, with almost full transferability of quotas. This system led to very dramatic increases in profitability and rent generation (Knutsson et al., 2015, Gunnlaugsson et al., 2019 and 2020). Norway, Denmark and the Faroe Islands later followed suit by introducing variants of MBEIs. In the meantime, the fisheries were regulated with various forms of regulated restricted access with different forms of licenses and quotas, through regulated fishing days, as well as technical measures such as mesh size regulations to ensure a minimum size of the fish caught, and seasonal closures.
Nielsen et al., (2018) suggests that fishers’ income in the Nordic countries that their study covered has increased substantially in recent decades. Their study also underscores, and our own literature review confirms this, that most studies looking at fisher revenues are local in nature in that they study only specific fisheries and communities. A publication by the Nordic Council of Ministers (Nielsen et al., 2017) notes that “knowledge on salary levels in fisheries is sparse in the scientific literature, with knowledge on salary during fisheries reforms being largely non-existent”.
Nevertheless, some studies have been published that analyse the use of share systems and the implication of this for fisheries. (Matthiasson, 2020) looks at the specificities of Icelandic fisheries and how fundamental changes to the Icelandic fisheries management systems have influenced remuneration. A particular trait of the Icelandic fisheries is that many vessels are part of vertically integrated organisations, often owned by land-based processors. This arrangement creates an issue of internal prices between fishing and processing. This led to some disputes between fishers and operators, which resulted in the creation of the Fish Price Resolution Committee in 1998. Its objective is to assist in negotiations between fisher unions and vessel owners, chaired by the Ministry of Industries and Innovation.
Another study explores the effects on crew remuneration and rent distribution by estimating several management targets (Guillen et al., 2015). Such modelling requires detailed data, which is available for the French Bay of Biscay Norway lobster fishery. In the study, they conclude that “in a share remuneration system, crew salaries can significantly increase when economic performance of the fleet improves […], allowing the crew to capture a portion of the fisheries’ rent”. This leads the authors to observe that in such circumstances ‘economic rents’ are not equal to ‘profits’. In a later article Guillen et al. (2017) concluded that “in shared remuneration systems, therefore, fisheries management measures also have an impact on labour costs and crew wages”. It follows that any analysis of fisher pay should consider the management regime.
In their analysis of Bering Sea/Aleutian Islands crab fisheries Abbott et. al. (2010) report that following the introduction of individual fishing quotas, remuneration increased, often substantially. “Given that the share formulas used to pay crew have remained fairly stable, this implies that the base on which the share is calculated (essentially revenues net of most variable costs) has increased substantially on a daily basis for many vessels – a consequence of IFQ-induced cost reductions and/or increases in live landings per day”. As such, it makes sense to discuss whether resource rent seeps into the remuneration of fishers.
1. Overview of pay systems for commercial fishers
Denmark
The number of employed and those in full-time employment fell between 2010 and 2018 by 8% and 15% respectively. In 2000, 3,410 people were in full-time employment. The major structural adjustment in Danish fisheries with the introduction of individual transferable quotas and vessel quota shares between 2004 and 2007 spurred a substantial reduction in employment. Between 2000 and 2010, the number of employed fell from 3,410 to 1,158 – a reduction of 66%. While employment continued to fall between 2010 and 2018, the reductions are smaller and relatively stable.
From 2010 to 2018, the Danish fishing fleet shrank by 686 vessels, or 24%, to 2,123 vessels. The number of active vessels fell by 178 vessels over the same period, corresponding to a decline of 26%. The number of less active vessels fell by 299, while the number of inactive vessels was down by 209. Measured as tonnage, the registered fleet contracted by 10%, while engine power decreased by 13% during the period (Nielsen et al., 2019).
Danish landings consist of fish for human consumption and fish for reduction (animal feed), see Table 1.1. The most important species for human consumption are mackerel and herring as well as the demersal species cod, plaice and Norway lobster. The most important industrial species for reduction to fishmeal and oil are sandeel, sprat and Norway pout. The small Danish vessels are mainly fishing with nets for demersal species, while the larger vessels use trawl and seines. The largest vessels target pelagic fish and fish for reduction. Some vessels specialise in fishery for mussels and horse shrimp.
| Landing quantity (1,000 tonnes) | 2010 | 2011 | 2012 | 2013 | 2014 | 2015 | 2016 | 2017 | 2018 | Percentage change (2010-2018) |
| Fish for consumption | 166 | 171 | 191 | 196 | 194 | 207 | 226 | 216 | 225 | 36% |
| Fish for reduction | 541 | 446 | 205 | 353 | 412 | 543 | 334 | 570 | 465 | -14% |
| In foreign ports | 121 | 100 | 107 | 121 | 139 | 120 | 111 | 118 | 99 | -19% |
| Total | 828 | 717 | 503 | 670 | 745 | 870 | 671 | 904 | 789 | -5% |
| Landing value (EUR million) | ||||||||||
| Fish for consumption | 207 | 245 | 237 | 210 | 203 | 231 | 292 | 272 | 281 | 35% |
| Fish for reduction | 118 | 101 | 57 | 94 | 82 | 125 | 91 | 91 | 107 | -10% |
| In foreign ports | 75 | 80 | 98 | 99 | 103 | 97 | 106 | 93 | 83 | 11% |
| Total | 400 | 427 | 393 | 404 | 389 | 453 | 489 | 455 | 470 | +18% |
Table 1.1: Landings and landing values of active Danish vessels in Danish and foreign ports, 2018
The average salary cost per person in full-time employment in 2018 is EUR 125,000. This number, however, hides the substantial differences between vessel sizes and type of fishery, as shown in Table 1.2.
The average salary cost per person in full-time employment spans from EUR 62,065 for dinghies to EUR 248,406 for vessels above 40 metres in length using a combination of trawl and seines. These numbers reveal that salary costs per person in full-time employment increase with vessel size. Although it is expected that the same can be said for salary, crew costs are also higher for the large vessels as the fishing trips last longer and so crew costs are higher.
| Vessel group | Net | Dinghies | Seines | Combi | Trawl | Other |
| <12 m | 74,810 | 62,065 | 82,780 | 73,107 | ||
| 12-15 m | 104,677 | 92,056 | 82,272 | 95,051 | ||
| 15-18 m | 103,185 | 103,252 | 100,500 | |||
| 18-24 m | 107,278 | 117,000 | 126,698 | |||
| 24-40 m | 121,130 | 124,466 | ||||
| >40 m | 248,406 | 152,513 | ||||
| Horse shrimp | 130,629 | |||||
| Mussels | 112,465 |
Table 1.2: Salary costs per person in full-time employment on active vessels, allocated per vessel and gear, 2018, EUR[1]Full-time employment is calculated as total working days on active vessels, set at 220 working days per year.
Footnotes
- ^ Full-time employment is calculated as total working days on active vessels, set at 220 working days per year.
Nielsen et al., (2017; 2018) made a study where data on the vessel, catch, landing and sale register from the Directorate of Fisheries were merged with data from the register of taxable income from Statistics Denmark. The average income of a full-time fisher in 2012 was EUR 57,614, of which 14% was non-fishery income. For all persons with any income from fishery, the average income was EUR 56,500, with 31% being non-fishery income. The average income of coastal fishers, defined as working on board vessels up to 17 metres in length, was EUR 45,800. In 2012, the average income comparably measured for all Danish citizens including the employed, unemployed and retired was EUR 34,000. This rises to EUR 48,700 in agriculture, to EUR 54,100 for craftspeople, to EUR 48,500 for commerce and office workers, and to EUR 58,200 for process/machine operators (Nielsen et al., 2018). To this end, fishers are relatively well paid.
Minimum wages are determined through collective negotiations between employers and employees on board fishing vessels. Together, the Danish Fishermen Producer Organisation and the Danish Pelagic Producer Organisation cover more than 95% of total catches and represent the vessel owners, while the organisation 3F United Federation of Workers in Denmark represents the hired fishers.
These two parties negotiate a collective Agreement on Working Conditions (AWC) in the Fisheries Sector including on minimum wages and pension. The current AWC of 9 March 2017 runs for three years from 2017 to 2020 (Danish Fishermen Producer Organisation and 3F United Federation of Workers in Denmark 2014; Danish Fishermen Producer Organisation 2017). The agreement establishes that crew members work with all kinds of jobs on board the fishing vessel, without official titles and salary levels, although these may be established outside the collective agreement in the crew share system. The agreement guarantees fishers a minimum salary per fishing day of EUR 171 and a pension of EUR 34 per day in 2020. As for the minimum wage, there is no difference between fishery types or between types of work on board. A price index regulates the minimum salary.
While the agreement is negotiated between the two parties it is important to note that Danish fisheries are characterised by many vessels which are owner-operated, often with very few or no hired crew members. Although updated numbers are not available, in 2012, 20% of the active vessels were owner operated (Nielsen et al., 2018). In these cases, the collective agreement is only of minor importance.
The negotiations follow the rules of the Danish Labour Market Model that was established in 1899. The partners decide individually their demands for the negotiations and the normal negotiating period is between one and three months. If the partners cannot agree, then first a mediator steps into the process. If this fails, strikes and lockouts can be effective. After some time, the Danish parliament can intervene.
The crew share system allocates vessel earnings to each crew member. It works by fixing shares of the landing value for each crew member on each fishing trip, excluding some specified costs paid beforehand. Crew shares are decided by way of individual negotiations between the vessel owner and each hired member of crew and agreed in the hire contract for each fishing trip. The position on board and the experience of the hired fishers determine the crew shares. Typically, the shares lead to a higher salary than the minimum salary. If not, the vessel owner must pay the minimum salary to the hired crew.
Crew shares are calculated as the gross value of the catch minus costs paid beforehand, including unloading, bridge toll paid to harbours, vessel servicing, fuel, ice, box rent, provisions, pensions, union fees, fees for the producer organisations, and renting of fishing rights.
With both catches and costs differing according to vessel size, area fished, type of gear etc., the shares allocated to each crew member differ between vessels. For example, a vessel of 22 metres may have a skipper that owns the vessel, two crew members and an apprentice. The shares could be 60% for the vessel, 20% for the skipper, 8% for each senior crew member and 4% for the apprentice. For a six-day fishing trip, the catch value could be EUR 50,000 and cost paid beforehand EUR 15,000, leaving EUR 35,000 for sharing. Accordingly, EUR 21,000 goes to the vessel, EUR 7,000 to the skipper, EUR 2,800 to each senior crew member and EUR 1,400 to the apprentice. Since all crew shares are higher than the minimum salary for six days, the crew shares are paid.
Other types of vessels may have different crew sizes, different costs paid beforehand, and different allocations of crew shares. For smaller vessels with only one crew member, crew shares are higher and consequently the vessel share lower.
The income of fishers is taxed as for everybody else in Denmark. The only difference between fishers and other payers of income tax is that fishers have a ‘fisher deduction’ of EUR 25 per day with a maximum of EUR 5,573 per year in 2018.
To support this study, interviews with several centrally placed persons from the fisheries sector were conducted in August 2021, supplemented with informal talks with skippers and fishers. Those interviewed agreed that the fisheries sector is unique in the way pay is agreed, in that the fisher contract is for the duration of the fishing trip only.
Fishers are paid based on a share system. The vessel’s share and variable costs such as fuel and ice are deducted from the gross value of landings. The rest is then divided among the crew and skipper according to a fixed percentage. Crew members are paid in case of sickness and there is a common agreement on pensions. The general observation is that the parties are satisfied with the system and that it is unlikely to change much in the foreseeable future.
All interviewed persons agree that the fishers are paid a fair share and that salary levels are well above the average of Danish workers. Salaries have been on the increase following the introduction of the ITQ system as overall returns are shared among fewer crew and vessels. In addition, the Danish fishing fleet lacks fishers due to a skewed age structure (many fishers and skippers are retiring) and because of the existence of alternative jobs in the offshore and windfarm sectors.
Two major initiatives have started to address the lack of fishers. One concerns the contracting of foreign fishers from other EU countries, Iceland and the Faroe Islands. Another initiative concerns the recent Apprentice Agreement whereby vessel owners pay into a fund in return for hiring an apprentice on board, a system which is run by the Danish Fishermen Producer Organisation.
The interviewees are generally content with the present system which is robust and worth defending. In respect of future negotiations on the agreement, a holiday arrangement may form part of the discussions. In addition, it was observed that as fisher pay is irregular and highly variable, a system with regular payments could form part of future talks. This may also help address the problems of the recruitment of younger people to the fisheries sector.
The socio-economic return in 2018 stood at EUR 120 million, corresponding to 25% of the total landed value of the Danish fleet (see Appendix 1 for a technical description of socio-economic returns in fisheries). This is higher than before the introduction of the individual transferable quota system, which highlights the importance of the fisheries’ management settings. Between 2002 and 2018, the distribution of the socio-economic return between labour, capital and the public sector changed considerably. While in 2002 labour received 42%, this fell to 13% in 2018. The corresponding figures for capital are 34% and 63%, and for the public sector 24% and 24%. It can be concluded that it is the fishers that bear the burden of the Danish fishery reform in the sense that they receive a smaller share of the overall socio-economic returns. Capital (vessel/quota owners), meanwhile, has been able to secure a major part of the socio-economic return following the introduction of the ITQ system.
However, between 2002 and 2018, full-time employment fell from 3,087 to 983 fishers and so their socio-economic return in real terms stood at EUR 32 million in 2002 compared with EUR 16 million in 2018. These figures suggest an average increase for labour’s socio-economic return of just shy of 60% over the same period. As the interviews revealed, this may be the reason why the crew still seems to be content with the situation and their salary levels.
Faroe Islands
Commercial fishers’ pay in the Faroe Islands is almost entirely based on a revenue sharing system. There is a minimum wage system of DKK 1,100 per fishing day (the equivalent to EUR 150) when catches are low. This is financed by the fishing industry through a levy of 0.6% on landed value. This is sometimes used in demersal long-line fishing around the islands, whereas pay far exceeds the minimum for larger vessels. It should be noted that the minimum wage is not part of the vessel’s accounts, so the figures below do not include this. The fishers and vessel crew also get a 14% tax break (compared to workers in the rest of the economy) for income up to DKK 470,000 per year (approx. EUR 63,000).
The share of the total revenue that the fishers earn is determined by way of negotiations between the shipowners and the fishers’ organisations that take place every other year. The last negotiations concluded in May 2020. The Faroese government has no role in these negotiations. The different shares are often based on historical conditions and do not change much over time. The system of pay is quite complex and differs across different vessel groups.
In general, fishers on long-liners get a much larger share of the revenue than fishers on purse seiners, with trawlers and factory trawlers somewhere between the two. On the vessels, the different roles of the crew give them different salaries. The captain usually earns around two to three times the salary of the deckhand, while the engineer and cook get half of the extra pay that the captain earns.
Table 1.3 below gives examples of share distributions for the different groups of vessels. Table 1.3 does not explain all the complexities of the agreements between the fishers and the shipowners. The first column is the percentage of the sales (turnover) which determines the basic share or part. The captain, for example, gets one additional part on trawlers. This means that if the sales were DKK 100 million for a trawler with 27 men on board, then the deckhands get DKK 27 million divided by 27, which is DKK 1 million each. The captain then earns DKK 2 million, the engineer DKK 1.75 million, and the cook DKK 1.25 million. The parts differ according to the type of vessel.
| Calculation of basic part for deckhand | Captain | Engineer | Cook | |
| Long-liners | 43% | 2.15 parts added | 0.8 parts added | 0.25 parts added |
| Trawlers | 27% | 1 part added | 0.75 parts added | 0.25 parts added |
| Factory trawlers | 37.75% | 2 parts added | 1 part added | 0.25 parts added |
| Pelagic vessels | 17.5% | 1.75 parts added | 0.9 parts added | 0.25 parts added |
Table 1.3: Parts for crew members
Figure 1.1: Salaries as a percentage of sales (= turnover) for the different groups of fishing vessels, 1996-2017
Although the salaries are negotiated as a stable percentage of sales, actual salaries can vary considerably over the years (see for example the long-liners in Figure 1.1). One reason for this can be that long-line shipowners can subtract some of the costs, such as oil, before calculating fishers’ pay. Oil prices fluctuate, often making such costs considerable and highly variable, which can in turn affect the percentage in the figure above.
In recent years, fishers have had a large increase in their salaries which is particularly true for fishers and crew on pelagic vessels. Figure 1.2 shows the salaries per full-time employee for the vessel groups (Salaries per full-time employee for the different groups of fishing vessels, 1996-2017 in DKK thousand). This is what one would get if one participated in every fishing trip. However, it should be observed that there are typically two crews on pelagic vessels, so one would only get half that salary if one was on this vessel. On the other hand, small vessels such as long-liners have a much lower salary, and there is often only one crew.
Figure 1.2: Salaries per full-time employee for the different groups of fishing vessels, 1996-2017 in DKK thousand
Although the annual pay on pelagic vessels and factory vessels is quite large, trawlers and especially long-liners do not have this level of salaries. For all groups, the salaries have been on the increase since 1996. While these numbers are not adjusted for inflation, there has nevertheless been an increase in real salary levels over the period.
The number of fishers has been declining in the Faroe Islands (see Figure 1.3). However, for the groups included in this analysis there has not been a large decline. The decline has been among small-scale fishers. As Figure 1.3 shows (number of full-time fishers for the different groups of fishing vessels 1996-2017, right scale shows total, left scale shows individual vessel groups) there were almost 1,000 fishers at the start of the century but this has since declined to around 700. It is particularly in demersal fishing that the number of fishers has fallen.
The interview part for this study was carried out in June 2021 through talking to the chair of the Faroese Fishermen’s Association, Mr. Jan Højgaard. There is a general feeling that fishers are well paid, and this is true in particular for the roughly 200 fishers participating in pelagic fisheries in the North-East Atlantic and the cod fishery in the Barents Sea. At the other end, smaller scale fishers fishing with long-lines and nets have long workdays, less turnover and do not feel overpaid.
It is observed that vessels today are better and that working conditions have improved considerably. This has been thanks to improvements in fishing gear and fishing technology. As a result, fishers have better work/life conditions. When considering the level of fisher pay, the possibility of injury and early retirement must be taken into account due to the hard work involved in some fleet segments. Meanwhile, the interviewee noted that low salaried fishers have difficulties in obtaining bank loans (such as for a home) as their income stream is uncertain.
Figure 1.3: Number of fishers (FTEs) in the different groups of fishing vessels from 1996 to 2017 (estimated from number of vessels in 2016/17).
Fishers are included in the general unemployment insurance system of the Faroe Islands. This general system does not have any fisheries-related provisions such as compensation for poor catches. It is also noted that few fishers benefit from the system.
Socio-economic returns have been identified for two vessels groups commercially active in the Faroe Islands for both 1997 and 2017. The two groups are smaller demersal fishing vessels operating around the isles and regulated through effort regulations system, and demersal factory vessels fishing in the Barents Sea regulated by an ITQ system. The main observation from comparing the two fleet segments relates to costs. The smaller vessels under effort regulation have been subjected to considerable costs increases and, despite a 50% increase in turnover for the group, costs have increased far more and rendered this fleet segment unprofitable in 2017. Conversely, factory vessels with the same 50% increase in turnover have been much better at managing costs and pre-tax profits more than tripled between 1997 and 2017. This suggests that there are benefits accruing to the fleet under an ITQ system in a way that enables them to manage the cost structure of their fishing operations more easily.
As to salary levels, both vessel segments have fared well. The annual average salary for the smaller vessels has almost doubled between 1997 and 2017 and almost tripled in the case of the factory vessels. Compared to salaries in alternative employment, the 2017 figures are telling: at EUR 82,345 per annum for the smaller vessels and EUR 163,569 for the factory vessels, compared to EUR 53,333 for alternative employment. Consequently, fishers are paid considerably more than comparable land-based jobs.
The calculated socio-economic returns for the two fleet segments also paints an interesting picture for the Faroe Islands. Figures reveal that the principal ‘winners’ are the public sector and labour. The returns to capital (vessels and quota owners) have fared poorly in the case of both the small-scale segment and factory vessels. These observations underscore the importance of the regulatory system in generating socio-economic returns. Conversely, however, as returns to labour have increased over the years in both fleet segments, it does not seem plausible to conclude that returns to labour hinge on the different management settings.
Greenland
Greenland and the Greenlandic economy is highly dependent on the fishing industry. The fishing industry accounts for 95% of total exports. The importance of fishing is also evidenced by the large number of people employed in the industry.
In 2018, the Greenlandic workforce totalled 26,848 of which 4,332 people were employed in the ‘fishery and fishery-related industry'[1]Includes both employment in the primary catch activity as well as processing. as their main occupation. This means that approximately 16% of the total Greenlandic workforce receives their main salary from the fishery and fishery-related industry.
Figure 1.4 shows that in 2018, in Greenland 7,772 people had ‘fishery or fishery-related industry’ as their primary income for at least one month per year. This may include seasonal employment in the processing industry and activities connected to dinghies and hunting. The relatively large number of people who receive some income from the industry for at least one month each year indicates that the industry is largely seasonal and that weather can have a considerable impact on the activity over the year.
Footnotes
- ^ Includes both employment in the primary catch activity as well as processing.
Figure 1.4: Number of people occupied in the Greenlandic fishing industry, 2008-2018
In recent years the number of vessels fishing with line and fishing from a dinghy has increased while the number of vessels fishing with trawl, net and pot has decreased. This development may be a sign of better profitability for the halibut and cod fisheries, which are harvested with line by dinghies. We also observe that the trawl, net and pot fleet segments have contracted and, in so doing, have become more efficient.
Inshore fishing is characterised by landings of whole non-processed fresh, iced fish landed by small vessels, and dinghies at shore-based collection points in the settlements. Offshore fishing is characterised by big oceangoing vessels with on-board processing facilities to cook and freeze, for example, shrimp and Greenland halibut and packaging for direct sale to the retail sector for processing.
| 2012 | 2013 | 2014 | 2015 | 2016 | 2017 | 2018 | 2019 | |
| Offshore trawler | 119,310 | 172,538 | 196,590 | 175,271 | 159,658 | 195,420 | 193,268 | 152,399 |
| Offshore trawler, foreign | 29,896 | 29,617 | 55,591 | 23,447 | 24,504 | 24,636 | 24,853 | 25,280 |
| Total offshore | 149,206 | 202,155 | 252,181 | 198,718 | 184,162 | 220,056 | 218,121 | 177,679 |
| Inshore trawler | 58,206 | 43,654 | 38,168 | 33,944 | 41,349 | 44,125 | 39,876 | 42,893 |
| Inshore vessel | 22,421 | 22,792 | 23,102 | 24,987 | 30,817 | 26,719 | 23,684 | 24,016 |
| Inshore dinghy | 25,211 | 32,537 | 33,578 | 35,228 | 42,308 | 40,614 | 37,009 | 37,887 |
| Total inshore | 105,838 | 98,983 | 94,848 | 94,159 | 114,474 | 111,458 | 100,569 | 104,796 |
| Total (tonnes) | 255,044 | 301,138 | 347,029 | 292,877 | 298,636 | 331,514 | 318,690 | 282,475 |
Table 1.5: Total landings from Greenlandic and foreign vessels in Greenland by vessel group (tonnes)
Table 1.5 shows that inshore and offshore trawlers catch the largest number of fish landed in Greenland. Overall Greenlandic vessels land most of the fish in Greenland, while foreign fleets contribute around 10%.
Table 1.5 also shows the value of the total inshore landings according to vessel type. This statistic is only available for inshore fishing vessels. The relatively large increase in the total landed value attributed to dinghies could have several explanations. Firstly, and perhaps most importantly, improvements in control functions have increased the registration of landings. Secondly, it may also be a consequence of the modernisation of the value and logistics chains. Options related to transport and conservation, such as freezing, have improved opportunities to sell the fish to a larger market and at a better quality, which raises prices and revenues. Improvements to the value chain are especially relevant to the Greenland halibut, which has experienced an 41% increase in landing volume, while the landing value has increased 84%.
As seen in Table 1.6, dinghies, dog sleds and the like experienced the largest increase in total landing value with an increase of 127% in 2019 compared to 2012. The other vessel size categories experienced a somewhat similar increase in total value at 43%, 53%, and 64% respectively for the groups < 10m, 10-20m, and > 20m.
| 2012 | 2013 | 2014 | 2015 | 2016 | 2017 | 2018 | 2019 | % change 2012 to 2019 | |
| Dinghies, dogsled etc, | 176 | 175 | 202 | 232 | 255 | 262 | 285 | 256 | 45 |
| < 10m | 346 | 332 | 494 | 492 | 748 | 563 | 575 | 633 | 83 |
| 10-20m | 1,296 | 1,199 | 1,580 | 1,524 | 2,027 | 1,844 | 1,949 | 2,232 | 72 |
| > 20m | 21,805 | 16,233 | 14,101 | 12,933 | 12,361 | 10,748 | 12,941 | 16,419 | -25 |
Table 1.6: Average landing value per individual vessel, DKK thousand
One of the most important companies is Royal Greenland, which is owned by the Greenlandic self-government. Another important company is the privately owned Polar Seafood. Both companies have factory and fishing vessels able to operate offshore as well as smaller inshore fishing vessels. In addition, the two companies have onshore processing plants focusing on cold water shrimp, Greenland halibut, and other species.
Niisa Trawl Aps, Sikuaq Trawl A/S, Artic Prime Fisheries ApS, Qaleralik A/S, Sigguk A/S, Angunnguaq A/S and Qajaq Trawl A/S are all private Greenland-based companies operating in the fishing sector using larger fishing vessels. Beside these, the companies operate smaller vessels of less than 30 metres in length that are typically family owned.
A central element of the fishing sector is vertical integration. For example, Royal Greenland and Polar Seafood have internal trade between the vessels and the landing points and processing facilities. This may create situations where it is difficult to establish the ‘right’ market price for the landed fish on which the crew remuneration is calculated, a situation which may create dissatisfaction among the crew members.
With respect to wage determination systems, the fishing fleet can be divided into three main categories:
- Corporate-owned large vessels, typically involved in offshore fishing activities where the workforce is covered by a collective agreement;
- Smaller and mid-size vessels, typically involved in inshore fishing activities, landing in local villages and settlements without a collective agreement; and
- Dinghies, which are either owner-operated or part of a loyalty system with the bigger corporations.
For the crew on vessels operated by the big corporations, there is a collective agreement system for determining crew payment. For the other vessels, crew payments are based on an informal system. Wages and part-sharing are determined from vessel to vessel and from settlement to settlement. Bear in mind that, in many cases, small-scale fishing is operated as a family business in small-scale fishing communities.
The big vessels in Greenland are generally owned by bigger companies like Royal Greenland, Polar Seafood, Niisa Trawl, and the like. Royal Greenland is government-owned and has a collective agreement with the Greenlandic trade union, SIK.[1]SIK, Sulinermik Inuussutissarsiuteqartut Kattuffiat, is the biggest trade union in Greenland The collective agreement is written in Danish and covers the crew on Royal Greenland trawlers of more than 300 GT. The crew consists of various skilled and unskilled labour, and engine technicians. The privately owned companies Polar Seafood Greenland and companies organised under APK[2]APK, Aalisariutinik Piginneqatigiiffiit Kattuffiat, The Greenlandic Offshore Fishing and Export Association have a collective agreement with the Faroese Maskinmeistarafelagið.[3]Maskinmeistarafelagið, a Faroese trade union for engineers also covering fishers in Greenland The agreement is written in Danish and is intended for engine technicians on board the two vessels ‘Polar Princess’ and ‘Polar Nanoq’.
Royal Greenland wage system – SIK
Specific data on the separate bonus agreements is only available for one collective agreement between SIK and Royal Greenland. The specific agreement has been in place since December 2000 and is still valid today. Royal Greenland is the largest fishing company in Greenland and, as mentioned, is the only company with publicly available information on their agreement. It would, however, be safe to assume that Royal Greenland, in some way, sets the standard and framework which other companies benchmark against.
For Royal Greenland crew, their wage consists of a) a fixed share determined by one of six different job positions and level of education, and b) a bonus determined by a share of the revenue from the sale of the landing, contingent on the total number of crew members. As an example, a fisher aged 18 or over working on a prawn trawler receives a salary of DKK 12,440 and a bonus of 0.42% of the revenue if there are 25 persons on board the vessel. If it is a halibut boat with 25 crew members the salary is the same, but the bonus share increases to 0.62%.
Polar Seafood – Maskinmeistarafelagið wage systems for big vessels
The Faroese Engineers Union has a collective agreement with Polar Seafood and other members in The Greenlandic Offshore Fishing and Export Association (APK), apart from Royal Greenland.
Compared to the Royal Greenland agreement, the Faroese Engineers Union agreement is more performance based. The wage system in the Faroese Engineers Union agreements solely takes the form of a part-based system, where all the crew receive an equal share of a crew-part, but with additional parts depending on job position and experience.
The crew-part share of the landed value is 37.75% for cod and demersal fisheries, and 28% in pelagic fisheries. The landed value is the sale at the first link in the value chain, less the cost of fuel (cod and demersal fisheries only) and other related costs (transport, sales costs, insurances, taxes and fees).
This crew-part is then divided equally by the number of crew and additional parts are added. As an example, a chief engineer will normally receive 1 part plus 1 part (in total 2.0 parts), while a lower-ranked engineer on board may receive 1 part plus 0.5 parts (in total 1.5 parts) and a fisher with more than 18 years of experience will receive 1 part.
In the agreement between Polar Seafood and Maskinmeistarafelagið, the crew share varies with the number of crew. The starting point in pelagic fisheries is 28% for 30 crew members with an increase/decrease of 0.45% per additional/fewer crew member. This means that if the fishing trip is made up of 24 crew members, they get to share 25.30% (28-(6*0.45) =25.30) of the landed value. When additional crew members are included on the trip, a smaller share goes to Polar Seafood. This arrangement helps to maintain the performance-based wage system. Finally, Polar Seafood crew receive a yearly bonus of 14% of the wage, which the company can withhold if there is misconduct.
Small and mid-size vessels (< 10m and 10-20m)
Small and mid-size vessels only account for 9% of total landings. The wage systems are usually very informal and based on unwritten customary rules. According to KNAPK[4]KNAPK, Kalaallit Nunaanni Aalisartut Piniartullu Kattuffiat, an interest group for Greenlandic fishers and hunters, a general wage determination system does not exist.
Wage determination often takes the form of a revenue sharing system, which is determined from vessel to vessel and village to village. There are examples of a wage sharing system among mid-size vessels, where the crew will share 45% of the landing revenue (gross) after the deduction of oil, supplies and the like, that is to say net landed revenue. How the 45% crew share is distributed among the crew is subject to changes and negotiation on board each vessel and for each fishing trip depending on the location and particular circumstances.
Dinghies
Dinghies are of great importance to the Greenlandic fishery economy and social fabric, especially in relation to the vessel size and geographical distribution, and its social importance to small and remote fishing communities. Dinghies accounted for 34% of the total landed value in 2019.
There is no singular wage system for this segment and the area is not regulated. Rather, this is a traditional community-based fishing operation by one or two people, often as a family operation, and is informal in nature. In this regard it should also be mentioned that due to its informal nature, there is likely to be an element of this fishery which is not accounted for officially and may be part of the ‘informal economy’ in Greenland.
There are cases where the big fishing companies such as Royal Greenland and Polar Seafood provide loans and/or help to fishers to enable them to become the operator and owner of a dinghy. In return, the loan is conditional on the understanding that the operators sell their catch to the company (e.g. Royal Greenland[5]Greenlandic media Sermitsiaq AG, https://sermitsiaq.ag/node/199971) in the local settlement.
There are also examples of Royal Greenland financing dinghies which then are leased to local fishers. In this way, Royal Greenland and Polar Seafood broaden their resource base of fish and provide opportunities for communities that depend on the fishing industry and fishers with limited resources of their own.[6]Royal Greenland news, August 2017 and January 2018
This way of financing a dinghy ensures the fishers’ loyalty and cements a dependency between the companies and the individual operator. There are known cases where Royal Greenland issues loans to fishers who are denied loans from commercial banks. In this way, Royal Greenland assumes the responsibility and risk of supporting local development in the settlements and villages.
Greenlandic income tax ranges from 42% to 44% depending on the municipality.[7]Greenland Tax Agency, Tax percentages Based on data from Greenland Statistics, actual taxation on inshore fishers’ salary after deductions has grown from 29% in 2008 to 36% in 2018.[8]Greenland Statistics [FID001]
For several years, it has been the goal of the Greenlandic government to impose a new uniform resource rent system across fishery sector. A task force consisting of the government and the fishing industry, among others, was established in 2016. The work of the task force resulted in the “Report on the Resource Rent in the Greenlandic Fishery and Proposals for New Resource Rent Models” (Ögmundsson & Haraldsson, 2017).
Prior to the reform of the resource rent in 2015, the report conducted by the task force established that, in total, Greenland receives DKK 0.78 per kilo of catch in tax, while Iceland and the Faroe Islands receives DKK 0.29 and DKK 0.24 per kilo respectively. This means that Greenland receives three times as much as the two countries that appear as the most comparable countries in the region (Ögmundsson & Haraldsson, 2017). The primary aims of the task force were to compare taxation systems in different countries and propose a revision of the resource rent in Greenland. Additionally, the task force was to develop concrete proposals for uniform, transparent and simple models for charging resource rent from fishery.
The Greenlandic government devised a new simple resource rent model valid from 1 January 2018. The resource tax rates are determined and published every quarter by the Greenland Tax Agency. The resource rent differs between catches that are landed and sold for domestic processing (indhandling) and for catches that are directly exported and not used in the local processing industry. Furthermore, a special regulation applies to pelagic species (Naalakkersuisut, 2017).
For the first quarter of 2018, landings for domestic processing are charged a resource rent of 5% of the landing value and, if the landing value accounts for less than DKK 8 per kilo, a basic tax of DKK 0.05 per kilo is paid (Naalakkersuisut, 2017). For catches that go directly to export, the resource rent amounts to a 5% charge of the export value if the price is between DKK 12 and DKK 17 per kilo. The resource rent increases by 1% per additional DKK 1 per kilo until the price per kilo is DKK 29. Exports with a value above DKK 29 per kilo are charged a resource rent of 17.5%. If the price per kilo is lower than DKK 12, the resource rent is DKK 0.2 per kilo, which corresponds to 1.6% (Naalakkersuisut, 2017).
The resource rent of pelagic species is based on a fixed price per kilo depending on whether the vessel is domestic or foreign, and depending on the species. For instance, for mackerel a domestic vessel pays DKK 0.40 per kilo, while a foreign vessel pays DKK 1.00 per kilo. (Naalakkersuisut, 2017).
Footnotes
- ^ SIK, Sulinermik Inuussutissarsiuteqartut Kattuffiat, is the biggest trade union in Greenland
- ^ APK, Aalisariutinik Piginneqatigiiffiit Kattuffiat, The Greenlandic Offshore Fishing and Export Association
- ^ Maskinmeistarafelagið, a Faroese trade union for engineers also covering fishers in Greenland
- ^ KNAPK, Kalaallit Nunaanni Aalisartut Piniartullu Kattuffiat
- ^ Greenlandic media Sermitsiaq AG, https://sermitsiaq.ag/node/199971
- ^ Royal Greenland news, August 2017 and January 2018
- ^ Greenland Tax Agency, Tax percentages
- ^ Greenland Statistics [FID001]
Iceland
Generally, Icelandic commercial fishers are paid catch shares. This has secured them a share of the high profitability of the fishing sector, making fishers among the best-paid professions in Iceland. Figure 1.5 shows a comparison of wages across selected professions.
Figure 1.5: Wages for selected professions in Iceland.
All the employed fishers are grouped as one, regardless of their job on board and the fleet segment. Fishers have similar pay systems with the difference mostly being how big of an extra share they receive. There are more differences in which kind of fisheries they take part in, the size of their vessel and type of gear. Self-employed fishers mostly use small boats and determine their own salary. They can be quota-owners or lease most or all of their catch quota, only owning their vessel.
Most of the quota is, however, owned by companies. Quotas are allocated to vessels, which can be run independently or by vertically integrated companies, which also run a processing plant and maybe even a sales company. That leaves fish processors without quotas. They must buy their fish from auction markets or through agreements with vessel operators to buy some of their catch. They routinely pay a higher price for the catch.
Fisher pay is determined based on collective agreements between organisations of vessel operators/owners and fishers. If the catch value does not reach a certain minimum, fishers get a fixed salary. One share corresponds to a deckhand share. This forms the basis from which the skipper gets one extra share (can be less for the smallest boats), the first mate half an extra share (second mate one-quarter, third mate one-eighth), the main engineer half an extra share (second engineer one-quarter, third mate one-fifth for larger engine vessels or one-eighth for smaller engine vessels), the cook a one-quarter extra share. On freezer trawlers, some extra shares are distributed to the boatsman, netting man and supervisor.
All vessel operators, except for freezer trawlers, must make a formal agreement with the crew of each vessel on the fish price and how the catch will be sold. There is a collective agreement for the minimum catch price for cod, haddock, redfish and saithe for direct sales in vertically integrated companies. This also influences some other catch values, such as for ‘development quota catches’. The minimum price is negotiated on a monthly basis by an official committee with representatives from fishers and vessel owner organisations (úrskurðarnefnd sjómanna og útvegsmanna). The price of other species is negotiated with each crew separately for direct sales. So, in some sense, the catch unit value represents an agreement of pay rather than the true price of fish.
If the catch is sold to a third party, the vessel operator negotiates the price of direct sales. If the catch is sold in auction markets, domestically or abroad, the price is fixed there.
Before the crew shares are calculated, vessel operators can deduct various costs from the gross value of the catch. They can deduct operating costs, which is a fixed percentage linked to the global market price of oil. A maximum cost of 30% of catch value has been most common for over a decade, with a temporary clause of a 0.5% deduction between 2017 and 2020 for direct sales in vertically integrated companies. For freezer trawlers it is a little less or a little more depending on whether sales are FOB or CIF. Also deducted are the cost of auction (around 5%), the cost of investment in new vessels (up to 10%) if the catch value is high enough, and the cost of transportation and customs for auction markets abroad (around 15% to 20%) with auction costs.
Smaller vessels of less than 30 GRT and 15 metres in length can only deduct auction costs and transport to auction markets abroad. However, they can also deduct the cost of gutting on land when the catch is sold at auction.
Crew share percentages per deckhand differ mostly by the size of the vessels in terms of gross registered tonnage, fishing gear, and how many crew members are on each fishing trip. For trawlers, their length is also considered, but for freezer trawlers the shares depend mostly on the number of crew.
A rule of thumb is that the smaller the boat, the higher the percentage of catch value per deckhand, but the catch is of course significantly less. Vessels of less than 30 GRT and 15 metres in length which qualify for the hook-and-line quota system, have a separate agreement that depends mostly on the number of crew, although if the hooks are baited on land the share per deckhand is less. There are also differences in extra shares per station; if there are very few on board they have less of an extra share. The crew should be able to choose which agreement is used.
Fishers who own their vessel and/or quota determine their own pay. They may not be paying themselves maximum salaries, for example for tax reasons. They also do have a reputation of receiving quotas at no cost in exchange for a lower price of fish.
The negotiation of general wage agreements is carried out on a national basis. It is primarily in the hands of fisher organisations (SSÍ/Sjómannasamband Íslands), engineer organisations (VM/Félag vélstjóra og málmtæknimanna) and skipper/mate organisations (FS/Félag skipstjórnarmanna) on one side, and the Federation of Icelandic Fishing Companies (SFS/Samtök fyrirtækja í sjávarútvegi) and the Confederation of Icelandic Enterprise (SA/Samtök atvinnulífsins) on the other. This major collective agreement sets the minimum wages for all employed fishers.
A special collective agreement for employed crews on smaller vessels was finally reached in August 2012. The agreement is between SSÍ/VM/FS and the National Association of Small Boat Owners (LS/Landssamband smábátaeigenda). At the time, the upper size limit was less than 15 GRT, thought to correspond to 12 metres in length at most. This was also the size limit for the hook-and-line quota system. In July 2013, the upper size limit for the hook-and-line quota system was changed to less than 30 GRT and 15 metres in length by law. There was some debate as to whether the agreement would follow the change in size limit. This not only affects pay systems but also which of the vessels can go fishing in the event of a fisher strike. According to a ruling of the Icelandic Labour Court (Félagsdómur) in 2017, the agreement can include vessels up to 30 GRT and 15 metres in length.
The duration of collective agreements is usually set at around two years but can have a much longer actual duration. The current agreement is from February 2017 and followed ten weeks of fisher strikes, with the previous agreement set in January 2009 and expiring in January 2011. Negotiations on new agreements were stalled by COVID-19 restrictions in 2020. In February 2021, the negotiations were referred to the State Conciliation and Mediation Officer and, as of September 2021, the fishers have terminated the negotiations. Future developments are unclear.
Over the years, the Icelandic government has regularly stepped into debates and negotiations in many ways. Fisher strikes have sometimes been stopped by law and been subject to arbitration, and there have been a number of attempts to introduce some sort of law regarding fish price and fisher pay. In 1998, the Directorate of Fresh Fish Price was established, working alongside an appointed price ruling committee of representatives established from earlier debates. The objective was to ensure public surveillance of fisher pay by surveying fish prices and to ensure that the objectives of the collective agreements were upheld, thus promoting fair wages for fishers.
One of the biggest issues at the time the directorate was established was the deduction of the cost of quota buying or leasing from catch value before the calculation of crew shares, which is prohibited by law and agreements. Although this is not as big a problem today, the issue still exists. Another issue was the price fixing of catch sales in vertically integrated companies, which continues to be a major challenge today particularly in pelagic fisheries.
There is a rich tradition for unionisation in Iceland among fishers. Separate unions exist for fishers, skippers and mates (officers), and marine engineers. During the interviews, which took place in early 2021, both fishers and quota/vessel owners agreed that the introduction of the ITQ system has had a major impact on wage negotiations. Fishers observe that there is a lack of transparency regarding the price obtained from the catch (when not landed via auction). There is also disagreement on the cost sharing, in particular related to pension contributions and government fees (fishing fees and carbon taxes). In addition, there is a sense that negotiations and general debates between fishers and their employers are getting tougher and harsher.
Leaders of fisher unions agree that fishers are well paid compared to other industries. Being a fisher/deckhand requires little formal education and even when compensated for harsh working conditions and the sacrifices of being away from home for long periods of time, fishers are well paid. On the other hand, for fishers’ unions, the introduction of the ITQ system seems to have mostly benefitted the vessel/quota owners. This is a feeling that is not shared to the same extent by the vessel/quota owners themselves.
The introduction of the Icelandic ITQ system has led to capital accumulation by vessel/quota owners and to a highly improved fisheries economy. This observation is shared by all stakeholders in the fishing industry. As for the representatives from the vertically integrated companies interviewed for this work, they note that the ITQ system saved fish stocks and the companies. For the most part, fishing companies are now thriving and resilient and profitable enough to enable them to invest in technology, marketing and innovation. Fishers, on the other hand, feel that the ITQ system has concentrated power, quotas and wealth in few companies. They also note a dichotomy in that the Fisheries Management Act states that fish stocks are the common property of all Icelanders. When a fishing fee was introduced by the government, this situation led to a dispute as to who was to bear the costs of this, i.e. the fishers or the quota owners.
Characterised by many companies that are forwardly integrated, the calculation of resource rents is complex and requires assumptions about the ‘true’ price of fish sold from vessels to processing facilities. Such ‘transfer pricing’ has similarities to what happens in multinational conglomerates where there is extensive selling and buying between companies withing the same family of operations. But it is unique in the Nordic fisheries sector, except for Greenland, and a main characteristic of the Icelandic fishing setup.
While Iceland was one of the first countries in the Nordic Region to introduce MBEIs in its fisheries sector, it was very slow to produce the desired economic outcomes. Introduced in 1991 in Iceland’s most important fisheries, it took two decades before some stability was found due to falling catches, fleet over-capacity, and lack of consolidation, which could possibly have its origins in the forward integration nature of the industry. Another reason could be the debt burden and subsequent financial costs of quota holdings that were purchased in order to remain in the industry. In this regard, it is observed that an important part of the potential rent generated was grandfathered by the initial quota holders when they left the industry. Since 2010, however, things have improved and the industry has been profitable.
Wages to fishers are high compared to similar land-based work. In 2019, wages were 41% higher than that of land-based work and fisher salaries have increased significantly over the past two decades. In terms of resource rent, the Icelandic calculations made for this study show that, in recent years, the part of the rent going to capital and the public has been increasing while the rent to labour has been relatively stable. However, when compared to earlier years when the industry was undergoing adjustment, the rents going to labour and the public have been declining.
Norway
The Norwegian pay system for commercial fishers is relatively egalitarian based on the ‘lott’ revenue sharing system and where the income is shared among the participating fishers albeit with differences reflecting experience. ‘Lott’ is the term used for the revenue resulting from the fisheries catch. In Norway, collective agreements between fishers’ unions and the boat owners federations detail how the ‘lott’ is to be distributed between the boat owner and the fishers (Bergland & Pedersen, 1999). For the coastal fleet, the collective agreements are between the crew section and boat-owner sections in Norges Fiskarlag (The Norwegian Fishermen’s Association), while for the trawler and purse seine fleet the agreement is between Norsk Sjømannsforbund (The Norwegian Seafarers Union) and Det Norske Maskinistforbund (Norwegian Union of Marine Engineers) on the one side, and Fiskebåt – Havfiskeflåtens forbund (The Norwegian Boat Owners Association and High Sea Fleet Association) on the other.
Two types of revenue sharing scheme are used. Coastal fisheries using conventional fishing gear apply the net income to calculate the ‘lott’, whereas for pelagic fisheries the ‘lott’ is calculated from the gross revenue. Bergland and Pedersen (1999) discuss why the two fisheries apply different ‘lott’ calculations. Firstly, in the pelagic fleet, the use of larger and more mobile vessels results in comparatively more predictable catches, that is to say less ‘risk in catch volumes’. In addition, the price also helps to stabilise incomes in those fisheries. Secondly, pelagic fishing vessel companies are often listed on the stock exchange and may therefore be less reliant on risk-sharing with crew than what is the case for the mostly smaller vessels in coastal fisheries.
In the coastal fisheries, Norges Fiskarlag (The Norwegian Fishermen’s Association) details the distribution of the ‘lott’ based on the fishing gear used, vessel length (feet) and storage volume (m3), and the number of fishers on board. For example, for a vessel of 30ft and 6m3 of storage using line fishing and with two fishers on board, the ‘lott’ should be 60% of net revenue (Norges Fiskarlag, 2019, p.22). After the deduction of operating costs, the two fishers (one being the owner) should share 60% of the net revenue, while the vessel receives the remaining 40%. A tradition is to share the ‘lott’ equally among the fishers, but considerations like experience and responsibilities can affect distribution. For example, an apprentice will typically receive half of what the regular fishers receive. In terms of the operating costs, an exceptionally long list of 34 items that may be deducted from the gross sales value has been established.
There is also a scheme to guarantee a minimum salary. This is triggered if the salary is below NOK 2,550 per week during the fishing period – that is the period in which there is fishing activity. The daily payment is calculated as 0.024 times the annual salary, as long this is does not exceed around NOK 600,000. The scheme is little used. The most common users are fishers in the Nordland County of Northern Norway using small vessels and who fish using nets (Svorken, Hermansen & Isaksen, 2012). The scheme does not appear to be misused and works as intended (Svorken, Hermansen & Isaksen, 2012).
Figure 1.6 shows fishers’ average nominal annual income levels by groups of vessel type. The highest income groups are fishers on board large cod trawling vessels, and vessels using purse seine or trawls for pelagic fisheries. Conversely, the lowest income levels are the coastal fisheries based on conventional gear and seine, which are also smaller units compared to the trawl and purse seine vessels. Consequently, capitalisation and economies of scale seem to play an important role for the level of fisher pay. As the graph shows, all the groups have had positive income development. The rate of income growth exceeds inflation, meaning it also represents real income growth.
The average income level in fisheries has, as depicted in Figure 1.7, been high relative to the average income level nationally in Norway in recent years. This underscores the fact that current economic conditions are good for fishers and there is no indication that recruitment to fisheries is difficult (Sønvisen, Johnsen and Vik, 2017). This suggests that the findings in Nielsen et al. (2018) about fishers being well off remains true to this date.
Figure 1.6: Average nominal annual fisher income levels by groups of vessel types.
Figure 1.7: Fishers’ pay compared to average income level in Norway.
Figure 1.8: Average nominal annual fisher income levels by size in cod/whitefish fisheries.
The role of vessel size is even clearer in Figure 1.8, which shows average nominal annual fisher income levels by vessel size in cod/whitefish fisheries including coastal vessels using traditional gear and cod trawlers. These fleets normally target cod and other demersal whitefish species. Fishers’ average income increases with vessel size and, for the largest cod trawlers, exceeds NOK 2 million per fisher for 2017 and 2018, while for the smallest vessels it was just above NOK 460,000 per fisher in 2018.
In support of this work, several interviews were carried out among stakeholders in Norwegian fisheries in June 2021. These included interviews with representatives of the fishing vessel owners in pelagic and demersal fisheries, the union of naval officers, as well as representatives of fishers and vessel owners in coastal fisheries. The interviewees share the view that fisher salaries have developed favourably following the restructuring of the industry with fewer vessels. In this regard, a consequence of the share system is increasing salaries for the vessels that have accumulated quotas.
By way of a background, it should be noted that the fisheries sector has been subject to significant structural change following the transition to a tradeable quota system in the early 2000s. This system has concentrated the ownership of fishing rights with the strongest concentration taking place in the ocean fleet (pelagic and cod fisheries) while the coastal cod fishing fleet has retained the most dispersed ownership.
An area of contention between vessel/quota owners and fishers is the extent to which the returns on additional quotas should be reflected in crew shares. On the one hand, the vessel/quota owners believe that the returns on their investments in additional quotas should not be shared with the crew, which acknowledges that they are providing the capital and assuming the risk for the restructuring of the fleet.
This point of contention exists in both the coastal and ocean fisheries sector and has been ongoing for several years. Due to the disagreement, the pay agreement from 2014 was not replaced until January 2021. As for the fisher representatives, they reported high levels of stress and fatigue during this period as they fought hard to maintain the status quo. Nevertheless, the overall feeling is that fishers have come out as ‘winners’ in terms of pay (and as a direct consequence of the lay share system) while quota and vessel owners are not content with the present sharing of profits.
Recently, young people training to become fishers through the public education system have become vocal about the difficulties they face in entering the fisheries due to the current individual quota system. In March 2021, a new branch exclusively for young people (Ungdommens fiskaralag) was formed within the fishers’ union. Although it is not obvious that this group yet has any real power, the existence of a youth branch serves as an indicator of the complexity of managing the diverging interests held by the different groups in the fisheries system.
In terms of the resource rent accruing between 2003 and 2018, thus covering the introduction of the tradeable quota system, the overall resource rent from both pelagic and the demersal fisheries has increased considerably. In the pelagic fisheries, total resource rent increased from NOK 371 million in 2003 to NOK 1,426 million in 2018. Comparable figures for the demersal fisheries are NOK 249 million NOK and NOK 2,005 million.
Meanwhile, in the pelagic fisheries the distribution of the resource rent shows that the public sector, capital and labour have all fared well, with labour taking slightly more than the other two. This contrasts with the demersal sector where the public and labour take the largest share, while the net remuneration of capital is low. Consequently, these calculations underscore the feeling among the interviewees that quota/vessel owners feel that they have not been sufficiently compensated for their investments.
Finally, the views of fishers that have exited the fisheries due to the restructuring have not been heard in this process. We are unaware of their situation. However, the fishers’ unions expressed that the consolidation has gone far enough. According to them, further accumulation of fishing quotas on individual vessels is not called for, since they feel that vessel owners already earn sufficient profits. This stance signals that it is now more important to protect fishers’ employment than to raise their salaries.
Discussion and conclusion
This work has explored the fisher remuneration systems used in five of the Nordic countries: Denmark, the Faroe Islands, Greenland, Iceland, and Norway. The share, or lay, pay system is widely used. Even with the introduction of the far-reaching reform of fisheries management, the share system is remarkably stable and may be considered an ‘institutionalised’ part of the fisheries economy. In addition, over the past decades, technological advances in fisheries operations have substantially reduced the risk for returning to ports empty handed and have made fishing a less physically demanding undertaking. This can be observed by the marginal use of minimum salary provisions in fisheries.
Fishers have a clear interest in keeping the share system as changes in fisheries management settings and investments in equipment that improves efficiency have increased salary levels. In all the surveyed countries, average fisheries income is above that of similar occupations on land. Granted, we would expect a premium paid to fishers due to the job characteristics such as being away from home over several days, the physical demands of the job, and the risk involved. However, the figures from across the Nordic countries suggest that fishers are compensated far beyond their job characteristics and well above alternative job possibilities. Due to the share pay system, fishers, even when not quota owners, may also capture part of the resource rent.
There are, however, some interesting differences across the Nordic countries in the application of the share systems. Denmark has the most ‘liberal’ system of all the countries. All decisions are pretty much left to an agreement between the skipper and the crew. They negotiate the costs to be deducted from gross earnings and individual shares on a one-by-one and trip-by-trip basis. In Norway, the agreements between the fisher unions and the vessel owners are applied. This agreement runs into 60 or more pages of detailed descriptions of which costs can be deducted. These hinge greatly on the type of fishing operation (gear and fishery) and leave little room for individualising the outcome. It is also worth highlighting the particularities of the Greenlandic and Icelandic situation where many large fishing vessels are owned and operated by land-based processors. These operations are forward integrated and a ‘true market price’ for the landed fish is difficult to establish when compared to fish landed via auction. This has given rise to conflicts between fish processors and fisher unions due to the internal pricing used as a basis for the pay.
The management reforms introduced over the past several decades in the Nordic countries have all sought to make the fisheries sector more sustainable through the introduction of market-based economic instruments (MBEI). Prior to the switch to using MBEIs, there was more of a focus on biological sustainability and less so on the profitability of the fishing fleets. Meanwhile, the introduction of MBEIs created resource rents that the fishers, due to the share system, might capture a share of. This has implications for policy makers seeking to increase the resource rent for the benefit of the public coffers. Taxing resource rents is not only a matter for quota owners, but certainly also for fishers.
The different participants in fisheries operations – that is to say the quota owners, boat owners and crew – have different incentive structures. The incentive structure of quota owners is defined by the fact that a quota is a financial asset which can be traded instantly. In some cases, they might not even be involved in fisheries operations but just be quota owners. Their interest and incentive remains in the quota market and, in light of increasing demand for fish with fixed or semi-fixed supplies, they are likely to see increasing rental income from leasing the quota and increasing prices for the quota itself.
Vessel owners and quota owner face different challenges. They need to rent out their fishing capacity or rent quotas to carry out fishing themselves. Their financial assets – the vessels – are usually in modern fisheries investments spanning some 30 years. Granted, the workings of the tax system with respect to such capital investments and rules for depreciation will influence decisions. However, as suggested by Sutinen (1979), “fishing entrepreneurs are unambiguously better off with the share system”. Vessel owners may still be interested in investing in better and more efficient equipment as additional profits from doing so will make them better off as well. They will also have an interest in ensuring a sustainable fishery because of their longer timeframe of operation. Furthermore, vessel owners will be interested in reducing gross earnings by as much of the variable costs of fishing operations as possible.
Fisher crew meanwhile will have a relatively short time horizon as most fishers are hired on a short-term/fishing trip basis and will therefore have short-term incentives which, translated into the fisheries economy, will emphasise obtaining the largest and best-quality catch as quickly as possible, with little by way of cost deductions from gross earnings. However, they do have incentives in signalling their suitability for the trade, to be top of the pile for future trips.
The interviews carried out as part of this work confirm that fishers are, in most cases, well paid. In general, we note that interviewees are content with the share system as the basis for the crew remuneration and that the fishers have been able to profit from the introduction of management reforms based on individualised quota systems. Improvements in fisher pay arrangements are still possible, however. A recurrent theme is the social disadvantage that fishers face in the uncertainty surrounding their future income stream, which may give rise to difficulties in getting bank loans.
The resource rent calculations support the observation that the introduction of ITQ-like systems have contributed substantially to societal welfare across the Nordic countries. However, the picture is less clear across the countries surveyed for this study as to who benefits from augmented socio-economic rent. In the case of Denmark, the capital owners (quotas and vessels) have benefitted immensely from the management reforms, while labour has fared less well. In Norway a similar situation is true for the pelagic sector, although here the share of the rent is evenly distributed among the capital, labour and the public. By contrast, in the Norwegian demersal sector, labour and the public sector are the major “winners” to the detriment of the capital owners. In the case of Faroese factory vessels, the socio-economic rent is evenly distributed, but among smaller vessels, labour and the public sector are the major beneficiaries compared to the capital owners.
A special case presents itself in fisheries characterised by forward integration between harvesting and processing. In these cases, Greenland and Iceland are the most prominent, with the fixing of the price for the landed fish at times causing problems and conflicts between hired crew and the owners of fishing vessels/rights.
Nevertheless, the introduction of ITQ-like systems across the Nordic countries has contributed to the sector’s viability and to overall welfare and wage levels, which have generally been increasing for those that have stayed in the fisheries. These observations have been confirmed by the interviews.
More work is needed on the different incentive structures of fisheries participants and how this influences their support for the sustainability of fisheries. Such political economy work would provide additional insights and be a useful input for fisheries policy makers when looking to reform fisheries management. An interesting aspect of the share system is that it provides an example of the triple bottom line in fisheries as purported by Asche et al. (2018). It means that the economic gains of better management schemes not only befall the environment and capital owners but are spread more widely in the community through higher fisher pay. This is also in line with the view that, when seen from a societal perspective, labour costs in fisheries can be treated as revenue rather than a cost (e.g., Holland, 2011). As observed across the Nordic countries surveyed for this work, the share pay system is a central element in achieving these results.
While fisheries management reforms have underpinned remarkable efficiency gains in the Nordic fisheries sectors in recent decades, most Nordic countries have retained a small-scale fisheries sector.
Economic efficiency objectives have been balanced politically against the desire to continue to have small-scale fisheries to cater for fishing communities with no alternatives to fishing. This component of the fisheries is often characterised by smaller vessels owned and operated by the skipper alone. Such fisheries may play an important part in the social fabric of remote fishing communities as, for example, in the case of small-scale fisheries in Greenland. In this regard, Nielsen et al. (2018) show that while the number of bigger fishing vessels has fallen substantially in recent decades, the number of small vessels has not fallen to the same extent.
The present study’s focus has been on the larger commercially important fisheries of the Nordic countries where fisheries management reforms have had a major impact over the past decades. More work is needed on small-scale fisheries, acknowledging that their social importance may far outreach their economic performance.
References
Abbott et al. 2010, “Employment and Remuneration Effects of IFQs in the Bering Sea/Aleutian Islands Crab Fisheries” Marine Resource Economics, Vol. 25, 2010
Asche, F., Garlock, T. M., Anderson, J. L., Bush, S. R., Smith, M. D., Anderson, C. M., ... & Oglend, A. (2018). Three pillars of sustainability in fisheries. Proceedings of the National Academy of Sciences, 115(44), 11221-11225.
Bergland, H., & Pedersen, P. A. (1999). Resultatavlønning – en drøfting av ulike lønnssystem med eksempler fra fiske. Magma, 2(2), 98-109.
Fiskimannafelagið: Manningarsáttmálar, Januar 2018.
Flaaten, O. and K Heen (2017), Profit and Resource Rent in Fisheries, Marine Resource Economics 32(3): 311-328.
Guillen et al. 2015 “Effects of the Share Remuneration System on Fisheries Management Targets and Rent Distribution”, Marine Resource Economics (2015) Volume 30, Number 2
Guillen et al. 2017 “Remuneration systems used in the fishing sector and their consequences on crew wages and labor rent creation”, Maritime Studies (2017) 16:3
Gunnlaugsson, S., Saevaldsson, H., Kristofersson, D. & Agnarsson, S. (2020). Resource Rent and its Distribution in Iceland’s Fisheries. Marine Resource Economics, 35(2), 113-135
Gunnlaugsson, S., Agnarsson, S. (2019). Late arrival: The development of resource rent in Icelandic fisheries. Fisheries Research, 214, 126-135
Hammerlund, C., M. Nielsen, S. Waldo, R. Nielsen, A. Hoff and V. Bartolini (2018), Fisheries management under nutrient influence: Cod fishery in the Western Baltic Sea, Fisheries Research
Holland, D. S. 2011. “Optimal Intra-Annual Exploitation of the Maine Lobster Fishery”. Land Economics 87(4):699–11.
Høst J. and Christiansen J. 2018, “Nordic fisheries in transition – future challenges to management and recruitment”, Nordic Council of Ministers, TemaNord 2018: 545
Iversen, A., Isaksen, J. R., Hermansen, Ø., Henriksen, E., Nyrud, T., & Dreyer, B. (2018). Strukturering i fiskeflåten-Drivkrefter og konsekvenser. Nofima rapportserie.
Knutsson, O., Kristofersson, D. & Gestsson, H. (2016). The effects of fisheries management on the Icelandic demersal fish value chain. Marine Policy, 63, 172-179
T. Matthiasson, 2020, “Splitting the catch, remuneration of Icelandic fishermen in a Sea of change” Marine Policy 117 (2020)
McConnell and Price, “The lay system in commercial fisheries: Origin and implications”; Journal of Environmental Economics and Management 51 (2006)
Nielsen, M., O. Flaaten and S. Waldo (2012), Management of and Economic Returns from Selected Fisheries in the Nordic Countries, Marine Resource Economics, 27 (1), 64-88, March 2012.
Nielsen, M., P. Andersen, L. Ravensbeck, F. Laugesen, D. Kristófersson and H. Ellefsen (2017), Fisheries Management and the Value Chain: The Northeast Atlantic Pelagic Fisheries Case, Fisheries Research 186:36-47.
Nielsen, M., A. Hoff, R. Nielsen, P. Andersen, S. Waldo, C. Hammarlund, D.M. Kristófersson, H. Sævaldsson, J. Virtanen, J. Setälä, K. Roll, F. Asche, H. Rógvi and H. Ellefsen (2018), Structural Adjustment and Regulation of Nordic Fisheries until 2025, report from the Nordic Council of Ministers, TemaNord 2018:547. Nielsen M. et al. 2018, “The myth of the poor fisher: Evidence from the Nordic countries”, Marine Policy 92 (2018)
Nielsen, M., F. Asche, R. Nielsen, A. Hoff, E. Henriksen, O. Bergesen, J. Viðarsson, S. Waldo and J. Blomquist (2018). The Myth of the Poor Fisher: Evidence from the Nordic countries, Marine Policy 93:186–194.
Nordic Council of Ministers, “Employment and salary of Nordic coastal fishermen”, TemaNord 2017:558
Roknskapargreiningin 2017.
Sutinen 1979, “Fishermen’s Remuneration Systems and Implications for Fisheries Development”, Scottish Journal of Political Economy, Vol. 26 No. 2, June 1979
Svorken, M., Hermansen, Ø., & Isaksen, J. R. (2012). Garantiordningen for fiskere. Nofima rapportserie.
Sønvisen, S. A., Johnsen, J. P., & Vik, J. (2017). Mellom nettverk og marked II: Om fiskerirekruttering og sysselsettingssystemer i fiske. Rapport Norsk senter for bygdeforskning.
Waldo S., F. Jensen, M. Nielsen, H. Ellefsen, J. Hallgrimsson, C. Hammarlund, Ø. Hermansen and J. Isaksen (2016), Regulating multiple externalities: The case of Nordic fisheries, Marine Resource Economics. 31(2):233-257.
Appendix 1. A note on socio-economic returns in fisheries
The ‘resource rent’ in fisheries measures the economic return a society obtains from owning a fish stock. Furthermore, fisheries may generate a ‘producer surplus’ which denotes the return some fishers obtain because they have greater skills and possibly also lower opportunity costs than others (Copes 1972). In the following, the ‘socio-economic return’ is identified as the sum of resource rent and producer surplus.
The socio-economic return is defined as the net surplus that, at a given time, remains for the remuneration of capital and labour above the rate that is achieved in other businesses. It is calculated as shown in Table 1. The resource rent measures the extra economic contribution from the existence of the fisheries over and above the socio-economic return. The opportunity cost of labour is the salary a fisher could have achieved in a job in another sector, and which demands the same level of skills. The opportunity cost of capital is the rate of return that could have been achieved by investing the amount currently invested in the fishery – such as in the vessel and gear – in alternative uses. The value of fishing rights is not part of the opportunity cost of capital because it is considered a transfer from one group in society to another, from the public sector to fishers. The value of fishing rights represents a cost for fishers who must raise capital to buy these, but since the sellers receive the same amount, it doesn’t affect the overall socio-economic return.
| Socio-economic return | Profit |
| Turnover | Turnover |
| – Costs (excluding labour and capital) | – Costs (excluding labour and capital) |
| – Cost of labour in alternative use | – Cost of labour in actual use |
| – Cost of capital in alternative use | – Cost of capital in actual use |
| = Socio-economic return | = Profit |
Table 1: Calculation of the socio-economic return and profit.
The socio-economic return is a societal measure as opposed to profit that measures a company’s (i.e., private) economic returns. With opportunity costs of capital identified for physical assets – without the value of fishing rights – the socio-economic return includes future earnings capitalised in the fishing rights. For the permanent fishing rights that have been bought, the amount paid will have been removed from the fishing sector by the former fisher(s) selling the rights. The socio-economic return includes this amount, despite having been removed from the fishing sector by former fishers. It follows that profit is often substantially smaller than the socio-economic return.
The socio-economic return is identified here on the assumption that the public net expenses to the fishery sector are at the same level as in other sectors. If there are extraordinary public expenses to the fishing sector, such as in the form of subsidies and fisheries management costs that are not covered by specific fishing taxes, the socio-economic return is overestimated.
The socio-economic return is allocated between the capital owners of both fishing vessels and fishing rights, the hired crew, and the public sector. Although the capital owners and crew receive the return, when paying income tax, corporation tax and, in some countries, landing tax, the public sector receives a part of the socio-economic return. On vessels where the owner is an active crew member, they are assumed to receive the same salary as the hired crew.
The calculation of the allocation of the socio-economic return is shown in Table 2 for hired crew, capital owners, and the public sector.
| Remuneration of: | Calculation |
| Labour 'Hired labour' | Total costs of actual labour in fisheries |
| – Income tax of actual labour | |
| – Opportunity costs of labour in alternative use | |
| + Income tax of labour in alternative use | |
| = Share of labour of socio-economic return | |
| Capital ‘Vessel owner or right owner’ | Profit before financial costs and tax |
| – Corporation tax | |
| – Financial income of physical assets in alternative use | |
| + Corporation tax of financial income of physical assets in alternative use | |
| = Share of capital of socio-economic return | |
| Public sector | Income tax revenue |
| + Corporation tax revenue | |
| + Landing tax revenue | |
| = Share of the public sector of socio-economic return |
Table 2: Calculation of the allocation of the socio-economic return in fisheries.
The share of the socio-economic return received by the hired crew appears in the form of extra income above what fishers could have earned if they had worked in another sector, adjusted for higher risks on board fishing vessels, and for the inconvenience of being away from home on a fishing trip. The share received by the hired crew consists of labour costs minus income tax minus opportunity costs of labour plus income tax in alternative employment.
The share received by capital owners consists of profit before interest and taxes (EBIT) minus corporation tax and minus financial earnings of capital in alternative use, plus corporation tax of financial earnings in alternative use. The share that capital owners receive is the extra earnings on top of what they could have received had they invested in, for example, stocks or bonds with a similar risk profile. Their share includes both the remuneration of capital of active fishers and the remuneration of capital capitalised in fishing rights and removed from fishing when former fishers sold their rights and left the sector. The share of the socio-economic return that capital owners receive cannot be separated between current and former fishers. It is clear, however, that a substantial amount has been removed from many fisheries with the sale of capitalised fishing rights, reflected by the socio-economic return often being substantially higher than the profits of active fishers. In this regard, it is worth noting that the profits of active fishers are often relatively low since they must ensure their income can repay their earlier purchase of fishing rights.
The public sector’s share consists of revenue from income tax, corporation tax and, in some countries, landing tax. The share the public sector receives consists of tax revenue and is identified on the assumption that the public’s expenditure to the fishery sector is at a similar level as for other sectors.
2. Denmark
Max Nielsen and Erling Larsen
Introduction
The Danish fisheries sector underwent substantial restructuring following the introduction of Individual Transferable Quotas (ITQ) and Vessel Quota Share regulation between 2004 and 2007, and as a result of continued technological development. The number of commercially active vessels fell from 1,528 to 690, corresponding to a 55% reduction between 2000 and 2010. The Danish fleet continued to decrease between 2010 and 2018, but only from 690 to 510 active vessels. During the same period, catches and the landing value of fish for human consumption increased, while both catches and the landing value for fish for reduction fluctuated. The total landing value increased by 20% between 2010 and 2018.
Cod stocks in the Baltic Sea have reached historically low levels, with some stocks outside safe biological limits. However, several important fish stocks are in a good biological condition, resulting in a mixed biological picture. Danish fisheries, however, have overcome or are in the process of overcoming earlier crises of overcapacity, economic deficits, and the depletion of local fishing communities. The result is a smaller fleet, reduced employment, and hardly any fishing activity in many small harbours that at one time depended on fisheries. On the plus side, however, the result is a stable and efficient fishing sector.
The purpose of this study is to provide knowledge on the wages and the wage determination system for Danish commercial fishers.
Although a long-term perspective is taken into account, short-term deviations and future trends affect developments. For example, the COVID-19 crisis had a negative effect on earnings and wages in Danish fisheries in 2020. Moreover, with 30% of Danish landings caught in the British fishing zone, Brexit may affect Danish fisheries, although it currently remains uncertain by how much. Other important drivers include the continued structural adjustment of the fleet, as well as the continued focus on the implementation of the landing obligation, on providing stable conditions for coastal fisheries, on the historically small cod stocks in the Baltic Sea, and on the adjustment of Danish fisheries to climate change. Whilst these developments are important, they are not analysed here.
Fleet structure
The registered Danish vessels can be divided into active vessels, less active vessels, and inactive vessels. The active vessels have a gross turnover above a minimum limit of EUR 36,000 and the less active vessels below this minimum limit. The less active vessels are mainly small vessels of less than 12 metres in length. The inactive vessels have no recorded catch. Table 2.1 shows that there were 2,123 registered vessels in the Danish fishing fleet in 2018, of which 756 were inactive and 855 less active. Although this represents a significant number of vessels, Nielsen et al. (2019) considers the full-time employment of the less active vessels to be extremely modest.
| 2010 | 2011 | 2012 | 2013 | 2014 | 2015 | 2016 | 2017 | 2018 | ||
| Active vessels | <12 m | 213 | 223 | 206 | 196 | 177 | 170 | 194 | 188 | 186 |
| 12-15 m | 151 | 125 | 114 | 105 | 100 | 94 | 87 | 75 | 71 | |
| 15-18 m | 97 | 95 | 91 | 87 | 90 | 88 | 86 | 85 | 83 | |
| 18-24 m | 75 | 73 | 70 | 68 | 61 | 59 | 53 | 48 | 46 | |
| 24-40 m | 46 | 46 | 41 | 41 | 39 | 35 | 37 | 39 | 39 | |
| >40 m | 26 | 26 | 27 | 28 | 28 | 28 | 29 | 27 | 27 | |
| Special fisheries1 | 82 | 80 | 77 | 75 | 71 | 67 | 64 | 64 | 60 | |
| Total | 690 | 668 | 626 | 600 | 566 | 541 | 550 | 526 | 512 | |
| Less active vessels | 1,154 | 1,113 | 1,108 | 1,041 | 1,013 | 960 | 932 | 892 | 855 | |
| Inactive vessels | 965 | 992 | 995 | 977 | 849 | 848 | 776 | 779 | 756 | |
| Total no. of vessels | 2,809 | 2,773 | 2,729 | 2,618 | 2,428 | 2,349 | 2,258 | 2,197 | 2,123 | |
Note: 1. Special fisheries includes fisheries for horse shrimp and mussels, according to the Account Statistics for Fishery and Aquaculture. | ||||||||||
Table 2.1: Number of registered vessels in the Danish fishing fleet as at 31 December
According to Table 2.1, overall the Danish fishing fleet contracted by 686 vessels, or 24%, between 2010 and 2018. The number of active vessels fell by 178 vessels over the same period, corresponding to a decline of 26%. The number of less active vessels fell by 299, while the number of inactive vessels was down by 209. Measured as tonnage, the registered fleet contracted by 10%, while engine power decreased by 13% during the period (Nielsen et al., 2019).
Employment
The number of people employed in Danish fisheries was 2,340 in 2018 compared with 2,548 in 2010. (Statistics Denmark, Register-based Labour Force Statistics). That corresponds to 0.1% of total Danish employment in 2018. The crew on board the vessels, including both hired persons and working owners, is 2,714 people in 2018. These are people who reported to work on vessels in the Vessel Register; see Table 2.2.
| Employment status | Active vessels | Less active vessels | Inactive vessels | Total registered vessels |
| Full-time commercial fisher | 458 | 456 | 418 | 1,332 |
| Part-time commercial fisher | 4 | 344 | 207 | 555 |
| Companies | 575 | 85 | 125 | 785 |
| Other employemnt status | 6 | 36 | 42 | |
| Total | 1,037 | 891 | 786 | 2,714 |
Table 2.2: Number of people employed on registered fishing vessels in Denmark, categorised according to employment status, ultimo 2018
The total of 2,714 commercial fishers include people associated with inactive and less active vessels, with limited or no working activity in fisheries. Consequently, people that may have a substantial and even their primary income from other occupations are included, implying that the number overestimates the real employment figures. In 2018, employment on active vessels totalled 1,037.
In 2018, 982 people were registered as being in full-time employment on active vessels, which is calculated as at least 220 working days per year (Account Statistics for Fishery and Aquaculture 2018). The number of 982 underestimates real employment in fisheries, since commercial fishers working part time on less active vessels are not included. Of these, 151 are working on large vessels (> 40 metres long), 381 on medium sized vessels (18-40 metres long), 382 on small vessels (< 18 metres long), and 68 in specialised fisheries (targeting mussels and horse shrimp).
Nielsen et al. (2018) collected employment and income statistics for 2012 for anyone with an income from a Danish fishing vessel with a turnover of more than EUR 6,667 per year. It was found that full-time employed commercial fishers, in this case defined as fishers with more than 60% of their income from fishing, earned 14% of their income in other occupations.
The development in employment since 2010 is shown in Figure 2.1 below. The number of employed and those in full-time employment fell between 2010 and 2018 by 8% and 15% respectively. In 2000, 3,410 people were in full-time employment. The structural adjustment in Danish fisheries with the introduction of individual transferable quotas and vessel quota shares between 2004 and 2007 spurred a substantial 66% reduction in employment between 2000 and 2010, with a fall from 3,410 to 1,158 people. While employment continued to fall between 2010 and 2018, the reductions were small and relatively stable.
Figure 2.1: Number of employed and full-time employed commercial fishers in Denmark, 2010 to 2018.
Landings and landing values
Danish landings consist of fish for human consumption and fish for reduction to fishmeal and oil (for use in animal feed). The most important species for human consumption are the pelagic species of mackerel and herring, as well as the demersal species cod, plaice and Norway lobster. The most important species for reduction are sandeel, sprat and Norway pout. The small Danish vessels are mainly fishing with nets for demersal species, while the larger vessels use trawl and seines. The largest vessels target pelagic fish and fish for reduction. Some vessels specialise in fishery for mussels and horse shrimp. Landings and landing values for 2018 are shown in Table 2.3.
Landings of Danish vessels totalled 789,000 tonnes in 2018, corresponding to a 5% reduction compared to 2010. Landings of fish for consumption and reduction at Danish ports totalled 225,000 tonnes and 465,000 tonnes respectively, while landings at foreign ports totalled 99,000 tonnes. The trend shows that landings of fish for consumption have increased every year between 2010 and 2018, leading to a 36% increase overall. Landings of fish for reduction were at their lowest level in 2012 but have since recovered, while landings at foreign ports fluctuated over the period.
The total landing value of EUR 470 million consists of EUR 281 million of fish for consumption, EUR 107 million of fish for reduction and EUR 83 million landed at foreign ports. The landing value of fish for human consumption generally increased, with a peak in 2016. The landing value of fish for reduction follow the lows in landing quantity in 2012. This development reflects a relative stable average price over the period for fish for consumption, although there may be substantial fluctuations in prices of individual species. Prices of fish for reduction were also relative stable, with a low in 2016.
| Landing quantity (1,000 tonnes) | 2010 | 2011 | 2012 | 2013 | 2014 | 2015 | 2016 | 2017 | 2018 | Percentage change (2010-2018) |
| Fish for consumption | 166 | 171 | 191 | 196 | 194 | 207 | 226 | 216 | 225 | 36% |
| Fish for reduction | 541 | 446 | 205 | 353 | 412 | 543 | 334 | 570 | 465 | -14% |
| In foreign ports | 121 | 100 | 107 | 121 | 139 | 120 | 111 | 118 | 99 | -19% |
| Total | 828 | 717 | 503 | 670 | 745 | 870 | 671 | 904 | 789 | -5% |
Landing value (EUR million) | ||||||||||
| Fish for consumption | 207 | 245 | 237 | 210 | 203 | 231 | 292 | 272 | 281 | 35% |
| Fish for reduction | 118 | 101 | 57 | 94 | 82 | 125 | 91 | 91 | 107 | -10% |
| In foreign ports | 75 | 80 | 98 | 99 | 103 | 97 | 106 | 93 | 83 | 11% |
| Total | 400 | 427 | 393 | 404 | 389 | 453 | 489 | 455 | 470 | +18% |
Table 2.3: Landings and landing values of active Danish vessels in Danish and foreign ports, 2018
Wage determination system
The minimum salary agreement
Minimum wages are determined through collective negotiations between employers and employees on board fishing vessels. Together, the Danish Fishermen Producer Organisation and the Danish Pelagic Producer Organisation cover more than 95% of total catches and represent the vessel owners, while the organisation 3F United Federation of Workers in Denmark represents the hired fishers.
These two fisheries parties negotiate a collective agreement on minimum wages and pension. The current agreement of 9 March 2017 runs for three years from 2017 to 2020 (Danish Fishermen Producer Organisation and 3F United Federation of Workers in Denmark 2014; Danish Fishermen Producer Organisation 2017). The agreement establishes that crew members work with all kinds of jobs on board the fishing vessel, without official titles and salary levels. The agreement guarantees fishers a minimum salary per fishing day of EUR 171 and a pension of EUR 34 per day in 2020. There are no differences between fishery types nor between types of work on board. A price index regulates the minimum salary.
While the agreement is negotiated between the two parties it is important to note that Danish fisheries are characterised by the fact that many vessels are owner-operated, often with very few or no hired crew. Although updated numbers are not available, in 2012, 20% of the active vessels were owner operated (Nielsen et al., 2018). In these cases, the collective agreement is only of minor importance.
The negotiations follow the rules of the Danish Labour Market Model that was established in 1899. The partners decide individually their demands for the negotiations and the normal negotiating period is between one and three months. If the partners cannot agree, then first a mediator steps into the process. If this fails, strikes and lockouts can be effective. After some time, the Danish parliament can intervene.
The crew share system
The crew share system allocates vessel earnings to each crew member. It works by fixing shares of the landing value for each crew member on each fishing trip, excluding some specified costs deducted beforehand. Crew shares are decided by way of individual negotiations between the vessel owner and the individual hired member of crew, and agreed in the hire contract (see the appendix for an example of a hire contract). The position on board and the experience of the hired fishers determine the crew shares. Typically, the shares lead to a higher salary than the minimum salary. If not, the vessel owner must pay the minimum salary to the hired crew.
Crew shares are calculated as the gross value of the catch minus deducted costs, including costs for unloading, bridge toll paid to harbours, vessel servicing, fuel, ice, box rent, provisions, pensions, union fees, fees for the producer organisations, and renting of fishing rights.
With both catches and costs differing according to vessel size, area fished, type of gear etc., the shares allocated to each crew member differ between vessels.
For example, a vessel of 22 metres may have a skipper that owns the vessel, two crew members and an apprentice. The shares could be 60% for the vessel, 20% for the skipper, 8% for each senior crew member and 4% for the apprentice. For a six-day fishing trip, the catch value could be EUR 50,000 and cost paid beforehand EUR 15,000, leaving EUR 35,000 for sharing. Accordingly, EUR 21,000 goes to the vessel, EUR 7,000 to the skipper, EUR 2,800 to each senior crew member and EUR 1,400 to the apprentice. Since all crew shares are higher than the minimum salary for six days, the crew shares are paid.
Other types of vessels may have different crew sizes, different costs paid beforehand, and different allocations of crew shares. For smaller vessels with only one crew member, crew shares are higher and consequently the vessel share is lower.
Development in the pay of commercial fishers
The income statistics for Danish commercial fishers are poor and largely non-existent, since the income of fishers at Statistics Denmark is registered together with agriculture and forestry, and only forms a minor part of this. Therefore, publicly available statistics do not provide useful information on fisher income.
For the period 2002 to 2012, however, Nielsen et al. (2017; 2018) made a study where data on the vessel, catch, landing and sale register from the Directorate of Fisheries were merged with data from the register of taxable income from Statistics Denmark. The personal income was identified for those with income from fishing vessels with an annual landing value of at least EUR 6,667. Of those, full-time commercial fishers were identified as those having at least 60% of their income from a fishing vessel.
The average income of a full-time fisher in 2012 was EUR 57,614, of which 14% was non-fishery income. For all persons with any income from fishery, the average income was EUR 56,500, with 31% being non-fishery income. The average income of coastal fishers, defined as working on board vessels up to 17 metres in length, was EUR 45,800.
In 2012, the average income measured for all Danish citizens including the employed, unemployed and retired was EUR 34,000. This rises to EUR 48,700 in agriculture, to EUR 54,100 for craftspeople, to EUR 48,500 for commerce and office workers, and to EUR 58,200 for process/machine operators (Nielsen et al., 2018). To this end, fishers are relatively well paid.
More recent income statistics for fishers do not exist. The only available data are on salary costs of active vessels, taken from the Account Statistics for Fishery and Aquaculture (Statistics Denmark). Salary costs include salary, as well as pension, insurance and crew costs, such as food on board. In 2012, the average income of a full-time fisher of EUR 57,614 (including 14% non-fishery income) must be compared against the average salary cost for a full-time fisher of EUR 97,800. While the numbers are not directly comparable, salary and salary costs are expected to follow the same development over time.
The average salary cost per person in full-time employment in 2018 is EUR 125,000. This number, however, hides the substantial differences between vessel sizes and type of fishery, as shown in Table 2.4.
| Vessel group | Net | Dinghies | Seines | Combi | Trawl | Other |
| <12 m | 74,810 | 62,065 | 82,780 | 73,107 | ||
| 12-15 m | 104,677 | 92,056 | 82,272 | 95,051 | ||
| 15-18 m | 103,185 | 103,252 | 100,500 | |||
| 18-24 m | 107,278 | 117,000 | 126,698 | |||
| 24-40 m | 121,130 | 124,466 | ||||
| >40 m | 248,406 | 152,513 | ||||
| Horse shrimp | 130,629 | |||||
| Mussels | 112,465 | |||||
Note: 1. Full-time employment is calculated as total working days on active vessels, set at 220 working days per year. | ||||||
Table 2.4: Salary costs per person in full-time employment on active vessels, allocated per vessel and gear, 2018, EUR[1]Full-time employment is calculated as total working days on active vessels, set at 220 working days per year.
Footnotes
- ^ Full-time employment is calculated as total working days on active vessels, set at 220 working days per year.
The average salary cost per person in full-time employment ranges from EUR 62,065 for dinghies to EUR 248,406 for vessels above 40 metres in length using a combination of trawl and seines. The numbers reveal that salary costs per person in full-time employment increase with vessel size. Although it is expected that the same can be said for salary, crew costs are also higher for the large vessels as the fishing trips last longer and so crew costs are higher.
The development of salary and salary costs is shown in Figure 2.2 together with the development in full-time employment between 2002 and 2018.

Figure 2.2: Number of full-time commercial fishers and real average income (EUR), 2002 to 2018
Data on both the number of full-time commercial fishers and salary/salary costs contain a data break in 2012, although there is an overlap of data between 2010 and 2012. Until 2012, full-time commercial fishers included fishers with more than 60% of their income from a fishing vessel, while full-time employment from 2010 onwards is calculated based on the total number of working days on board active vessels, divided by 220 working days per year. Until 2012, salary is the actual taxable income of the full-time fishers including non-fishery income, while salary costs from 2010 to 2018 include salary, pension, insurance, and crew costs, such as food on board.
Full-time employment fell between 2002 and 2018 from 2,426 to 983. However, the reduction is 60% between 2002 and 2018, but only 6% between 2012 and 2018. The structural adjustment following the introduction of individual transferable quotas and vessel quota shares between 2004 and 2007 seems to have been accompanied by only minor adjustments due to technological developments and changes in fish stock levels since 2010. With near stability in employment between 2010 and 2018, the average salary costs per full-time employee were EUR 125,000 in 2018, a 30% rise from 2012.
Income taxation of commercial fishers
The income of fishers is taxed as for everybody else in Denmark. The gross tax of labour market contributions, the basic tax and, for high-income earners, the top tax are paid, calculated as a percentage of the gross income. Net income is calculated after several deductions, including the basic deduction, the deduction for being employed, and person-specific deductions such as for net capital expenses and travel to work. Out of net income, municipal tax, church tax and a health contribution are paid. The only difference between fishers and other taxpayers is that fishers have a fisher deduction of EUR 25 per day with a maximum of EUR 5,573 per year in 2018.
The income tax burden of a typical full-time fisher can be identified as the amount of all income taxes paid as a percentage of gross income. The average income of a full-time fisher was EUR 57,614 in 2012, including income from other economic activities (Nielsen et al., 2018). With the same development in income as for the salary costs of fishing vessels, in 2018 that corresponded to EUR 75,186. For a fisher with that income, living in the largest fishing municipality in Denmark, Thisted, a total of EUR 26,303 is paid in income taxes. That corresponds to an income tax burden of 35% of gross income. It must be noted that since salary levels differ substantially across different types of fishery and between crew member roles, the tax burden increases with income due to the progression of income taxes. Municipal taxes also differ and result in varying tax burdens.
Interviews with relevant persons participating in the negotiations of the Agreement on Working Conditions (AWC) for the Danish Fisheries Sector, 2020 to 2023
Interviews with several centrally placed persons from the fisheries sector were conducted in August 2021, supplemented with informal talks with skippers and fishers. Media articles have been used as background information and a few historical sources have been consulted, including “Fortællinger om fisk og fiskere” Danmarks Fiskeriforening 125 år, red. Margrethe Lyngs Mortensen, Denmark, 2012 with special emphasis on the article pp 146–151, which provides a historical background for the development of the AWC Agreement over the last 50 years. More recently, the individual quota systems have had a huge impact on both employment and payment in the fishing sector.
The starting point for the interviews has been the latest AWC between the three biggest organisations in the sector – the owners and the commercial fishers, (Danmarks Fiskeriforening Producent Organisation (DFPO), Danmarks Pelagiske Producentorganisation (DPPO) and 3F Fagligt Fælles Forbund, (Transportgruppen), 2020 to 2023. The Agreement is normally three years in length.
All those interviewed pointed out that the AWC in the fisheries sector is different from all other agreements in Denmark, except the one between the Danish harbours and the dockworkers. Employment exists only when the person works with the agreed job. For a dockworker this is normally one day’s employment that has to be renewed the next day, and for fishers this is only for the duration of the fishing trip. The moment the fisher steps ashore, their employment is terminated – if not otherwise agreed. This system is called ‘Partsfisker’ in Danish and can be translated as something like ‘partial fisher’. The origin can be traced to the traditional system where the skipper owned the boat and some fishing gear while the fishers on board owned their own fishing gear and paid an agreed amount of money to the owner for using their boat.
This system is reflected in modern-day payments, whereby the boat gets its share of the fishing trip’s grossing for consumables, durables, rent and other expenses. This can exceed 60% of the value of the total catch. The rest of the money is then divided according to a fixed percent between each crew member and the skipper. The percentage-based system is an ‘output-based contract’ system and is an agreement between the owner/skipper and individual crew members participating in the fishing trip. This agreement is registered by the organisations behind the overall AWC Agreement for the Fisheries Sector. A hypothetical dividing of the ‘salary’ could be 30% for the skipper, 20% for the most senior crew member, 15% for the next crew members (two people), and 10% for the youngest crew member. There are additional percentages for the crew members that are responsible for the engine room and 5% if there is a dedicated ship cook.
The crew members are paid in case of sickness. The employer pays the crew member from the first whole day of sickness. The payment can be up to eight weeks. If the sickness is due to an occupational accident, the payment will be for 13 weeks. There is a common agreement regarding savings for pensions. So, all-in-all, fishers are considered to be something between an independent person and an employee. There is a general agreement that this system is not going to be changed in the foreseeable future as all partners are content with the present system. An underlying observation for this situation is that fishers are fascinated by the fact that they are ‘hunters’, in that they do not know the outcome and monetary returns of the next fishing trip.
The payment to the fishers is generally considered to be fair by all the parties involved in the AWC. More generally, following the introduction of the ITQ system, pay has increased as fewer fishers and vessels have participated. Because of the geographic location of the fishing harbours in West and North Jutland, new fishers are normally recruited from these areas. In times when the fishing is poor and jobs are scarce, fishers seek new jobs in the offshore or wind farm industries. These two sectors are fishing’s competitors in terms of employment. However, presently the situation is different as the fishing sector lacks fishers primarily because of the high average age of fishers, who are now retiring. Many fishers have taken the opportunity to retire thanks to the relatively high income during the last years of their active working life.
Several sector initiatives have begun to address this situation. One is an apprentice scheme discussed below. Another initiative has been to ‘import’ fishers, primary from Eastern EU countries. The exact number of non-Danish EU citizens working in the Danish fishing fleet is unknown, although it is estimated to be between 5% and 15% of the total fishing crew. Traditionally, there have always been fishermen from other countries working on Danish vessels including fishers from Iceland, Sweden, and the Faroe Islands. This has mainly concerned the pelagic fishing sector, where longer fishing trips are the rule. The ‘new’ fishers from the EU are accepted by the Danish fishers as long as they are part of the AWC and their salaries are calculated according to the rules in the agreement. There is a specific protocol, protocol 11, (appendix) to the agreement regulating the employment of fishers from the EU and EEA/EFTA countries.
The recruitment of young Danish fishers takes place by way of the apprentice agreement, which is different compared to the general apprenticeship system applied in the rest of the Danish economy. Due to the agreement between the owners and the fishers, the fishers cannot participate in paying for the apprentices. Some twenty years, ago a foundation was established to pay for research, information, and other activities. It was paid for by the vessel owners as a per mil (o/oo) of the catch value and therefore named the ‘Promilleafgiftsfonden’. This has since been changed and the fund’s primary function now is to pay for apprentices who are employed by the DFPO. As a result, all vessel owners pay a certain amount of money into the fund, some of whom employ an apprentice on board, paid by the fund. This solution gave rise to the latest addition to the AWC and now apprentices also pay a percentage of their salary into a pension fund.
The people interviewed were all asked what they think the future will bring. There was a general agreement that a holiday arrangement could be brought into the discussions, but that the present AWC prevents this due to the special status of the fishers. One area of discussion that could play a role in the future is the question of a steady monthly income compared to the present system where nobody knows what their income and monetary return will be until the next fishing trip has come to an end. Although it has been observed that there is pressure from the fishers’ families to have a much clearer idea of the next month’s salary, this aspect is unlikely to be part of the AWC in the near future.
The Danish fishing sector seems to be content with the present system of working conditions as established between the vessel owners and fishers. They all find that it is a unique system that is worth defending and is robust enough to withstand the pressure from the rest of the Danish labour market and the initiatives coming from the EU in respect of minimum salary and social arrangements. There was some discussion in the media when the most recent AWC for 2020 to 2023 was subject to a referendum among the members of the different organisations. This has now disappeared and there is peace among the participating organisations. The representatives from the different organisations state that if a problem develops during the agreement period, it must be settled by discussion or, more rarely, brought before a court as specified in the AWC.
Rent calculations
The overall socio-economic return is identified for all commercially active Danish fishing vessels for 2018 and compared to 2002 and 2003 as years before the introduction of individual transferable quotas and vessel quota share regulation. 2002 represent a good economic year, while the economy of the vessels was less good in 2003. The commercially active fleet covers more than 99% of the total landed value of Danish fishers.
Account data and other data for commercially active Danish fishing vessels is shown in Table 2.5.
| 2002 | 2003 | 2018 | |
| Account data (EUR million) | |||
| Turnover | 498 | 368 | 487 |
| Variable costs | 233 | 216 | 228 |
| Depreciation | 65 | 57 | 65 |
| Salary costs | 157 | 109 | 74 |
| Profit before interest and taxes | 43 | -111 | 120 |
| Financial costs | 29 | 26 | 23 |
| Profit before taxes | 14 | -137 | 97 |
Other data | |||
| Assumed remuneration of capital in alternative use (% of physical assets) | . | . | 3.0 |
| Number of commercially active vessels | 1,409 | 1,244 | 526 |
| Corporation tax rate (%) | . | . | 22 |
| Physical assets (EUR million) | 610 | 597 | 900 |
| Other assets2 (EUR million) | 72 | 62 | 1,853 |
| Total assets (EUR million) | 682 | 659 | 2,753 |
| Rate of return on total assets (%) | 2.0 | -20.8 | 3.5 |
| Rate of return on turnover (%) | 2.8 | 37.2 | 20.0 |
Note: 1. Commercially active fishing vessels include vessels with an annual turnover of more than EUR 29,200 in 2002, EUR 30,700 in 2003, and EUR 36,000 in 2018. 2. Included for 2018 is mainly the value of the fishing rights, i.e. the value of the permanent quota shares in the individual transferable quota scheme and in the vessel quota share system. This value was zero in the accounts for 2002 and 2003. | |||
Table 2.5: Account data and other data for commercially active Danish fishing vessels[1]Commercially active fishing vessels include vessels with an annual turnover of more than EUR 29,200 in 2002, EUR 30,700 in 2003, and EUR 36,000 in 2018. 2. Included for 2018 is mainly the value of the fishing rights, i.e. the value of the permanent quota shares in the individual transferable quota scheme and in the vessel quota share system. This value was zero in the accounts for 2002 and 2003., 2002, 2003 and 2018.
Footnotes
- ^ Commercially active fishing vessels include vessels with an annual turnover of more than EUR 29,200 in 2002, EUR 30,700 in 2003, and EUR 36,000 in 2018. 2. Included for 2018 is mainly the value of the fishing rights, i.e. the value of the permanent quota shares in the individual transferable quota scheme and in the vessel quota share system. This value was zero in the accounts for 2002 and 2003.
Table 2.5 shows that for 2018, the profit before tax was EUR 97 million, corresponding to 20.0% of turnover and 3.5% of total assets. It further appears that the corporation tax rate was 22% of the profit, with only one-third of the total assets of EUR 2.75 billion being physical assets, the rest being the value of the permanent quota shares. For 2002, the surplus profit before taxes was EUR 14 million, corresponding to 2.8% of turnover and 2.0% of total assets. In 2003, the profit before taxes reveals a deficit of EUR 137 million.
Remuneration of capital in alternative use measures the rate of return of the capital invested in fishing vessels that could have been achieved had the amount been invested in other capital goods, such as stocks or bonds. The capital is based on the value of the physical assets of the vessels including the hull, engine, gear, and the like. The value of fishing rights is not included since this does not affect the size of the socio-economic return. The rate of return in alternative use is assumed to be 3%, due to the current low interest rates.
Data on employment, salary, and income taxes are shown in Table 2.6.
| 2002 | 2003 | 2018 | |
| Calculated full-time employment in fisheries1 | 3,087 | 2,697 | 983 |
| Actual average annual salary in fisheries (EUR)2 | 50,912 | 40,583 | 75,186 |
| Income tax rate of actual salary3 (%) | 36.6 | 34.3 | 37.6 |
| Annual salary of fishers in alternative employment (EUR)4 | 34,600 | 35,900 | 48,000 |
| Income tax rate of alternative salary (%)3 | 36.3 | 36.3 | 36.3 |
Notes: 1. The number of full-time employees is calculated based on the known number of working days on board fishing vessels, using the assumption of 220 working days per year. 2. For 2002 and 2003, the average income of a full-time fisher is known from Nielsen et al. (2018), while it was EUR 57,614 in 2012 including income from other economic activities (Nielsen et al., 2018). With a similar development in salary costs, this would correspond to an income of EUR 75,186 in 2018. See also the Danish case study. 3. The income tax rates for 2018 for both actual salary and salary in alternative employment has been calculated by taking into account the gross tax, the basic tax, the top tax, the municipal tax rate, the personal deduction, the employment deduction, the job deduction, the fisher deduction, and income tax brackets. For municipal taxes, the tax rate from the largest fishing municipality in 2018, Hjørring, is applied. The tax rates for 2002 and 2003 have been identified assuming the same corporate and income tax rates as in 2018 to avoid the results being skewed by tax reforms. Income tax brackets for 2002 and 2003 are also the same as in 2018, except for being deflated using the consumer price index for 2002 and 2003. 4. The salary of fishers in alternative employment is an assumed value assessed realistically in 2018 and deflated using the consumer price index for 2002 and 2003. | |||
Table 2.6: Calculated full-time employment and gross average salary of crew in actual and alternative employment and income tax rates of these incomes, annual price level, 2002, 2003 and 2018.
The observed annual income of fishers at EUR 75,186 in 2018 per full-time employee is 57% higher than the income of EUR 48,000 that could have been achieved in other sectors. Moreover, it increased from EUR 50,912 in 2002 (and EUR 40,583 in 2003). Measured at a fixed price level, this corresponds to a 6% to 39 % increase from 2002/2003 to 2018.
In 2018, the income tax rate in fisheries was 37.6% and in alternative employment 36.3%. These rates have been identified taking into account the different tax rates, income brackets and tax deductions, including the ‘fisher deduction’. The different rates follow from the progression of income taxes. It is assumed that the fisher deduction is fully used. The income tax rates for 2002 and 2003 have been identified assuming the same corporate and income tax rates as in 2018, but with income tax brackets for 2002 and 2003 deflated to 2018 values. It appears from above that the remuneration of labour is higher in fisheries than in other sectors, while the remuneration of capital varies over time. Consequently, the socio-economic return may be positive or negative.
The socio-economic return for commercially active Danish fishing vessels has been identified for the three years in Table 2.7. It is assumed that the income tax rates and the corporation tax rate are the same in 2002 and 2003 as in 2018. The reason is that the socio-economic return can be compared over time without being skewed by changes in the tax system.
| 2002 | 2003 | 2018 | |
Socio-economic return (EUR million) | |||
| Remuneration of labour | 32 | 10 | 16 |
| Remuneration of capital | 25 | -28 | 75 |
| Public sector | 18 | -2 | 29 |
| Total | 75 | -20 | 120 |
Allocation of socio-economic return (percentage) | |||
| Remuneration of labour | 42 | . | 13 |
| Remuneration of capital | 34 | . | 63 |
| Public sector | 24 | . | 24 |
| Total | 100 | . | 100 |
Table 2.7: Size and allocation of the socio-economic return of commercially active Danish fishing vessels in 2002, 2003, and 2018, EUR million and percentage.
The socio-economic return in 2018 is EUR 120 million, corresponding to 25% of the total landing value. The socio-economic return in 2018 is higher than before the introduction of the individual transferable quota and vessel quota share systems. The socio-economic return was EUR 75 million in the good economic year of 2002, while it was negative in 2003. Considering only this one year, a negative socio-economic return would indicate that society is richer without the existence of fisheries. Consequently, the management reform led to a substantial increase in the sector’s contribution to the Danish economy.
The socio-economic return in 2018 is higher than the profit of EUR 97 million. This reveals that the Danish individual transferable quota and vessel quota share systems have been running for several years after their introduction between 2004 and 2007. Permanent quota shares have been traded and, accordingly, future earnings in them have been capitalised. The implication is that part of the socio-economic return has been removed from the fisheries as former fishers have left the sector.
Earlier studies have also identified the socio-economic return of vessel groups in Danish fisheries using the same method as above. The results of those are summarised in Table 2.8. The socio-economic return accounted for 60% of the landing value for mussel fishery between 2001 and 2003, and 17% of the landing value in pelagic fisheries in 2007. Mussel fishery was, however, a special fishery with extraordinarily good stock conditions at the time of the study, which is difficult to compare with other Danish fisheries.
The pelagic fleet is known to have higher earnings than the average of the Danish fleet. In 2007, after the introduction of individual transferable quotas in 2004, the socio-economic return was 17% of the landing value. Compared to the current finding of 25%, this is smaller. The reason is that the introduction of individual transferable quotas and vessel quota shares led to a substantial reduction in the Danish fleet (Table 2.5), giving rise to higher earnings among all the remaining vessel groups.
| Mussel vessels | Pelagic vessels | |
| Study | Nielsen et al. (2006) | Nielsen et al. (2010) |
| Year | 2001-2003 | 2007 |
| Number of vessels | 63 | 36 |
Size of socio-economic return | ||
| Value (EUR million) | 80 | 16 |
| Share of landing value (%) | 60% | 17% |
Allocation of socio-economic return (%) | ||
| Remuneration of labour | 15% | 22% |
| Remuneration of capital | 41% | 36% |
| Public sector | 44% | 41% |
| Total | 100% | 100% |
Table 2.8: Literature review of studies identifying the socio-economic return of Danish fisheries.
Table 2.7 shows that capital achieved the largest share of the socio-economic return at 63%, while labour obtained 13% and the public sector 24%. In the good economic year of 2002, the share of the capital owners was 34%, while in the less good economic year of 2003, capital owners contributed negatively to the socio-economic return. Consequently, the introduction of individual transferable quotas and vessel quota shares led to a substantial increase in remuneration of capital that gave rise to the increase in the overall socio-economic return.
The share of capital owners includes both the remuneration of capital of active fishers and the remuneration of capital capitalised in fishing rights and removed from fishing when former fishers sold their rights and left the sector. While it is not possible to allocate the identified remuneration of capital between current and former capital owners, the rate of return of capital of 3.5% is higher than the rate of return of total assets in alternative use (3%) and reveals that current owners capture a share of the socio-economic return. However, with the two numbers being close, a large share of the socio-economic return has been capitalised in the fishing rights and removed from fishery.
For the public sector, tax revenue from fishing increased from EUR 18 million in 2002 (negative in 2003) to EUR 29 million in 2018. Although the share is the same at 24% in both years, the public sector is positively affected by the management reform.
The share of the socio-economic return of the hired crew falls from EUR 32 million in the good economic year of 2002 to EUR 16 million in 2018 (only EUR 10 million in 2003). Consequently, the Danish individual transferable quota and vessel quota share systems reduced the share of the socio-economic return to hired crew from 42% to 13%. As a result, it is labour that bears the burden of the Danish fishery reform.
Two groups of hired crew are affected, those that remain active and those that leave fishing. Those that remain active receive an increase of between 6% and 39%[1]Increase from the average annual salary of a Danish commercial fisher: From EUR 50,912 in 2002 to EUR 75,186 in 2018, corrected by the 27.9% price increase known from the consumer price index, and from EUR 40,583 in 2003 to EUR 75,186 in 2018, corrected by the 25.2% price increase. in real wages, based on 2002 and 2003 respectively. Consequently, this group gains slightly from the reform, but such gains are small compared to capital owners that, in real terms, double their contribution to the socio-economic return.
Between 2002 and 2018, full-time employment fell 68% from 3,087 to 983. This group is severely negatively affected by the management reform, although the presence of alternative job opportunities may mitigate some of the negative effects. When fishing rights are purchased, the cost of fishing increases. Capital owners pay the extra cost. Since active labourers are paid by way of crew shares that are normally identified as fixed shares of turnover minus pre-specified cost items including extra costs of fishing rights, the hired crew is also affected. Consequently, in Denmark the crew share salary negotiation system may have implied that the hired crew that remains active is not substantially affected, neither positively or negatively, by the introduction of individual transferable quotas and vessel quota share systems.
It is stressed that the calculation of both the size and allocation of the socio-economic return is based on several assumptions, implying that the results are subject to uncertainty and must be interpreted with caution.
Footnotes
- ^ Increase from the average annual salary of a Danish commercial fisher: From EUR 50,912 in 2002 to EUR 75,186 in 2018, corrected by the 27.9% price increase known from the consumer price index, and from EUR 40,583 in 2003 to EUR 75,186 in 2018, corrected by the 25.2% price increase.
References
Copes, P. (1972). Factor Rents, Sole Ownership and the Optimum Level of Fisheries Exploitation., The Manchester School of Social and Economic Studies, 40:145-63.
Danmarks Fiskeriforening (2017), Orienterieng om overenskomstaftale for 2017-2020, available at: https://fiskeriforening.dk/media/1467/170310-infobrev-overenskomstaendringer-pr-1-marts-2017.pdf
Danmarks Fiskeriforening og 3F Fagligt Fælles Forbund (2014), Overenskomst mellem Danmarks Fiskeriforening og 3F Fagligt Fælles Forbund 2014-2017, 3F-varenummer 3118, available at: https://fiskeriforening.dk/media/1468/overenskomst-for-fiskere-2014-2017.pdf.
Gunnlaugsson, S.B and S. Agnarsson (2019), Late arrival: The development of resource rent in Icelandic fisheries, Fisheries Research 214(June):126-135.
Gunnlaugsson, S.B. and D-M- Kristofersson, Resource Rent and its Distribution in Iceland’s Fisheries, forthcoming in Marine Resource Economics 130.208.126.236.
Nielsen, M., P. Andersen, L. Ravensbeck, F. M. Laugesen, J. Andersen, D. M. Kristoffersen, S. Reithe, J. Nilssen and H. Ellefsen (2010), Samfundsøkonomisk afkast af pelagiske fiskerier i Nordøstatlanten, Nordisk Ministerråd, TemaNord rapport 2010:573.
Nielsen, M., B. Cozzari, G. Eriksen, O. Flaaten, E. Gudmundsson, J. Løkkegaard, K. Petersen and S. Waldo (2006), Økonomien i de nordiske fiskerier - fokus på ressourcerenten, Nordisk Ministerråd, TemaNord rapport 2006:540.
Nielsen, N., S. Waldo, A. Hoff, R. Nielsen, F. Asche, J. Blomquist, O. Bergesen, J. Viðarsson, S. Sigurðardóttir and R. Sveinþórsdóttir (2017), Employment and salary of Nordic coastal fishermen, Nordic Council of Ministers, TemaNord 2017:558.
Nielsen, M., F. Asche, R. Nielsen, A. Hoff, E. Henriksen, O. Bergesen, J. Viðarsson, S. Waldo and J. Blomquist (2018), The Myth of the Poor Fisher: Evidence from the Nordic countries, forthcoming in Marine Policy 93:186–194.
Nielsen, M., J. Dalskov, J.L. Andersen, R. Nielsen, A. Koed, J.K. Pedersen, A. Rindorf, M. Vinther, N.J. Olesen, P. Bovbjerg Pedersen, U. Sveistrup, A. Philips, S.O. Heltberg, M. Krestyanska, P.E. Agerskov and E.A. Olesen (2019), Situationsbeskrivelse af den danske fiskeri-, akvakultur og fiskeindustrisektor: Den Europæiske Hav- og Fiskerifond 2021-2027, IFRO Udredning 26/2019 fra Institut for Fødevare- og Ressourceøkonomi, Københavns Universitet, available at: https://static-curis.ku.dk/portal/files/233843569/IFRO_Udredning_2019_26.pdf
Appendix: Hire contract
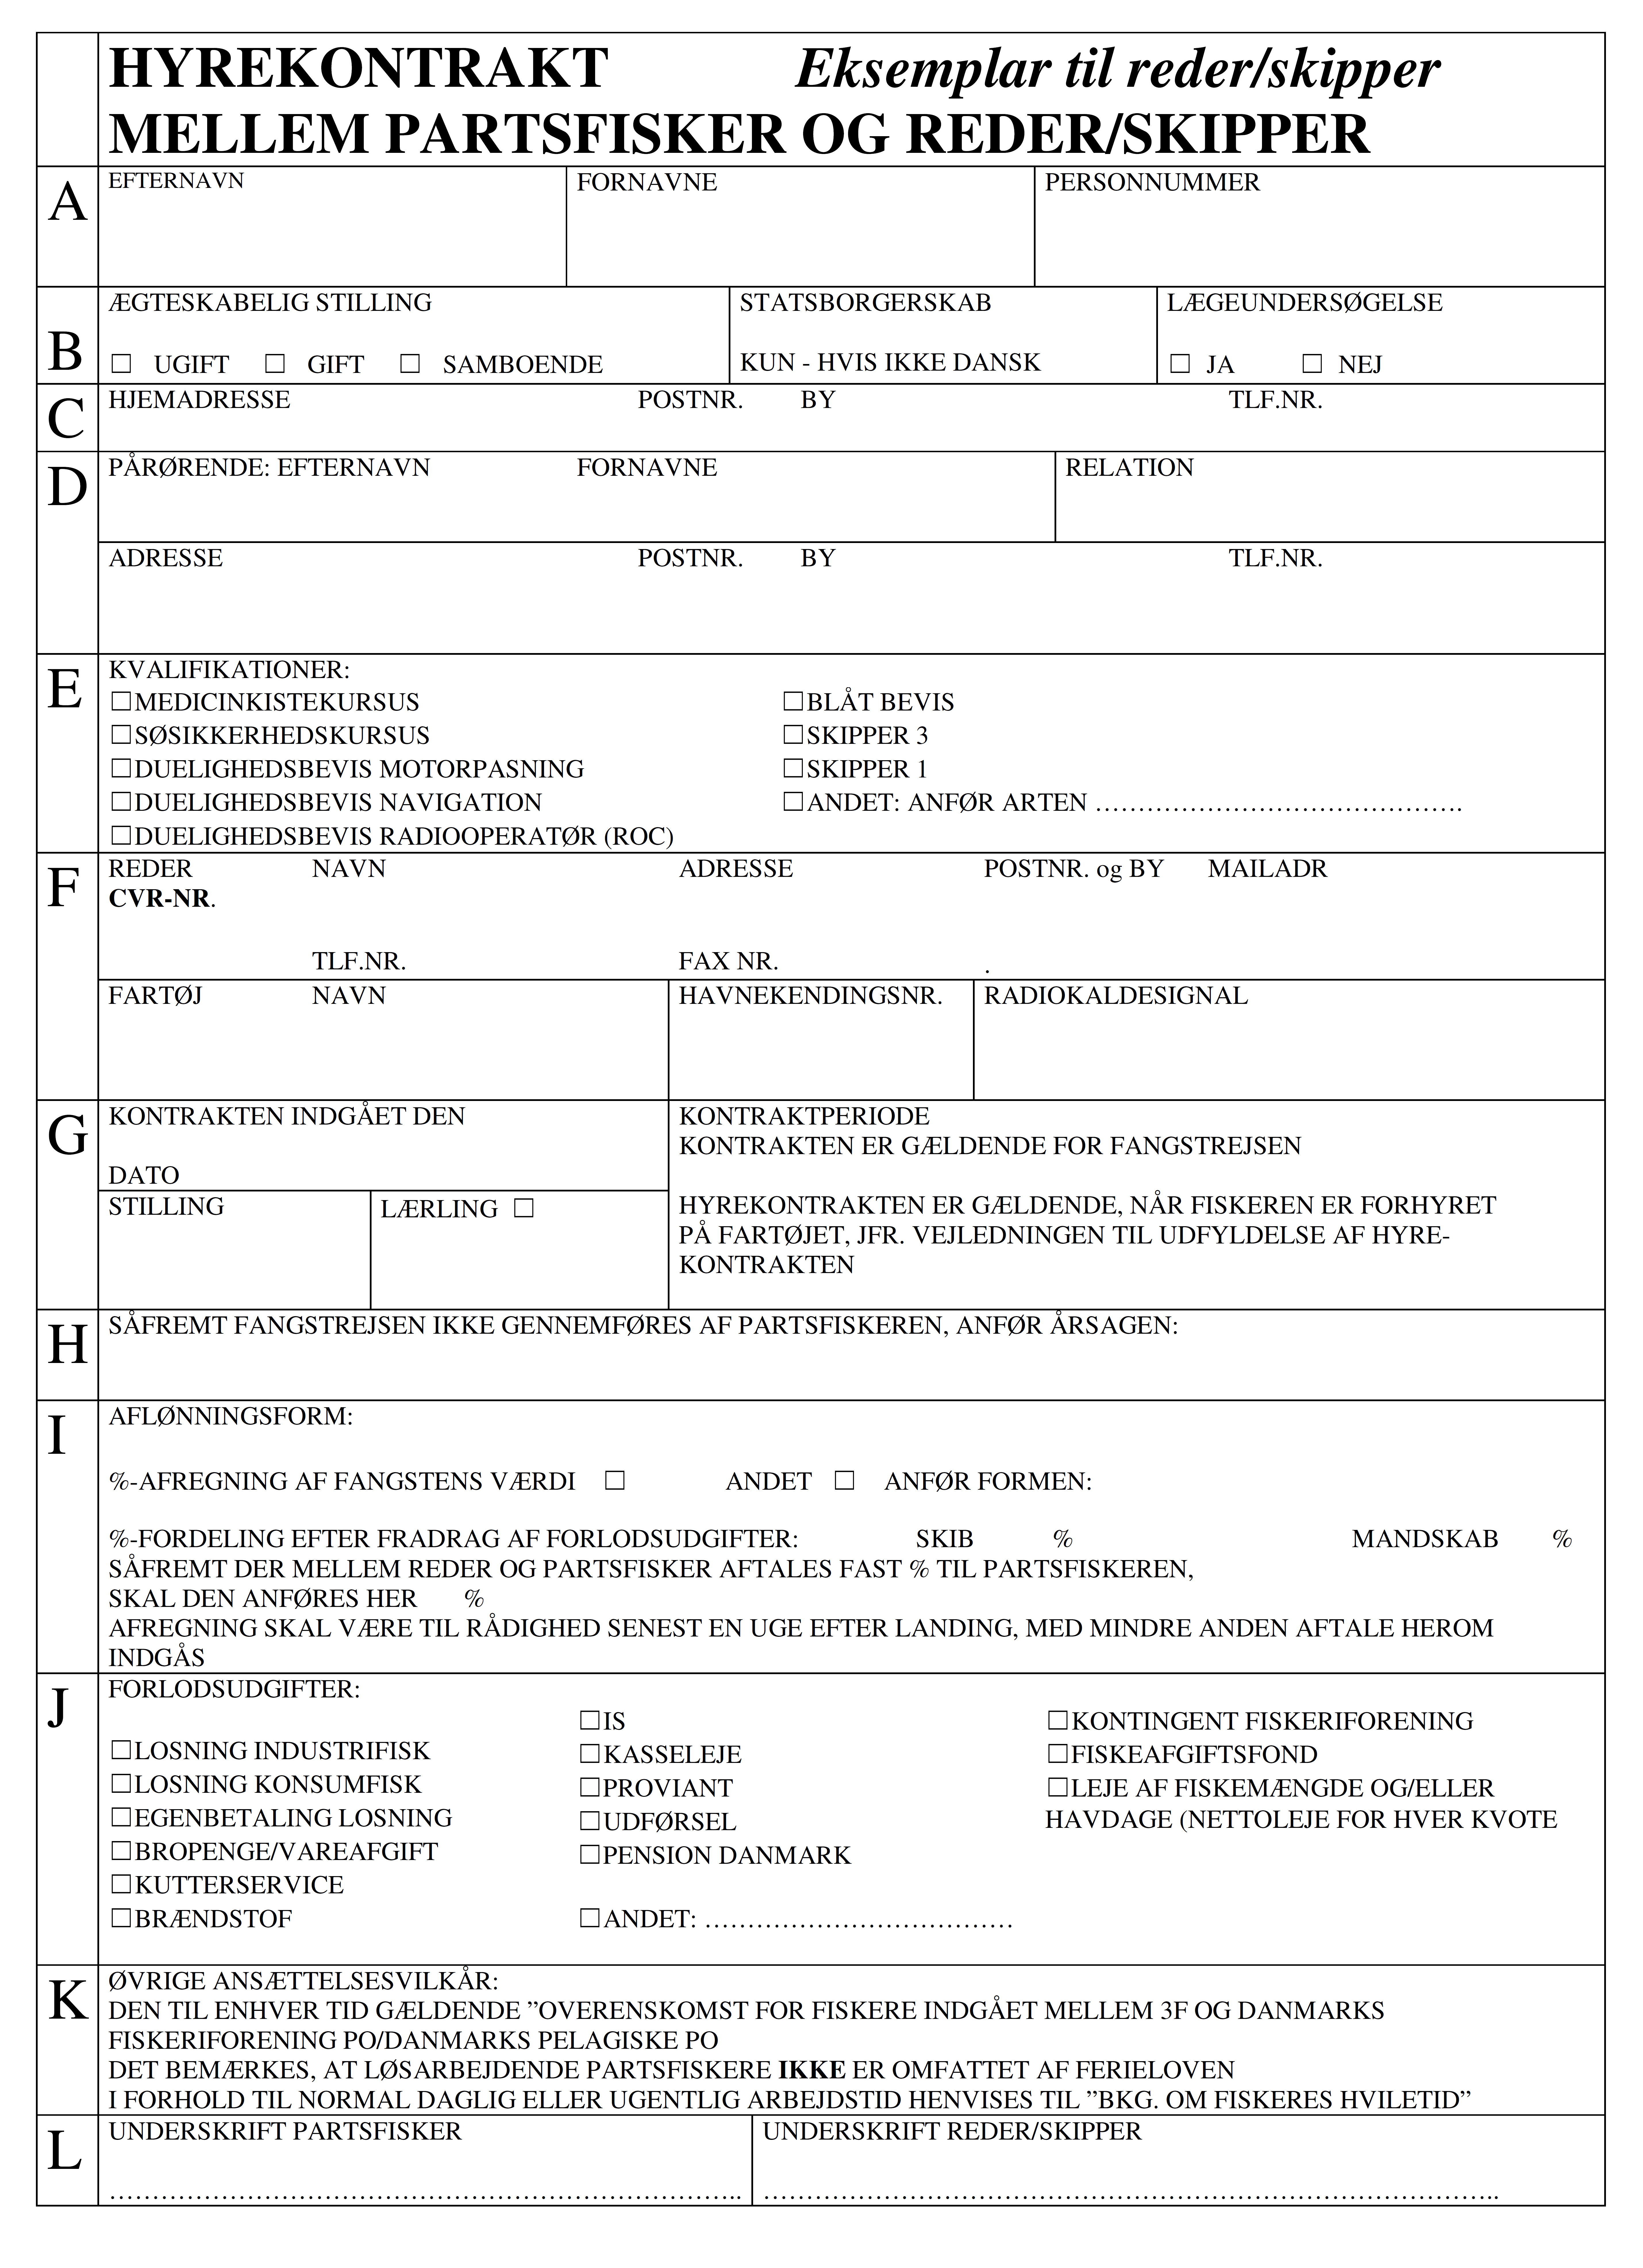
3. The Faroe Islands
Hans Ellefsen and Heri á Rógvi
Introduction
The Faroese fishing industry has been through a history of restructuring. Its history goes back many years, and until the 1970s there was open access fishery in large parts of the North Atlantic Ocean, which Faroese commercial fishers exploited. The extension of the exclusive economic zones by North Atlantic countries around 1977 meant that Faroese vessels needed to fish in their own waters unless the Faroese government made agreements with other countries to fish in their waters. Consequently, most of the Faroese vessels were forced into Faroese waters in the late seventies. The Faroese waters did not have as much room for the vessels, meaning in the late seventies and eighties, there were simply too many vessels (Danielsen & Agnarsson, 2018).
The first real legislation of Faroese fishing did not come until 1994 following an economic downturn in 1992, due mostly to a crisis in the fishing industry. Prior to this legislation, fishing was regulated only with licenses. In the law from 1994, the government of Denmark demanded that the Faroe Islands introduce an ITQ system in exchange for loans to finance the economic crisis. This system lasted only until 1996 for demersal fisheries around the Faroe Islands, after which a system of fishing days (effort regulation) was introduced. This has not proven to be successful either economically or biologically (Danielsen & Agnarsson, 2018).
The fishing opportunities for Faroese vessels that were negotiated with other governments were still in the ITQ form. In particular, the pelagic fishery in the North-East Atlantic and the demersal fishery in the Barents Sea were quota-based and subsequently distributed to Faroese vessels as individual quotas. Before 1996, there were no agreements between the governments bordering the North-East Atlantic on any of the pelagic species. Eventually, by 2007, agreements were in place for the three major pelagic species: herring, mackerel, and blue whiting. These agreements only lasted until 2010 when the Faroe Islands first exited the mackerel agreement, as they were not satisfied with the share allocated to the Faroes. Later, in 2014, a new mackerel agreement was concluded between some of the parties, while the herring and blue whiting agreements broke down in 2013 and 2015 respectively. At the time of writing this paper (2020) these agreements have not been restored.
This following will look at Faroese fishery and the crew payment system of the Faroe Islands. First, there is a short summary of Faroese fishery, followed by the salaries system, and finally about resource rent and how the Faroese government has tried to recuperate some of this rent into the public coffers. We will look at the period from 1996 to 2017, which is the period for which we have data. The data is mostly from annual accounts from the vessels (Januar, 2018).
Faroese fishery
Faroese fishery can be divided into three segments:
- the demersal fishery around the Faroes fished by long-liners (8% of the total landing value in 2017) and trawlers (17% of the total landing value in 2017);
- the demersal fishery in the Barents Sea fished by factory vessels (16% of the total landing value in 2017); and
- the pelagic fishery in the North-East Atlantic fished by purse seiners (50% of the total landing value in 2017).
There are other fleet segments in Faroese fishery, including small-scale fishery which accounted for about 10% of the total value in 2017. However, these fisheries will not be considered in the following as the vessel accounts are not accessible.
As can be seen below in Figure 3.1, sales from demersal fishery around the Faroe Islands (= long-liners and trawlers) are stable or falling. The demersal fishery in the Barents Sea (= factory vessels) has had some good returns in recent years (Figure 3.2) and has been relatively stable sales throughout (Figure 3.1). Finally, the pelagic sector (= purse seiners) has seen a big increase in sales and profits (Figure 3.1 and 3.2) mostly due to the huge increase in mackerel fishery, which has been very profitable for the Faroese pelagic sector.
Figure 3.1: Total sales in the different groups of fishing vessels from, 1996-2017 in DKK thousand.
Fishery profits in these groups have been good for pelagic vessels and, to a lesser degree, factory vessels, as we can see in Figure 3.2. Here we need to remember that resource taxes and auction fees increased for these groups in the later years, as we will discuss later.
In Figure 3.2 we can see that the profits for the vessels fishing demersal fish around the Faroe Islands (= long-liners and trawlers) have been negative for the last couple of years, which can probably be attributed to the mismanagement of the stocks and fishery characterised by “too many vessels for too few fish” (Búskaparráðið, 2014).
Figure 3.2: Profit before extras in the different groups of fishing vessels, 1996-2017 in DKK thousand.
Another way to show the development of Faroese fishery is to look at the number of vessels, which has been on the decline in later years but not so much as one would expect as can be seen in Figure 3.3.
Figure 3.3: Number of vessels in the different groups of fishing vessels, 1996-2017.
We can see that the number of pelagic vessels (= purse seiners) has been increasing since the surge in sales from 2010 onwards (ref. Figure 3.2). But this increase in vessels is smaller than what could be expected and is probably the reason for the increased profitability in this vessel group.. Where some of the quotas were auctioned off, the highest bids mostly came from existing vessels. The number of vessels in other vessel groups is probably declining due to more efficient fishing methods.
Wage determination system
Commercial fishers’ pay in the Faroe Islands is almost entirely based on a revenue sharing system. However, to compensate for low catches, there is also a minimum wage system of DKK 1,100 per fishing day that is financed by the fishing industry through a levy of 0.6% on the landed value of all landed fish. This minimum wage is sometimes used in demersal long-line fishing around the islands, whereas actual pay far exceeds the minimum for larger vessels. It should be noted that the minimum wage is not part of the vessel’s accounts, so the figures below do not include this. The fishers and vessel crew also get a 14% tax break (compared to workers in the rest of the economy) for income up to DKK 470,000 per year.
The part of the total revenue that the fishers earn is determined by way of negotiations between the shipowners and the fishers’ organisations that take place every other year. The last negotiations concluded in May 2020. The Faroese government has no role in these negotiations. The different percentages are often based on historical conditions and do not change much over time. The system of pay is quite complex and differs across different vessel groups.
In general, we can say that fishers on long-liners get a larger share of the revenue than fishers on purse seiners, with trawlers and factory trawlers somewhere between the two. On the vessels, the different roles of the crew give them different salaries. The captain usually earns around two to three times the salary of the deckhand, while the engineer and cook get half of the extra pay that the captain earns.
Table 3.1 below gives examples of salary distributions for the different groups of vessels. The table contains examples of the distribution of salaries but does not explain all the complexities of the agreements between the fishers and the shipowners. The first column is the percentage of the sales (turnover). The captain, for example, gets one additional part on trawlers. This means that if the sales were DKK 100 million for a trawler with 27 men on board, then the deckhands get DKK 27 million divided by 27, which is DKK 1 million each. The captain then earns that DKK 1 million and DKK 1 million extra (DKK 2 million), the engineer DKK 0.75 million extra, and the cook DKK 0.25 million extra. We see that the parts vary depending on the vessel type.
| Deckhand | Captain | Engineer | Cook | |
| Long-liners | 43% | 2.15 parts added | 0.8 parts added | 0.25 parts added |
| Trawlers | 27% | 1 part added | 0.75 parts added | 0.25 parts added |
| Factory trawlers | 37.75% | 2 parts added | 1 part added | 0.25 parts added |
| Pelagic vessels | 17.5% | 1.75 parts added | 0.9 parts added | 0.25 parts added |
Table 3.1: Examples of crew shares
Figure 3.4 provides the different salaries as percentages of the sales for the different vessel groups (figures from the annual vessel accounts).
Figure 3.4: Salaries as a percentage of sales (= turnover) for the different groups of fishing vessels, 1996-2017
We can see that although the salaries are negotiated as a stable percentage of sales, actual salaries can vary considerably over the years (as we see for long-liners, for example). Although we are not quite sure why that is, one reason could be that the long-line shipowners can subtract some of the costs, such as oil, before the calculation of the fishers’ pay. Fluctuating oil prices can make this a large and highly variable cost, which can influence the percentage in the figure above.
The fishers had a large increase in their salaries in later years. This is particularly true for the fishers and crew of the pelagic vessels. Figure 3.5 below shows the salaries per full-time employee for the different vessel groups. This is what one would get if one were on every fishing trip. However, it should be observed that there are typically two crews on pelagic vessels, so one would only get half that salary if one was on this vessel. On the other hand, small vessels such as long-liners have a much lower salary, and there is often only one crew.
Figure 3.5: Salaries per full-time employee for the different groups of fishing vessels, 1996-2017 in DKK thousand
We can see that although the annual pay on pelagic vessels and factory vessels is quite large, trawlers and especially long-liners do not have this level of salaries. For all groups, the salaries have been on the increase since 1996. While these numbers are not adjusted for inflation, there has nevertheless been an increase in real salary levels over the period.
Although the number of fishers has declined in later years in the Faroe Islands, this has not been the case for the groups that we are looking at here. The decline has been among small-scale fishers. As the graph below shows, there were almost 1,000 fishers in the beginning of the century, which has fallen to around 700 now. It is particularly in demersal fishing that the number of fishers has fallen.
Figure 3.6: Number of fishers (FTEs) in the different groups of fishing vessels from 1996 to 2017.
Resource rent
There has been a lengthy discussion on the size of the resource rent in the Faroe Islands, which has lasted many years. This discussion was mainly driven by the decision of the Faroe Islands not to be part of the mackerel agreement in 2010 and by the resulting large increase in sales that occurred as we saw in Figure 3.1. As we saw in Figure 3.2, a large increase in profits for the pelagic fleet followed as well as an increase in the salaries on board these vessels (Figure 3.5). This led to the discussion of whether there was a large resource rent in this fishery.
The political answer to this development was first to have a small auction of fishing rights in 2011 and to introduce a small resource rent fee which was separate from the auction and directly levied on quota holders. The auctions were discontinued from 2012 to 2015 but continued from 2016 to 2019 when auctions of around 20% of the pelagic species and Barents Sea cod were held. Over the same period (from 2011 to 2019), the resource rent fee, directly levied on quota holders, increased. Finally, when the auctions were abolished again in 2020, the fees more than doubled making the revenue to the government almost the same as in 2018 (but not as high as in 2019), but this time without the auctions.
Figure 3.7 shows the pelagic vessels’ resource rent as an illustration. Although methodologically controversial, the use of FTE wages as above sets a normal wage for this at DKK 400,000 per year and a normal profit at 6% of the vessels value according to the annual accounts. This was the calculation that was made in (Nielsen, et al., 2010). If we use this calculation method, the resource rent for the pelagic industry has been increasing for many years and the government gets an increasing part of the resource rent. Total government revenue from the resource taxes and auction was only 36% of the resource rent in 2017 (Løgting, 2017) although, over the period, the 36% represents the largest share of the resource rent.
Figure 3.7: Resource rent calculation of the purse seiners in the Faroe Islands
Interviews
The salary of fishers on board Faroese ships is set through negotiation between the three fisher organisations (Føroya Skipara- & Navigatørfelag, Maskinmeistarafelagið og Føroya Fiskimannafelag) on the one side and the boat owners’ organisation on the other. In support of this work an interview was carried out in the summer of 2021 with the leader if the Føroya Fiskimannafelag, Jan Højgaard. The purpose was to ascertain the main issue in the salary negotiations.
The salary depends on fish prices, oil prices, and the cost of vessel, landing costs, etc. In addition, weather and tidal flow plays a role and influences fishers’ wages from time to time.
– Leader of Føroya Fiskimannafelag, Jan Højgaard.
According to the agreement (§20), the performance-based salary is calculated from the total sales from which shared expenses are deducted, which vary depending on the vessel type and contract. Fisher salaries are set as a percentage part of total sales, but are also based on vessel type and number of crew on board (§§35-45). In addition to the regular shares, extra shares are given depending on job type such as officers, engineers, chef, and the like.
The fishers and boat owners can agree upon a minimum wage and extra share which is higher than the one stated in the agreement. Some (ice) long-liners have such an agreement, where the boat owners pay twice the minimum wage to make sure the boat has sufficient crew.
The salary of Faroese fishers is based on a hierarchy which gives the captain most, officers second, engineers third, machinist fourth, chef fifth, and the members of Føroya Fiskimannafelag (regular fishers) the lowest pay. These fishers work as regular fishers (deckhands and factory workers, etc.).
Are fishers well paid compared to other industries?
Yes, some think so. However, if you look at the hours spent on board, fishers are poorly compensated for their work. On the other hand, one can say that 20% (200 fishers) are well paid. They’re the ones fishing with purse seiners in the North-East Atlantic and factory trawlers in the Barents Sea. These fishers get all the attention from the public, and this is what people talk about.
– Jan Højgaard.
Salary groups and vessel types
Fisher salaries can, in general, be divided into six groups. Captains, officers, engineers, machinists, chef, and regular fishers. The captain gets the highest pay and regular fishers the lowest. The salary of these groups is a function of the value of the catch. For example, during the last years, fishers on board Faroese (ice) long-liners and netting boats have had rather low salaries. Fishers on board trawlers, pair trawlers, (freezing) long liners, and vessels fishing for prawn and blue whiting have had average salaries, while fishers on purse seiners in the North-East Atlantic and factory trawlers in the Barents Sea have had very good earnings.
It is difficult to talk about the fishing fleet in general. Fishers fishing with (ice) long-liners, netting boats and some trawlers have long workdays, and the value of catch is low to medium. This compares with fishers on board a purse seiner in the North-East Atlantic or a factory trawler in the Barents Sea where life must be classified as very good, both because of the working conditions and the high salary.
– Jan Højgaard.
Technological advancement
According to Jan Højgaard, the fishing fleet has undergone a lot of improvements and fishers are not as worn out as they used to be. The vessels and the work environment for fishers are better, and Højgaard therefore expects that fishers will endure much longer. This is especially the case if technology on board continues to improve. But for fishers still working long days on board, this must be seen in the context of their salary and the hours they spend on board. We must consider that fishers only are paid when they are on board and away from home and their family. They are not paid when they are at home. Retirement due to injury because of the hard work on board (especially on board long-liners, netting boats and trawlers) must be considered when measuring and evaluating fisher salaries. Also, the fishers’ social insurance needs to be considered and how this compares to other industries. Another social difference is that low-salary fishers have difficulties getting bank loans due to difficulties in estimating their income.
I had to go onshore at 36 years old because I was worn out.
– Former fisher (now 56 years old).
Salary negotiation
Although the agreement is up for negotiation once a year, in recent years it has been common to make agreements for two years at a time. Normally, it is the chair of each fisher organisation and their committee who negotiates with the managing director of the boat owners’ organisation. In case of shared requests from all fisher organisation, this will be presented as a common request.
The negotiations deal with how to share the net grossing between boat owner and fisher, and who will benefit from extra shares and the operating costs of the particular vessel to be deducted from the value of the catch. However, negotiations also deal with social security, such as insurance, work clothing, payment for television, food, and pension.
When the organisations are ready to conclude the agreement, everyone leaves the room except the chair of Føroya Fiskimannafelag and the managing director for the boat owners. The agreement is then made. Arbitrators are called in case of conflict on the agreement.
Unemployment insurance
Jan Højgaard says that although fishers are, in principle, covered by state unemployment insurance (ALS), in practice it does not work as intended as the ALS does not have fishing-related provisions such as for poor catches or if the vessel is not operating because of a refit or repairs. Hence fishers only receive little or nothing from the ALS. Only if they are made redundant will the ALS unemployment insurance pay. But there are very few fishers getting paid from the ALS unemployment insurance, according to Jan Højgaard. Meanwhile the ALS unemployment insurance has improved over the last decade, as previously fishers were not covered by the ALS.
Type of payment
It can be difficult to say something general about the type of payment to fishers. The salary is paid according to the agreement between boat owners and fishers, that is to say either up front, after the fishing trip, or a combination of both. Sometimes fishers get paid when signing on. The resulting salary will be high when the fisher is at sea and non-existent when at home. Some vessels split the salary into two, so there are two crews, and some also split it over the year, so fishers get approximately the same amount of salary every month.
The way fishers get their salary depends very much on the mentality of the crew. But in recent times, many young fishers find it hard receiving their payment only when signing on and not when signing off.
– Jan Højgaard.
But Højgaard also points out, that especially (ice) long-liners and netting boats have difficulties paying fishers in general because of bad fishery, low income, and sometimes deficits and difficulty finding crew for the vessel, while in other fisheries where the salary is medium-high, fishers can be paid every month. But again some crews, such as those on board purse seiner, simply want their salary when signing on and not when signing off, Jan Højgaard says.
Why is there a difference in fisher salaries?
The value of the catch and the number of crew are the most important parameters for the calculation of salary. The catch from a purse seiner in the North-East Atlantic and trawlers in the Barents Sea has a much higher value. In addition, these vessels can stay at sea for a very long time, keeping the fish in good condition and have a huge cargo hold compared to smaller boats and ships.
Calculation of the size and allocation of the resource rent in the Faroe Islands
Now we go back to more detailed calculation of the resource rent. The overall socio-economic return is now identified for the missing two groups of commercially active Faroese fishing vessels for 2017 and compared with 1997. These two groups are: 1) smaller vessels fishing mostly demersal fish around the Faroe Islands, and 2) factory vessels fishing mostly demersal fish in the Barents Sea. The smaller vessels are regulated by an effort regulation system while the factory vessels are regulated by an individual transferable quota system, that was made fully transferable in 1998. Both 1997 and 2017 were good years for both groups, in between there were both good and bad years. Some years were especially bad for the smaller vessels. Account data and other data for these vessels are shown in Table 3.2.
| Smaller vessels | Factory vessels | |||
| 1997 | 2017 | 1997 | 2017 | |
| Account data (EUR million) | ||||
| Turnover | 64 | 99 | 42 | 66 |
| Variable costs | 20 | 48 | 14 | 14 |
| Depreciation | 4 | 9 | 4 | 5 |
| Salary costs | 29 | 43 | 15 | 25 |
| Profit before interest and taxes | 10 | -2 | 9 | 22 |
| Financial costs | 2 | 3 | 2 | -1 |
| Profit before taxes | 8 | -5 | 7 | 23 |
Other data | ||||
| Assumed remuneration of capital in alternative use (% of physical assets) | 3.0 | 3.0 | 3.0 | 3.0 |
| Number of commercially active vessels | 57 | 44 | 6 | 4 |
| Corporation tax rate (%) | 18 | 18 | 18 | 18 |
| Physical assets (EUR million) | 42 | 97 | 37 | 66 |
| Other assets1 (EUR million) | 13 | 36 | 17 | 57 |
| Total assets (EUR million) | 55 | 132 | 54 | 124 |
| Rate of return on total assets (%) | 14.5 | -3.9 | 12.7 | 18.6 |
| Rate of return on turnover (%) | 12.6 | -5.3 | 16.1 | 34.7 |
Note: 1. Includes mainly the value of the fishing rights, i.e. the value of the permanent quota shares in the individual transferable quota scheme and in the vessel quota share system. | ||||
Table 3.2: Account data and other data for some commercially active Faroese fishing vessels, 1997 and 2017.
Table 3.2 shows that in 1997, the profit before taxes was EUR 8 million for the smaller vessels while it was EUR 7 million for the factory vessels, corresponding to 12.6% of the turnover and 14.5% of total assets for the smaller vessels, and 16.1% and 12.7% for the factory vessels. This changed dramatically in 2017 where there was a loss before taxes of EUR 5 million for the smaller vessels corresponding to a loss of 5.3% of turnover and a loss of 3.9% of total assets. The factory vessels on the other hand had profits of EUR 23 million in 2017, corresponding to a profit of 34.7% of turnover and 18.6% of total assets. The reasons for this difference in fortunes for these two groups are due to different factors. We can see that the smaller vessels had a large increase in variable costs in the period, while the factory vessels had the same costs in both 1997 and 2017. This is due to the factory vessels being better able to adjust the fleet to the size of the quota in the ITQ system, which is not that easily done in an effort system as in the smaller vessel group.
Remuneration of capital in alternative use measures the rate of return of the capital invested in fishing vessels that could have been achieved had the amount been invested in other capital goods, such as stocks or bonds. The capital is based on the value of the physical assets of the vessels including the hull, engine, gear, and the like. The value of fishing rights is not included since this does not affect the size of the socio-economic return. The rate of return in alternative use is assumed to be 3%, due to the current low interest rates.
Data on employment, salary, and income taxes are shown in Table 3.3.
| Smaller vessels | Factory vessels | |||
| 1997 | 2017 | 1997 | 2017 | |
| Calculated full-time employment in fisheries1 | 685 | 525 | 259 | 152 |
| Actual average annual salary in fisheries (EUR)2 | 42,555 | 82,345 | 58,547 | 163,569 |
| Income tax rate of actual salary3 (%) | 29.4 | 36.9 | 32.3 | 44.6 |
| Annual salary of fishers in alternative employment (EUR)4 | 38,400 | 53,333 | 38,400 | 53,333 |
| Income tax rate of alternative salary (%)3 | 34.7 | 38.2 | 34.7 | 38.2 |
Notes: 1. The number of full-time employees is calculated based on the known number of working days on board fishing vessels, using the assumption of 220 working days per year. 2. The average income of a full-time fisher is calculated based on the annual accounts and the calculated full-time employment. 3. The income tax rates for 2017 for both actual salary and salary in alternative employment has been calculated by taking into account the gross tax, the municipal tax rate, the personal deduction, the unemployment fund, the labour market pension fund, and the fisher deduction. For municipal taxes, the tax rate from the largest fishing municipality in 2017, Klaksvík, is applied. The tax rates for 1997 have been identified assuming the same corporate and income tax rates as in 2017 to avoid the results being skewed by tax reforms. 4. The salary of fishers in alternative employment is an assumed value assessed realistically in 2017 and deflated using the consumer price index for 1997. Sources: Accounting firm January (2018) and Faroese tax authorities. | ||||
Table 3.3: Calculated full-time employment and gross average salary of crew in actual and alternative employment and income tax rates of these incomes, annual price level, 1997 and 2017.
The observed annual income of fishers on factory vessels was EUR 163,569 in 2017 per full-time employee, which is more than three times higher than the income of EUR 53,333 that could have been achieved in other sectors. Moreover, the salary increased from EUR 58,549 in 1997 which, measured in nominal prices, corresponds to a 179% increase between 1997 and 2017. For smaller vessels, the average (nominal) salary almost doubled from EUR 42,555 in 1997 to EUR 82,345 in 2017. Compared to the salary achieved in alternative employment, the fisher salary for smaller vessels was 11% higher in 1997 and 55% higher in 2017.
The income tax rates for factory vessel fisheries and in alternative employment in 2017 were 44.6% and 38.2% respectively. For smaller vessels, these rates were 36.9% and 38.2% respectively, even though the income for the fisher was larger than in alternative employment. This is due to the fisher deduction in the income tax. The different rates also follow from the progression of income taxes. The income tax rates for 1997 have been identified assuming the same corporate and income tax rates as in 2017.
It appears from above that the remuneration of labour is higher in fisheries than in other sectors, while the remuneration of capital varies over time. Consequently, the socio-economic return may be positive or negative.
The socio-economic return for Faroese fishing vessels is identified for the two years in Table 3.4. It is assumed that the income tax rate and the corporation tax rate are the same in 1997 as in 2017. The reason is that the socio-economic return can be compared over time without being skewed by changes in the tax system.
| Smaller vessels | Factory vessels | |||
| 1997 | 2017 | 1997 | 2017 | |
Socio-economic return (EUR million) | ||||
| Remuneration of labour | 3.4 | 10.0 | 3.8 | 8.7 |
| Remuneration of capital | 3.1 | -3.9 | 4.6 | 8.8 |
| Public sector | -0.5 | 5.2 | 1.4 | 7.9 |
| Total | 5.9 | 11.3 | 9.7 | 25.5 |
Allocation of the socio-economic return (%) | ||||
| Remuneration of labour | 58 | 88 | 39 | 34 |
| Remuneration of capital | 53 | -35 | 47 | 35 |
| Public sector | -8 | 46 | 15 | 31 |
| Total | 100 | 100 | 100 | 100 |
Table 3.4: Size and allocation of the socio-economic return of selected Faroese fishing vessels in 1997 and 2017, EUR million and percentage.
The socio-economic return in 1997 is EUR 5.9 million for smaller vessels, corresponding to 9% of the total landing value. This rose to EUR 11.3 million in 2017. On the other hand, the socio-economic return for factory vessels rose more significantly from EUR 9.7 million in 1997 to EUR 25.5 million in 2017. The socio-economic return in 2017 rose significantly more for fisheries with the individual transferable quota than fisheries with the fishing days system. Hence, this would indicate that the management system for factory vessels led to a substantial increase in the sector’s contribution to the Faroese economy, while the management system for smaller vessels did not increase its contribution in the same way.
Earlier studies have also identified the socio-economic return of vessel groups in Faroese fisheries using the same method as above. The results of those are summarised in Table 3.5.
| Demersal vessels | Pelagic vessels | |
| Study | Nielsen et al. (2018) | Nielsen et al. (2010) |
| Year | 2012-2014 | 2007 |
| Number of vessels | 45 | 8 |
Size of socio-economic return | ||
| Value (EUR million) | -7 | 28 |
| Share of landing value (%) | -9% | 38% |
Allocation of socio-economic return (%)1 | ||
| Remuneration of labour | . | 29% |
| Remuneration of capital | . | 38% |
| Public sector | . | 33% |
| Total | . | 100% |
Note: 1. Allocations are not reported for the demersal vessels in the report. Sources: Nielsen et al. (2010, 2018). | ||
Table 3.5: Literature review of studies identifying the socio-economic return of Faroese fisheries.
The socio-economic return accounted for EUR -7 million of the landing value for demersal fishery around the Faroe Islands between 2012 and 2014, and EUR 28 million of the landing value for pelagic vessels, corresponding to 38% of the landing value in Faroese pelagic fisheries in 2007. Demersal fishery here is the same as above but for 2012 to 2014, which was not a good period for demersal fishery around the Faroe Islands.
The pelagic fleet is known to have higher earnings than the average fleet. In 2007, after the fully transferable individual quotas were introduced in 1998, the socio-economic return was 38% of the landing value. This was at the same level or higher in the following couple of years (Búskaparráðið, Faroese Economic Council 2020).
Table 3.4 shows that capital achieved the largest share of the socio-economic return for factory vessels at 47% in 1997 and 35% in 2017, while labour obtained 39% and 34%, and the public sector 15% and 31%. As there are negative numbers in the data for smaller vessels, there are no percentages for this fleet.
Although the share of capital owners is the largest for factory vessels, it has declined between 1997 and 2017. For smaller vessels, the share of the capital is negative for 2017.
For the public sector, tax revenue from fishing increased for factory vessels from EUR 1.4 million in 1997 to EUR 7.9 million in 2017 due to the larger salaries in the vessel group. For smaller vessels, the public sector had a negative result in 1997 due to lower tax income from these salaries than in alternative employment. This, however, rose to EUR 5.2 million in 2017.
The share of the socio-economic return of hired crew increased for both groups between 1997 and 2017. For factory vessels it increased from EUR 3.8 million in 1997 to EUR 8.7 million in 2017. For smaller vessels it increased from EUR 3.4 million in 1997 to EUR 10 million in 2017.
Two groups of hired crew are affected, those that remain active and those that leave fishing. The active fishers in the factory vessel group received a 179% wage rise over between 1997 and 2017 in nominal prices, and an increase of 101% when measured in fixed prices (deflated). In the smaller vessel group, fishers received a nominal increase of 94% and an increase of 39% when measured in fixed prices (deflated). Concurrently, between 1997 and 2017, total full-time employment for both vessel groups fell from 944 to 677, corresponding to a 28% decrease (Table 3.3). Those that left fishery have probably not had this kind of increase in their salaries.
It is stressed that the calculation of both the size and allocation of the socio-economic return is based on several assumptions, implying that the results are subject to uncertainty and must be interpreted with caution. These observed changes have not considered productivity increases among fishers or vessels that may have occurred over the period of the study.
References
Búskaparráðið. (2014). Búskaparrenta og tilfeingisrenta.
Búskaparráðið, Faroese Economic Council (2020), Búskaparfrágreiðing várið 2020. Búskaparráðið.
Danielsen, R., & Agnarsson, S. (2018). Fisheries policy in the Faroe Islands: Managing for failure? Marine Policy 94.
Januar. (2018). Roknskapargreiningin 2017.
Løgting. (2017). Fíggjarlóg.
Nielsen, M., Andersen, P., Ravensbeck, L. L., A. J., Kristoffersen, D., Reithe, S., . . . Ellefsen, H. (2010). Samfundsøkonomisk afkast af pelagiske fiskerier i Nordøstatlanten. Tema Nord, p. 2010:573.
Nielsen, M., P. Andersen, L. Ravensbeck, F. M. Laugesen, J. Andersen, D. M. Kristoffersen, S. Reithe, J. Nilssen and H. Ellefsen (2010), Samfundsøkonomisk afkast af pelagiske fiskerier i Nordøstatlanten, Nordisk Ministerråd, TemaNord rapport 2010:573.
Nielsen, M., Hoff, A., Nielsen, R., Andersen P., Waldo S., Hammarlund, C., Kristófersson D. M., Sævaldsson, H., Virtanen, J., Setälä, J., Roll K., Asche F., Rógvi H. and Ellefsen, H. (2018), Structural Adjustment and Regulation of Nordic Fisheries until 2025, Nordisk Ministerråd, TemaNord 2018:547.
4. Greenland
GEMBA Seafood Consulting consisting of partner Kasper Teilmann, analyst Jonathan Sandager Hansen, consultant Søren Espersen Schrøder and partner Jens Henrik Møller.
Introduction and background
Following the doubling of Greenland’s population between the 1800s and 1900s, and as seal hunting was not scalable, commercial fishing for halibut and cod was introduced in 1908 and 1917 respectively. In 1950, The Greenland Commission, set up by the Danish prime minister at the time Hans Hedtoft, submitted a report which initiated a development programme to modernise Greenlandic fishery using Danish fishery as a role model.
The Danish government financed an expansion of Greenlandic infrastructure. Furthermore, the Danish government financed fish processing factories and trawlers, which became the economic foundation of the Greenlandic society. In the mid-1960s, cod fishing experienced a downturn and was replaced by prawn fishing as the primary fishing activity (Sørensen, 2020).
After Greenland exited the EF (now the EU), the Greenlandic self-government[1]Naalakkersuisut, autonomous of Denmark, handled the regulation of fishery via the GFLK.[2]GFLK, Greenlandic Fishery and License Control Today, fishing for prawn, halibut, cod, and other species is regulated by way of quotas and licenses set by the Greenlandic self-government. The TAC is also set by the Greenlandic self-government. Greenland is a member of ICES[3]ICES, International Council for the Exploration of the Sea, an independent science and research network which advises on fishery and marine ecosystem and NAFO.[4]NAFO, Northwest Atlantic Fisheries Organization, an intergovernmental science and management body for fisheries
By 1990, the fishing industry was the primary profession in Greenland, and the sector largely influenced by government-owned companies (Sørensen, 2020). Through the adoption of the 1990 Fisheries Act, Greenland’s parliament introduced the concept of individual fully transferable quotas in shrimp fishing at sea. This was extended to also include coastal shrimp fisheries in 1997. In 2015, fishery accounted for 95.6% of Greenland’s exports, with the two most important species, prawns and Greenlandic halibut, accounting for 71.4% of Greenland’s total exports (Ögmundsson & Haraldsson, 2017).
The fishing industry is an important occupation in Greenland. In 2018, 16% of the total Greenlandic workforce had their main occupation in the fishing industry, while 29% of the workforce were occupied part time in the industry.[5]‘Main occupation’ is defined as the employment where an employee earns their highest salary. Any other employment in a given month is referred to as side employment (bibeskæftigelse)
A major part of the Greenlandic fishing industry’s fleet segments is scattered across the settlements of the country, especially dinghies, small, and mid-size vessels. Market access is challenging due to the long distances between settlements in Greenland. This means that each settlement is often dominated by one fishing corporation, which takes care of the fish landed in the settlements by the small-scale fleet (mostly dinghies). This makes fishers using small vessels very dependent on the corporations (i.e. Royal Greenland and Polar Seafoods) and the price and conditions they set in order for the individual fisher to obtain a reasonable profit.
Footnotes
- ^ Naalakkersuisut
- ^ GFLK, Greenlandic Fishery and License Control
- ^ ICES, International Council for the Exploration of the Sea, an independent science and research network which advises on fishery and marine ecosystem
- ^ NAFO, Northwest Atlantic Fisheries Organization, an intergovernmental science and management body for fisheries
- ^ ‘Main occupation’ is defined as the employment where an employee earns their highest salary. Any other employment in a given month is referred to as side employment (bibeskæftigelse)
Greenlandic fishery
In this chapter, Greenlandic fishery is presented in terms of a) fleet structure, b) fishing methods, c) landings, and d) corporate structure.
Fleet structure
The Greenland-registered vessels are categorised according to their size and are all assumed to be active vessels.
Table 4.1 shows the overall development in Greenlandic fishing vessels from 2012 to 2019.
| 2012 | 2013 | 2014 | 2015 | 2016 | 2017 | 2018 | 2019 | |
| Dinghy | 1,218 | 1,441 | 1,516 | 1,550 | 1,875 | 1,690 | 1,668 | 1,900 |
| < 10m | 175 | 193 | 138 | 129 | 129 | 119 | 122 | 137 |
| 10-20m | 132 | 149 | 117 | 123 | 120 | 116 | 116 | 117 |
| 21-30m | 20 | 19 | 17 | 17 | 15 | 16 | 17 | 15 |
| > 30m | 17 | 23 | 25 | 32 | 38 | 42 | 41 | 37 |
| Total vessels | 1,562 | 1,825 | 1,813 | 1,851 | 2,177 | 1,983 | 1,964 | 2,206 |
Table 4.1: Number of registered vessels in Greenland from 2012 to 2019
Table 4.1 shows that all vessel size categories below 30 metres are declining in number, except for dinghies. Between 2012 and 2019, the number of vessels in the ‘< 10m’ and ‘21-30m’ categories fell by around 23%, while the number of vessels in the ‘10-20m’ category fell by 11%. The 118% increase in the number of vessels in the ‘> 30m’ category indicates a trend of modernisation in Greenlandic fishery towards a bigger and possibly more efficient fleet.
Overall, the aggregate number of fishing vessels in Greenland, not counting dinghies, fell by 11% between 2012 and 2019. Including dinghies, the overall number of fishing vessels in Greenland increased by 41%. A major and important component of the registered vessels is the ‘dinghy’ category, which covers small one- to two-person vessels used for inshore fishery. According to Table 4.1, the number of dinghies has increased by 56% between 2012 and 2019. It should be noted that it is common for one fisher to own multiple dinghies for different purposes or for renting out.
Fishing methods
Figure 4.1 shows the development in the number of Greenlandic vessels grouped by the type of fishing method.
Figure 4.1: The development of different size categories of fishing vessels / Number of vessels
In recent years the number of vessels fishing with line and fishing from a dinghy has increased while the number of vessels fishing with trawl, net and pot has decreased. This development may be a sign of better profitability for the halibut and cod fisheries, which are harvested with line by dinghies. The figures also indicate that the trawl, net and pot fleet segments have contracted and, in so doing, have become more efficient.
Total landings
The national statistics bureau, Greenland Statistics, divides the landings into inshore (“indhandling”) and offshore (“havgående”) fishing. Inshore fishing is characterised by landings of whole non-processed fresh, iced fish landed by small vessels, and dinghies at shore-based collection points in the settlements. Offshore fishing is characterised by big oceangoing vessels with on-board processing facilities to cook and freeze, for example, shrimp and Greenland halibut and packaging for direct sale to the retail sector for processing.
Table 4.2 shows the total landings in Greenland from Greenlandic and foreign vessels by vessel group. The landings are stated in tonnes for each vessel group and area, offshore and inshore fishing.
Table 4.2 shows that inshore and offshore trawlers catch the largest number of fish landed in Greenland. Overall Greenlandic vessels land most of the fish in Greenland, while foreign fleets contribute around 10%. Figure 4.2 shows the development of total inshore landings according to vessel type. This statistic is only available for inshore fishing vessels.
| 2012 | 2013 | 2014 | 2015 | 2016 | 2017 | 2018 | 2019 | |
| Offshore trawler | 119,310 | 172,538 | 196,590 | 175,271 | 159,658 | 195,420 | 193,268 | 152,399 |
| Offshore trawler, foreign | 29,896 | 29,617 | 55,591 | 23,447 | 24,504 | 24,636 | 24,853 | 25,280 |
| Total offshore | 149,206 | 202,155 | 252,181 | 198,718 | 184,162 | 220,056 | 218,121 | 177,679 |
| Inshore trawler | 58,206 | 43,654 | 38,168 | 33,944 | 41,349 | 44,125 | 39,876 | 42,893 |
| Inshore vessel | 22,421 | 22,792 | 23,102 | 24,987 | 30,817 | 26,719 | 23,684 | 24,016 |
| Inshore dinghy | 25,211 | 32,537 | 33,578 | 35,228 | 42,308 | 40,614 | 37,009 | 37,887 |
| Total inshore | 105,838 | 98,983 | 94,848 | 94,159 | 114,474 | 111,458 | 100,569 | 104,796 |
| Total (tonnes) | 255,044 | 301,138 | 347,029 | 292,877 | 298,636 | 331,514 | 318,690 | 282,475 |
Table 4.2: Total landings from Greenlandic and foreign vessels in Greenland by vessel group (tonnes)
Figure 4.2: Total inshore landing value by vessel size from 2012 to 2019 (DKK thousand)
The relatively large increase in the total landing value attributed to dinghies could have several explanations. Firstly, due to an improvement in control functions, the registration of landings has increased. This may be the main reason for the increasing registered landing values. Secondly, it may be a consequence of a modernised value and logistics chain, where the options for transport and conservation, such as freezing, have improved opportunities to sell the fish to a larger market and at a better quality which, combined, raises prices and revenues. Improvements to the value chain are especially relevant to the Greenland halibut, which has experienced an 41% increase in landing volume, while the landing value has increased 84%.
Table 4.3 shows the total landing value in Greenland. Only inshore landings can be specified by vessel type, while offshore landings can be specified by total value.
| 2012 | 2013 | 2014 | 2015 | 2016 | 2017 | 2018 | 2019 | %-change 2012-19 | |
| Dinghies, dog sled etc. | 215 | 253 | 306 | 360 | 479 | 443 | 475 | 487 | 127 |
| < 10 m | 61 | 64 | 68 | 64 | 97 | 67 | 70 | 87 | 43 |
| 10 - 20 m | 171 | 179 | 185 | 188 | 243 | 214 | 226 | 261 | 53 |
| > 20 m | 371 | 373 | 353 | 414 | 470 | 451 | 531 | 608 | 64 |
| Total inshore | 818 | 869 | 912 | 1,024 | 1,288 | 1,176 | 1,302 | 1,442 | 76 |
| Offshore | 1,438 | 1,366 | 1,610 | 1,482 | 1,743 | 2,010 | 2,130 | 2,422 | 68 |
| Totals | 2,256 | 2,234 | 2,521 | 2,506 | 3,031 | 3,186 | 3,431 | 3,864 | 71 |
Table 4.3.: Total inshore and offshore landings in 1,000,000 DKK
As seen in Table 4.3, dinghies, dog sleds and the like experienced the largest increase in total landing value with an increase of 127% in 2019 compared to 2012. The other vessel size categories experienced a somewhat similar increase in total value at 43%, 53%, and 64% respectively for the groups < 10m, 10-20m, and > 20m.
To enable an analysis of the development in revenue per vessel in each vessel group, Table 4.4 provides an overview of the average value per individual vessel in each size category.
| 2012 | 2013 | 2014 | 2015 | 2016 | 2017 | 2018 | 2019 | % change 2012 to 2019 | |
| Dinghies, dog sled etc, | 176 | 175 | 202 | 232 | 255 | 262 | 285 | 256 | 45 |
| < 10m | 346 | 332 | 494 | 492 | 748 | 563 | 575 | 633 | 83 |
| 10-20m | 1,296 | 1,199 | 1,580 | 1,524 | 2,027 | 1,844 | 1,949 | 2,232 | 72 |
| > 20m | 21,805 | 16,233 | 14,101 | 12,933 | 12,361 | 10,748 | 12,941 | 16,419 | -25 |
Table 4.4: Average landing value per individual vessel, DKK thousand
Table 4.4 shows that small and mid-sized vessels have become more efficient in terms of economic performance, with the greatest increase in landing value per vessel at 83% and 72% respectively. The group of vessels that had the largest increase are those of less than 10 metres in length. In 2012, the average landing value per vessel amounted to DKK 346,000, which increased by DKK 287,000 to an average landing value of DKK 633,000 in 2019.
The development of the group of larger vessels of more than 20 metres in length is more complex, with a very strong economic year in 2012. A more stable economic average for landings per individual vessel can be seen from 2013 to 2019.
Corporate structure
Greenlandic fishery has several central fishing companies with a long corporate history in Greenland. However, it is important to underline the geographical situation in Greenland with long internal distances, a dispersed population in small settlements, and often challenging transport and logistics due to harsh winters and icy conditions. This situation underscores the importance of maintaining and developing a corporate business structure that can operate under these conditions.
One of the most important companies is Royal Greenland, which is owned by the Greenlandic self-government. Another important company is the privately owned Polar Seafood. Both companies have factory and fishing vessels able to operate offshore as well as smaller inshore fishing vessels. On shore, the two companies have different processing plants focusing on cold water shrimp, Greenland halibut, and other species. Niisa Trawl Aps, Sikuaq Trawl A/S, Artic Prime Fisheries ApS, Qaleralik A/S, Sigguk A/S, Angunnguaq A/S and Qajaq Trawl A/S are all private Greenland-based companies operating in the fishing sector, typically using larger fishing vessels. Beside these, the companies operate smaller vessels of less than 30 metres in length that are typically family owned.
A central component in the Greenlandic fishing sector is the vertical integration. For example, Royal Greenland and Polar Seafood have internal trade between the vessels and the landing points and factories. This may create a situation where it is difficult to establish the ‘right’ market price for the landed fish on which the crew remuneration is calculated, a situation which may create dissatisfaction among the crew members.
How price-setting due to vertical integration impacts the payment system for specific payment levels is not covered in this document, but it is important to understand the Greenlandic payment system against this background.
Some companies that are not based in Greenland fish in Greenlandic waters using Greenlandic licenses. For example, the fishing company Ocean Prawn A/S based in Nexø, Denmark operates in Greenlandic waters and uses the collective agreement between Danmarks Fiskeriforening PO and 3F. A share of the crew on board Ocean Prawn’s vessels lives in Greenland and are of Greenlandic origin.
Due to the licensing system, Ocean Prawn has obligations to land some shares of the catches with companies in Greenland for further processing.
Several fishing vessels from other countries such as Iceland, Canada, Lithuania, Estonia, Norway and the UK operate in Greenlandic waters, typically without Greenlandic crew on board.
Employment in Greenlandic fisheries
Greenland and the Greenlandic economy is highly dependent on the fishing industry. The fishing industry accounts for 95% of total exports. The importance of fishing is also evidenced by the large number of people employed in the industry.
In 2018, the Greenlandic workforce totalled 26,848 of which 4,332 people were employed in the ‘fishery and fishery-related industry’[1]Includes both employment in the primary catch activity as well as processing. as their main occupation. This means that approximately 16% of the total Greenlandic workforce receives their main salary from the fishery and fishery-related industry.
Data regarding employment in the fishing industry is provided by Greenland Statistics. At this point, it is not possible to segregate the data at a more detailed level than ‘the fishing industry’. Hence there are no official statistics that detail the number of fishers, people working with the processing of fish, sales, and the like. Therefore, the total number of employees in the catch sector (people directly involved in fishing activities on vessels) will be estimated below.
As an assumption, dinghies are operated by one person, though not on a full-time basis, and so this has been assessed as 0.75 FTE (full-time equivalent) per dinghy. Smaller vessels (< 10m) have been assessed as 1 FTE, while midsize vessels (10-20m) are operated by between three and five people, averaging 4 FTEs, and larger vessels (21-30m) by 7 FTEs. The big vessels that offer on-board processing usually engage around 25 people per vessel, i.e. 25 FTEs. Table 4.5 shows the assumptions for the estimation of the employment in the on-board fishing industry in 2018.
Footnotes
- ^ Includes both employment in the primary catch activity as well as processing.
| Number of vessels | People per vessel | Total people occupied | |
| Dinghies | 1,900 | 0.75 | 1,425 |
| < 10m | 137 | 1 | 137 |
| 10-20m | 117 | 4 | 468 |
| 21-30m | 15 | 7 | 105 |
| > 30m | 37 | 25 | 925 |
| Totals | 2,206 | 3,060 |
Table 4.5: Estimation of full-time equivalents (FTEs) on fishing vessels and dinghies in Greenland
This amounts to an estimated total of 3,060 people employed on board fishing vessels. With 4,332 people occupied in the fishing industry as suggested by Greenland Statistics, this estimate seems reasonable. In addition to the 4,332 people that receive their main salary from fishing and the fishing-related industry, there is a great deal of employment as a side occupation. Figure 4.3 shows the development of employment types in the Greenlandic fishing industry and illustrates the fluctuations in employment. Figure 4.3 shows that in 2018, in Greenland 7,772 people had ‘fishery or fishery-related industry’ as their primary income for at least one month of the year. This may include seasonal employment in the processing industry and activities connected to dinghies and hunting.
The statistics also suggests that 4,332 people have their main income from fishery or the fishery-related industry. This group may be the core group of those employed in the Greenlandic seafood sector. Additionally, 545 people had an income from the industry each month. The relatively large number of people who receive some income from the industry for at least one month each year indicates that the industry is largely seasonal and that weather can have a considerable impact on the activity over the year.
Based on the above calculation, from Table 4.5 and Figure 4.3, it can be concluded that the number of people involved in fishery and the fishery sector makes up a big share of the Greenlandic workforce and far exceeds the figure of 4,332 people due to a structure of seasonal and loose employment in the sector.
Wage determination system
With respect to wage determination systems, the Greenlandic fishing fleet can be divided into three main categories:
- Corporate-owned large vessels, typically involved in offshore fishing activities, like Royal Greenland and Polar Seafood, where the workforce is covered by a collective agreement;
- Smaller and mid-size vessels, typically involved in inshore fishing activities, landing in local villages and settlements without a collective agreement; and
- Dinghies, which are either owner-operated or part of a loyalty system with the bigger corporations.
Apart from vessels operated by the big corporations for which there is a collective agreement system, the wage and part-sharing system for other vessels is an informal system. Wages and part-sharing are determined from vessel to vessel and from settlement to settlement. Bear in mind that, in many cases, small-scale fishing is operated as a family business in small-scale fishing communities.
Figure 4.3: Number of people occupied in the Greenlandic fishing industry, 2008-2018
Big vessels covered by a collective agreement
The big vessels in Greenland are generally owned by bigger companies like Royal Greenland, Polar Seafood, Niisa Trawl, and the like. Royal Greenland is government-owned and has a collective agreement with the Greenlandic trade union, SIK.[1]SIK, Sulinermik Inuussutissarsiuteqartut Kattuffiat, is the biggest trade union in Greenland The collective agreement is written in Danish and covers the crew on Royal Greenland trawlers of more than 300 GT. The crew consists of various skilled and unskilled labour, both within fishery, and engine technicians.
The privately owned companies Polar Seafood Greenland and companies organised under APK[2]APK, Aalisariutinik Piginneqatigiiffiit Kattuffiat, The Greenlandic Offshore Fishing and Export Association have a collective agreement with the Faroese Maskinmeistarafelagið.[3]Maskinmeistarafelagið, a Faroese trade union for engineers also covering fishers in Greenland The agreement is written in Danish and is intended for engine technicians on board the two vessels ‘Polar Princess’ and ‘Polar Nanoq’.
Royal Greenland wage system – SIK
Specific data on the separate bonus agreements is only available for one collective agreement between SIK and Royal Greenland. The specific agreement has been in place since December 2000 and, although salaries have been adjusted for inflation, the wage system is still valid today.
For Royal Greenland crew, their wage consists of a) a fixed share determined by one of six different job positions and level of education, and b) a bonus determined by a share of the revenue from the sale of the landing, contingent on the total number of crew members.
As an example (see the appendix), a fisher aged 18 or over working on a prawn trawler receives a salary of DKK 12,440 and a bonus of 0.42% of the revenue if there are 25 persons on board the vessel. If it is a halibut boat with 25 crew members the salary is the same, but the bonus share increases to 0.62%. A few of the main job positions and salary schemes are presented in the appendix for illustrative purposes.[4]Collective agreement between Royal Greenland & SIK. A detailed overview of the wage system can be found in the appendix
Royal Greenland is the largest fishing company in Greenland. Therefore, it would be safe to assume that Royal Greenland, in some way, sets the standard and framework for the wage system, which the other companies benchmark their wages against.
Polar Seafood – Maskinmeistarafelagið wage systems for big vessels
The Faroese Engineers Union has a collective agreement with Polar Seafood and other members in The Greenlandic Offshore Fishing and Export Association (APK), apart from Royal Greenland.
Compared to the Royal Greenland agreement, the Faroese Engineers Union agreement is more performance based. The wage system in the Faroese Engineers Union agreements solely takes the form of a part-based system, where all the crew receive an equal share of a ‘crew-part’, but with the opportunity for additional parts depending on job position and experience.
The crew-part share of the value generated from the landings is 37.75% for cod and demersal fisheries, and 28% in pelagic fisheries. The landed value is the sale at the first link in the value chain, less the cost of fuel (cod and demersal fisheries only) and other related costs (transport, sales costs, insurances, taxes and fees).
This crew-part is then divided equally by the number of crew and additional parts are added as shown in Table 4.6. As an example, a chief engineer will normally receive 1 part plus 1 part (in total 2.0 parts), while a lower-ranked engineer on board may receive 1 part plus 0.5 parts (in total 1.5 parts) and a fisher with more than 18 years of experience will receive 1 part.
It is important to be aware that the function of an engineer on a Greenlandic shrimp trawler/factory is in tough competition with global labour markets for engineers on liners and container ships and the like.
Footnotes
- ^ SIK, Sulinermik Inuussutissarsiuteqartut Kattuffiat, is the biggest trade union in Greenland
- ^ APK, Aalisariutinik Piginneqatigiiffiit Kattuffiat, The Greenlandic Offshore Fishing and Export Association
- ^ Maskinmeistarafelagið, a Faroese trade union for engineers also covering fishers in Greenland
- ^ Collective agreement between Royal Greenland & SIK. A detailed overview of the wage system can be found in the appendix
| Parts | Additional parts | |
| Inexperienced u/18 | 0.50 | |
| Experienced u/18 and inexperienced o/18 | 0.75 | |
| Experienced o/18 | 1.00 | |
| Engineer | 1 | 1.00-0.25 |
Table 4.6: Part-sharing system between APK and Maskinmeistarafelagið
The performance-based nature of the wage system is further emphasised in the collective agreement between APK and Maskinmeistarafelagið, where the crew can be offset in the second fishing trip if the first fishing trip did not cover the prepayment of the wage. This means that a share of the salary is paid in advance, and if the landings in trip one are not ‘sufficient’ to cover the prepaid salary, this will be deducted from the employee’s next salary, i.e. the second trip.
In the agreement between Polar Seafood and Maskinmeistarafelagið, the crew share varies with the number of crew. The starting point in pelagic fisheries is 28% for 30 crew members with an increase/decrease of 0.45% per additional/fewer crew member. This means that if the fishing trip consists of 24 crew members, they get to share 25.30% (28-(6*0.45) = 25.30) of the landing value. When additional crew members are included on the trip, a smaller share goes to Polar Seafood. This arrangement helps to maintain the performance-based wage system. Finally, Polar Seafood crew receive a yearly bonus of 14% of the wage, which the company can withhold if there is misconduct.
Small and mid-size vessels (< 10m and 10-20m)
Small and mid-size vessels only account for 9% of total landings. The wage systems are usually very informal and based on unwritten customary rules. According to KNAPK[1]KNAPK, Kalaallit Nunaanni Aalisartut Piniartullu Kattuffiat, an interest group for Greenlandic fishers and hunters, a general wage determination system does not exist. Wage determination often takes the form of a revenue sharing system, which is determined from vessel to vessel and village to village.
There are examples of a wage sharing system among mid-size vessels, where the crew will share 45% of the landing revenue (gross) after the deduction of oil, supplies and the like, that is net landed revenue. How the 45% crew share is distributed among the crew is subject to changes and negotiation on board each vessel depending on the location and circumstances and prior to each fishing trip, although such details have not been documented.
Dinghies
In Greenland, dinghies account for a major part of total fishery in terms of value, the volume fished, and the sheer number of vessels. Dinghies are of great importance to Greenlandic fishery and social fabric, especially in relation to the vessel size and geographical distribution, and its social importance to small and remote fishing communities. Dinghies accounted for 34% of the total landed value in 2019. There is no singular wage system for this segment and the area is not regulated. Rather, this is a traditional community-based fishing operation by one or two people, often as a family operation, and is informal in nature. In this regard it should also be mentioned that due to its informal nature, there is likely to be an element of this fishery which is not accounted for officially and may be part of the ‘informal economy’ in Greenland.
There are instances where the big fishing companies such as Royal Greenland and Polar Seafood provide loans and/or help to fishers to enable them to become the operator and owner of a dinghy. In return, the loan comes with a condition that the operators sell their catch to the company (e.g. Royal Greenland[2]Greenlandic media Sermitsiaq AG, https://sermitsiaq.ag/node/199971) in the local settlement.
There are also examples of Royal Greenland financing dinghies which then are leased to local fishers. In this way, Royal Greenland and Polar Seafood broaden their resource base of fish and provide opportunities for communities that depend on the fishing industry and fishers with limited resources of their own.[3]Royal Greenland news, August 2017 and January 2018 This way of financing a dinghy ensures the fishers’ loyalty and cements a dependency between the companies and the individual operator. Instances have been described where Royal Greenland issues loans to fishers who are denied loans from the banks. Royal Greenland thereby bears the responsibility and risk of supporting local development in the settlements and villages. This aspect must not be overlooked.
Finally, many dinghies also operate in the Greenlandic fishing sector, typically owned by big local fishers. Quite often some of these fishers work with the operation of larger vessels offshore or inshore. Also, some of the dinghies have an element of seasonal and leisure activity.
Footnotes
- ^ KNAPK, Kalaallit Nunaanni Aalisartut Piniartullu Kattuffiat
- ^ Greenlandic media Sermitsiaq AG, https://sermitsiaq.ag/node/199971
- ^ Royal Greenland news, August 2017 and January 2018
Salary developments
Detailed information about the development of fishers’ salaries over the years is not available through the collective agreements. Instead, data from Greenland Statistics show the development of the average salary in the fishing industry. The salary in the fishing industry covers the whole industry, hence also people employed in processing and sales, as well as those employed on a part-time, or seasonal basis. This data is shown in Table 4.7.
The data from Greenland Statistics shows an increase of 54% in the average monthly salary in the fishing industry in the ten years between 2009 and 2018. An indexation of the average salary and total catch in tonnes and value in Table 4.8 provides a comparison between the development of salary and of fishing volumes and values.
| 2009 | 2010 | 2011 | 2012 | 2013 | 2014 | 2015 | 2016 | 2017 | 2018 | %-change 2009-18 | |
| Average income | 20,787 | 23,223 | 26,873 | 29,915 | 30,653 | 26,189 | 28,027 | 29,652 | 29,350 | 31,953 | 54% |
| Average tax | 6,117 | 6,946 | 7,894 | 8,947 | 9,225 | 8,981 | 9,717 | 10,408 | 10,410 | 11,422 | 87% |
| Tax as % of salary | 29% | 30% | 29% | 30% | 30% | 34% | 35% | 35% | 35% | 36% | 21% |
Table 4.7: Development in monthly salary and tax for people in the fishing industry (DKK)
| 2009 | 2010 | 2011 | 2012 | 2013 | 2014 | 2015 | 2016 | 2017 | 2018 | %-change 2009-18 | |
| Monthly salary | 100 | 112 | 129 | 144 | 147 | 126 | 135 | 143 | 141 | 154 | 54% |
| Landing volume | 100 | 106 | 148 | 119 | 140 | 167 | 136 | 138 | 154 | 150 | 50% |
| Landing value | 100 | 112 | 148 | 142 | 139 | 153 | 158 | 195 | 203 | 208 | 108% |
Table 4.8: Indexation of the development of fisher salary
Table 4.8 shows that, over a ten-year period, the wage has increased at the same pace as the overall development in volume, while the total value of the catch has doubled.
Market forces, professionalisation, and innovation in fishery and in seafood logistics has ensured the positive development of the landing value and hence provided an improved opportunity for fishers and fishing companies operating in the first link of the value chain to generate a greater profit. Over the same period, salaries have not kept the same pace as overall landed value, however.
Resource rent[1]Natural resource rent is generally defined as follows: “The economic rent of a natural resource equals the value of capital services flows rendered by the natural resources, or their share in the gross operating surplus; its value is given by the value of extraction. Resource rent may be divided between depletion and return to natural capital” (source: OECD, https://stats.oecd.org/glossary/detail.asp?ID=2332 ). In this chapter ‘resource rent’ is used for what could more rightly be called a ‘fishing tax’.
For several years, it has been the goal of the Greenlandic self-government to impose a new uniform resource rent system across the fishery sector. Since different resource rent systems are viewed as an administrative burden of fishery and the public administration, a simple and understandable system is needed (Ögmundsson & Haraldsson, 2017). A task force consisting of the self-government and the fishing industry, among others, was established in 2016. The work of the task force resulted in the “Report on the Resource Rent in the Greenlandic Fishery and Proposals for New Resource Rent Models” (Ögmundsson & Haraldsson, 2017).
Prior to the reform of the resource rent in 2015, the report conducted by the task force established that, in total, Greenland receives DKK 0.78 per kilo of catch in tax, while Iceland and the Faroe Islands receives DKK 0.29 and DKK 0.24 per kilo respectively. This means that Greenland receives three times as much as the two countries that appear as the most comparable countries in the region (Ögmundsson & Haraldsson, 2017).
The primary aims of the task force were to compare taxation systems in different countries and propose a revision of the resource rent in Greenlandic fishery. Additionally, the task force was to develop concrete proposals for uniform, transparent and simple models for charging resource rent from the fishery sector.
The self-government devised a new simple resource rent model valid from 1 January 2018. The resource tax rates are determined and published every quarter by the Greenland Tax Agency. The resource rent differs between catches that are landed and sold for domestic processing (indhandling) and for catches that are directly exported and not used in the Greenlandic processing industry. Furthermore, a special regulation applies to pelagic species (Naalakkersuisut, 2017).
For the first quarter of 2018, landings for domestic processing are charged a resource rent of 5% of the landing value and, if the landing value accounts for less than DKK 8 per kilo, a basic tax of DKK 0.05 per kilo is paid (Naalakkersuisut, 2017). For catches that go directly to export, the resource rent amounts to a 5% charge of the export value if the price is between DKK 12 and DKK 17 per kilo. The resource rent increases by 1% per additional DKK 1 per kilo until the price per kilo is DKK 29. Exports with a value above DKK 29 per kilo are charged a resource rent of 17.5%. If the price per kilo is lower than DKK 12, the resource rent is DKK 0.2 per kilo, which corresponds to 1.6% (Naalakkersuisut, 2017).
The resource rent of pelagic species is based on a fixed price per kilo depending on whether the vessel is Greenlandic or foreign, and depending on the species. For instance, for mackerel a Greenlandic vessel needs to pay DKK 0.40 per kilo, while a foreign vessel needs to pay DKK 1.00 per kilo. (Naalakkersuisut, 2017).
Footnotes
- ^ Natural resource rent is generally defined as follows: “The economic rent of a natural resource equals the value of capital services flows rendered by the natural resources, or their share in the gross operating surplus; its value is given by the value of extraction. Resource rent may be divided between depletion and return to natural capital” (source: OECD, https://stats.oecd.org/glossary/detail.asp?ID=2332 ). In this chapter ‘resource rent’ is used for what could more rightly be called a ‘fishing tax’.
Taxation of commercial fishers
In Greenland, income tax on salary ranges from 42% to 44% depending on the municipality.[1]Greenland Tax Agency, Tax percentages Based on data from Greenland Statistics, actual taxation on inshore fishers’ salary after deductions has grown from 29% in 2008 to 36% in 2018.[2]Greenland Statistics [FID001]
References
Collective agreement between APK and Maskinmeistarafelagið of 1 January 2006
Collective agreement between Polar Seafood Greenland A/S and Maskinmeistarafelagið of 1 March 2018
Collective Agreement between Royal Greenland and SIK of 18 December 1997. In general, collective agreements to which SIK is a partner can be accessed at https://sik.gl/da/om-sik/overenskomster/
GFLK, Greenlandic Fisheri and License Control, annual reports 2000-2006 (businessgreenland.gl)
Greenland Statistics, annual reports 1998-2019
Greenland Statistics, Inshore fishing of fish and shellfish [FID001]
Greenland Statistics, Landings of fish and shellfish by vessel group in tonnes [FID010]
Greenland Statistics, Main and side occupation among permanent residents [ARDBFB2]
Greenland Statistics, Main occupation among permanent residents [ARDBFB1]
Greenland Statistics, Offshore fishing of fish and shellfish [FID008]
Greenland Statistics, Workforce among permanent residents 18-65 years of age [ARDSTK1]
Greenland Tax Agency, Tax Percentages (aka.gl)
Naalakkersuisut (2017): Vejledning vedrørende ressourceafgift på grønlandsk fiskeri Gældende from 1 January 2018 [available online] (aka.gl)
Law on fisheries of 31 October 1996 (lovgivning.gl)
Sørensen, A. K. (2020). Grøndlands historie. Aarhus Universitet, [available online] www.danmarkshistorien.dk.
Ögmundsson, H., & Haraldsson, G. (2017). Redegørelse af ressourcerenten i det grønlandske fiskeri og forslag til nye. Nuuk: Departementet for Finanser og Skatter, Grønlands Selvstyre.
Appendix
| Fixed wage (DKK) | Bonus wage | ||||||||
| Fishing wage1 | Yard wage2 | Overtime | |||||||
| Position | Per month | Per day | Per month | Per day | Per hour | Crew | Rate (%) | Crew | Rate (%) |
| 26 | 0.4 | 21 | 0.51 | ||||||
| 25 | 0.42 | 20 | 0.54 | ||||||
| Fisher, Motorman, Mess | 12,440.13 | 414.67 | 11,809.26 | 393.64 | 102.2 | 24 | 0.44 | 19 | 0.57 |
| 23 | 0.46 | 18 | 0.61 | ||||||
| 22 | 0.49 | ||||||||
| 26 | 0.21 | 21 | 0.32 | ||||||
| 25 | 0.23 | 20 | 0.35 | ||||||
| Fisher, Mess u/18 | 8,747.15 | 291.57 | 7,593.82 | 253.13 | 65.72 | 24 | 0.25 | 19 | 0.38 |
| 23 | 0.27 | 18 | 0.41 | ||||||
| 22 | 0.29 | ||||||||
Notes: 1. Fishing wage is the minimum base salary upon which a bonus will be added. 2. Yard wage is considered a ‘waiting wage’ and is paid, for example, during port calls when crew members do not have any sailing or catch activity. A yard wage is also paid if crew members are waiting in port for the ship to be repaired. | |||||||||
Table 4.9: Extract of schedule with the minimum and bonus wage for fishers on a prawn trawler
| Wage chart, cod and halibut Fixed wage (DKK) | Bonus wage | ||||||||||
| Fishing wage | Yard wage | Overtime | Cod | Halibut | |||||||
| Position | Per month | Per day | Per month | Per day | Per hour | Crew | Rate (%) | Crew | Rate (%) | Crew | Rate (%) |
| 40 | 0.38 | 33 | 0.47 | 28 | 0.52 | ||||||
| 39 | 0.39 | 32 | 0.49 | 27 | 0.57 | ||||||
| 38 | 0.40 | 31 | 0.51 | 26 | 0.59 | ||||||
| Fisher, Motorman, Mess | 12,440.13 | 414.67 | 11,809.26 | 393.64 | 102.2 | 37 | 0.42 | 30 | 0.53 | 25 | 0.62 |
| 36 | 0.43 | 29 | 0.55 | 24 | 0.65 | ||||||
| 35 | 0.44 | 28 | 0.57 | 23 | 0.68 | ||||||
| 34 | 0.46 | 22 | 0.71 | ||||||||
| 40 | 0.18 | 33 | 0.28 | 28 | 0.3 | ||||||
| 39 | 0.19 | 32 | 0.29 | 27 | 0.32 | ||||||
| 38 | 0.21 | 31 | 0.31 | 26 | 0.37 | ||||||
| Fisher, Mess u/18 | 8,747.15 | 291.57 | 7,593.82 | 253.13 | 65.72 | 37 | 0.22 | 30 | 0.33 | 25 | 0.4 |
| 36 | 0.23 | 29 | 0.35 | 24 | 0.4 | ||||||
| 35 | 0.24 | 28 | 0.37 | 23 | 0.43 | ||||||
| 34 | 0.26 | 22 | 0.46 | ||||||||
Table 4.10: Extract of wage schedule with the minimum and bonus wage for cod and halibut fishery.
5. Iceland
Daði Már Kristófersson and Eyrún Marinósdóttir
Introduction
The Icelandic fishing industry has long been an important part of the nation’s economy. However, although its importance has declined considerably in recent years with the growth of the service and production sectors, it still accounts for more than 30% of nation’s total value of exported goods. Demersal products account for around 70% and pelagic products for around 30% (Statistics Iceland 2017). For some time now, the Icelandic authorities have been at the forefront of fisheries management by extending the EEZ and implementing IQ and ITQ management systems.
The Exclusive Economic Zone (EEZ) was extended in stages starting in 1952, reaching 200 miles in 1976. The management of pelagic species was initiated in 1969 with a total allowable catch (TAC) of Icelandic herring with individual quotas (IQ) announced in 1975, followed by capelin in 1980. A demersal ITQ management system was established in 1984. In 1990 a uniform system of ITQ covering almost all fisheries in Iceland was established, with almost full transferability of quotas for larger vessels. ITQ management for smaller coastal vessels was adopted during the first decade of this century.
Since 1990, the demersal catch has almost halved in terms of quantity, while the pelagic catch has also halved since 2000. The adjustments were mostly left to the industry, with the consolidation of quotas, the scrapping of vessels, and the closure of factories. Most of the quotas are held by vertically integrated companies that manage quotas, fisheries, and processing facilities. Specialization in fishing and processing is widespread. Fleet segments target demersal species, pelagic species, or shellfish. Vessel size has increased while the number of vessels has decreased. Most of the pelagic catch is landed by 25 vessels. A fleet of 45 stern trawlers lands 50% to 55% of the demersal catch.
Catch share pay with a set minimum is the most common system of pay in the Icelandic fleet. Agreements vary between fleet segments. In the following, we will discuss the development of fisheries in Iceland and specifically address issues related to economic development, fleet structure, and pay.
Fisheries management, catch and the fleet
Fishing around Iceland used to be open access with the participation of foreign nations until the 1950s. The Exclusive Economic Zone (EEZ) was extended in three stages between 1952 and 1976. In 1952 it was extended from three to four miles and closed off bays and fjords. An extension to 12 miles took place in 1952, increasing to 50 miles in 1972. Finally, in May 1976, Icelanders won full jurisdiction over the 200-mile EEZ, giving them full control over their fishing grounds (Hannesson 2004).
Catch in Icelandic waters
Catches of herring increased rapidly in late 1950s, reaching a peak of 690,000 tonnes in 1966. Two years later, herring stocks collapsed. In the 1970s, production increased again with capelin fisheries. It made up roughly half of the total catch in Icelandic waters some years, although the stock has been low in recent years. The demersal catch increased during and shortly after the Second World War until 1960, fished by a large fleet of smaller boats and sidewinder trawlers. Following the collapse of herring stocks in late 1960s, the herring fleet turned towards demersal fisheries, which increased the demersal catch substantially. The catch of Icelandic vessels rose again in the 1970s with the introduction of stern trawlers and the extension of the EEZ. Their number and share of the total catch increased sharply the following years; see the area under the red line in Figure 5.1. Foreign trawlers lost their most important fishing grounds following the 50- and 200-mile extensions of the EEZ. Between 1970 and 1975, the annual average demersal catch in Icelandic waters was 765,000 tonnes, of which foreign vessels accounted for 300,000 tonnes. The demersal catch of Icelandic vessels peaked in the 1980s, and since 1990 the catch has almost halved in terms of quantity.
Figure 5.1: Catch (million metric tons) of the Icelandic fleet since 1945. The area under the red dotted line represents the trawlers’ share of the demersal catch. Sidewinder trawlers until the introduction of stern trawlers in the 1970s.
The fishing fleet
Excess capacity and overcapitalization characterised the 1970s and early 1980s. The fishing effort of the fleet increased consistently from late 1960s until 1977 at the same time as vessel and engine sizes grew (Runolfsson & Arnason 2001). The previous herring fleet had a lack of activity outside the winter capelin season. This fleet of more than 200 vessels, built or renovated in the 1960s, turned to demersal fisheries using various fishing gear. In addition, stern trawlers replaced the old side winding trawlers built in the late 1940s; see Figure 5.2. The first stern trawlers began operating in Icelandic waters in 1970 and five years later there were 58 fishing in the EEZ. When Iceland gained control over the 200-mile EEZ in 1976, serious concerns were raised that demersal stocks were being overfished, especially the valuable Atlantic cod (Gadus morhua) (Palsson & Helgason 1995).
Figure 5.2: Size of the Icelandic fishing fleet since 1945 in GRT up to 1998 and GT from 1999.
Pelagic management
The collapse of the Atlantic herring in 1968 served as an alarm signal (Arnason 2005). The management of pelagic species began in 1969 with a TAC for Icelandic herring. Individual quotas (IQ) were announced in 1975 in the wake of a three-year harvesting moratorium. In 1980, quotas for capelin were introduced after warnings from fisheries biologists at the Icelandic Marine Research Institute, which raised concerns of possible overfishing (Matthiasson 2003). In 1986, the transferability of annual quotas was introduced, and in 1988 the consolidation of quotas was permitted among capelin vessels. Initial allocations in Icelandic herring and capelin fisheries were divided between vessels participating in the fisheries the previous year and with an active fishing licence for those species; that is to say, not based on previous catch history. Today when the fishing of new species commences (pelagic, demersal or crustacean) it often starts with some form of open access, with or without TAC, and then followed up by individual quota allocations based on each vessel’s catch performance in the previous three fishing periods. (Ministry of Industries and Innovation 2014).
Demersal management
Various forms of fisheries restrictions have been applied in demersal fisheries. From 1977 to 1983, effort limitations were in force, with a view to reduce fishing effort. In 1983, when the cod stock was in decline, effort limitations were abolished as fishing effort and fleet capacity had been increasing while the number of days at sea contracted (Runolfsson & Arnason 2001). At that time, Iceland’s Althing (national parliament) voted on and accepted a demersal management system with individual vessel quotas (IVQs) according to which each vessel’s allocation was based on catch performance between 1981 and 1983. The initial demersal quotas were allotted in 1984 with quotas being partly transferable with the authority of the Ministry of Fisheries. Between 1985 and 1987, an effort option was active which gave vessel operators an opportunity to boost their share of the initial allocation. This system remained in force until 1990, although vessel allocations could not be increased after 1988. The effort system made it difficult to limit total available catches for some species (Runolfsson & Arnason 2001, Arnason 1993).
Vessel renewals or enlargements were integrated into the 1984 demersal ITQ quota regulations. In 1983, all vessels fishing in Icelandic waters received fishing licences that indicated their gross registered tonnage (GRT). New licences were not issued unless a vessel of similar size in GRT was decommissioned. However, vessels added to the fleet prior to 1 January 1986 could be enlarged, under certain conditions, until 1997. If a vessel was to be renovated, either by import or newbuilding, the renovation GRT was restricted to the vessel size registered on 1 January 1985. Consequently, all newbuilding/import of vessels needed additional GRT from a vessel within the current fishing fleet; that is to say, GRT had to be bought. Restrictions controlling total fleet capacity were abolished in 1999. From this point, renovation/newbuilding of vessels could be carried out without additional cost (Runolfsson & Arnason 2001, Lög um stjórn fiskveiða nr. 38/1990, Runolfsson 1999). Since then the fleet has been gradually modernised through the import of both newly built and used vessels.
1990 uniform fisheries management
The uniform system of individual vessel quotas (ITQ) established in 1990 covered all fisheries in Iceland, except coastal fishing with hook and line. It combined fundamental laws and regulations regarding fisheries into a comprehensive Fisheries Management Act (No. 38/1990) which entered into force in 1991. Since then, legislation relating to demersal, pelagic and crustacean species has been combined into a single act, allowing the majority of ITQs to be almost freely transferable. This is a move which has motivated the consolidation of fishing rights. Smaller boats of less than 10 GRT were outside the demersal ITQ system between 1984 and 1990 and during this period their number rose sharply (Runolfsson 1999). Boats of less than 10 GRT were outside the ITQ system from 1984 but were included in 1990 (Ministry of Industries and Innovation 2014). Smaller boats of less than 6 GRT were left out and only permitted to catch with hooks and line. The majority of these boats were integrated into the ITQ system in two stages, in 2001 and 2004.
Current management system
The structure of the Icelandic ITQ system is still like the initial uniform system implemented in 1990. The fisheries act was reformed in 2006 resulting in the current Fisheries Management Act no. 116/2006. According to the Fisheries Management Act, the TAC is issued annually by regulation of the Minister of Fisheries upon the recommendations of the Marine Research Institute. The TAC is valid for one fishing year, a twelve-month period commencing on 1 September each year. All species subject to the system are issued with a TAC. Finally, the annual vessel catch quota (harvesting right) is issued by the Directorate of Fisheries based on a vessel’s share of the current TAC (permanent quota share). The annual and permanent quotas for each species are divisible and transferable among vessels with fishing licences (Ministry of Industries and Innovation 2014).
All vessels participating in commercial fishing in the Icelandic EEZ need a fishing permit. There are two types of permit: a general catch quota and a hook-and-line catch quota. Each vessel may only hold one type of fishing permit for each fishing year. In general hook-and-line catch quotas may only be used for long-line and hand-line fishing. For two months of the year they can use gillnets for lumpfish fishing (Ministry of Industries and Innovation 2014). The catch from vessels with hook-and-line catch quotas is made up of demersal species. In recent fishing years, vessels with general catch quotas have been allocated about 90% of the quotas, calculated in cod-equivalent kilos.[1]A cod-equivalent kilo is a special conversion factor to assess all species at the same value as cod, which always equals one. All species are calculated annually by the Directorate of Fisheries. Example: If the cod-equivalent kilo of haddock is 0.71 it means that 1.40 kilos of haddock equal 1 kilo of cod (1/0.71), or the value haddock is 71% of value of cod. (Ministry of Industries and Innovation 2014, Directorate of Fisheries 2014a). Vessels with hook-and-line catch quotas are allocated the remaining 10%, but this fleet has more than 17% of the total issued quota of Atlantic cod (Directorate of Fisheries 2017a).
The vessels with current hook-and-line catch quotas were outside of the 1984 demersal ITQ quota regulation as this fleet mainly targets demersal species. In 1990 the size of these vessels limited to 6 GRT, before being increased to 15 GRT in 2002 and 30 GRT in 2013, with a maximum length of 15 metres. The hook-and-line catch quotas were issued in 1996, 2001 and 2004. all segments of the Icelandic fleet have since been issued with ITQ quotas. Later (2009) an open-access coastal jigging system was introduced. Restrictions apply to quota trading between vessels with general catch quotas and vessels with hook-and-line catch quotas. Hook-and-line vessels can freely transfer quotas within their system and from vessels with general catch quotas. However, to prevent the consolidation of fishing rights, the hook-and-line quotas cannot be transferred to vessels with general catch quotas.
In 1998, a maximum quota share was introduced which restricts a company’s quota allowance, commonly named a ‘quota ceiling’. The ceiling was introduced to reduce the ongoing consolidation of quotas and to prevent a handful of firms controlling all the fishing in the country. The current maximum quota share is 12% of the total issued quota in cod-equivalent kilos. For individual species, the ceiling is normally 20%, but for certain species it reaches 35%.
Footnotes
- ^ A cod-equivalent kilo is a special conversion factor to assess all species at the same value as cod, which always equals one. All species are calculated annually by the Directorate of Fisheries. Example: If the cod-equivalent kilo of haddock is 0.71 it means that 1.40 kilos of haddock equal 1 kilo of cod (1/0.71), or the value haddock is 71% of value of cod. (Ministry of Industries and Innovation 2014, Directorate of Fisheries 2014a).
Literature review
The initial 1980s IQ and later the 1990s ITQ system has been a controversial issue in Iceland. The system has been harshly criticised and different forms of fisheries management have been the subject of intensive political debate. Several matters of opinion have been brought to court and even to the UN Human Rights Committee (Hannesson 2004, Ministry of Industries and Innovation 2010). In 2009, a reconciliation committee was established on behalf of the Ministry of Fisheries to identify matters of dispute and to put forward a proposition regarding a future revision of the 2006 Fisheries Management Act. The committee’s report was issued in 2010 (Einarsson 2011). Since then, a major policy review has not yet been passed in the Althing. Revisions of fisheries legislation were also carried out by committees between 1991 and 1993, and between 1999 and 2001 (Ministry of Industries and Innovation 2001, Eythórsson 2000).
The fishing industry has been and still is an extremely important part of the rural economy of Iceland. Since 1984, structural changes have steadily emerged following the optimisation of the fleet’s efficiency, which sought to reduce harvesting costs and increase profitability (Hannesson 2004, Arnason 2005, Arnason 1993, Runolfsson & Arnason 2001), (Eythórsson 2000, Gissurarson 2000, Arnason 2002, Yagi et al. 2012, Christensen, Hegland & Oddsson 2009). Restrictions on quota transferability within the uniform ITQ system were lifted in 1990, encouraging the optimisation of the industry. The consolidation of quotas following sales or mergers resulted in fewer vessels and factories, thus reducing investment and employment opportunities within the industry (Eythórsson 2000, Skaptadottir 2000). Transferability also resulted in quota displacements between geographical regions, negatively affecting some fishing communities (Eythórsson 2000, Yagi et al. 2012, Skaptadottir 2000, Eythórsson 1996, Danielsson 1997). In 1998, a maximum quota share was introduced to restrict a company’s quota allowance in terms of total catch share, as well as individual species (Ministry of Industries and Innovation 2014). A few large, vertically integrated companies have strengthened their quota holdings since 1990 (Arnason 2005, Palsson & Helgason 1995, Runolfsson & Arnason 2001), (Eythórsson 2000, Bjorndal, Child & Lem 2014, Directorate of Fisheries 2017a).
The concentration of quotas into fewer hands has been on the public agenda in Iceland and within the literature since early 1990. Criticism concerning quota consolidation has been along similar lines regarding the demersal and pelagic industry. Concerns were raised that demersal fishers were becoming tenants, leasing the quotas and reducing their income as the number of smaller ITQ quota holders contracted and the larger companies increased their share (Palsson & Helgason 1995, Eythórsson 2000, Eythórsson 1996). Others maintained that, although the number of companies and owners had decreased, the number of shareholders and, therefore, owners had risen in parallel with the listing of fishing corporations on the Icelandic stock exchange (Runolfsson & Arnason 2001, Gissurarson 2000, Runolfsson 1997). The listing of fishing companies commenced in 1991 and increased sharply until 1997, peaking at 24 companies in 1999. Most of these companies were deregistered between 2000 and 2008, primarily owing to mergers and as former owners bought them back. Only one company was listed on the stock exchange in 2015 (Baldursson & Gunnlaugsson 2004, Gunnlaugsson 2014).
Figure 5.3: Division of all quotas in cod-equivalent kilos, issued at the beginning of each fishing year which commences 1 September each year. This series represents the consolidation of demersal stocks quite well, as it contains all demersal quotas in the EEZ issued at the beginning of the fishing year. Most of all straddling stocks and species in foreign EEZs are issued at the beginning of the calendar year.
Fewer restrictions on quota transferability in the 1990s enabled the industry to rationalize. Since 1990, the demersal catch has almost halved in terms of quantity. Icelandic authorities left it to the fishing industry to adjust to reduced quotas. The quota consolidation measured in cod-equivalent kilos rose sharply between 1997 and 2000 following a prolonged period of reduced quotas; see Figures 5.1 and 5.3. Small privately-owned companies were bought or merged with other companies. The buyers, often vertically integrated companies, manage quotas, fisheries, and processing facilities. The larger companies merged to operate their processing facilities year-round with enough raw material. Since 2007, the 25 major companies have controlled approximately 55% of the total demersal quotas issued each fishing year. During this three-decade period, industry focus has as well turned from catch quantity to value maximization, with a focus on product quality and full utilization of the whole fish.
The structure of the Icelandic pelagic industry has changed even further. Initial capelin quotas were issued to 42 companies in the autumn of 1980. Most of the companies were privately owned and only a quarter of them linked to enterprises within the pelagic processing industry. Since the year 2000, the pelagic catch has almost halved. Quota concentrations increased continuously between 1997 and 2007, when the privately-owned companies were bought or merged with other companies; see Table 5.1. There are only 11 pelagic oriented companies left, which additionally manage more than one-third of all demersal fishing rights (Directorate of Fisheries 2017a). A maximum quota ceiling applies to capelin and herring. Three companies currently reach the maximum 20% ceiling (Ministry of Industries and Innovation 2014). This ceiling will certainly affect future mergers of companies, thus restricting further consolidation. Moreover, in accordance with Act 98/1998, only Icelandic nationals and/or entities under the control of Icelandic parties can participate in Icelandic fisheries (Ministry of Industries and Innovation 2014).
| Year | Companies | Capelin | I-herring | A-herring | Blue Whiting | Mackerel |
| 1982 | 41 | 100% | - | - | - | - |
| 1992 | 33 | 100% | 18% | - | - | - |
| 2002 | 26 | 100% | 88% | 97% | 99,7% | - |
| 2012 | 11 | 99% | 99% | 100% | 100% | 82% |
| 2012 | 8 Major | 94% | 93% | 92% | 86% | 68% |
| 2012 | 5 Major | 74% | 71% | 63% | 62% | 53% |
| 2012 | 3 Major | 55% | 53% | 40% | 51% | 34% |
| 2012 | Largest | 20% | 20% | 13% | 5% | 13% |
Table 5.1: Pelagic companies’ consolidation, capelin as the fundamental species.
Other matters of dispute can be narrowed to three issues in random order:
- Initial quota allocation and difficulties encountered by newcomers trying to enter the industry: The demersal quotas were allotted in 1984 for free to a restricted number of individuals and companies that owned vessels with active fishing licences. Since then, entrance limitations have applied which has resulted in dissatisfaction (Palsson & Helgason 1995, Eythórsson 2000, Gissurarson 2000). The scarce quotas are expensive (Arnason 2008, Saevaldsson 2007) making it very difficult for newcomers to enter the industry unless they are wealthy or have inherited vessels and quotas.
- Property rights and wealth creation by quota trading: In the wake of the increased transferability of quotas in 1990, the system created wealth in the form of valuable fishing rights (Hannesson 2004, Eythórsson 1996, Arnason 2008). Holders of quotas gain wealth by selling their share at a sizable profit (Gunnlaugsson et al., 2020). This has created dissatisfaction and given rise to claims of inequality, uneven distribution of common rights, and the privatization of these rights (Palsson & Helgason 1995, Yagi et al. 2012, Eythórsson 1996). The opponents of the system cite the first Article of the Fisheries Management Act No. 116/2006, amended in 1988, which states: “[T]he exploitable marine stocks of the Icelandic fishing banks are the common property of the Icelandic nation.”(Ministry of Industries and Innovation 2014).
- Fishing fee and property rights: The fee was initially set in 2002 but did not become valid until 2004 (Lög um stjórn fiskveiða nr. 38/1990, Matthiasson 2008). It remained below EUR 0.03 per cod-equivalent kilo until 2010 when it was increased to EUR 0.04. The fee was raised significantly again in 2012 to EUR 0.06 per kilo. In 2012 a special fee, based on companies’ profit, was levied on top of the normal fee amounting to EUR 0.14 to EUR 0.17 per cod-equivalent kilo (Gunnlaugsson et al., 2018). In 2013 the special fee was EUR 0.04 for companies in demersal industry and EUR 0.24 for the pelagic industry (Directorate of Fisheries 2017b). The size of the fees (Figure 5.4) has been a source of friction. The quota holders want a minimal fee while others maintain that fees should at least cover the cost of monitoring catches, enforcing regulations and conducting fisheries research plus a certain amount for the use of common property (Hannesson 2004, Gissurarson 2000, OECD 2011, Matthiasson 2008). The fishing fee raised EUR 52.2 million in 2014, around 5.9% of the fishing vessel catch value and 3.3% of the value of seafood exports (Directorate of Fisheries 2017b). The fishing fee has been an important source of income for the Icelandic government since 2012, constituting of between 1.5% and 1.7% of the total revenue of the treasury (Fjársýsla Ríkisins 2017a, Fjársýsla Ríkisins 2017b, Gunnlaugsson et al. 2018).
Figure 5.4: Annual tax revenue from the fishing sector, 2010 to 2017.
Figure 5.5 shows the development of resource rents from 1997 to 2017. The figure clearly shows the vast improvement in economic outcomes during the period.
Figure 5.5: Annual resource rents and share of export value between 1997 and 2017.
Various measures have been taken to tackle the opposition to the ITQ system. The most important include the allocation of some quotas to individual communities following structural changes (Byggdakvoti) (Christensen, Hegland & Oddsson 2009, OECD 2011, Directorate of Fisheries 2017c). In 2003, approximately 0.4% of the total demersal quota was allocated to support rural communities adapting to structural changes. This has grown gradually, reaching around 2.0% in 2015. In addition, the entry of newcomers into the fishing industry has been encouraged since 2009, allowing a certain category of vessel to participate in coastal fisheries using jigging reel only (Strandveidar) (Directorate of Fisheries 2014b). Initially, 4,000 tonnes were allocated to this category to the catch quotas. In 2015, coastal fishery permits were issued for approximately 8,600 tonnes in cod equivalents of demersal fish, or around 2.0% of Icelandic demersal quotas. Finally, quotas have been allocated to long-line fisheries, baited onshore with fishing trips lasting no longer than 24 hours (Linuivilnun) (Directorate of Fisheries 2014c). In the past few years, long-line fishery permits have been issued for around 5,500 tonnes in cod equivalents of demersal fish, or around 1.5 % of Icelandic demersal quotas. The aim of these measures is to bolster employment in outlying coastal communities where much of Icelandic fisheries originated. The above measures did not cover the pelagic fishing industry until 2012. Up until then, no quota had been allocated to outlying coastal communities for pelagic species. This is probably because catching and processing pelagic species is more capital intensive than demersal fisheries. Consequently, it is easier to recommence the fishing and processing of demersal species to support employment in the outlying communities that participate in structural changes.
Fleet data
This section describes historical and current statistical and economic data for four fleet segments. With a smaller demersal catch in the 1990s and fewer pelagic quotas as of 2000, the focus of the industry has turned from catch quantity to value maximisation and full utilisation of the whole fish. Improvements have been made to the preservation of the raw material with increased chilling on board the vessels, and to processing in order to maintain quality and extend the shelf life of fresh and frozen products.
Fleets specialisation and increased profit
Specialisation in fishing and processing is widespread in Icelandic fisheries. Fleet segments target demersal species, pelagic species, or shellfish. Most of the demersal catch is landed by stern trawlers either fresh or frozen at sea. Stern trawlers are large vessels, normally over 42 metres in length. Other important groups of vessels are large, long-line vessels and the smaller costal fleet. Pelagic fish are normally caught using vessels 60 to 80 metres long, capable of carrying up to 3,000 metric tonnes per trip in chilled storage rooms. Profitability and efficiency have risen substantially in the industry. The use of fully automated processing with the latest computer technology is widespread. Improvements and innovations in transportation and logistics have also increased efficiency with the use of temperature-controlled containers, better storage boxes, and readily available refrigerated warehouses. The availability of air cargo capacity has also greatly increased, supporting a huge rise in the export of chilled fresh fish products (Knutsson et al., 2016).
Icelandic stern trawlers
The first stern trawlers started operating in 1970 when they replaced the older fleet of sidewinder trawlers. Five years later there were 58 of them fishing in the EEZ and their fishing effort increased sharply. With the stern trawlers, the availability of raw material began to match the capacity of demersal processing facilities over the year. Previously, the majority of the annual catch was landed by smaller boats during the winter fishing season. The stern trawlers’ proportion of the demersal catch increased sharply to more than 50% of the total catch. The fleet size was restricted with the 1984 partly transferable quota system. The stern trawlers’ catch per vessel peaked in the 1980s and reduced almost continuously until the late 1990s when excess capacity was removed. Adjustments were not centralised by the authorities but were mostly left to the companies. The industry has, in many ways, adapted well. Part of the fleet was converted to freezer trawlers in the 1980s and 1990s. The uniform ITQ system made the majority of ITQs almost freely transferable, which led to consolidation. Since then, the number of trawlers and companies has decreased almost continuously. From 2010, the processing of fresh fish at land-based facilities has increased to the detriment of frozen-at-sea vessels. The catch per vessel has increased sharply in recent years to 5,000 tonnes in 2015.
| 1970 | 1975 | 1980 | 1985 | 1990 | 1995 | 2000 | 2005 | 2010 | 2015 | ||
| Stem trawlers | Fresh fish vessels | 3 | 58 | 87 | 102 | 109 | 65 | 51 | 36 | 29 | 26 |
| Frozen at sea vessels | 7 | 29 | 47 | 33 | 29 | 28 | 19 | ||||
| Total stem trawlers | 3 | 58 | 87 | 109 | 138 | 112 | 84 | 65 | 57 | 45 | |
| Annual catch | 600 | 172,000 | 377,000 | 342,000 | 371,000 | 278,000 | 226,000 | 275,000 | 223,600 | 225,000 | |
| % All demersal catch | 0.1% | 39% | 56% | 57% | 54% | 53% | 53% | 53% | 51% | 49% | |
| Catch per vessel | 200 | 3,000 | 4,300 | 3,100 | 2,700 | 2,500 | 3,200 | 4,200 | 4,100 | 5,000 | |
| Sidewinder trawlers | Fresh fish vessel | 22 | 6 | ||||||||
| Total side winder trawlers | 22 | 6 | |||||||||
| Annual catch | 80,000 | 11,000 | |||||||||
| % All demersal catch | 17% | 2% | |||||||||
| Catch per vessel | 3,700 | 1,700 |
Table 5.2: Fleet of stern trawlers, fresh and frozen-at-sea, and their precursor sidewinder trawlers (catch in tons and number of vessels).
Pelagic vessels
Until the mid-1990s, the only pelagic species in Icelandic waters were capelin and Icelandic summer spawning herring. The capelin normally accounts for more than 80% of the annual pelagic catch. Since 1995, three other pelagic species have entered the Icelandic EEZ: the blue whiting, the Atlanto-Scandian herring, and the Atlantic mackerel. Initial quotas for capelin were issued in 1980 which simultaneously restricted vessel size, that is to say that vessels could not be added to the fleet without vessels of an equivalent size being decommissioned. Restrictions controlling total fleet capacity were abolished in 1999. Transferability of permanent quotas was allowed among capelin vessels in 1988. This triggered the consolidation of quotas and the number of vessels declined as companies merged their vessels’ quotas. In 1990, the pelagic fleet merged to adhere to the uniform ITQ system, with almost full transferability. The years between 1995 and 2005 were record years in terms of the pelagic catch. The number of vessels increased until 2000, after which the fleet size declined sharply, both in terms of numbers and quotas. Pelagic companies have adjusted to these changes, with the scrapping of several vessels and the closure of several fishmeal factories since 2005. At the same time, the positives include an increase in processing directly for human consumption, with the industry aiming for value instead of quantity.
| 1970 | 1975 | 1980 | 1985 | 1990 | 1995 | 2000 | 2005 | 2010 | 2015 | ||
| Pelagic vessels | Fresh fish vessels | 63 | 107 | 53 | 52 | 44 | 43 | 47 | 30 | 18 | 20 |
| Frozen at sea vessel | 3 | 10 | 8 | 5 | |||||||
| Total pelagic vessels | 63 | 107 | 53 | 52 | 44 | 42 | 50 | 40 | 26 | 25 | |
| Average vessel capacity (tons) | 280 | 290 | 710 | 760 | 840 | 830 | 1,050 | 1,400 | 1,650 | 1,800 | |
| Annual catch | 243,000 | 535,000 | 827,000 | 1,043,000 | 757,000 | 1,000,000 | 1,439,000 | 1,136,000 | 596,000 | 845,000 | |
| Catch per vessel | 3,900 | 5,000 | 15,600 | 20,100 | 17,200 | 23,300 | 28,800 | 28,400 | 22,900 | 33,800 |
Table 5.3: Fleet of pelagic vessels, fresh and frozen-at-sea (catch in tons and number of vessels).
Statistical and economic data of the fleet segments utilised in the model are provided in Tables 5.2 and 5.3 as an average of the numbers for 2012 to 2014. The fleet consists of two groups: the demersal and pelagic fleet, which are then further divided into two sections: fresh and frozen-at-sea. Demersal fresh fish vessels focus on cod, while vessels with frozen-at-sea facilities are more equally distributed among other species. It is a similar story for the pelagic fleet, with frozen-at-sea focusing on Atlantic mackerel and fresh fish vessels targeting capelin.
Payment system
Generally, Icelandic commercial fishers are paid catch shares. This has secured them a share of the high profitability of the fishing sector, making fishers among the best-paid professions in Iceland. Figure 5.6 shows a comparison of wages between fishers and selected professions.
Figure 5.6: Wages for selected professions in Iceland.
Groups of fisher participants
Employed fishers are grouped as one, regardless of their station on board. They have very similar pay systems with the difference mostly being how big of an extra share they receive. There are more differences based on the type of fisheries they take part in, the size of their vessel and type of gear. Self-employed fishers mostly use small boats and determine their own salary. They can be quota-owners or lease most or all of their catch quota, only owning their vessel.
Most of the quota is, however, owned by companies as mentioned above. Quotas are mostly allocated to vessels, which can be run independently or by vertically integrated companies. Fish processors without quotas buy their fish from auction markets or make agreements with vessel operators to buy their catch.
Determination of fisher pay
Fisher pay is primarily determined by crew shares, which are a percentage of catch value based on collective agreements between organisations of vessel operators/owners and fishers. If the catch value does not reach a certain minimum, fishers get a fixed salary. One share is based on a deckhand share. Skippers normally get one extra share (can be less for the smallest boats), first mates and main engineers get half an extra share, while the cook, second mate or engineer get a one-quarter extra share. The third mate or engineer, boatsmen, netting men and supervisors on freezer trawlers also have some extra shares (Samtök fyrirtækja í sjávarútvegi & Sjómannasamband Íslands 2017). Fisher pay depends greatly on catch value and how the catch value is determined.
Catch value
All vessel operators, except for freezer trawlers, must make a formal agreement with the crew of each vessel on the fish price or how the catch will be sold. There is a collective agreement for the minimum catch price for cod, haddock, redfish and saithe for direct sales in vertically integrated companies (Samtök fyrirtækja í sjávarútvegi & Sjómannasamband Íslands 2017). It can also influence the determination of catch value in different types of sales, such as development quota catches (Reglugerð um úthlutun byggðakvóta nr. 995/2021). The minimum price is negotiated on a monthly basis by an official committee with representatives from fishers and vessel owner organisations. The price of other species is negotiated with each crew separately. In some sense, the catch value can be considered an agreement of pay rather than of the price of fish.
For companies not vertically integrated or if part of the catch is sold to someone else, the vessel operator negotiates the price in direct sales, or the catch is sold in auction markets, domestically or abroad.
Deductions from catch value
Before the crew shares are calculated, vessel operators can deduct various costs. They can deduct operating costs, which is a fixed percentage linked to the global market price of oil. A maximum cost of 30% of catch value (Lög um skiptaverðmæti nr. 24/1986) has been most common for over a decade, with a temporary clause of 0.5% less deduction from 2017-2020, for direct sales in vertically integrated companies. For freezer trawlers it is a little less or a little more depending on whether sales are FOB or CIF. Other deductions include auction costs (around 5%), the cost of investment in new vessels (up to 10%) if the catch value is high enough, and the cost of transportation and customs for auction markets abroad (around 15% to 20%) with auction costs (Samtök fyrirtækja í sjávarútvegi & Sjómannasamband Íslands 2017).
For smaller vessels under 30 GRT and 15 metres in length, although operators can only deduct auction costs and transport costs to auction markets abroad, they can also deduct the cost of gutting on land if the catch is sold at auction (SSÍ, FFSÍ, VM & Landssamband smábátaeigenda 2012).
Differences across different types of fisheries
Crew share percentages per deckhand differ mostly by the size of the vessels in terms of gross registered tonnage, fishing gear, and crew size for each fishing trip. For trawlers, their length is also considered, but for freezer trawlers the shares depend mostly on the number of crew (Samtök fyrirtækja í sjávarútvegi & Sjómannasamband Íslands 2017).
A rule of thumb is that the smaller the boat, the higher the percentage of catch value per deckhand, but the catch is of course significantly less. Vessels of less than 30 GRT and 15 metres in length which qualify for the hook-and-line quota system, have a separate agreement that depends mostly on the number of crew. If the hooks are baited on land, the shares are less per deckhand. There are also differences in extra shares per station; if there are very few on board they have less of an extra share (SSÍ, FFSÍ, VM & Landssamband smábátaeigenda 2012). The crew should be able to choose which agreement is used.
Fishers who own their vessel and/or quota determine their own pay. They may not be paying themselves as high a salary as they should, for example for tax reasons (Nielsen et al., 2017). They also have a reputation of receiving quotas at no cost in exchange for a lower price of fish.
Negotiators of work and pay conditions
The negotiation of work and pay conditions at the national level is primarily in the hands of fisher organisations (SSÍ), engineer organisations (VM) and skipper/mate organisations (FS) on the one side, and the Federation of Icelandic Fishing Vessel Owners (LÍÚ), now combined with the Federation of Icelandic Fish Processing Plants (SF) under the current name of Fisheries Iceland (SFS), on the other side, together with the Confederation of Icelandic Enterprise (SA). This major collective agreement sets the minimum wages for all employed fishers.
A special collective agreement for employed crews on smaller vessels was finally reached in August 2012 (SSÍ, FFSÍ, VM & Landssamband smábátaeigenda 2012). At the time, the upper size limit was less than 15 GRT, thought to correspond to 12 metres in length at most. This was also the size limit for the hook-and-line quota system. In July 2013, the upper legal size limit for the hook-and-line quota system was changed to less than 30 GRT and 15 metres in length. There was some debate as to whether the agreement would follow the change in size limit. This not only affects pay systems but also which of the vessels can go fishing in the event of a fisher strike. According to a ruling of the Icelandic Labour Court (Félagsdómur nr. 1/2017, the agreement can include vessels up to 30 GRT and 15 metres in length.
Negotiations
The duration of collective agreements is usually set at around two years but can have a much longer actual duration. The current agreement is from February 2017 and followed ten weeks of fisher strikes, with the previous agreement set in January 2009 and expiring in January 2011 (Landssamband íslenskra útvegsmanna & Sjómannasamband Íslands 2008). Negotiations on new agreements were stalled by COVID-19 restrictions in 2021, and in February 2021 the negotiations were referred to the State Conciliation and Mediation Officer. As of September 2021, the fishers have terminated the negotiations. Future developments are unclear.
Role of public authorities
Over the years, the Icelandic government has regularly stepped into debates and negotiations in many ways. Fisher strikes have sometimes been stopped by law and been subject to arbitration, and there have been a number of attempts to introduce some sort of law regarding fish price and fisher pay (Matthiasson, 2020).
In 1998, the Directorate of Fresh Fish Price was established, working alongside an appointed price ruling committee of representatives established from earlier debates. The agenda was to ensure public surveillance of fisher pay. Its main objective is to survey fish prices and to ensure that the objectives of the collective agreements are upheld, thus promoting fair wages for fishers (Frumvarp til laga um Verðlagsstofu skiptaverðs og úrskurðarnefndar sjómanna og útvegsmanna nr. 13/1998). One of the biggest issues at the time the directorate was established was the deduction of the cost of quota buying or leasing from catch value before the calculation of crew shares, which is prohibited by law and agreements. Although this is not as big a problem today, the issue still exists. Another issue was the price of catches between vertically integrated companies. This remains one of the biggest outstanding issues, especially for pelagic fisheries.
Interviews with key players in Iceland
Interviewees:
- Örn Pálsson, CEO of the National Association of Small Boat Owners (LS/Landssamband smábátaeigenda)
- Pétur Hafsteinn Pálsson, CEO of Vísir hf. (vertically integrated fisheries company) and board member of Fisheries Iceland (SFS/Samtök fyrirtækja í sjávarútvegi)
- Hólmgeir Jónsson, CEO of the Icelandic Fishers Union (SSÍ/Sjómannasamband Íslands)
- Árni Bjarnason, chair of the Ships Officers Association (FS/Félag skipstjórnarmanna)
- Guðmundur Helgi Þórarinsson, chair of the Icelandic Union of Marine Engineers and Metal Technicians (VM/Félag vélstjóra og málmtæknimanna)
- Anonymous, trawler fisher
Interviewees one and two represent vessel/quota owners, while interviewees three to six represent fishers. Interviewees one to five are all representatives in the official price ruling committee (úrskurðarnefnd sjómanna og útvegsmanna) and take part in collective agreement negotiations. The interviews took place between 23 and 29 March 2021 and were conducted and summarised by Eyrún Marinósdóttir.
Unions and owners associations
There is a rich tradition of unionisation in Iceland, and this is no different for fishers. Almost all employed fishers are members of a union. Smaller unions are widely distributed across the country, each members of the national fishers union (except for two smaller, newer independent unions) and affiliated with the Icelandic Confederation of Labour (ASÍ). Skippers and mates (officers) have a separate union, as do the marine engineers. Fishers have the same unemployment benefits from the Unemployment Insurance Fund (a governmental institution) as workers in other industries. A tax deduction for days at sea was removed in 2014 after being available to fishers for 60 years.
Many vessel/quota owners are also members of associations. The most prominent is Fisheries Iceland, which merged the former federations of vessel owners and processing plants. It is a member of the Confederation of Icelandic Enterprise (SA). Owners of small boats have their own organisation. A debate on size limits for the hook-and-line quota system resulted in the establishment of the Association of Smaller Vessel Operators in 2013, and now a debate on the setting of lumpfish quotas is sparking another split from the National Association of Small Boat Owners.
Pay negotiations
Negotiations are not very regular and there can be long periods of time where only rather insignificant parts of collective agreements are updated. The connection to export prices and exchange rates can make the agreements more flexible to change than in other industries.
Negotiation of work and pay conditions at the national level is essentially in the hands of chairpersons and CEOs of the unions and owners associations. In the latter stages, board members, working fishers and company owners step into the debate. If an agreement cannot be achieved, the matter is referred to the State Conciliation and Mediation Officer (SCMO).
If that fails to result in an agreement, the next step is historically a fisher strike. The strikes have either resulted in agreements, or have been stopped by law and met with arbitration. The interviews somewhat reflected the current status of negotiations, as the last agreement expired in December 2019 and the dispute has been referred to the SCMO.
Development of negotiations
Representatives of both fishers and vessel/quota owners feel that the implementation of the ITQ system has had a big impact on how negotiations have developed. The ensuing optimisation of the fleet and processing that led to vertically integrated companies covering the whole value chain has changed the emphasis of the negotiations. The companies feel like the fishers are not only getting their share of the catch value, but also of all the company profits resulting from investments in processing technology and marketing and the like.
Fishers, on the other hand, feel that companies lower the catch value to keep them from getting their fair share. This is evident to them when the catch is landed in other Nordic countries or foreign ships land their catch in Iceland for a higher price. In their view, the companies hold all the information of the value chain leaving fishers in the dark and not believing the price of the fish. There is a lack of transparency, which leads to suspicion and dissatisfaction among fishers. There is also a large gap between the parties on pension payments and government fees (fishing fee, carbon taxes) which companies believe should impact the fishers’ share. The fishers do not agree.
There are further debates relating to optimisation and technological developments, namely the question of the number of fishers on board. It is a complicated issue that involves safety, workload and share of the catch value. And companies get bigger, wealthier and more powerful, there is a sense that the fishers feel disrespected and treated unfairly. They feel like some (emphasis on some) companies wield power out of their reach, leading to intimidation and a lack of respect. Overall, the debates seem to be getting tougher and harsher.
Specialties versus traditional knowledge
Extra shares for specialist positions on board are part of the system. The best officers and engineers are those who adapt to the most modern technology and information at any given time. The job of skippers has shifted from trying to catch the most, to trying to have the best management on board the ship. Engineers feel that the companies and even the skippers do not understand the need for more training given the rapid evolution of technology and the ‘fourth industrial revolution’. Most representatives feel that more traditional knowledge also has value and there is a great demand for experienced fishers.
Reactions to headline conclusions
1. Fishers are well paid compared to other industries (except for a certain segment, where the pay is lower than the pay of a skilled worker).
All the leaders of the fishers unions generally agreed with this statement. For a deckhand on a good ship, with little formal education, this is by far the best chance they have for a high paying job. And it should be well paid: the work is hard and dangerous, with long hours and extended periods away from home, handling a very valuable material. It requires a certain amount of sacrifice and if it wasn’t well paid, you wouldn’t do it. However, there can be big differences depending on the type of fishing and the ship’s quota status. The representatives for vessel/quota owners had similar observations.
The representative of the engineers union and the individual fishers interviewed argued that although the pay was generally good, it’s not that much for the hours put in, compared to jobs on land, be they specialist jobs or not.
2. The introduction of ITQ-like management systems has led to substantial increases in levels of remuneration for fishers, irrespective of their job on board.
This statement is not perceived to be true by fisher representatives. Stories of fishers having the money to buy two new cars or a small apartment after a short pelagic season are prevalent. They feel like fleet optimisation following the introduction of the ITQ system has mostly benefitted the vessel/quota owners and that the fishers’ share of the catch value has decreased. Even if it hasn’t, they feel that their share has decreased by lowering the catch value in vertically integrated companies.
The representatives of vessel/quota owners somewhat agreed with the statement, the difference being that more secure, year-round jobs are now available for fishers.
For the representatives of small boat owners, it really depends on the ship’s quota status and whether the operator is vertically integrated or not. Independent vessel operators normally get a higher price for their catch and, as bigger companies have been buying quotas from the jig and line system, they are getting fewer and fewer. They even wonder why fishers haven’t argued more against this pricing system.
3. The introduction of ITQ-like management systems has led to capital accumulation among vessel/quota owners and to a highly improved fisheries economy (higher profitability).
This statement was uncontested by all participants. They all perceive this as being very true, although the representative for small boat owners feels they have been left behind in some ways. Because of this accumulation, the position of bigger companies is so strong that it is becoming nearly impossible for small boat owners to add to their quota status. If there is the will to keep the fleet diverse, this must be regulated.
In the view of the representative for vertically integrated companies, the introduction of the ITQ system saved fish stocks and the companies. For the most part, the companies are now secure, thriving and resilient, and this profitability provides an opportunity for investing in new technology, marketing and innovation. They feel that people mostly agree that the Icelandic fishing industry is doing things the right way. The disagreement revolves around the stakeholders, the owners, and the form of ownership. Such a discussion should take place and would not harm the companies. What is harmful are statements about changing the management system, too much taxation, the auction of quotas and the like, which leads to uncertainty within the industry.
Fishers generally feel there has been too much accumulation of quotas, wealth and power within very few companies. Quotas have been treated like any other property for decades now, despite the Fisheries Management Act stating that the stocks are the common property of the nation. Instead, the government implemented a fishing fee, causing a dispute between fishers and vessel/quota owners as to who should pay the price.
Rent calculations
Iceland introduced an individual tradable quota system in its most important fisheries in 1991, as described above. This system has since been introduced in all but a small open access coastal fishery. Gunnlaugsson and Agnarsson (2019) showed that it took several years before resource rents started emerging in fishery. This is most likely because the Icelandic fishing industry was dealing with an accumulated need for consolidation, capacity reduction, and dwindling catches during this period.
Profitability has been very good since 2009. For this reason, we are comparing 1991 (the initial year of the ITQ system) with the results of 2000, 2010, and 2019. Account data and other data for commercially active Icelandic fishing vessels is shown in Table 5.4.
| 1991 | 2000 | 2010 | 2019 | |
| Account data (EUR million) | ||||
| Turnover | 745 | 861 | 844 | 1,104 |
| Variable costs | 610 | 694 | 620 | 848 |
| Depreciation | 97 | 125 | 51 | 58 |
| Salary costs | 301 | 231 | 225 | 317 |
| Profit before interest and taxes | 38 | 42 | 173 | 198 |
| Financial costs | 64 | 108 | 58 | 51 |
| Profit before taxes | -26 | -66 | 115 | 147 |
Other data | ||||
| Assumed remuneration of capital in alternative use (% of physical assets) | 4.8% | 4.8% | 4.8% | 4.8% |
| Number of commercially active vessels | 984 | 892 | 818 | 760 |
| Corporation tax rate (%) | 10 | 18 | 20 | 20 |
| Physical assets (EUR million) | 651 | 837 | 342 | 390 |
| Other assets1 (EUR million) | 634 | 2,994 | 1,651 | 1,947 |
| Total assets (EUR million) | 1,284 | 3,830 | 1,994 | 2,337 |
| Rate of return on total assets (%) | -2.0% | -1.7% | 5.8% | 6.3% |
| Rate of return on turnover (%) | -3.4% | -7.7% | 13.6% | 13.3% |
Note: 1. Other assets are mostly quota holdings. | ||||
Table 5.4: Account data and other data for commercially active Icelandic fishing vessels for 1991, 2000, 2010, and 2019.
Table 5.4 shows poor profitability in 1991 and 2000. This outcome is pretty typical for the period. The fishing companies were dealing with reductions in quotas and cuts in capacity following mismanagement in the years prior to the introduction of the quota system. Some years were better, others worse. The consolidation can be seen in the changes in assets, mostly quotas, as well as the reduction in the number of vessels (Knutsson et al., 2016). Things change dramatically for the better in 2010. Profits improved considerably and have mostly remained very high, with the exception of 2017 (data not shown in the table).
For the fishing sector, the capital is based on the value of the physical assets of the vessels including the hull, engine, gear, and the like. Remuneration of capital in alternative use measures the rate of return of other companies in the Icelandic economy, as described by Gunnlaugsson and Agnarsson (2019) and Gunnlaugsson et al. (2020). The rate of return in alternative use is assumed to be 4.8%, as estimated by Gunnlaugsson et al. (2020).
Data on employment, salary, and income taxes are shown in Table 5.5.
| 1991 | 2000 | 2010 | 2019 | |
| Calculated full-time employment in fisheries | 6,100 | 6,100 | 5,100 | 4,900 |
| Actual average annual salary in fisheries (EUR) | 49,386 | 49,435 | 52,015 | 64,596 |
| Income tax rate of actual salary (%) | 31.45 | 31.45 | 31.45 | 31.45 |
| Annual salary of fishers in alternative employment (EUR) | 36,313 | 41,482 | 34,394 | 45,798 |
| Income tax rate of alternative salary (%) | 31.45 | 31.45 | 31.45 | 31.45 |
Table 5.5: Calculated full-time employment and gross average salary of crew in actual and alternative employment and income tax rates of these incomes, annual price level, 1991, 2000, 2010 and 2019.
The number of full-time employees and wages in fishing and for general industrial workers, as a measure of alternative employment, has been calculated using data from Statistics Iceland, available at www.hagstofa.is.
The observed annual income of fishers of EUR 64,596 in 2019 per full-time employee is 41% higher than the income of non-specialist workers in the Icelandic economy, who receive an annual income of EUR 45,798. It also represents a significant increase from the roughly EUR 50,000 that fishers made in 1991 and 2000.
The remuneration of labour is higher in fisheries than in other sectors, while the remuneration of capital varies over time. Consequently, the socio-economic return may be positive or negative. The socio-economic return for commercially active Icelandic fishing vessels has been identified for the four years in Table 5.6. It is based on calculations from Gunnlaugsson et al. (2000) and differs slightly from the data presented in Table 5.4. This is due to the fact that most Icelandic fishing companies are vertically integrated. The prices of fish are therefore not true prices, but rather figures used to calculate fishers’ wages. It is assumed that resource rents only occur in fisheries and that the profitability of fish processing should be no greater than in other industries in Iceland, that is to say 4.8%. The calculations have therefore been corrected for transfer pricing possibly occurring within Icelandic fishing companies between fishing and processing. Figure 5.7 shows the share of rents as estimated going to fishing operations and processing operations.
Figure 5.7: The share of resource rents going to fishing (the remaining rents going to processing operations) for Icelandic fishing companies from 1997 to 2019. Rents have been calculated by Statistics Iceland using imputed cost of capital.
As seen in the figure, the share of rents attributed to fishing declined during the period. It is, however, difficult to see why this might be happening. Fish processing should not generate resource rents. The most likely explanation is that fish prices for trade within vertically integrated companies do not fully reflect their value. Rent calculations must therefore be adjusted in such a way as to account for the fact that the official fish price does not fully reflect the value of fish. This is done by estimating the fish price as the highest price that fish processors could pay and still maintain the same profitability as Icelandic companies on average.
The calculation of rents to the government has been based on the sum of tax revenue and the fishing fees introduced in Iceland in 2009.
| 1991 | 2000 | 2010 | 2019 | |
| Socio-economic return (EUR million) | ||||
| Remuneration of labour | 74 | 40 | 93 | 89 |
| Remuneration of capital | -37 | -86 | 197 | 223 |
| Public sector | 34 | 30 | 68 | 89 |
| Total | 71 | -16 | 358 | 401 |
Allocation of socio-economic return (percentage) | ||||
| Remuneration of labour | 69 | 57 | 26 | 22 |
| Remuneration of capital | -34 | -123 | 55 | 56 |
| Public sector | 31 | 43 | 19 | 22 |
| Total | - | - | 100 | 100 |
Table 5.6: Size and allocation of the socio-economic return of commercially active Icelandic fishing vessels in 1991, 2000, 2010, and 2019, EUR million.
The overall socio-economic return in 2019 (Table 5.6) is EUR 401 million, corresponding to 36% of the total landing value. The socio-economic return in 2010 and 2019 is much higher than in the early years of the system. During this period, there were some interesting shifts in the relative distribution of rents to labour, capital, and the public. Rents in general increased substantially after 2010. Most of this increase goes to capital, but some of it to fishers and the public. The relative distribution of rents has therefore changed dramatically since 2010. The share to capital has increased while the share to fishers and the public has declined. Although the amount of rent to the government has increased substantially with the introduction of a special fishing fee in 2009, the declining share to the public in total rent has led to a heated public debate in Iceland regarding resource rents and their distribution.
The socio-economic return is higher than the profit. It has already been discussed that the calculations have been adjusted for the lack of a market price in determining fishing revenue in vertically integrated companies. This also reveals that the individual transferable quota system has led to the capitalization of future earnings in the quota holdings as shown in Table 5.4. The implication is that part of the socio-economic return has been moved away from the fisheries as former fishers left the sector. This is discussed in detail in Gunnlaugsson et al. (2020).
It is worth noting that the estimation of the size and allocation of the socio-economic return is based on several assumptions, as listed in the text. The results are therefore subject to uncertainty and must be interpreted with caution.
References
Arnason, R. (1993). The Icelandic individual transferable quota system: A descriptive account. Marine Resource Economics, 8(3), 201-218.
Arnason, R. (2002). A review of international experiences with ITQs: Annex to future options for UK fish quota management. Portsmouth: University of Portsmouth.
Arnason, R. (2005). Property rights in fisheries: Iceland’s experience with ITQs. Reviews in Fish Biology and Fisheries, 15(3), 243-264.
Arnason, R. (2008). Iceland’s ITQ system creates new wealth. The Electronic Journal of Sustainable Development, 1(2), 35-41. Retrieved from https://dlc.dlib.indiana.edu/dlc/bitstream/handle/10535/3176/arnason.pdf?sequence=1&isAllowed=y
Baldursson, E., & Gunnlaugsson, S. (2004). Sjávarútvegur í kauphöllinni: Saga og greining. Reykjavík: Kauphöll Íslands.
Bjorndal, T., Child, A., & Lem, A. (2014). Value chain dynamics and the small-scale sector: Policy recommendations for small-scale fisheries and aquaculture trade (FAO Fisheries and Aquaculture Technical Paper no. 581). Retrieved from http://www.fao.org/fileadmin/user_upload/fisheries/docs/Value_chain_dynamics_and_the_small-scale_sector.pdf
Christensen, A. S., Hegland, T. J., & Oddsson, G. (2009). The Icelandic ITQ system. In K. H. Hauge & D. C. Wilson (Eds.), Comparative evaluations of innovative fisheries management: Global experiences and European prospects (pp. 97-118). New York: Springer.
Danielsson, A. (1997). Fisheries management in Iceland. Ocean & Coastal Management, 35(2), 121-135.
Directorate of Fisheries. (2017). Úthlutað aflamark fyrri ár (Annual quota allocation). Retrieved from (Icelandic only) http://www.fiskistofa.is/aflamarkheimildir/uthlutadaflamark/fyrriar/
Directorate of Fisheries. (2014a). Fisheries management. Retrieved from http://www.fiskistofa.is/english/fisheries-management/
Directorate of Fisheries. (2014b). Strandveiðar (Quota to coastal fisheries). Retrieved from (Icelandic only) http://www.fiskistofa.is/fiskveidistjorn/umfiskveidistjornunarkerfid/strandveidar/
Directorate of Fisheries. (2014c). Línuívilnun (Quota to onshore bated long-line). Retrieved from (Icelandic only) http://www.fiskistofa.is/fiskveidistjorn/linuivilnun/
Directorate of Fisheries. (2017a). Úthlutað aflamark fyrri ár (Annual catch quota previous years). Retrieved from (Icelandic only) http://www.fiskistofa.is/aflamarkheimildir/uthlutadaflamark/fyrriar/
Directorate of Fisheries. (2017b). Veiðigjöld (Fishing fees). Retrieved from (Icelandic only) http://www.fiskistofa.is/fiskveidistjorn/veidigjold/
Directorate of Fisheries. (2017c). Byggðakvóti (Quota to offset major disturbances within the system). Retrieved from (Icelandic only) http://www.fiskistofa.is/veidar/aflaheimildir/byggdakvoti/
Einarsson, N. (2011). Fisheries governance and social discourse in post-crisis Iceland: Responses to the UN Human Rights Committee’s views in case 1306/2004. In G. Alfredsson & T. Koivurova (Eds.), The Yearbook of Polar Law: Vol. 3 (pp. 479-515). Leiden: Martinus Nijhoff.
Eythórsson, E. (1996). Theory and practice of ITQs in Iceland: Privatization of common fishing rights. Marine Policy, 20(3), 269-281.
Eythórsson, E. (2000). A decade of ITQ-management in Icelandic fisheries: Consolidation without consensus. Marine Policy, 24(6), 483-492.
Félagsdómur nr. 1/2017. Retrieved from (Icelandic only) https://felagsdomur.is/default.aspx?pageid=347c3bb1-8926-11e5-80c6-005056bc6a40&id=223552aa-d7d4-4b86-90a0-6f6b22c67e54
Fjársýsla Ríkisins (2017a). Ríkisreikningur 2014. Retrieved from http://www.fjs.is/media/rikisreikningur/Rikisreikningur-arid-2014-Heildaryfirlit-Rafraenundirritun.pdf
Fjársýsla Ríkisins (2017b). Ríkisreikningur 2013. Retrieved from http://www.fjs.is/media/rikisreikningur/Rikisreikningur-arid-2013,-Heildaryfirlit---Rafraen-undirritun.pdf
Frumvarp til laga um Verðlagsstofu skiptaverðs og úrskurðarnefndar sjómanna og útvegsmanna nr. 13/1998. Retrieved from (Icelandic only) https://www.althingi.is/altext/122/s/1025.html
Gislason S.G., 2017. Taxation on Icelandic fisheries. BSc thesis. University of Iceland. https://skemman.is/bitstream/1946/32959/1/Skattspor%20-%20%c3%8dslenskur%20sj%c3%a1var%c3%batvegur%20-%20Loka%c3%batg%c3%a1fa.pdf
Gissurarson, H. H. (2000). Overfishing: The Icelandic solution. Retrieved from https://iea.org.uk/wp-content/uploads/2016/07/upldbook16pdf.pdf
Gunnlaugsson, S. (2014). Fisheries companies within the Icelandic stock exchange 2004-2013. Unpublished data.
Gunnlaugsson, S.B. Saevaldsson, H., Kristofersson, D. And Agnarsson, S., 2020. Resource Rent and its Distribution in Iceland’s Fisheries. Marine Resource Economics, 34(3): (287-288).
Gunnlaugsson, S.B. and Agnarsson, S., 2019. Late arrival: The development of resource rent in Icelandic fisheries. Fisheries Research 214:126-135
Gunnlaugsson, S.B.; Kristofersson, D. and Agnarsson, S. 2018. Fishing for a fee: Resource rent taxation in Iceland’s fisheries. Ocean & Coastal Management Volume: 163 Pages: 141-150.
Hannesson, R. (2004). The privatization of the oceans. Cambridge: MIT Press.
http://px.hagstofa.is/pxen/pxweb/en/Atvinnuvegir/Atvinnuvegir__sjavarutvegur__skip/SJA05002.px
ICES. The International Council for the Exploration of the Sea: Catch statistics. [Data set]. Retrieved from https://www.ices.dk/data/dataset-collections/pages/default.aspx
Jónsson, G., & Magnússon, M. S. (1997). Hagskinna: Icelandic historical statistics. Reykjavík, Iceland:
Knútsson, O., D. Kristofersson & H. Gestsson, 2016. The effects of fisheries management on the Icelandic demersal fish value chain. Marine Policy, 63(4): 996-1012.
Landssamband íslenskra útvegsmanna & Sjómannasamband Íslands (2008). Kjarasamningur milli Landssambands íslenskra útvegsmanna og Samtaka atvinnulífsins annars vegar og Sjómannasambands Íslands hins vegar, fyrir báta, togara og vinnsluskip, January 1, 2009 – January 1, 2011. Reykjavík. Retrieved from (Icelandic only) https://www.sfs.is/efni/kjaramal
Lög um skiptaverðmæti nr. 24/1986. Retrieved from (Icelandic only) https://www.althingi.is/lagas/151a/1986024.html
Lög um stjórn fiskveiða nr. 38/1990. Retrieved from (Icelandic only) http://www.althingi.is/lagas/132a/1990038.html
Matthiasson, T. (2003). Closing the open sea: Development of fishery management in four Icelandic fisheries. Natural Resources Forum, 27(1), 1-18.
Matthiasson, T. (2008). Rent collection, rent distribution, and cost recovery: An analysis of Iceland’s ITQ catch fee experiment. Marine Resource Economics, 23(1), 105.
Matthiasson, T. (2020). Splitting the catch, remuneration of Icelandic fishermen in a sea of change. Marine Policy, 117(2020), 103959.
Ministry of Industries and Innovation. (2001). Niðurstöður nefndar um endurskoðun laga um stjórn fiskveiða ásamt fylgiskjölum. Retrieved from (Icelandic only) http://www.atvinnuvegaraduneyti.is/media/Skyrslur/Nidurst-nfd-um-endursk-l-um-stjorn-fiskveida-asamt-fylgiskjolum.pdf
Ministry of Industries and Innovation. (2010). Skýrsla starfshóps um endurskoðun á lögum um stjórn fiskveiða: Álitamál, greiningar, skýrslur og valkostir við breytingar á stjórn fiskveiða. Retrieved from (Icelandic only) http://www.atvinnuvegaraduneyti.is/media/Skyrslur/meginskyrsla_uppsett_lokaeintak.pdf
Ministry of Industries and Innovation. (2014). Act on fisheries management as subsequently amended: Act no. 116, 10 August 2006. Retrieved from http://extwprlegs1.fao.org/docstemanord2022-515.pdfice3455.pdf
Ministry of Industries and Innovation. (2014). Act no. 98, 8 April 1998.
Nielsen, M., Waldo, S., Hoff, A., Nielsen, R., Asche, F., Blomquist, J., Bergesen, O., Viðarsson, J. R., Sigurðardóttir, S., & Sveinþórsdóttir, R. (2017). Employment and salary of Nordic coastal fishermen. Report from the Nordic Council of Ministers, TemaNord 2017:558.
OECD. (2011). Fisheries policy reform: National experiences. doi:10.1787/9789264096813-en.
Palsson, G., & Helgason, A. (1995). Figuring fish and measuring men: The individual transferable quota system in the Icelandic cod fishery. Ocean & Coastal Management, 28(1), 117-146.
Reglugerð um úthlutun byggðakvóta til fiskiskipa á fiskveiðiárinu 2021/2022 nr. 995/2021. Retrieved from (Icelandic only) https://www.reglugerd.is/reglugerdir/eftir-raduneytum/atvinnuvega--og-nyskopunarraduneyti/nr/0995-2021
Runolfsson, B. (1997). Regional impact of the individual transferable quotas in Iceland. In L. Jones & M. Walker (Eds.), Fish or cut bait! The case for individual transferable quotas in the salmon fishery of British Columbia (pp. 65-89). Vancouver: Fraser Institute.
Runolfsson, B. (1999). On the management measures to reduce overcapacity in Icelandic fisheries. A short report for the Ministry of Fisheries. Retrieved from http://www.hi.is/~bthru/Capacity.pdf
Runolfsson, B. (2000). Aflahlutdeildir og eignarhald útgerða (Catch quotas shares and companies’ ownership). Retrieved from (Icelandic only) https://notendur.hi.is/bthru/Audlindanefnd1.pdf
Runolfsson, B., & Arnason, R. (2001). Initial allocation of ITQs in the Icelandic fisheries (FAO Fisheries Technical Paper no. 411). Retrieved from http://www.fao.org/docrep/005/y2684e/y2684e05.htm
Runolfsson, B., & Arnason, R. (2001). The effects of introducing transferable property rights on fleet capacity and ownership of harvesting rights in Iceland’s fisheries (FAO Fisheries Technical Paper nr. 412). Retrieved from http://www.fao.org/docrep/005/y2498e/y2498e04.htm
Saevaldsson, H. (2007). Áhrifaþættir á verð þorskaflaheimlda (B.Sc dissertation). Retrieved from (Icelandic only) http://skemman.is/handle/1946/815
Saevaldsson, H. (2014). Icelandic pelagic vessels carrying capacity & age & fishmeal factories total output 1991-2013. Unpublished data.
Samtök fyrirtækja í sjávarútvegi & Sjómannasamband Íslands (2017). Kjarasamningur milli Samtaka fyrirtækja í sjávarútvegi og Samtaka atvinnulífsins annars vegar og Sjómannasambands Íslands hins vegar, fyrir báta, togara og vinnsluskip, February 1, 2017 – December 1, 2019. Reykjavík. Retrieved from (Icelandic only) https://www.ssi.is/kjaramal/kjarasamningur-milli-ssi-og-sfs/
Skaptadóttir, U. D. (2000). Women coping with change in an Icelandic fishing community: A case study. Women’s Studies International Forum, 23(3), 311-321.
SSÍ, FFSÍ, VM &Landssamband smábátaeigenda (2012). Kjarasamningur milli SSÍ, FFSÍ og VM annars vegar og Landssambands smábátaeigenda hins vegar um kaup og kjör á smábátum, August 29, 2012 – January 31, 2014. Reykjavík. Retrieved from (Icelandic only) https://www.ssi.is/kjaramal/kjarasamningur-fyrir-smabata/
Statistics Iceland. (2017). Catch and catch value by type of landing and fish species 1982-2016 [Data set]. Retrieved from
Statistics Iceland. (2017). Exports of some major commodities (SI classification) 1840-2016 [Data set]. Retrieved from http://px.hagstofa.is/pxen/pxweb/en/Efnahagur/Efnahagur__utanrikisverslun__1_voruvidskipti__01_voruskipti/UTA06105.px
Statistics Iceland. (2017c). Decked vessels and trawlers 1999 [Data set]. Retrieved from
Yagi, N., Clark, M. L., Anderson, L. G., Arnason, R., & Metzner, R. (2012). Applicability of Individual Transferable Quotas (ITQs) in Japanese fisheries: A comparison of rights-based fisheries management in Iceland, Japan, and United States. Marine Policy, 36(1), 241-245.
6. Norway
Sigbjørn L. Tveteraas
Introduction
The Norwegian fishing industry has undergone an extensive period of restructuring motivated by the sustainability goals promoted by the government. These sustainability considerations are linked to:
- the sustainable management of stock as implemented through harvesting rights;
- the wellbeing of local communities, in particular with regard to job security;
- profitability; and
- the resource rent.
Although the reduction in the number of vessels and fishers may be detrimental to some communities, it is also clear that fisheries that previously relied on government subsidies are unsustainable. In this respect, Asche et al. (2018) argues that the three pillars of sustainability are not in conflict with each other, but rather reinforce each other. This observation is supported by a recent study by Danielsen and Arnarsson (2020) which provides an empirical case study of Faroese fisheries.
A key challenge for fisheries policy makers is to define how far restructuring should go. Iversen et al. (2018) suggest two answers at different ends of the political spectrum:
- Maximum restructuring in a manner that allows one to extract the greatest possible of the resource rent for the benefit of society, versus
- Minimal restructuring so that, through overcapacity, the industry contributes to employment in coastal societies and in a way that slows down the speed of transition and friction.
However, restructuring has been necessary due to the technological changes that have taken place in recent decades (Iversen et al., 2018). A fundamental element in the restructuring is that it allows fishers to transfer fishing quotas from two vessels to one vessel. Although this reduces capacity and results in the capitalisation of the remaining vessels (Iversen et al., 2018), Nøstbakken (2012) questions the efficiency of this latter investment behaviour. In any case, as Iversen et al. (2018) shows, there has been a significant increase in investments in the vessels that remain in fishery, and this is bound to affect the pay of commercial fishers.
The reason why commercial fishers’ salaries are influenced by capitalisation is because their salaries are based on a revenue sharing system, the ‘lay’ system (‘lott’ in Norwegian, which can loosely be translated as the ‘part’ system). Most fishers in Norway are self-employed with salaries based on a share of revenue (i.e. the lay). Although fishers may also have a fixed income component, as a rule the lay is the main source of income. Consequently, if the vessels become more efficient in catching fish, the expected revenue and the fishers’ income should increase. Evidence seems to confirm this and will be discussed in more detail later, in addition to the other related factors that influence salary levels in fisheries.
Norwegian fishery structure
Norwegian fisheries can be divided into:
- a pelagic ocean fleet dominated by purse seiners in terms of fishing quotas. This fleet segment targets herring and mackerel as the two most important species, but there are also sizeable catches of blue whiting; and
- a fleet segment which consists of coastal vessels that target cod and other whitefish (haddock, saithe, flounder etc.) and, compared to the pelagic fleet, is dominated by many small vessels.
The different structure in the two fisheries with respect to the types of vessels also has implications for the wage determination system. Although both fisheries have a lay system, that is to say a revenue-sharing system, the way this is calculated differs between the two fisheries. This is discussed in more detail below. First, we will describe the fisheries and their structures.
Figure 6.1 shows the development in the number of vessels in the fisheries. The reduction in the number of vessels is largely a result of reforms that have allowed fishing quotas to be concentrated among fewer vessels. The large reduction of vessels in the early 2000s is primarily a consequence of the introduction of an annual fee to maintain a vessel registered as a fishing boat. Since many smaller vessels (i.e. less than 10 metres in length) were inactive, many of their owners chose not to pay the fee and, consequently, around 5,000 boats were removed from the register. In addition, between 2002 and 2009, coastal vessels that did not have the opportunity to restructure (i.e. below 15 metres in length) were offered the opportunity of scrapping aid financed by the Norwegian government and a fee on first-hand sales of fish. This led to the removal of 243 boats. In addition to this, the reform has been the main driver for the concentration of fishing quotas among fewer vessels.
Figure 6.1: Number of registered vessels in Norwegian fisheries
A consequence of the reduction in vessels is that the number of fishers has also decreased. Figure 6.2 shows how the number of fishers has decreased between 2000 and 2019. It includes both those who have fishery as their main or secondary occupation[1]Main occupation: At least NOK 100,000 in annual income from fishery. The time spent in other occupations cannot exceed two-thirds of working time. Earnings from occupations other than fishery cannot exceed NOK 300,000. Earnings from fishery must be at least twice the income from other occupations.Secondary occupation: Salary from fishery must exceed NOK 50,000 but be less than NOK 400,000. Cannot be employed full time in another occupation (e.g. it is not possible to have two occupations that mean working more than 100%) . Overall, the number of active fishers decreased from around 20,000 in 2000 to around 11,000 in 2019.
Footnotes
- ^ Main occupation: At least NOK 100,000 in annual income from fishery. The time spent in other occupations cannot exceed two-thirds of working time. Earnings from occupations other than fishery cannot exceed NOK 300,000. Earnings from fishery must be at least twice the income from other occupations.Secondary occupation: Salary from fishery must exceed NOK 50,000 but be less than NOK 400,000. Cannot be employed full time in another occupation (e.g. it is not possible to have two occupations that mean working more than 100%)
Figure 6.2: Number of fishers in Norway by main and secondary occupation
Norwegian fisheries are regulated by restricted access, which implies that all participating vessels must be registered with fishing rights or licenses. Vessels are allocated quotas with total allowable catch quotas in place to regulate the overall fishing effort. As such, the key fisheries in Norway can be considered to be sustainably managed (Iversen et al., 2018). This is also reflected in landing figures, as volumes remain relatively stable. Unsurprisingly, catches of pelagic species are more volatile. Figures 6.3 and 6.4 show landings based on value and volume. While volumes of cod landings have remained relatively stable, first-hand prices have increased over the years, increasing the overall value of cod landings. Meanwhile, prices of pelagic species (mostly herring and mackerel) vary considerably depending on the total size of the landings. This makes sense given that Norway is a key global supplier of herring and Atlantic mackerel, for which there appear to be few (if any) close substitute products. This countercyclical price effect has a revenue-stabilising effect that creates more stable conditions for fishers and their income.
Figure 6.3: Value of fishery landings
Figure 6.4: Volume of fishery landings
Wage determination system
The wage system for fishers is relatively egalitarian, based on the ‘lay‘ revenue sharing system. Income is shared equally among the participating fishers with any differences a reflection of experience. The ‘lay’ is the revenue resulting from selling the fisheries catch. In Norway, collective agreements between fishers’ unions and the boat owners federations detail how the lay is to be distributed between the boat owner and the fishers (Bergland & Pedersen, 1999). For the coastal fleet, the collective agreements are between the crew section and boat-owner sections in Norges Fiskarlag (The Norwegian Fishermen’s Association), while for the trawler and purse seine fleet the agreement is between Norsk Sjømannsforbund (The Norwegian Seafarers Union) and Det Norske Maskinistforbund (Norwegian Union of Marine Engineers) on the one side, and Fiskebåt – Havfiskeflåtens forbund (The Norwegian Boat Owners Association and High Sea Fleet Association) on the other.
Two types of revenue sharing scheme are used. Coastal fisheries using conventional fishing gear apply the net income to calculate the lay, whereas for pelagic fisheries the lay is calculated from the gross revenue. Bergland and Pedersen (1999) discuss why the two fisheries apply different lay calculations. Firstly, in the pelagic fleet, the use of larger and more mobile vessels results in comparatively more predictable catches, that is to say less ‘risk in catch volumes’. In addition, and as discussed above, the price also helps to stabilise incomes in those fisheries. Secondly, pelagic fishing vessel companies are often listed on the stock exchange and may therefore be less reliant on risk-sharing with crew than what is the case for the smaller vessels in coastal fisheries.
In the coastal fisheries, Norges Fiskarlag (The Norwegian Fishermen’s Association) details the distribution of the lay based on the fishing gear used, vessel length (feet) and storage volume (m3), and the number of fishers on board. For example, for a vessel of 30ft in length with 6m3 of storage using line fishing and with two fishers on board, the lay should be 60% of net revenue (Norges Fiskarlag, 2019, p.22). After the deduction of operating costs, the two fishers (one being the owner) should share 60% of the net revenue, while the vessel receives 40%. Although there is a tradition of sharing the lay equally among the fishers, considerations such as experience and responsibilities can affect distribution. For example, an apprentice will typically receive half of what the regular fishers receive.
There is also a scheme to guarantee a minimum salary. This is triggered if the salary is below NOK 2,550 per week during the fishing period – that is the period in which there is fishing activity. The daily payment is calculated as 0.024 times the annual salary, as long this is does not exceed around NOK 600,000. The scheme is little used. The most common users are fishers in the Nordland county of Northern Norway using small vessels and nets (Svorken, Hermansen & Isaksen, 2012). The scheme does not appear to be misused and works as intended (Svorken, Hermansen & Isaksen, 2012).
Figure 6.5: Average nominal annual fisher income by groups of vessel types.
Figure 6.5 shows the income development of fishers based on the type of fishing vessel. The highest income groups are fishers on board large cod trawling vessels, and pelagic vessels using purse seine or trawls. Conversely, the lowest income levels are the coastal fisheries based on conventional gear and seine, which are also smaller compared to the trawl and purse seine vessels. Consequently, capitalisation and economies of scale seem to play an important role in determining fisher pay.
As shown in Figure 6.5 all the vessel segments have had a positive income development. The rate of income growth exceeds inflation, meaning it also represents real income growth.
The average income level in fisheries has been high relative to the average income level nationally in Norway in recent years (Figure 6.6). This underscores the fact that current economic conditions are good for fishers and there is no indication of recruitment difficulties (Sønvisen, Johnsen and Vik, 2017). This suggests that the findings in Nielsen et al. (2018) about fishers being well off remains true to this date.
Figure 6.6: Fishers’ pay compared to average income level in Norway.
Figure 6.7: Average nominal annual fisher income levels by vessel size in cod/whitefish fisheries.
The role of vessel size is even clearer in Figure 6.7, which includes coastal vessels using traditional gear and cod trawlers. These fleet segments normally target cod and other demersal whitefish species. Fishers’ average income increases with vessel size and, for the largest cod trawlers, exceeds NOK 2 million per fisher for 2017 and 2018, while for the smallest vessels it was just above NOK 460,000 per fisher in 2018.
However, the effect of capitalisation does not preclude fishers on smaller vessels from earning high wages. New rules that were meant to be temporary allow owners of small vessels to pool quotas within a fishing season on one vessel (Riksrevisjonen, 2020). Typically, they will pool the quotas on the most efficient vessel and in this way lower the operational costs of fishing. Since the lay in coastal fisheries is based on net revenue, this means that fishers participating in these arrangements can still earn high wages. In any case, Figure 6.7 clearly shows that vessel size is a key predictor of the expected fisher salary and, as such, an indicator of capitalisation.
Resource rent
A relevant question is who extracts the resource rent: the government, the fishers (i.e. fisher crew) or the owner? Some parts of resource rents have already been extracted through the transactions of fishing quotas. Consequently, one view is that those fishers who owned quotas and left the fisheries by selling their fishing rights have extracted a considerable part of the resource rent.
The high income levels among fishers, at least among certain segments, indicates that resource rent remains among the active participants in fisheries. As discussed above, the highest income levels are associated with large vessels. This suggests that further restructuring is required in order to yield more resource rent, removing additional smaller vessels in favour of fewer larger vessels. This corresponds to the view of Steinshamn (2019), who concludes that overcapacity is still present and, consequently, that little resource rent is generated with the current industry structure. Although this would make yield a more taxable resource rent, it would also give rise to regional distributional effects with more fishing communities becoming vulnerable to withering away in such a process (Iversen et al., 2018; Riksrevisjonen, 2020).
As Figure 6.1 shows, a large majority of vessels are small, being less than 11 metres in length. If the government chose to continue fleet restructuring in favour of larger vessels, this would likely leave more of the resource rent to society (if taxed) but remove livelihoods from coastal communities.
Interviews
The following people were interviewed for this study:
- Roald Sturla, department head/law specialist from Fiskebåt (the representative of fishing vessel owners in the pelagic and ocean demersal fisheries)
- Trond A. Dyb, senior advisor from Norsk Sjøoffisersforbund (the union of naval officers)
- Audun Stautland, CEO of the crew section in Norges fiskarlag (the organisation representing both fishing vessel owners and fishers linked primarily to coastal fisheries)
- Heidi Merethe Rånes and Geir Kroknes, both senior advisors for the vessel owner section of Norges fiskarlag (the organisation representing both fishing vessel owners and fishers linked primarily to coastal fisheries)
Summary of the organisations involved in pay negotiations and their relations
The pay system used today in Norwegian fisheries, the lay system, is rooted in historical traditions where the fishers who participated consisted of boat owners and, often-times, farmers. Farmers contributed capital, or more specifically storage and drying facilities for fish, as the landed fish was dried in the farms. In this sense, the lay system was created to distribute fair revenues based on capital, skills, and effort.
Today, the equivalent of that historical system is pay agreements that contain formalised and agreed-upon pay tables that detail how the lay will be distributed to the different parties in the fisheries based on the size of vessels, fishing gear, number of fishers, and the like. The tables seek to reflect the relative contribution of capital and labour input. The lay system stipulates that fishers are not regular employees since their revenue depends on the catch and market prices, that is to say the catch revenue. In this sense, fishers are treated as business owners even if they do not own a vessel. As such, fishers are not part of regular labour law regulations but are nevertheless protected by regulations pertaining more generally to people working at sea.
In terms of pay agreements, Norwegian fisheries are divided into two sectors: coastal and ocean. Coastal fisheries include fjords and coastal areas and are restricted to fishing vessels of less than 28 metres in length. Coastal fisheries predominantly land fresh fish with cod-species being the most valuable. However, many other species are caught using a range of fishing gear. Ocean fisheries refers to deep sea fishing and is dominated by pelagic fisheries, mainly using purse seiners that catch mackerel and herring as the most important species. However, trawl fisheries of demersal fish and shrimp also form part of ocean fisheries.
In coastal fisheries, negotiations take place between the boat owners and the crew sections of Norges fiskarlag. In other words, both parties in the negotiations are represented by the same umbrella organisation, although they are organised in different sections within that organisation. This unusual arrangement has historic roots and reflects the fact that boat owners have traditionally been active fishers themselves. In Norwegian coastal fisheries, many of them are still active participants. Norges fiskarlag has a long history, being formed in 1926 and becoming a true national organisation ten years later in terms of reach.
Pay negotiations in ocean fisheries include Fiskebåt, another branch of Norges fiskarlag, as the organisation representing the vessel owners. Fishers are represented by Norsk sjømansforbund, captains and first mates by Norsk sjøoffisersforbund, and machinists by Det norske maskinistforbund. The unions that represent the crew in ocean fisheries do not pertain to Norges fiskarlag.
A key difference between pay negotiations in ocean and coastal fisheries is the possibility of mediation. There is no process for third-party mediation for ocean fisheries. This is because the parties have rights to strike and lockout. In contrast, participants in coastal fisheries have no such rights but can instead resort to a process of mediation and arbitration. The mediation process in coastal fisheries has two steps where the final step involves a process that leads to a binding arbitration solution for the pay agreement (‘voldgift’ in Norwegian).
The disparity in the pay negotiation process between ocean and coastal fisheries has practical consequences. Specifically in ocean fisheries, there is very low willingness on either side to resort to strike or lockout during the pay negotiations. The opportunity cost of a strike or lockout in terms of lost revenue is simply too high and reflects the fact that the bulk of the fishers’ pay depends on catch revenue and not on a fixed salary.
An anecdote told by one interviewee was that when the machinists in the pelagic fisheries at one time attempted to strike, it was cancelled after few hours. The willingness among machinists to strike was low and only few members went on strike. Among the machinists who went on strike, some received threats of reprisals: The entire crew of fishers and captains stood to lose revenue from the strike. This failed attempt to strike illustrates that, most of the time, using strike as a negotiation lever is not a real option.
A side effect of not having any mediation or real sanctions is that pay disagreements can persist for years without any resolution. Disagreements lead to deadlock in negotiations and essentially mean the ruling pay tables (i.e. the lay system) agreed upon during negotiations from preceding years are left unrevised. For example, a period of six years passed with a deadlock on pay between Fiskebåt and the parties representing the fishers and other crew members.
In contrast, the mediation and arbitration policies exercised in coastal fisheries resolve these deadlocks by way of third-party rulings. The arbitration process includes representatives of the Norwegian Directorate of Fisheries. The role of the representatives from the directorate is to ensure that sufficient third-party expertise about the fisheries is available during the arbitration process. In this regard, one interviewee commented that the fisheries sector is so complex and with such deep historical roots that politicians most often opt to keep their hands off negotiations. However, fisheries bureaucrats who are knowledgeable about the industry are respected and allowed into the process as mediators.
There is a shared understanding among the interviewees that the development of fishers’ salaries has been favourable following the restructuring of the fisheries (i.e. fewer vessels and fishers). This sentiment is shared across the organisations that the interviewees represent. Fishers working on board vessels accumulating more fishing quotas, typically the larger vessels, have been rewarded with higher revenue. In other words, higher fisher pay shows that productivity gains have been shared between vessel owners and fishers. The increase in fisher pay is a logical consequence of the revenue-sharing system.
According to one interviewee, the most significant change in the fisheries’ structures is linked to the regulatory changes of 2004 with ‘Strukturkvoteordningen’. This arrangement removed vessels from the fisheries so that boat owners could accumulate quotas among fewer vessels. Today, a complete condemnation of vessels is no longer required. This is possibly because there is a second-hand market for vessels that do not significantly impact overall capacity. According to the interviewee, the capacity reductions have been large enough to relax the regulations.
However, a point of contention between fishers and vessel owners has been how the lay should be distributed once more quotas are accumulated among fewer vessels. With an increase in the concentration of fishing quotas among fewer vessels, vessel owners have proposed to change the lay distribution between fishers and vessel owners. The view of vessel owners is that they bear all the capital costs and risks associated with restructuring, while fishers who remain in the fisheries only reap the rewards. When vessel owners buy additional quotas, they will often finance the purchase with a bank loan. Consequently, restructuring has likely increased the level of financial debts and repayments in the fisheries sector. An exception is those vessel owners who already own several fishing vessels and can move quotas between their own vessels (by reducing the number of vessels).
In negotiations, vessel owners in both the ocean and coastal fisheries have proposed to increase their own share of the lay as compensation for the capital costs and financial risks they bear. However, the fishers have fought hard against any shift in lay distribution. The representative of Norsk Sjøoffisersforbund said that their members, that is to say the captains and first mates, believed the restructuring and consolidation of the fishing fleet had gone far enough. Their view is that the vessels are sufficiently profitable and there are no reasons for further consolidation. The efficiency gains are already substantial and vessel owners do not need higher profits. An interpretation of this stance is that crew members are content with their wage levels and think it is more important to protect workplaces than to increase wages further.
The opposing views and tensions between the two parties explain the gridlock in pay negotiations, particularly in ocean fisheries where there is no arbitration process. For example, there has been disagreement in ocean trawl fisheries about how to adjust the revenue sharing scheme should individual vessels be allowed to increase the number of quotas from 3 to 4. Due to the disagreement, the pay agreement from 2014 remained in place until it was replaced with a new one in January 2021. The main point of contention was that vessel owners argued that they should have 15.44% deduction from the total lay to cover capital costs and financial risks. The current deduction remains at 9.5% with fishers arguing that this deduction is still too high.
The same type of disagreements have been ongoing in coastal fisheries. An agreement from 2001 allows vessel owners to deduct 2.5% from the total lay when acquiring additional quotas. There has been an increase to 4% over time, albeit based on difficult negotiations. Note that the percentage shares for coastal fisheries are not comparable with those in ocean fisheries since they have different ways of calculating the lay.
The representative of coastal fishers in Norges Fiskarlag stated that several of the fishers involved in the negotiations reported high levels of stress and fatigue. This indicates that even if there have been few open conflicts in pay negotiations, tensions are running high. Relations between fishers and vessel owners in respect of pay negotiations do not seem particularly harmonious.
Fishers have fought hard to maintain the status quo in terms of how the lay is distributed, while vessel owners have been arguing for a larger share of the revenue to compensate for capital costs associated with restructuring and the acquisition of fishing quotas. Overall, the sentiment seems to be that fishers have come out as the winners (or at least retained a fair share), while vessel owners are discontent with the current distribution. This sentiment seems to prevail both in ocean and coastal fisheries. Fishers who have lost their livelihoods because of the restructuring of the fisheries sector may have other opinions, depending on the outcome of them leaving the sector. Furthermore, local communities that have declined because of fishers losing their livelihoods and due to the regional concentration of fishing activities (including at the coastal level), may hold a different view on who are the real winners and losers (Riksrevisjonen, 2020).
Resource rent in Norwegian fisheries
The Norwegian fisheries sector has undergone major structural changes, the most important of which is a transition to a transferable quota system. This system, introduced in the early 2000s, has allowed an increased concentration of quotas among individual vessels. The system has also introduced capitalisation in the fisheries, a concentration of ownership of fishing rights, and a geographical concentration of fisheries activities (Riksrevisjonen, 2020). Figures 6.8 below was originally in the public audit report by Riksrevisjonen (2020) that assessed the consequences of the restructuring of the fisheries. The figure shows the share of the total fishing quota in the respective fisheries of cod, mackerel and spring-spawning herring that is controlled by the ten largest companies. Importantly, the figures show how the concentration has increased.
The highest concentration has been within the ocean fleet, which consists of both pelagic and demersal fisheries (i.e. predominantly cod fisheries). The pelagic fleet operating in coastal areas has also experienced a marked increase in concentration, while coastal cod fisheries have the most dispersed ownership. However, even the coastal fleet of smaller cod fishing vessels has become more concentrated. It is also noted that the low concentration of purse seiners (‘ringnot’) stands out, which is likely due to a major capital upgrade of the fleet in the 1980s and 1990s. It also appears that the profitability of the purse seiners has been quite good and consequently there was no incentive to sell quotas once these became transferable.
Figure 6.8: Share of the total fishing quota that the ten largest companies have in their respective fisheries for cod, mackerel and Norwegian spring-spawning herring (Riksrevisjonen, 2020).
The relative lower concentration in the coastal fleet (‘kystflåte’) does not tell the whole story. There has been a geographical concentration as vessels (and their quotas) have increasingly migrated across municipalities and counties. Moreover, owners of small vessels are now allowed to temporarily pool the quotas of several vessels to one vessel within a fishing season. As mentioned earlier, this typically involves quotas of older and less efficient vessels that are seasonally transferred to more modern vessels.
The report by Riksrevisjonen (2020) concludes that restructuring has increased profitability in all fisheries. However, it also points to negative effects, for example that the fleet of smaller vessels and coastal communities have experienced reduced activity and employment.
In terms of resource rent, Table 6.1 shows that the restructuring caused by tradable quotas has significantly increased the resource rent from pelagic fisheries. The calculations of resources rent ae based on data for the profitability of the different fisheries and is sourced from the Norwegian Directorate of Fisheries. In addition, data from Statistics Norway has been used to, for example, estimate the opportunity cost of labour based on mean industrial wage levels in Norway. The estimations are sensitive to assumptions about parameters such as expected normal return on capital and the opportunity cost of fishers’ labour. As such, the absolute levels of the estimated resource rent should be interpreted as crude approximations.
The calculations show that capital, labour, and the public sector have benefitted from the increase. In terms of the growth rates of resource rent allocation, capital has benefitted the most as it received a substantially larger share of the total resource rent in 2017/18 compared to 2003/04. However, labour and the public sector still receive greater shares in absolute terms.
The resource rents presented in Table 6.1 exclude the value of the fishing quotas. The transferable fishing quotas in Norway are not sold in an open market, but ownership can be transferred in exchange for monetary compensation. This monetary compensation has increased in value over the period studied here (Riskrevisjonen, 2020). The fact that, in several cases, four quotas have been accumulated to one vessel means that former vessel owners (and thus quota owners) have already capitalised some of the resource rent gains. It should therefore be clear that besides the resource rent vessel owners receive from revenue, they also accrue resource rent through the increased value of the fishing quotas. It is noted that the transfer of ownership of quotas and the associated compensation in Norway is not transparent and is not necessarily publicly available information.
In the demersal sector (Table 6.2) the resource rent also increased considerably from 2003/04 to 2017/18. At the same time, capital appears not to have benefitted in the same way as in pelagic fisheries. In fact, the share going to capital has diminished to between 3% and 5%. Labour receives the greatest share at around 55% and the public sector around 42%. A possible reason why labour receives a larger share of resource rent in demersal fisheries compared to pelagic fisheries may be that there are more active owners in demersal fisheries (i.e. owners who participate as fishers/captains in the fisheries).
| 2003 | 2004 | 2017 | 2018 | |
| Results | Total RR | Total RR | Total RR | Total RR |
| NOK million | NOK million | NOK million | NOK million | |
| Public sector | 96 | 226 | 338 | 426 |
| Net remuneration of capital | 74 | 13 | 249 | 401 |
| Net remuneration of labour | 202 | 295 | 528 | 599 |
| Total | 371 | 534 | 1,115 | 1,426 |
| Allocation: | % | % | % | % |
| Public sector | 26% | 42% | 30% | 30% |
| Net remuneration of capital | 20% | 2% | 22% | 28% |
| Net remuneration of labour | 54% | 55% | 47% | 42% |
| Total | 100% | 100% | 100% | 100% |
Table 6.1: Resource rent in the pelagic sector
| 2003 | 2004 | 2017 | 2018 | |
| Results | Total RR | Total RR | Total RR | Total RR |
| NOK million | NOK million | NOK million | NOK million | |
| Public sector | -42 | 181 | 771 | 832 |
| Net remuneration of capital | 252 | 45 | 45 | 99 |
| Net remuneration of labour | 39 | 205 | 989 | 1,074 |
| Total | 249 | 430 | 1,805 | 2,005 |
| Allocation: | % | % | % | % |
| Public sector | -17% | 42% | 43% | 41% |
| Net remuneration of capital | 101% | 10% | 3% | 5% |
| Net remuneration of labour | 16% | 48% | 55% | 54% |
| Total | 100% | 100% | 100% | 100% |
Table 6.2: Resource rent in the demersal sector
Figure 6.9: Resource rent development in Norwegian pelagic and demersal fisheries from 2004 to 2018. The top two graphs show resource rent development of nominal NOK and percentage share in pelagic fisheries and the bottom two the corresponding figures for demersal fisheries.
In summary, Tables 6.1 and 6.2 show that the restructuring of the Norwegian fisheries sector towards transferable quotas and reduced capacity has increased the resource rent. Moreover, additional resource rent not reflected in the above tables is contained in the value of the fishing quotas. The value of the transferable quotas increased substantially during the study period, accruing to the owners of the fishing quotas (Riksrevisjonen, 2020). Nonetheless, fishers have also benefitted as the distribution of the resource rent calculated in this report suggests that fishers receive substantially more resource rent in 2018 compared to 2004. This increase in resource rent to fishers is a result of the restructuring and capitalisation of the fisheries. In other words, fishers who have remained in fishery during the downsizing of capacity have gained. Although fishers appear to have gained overall, due to the distributional effects, some fishers who have exited the sector may be worse off. The same applies for coastal fishing communities where the number of fishers and fishing vessels has diminished.
It is worth to reiterate that the estimation of the size and allocation of the socio-economic return is based on several assumptions. The results are therefore subject to uncertainty and must be interpreted with caution.
References
Asche, F., Garlock, T. M., Anderson, J. L., Bush, S. R., Smith, M. D., Anderson, C. M., ... & Oglend, A. (2018). Three pillars of sustainability in fisheries. Proceedings of the National Academy of Sciences, 115(44), 11221-11225.
Bergland, H., & Pedersen, P. A. (1999). Resultatavlønning – en drøfting av ulike lønnssystem med eksempler fra fiske. Magma, 2(2), 98-109.
Danielsen, R., & Agnarsson, S. (2020). Perspectives: In Pursuit of the Three Pillars of Sustainability in Fisheries: A Faroese Case Study. Marine Resource Economics, 35(2), 000-000.
Iversen, A., Isaksen, J. R., Hermansen, Ø., Henriksen, E., Nyrud, T., & Dreyer, B. (2018). Strukturering i fiskeflåten-Drivkrefter og konsekvenser. Nofima rapportserie.
Nielsen, M., Waldo, S., Hoff, A., Nielsen, R., Asche, F., Blomquist, J., ... & Sveinþórsdóttir, R. (2017). Employment and salary of Nordic coastal fishermen (Vol. 2017558). Nordic Council of Ministers.
Nielsen, M., F. Asche, R. Nielsen, A. Hoff, E. Henriksen, O. Bergesen, J. Viðarsson, S. Waldo and J. Blomquist (2018). The Myth of the Poor Fisher: Evidence from the Nordic countries, Marine Policy 93:186–194.
Norges Fiskarlag (2019). Fiskerioverenskomst og oppgjørsavtaler mellom Mannskapsseksjonen og Båteierseksjonen i Norges Fiskarlag (Gjelder f.o.m. 1. januar 2019 og avløser tidligere avtaler). https://www.fiskarlaget.no/index.php?option=com_edocman&task=document.viewdoc&id=292&Itemid=194
Nøstbakken, L. (2012). Investment drivers in a fishery with tradable quotas. Land Economics, 88:2, pp. 400-424.
Riksrevisjonen (2020). Riksrevisjonens undersøkelse av kvotesystemet i kyst- og havfisket. Dokument 3:6 (2019–2020).
Steinshamn, S. I. (2019). Ressursrentebeskatning i fiskeri: Kunnskapsstatus, samt erfaringer fra andre fiskerinasjoner. SNF rapport 02/19.
Svorken, M., Hermansen, Ø., & Isaksen, J. R. (2012). Garantiordningen for fiskere. Nofima rapportserie.
Sønvisen, S. A., Johnsen, J. P., & Vik, J. (2017). Mellom nettverk og marked II: Om fiskerirekruttering og sysselsettingssystemer i fiske. Rapport Norsk senter for bygdeforskning.
About this publication
The pay systems for commercial fishers in Nordic fisheries
Influence on the management and sustainability of fisheries
Max Nielsen, Erling Larsen, Hans Ellefsen, Heri a Rógvi, Jonathan Sandager Hansen, Søren Espersen Schrøder, Kaspar Teilmann, Jens Henrik Møller, Daði Már Kristófersson, Eyrún Marinósdóttir, Sigbjørn L. Tveteraas and Carl-Christian Schmidt
ISBN 978-92-893-7285-5 (PDF)
ISBN 978-92-893-7286-2 (ONLINE)
http://dx.doi.org/10.6027/temanord2022-515
TemaNord 2022:515
ISSN 0908-6692
© Nordic Council of Ministers 2022
Cover photo: Yadid Levy/norden.org
Published: 24/3/2022
Disclaimer
This publication was funded by the Nordic Council of Ministers. However, the content does not necessarily reflect the Nordic Council of Ministers’ views, opinions, attitudes or recommendations.
Rights and permissions
This work is made available under the Creative Commons Attribution 4.0 International license (CC BY 4.0) https://creativecommons.org/licenses/by/4.0.
Translations: If you translate this work, please include the following disclaimer: This translation was not produced by the Nordic Council of Ministers and should not be construed as official. The Nordic Council of Ministers cannot be held responsible for the translation or any errors in it.
Adaptations: If you adapt this work, please include the following disclaimer along with the attribution: This is an adaptation of an original work by the Nordic Council of Ministers. Responsibility for the views and opinions expressed in the adaptation rests solely with its author(s). The views and opinions in this adaptation have not been approved by the Nordic Council of Ministers.
Third-party content: The Nordic Council of Ministers does not necessarily own every single part of this work. The Nordic Council of Ministers cannot, therefore, guarantee that the reuse of third-party content does not infringe the copyright of the third party. If you wish to reuse any third-party content, you bear the risks associated with any such rights violations. You are responsible for determining whether there is a need to obtain permission for the use of third-party content, and if so, for obtaining the relevant permission from the copyright holder. Examples of third-party content may include, but are not limited to, tables, figures or images.
Photo rights (further permission required for reuse):
Any queries regarding rights and licences should be addressed to:
Nordic Council of Ministers/Publication Unit
Ved Stranden 18
DK-1061 Copenhagen
Denmark
pub@norden.org
Nordic co-operation
Nordic co-operation is one of the world’s most extensive forms of regional collaboration, involving Denmark, Finland, Iceland, Norway, Sweden, and the Faroe Islands, Greenland and Åland.
Nordic co-operation has firm traditions in politics, economics and culture and plays an important role in European and international forums. The Nordic community strives for a strong Nordic Region in a strong Europe.
Nordic co-operation promotes regional interests and values in a global world. The values shared by the Nordic countries help make the region one of the most innovative and competitive in the world.
The Nordic Council of Ministers
Nordens Hus
Ved Stranden 18
DK-1061 Copenhagen
pub@norden.org
Read more Nordic publications on www.norden.org/publications