
- Full page image w/ text
- Table of contents
- Authors
- Scope of the project
- The main conclusions
- Nitrogen pollution continues to be a problem
- A National Nitrogen Budget provides an overview of reactive nitrogen flows in a country
- The major nitrogen flows are deposition, fixation, leaching, harvest, and denitrification
- Nitrogen and carbon: a complex relationship of the ecosystems’ inseparable couple
- The forest carbon sequestration reported to UNFCCC requires nitrogen
- The inconsistency between carbon and nitrogen data is not fully clarified
- Implications and recommendations
- About this publication
MENU
Contents
This publication is also available online in a web-accessible version at https://pub.norden.org/temanord2021-554.
Nitrogen budgets and the link to carbon sequestration in the Nordic forests
Filip Moldan, IVL Swedish Environmental Research Institute,
Sara Jutterström, IVL Swedish Environmental Research Institute,
Johanna Stadmark, IVL Swedish Environmental Research Institute,
Anu Akujärvi, SYKE Finnish Environment Institute,
Martin Forsius, SYKE Finnish Environment Institute,
Maria Holmberg, SYKE Finnish Environment Institute,
Kari Austnes, NIVA Norwegian Institute for Water Research,
Heleen de Wit, NIVA Norwegian Institute for Water Research, and
Jesper Bak, Aarhus University
This project has been supported by the Nordic Working Group for Climate and Air (NKL).
Scope of the project
- Organic matter contains both carbon and nitrogen and therefore in all ecosystems carbon cycling is linked to nitrogen. In this project we have quantified annual changes of nitrogen stocks in forests in Sweden, Finland, Norway and in Denmark in two independent ways.
- First, we used methodology developed within CLRTAP to quantify major inflows and outflows of nitrogen in forests, wetlands and other semi-natural vegetation.
- Then we calculated nitrogen flows in forests based on the carbon stock changes annually reported to UNFCCC, using published carbon to nitrogen ratios for trees and soils.
The main conclusions
- Major inflows of N to forests are atmospheric deposition and biological nitrogen fixation, and major outflows are runoff and tree harvest.
- The annual nitrogen budgets for forests were approximately in balance, with outflows between 70% and 130% of the nitrogen inflows, in the four countries.
- All four countries report substantial annual forest carbon accumulation to UNFCCC. The forest carbon accumulation is not possible without accumulation of nitrogen, but the sources of nitrogen to support the reported carbon accumulation have not been identified in the nitrogen budgets based on inflows and outflows.
- The relatively large discrepancy between forest nitrogen budgets based on nitrogen flows and based on UNFCCC carbon data raises the question of the consistency between reported data on nitrogen and carbon flows.
Nitrogen pollution continues to be a problem
Deposition of nitrogen is causing eutrophication and damage to ecosystems. High air concentrations of nitrogen compounds are negatively impacting human health and contribute to global warming. Emissions of nitrogen are still high and declining only slowly (Figure 1). In particular, the emissions of ammonia from agriculture have been difficult to limit. Critical loads of nitrogen are exceeded at ca 70% of the EU area.
Figure 1. National annual emissions of nitrogen oxides (NOx) and ammonia (NH3) for 28 countries of the EU. Source: official reported emissions, gap-filled and adjusted for EMEP modelling purposes (https://www.ceip.at/webdab-emission-database/emissions-as-used-in-emep-models).
Nitrogen gas (N2) constitutes 78% of Earth’s atmosphere and nitrogen is one of the major cellular components of organisms. Nitrogen from the atmosphere is converted into the reactive and biologically available forms by one of three processes: by fertilizer production, by combustion processes or by biological fixation. Lightnings also contribute, but to a much smaller extent. In Europe, Sutton et al. (2011) estimated that 74% of the total input of reactive nitrogen to the environment stems from the fertilizer production using the Haber-Bosch process, 16% from combustion, and the remaining 10% from biological fixation and import of feed and products. Once in reactive forms, nitrogen enters a complex chain of reactions where it is cycled within ecosystems and in industrial processes, becomes a part of living biomass or chemical components, is released back to water or to the atmosphere in decay processes, changes chemical form, and re-enters the cycle, until it is ultimately converted back to N2 and again becomes part of the atmospheric N2 pool. Elevated levels of reactive nitrogen in air, water and soil can cause damage to the environment and ecosystems.
The Task Force on Reactive Nitrogen (TFRN)
TFRN was established under the Working Group on Strategies and Review (WGSR) by the Executive Body of the UNECE Convention on Long-Range Transboundary Air Pollution in December 2007. The purpose of TFRN has been defined as: “The Task Force will develop in the long-term technical and scientific information and options which can be used for strategy development across the UNECE to encourage coordination of air pollution policies on nitrogen in the context of the nitrogen cycle and which may be used by other bodies outside the Convention in consideration of other control measures.” TFRN defined reactive nitrogen (Nr) as all biologically active, photochemically reactive and radiatively active N compounds in the biosphere and atmosphere. This meant, in practice, all N except N2 gas; for example, nitric oxide (NO), nitrogen dioxide (NO2), nitrate (NO3), organic N compounds, nitrous oxide (N2O), ammonia (NH3) and ammonium (NH4+). Within TFRN, the Expert Panel on Nitrogen Budgets (EPNB) was established and commenced work to prepare guidelines for compilations of national N budgets of individual countries. EPNB prepared the “Guidance Document on National Nitrogen Budgets” and provided detailed guidelines for each of the identified eight main parts of the National Nitrogen Budget (NNB), Figure 2.
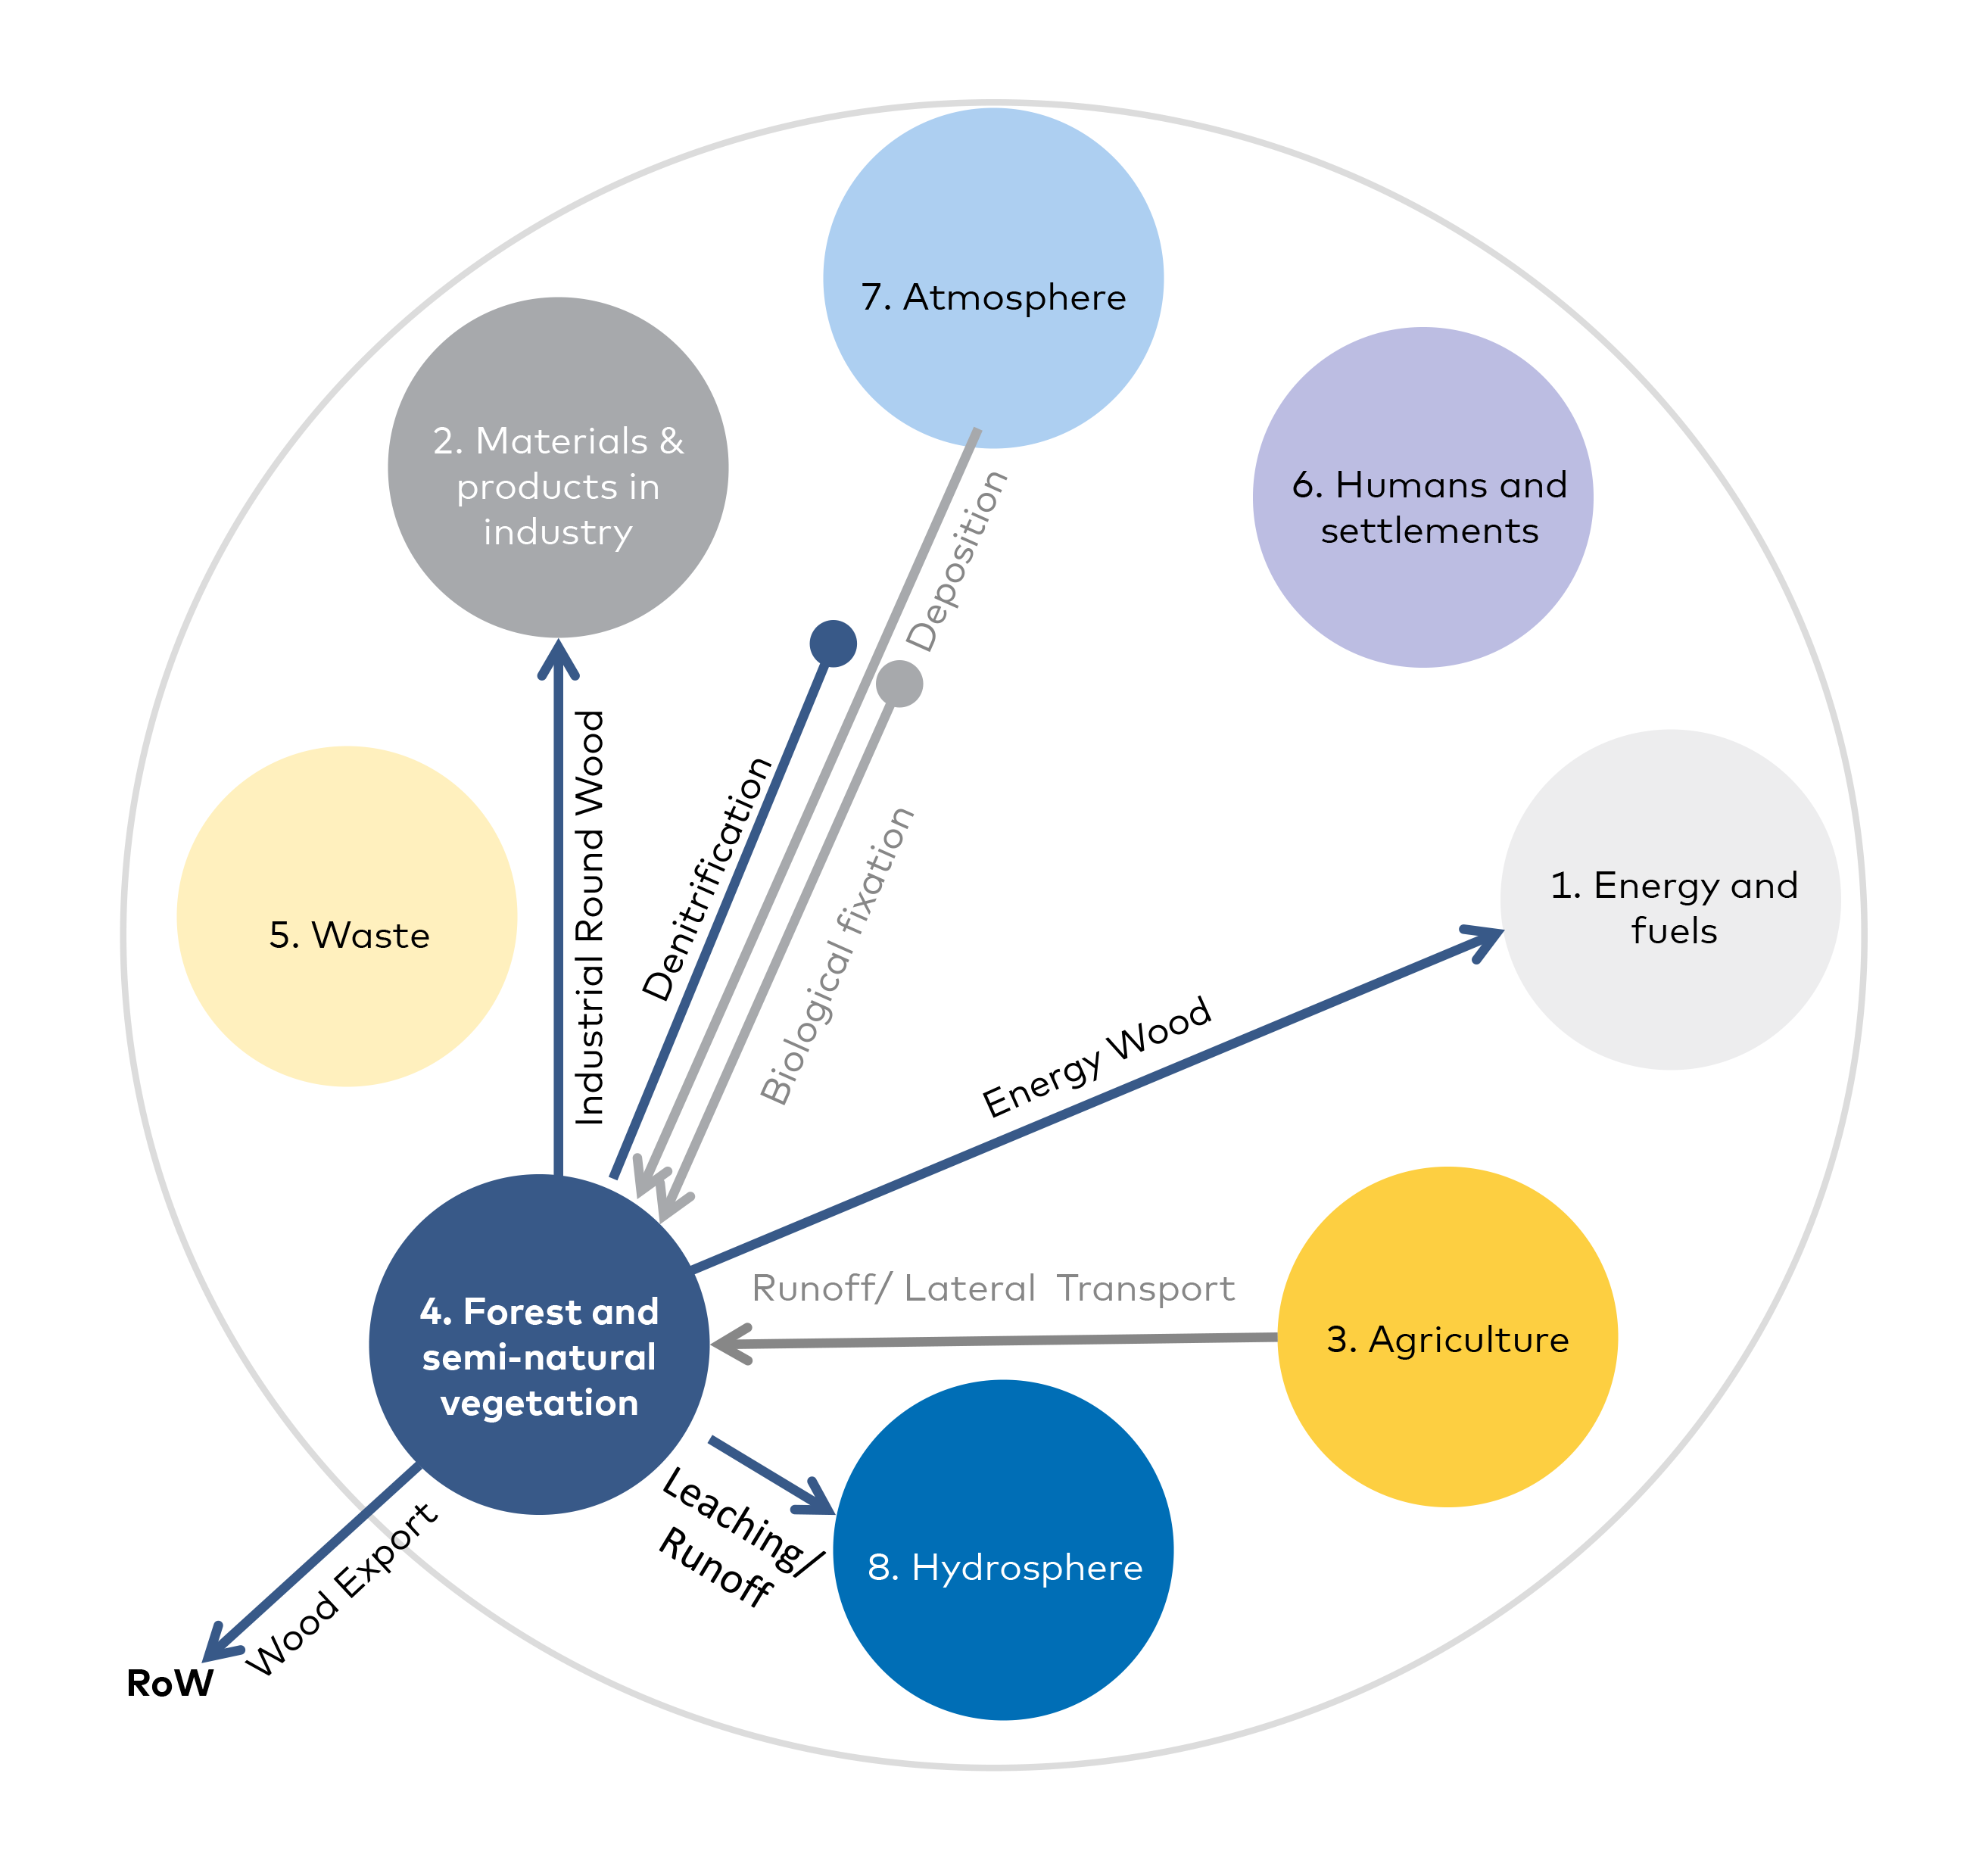
Figure 2. Nitrogen flows between the “Forest and semi-natural vegetation” (FS) pool and the other pools of the National Nitrogen Budget (including the pool “Rest of the world”, RoW). Grey arrows represent nitrogen flows entering the FS pool from the other pools; blue arrows show nitrogen flows from the FS pool to the other pools. The diagram could be rearranged to focus on any of the eight subpools. (Source: http://www.clrtap-tfrn.org/sites/clrtap-tfrn.org/files/documents/EPNB_new/EPNB_annex_20160921_public.pdf )
A National Nitrogen Budget provides an overview of reactive nitrogen flows in a country
Emissions of nitrogen to the environment come from several sectors but the proportion of the sources of emissions vary from country to country. Agriculture, transport, the energy sector, industry and waste management are the major sources of N emissions. To minimize the losses of reactive nitrogen to the environment, major nitrogen flows and pools need to be understood and quantified. To construct a total reactive nitrogen budget of a country is a good way to identify both the largest sources of emissions and where the potential for emission reductions is largest. It is of further benefit if the task of identifying all major components of a national nitrogen budget is done using standardized methodology which makes comparison of results among countries possible.
The major nitrogen flows are deposition, fixation, leaching, harvest, and denitrification
The “Forest and semi-natural vegetation” (FS) pool (Figure 2) is divided into three sub-pools: forest, wetland and other land. In Finland and Sweden, the FS covers 71% of the area and in Norway it makes up as much as 90% of the country (Figure 3). In Denmark the land cover is dominated by arable land, but even so the forests, wetlands and other land combined cover about 25% of the country area. In total across the four countries the land use categories included in FS add up to 90 Mha and dominate the combined total area (117 Mha).
Figure 3. Five major land use categories in the four countries. “Remaining land” includes all remaining land use categories such as urban areas, high mountains or coastal non-forested vegetation.
There are a number of similarities among the four National Nitrogen Budgets (NNBs) FS pools (Figure 4). Atmospheric deposition is the major inflow of reactive nitrogen in all four countries, followed by biological N fixation. Finland and Sweden apply N-fertilizers to enhance forest growth to an extent where N-fertilization was another important input of Nr (7% of the total Nr input to the FS pool in Finland, 3% in Sweden). Leaching of nitrogen (sum of organic and inorganic forms of N) was the largest outflow in all countries while the removal of N due to biomass harvest differed between countries. It was almost as large as leaching in Finland and not far from that in Sweden and in Denmark. The harvest was a less important N removal pathway for Norway, where N2 emission due to denitrification was the second largest outflow (after leaching).
Figure 4. Outputs (left bars) and inputs (right bars) of reactive nitrogen to the three sub pools of the forest and semi-natural vegetation part of the national nitrogen budgets, expressed in kg N/ha/year. The outputs are leaching to waters, denitrification and forestry harvest. The inputs are atmospheric deposition, biological fixation and forest fertilization.
Of the four countries, the FS budgets for Norway and to an extent in Denmark indicated a net N accumulation (inputs>outputs) while in Sweden and in Finland the situation was the opposite, i.e. net loss of N from the FS system (outputs>inputs), even though the outputs were within 10% of the inputs (arguably more or less in balance) for Denmark, Sweden and Finland. Expressed as a percentage of the inputs, the outputs were 69% of the inputs in Norway, 96% of the inputs in Denmark and 107% and 108% of the inputs in Sweden and in Finland, respectively.
Nitrogen and carbon: a complex relationship of the ecosystems’ inseparable couple
Nitrogen and carbon are essential building blocks of organic material. Organic matter such as living or dead biomass or soil organic matter typically contain a proportion of carbon and nitrogen which is relatively stable over time and is often expressed as the carbon to nitrogen ratio (C/N ratio). The forest area of the four Nordic countries involved in this project (Sweden, Finland, Norway, Denmark) is 64 Mha, or 30% of the 42 European countries' combined forests (Russia excluded). The 64 Mha is also 58% of the four countries land area. The flows of reactive nitrogen to and from forests are therefore large in both European and national context just by the fact that forests cover such large areas.
Having established a nitrogen budget for the forests as part of the NNB for Forest and semi-natural vegetation opens the possibility to compare the N budget for forests with the carbon stock changes reported to UNFCCC. Assuming no changes in the C/N ratios of the forest compartments, an increase or a decrease of C stock means a corresponding change in N stock. Therefore, the C stock changes reported to the UNFCCC could be used to calculate N stock changes in a way that is independent of the TFRN methodology. The two different ways to calculate N stock changes should give consistent results and potential differences between the two require explanations.
Carbon stock and carbon stock changes
National carbon stock changes for forest land are included in the national reporting to the UNFCCC and can also be calculated from the reporting to the Global Forest Resources Assessments from the Food and Agriculture Organization (FAO) of the United Nations.
The C stocks and stock changes are typically divided into:
- living biomass (above- and below-ground)
- dead biomass (litter and dead wood)
- soil (organic layer and mineral soil).
Estimates of C stock changes of forest land were available for all major organic matter compartments in all countries although the methodology varied.
C/N ratios
In forest and semi-natural ecosystems there is a rather large variability of the C/N ratios across the various ecosystem parts and there are a wide range of estimates of C/N ratios available in the literature. Typically, the compartment with the lowest C/N (i.e. the most N rich) are the soil microbes. On the other side of the scale is the stem wood which is the most N-poor pool with the highest C/N. There is also a variability within the same compartment for e.g. different tree species or soil types. There is, however, also a degree of consistency in the published measured C/N, especially when comparing mean values from studies which summarize C/N across multiple sites or across a region.
An assumption in the conversion of the C stock change to N stock is that C/N ratios are held constant. C/N ratios do show considerable spatial differences, but there is limited evidence to suggest that C/N ratios in biomass compartments and soils show significant change with time.
In this work there are, in some cases substantial, differences between the C/N ratios for the different compartments that the individual countries have chosen to use in the calculations:
| Compartment | Range of C/N ratio |
| above-ground biomass | 151 – 181 |
| below-ground biomass | 65 – 295 |
| dead wood | 400 – 425 |
| litter | 50 – 65 |
| mineral soils | 30 – 39 |
| organic soils | 35 – 40 |

The forest carbon sequestration reported to UNFCCC requires nitrogen
All four countries sequester C in forests (Figure 5). The C stock is reported to be increasing in each compartment (living biomass, dead wood and litter, and soils) in all four countries, with two exceptions, which are the litter in Sweden and forest soils in Norway, which both are reported to lose C. The C accumulation in the living biomass is by far the largest post in Sweden, Norway and Finland. For Finland, the C stock change in dead wood and litter are included in the C stock change of soil organic matter.
Figure 5. Annual carbon sequestration in the forests reported to UNFCCC in the four countries (left panel) and N stock change (right panel) based on C stock change (using C/N ratios, blue staples) and calculated as a difference of annual N inputs and outputs in the National Nitrogen Budget according to TFRN methodology (yellow).
The sum of the C stock change of living and dead biomass and soil was in all four countries positive. The reported increase in C stock (carbon sequestration) was substantial, almost 12 000 kt C/yr in Sweden, 8 000 kt C/yr in Norway, 8 000 kt C/yr in Finland and 3 000 kt C/yr in Denmark. The reported C stock changes in forest land for Sweden, Norway, Finland and Denmark would require (if the C stock increase is taking place by accumulating organic matter with the current C/N ratio) additions of 141, 70, 40 and 45 kt N/yr. This is, however, not in agreement with the N stock changes based on the flows of N to and from forests as calculated in the National Nitrogen Budgets for the four countries (Figure 5, lower panel). The difference between N stock change based on UNFCCC and on TFRN calculations is largest for Sweden. The C stock change would in Sweden require a N stock increase of 141 kt N/yr while the NNB indicates a decrease of the N stock by 22 kT N/yr, a difference of 163 kt N/yr. The differences are in the same direction (UNFCCC reporting require larger N stock change than identified in the NNB) in the other three countries as well, with “missing” 49 kt N/yr in Norway, 61 kt N/yr in Finland and 47 kt N/yr in Denmark. To put these numbers into perspective, the latest figures on the total country emissions of nitrogen to the atmosphere (2018, EMEP Status report 1/2020) were 179 kt N in Sweden and 159 kt in Finland, 195 kt N in Norway and 183 kt N in Denmark. The relatively large discrepancy between the two ways of calculating the N stock change and the fact that the difference is in the same direction in all four countries raises the question of what the reality of the N stock change is.
The inconsistency between carbon and nitrogen data is not fully clarified
Explanations for the discrepancy between the available N, based on inflows and outflows according to TFRN methodology, and the N needed to support the reported C stock changes in the UNFCCC reporting could originate from one or a combination of several factors.
The largest post in the C stock increase reported to UNFCCC is the increase in living biomass. The calculations are based on extensive repeated forest inventories conducted by the national forestry authorities. To know the volume of standing biomass is of utmost interest to the forestry sector. The methodology to measure the forests has been developed and applied over a long time. Consequently, the C stock change of living biomass is the number most tightly bound to observations with relatively low uncertainty. The other two posts (dead wood and litter, and soils) are, however, much more difficult to measure and of less direct economic interest, which means less intensively measured and investigated. To measure soils' C stock and C stock changes is particularly difficult due to soil spatial heterogeneity. At the same time the soil C stock is very large and even small percentual changes are large posts in the annual C reporting.
Uptake of N from soils in growing forest could result in a decreasing soil N stock by translocation of N from soil to trees. Consequently, an increase in forest C stock could – in time periods of intensive forest growth – take place without a net increase of the N stock of the whole forest ecosystem. Soils accumulate C when above- and belowground litter production is faster than organic matter decomposition. Norway reported a small decrease in soil C stock. The net decomposition of soil organic matter and associated release of nitrogen would be consistent with an increasing C stock in biomass without an increase of N stock in the whole soil-tree forest ecosystem. The reported decrease of C stock in the Norwegian forest soil is, however, not of the order of magnitude to free enough nitrogen to support the reported C increase in the trees. Furthermore, this explanation is not applicable for Sweden, Finland and Denmark, where C stock increase is reported in both trees and in the forest soils.
Another explanation could be that the source of N supporting C accumulation in standing biomass is mineral soil. That hypothesis is, however, difficult to prove or disprove as direct observations of N stock of the mineral soils is typically not well covered or sometimes even omitted by the soil surveys. Yet another explanation could be that the forest area is changing. The documented increase of forest area in e.g. Denmark means that forest C and N stocks increase as the annual inclusion of new areas effectively means enlargement of the total forest soil- and biomass pool. Especially afforestation on farmland will add substantially to the available N pool.
Furthermore, there could be a simultaneous N stock decrease and C stock increase if the increasing forest C stock is getting more N-poor. There has not been an indication of increasing C/N in soils or forests, but that does not necessarily rule out this hypothesis. The annual C and N flows are small relative to the sizes of the pools. Over a shorter period of one or several years the rate of C/N change is low and therefore difficult to detect.
Finally, there are several uncertain posts in the N flow calculations of the forest pool, most notably N-fixation rates and denitrification, but at the same time it is unlikely to be of the order of magnitude to explain the mismatch between the two ways to calculate the N stock change. Which process or what combination of processes that are behind the observed discrepancy has implications for future predictions of C sequestration and of ecosystem eutrophication. For instance, if the increase in C stock reported to the UNFCCC reflects the reality and is supported by relocation of N previously stored in the soil, then this process will have to slow down or stop once the N stock in the soil decreases. The opposite is true if the C accumulation is made possible by sources of N unaccounted for or underestimated by the TFRN methodology, in which case the C accumulation could continue if the source of N is available.
Implications and recommendations
Establishing a National Nitrogen Budget is a good way to identify major flows of N in a country, to design strategies to mitigate N losses and to compare the flows and measures taken to minimize the N losses to the environment among countries.
- All four countries involved in this project are working on their respective NNBs. For policy purposes it would be beneficial if this work is continued until all eight pools are assessed and a complete NNB is compiled for each country. That will provide an excellent basis for international negotiations and for setting sector specific goals to minimize the N losses to the environment.
- An increase of forest carbon stock requires a source of “new” nitrogen or nitrogen relocation from soils to trees to support forest growth and biomass accumulation, or growth combined with a shift towards more N-poor biomass. In this project we could not identify the N flows associated with the reported C sequestration.
- There are several possibilities how to explain the identified discrepancy, but no conclusion on which (or what combination of these) could be given. However, to provide a conclusive and evidence-based explanation to the identified discrepancy would increase robustness of the NNB and C sequestration calculations.
- To investigate the magnitude and rate of change of N stocks is also of crucial importance for making projections of future C sequestration and future negative impacts of N pollution on the environment.
- Further interaction between groups dealing with the national air pollution and climate reporting would be mutually beneficial.
About this publication
Policy Brief: Nitrogen budgets and the link to carbon sequestration in the Nordic forests
Filip Moldan, Sara Jutterström, Johanna Stadmark, Anu Akujärvi, Martin Forsius, Maria Holmberg, Kari Austnes, Heleen de Wit and Jesper Bak
ISBN 978-92-893-7219-0 (PDF)
ISBN 978-92-893-7220-6 (ONLINE)
http://dx.doi.org/10.6027/temanord2021-554
TemaNord 2021:554
ISSN 0908-6692
© Nordic Council of Ministers 2021
Cover photo: Filip Moldan
Photographies: Filip Moldan, except in the chapter "Nitrogen pollution continues to be a problem": al-grishin / pixabay
Published: 21/12/2021
Disclaimer
This publication was funded by the Nordic Council of Ministers. However, the content does not necessarily reflect the Nordic Council of Ministers’ views, opinions, attitudes or recommendations.
Rights and permissions
This work is made available under the Creative Commons Attribution 4.0 International license (CC BY 4.0) https://creativecommons.org/licenses/by/4.0.
Translations: If you translate this work, please include the following disclaimer: This translation was not produced by the Nordic Council of Ministers and should not be construed as official. The Nordic Council of Ministers cannot be held responsible for the translation or any errors in it.
Adaptations: If you adapt this work, please include the following disclaimer along with the attribution: This is an adaptation of an original work by the Nordic Council of Ministers. Responsibility for the views and opinions expressed in the adaptation rests solely with its author(s). The views and opinions in this adaptation have not been approved by the Nordic Council of Ministers.
Third-party content: The Nordic Council of Ministers does not necessarily own every single part of this work. The Nordic Council of Ministers cannot, therefore, guarantee that the reuse of third-party content does not infringe the copyright of the third party. If you wish to reuse any third-party content, you bear the risks associated with any such rights violations. You are responsible for determining whether there is a need to obtain permission for the use of third-party content, and if so, for obtaining the relevant permission from the copyright holder. Examples of third-party content may include, but are not limited to, tables, figures or images.
Photo rights (further permission required for reuse):
Any queries regarding rights and licences should be addressed to:
Nordic Council of Ministers/Publication Unit
Ved Stranden 18
DK-1061 Copenhagen
Denmark
pub@norden.org
Nordic co-operation
Nordic co-operation is one of the world’s most extensive forms of regional collaboration, involving Denmark, Finland, Iceland, Norway, Sweden, and the Faroe Islands, Greenland and Åland.
Nordic co-operation has firm traditions in politics, economics and culture and plays an important role in European and international forums. The Nordic community strives for a strong Nordic Region in a strong Europe.
Nordic co-operation promotes regional interests and values in a global world. The values shared by the Nordic countries help make the region one of the most innovative and competitive in the world.
The Nordic Council of Ministers
Nordens Hus
Ved Stranden 18
DK-1061 Copenhagen
pub@norden.org
Read more Nordic publications on www.norden.org/publications