

- Full page image w/ text
- Table of contents
- PREFACE
- SUMMARY
- SAMMENFATNING
- ABBREVIATIONS, ACRONYMS AND DICTIONARY
- 1. CIRCULAR ECONOMY
- 1.1 Monitoring the Circular Economy
- 2. METHODOLOGY
- 2.1 Points of measurement
- 2.2 Taxonomy of circular economy indicators
- 2.3 Collection of data on Nordic monitoring of circular economy
- 2.4 Uncovering the interest for Nordic collaboration
- 3. CE MONITORING IN DENMARK
- 3.1 National level monitoring models and indicators
- 3.2 Sub-national monitoring of circular economy
- 4. CE MONITORING IN FINLAND
- 4.1 National level monitoring models and indicators
- 4.2 Sub-national monitoring of circular economy
- 5. CE MONITORING IN ICELAND
- 5.1 National level monitoring models and indicators
- 5.2 Sub-national monitoring of circular economy
- 6. CE MONITORING IN NORWAY
- 6.1 National level monitoring models and indicators
- 6.2 Sub-national monitoring of circular economy
- 7. CE MONITORING IN SWEDEN
- 7.1 National level monitoring models and indicators
- 7.2 Sub-national monitoring of circular economy
- 8. OVERVIEW - MONITORING CIRCULAR ECONOMY IN THE NORDICS
- 8.1 Monitoring the points of measurements
- 8.2 Monitoring systems on circular economy
- 9. POTENTIAL FOR NORDIC COOPERATION
- 9.1 Interest for Nordic cooperation on monitoring CE
- 9.2 Relevant stakeholders in the development of CE monitoring
- 9.3 Opportunities and challenges - monitoring the circular economy
- 9.4 Recommendations on Nordic collaboration
- 10. BIBLIOGRAPHY
- 11. ANNEX A – POINTS OF MEASUREMENT
- 12. ANNEX B - LIST OF INFORMANTS
- About this publication
MENU
Contents
PREFACE
Humanity is facing severe challenges in terms of climate change, the sixth mass extinction, and resource scarcity. Circular economy offers a potential solution by maintaining resources in the loop at their highest possible value and thereby reducing the volume of resources used and waste produced. The circular economy also reduces carbon emissions from production and lead to less use of areas for production facilities, thereby reducing the damage of habitats and the negative impact on biodiversity. Hence, in theory, the circular economy offers a decoupling between resource use, environmental degradation and economic growth.
A continuous and systematic measurement of circular economy can help to track the progress towards a circular economy and document if the circular economy is realising the expected outcomes and impacts. Monitoring the circular economy will enable informed decision-making and form the basis for relevant strategy modifications in light of achievements.
This pre-study, commissioned by the Nordic Working Group for Circular Economy in the Nordic Council of Ministers, aims at identifying and mapping indicators on the circular economy in the Nordic countries at national, regional and local level. The results of the study will inform and support future Nordic initiatives on measuring the circular economy.
The pre-study has been carried out January-September 2020 by a team of Nordic consultants: PlanMiljø with Bjørn Bauer (team leader), Nina Lander Svendsen, David Watson, Elvira Borgman and Kia Egebæk; Gaia with Susanna Sepponen and Päivi Luoma; and Norsus with Ole Jørgen Hansen.

SUMMARY
Monitoring of the circular economy
Circular economy offers a solution to several of the sustainability crises that humanity is facing; resource scarcity, climate change, and the sixth mass extinction. Reducing consumption and maintaining materials in active loops for as long as possible lead to reduced waste amounts, carbon emissions and pollution, and extraction of resources will be decreased leaving a larger area for nature and biodiversity to flourish. In EU’s Circular Economy Action Plan (2020), circular economy is presented as an enabler of decoupling economic growth from environmental degradation.
These theoretical outputs, outcomes, and impacts of the circular economy should be documented, and a monitoring system offers a continuous and systematic measurement, enabling governments and stakeholders to track the progress towards a circular economy. A well-established monitoring system can establish the causal pathways between activities, outcomes and impacts and inform decision makers on where resources should be allocated and where progress is sufficient.
This project, commissioned by the Working Group for Circular Economy under the Nordic Council of Ministers, has mapped circular economy indicators across the Nordic countries on both national and sub-national level as a pre-study to promote monitoring of the circular economy in the Nordic countries.
What to be measured in the circular economy?
To develop a monitoring system on circular economy, we need to know what to measure. A recently published review of literature has revealed more than 100 different definitions of circular economy, reflecting that there is no uniform understanding of the term. This is also reflected in the existing monitoring systems and the very diverse academic suggestions on how the circular economy should be measured.
In the present project, a systematic desk study on circular economy literature and monitoring systems has formed the basis for selecting points of measurement covering the material flow, societal factors, and the economic, social and environmental impacts of a circular transition. An index of points of measurement prepared during the first phases of the project has guided the identification and categorisation of circular economy indicators.
Where is data available, and where do we need to collect new data?
The study reveals that at present, all over the Nordics, data streams and indicators are missing especially for the inner loops of the circular economy with strategies such as refuse, product lifetimes, consumption, reuse and repair, whereas data streams and circular economy indicators are available for resource use, waste generation/treatment, and environmental and socio-economic state of affairs.
A monitoring system embracing only selected aspects of the circular economy (where data is readily available) risks exaggerating the focus on these areas and downgrade the importance of other areas where data is unattainable, even though the latter may (in principle) be creating more circular value (such as prolonging products’ lifetimes).
Even on a project scale, few initiatives are measuring circular consumption, products, or production. Data on reuse can be found at virtual and physical reuse shops, but informal transactions between family and friends are not monitored; some research projects are investigating how circular products and productions can be measured. Circular consumption is closely related to attitudes and behaviours, and this complexity is difficult to grasp through quantitative measures.
The project has led to identification and description of around 70 circular economy indicators used or developed in the Nordics. This inventory, which is attached to the present report in a searchable excel file, can serve as inspiration for the formulation of a Nordic circular economy monitoring system.
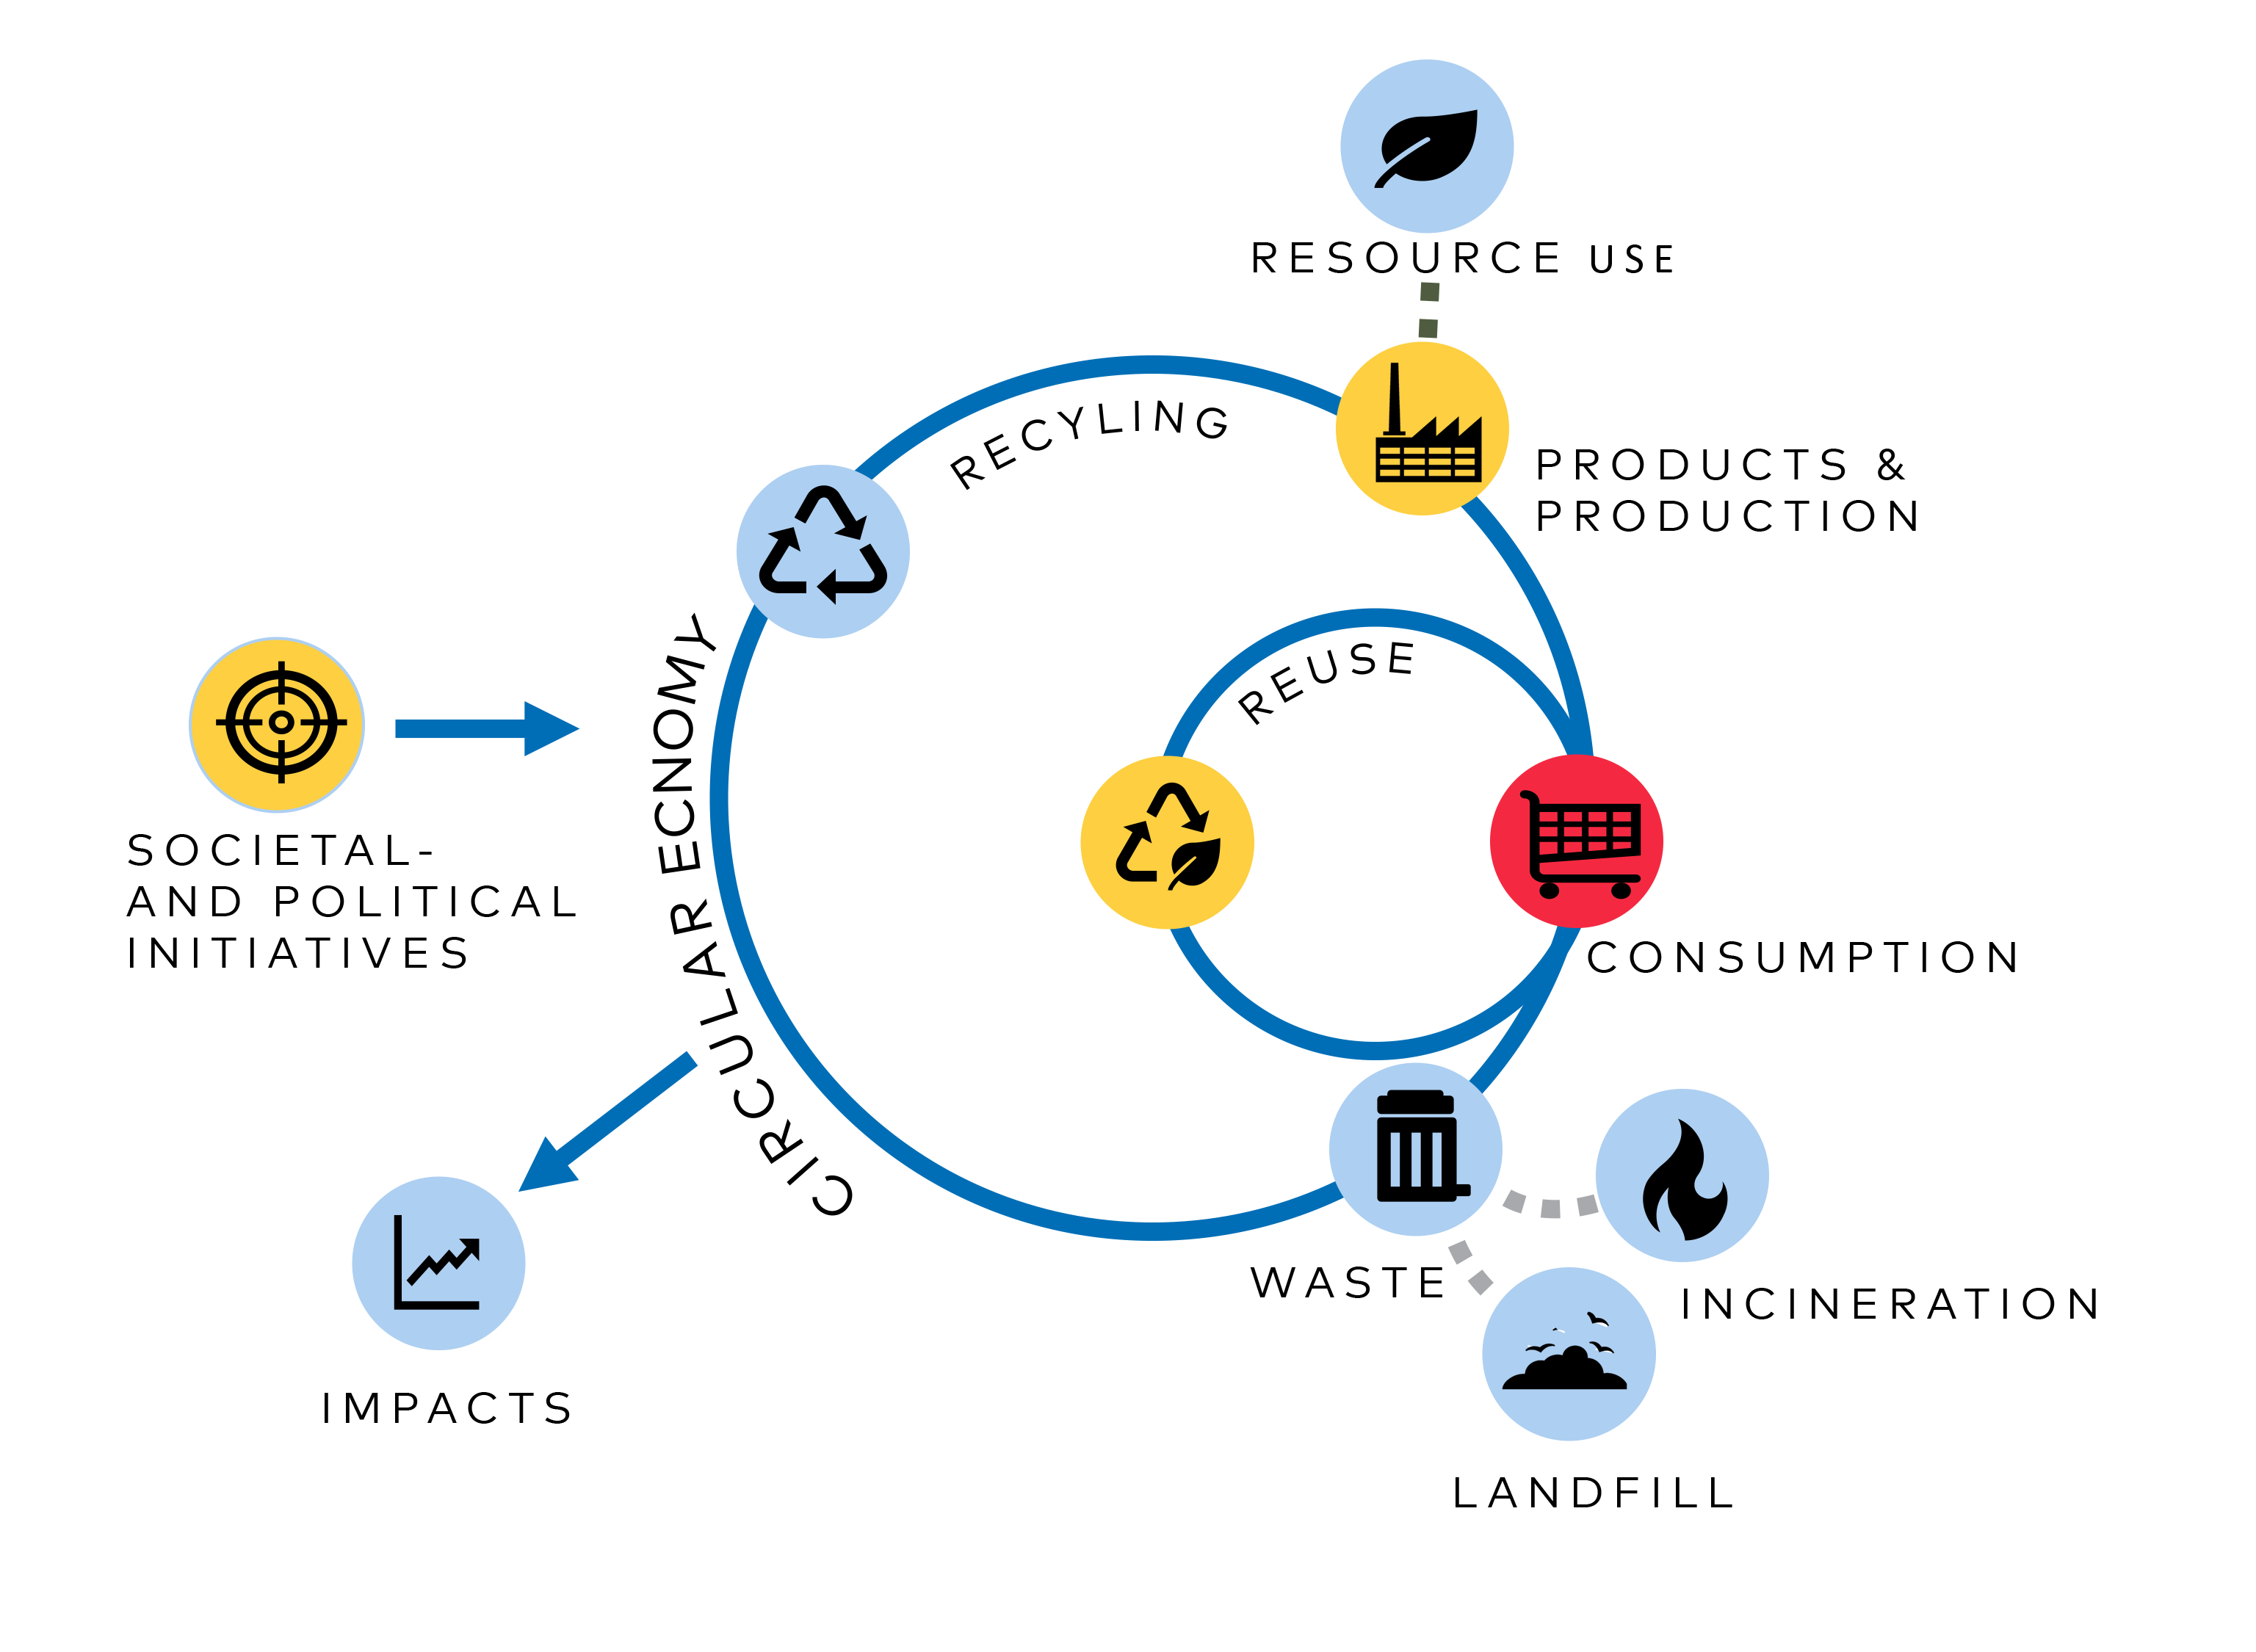
Figure 1: Data accessibility and indicators for the points of measurement. Blue: Data is available; Yellow: indicators developed, but lack of data; Red: Data and indicators are missing.
How does the Nordic countries monitor the circular economy?
The Nordic countries have very different approaches to the monitoring of circular economy. In Sweden, the monitoring framework is inspired by the UN sustainable development goals and the related indicators. In Finland, a monitoring framework linked to sustainable development is under development. In Norway, a monitoring framework is expected to be launched with a new circular economy strategy in the first quarter of 2021. The Danish circular economy strategy does not include a monitoring system as such but indicators on recycling and resource efficiency.
Limited available data on the inner loops – circular products and production, circular consumption and reuse – implies that the circular economy is currently not monitored entirely in any of the Nordic countries.
Nordic collaboration on monitoring the circular economy
The Nordic countries are all data rich, are subject to the same data requirements from the EU, and are frontrunners in the circular transition. The value of a Nordic collaboration on monitoring the circular economy would therefore be high.
Future Nordic collaboration on circular monitoring - Areas of potential significant value
-
The Nordics are mature countries in terms of data availability and effective public and private organisations and systems, and the Nordics could serve as international frontrunners in terms of pursuing and monitoring progress towards circular economy.
A consolidated monitoring framework would provide the Nordic countries with a basis for cooperation and exchange of best practices in pursuing and monitoring circular economy. Internationally such a joint effort would attract considerable attention and serve as inspiration for other countries striving to become more circular. -
The Nordic countries could in cooperation define relevant indicators and identify data streams covering all aspects of the circular economy – and especially circular consumption, circular products and production, and reuse.
A monitoring system measuring only selected aspects of a circular economy may lead to distorted decisions. The Nordic Working Group on Circular Economy could facilitate a discussion of how all aspects of the circular economy could be monitored; topics include how micro data can be aggregated and the data’s representativity, comparability, and relevance. -
A joint Nordic effort could have great value in testing and piloting experimental data streams on national and sub-national level
EU is currently looking into how the inner circles can be monitored through among others innovative data streams. The Nordic countries and individual cities have the capacities to set up and test such indicators in terms of feasibility, relevance, easiness, and other parameters. -
Co-creation should go beyond the Nordic countries
A Nordic Working Group on Monitoring the Circular Economy could benefit from consulting very closely with the EU (DG ENV), the EEA, EMF, OECD, Nordic organisations at national and sub-national level, and other EU stakeholder to pursue co-creation and ensure exchange of best practices. The EU strategy on circular economy is ambitious and the EU is constantly striving to improve the monitoring of circular economy. The Nordics can learn from the EU, and a collaborative, comprehensive monitoring effort in the Nordics can inspire EU’s elaboration of the monitoring framework on circular economy. -
What you measure is what you get – and the monitoring system should reflect Nordic circular economy priorities
Communication on the progress towards circular economy, brought forward by the monitoring system, can inform decision makers to better support the circular economy transition, in particular if the monitoring system is related to a circular economy strategy that links resources, input, output, outcome, and impacts.
SAMMEN|FATNING
Monitorering af den cirkulære økonomi
Cirkulær økonomi tilbyder en løsning på flere af de bæredygtighedskriser, vi som moderne samfund står over for, bl.a. ressourcekrise, klimaforandring og tab af biodiversitet. Ved at reducere vores forbrug og fastholde materialer i kredsløbet så længe som muligt, genereres mindre affald, færre drivhusgasudledning og mindre forurening, og samtidig betyder det lavere træk på ressourcerne et større areal til vild natur. I EU’s Handlingsplan for Cirkulær Økonomi (2020) udlægges cirkulær økonomi da også som en nøglekatalysator for at afkoble økonomisk vækst og miljøforringelse.
Med sigte på at styrke dokumentation og beslutningstagning, skal de i praksis opnåede resultater og effekter af den cirkulære økonomi måles og vurderes, og et monitoreringssystem for cirkulær økonomi muliggør, at regeringer og interessenter kan følge fremskridtet mod en cirkulær økonomi. Et veletableret monitoreringssystem kan endvidere etablere kausale sammenhænge mellem aktiviteter, resultater og effekter og dermed informere beslutningstagere om, hvordan ressourcer bør allokeres, og hvor fremskridt allerede ses.
Dette projekt, der er bestilt af Nordisk Ministerråds Arbejdsgruppe for Cirkulær Økonomi, har kortlagt indikatorer for cirkulær økonomi i alle de nordiske lande på både nationalt og lokalt niveau. Projektet udgør dermed en første videnskortlægning til at promovere monitorering af cirkulær økonomi i de nordiske lande.
Hvad skal måles i den cirkulære økonomi?
For at kunne udvikle et monitoreringssystem for cirkulær økonomi, må vi vide, hvad der skal måles. Et nyligt lanceret litteraturstudie viser imidlertid, at der findes mere end 100 forskellige definitioner på cirkulær økonomi, hvilket da også afspejles i den variation, der ses i den eksisterende monitorering såvel som i forskningens bud på, hvordan cirkulær økonomi skal måles.
Et systematisk litteraturstudie af cirkulær økonomi og nationale monitoreringssystemer har udgjort fundamentet for udvælgelsen af en række målepunkter, der dækker materiale kredsløb, samfundsfaktorer og økonomiske, sociale og miljømæssige effekter af den cirkulære omstilling. En taksonomi er udarbejdet med henblik på at guide identifikation og kategorisering af indikatorer for cirkulær økonomi.
Hvor findes data, og hvor skal ny data indsamles?
Kortlægningen har afdækket en mangel data om de indre kredsløb af den cirkulære økonomi, herunder at undgå forbrug samt øge levetiden og genbruget af produkter. For de ydre kredsløb af den cirkulære økonomi – som handler om affald og genanvendelse – er der bedre data og flere indikatorer. Endelig findes i alle de nordiske lande målinger af miljømæssige og socioøkonomiske effekter, som dog kun med vanskelighed og usikkerhed kan korreleres direkte med den cirkulære omstilling.
Data for genbrug kan findes for virtuelle og fysiske butikker, men denne data findes ikke aggregeret lokalt eller nationalt; der måles heller ikke på uformelle transaktioner mellem venner og familie. Cirkulært forbrug er tæt relateret til holdninger og adfærd, og den høje kompleksitet er svær at indfange gennem kvantitative mål.
Dette projekt har identificeret 70 indikatorer for cirkulær økonomi, anvendt eller udviklet i Norden. Disse indikatorer er præsenteret i rapporten samt i en søgbar excel-fil, som kan inspirere nordiske monitoreringssystemer for cirkulær økonomi.
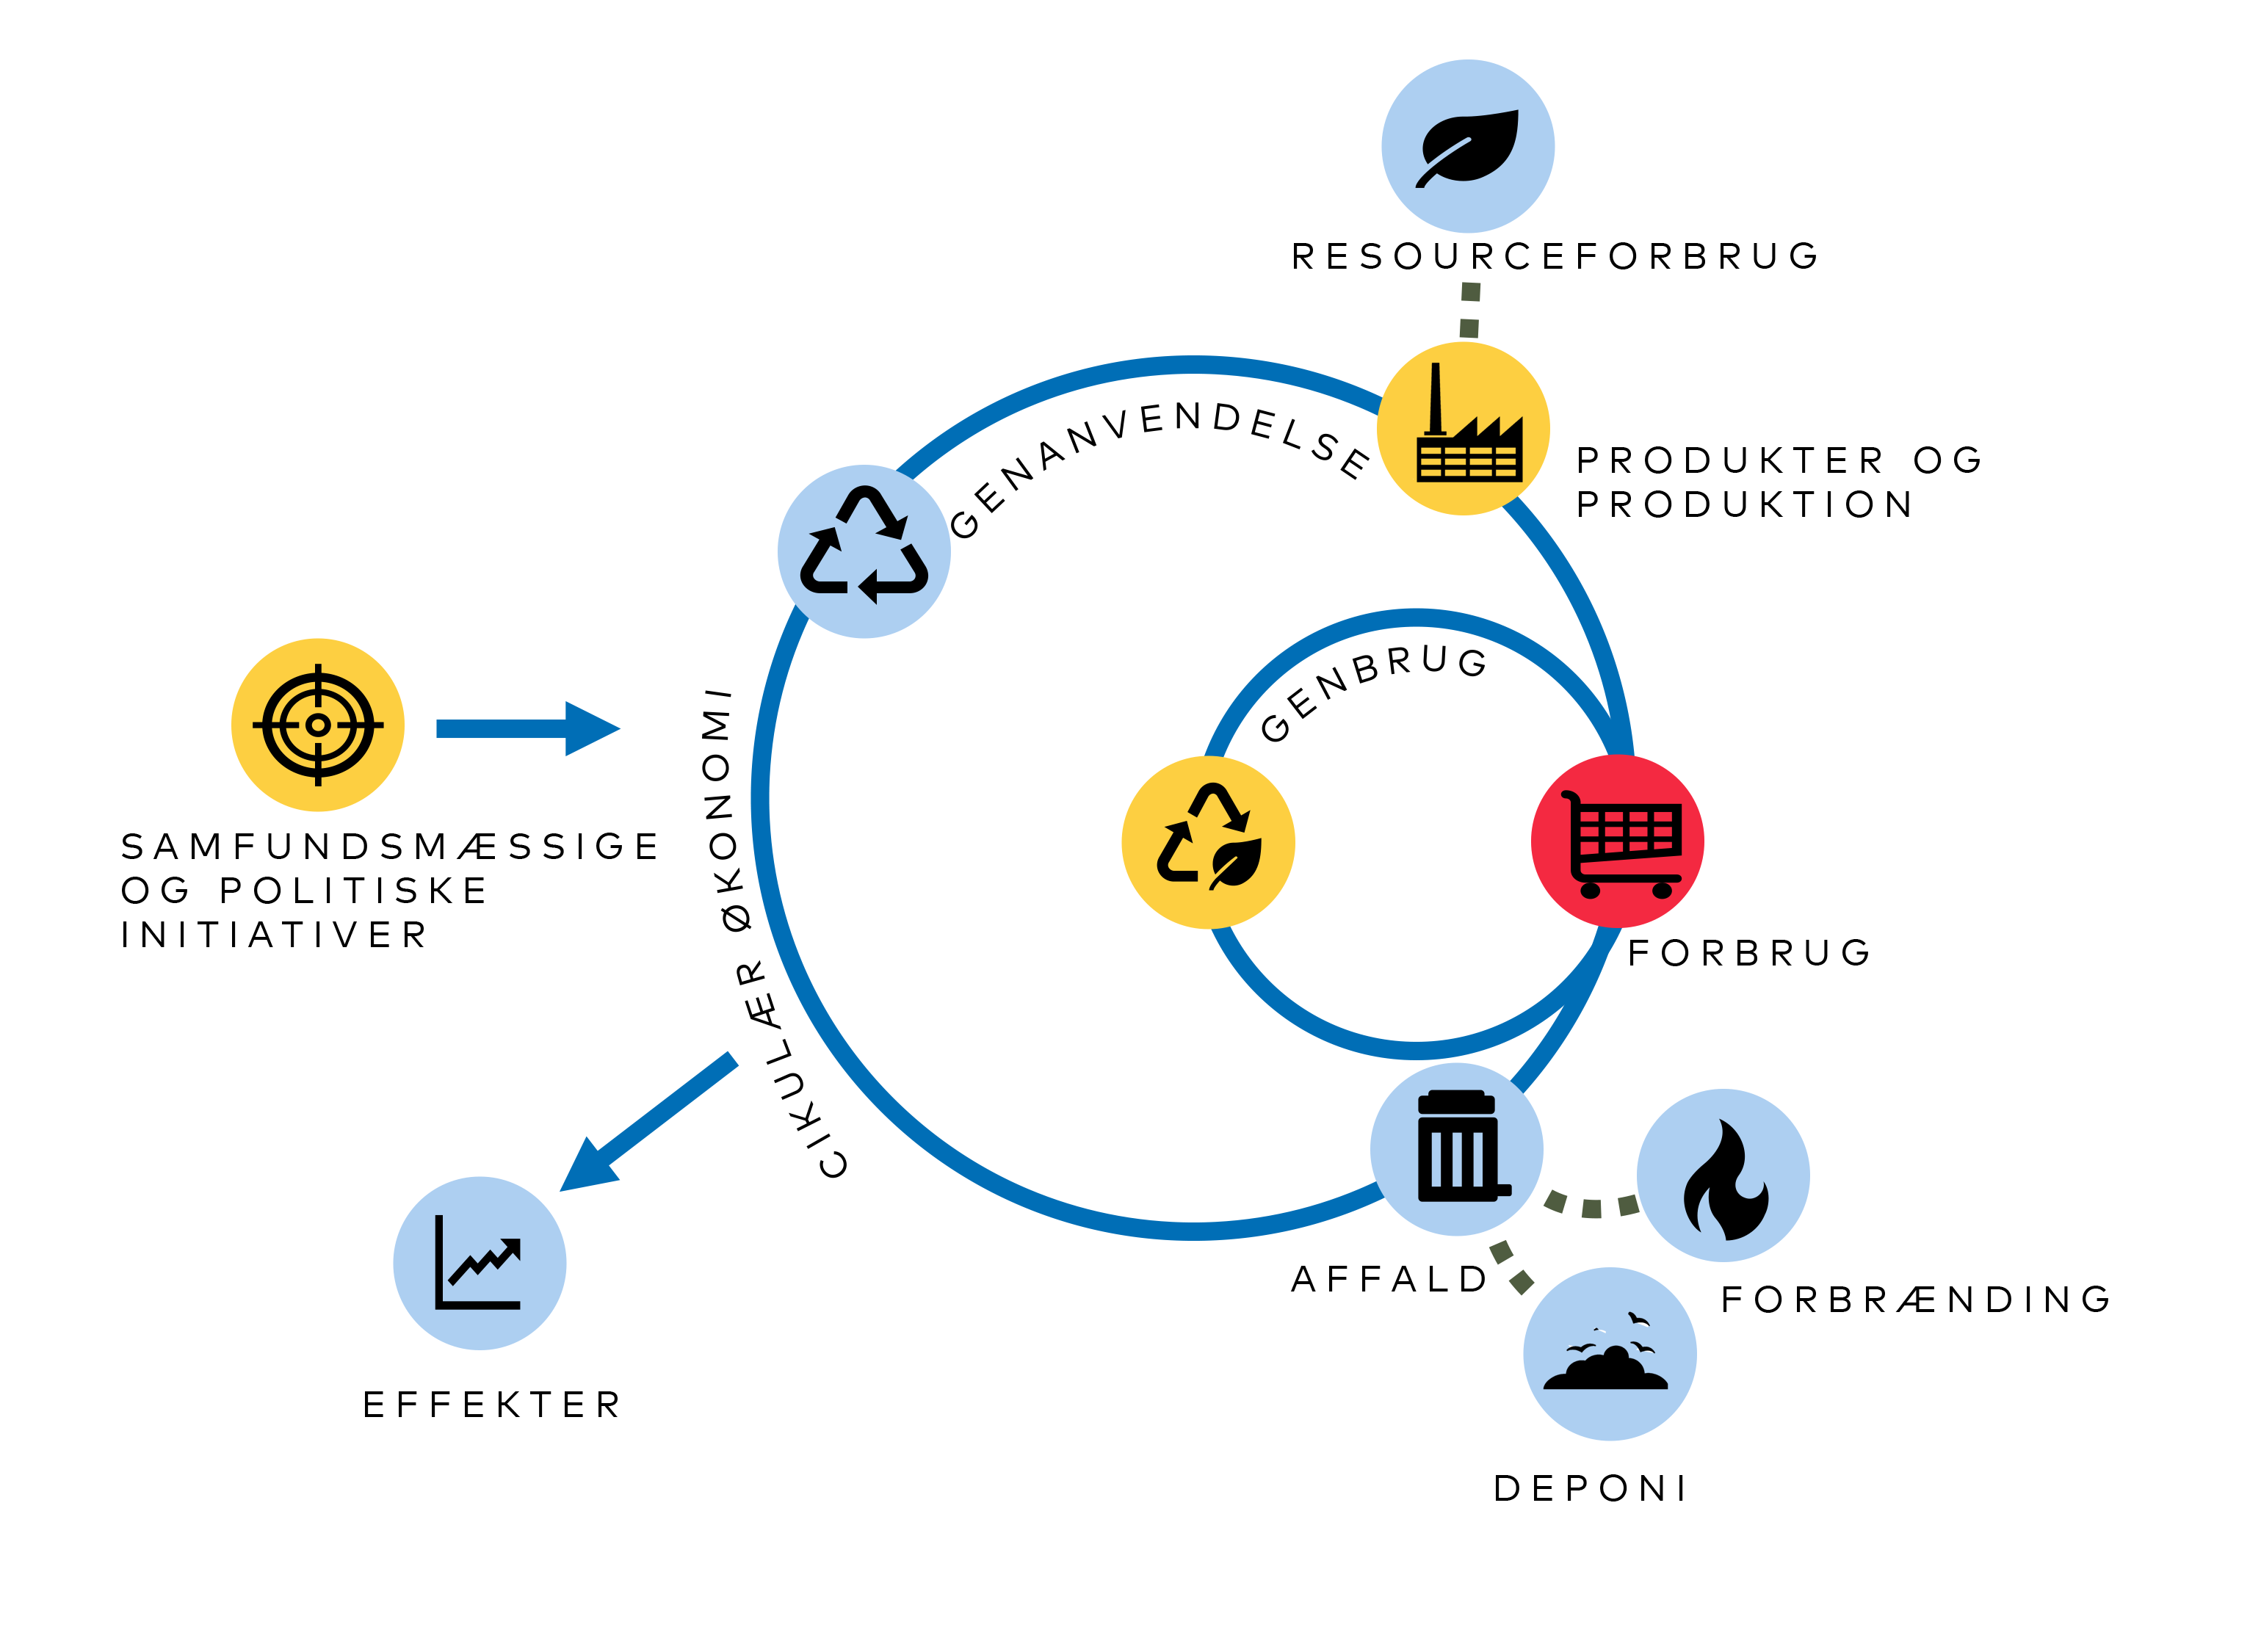
Figur 1: Datatilgængelighed og indikatorer for målepunkterne.
Blå: Data er tilgængelig. Gul: Indikatorer udviklet, manglende data. Rød: Data og indikatorer mangler
Hvordan monitorerer de nordiske lande cirkulær økonomi?
De Nordiske lande har forskellige tilgange til at monitorere den cirkulære økonomi. I Sverige har de udarbejdet et monitoreringsrammeværk inspireret af FN’s Verdensmål for Bæredygtig Udvikling. I Finland er et monitoreringssystem undervejs, tæt relateret til bæredygtig udvikling. I Norge forventes et monitoreringssystem lanceret med den kommende strategi for cirkulær økonomi i første kvartal 2021. Den danske strategi for cirkulær økonomi medtager ikke et monitoreringssystem, men der findes indikatorer for genanvendelse og ressourceeffektivitet. For alle lande gælder en begrænset datatilgængelighed på de indre kredsløb – cirkulære produkter og produktion, cirkulært forbrug og genbrug.
Nordiske samarbejde om monitorering af den cirkulære økonomi
De Nordiske lande er rige på data, er underlagt de samme datakrav fra EU og er frontløbere i den cirkulære omstilling. Den potentielle værdi af et nordisk samarbejde om monitorering af cirkulær økonomi er derfor høj og kan inspirere også udover Nordens grænser.
Fremtidigt nordisk samarbejde om cirkulær monitorering – Områder med signifikant værdi
- De nordiske lande er modne, når det kommer til datatilgængelighed og effektive offentlige – og private organisation og systemer, og Norden kan derfor agere frontløber på monitorering af cirkulær økonomi.
Et konsolideret monitoreringssystem for cirkulær økonomi vil give de nordiske lande et grundlag for samarbejde og udveksling af erfaringer. En sådan fælles indsats vil tiltrække opmærksomhed og tjene som inspiration for andre lande, der arbejder på at blive mere cirkulære.
- De nordiske lande kan i samarbejde definere og indsamle data, der afspejler alle aspekter af den cirkulære økonomi og særligt cirkulært forbrug, cirkulære produkter og produktion samt genbrug. Den Nordiske Arbejdsgruppe for Cirkulære Økonomi bør drøfte, hvordan alle aspekter af den cirkulær økonomi monitoreres. Emnerne inkluderer fremskaffelse af mikrodata samt forhold omkring datarepræsentativitet, sammenlignelighed og relevans.
- En fælles nordisk indsats kan have stor værdi i test og pilotforsøg med eksperimentelle datastrømme på nationalt og subnationalt niveau
EU undersøger i øjeblikket, hvordan de indre cirkler kan overvåges gennem blandt andet innovative datastrømme. De nordiske lande og de enkelte byer har kapacitet til at oprette og teste sådanne indikatorer med hensyn til gennemførlighed, relevans og repræsentativitet.
- Samskabelse lokalt og internationalt kan skabe øget værdi
En nordisk arbejdsgruppe om monitorering af den cirkulære økonomi kan drage nytte af at konsultere tæt med en lang række aktører (fx EU (DG ENV), EEA, OECD, EMF) for at styrke samskabelse og sikre udveksling af erfaringer. EU-strategien for cirkulær økonomi er ambitiøs, og EU stræber konstant efter at forbedre overvågningen af cirkulær økonomi. Norden kan lære af EU, og en samarbejdende, omfattende monitoreringsindsats i Norden kan inspirere EU's udarbejdelse af overvågningsrammen om cirkulær økonomi.
- Hvad du måler er, hvad du får - og et monitoreringssystem kan med fordel afspejle de nordiske cirkulære prioriteter
Kommunikation om den cirkulære omstilling med afsæt i et monitoreringssystem kan informere beslutningstagere, især hvis monitoreringssystemet er relateret til en cirkulær økonomistrategi, der forbinder ressourcer, input, output, resultat, og påvirkninger.
ABBRE|VIA|TIONS, ACRO|NYMS AND DICTIO|NARY
| CE | Circular economy: “To maintain the value of products, materials and resources for as long as possible by returning them into the product cycle at the end of their use, while minimising the generation of waste. The fewer products we discard, the less materials we extract, the better for our environment.”1 |
| Circularity ladder | Contains of ten circularity strategies in order of priority: Refuse (R0), Rethink (R1), Reduce (R2), Reuse (R3), Repair (R4), Refurbish (R5), Remanufacture (R6), Repurpose (R7), Recycle (R8), Recover (R9). |
| Circular consumption | Circular consumption is to reduce consumption and increase the intensity of a product (through e.g. sharing, leasing and renting) as well as extending the lifetime by repair, maintenance and reuse. |
| Circularity metrics | Circularity metrics refer to a standard of measuring the level of circularity |
| Circular products and production | Circular products are products with one or several of the following attributes: Extended lifetime, separation of materials, no hazardous chemicals applied, high resource efficiency, based on secondary or reused resources or reused material. Circular production refers to how the materials are extracted and processed including produced with low environmental footprint, with no use of hazardous chemicals and with high resource- and energy efficiency. |
| Decoupling | Decoupling means that factors that are currently correlating – such as growth and resource use as well as consumption and waste production – are made independent of one another. |
| EC | European Commission |
| EPA | Environmental Protection Agency |
| EW-MFA | Economy-Wide Material Flow Accounting is a method to map resource flows from extraction and processing of materials to waste and emission to air and soil. |
| GPP | Green Public Procurement |
| Impacts | It is estimated that CE will deliver a range of impacts including; lower resource use, resource security, reduction of CO2-emission, job creation, economic growth, and increase of biodiversity. |
| Monitoring system | A systematic and continuous data collection on an intervention or a trend |
| MCI | Material Circularity Indicator (MCI) measures how circular a products are based on its material compo-sition throughout the entire lifecycle. MCI is based on information of input of materials, use, destina-tion after end of life-time and the efficiency of recycling. MCI is developed by Ellen MacArthur Foun-dation. |
| Political and societal initiatives promoting CE | Activities initiated by a public agency, a civil society organisation or a company with the aim to pro-mote CE. |
| RACER | An acronym for Relevant, Accepted, Credible, Easy and Robust expressing criteria for good indicators. |
| Recover | Incineration of materials, recovering their energy |
| Recycling | Processing of materials to achieve the original high-quality or low-quality |
| Reduce | More efficient use and/or manufacture of products through the use of fewer natural resources and materials |
| Refuse | Turning a product redundant by cancelling its function, or by substituting it with a radically different product |
| Rethink | Intensifying product use (e.g. via product sharing or multifunctional products) |
| Refurbish | Refurbishing and/or modernising an older product, so that the improved version can be used in the product’s original function |
| Remanufacture | Using parts of a discarded product in a new product of the same function |
| Repair | Repair and maintenance of broken or malfunctioning product, to enable continuation of its original function |
| Repurpose | Using discarded products or their parts in new products with a different function |
| Resource use | Resources used in an economy |
| Reuse | Reuse of discarded yet still usable product, for the same purpose, by a different user |
| SDG | Sustainable Development Goals |
| WFD | Waste Framework Directive |
1. CIRCULAR ECONOMY
During the last decade, numerous definitions on the term Circular Economy have been formulated, with slightly different angles and focus. The EU describes a circular economy as aiming “to maintain the value of products, materials and resources for as long as possible by returning them into the product cycle at the end of their use, while minimising the generation of waste. The fewer products we discard, the less materials we extract, the better for our environment.”[1]EC (2015). Closing the loop – an action plan for circular economy
A recent meta-study reviews 114 definitions of the circular economy and ends up with the following definition: “An economic system that replaces the ‘end-of-life’ concept with maintaining the value of products, materials, and resources reducing, alternatively reusing, recycling and recovering materials in production/distribution and consumption processes. It operates at the micro level (products, companies, consumers), meso level (eco-industrial parks) and macro level (city, region, nation and beyond), with the aim to accomplish sustainable development, thus simultaneously creating environmental quality, economic prosperity and social equity, to the benefit of current and future generations. It is enabled by novel business models and responsible consumers.”[2]Kirchher et al. (2018). Coding framework of CE barriers.
Aiming at guiding a broad search for relevant indicators introduced in the Nordics, the project adopts a ten-step circular ladder that extends the three steps “reduce, reuse, recycle” with seven more circular strategies - ranging from “Refuse” (R0) to “Recover” (R9)[3]PBL Netherlands (2018). Circular economy: what we want to know and can measure.. By prioritising circular strategies, the circularity ladder offers a method to assess the quality and value of how materials and products are being handled and maintained in the economy. Refusing consumption and reuse are thus creating a higher value than recycling.
| TABLE 1. THE CIRCULARITY LADDER | ||
| Smarter creation and use of products | R0 Refuse | Turning a product redundant by cancelling its function, or by substituting it with a radically different product |
| R1 Rethink | Intensifying product use (e.g. via product sharing or multifunctional products) | |
| R2 Reduce | More efficient use and/or manufacture of products through the use of fewer natural resources and materials | |
| Extending the lifespan of products and parts | R3 Reuse | Reuse of discarded yet still usable product, for the same purpose, by a different user |
| R4 Repair | Repair and maintenance of broken or malfunctioning product, to enable continuation of its original function | |
| R5 Refurbish | Refurbishing and/or modernising an older product, so that the improved version can be used in the product’s original function | |
| R6 Remanufacture | Using parts of a discarded product in a new product of the same function | |
| R7 Repurpose | Using discarded products or their parts in new products with a different function | |
| Useful application of materials | R8 Recycle | Processing of materials to achieve the original high-quality |
| Processing of materials to low-quality | ||
| R9 Recover | Incineration of materials, recovering their energy | |
| Source: PBL Netherlands (2018). What we want to know and can measure | ||
1.1 Monitoring the Circular Economy
A monitoring system on the circular economy is a systematic and continuous collection of data informing on the progress towards the circular economy[1]EC (2019). Tool #41: Monitoring arrangement and indicators.. The monitoring system will inform decision makers on whether the circular transition is on the right track and allow for fact-based revision of plans and strategies.
To assess the progress of circular economy a variety of indicators can be used. An indicator is a quantitative or qualitative measure that informs about a given phenomenon (here circular economy). Simple and well-defined phenomena such as “recycling” can be measured through the indicator “recycling rate”, whereas an index of indicators is needed to inform about more complex and broad concepts as the ‘circular economy’.
Indicators can focus on monitoring process and activities, output, outcome, or impact (Figure 1).
Footnotes
- ^ EC (2019). Tool #41: Monitoring arrangement and indicators.
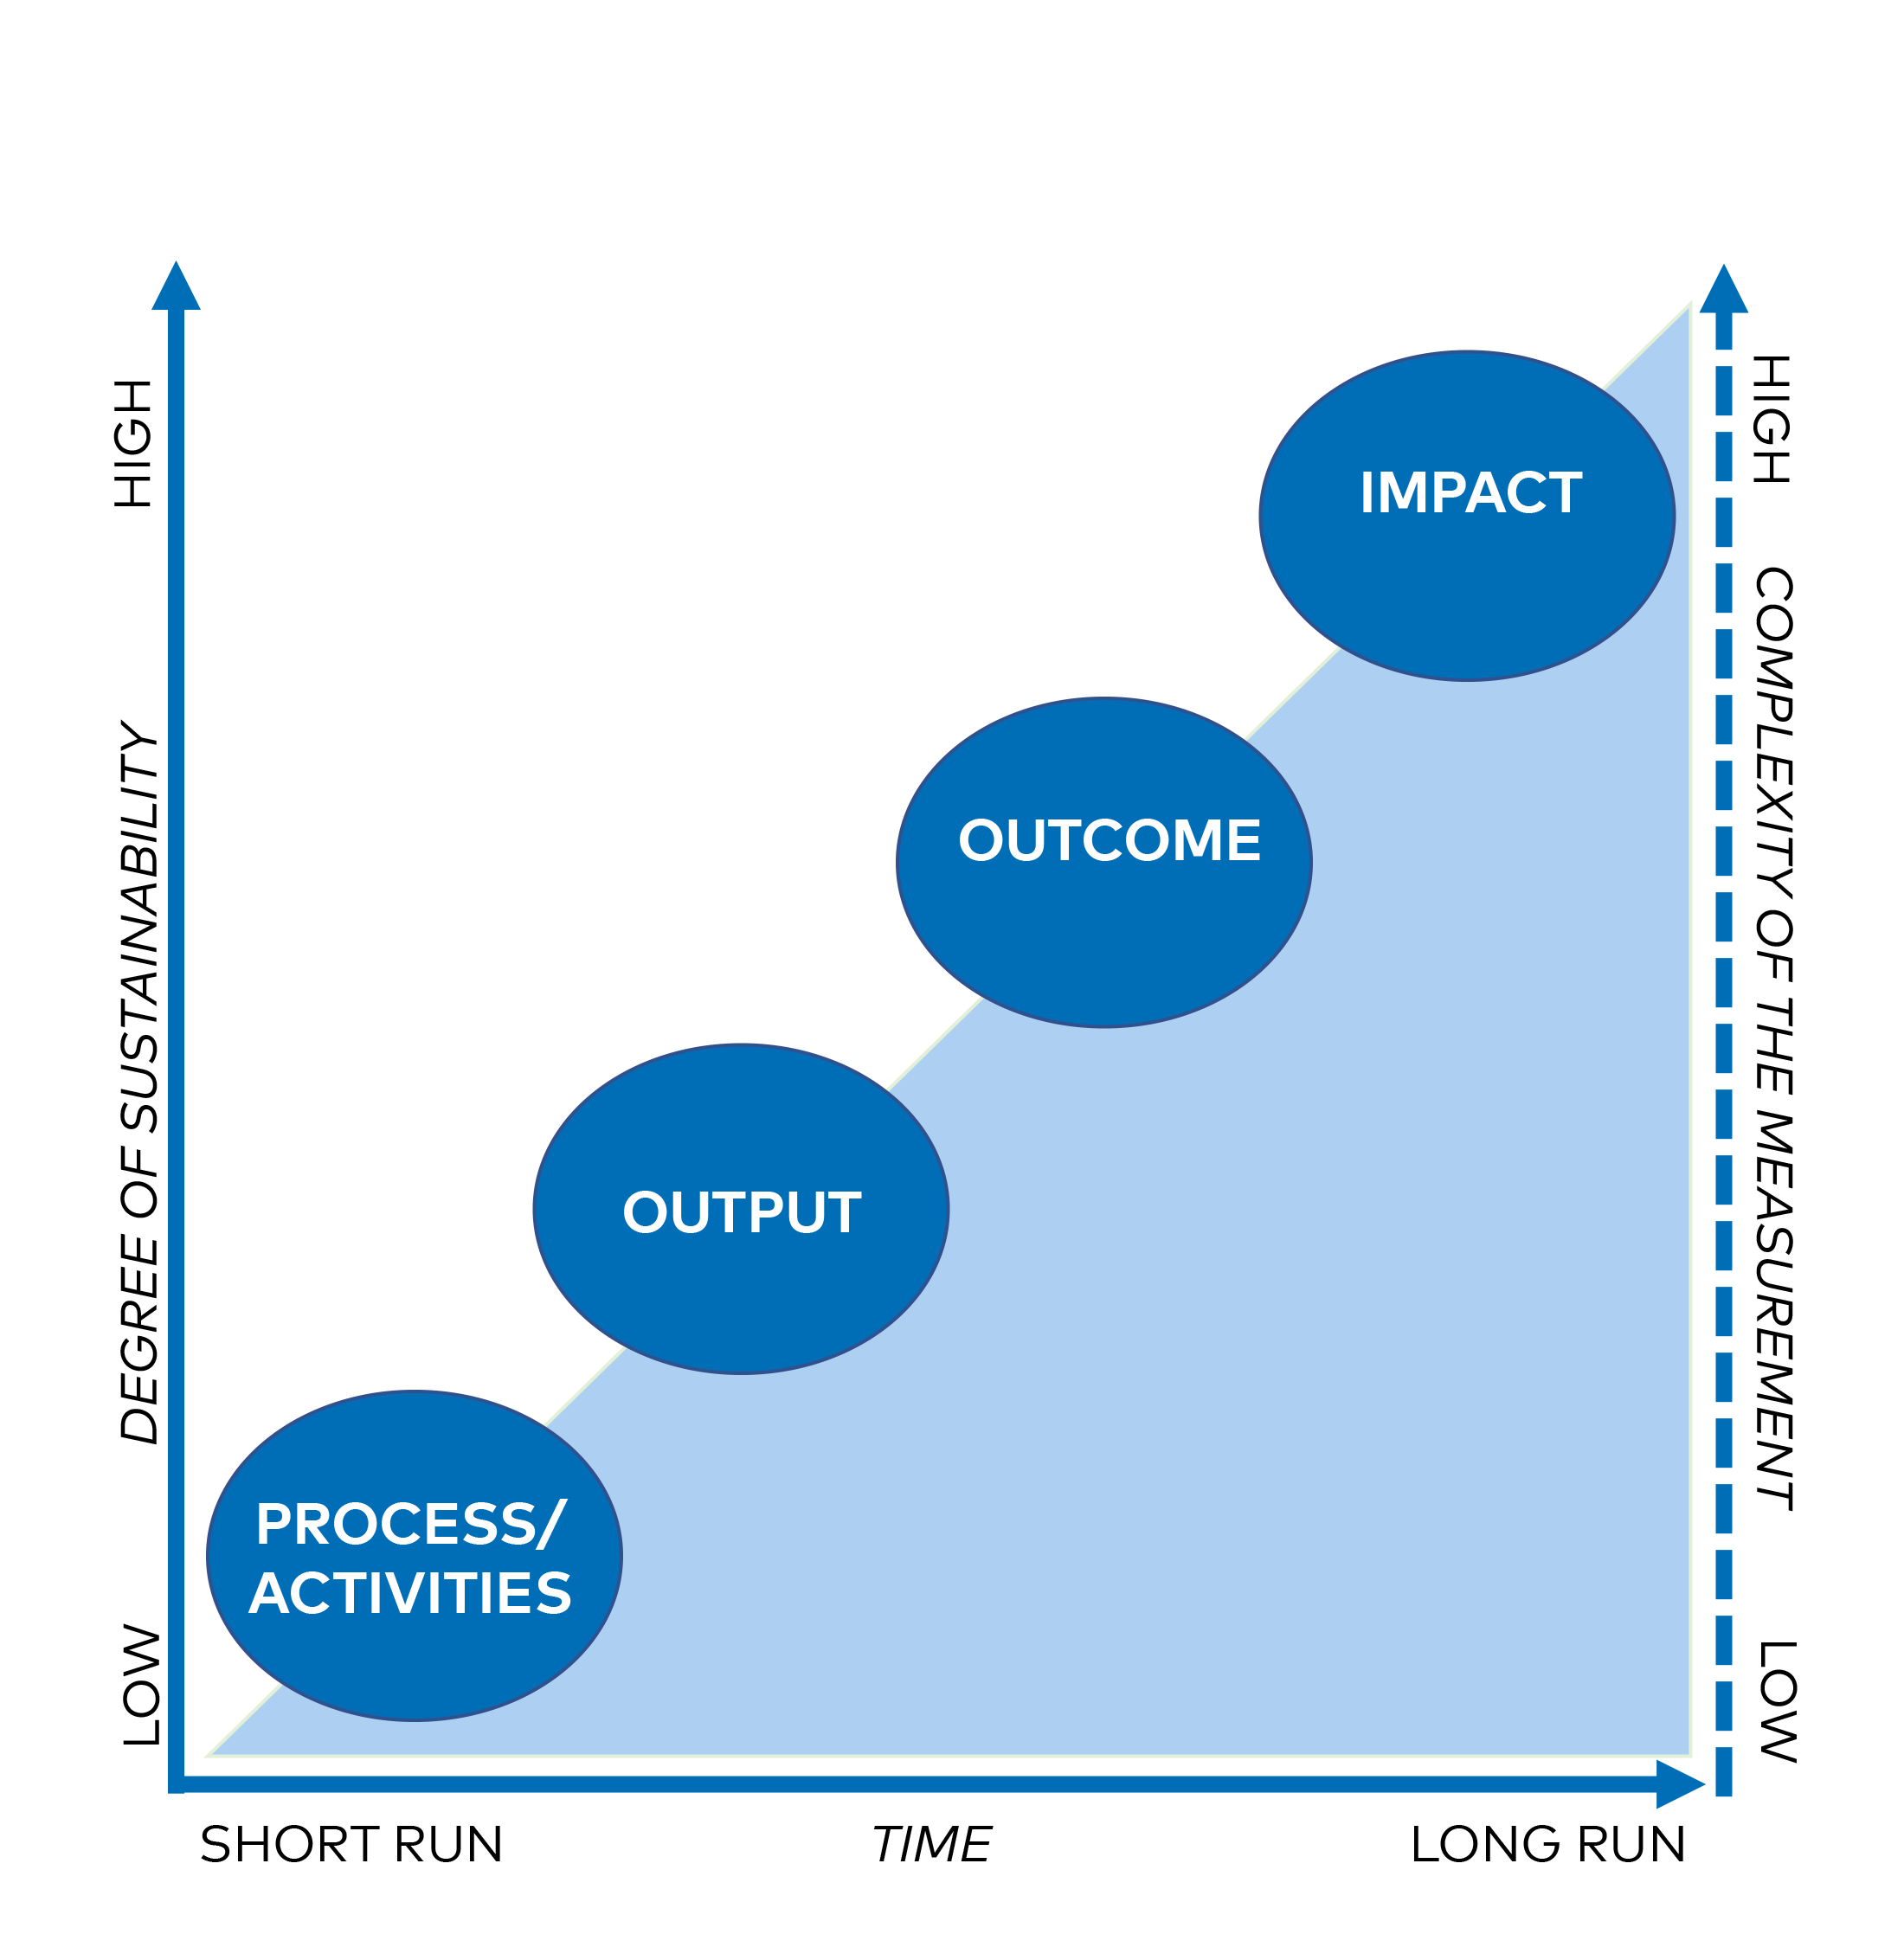
Figure 2. The factors process/activities, output, outcome, and impact follow a trend where the degree of sustainability and the complexity of measurement increase over time.
The time span between implementation of specific measures and the impact can be long. The causal linkages between activities and outputs and impact are often difficult to prove as many competing societal factors influence the development of environment, economy and society. Measuring outcome and impact is thus way more complex and time heavy than measuring activities.
The European Commission stresses that a monitoring system should be informing on an intervention[1]EC (2019). Tool #41: Monitoring arrangement and indicators., implying that a monitoring system on circular economy should be designed in accordance with a strategy on circular economy. A monitoring system designed to a strategy can observe if the strategy targets are achieved or pursued, and whether the economy is on the right track to reach the stated circular objectives. The monitoring system thus functions as an ongoing evaluation-mechanism informing future decisions and enabling focused and fact-based strategy revisions.
Another approach to design a monitoring system is to let the definition of circular economy guide which indicators that are included in a monitoring system. If the circular economy is well-defined and is systematically operationalised into relevant indicators, the measurement validity – meaning that you actually measure the circular economy - will be higher[2]Adcock, R. and D. Collier (2001). Measurement validity: A shared standard for qualitative and quantitative research. A monitoring system based on the definition of circular economy may be less vulnerable to changing political agendas than the strategy-based approach.
1.1.1 EU’s monitoring system on circular economy
The EC has initiated a monitoring system on circular economy covering the entire EU and the individual member states and EFTA countries. The monitoring system relies on data reported by national statistics to Eurostat. The monitoring framework embraces four overall themes, ten variables and 23 indicators as presented in Table 2[1]At present (early 2020), there is lacking data for the indicators of green public procurement, food waste, self-sufficiency of raw materials and end-of life recycling input rates..
Footnotes
- ^ At present (early 2020), there is lacking data for the indicators of green public procurement, food waste, self-sufficiency of raw materials and end-of life recycling input rates.
| TABLE 2. EU’S INDICATORS ON CIRCULAR ECONOMY | |||
| Production and Consumption | Waste Management | Secondary Raw Materials | Competitiveness and Innovation |
| 1. Self-sufficiency of raw materials for production in the EU (NA)9 2. Green public procurement (NA) 3. Waste generation (as an indicator for consumption aspects); a: Per capita b: Per GDP-unit (excl. major mineral waste)10 c: Per DMC 4. Food waste (NA) | 5. Recycling rates a: Of municipal waste b: Of all waste excl. major mineral waste 6. Recycling rates of specific waste streams a: overall packaging b: Plastic packaging c: Wooden packaging d: E-waste e: Bio-waste f: Construction and Demolition waste | 7. Contribution of recycled mate-rials to raw materials demand; a: End-of life recycling input rates (NA) b: Circular Material Use rate (CMU rate) 8. Trade of recyclable raw materials be-tween the EU Member States and with the rest of the world. a: Imports from non-EU countries b: Export to non-EU-countries c: Intra EU-trade | 9. Private investments, jobs and gross value added11; a: Gross investment in tangible goods b: Persons employed12 c: Value added factor costs 10. Patents related to recycling and secondary raw materials as a proxy for innovation. |
Notes: [1]Is not informing how the materials are extracted, which implies it also include materials from mining and thus linear extraction methods. Moraga et al. (2019): Circular economy indicators: what do they measure? [2]General mineral waste includes soil and gravel, which is excluded as mineral waste accounts for 90% of the total weight of waste generation. Likewise, there a many different ways of reporting mineral waste across member states. [3]Measure on the sectors of recycling, reuse and repair and do not include spill-over effects on other sectors. [4]In circular economy sectors – recycling, reuse and repair
Footnotes
- ^ Is not informing how the materials are extracted, which implies it also include materials from mining and thus linear extraction methods. Moraga et al. (2019): Circular economy indicators: what do they measure?
- ^ General mineral waste includes soil and gravel, which is excluded as mineral waste accounts for 90% of the total weight of waste generation. Likewise, there a many different ways of reporting mineral waste across member states.
- ^ Measure on the sectors of recycling, reuse and repair and do not include spill-over effects on other sectors.
- ^ In circular economy sectors – recycling, reuse and repair
EU’s monitoring framework contains indicators on recycling and waste amounts, but have limited focus on product lifetime, circular design and circular business models[1]Llorente-Gonzáles, L. J. og Vence, X. (2019). Docoupling or ’defaffing’? The underlying conceptualization of circular economy in the European Union Monitoring Framework. The system does not include environmental outcome or impact indicators (such as GHG-emissions, biodiversity etc.)[2]Llorente-Gonzáles, L. J. og Vence, X. (2019). Docoupling or ’defaffing’? The underlying conceptualization of circular economy in the European Union Monitoring Framework.
In EU’s new action plan for circular economy, “For a cleaner and more competitive Europe” (2020), the Commission states that the Monitoring Framework for Circular Economy will be updated to enhance circular consumption, material footprints, and indicators on the interlinkage between circularity, carbon neutrality and the zero-pollution emission. Horizon Europe will be used to improve circularity metrics at various levels, where official statistics are available and where circularity metrics refer to standards of measuring circular economy. Moreover, EC will sharpen monitoring of national actions plan on circular economy to ensure progress[3]EC (2020). Circular economy action plan: A new Circular Economy Action Plan – For a cleaner and more competitive Europe.
Footnotes
- ^ Llorente-Gonzáles, L. J. og Vence, X. (2019). Docoupling or ’defaffing’? The underlying conceptualization of circular economy in the European Union Monitoring Framework
- ^ Llorente-Gonzáles, L. J. og Vence, X. (2019). Docoupling or ’defaffing’? The underlying conceptualization of circular economy in the European Union Monitoring Framework
- ^ EC (2020). Circular economy action plan: A new Circular Economy Action Plan – For a cleaner and more competitive Europe
1.1.1 International experiences with monitoring the circular economy
A range of international stakeholders have developed interesting monitoring systems for circular economy that have been investigated as part of the present study.
- At the national level, the Netherlands and France have developed comprehensive monitoring systems on circular economy[1]PBL Netherlands (2018). What we want to know and can measure.,[2]Magnier et al. (2017). 10 Key Indicators for Monitoring the Circular Economy.
- OECD has developed a model for municipalities and regions to self-assess how mature they are to take up a circular economy transition[3]OECD (2020). The Circular Economy in Cities and Regions: https://www.oecd.org/regional/cities/circular-economy-cities.htm.
- The Ellen MacArthur Foundation has developed circularity metrics for product level (The Material Circularity Indicator) and company level (Circulytics)[4]Ellen MacArthur Foundation (EMF) (2020a). Material circularity indicator: https://www.ellenmacarthurfoundation.org/resources/apply/material-circularity-indicator,[5]Ellen MacArthur Foundation (EMF) (2020b). Circulytics – method introduction.
- The World Business Council for Sustainable Development’s (WBCSD) Circular Transition Indicators aim at supporting companies in accelerating the circular economy by providing information for decision-making through indicators and, on the other hand, to strengthen communication with stakeholders[6]WBCSD (2020). Circular Transition Indicators V1.0.
- The Circularity Gap Reporting Initiative is an annual review of the progress of the circular economy in the world and analysis of developments and challenges in different countries and sectors (“gaps”)[7]Circular Norway (2020). The Circularity Gap Report Norway.
- The International Organization for Standardization ISO is developing models, tools, requirements and guidelines to support the implementation of circular economy projects. Currently, a standard for measuring circular economy is being developed by ISO and is expected to be launched in May 2022[8]ISO (2018). ISO/TC 323 Circular economy: https://www.iso.org/committee/7203984.html.
Footnotes
- ^ PBL Netherlands (2018). What we want to know and can measure.
- ^ Magnier et al. (2017). 10 Key Indicators for Monitoring the Circular Economy
- ^ OECD (2020). The Circular Economy in Cities and Regions: https://www.oecd.org/regional/cities/circular-economy-cities.htm
- ^ Ellen MacArthur Foundation (EMF) (2020a). Material circularity indicator: https://www.ellenmacarthurfoundation.org/resources/apply/material-circularity-indicator
- ^ Ellen MacArthur Foundation (EMF) (2020b). Circulytics – method introduction
- ^ WBCSD (2020). Circular Transition Indicators V1.0
- ^ Circular Norway (2020). The Circularity Gap Report Norway
- ^ ISO (2018). ISO/TC 323 Circular economy: https://www.iso.org/committee/7203984.html
2. METHODO|LOGY
This project has mapped circular economy indicators and assessed Nordic potentials of monitoring the circular economy through four phases.
- Identification of relevant points of measurement to monitor the circular economy.
- Development of a taxonomy to characterise and assess the identified indicators.
- Collection - through interviews and a desk-study – of information on relevant national initiatives and data sets that can contribute to measure the circular economy.
- Information gathering through interviews on the potential pros and cons of a collaborative Nordic effort on monitoring the circular economy in the Nordics.
2.1 Points of measurement
Circular economy is a broad concept involving many actors at all levels of society and encompassing countless potential aspects for monitoring. When aiming at defining indicators providing useful information about the circular economy progress, it is essential to decide what to measure.
The figure below illustrates the key points of measurement of the circular economy, starting with political and societal initiatives, then following the resources in the economy, and ending with the impacts on environment and society.
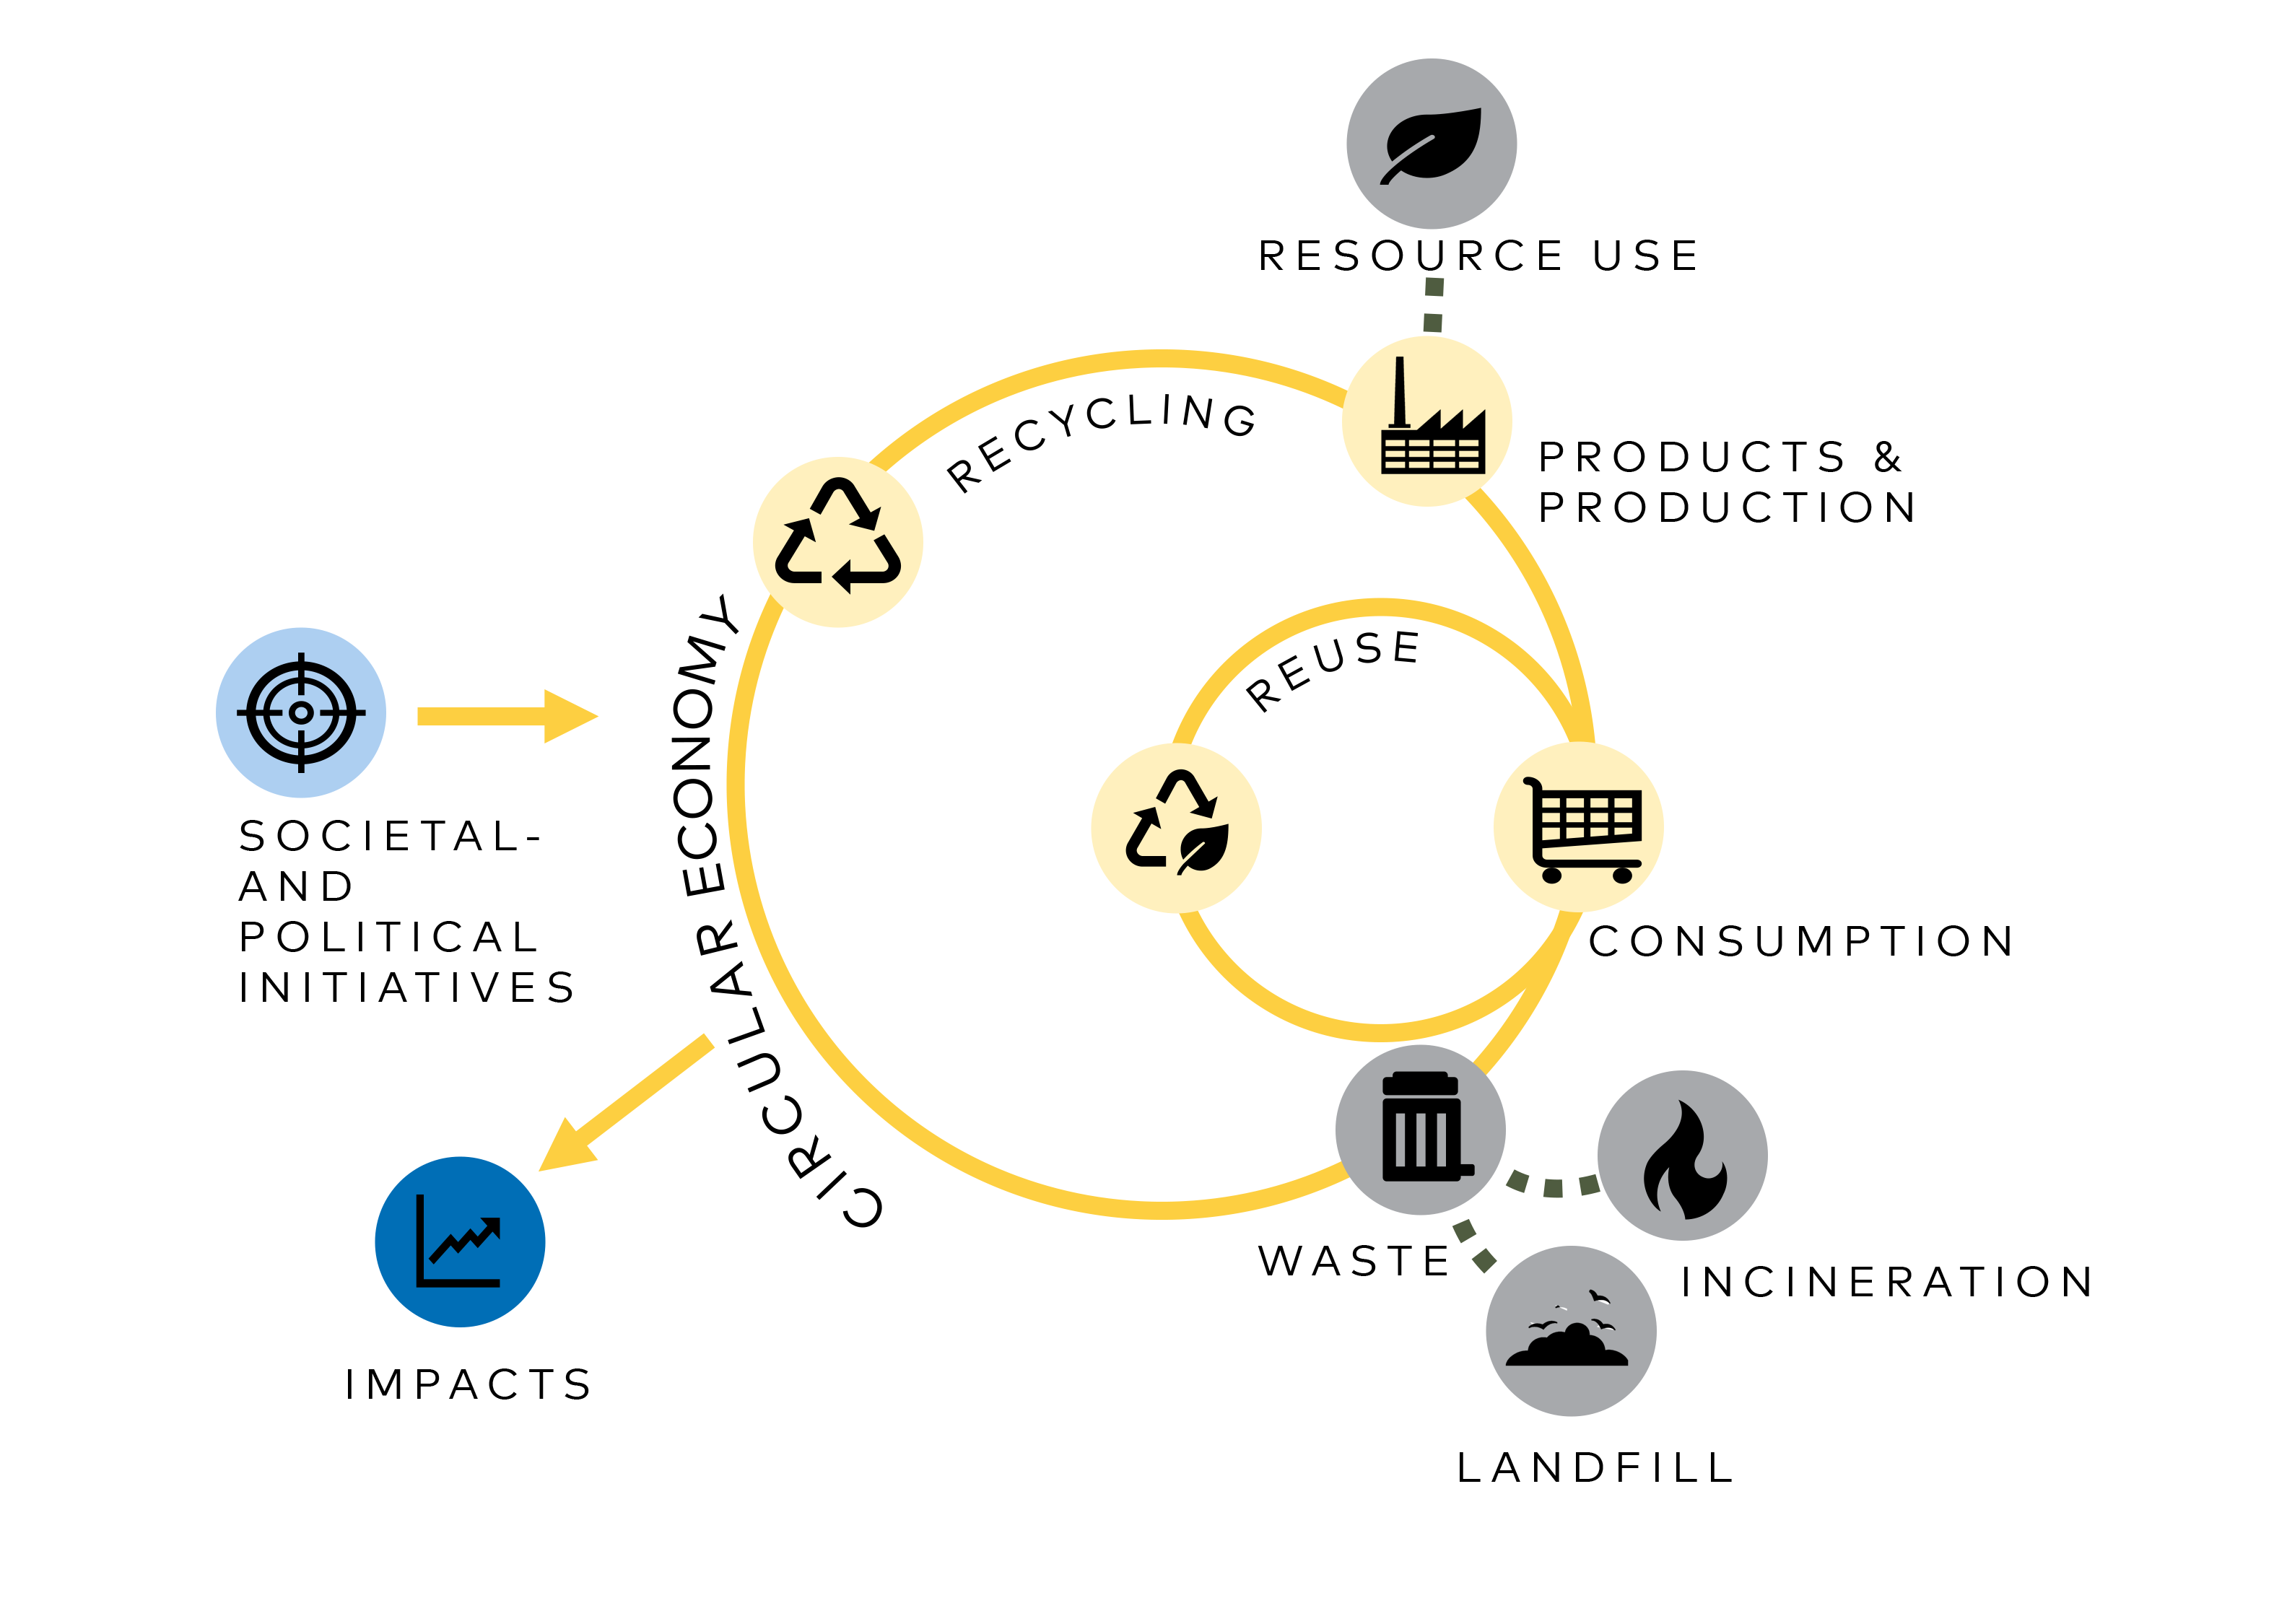
Figure 3: Points of measurement in the circular economy’s
The index of points of measurement in Table 3 has been developed through a methodical and meticulous desk study of literature on circular economy and circular economy indicators.
| TABLE 3. POINTS OF MEASUREMENT | ||||
| Points of measurement | Circular ladder | Definition | Derived from | Relevance |
| Political and societal activities promoting circular economy | All steps in circular ladder can be promoted through political and societal activities. | Political and societal activities initiated by a public agency, a civil society organisation or a company with the aim to promote CE | Theory of Change and the Dutch monitoring system | Information on the scope and depth of political /societal activities provide insight in government and stakeholder prioritisations. |
| Resource use | Indicators reflect realisation of all circular strategies keeping the resources in the loop /minimising the need for new resources. | Use of resources in an economy | The French and Dutch monitoring systems comprise resource use indicators | Reduced resource use is a key outcome of the circular economy |
| Circular production and products | Conscious design of products and lifecycle thinking support all circular strategies | Circular products mean: – Extended lifetime – Separation of materials – No hazardous chemicals – Less resources/high resource efficiency – Based on secondary or reused resources – Recyclable – Repairable Circular production means: – Conscious extraction and processing of materials – Production processes with low environmental footprint – No use of hazardous chemicals – Resource and energy efficiency | The definition of circular economy. EU and France monitoring models include the amount of secondary resources used in production | A key aspect of the circular economy – according to the ladder of circularity. |
| Circular consumption | Circular consumption means refusing, rethinking, reducing, and repairing | – Reduce purchase of products and resources (including less harmful products) – Extend lifetime by repair and maintenance, sharing, leasing or renting – Consume reused goods instead of new products | EU includes green public procurement as an indicator. France includes repair and maintenance. The Netherlands suggests a survey on attitude towards CE. | Covering several of the ten strategies in the circularity ladder (refer to section 1.1), circular consumption constitutes a key aspect of the circular economy |
| Reuse and preparation for reuse | Reuse, refurbishment, preparation for reuse and remanufacturing prolongs the active lifetime of products | – Direct reuse keeps the value of the product intact and the resources in the active loop – Refurbishment, preparation for reuse and remanufacturing make reuse possible. | The definition of circular economy. No inspiration found in international monitoring models | Reuse extends products life and keeps resources in active loops |
| Waste generation and waste treatment including recycling | Recycling, repurpose, recycle and recover | If waste products and materials cannot be prepared for reuse, they can be recycled and used as secondary raw materials in new productions When waste products and materials are incinerated or landfilled, they do not contribute to a circular economy | EU, France and the Netherlands include indicators on recycling in their monitoring systems | Recycling is the most widespread approach to circular economy. Figures on waste amounts inform on the consumption and circular performance |
| Impacts | Impacts express the outcomes and impacts of circular strategies | Circular economy is expected to deliver a range of impacts: – Resource security – Reduced greenhouse gas emissions – Reduced emissions of pollutants to the natural environment – Preservation of resources – Growth – Job creation – Altered land use – Conservation of habitats and biodiversity | The Netherlands include socioeconomic, environmental and climate impacts. EU includes socioeconomic impact and resource security. France includes job creation. | Monitoring of impacts provide a picture of the societal gains of circular economy, legitimising actions and initiatives |
2.2 Taxonomy of circular economy indicators
The term ‘taxonomy’ refers to the characterisation and classification of circular economy indicators in this project, with the following key elements:
- Points of measurement (as described above).
- Level of Theory of Change
- Societal level
- Sector
- Data description.
2.2.1 Theory of change
Circular economy is a process of change, and the concept of “Theory of change” spells out whether the individual indicator is providing information on an activity, an output, an outcome or an eventual impact. Figure 4 illustrates the complexity of monitoring:
- Political processes and societal/business activities are measured before or at the same time as the circular efforts take place (also called ‘ex ante’ or ‘ex durante’).
- The outputs are measured just after activities have been carried through.
- Outcome and impact are measured after outputs have been achieved and societal/environmental gains have been realised (also called ‘ex post’).
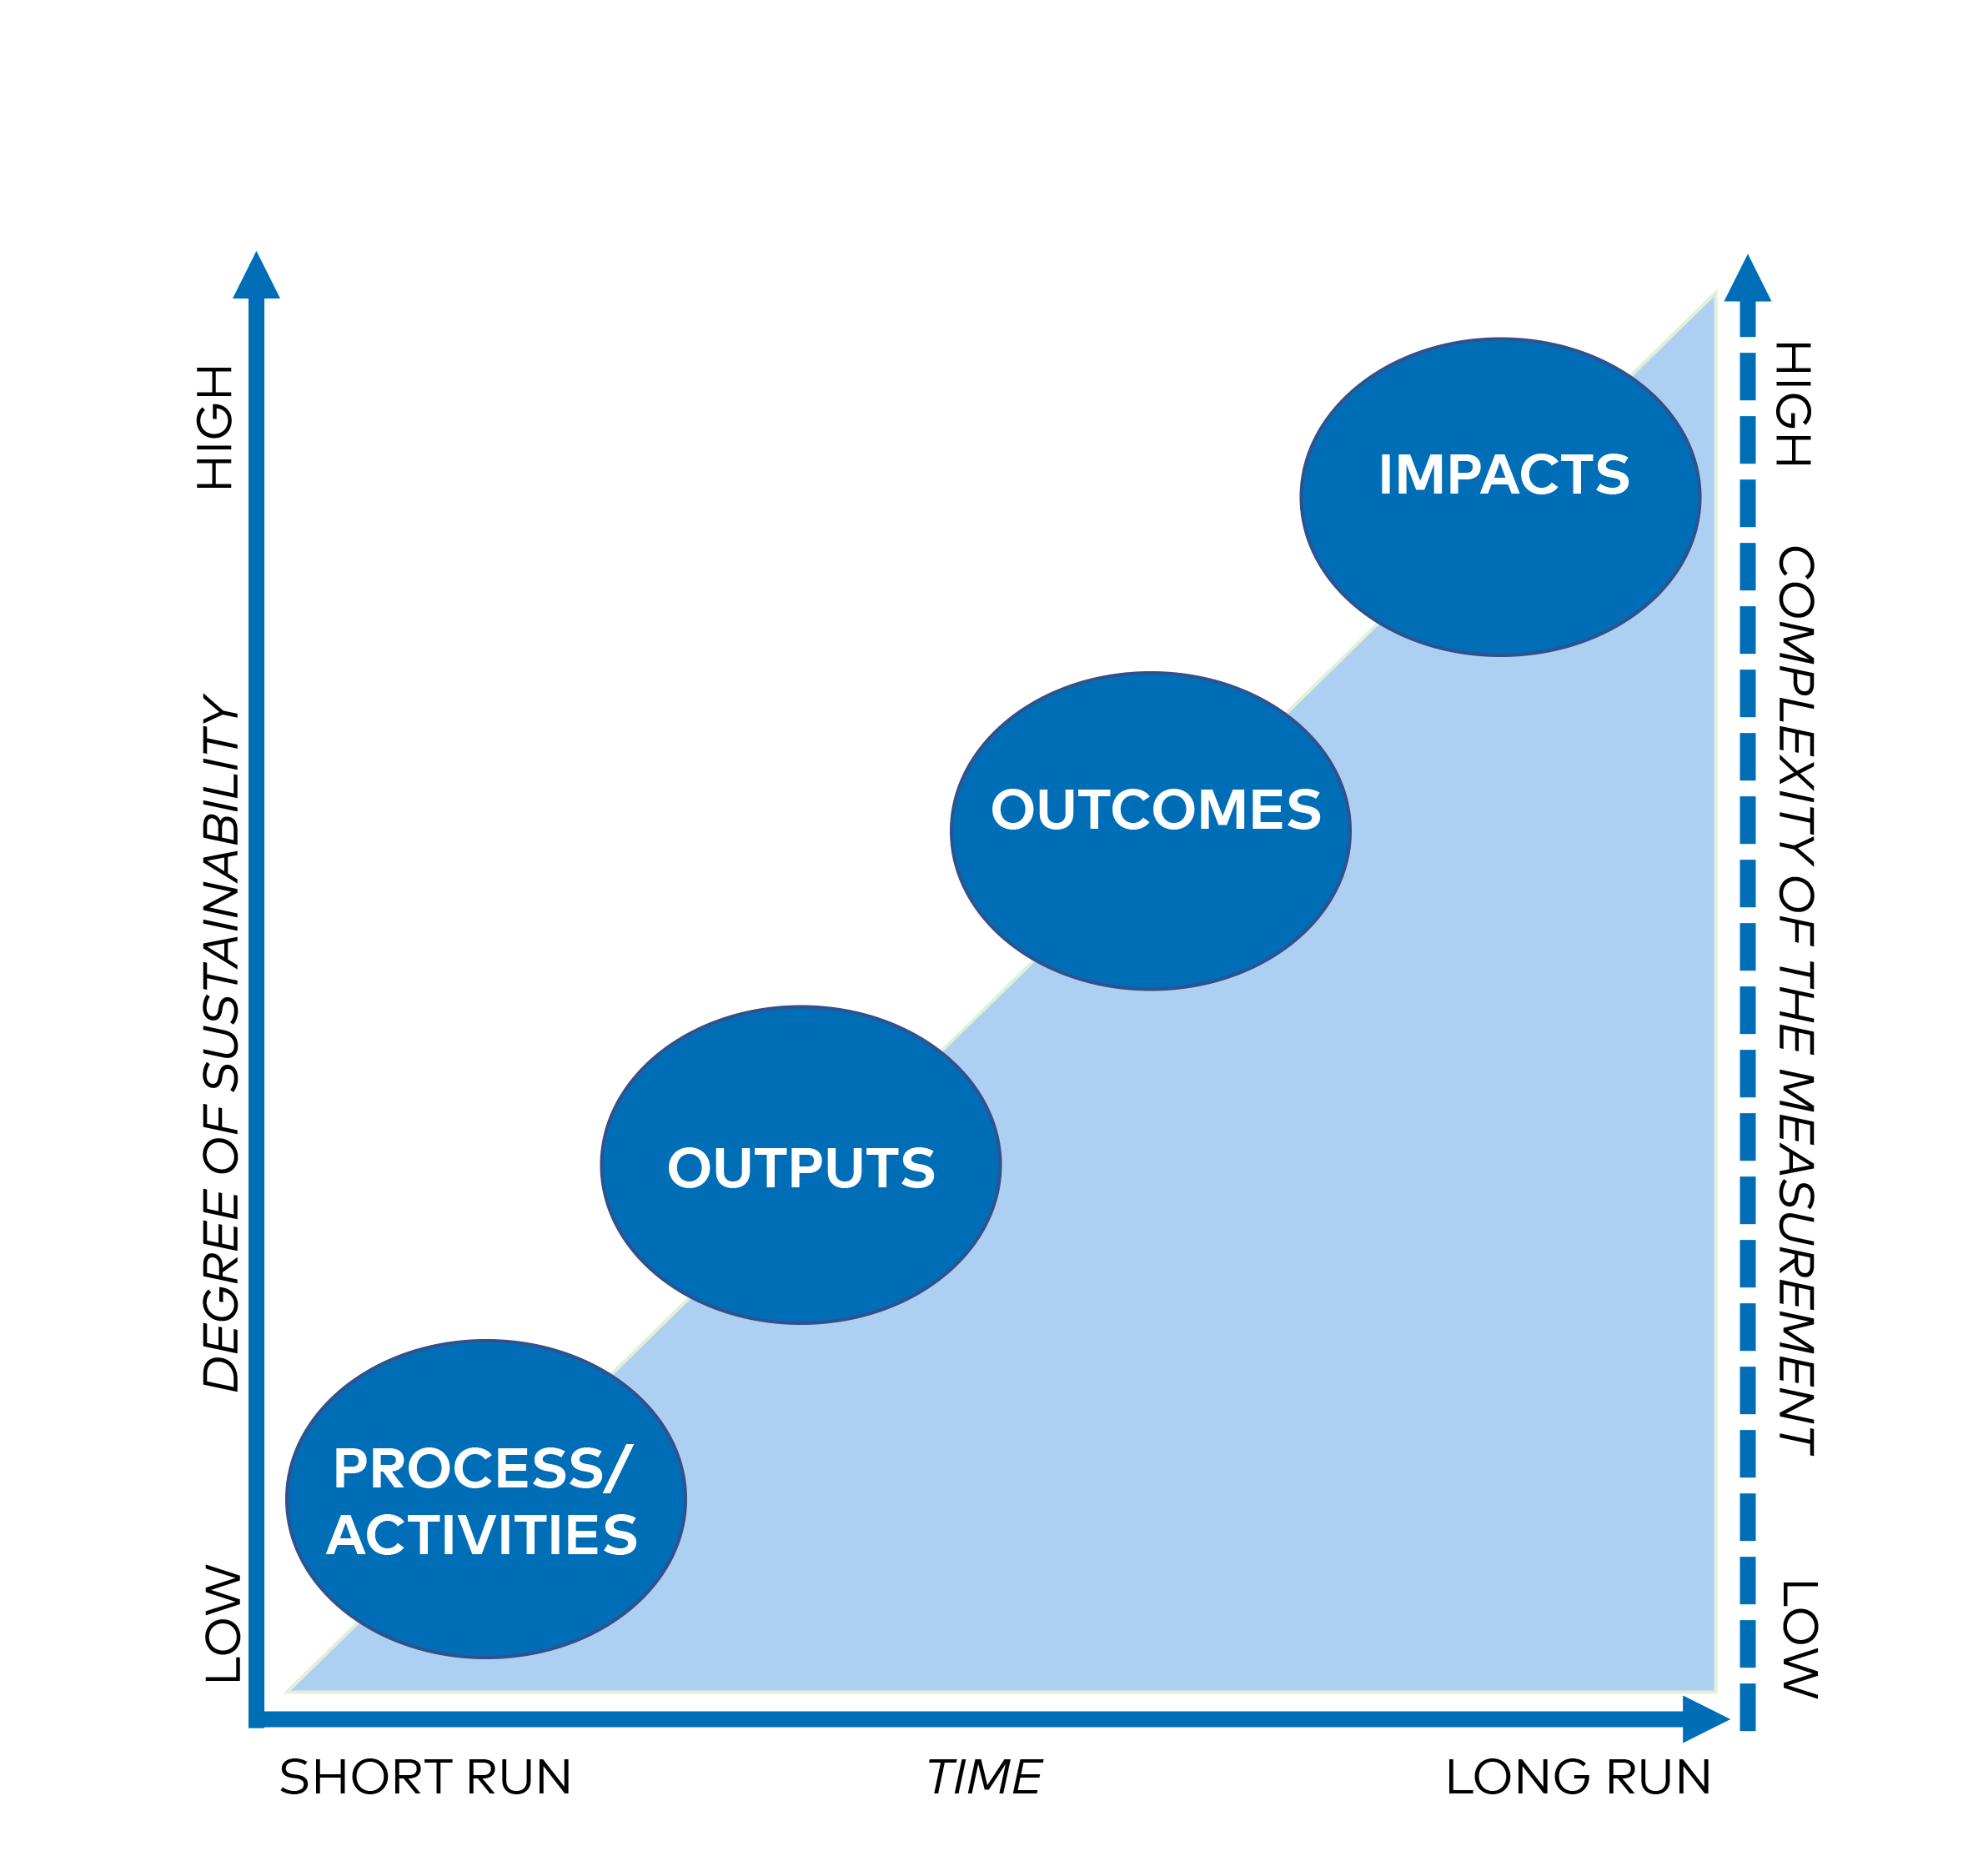
Figure 4. The complexity of monitoring
2.2.2 Societal level
A circular transition can relate to companies, consumers, organisations, local and national governments. To capture the different societal levels, the taxonomy includes a differentiation between micro, meso and macro level, which are understood in alignment with the definition of circular economy applied in this report:
- Micro level comprises products, companies and consumers
- Meso level comprises sectors and multi-stakeholder initiatives
- Macro level comprises efforts in municipalities, regions and national governments
2.2.3 Sector
This parameter captures whether the indicator is linked to specific (primarily business) sectors of the society or is more general in nature.
2.2.4 Data
Indicators are categorised in terms of data availability, source of data and unit.
The parameters are summarised in the taxonomy provided in Table 4.
| TABLE 4: TAXONOMY OF INDICATORS | ||
| Parameter | Explanation | Categories |
| Categorisation of indicators | ||
| Point of measurements in a monitoring system for circular economy | Refer to table 3 | – Political and societal initiatives – Resource use (including prevention) – Circular products and production – Circular consumption – Reuse – Recycling – Waste quantities and handling – Impacts |
| Theory of change | Circular economy is a process of change; relating the indicators to the “Theory of change” clarifies the causal linkages between efforts and impacts | – Input – Activities – Output – Outcome – Impacts |
| Societal level | A circular transition takes place product design, companies, consumer behaviour, cities, regions and national governments. This parameter captures the different societal levels: Micro, meso or macro. | – Macro (national level) – Meso (local or regional level) – Micro (organisation level) |
| Sector | Strategies on circular economy can focus on certain sectors, so can indicators. This parameter describes whether an indicator is exhaustive or sector specific. | – Exhausted – Prioritised – No sector measurements |
| Data description | The presence and quality of data is crucial for the applicability and validity of the indicator. | – Data availability – Source of data – Unit |
2.2.5 The RACER criteria
The RACER criteria, developed by the EU Commission, has formed a basis for the indicator assessment. The five criteria specified below have been taken into consideration when assessing the suitability of the individual indicators.[1]Inspired by: EC (2019): Tool #41: Monitoring arrangement and indicators..
- Relevance refers to whether the indicator measures key aspects of the circular economy.
- Acceptance assesses whether stakeholders accept the indicator.
- Credibility evaluates whether the indicator is transparent, trustworthy and easy to interpret.
- Easy refers to easiness of measuring the indicator, if data is accessible or/and can be collected with limited use of resources.
- Robust assesses whether data is biased and the level of uncertainty.
Footnotes
- ^ Inspired by: EC (2019): Tool #41: Monitoring arrangement and indicators.
2.3 Collection of data on Nordic monitoring of circular economy
A systematic and thorough desk-study was completed mapping national and sub-national strategies on circular economy and reviewing initiatives on monitoring the circular activities and/or the progress towards the circular society.
The consultant has taken contact to more than 60 stakeholders and representatives in relevant ministries, agencies and local governments across the Nordic countries, as well as data owners, to identify monitoring models, indicator sets, or single indicators that contribute to measuring the process towards a circular economy. The initial list of relevant contact points, established through consultations with the Steering Group, was amended by applying a snowball strategy where informants identified other relevant informants with knowledge of circular economy indicators. A full list of informants can be found in Annex B. All interviews were based on semi-structured interview guides (see Annex C) and carried out through Skype or a similar virtual platform.
The identified indicators were noted, categorised, analysed and assessed in accordance with the taxonomy. A long list of indicators can be found in Annex D.
2.4 Uncovering the interest for Nordic collaboration
The interviews with the many stakeholders also covered viewpoints on future Nordic cooperation about monitoring circular economy, including how such a system could be established, and how barriers can be handled.
3. CE MONI|TORING IN DENMARK
The Danish government launched the Danish Strategy for Circular Economy 2018-2030 (DSCE) in 2018[1]Danish government (2018). Strategi for cirkulær økonomi – mere værdi og bedre miljø gennem design, forbrug og genanvendelse aiming at reducing the use of virgin resources and increasing the competitiveness and productivity of Danish businesses.
The DSCE contains six focal areas and 15 initiatives, supported by a budget of approximately 15 M€. The six focal areas of the DSCE are:
- The circular transition in SME’s by circular business development, establishing a stronger channel between circular business models and the public sector as well as through financial support.
- Digitalisation by supporting commercial use of data and challenges.
- Circular design through product policy and EU-cooperation.
- Circular consumption through circular public procurement including Total-Cost of Ownership (TCO).
- A market for waste and secondary resources through aligning collection of household waste, create equal conditions, liberalise handling of WEEE and addressing regulative barriers.
- More value from biomass and buildings through developing of volunteering sustainability standard, propagate selective demolition and get more value from biomass.
The responsibility for implementation is shared between several resort areas with the Ministry of Environment and Food and the Ministry of Business as the main consignors of the strategy.
The Ministry of Food and Environment is responsible for coordinating the monitoring of the strategy. Denmark aims to increase resource productivity with 40% from 2014 to 2030 and increase recycling from 58% to 80%, and two quantitative indicators are applied to measure progress, namely resource productivity (DKK/RMC) and the amount of recycled waste[2]Excluding mineral waste, as it accounts for 90% of the total waste amount. Monitoring is carried out every third month, followed by a steering group meeting.
Circular economy is one out of five 2020 focal areas of the Ministry of Food and Environment and CE is expected to contribute significantly to the ambitious Danish climate goal on reducing GHG-emissions with 70% in 2030 compared to 1990-levels[3]Danish government (2019). Klimalov. The action plan to reach the climate goal is expected to be prepared and adopted during 2020.
3.1 National level monitoring models and indicators
No national monitoring system on circular economy has been launched in Denmark.
In the autumn 2019, the Danish Business Authority commissioned a project with a comparative assessment of monitoring systems on circular economy in EU member states, followed by the development of a first draft indicator set for a Danish monitoring system on circular economy[1]PlanMiljø: Draft Danish monitoring system for circular economy, 2019.. The project has strengthened the capacity of the Danish Business Authority to support the development of a Danish CE monitoring model if so desired by politicians.
The draft indicator set on circular economy has inspired the taxonomy and the points of measurement referred to in section 3 of the present report, covering all aspects of the circular economy.
Ellen MacArthur Foundation carried out a Danish case study of circular economy that includes a baseline of circularity containing indicators on resource productivity, recycling rate, the eco-innovation index[2]The eco-innovation index originates from EU and consists of 16 indicators related to input, activities, output, socioeconomic- and resource efficiency outcomes as presented in the table below. All indicators are added up and divided by population to create an index number. EU’s average is the index number of 100, which the member states eco-performances are related to. See all indicators in Table 6., waste generation/GDP, municipal waste generated per capita, share of renewable energy and GHG-emissions[3]Ellen MacArthur Foundation (EMF) (2015). Potential for Denmark as a Circular Economy – a case study from delivering the circular economy – a toolkit for policy makers.
Footnotes
- ^ PlanMiljø: Draft Danish monitoring system for circular economy, 2019.
- ^ The eco-innovation index originates from EU and consists of 16 indicators related to input, activities, output, socioeconomic- and resource efficiency outcomes as presented in the table below. All indicators are added up and divided by population to create an index number. EU’s average is the index number of 100, which the member states eco-performances are related to. See all indicators in Table 6.
- ^ Ellen MacArthur Foundation (EMF) (2015). Potential for Denmark as a Circular Economy – a case study from delivering the circular economy – a toolkit for policy makers
3.1.1 Accessible indicators on national level
Danish institutions collect and report on a range of indicators measuring aspects of the circular economy.
Political and societal activities promoting circular economy
The Danish Ministry of Food and Environment is responsible for coordinating the monitoring of the circular economy strategy. Besides the quantitative indicators of resource productivity and recycling, all strategic activities are monitored every third month with a survey and subsequently discussed on a steering group meeting.
Resource use
Statistics Denmark is responsible for Material Flow Accounting (MFA) based on indicators on resource extraction, import and export of resources, Domestic Material Input (DMI) and Domestic Material Consumption (DMC) as well as the physical balance accounting. The data forming the basis for MFA is derived from national statistics as external trade statistics (imported and exported goods), energy accounts, extraction of oil, nature gas and natural resources and the agriculture statistics[1]Danish Statistics (2020). Materialsstrømsregnskab – statistisk behandling.
MFA constitutes the basis for the national resource productivity, which is calculated by dividing DMC with Gross Domestic Product (GDP). The indicators, Raw Material Consumption (RMC) and Raw Material Input (RMI), are also available, but are continuously being refined to reduce uncertainty as import and export are measured in Raw Material Equivalents (RME) based on several assumptions.
The Danish Energy Agency compiles statistics on the renewable energy share of total energy consumption.
Circular products and production
An indicator on environmental products and services is the number of marketed products with the Nordic eco-label ‘the Swan’ and the turnover of Swan-labelled products. The data is collected by Ecolabel Denmark and included in the Danish Environmental Protection Agency’s (DEPA’s) web portal “Environmental Status” containing continuous monitoring of the status of the environment (replacing the previous four-year environmental reports)[2]DEPA (2019). Miljøtilstand.nu.
Some individual and independent surveys have thrown light on the circular performance of the business community. In 2017, DEPA carried out a survey to measure the level of circularity in companies through mapping of knowledge of circular economy, initiatives, potentials, and barriers[3]DEPA (2017). Cirkulær økonomi - virksomhedsundersøgelse. The Danish Technological Institute has assessed circular economy in manufacturing companies based on interviews[4]DEPA (2017). Cirkulær økonomi - virksomhedsundersøgelse.
Circular consumption
No indicators on circular consumption have been identified, as, however, the revenue and number of ecolabels (Nordic Swan and EU Flower) can be seen as indicators on circular consumption.
Reuse and preparation for reuse
The Danish Association for Engineers (IDA) in 2018 measured the level of repair of durable consumption goods through a survey[5]IDA (2018). Reparation af varige forbrugsgoder, but there is no continuous nor systematic collection of data on reuse at a national scale. The largest Danish online consumer-to-consumer sales channel, “Den Blå Avis” (DBA), has prepared a reuse index based on a population survey and the company’s own data on the exchange of reused goods between consumers[6]DBA (2019). Genbrugsindeks.
Since 2019, the Danish Waste Data System enables registration of waste being “Prepared for reuse”, but little data has been provided. Measurements of reuse is awaiting guidelines from the EU.
Waste generation and treatment
Data on waste amounts and recycling is collected in the Danish Waste Data System, divided in fractions, sectors and treatment processes.
Actors that import, export, produce, collect and/or treat waste are to report their waste treatment and volumes to the Waste Data System. Recycling is measured at the point of sorting, but as EU requires all member states to measure recycling after the first treatment looking forward, Denmark is currently looking into how that can be done.
DEPA reports on recycling of packaging waste to the EU based on data from Statistics Denmark and the suppliers[7]The Danish Ministry for Food and Environment (2019). Statistik for emballageforsyning og indsamling af emballageaffald 2017.
Impacts
A range of indicators provide information on Denmark’s environmental status and emissions of greenhouse gasses. Statistics Denmark prepares the annual Green National Account in compliance with the System of Environmental Economic Accounting (SEEA) developed by the UN. As part of the green accounting, Statistics Denmark reports to the EU on GHG-emissions and energy use, extraction and use of water and generation of waste water, which inform on potential environmental impacts of the circular economy. Yet, the correlation needs to be proved in a statistical model to isolate the impact arrived from a circular economy.
The Environmental Status web portal provides information on several indicators on the state of affairs of Danish nature, including data on land use and preservation of certain types of biotopes and habitats[8]MST (2020). Miljøtilstand.nu - Natur og biodiversitet.
Statistics Denmark reports on circular job creation and circular growth to Eurostat. The data is not available from Statistics Denmark’s public website.
Footnotes
- ^ Danish Statistics (2020). Materialsstrømsregnskab – statistisk behandling
- ^ DEPA (2019). Miljøtilstand.nu
- ^ DEPA (2017). Cirkulær økonomi - virksomhedsundersøgelse
- ^ DEPA (2017). Cirkulær økonomi - virksomhedsundersøgelse
- ^ IDA (2018). Reparation af varige forbrugsgoder
- ^ DBA (2019). Genbrugsindeks
- ^ The Danish Ministry for Food and Environment (2019). Statistik for emballageforsyning og indsamling af emballageaffald 2017
- ^ MST (2020). Miljøtilstand.nu - Natur og biodiversitet
3.2 Sub-national monitoring of circular economy
The Danish regions are emphasising the importance of circular economy in regional development, yet their economic scope of action is limited. The regions are primarily responsible for the health sector, whereas the business development area is managed by the municipalities.
The Capital Region is participating in a project combining all actors in the waste sector and across the value chain in order to carry out a material flow account of the region, map all actors and circular economy projects, and map circular economy initiatives in the municipal waste plans[1]The Capital Region of Denmark (2019). Affald og ressourcer på tværs – kortlægning af kommunale indsatser på affaldsområder i Region Hovedstaden. Also, other regions have individual circular economy related projects.
The Danish municipalities are the owners – or co-owners – of the waste companies receiving waste from Danish households. Danish municipalities are working more strategically with the circular economy in areas such as business development, public procurement and construction. Some have strategies, organisational structures, systems, and competencies that support circular economy.
No examples have been found of regions or municipalities continuously and systematically measuring the progress towards a circular economy; some municipalities have prepared indicators informing on the impacts of specific projects, potentially providing valuable experiences.
Footnotes
- ^ The Capital Region of Denmark (2019). Affald og ressourcer på tværs – kortlægning af kommunale indsatser på affaldsområder i Region Hovedstaden
3.2.1 Accessible indicators at sub-national level
Political and societal activities promoting circular economy
The Capital Region carried out a mapping in 2019 of all initiatives in local waste management plans related to the circular economy in qualitative terms[1]The Capital Region of Denmark (2019). Affald og ressourcer på tværs – kortlægning af kommunale indsatser på affaldsområder i Region Hovedstaden. Likewise, the Central Denmark Region has carried out interviews with the municipalities to map local circular economy initiatives[2]Central Denmark Region (2018). Tematikker for kommuner i Region Midtjylland.
Resource use
There is little data on resource use at a local level. The Capital Region is striving for mapping material flows across companies in the regions in their project “Across waste and resources”[3]The Capital Region of Denmark (2019). Affald og ressourcer på tværs – kortlægning af kommunale indsatser på affaldsområder i Region Hovedstaden.
Share of renewable energy of total energy consumption is monitored by some municipalities. Data is also available from the Danish District Heating Association on the share of renewable energy in district heating for a group of municipalities.
Circular products and production
No local indicators measuring circular products or productions have been identified on a local level.
Circular consumption
Circular public procurement is gaining more attention, but no region or municipality is monitoring the level of circular consumption.
Reuse and preparation for reuse
The municipality of Copenhagen is planning to measure reuse by noting and weighing all materials being taken for free or sold at the municipality’s exchange stations over one week a couple of times a year. The baseline measurement has been carried out and the first measurement is expected to be carried out late 2020.
The waste company AffaldPlus, co-owned by six municipalities in South-East Denmark, is in 2019-2020 carrying out a project aiming at measuring the environmental impact of reuse compared with recycling of selected goods. The company is setting up a database that calculates the environmental impact of reuse compared with recycling, informing on when reuse is preferable, and on how to handle materials in the most environmentally sound way.
Waste generation and treatment
The municipalities are responsible for the management of household waste and plays a crucial role in preparing waste management targets and strategies, ultimately (up until 2020) deciding the household collection system and the treatment of the waste. The Ministry of Environment has stated that it will streamline waste handling across the municipalities and companies in order to increase sorting and recycling[4]Freiesleben, S. (2020). Længe ventet klimaudspil for affald: Alle skal sortere affald i 10 fraktioner. Data is systematically reported to the Waste Data System, which many municipalities supplement with their own data system.
Impacts
No sub-national monitoring of environmental or socio-economic impacts of circular economy efforts have been identified.
With the great societal focus on climate change and with many municipalities aiming to reduce carbon emissions or even being reaching for carbon-neutrality, most municipalities are measuring their CO2-emissions. A common tool to monitor the municipalities’ energy and climate impact allows benchmarking against other municipalities[5]The Danish Energy Agency (2020). Energi og CO2-regnskabet.
The municipality of Copenhagen has a goal of being climate neutral in 2025[6]Municipality of Copenhagen (2017). CO2-neutral hovedstad. In the climate plan, a sub-goal is to reduce emissions from waste services with 59 tons CO2-equivalents. The CO2-emissions from the waste sector is solely measuring the direct emissions from a reduction of incineration measuring the CO2-emissions from the incinerator[7]Municipality of Copenhagen (2018). Cirkulær København – Ressource og Affaldsplan 2024.
Footnotes
- ^ The Capital Region of Denmark (2019). Affald og ressourcer på tværs – kortlægning af kommunale indsatser på affaldsområder i Region Hovedstaden
- ^ Central Denmark Region (2018). Tematikker for kommuner i Region Midtjylland
- ^ The Capital Region of Denmark (2019). Affald og ressourcer på tværs – kortlægning af kommunale indsatser på affaldsområder i Region Hovedstaden
- ^ Freiesleben, S. (2020). Længe ventet klimaudspil for affald: Alle skal sortere affald i 10 fraktioner
- ^ The Danish Energy Agency (2020). Energi og CO2-regnskabet
- ^ Municipality of Copenhagen (2017). CO2-neutral hovedstad
- ^ Municipality of Copenhagen (2018). Cirkulær København – Ressource og Affaldsplan 2024
4. CE MONI|TORING IN FINLAND
In 2016, Finland was the first country in the world to launch a national strategy for circular economy: “Leading the Cycle: Finnish Roadmap to a Circular Economy 2016-2025”[1]Sitra (2016). Leading the cycle. Finnish road map to a circular economy 2016-2025. The Finnish Innovation Fund (SITRA) was responsible for drafting the strategy, and the update in 2018 applied an inclusive stakeholder approach across all ministries. The strategy also included almost 30 actions for the central government, municipalities, cities, enterprises and citizens. The roadmap covered four strategic and cross-sectoral goals:
- Renewal of the foundations of competitiveness and vitality
- Transfer to low-carbon energy
- Natural resources as scarcities, and
- Everyday decisions as a driving force for change.
In 2019, to further support the development of a carbon-neutral circular economy the Finnish government[2]Finnish Government (2019). Inclusive and competent Finland – a socially, economically and ecologically sustainable society. wanted to “adopt a horizontal, strategic circular economy programme and the related indicators over the government term”[3]Objective 6 strengthening Finland’s role in the circular economy.. This work is ongoing and builds on the previous strategy. It will set targets, define the necessary measures and allocate the resources needed to promote circular economy in Finland, with focus on four thematic areas:
- Real estate and construction
- Manufacturing and process industries
- Municipalities and regions
- Emerging business models and technologies.
The programme is planned to be finalised by December 2020 and will be implemented from 2021.
Circular economy is on the agenda of different government sectors including the Ministry of Environment, Ministry of Economic Affairs and Employment, Ministry of Agriculture and Forestry, the Ministry of Health and Social Affairs and Ministry of Education. Focus has been on material efficiency (e.g. the national material efficiency programme launched in 2013[4]Finnish Ministry of Economic Affairs and Employment (2018). Kestävää kasvua materiaalitehokkuudella Kansallisen materiaalitehokkuusohjelman päivitys 2017 (Sustainable growth through material efficiency. Update of the National Material Efficiency Programme 2017)) and on recycling and waste (e.g. the National waste management plan From Recycling to a Circular Economy - National Waste Plan to 2023[5]Finnish Ministry of the Environment (2018). From Recycling to a Circular Economy. National Waste Plan to 2023.). Studies have been made on the impacts of the circular economy on growth and employment[6]Finnish Ministry of Economic Affairs and Employment (2017). Kasvua ja työpaikkoja kestävistä ratkaisuista. Selvitys biotalouden, cleantechin ja kiertotalouden kasvun ja työpaikkojen dynamiikasta. (Growth and employment from sustainable solutions – A study into the dynamics of growth and employment in the bioeconomy, cleantech and circular economy). The national funding agency for innovation, Business Finland, in 2019 launched a funding programme on Bio and Circular Finland[7]Business Finland (2019). Bio and Circular Finland Programme 2019-2022.
Footnotes
- ^ Sitra (2016). Leading the cycle. Finnish road map to a circular economy 2016-2025
- ^ Finnish Government (2019). Inclusive and competent Finland – a socially, economically and ecologically sustainable society.
- ^ Objective 6 strengthening Finland’s role in the circular economy.
- ^ Finnish Ministry of Economic Affairs and Employment (2018). Kestävää kasvua materiaalitehokkuudella Kansallisen materiaalitehokkuusohjelman päivitys 2017 (Sustainable growth through material efficiency. Update of the National Material Efficiency Programme 2017)
- ^ Finnish Ministry of the Environment (2018). From Recycling to a Circular Economy. National Waste Plan to 2023.
- ^ Finnish Ministry of Economic Affairs and Employment (2017). Kasvua ja työpaikkoja kestävistä ratkaisuista. Selvitys biotalouden, cleantechin ja kiertotalouden kasvun ja työpaikkojen dynamiikasta. (Growth and employment from sustainable solutions – A study into the dynamics of growth and employment in the bioeconomy, cleantech and circular economy)
- ^ Business Finland (2019). Bio and Circular Finland Programme 2019-2022
4.1 National level monitoring models and indicators
Despite these efforts to support a climate-friendly circular economy, no national monitoring system on circular economy has been launched in Finland. The topic is, however, highly actualized, as the new national circular economy programme will be monitored using a set of indicators, which are being developed during the latter part of 2020. As a first step, a background study of existing indicators in use in Finland, including an analysis of their strengths and challenges, was carried out in Spring 2020[1]Gaia Consulting (2020). Kiertotalouden indikaattorien tilannekuva. Loppuraportti 11.6.2020 (Snapshot of indicators for the circular economy. Final report 11.6.2020.) (Unpublished report for the Ministry of Economic Affairs and Employment)..
Circular economy related measures and indicators have earlier been developed and utilized in various contexts, and the challenges related to indicator development are broadly recognised. The challenges are related specifically to the data quality, coverage and availability, legislative aspects (e.g. openness of data or the mandatory functions of the statistical bureau) as well as striving for clarity and simplicity and the avoidance of excess reporting.
SITRA prepared input to a national monitoring system on circular economy in 2015 as part of the circular economy roadmap[2]Gaia Consulting (2015). Miten kiertotalouden kehitystä mitataan? Esiselvitys kiertotalouden kansallisen barometrin kehittämisestä. (How to measure circular economy development? Pre-study for the development of a national barometer for the circular economy).
The Finnish Environment Institute SYKE is currently leading a seven-year project funded through the EU Life Programme: CIRCWASTE – Finland towards circular economy[3]SYKE (2017). Circwaste - towards circular economy in Finland. CIRCWASTE aims at directing Finland towards a circular economy, mainly by different actions contributing to the national waste management plan. CIRCWASTE also develops calculation methods for circular economy indicators and provides estimations of regions’ and municipalities’ progress towards a circular economy.
As a specific sub-project of CIRCWASTE, Statistics Finland is looking into the possibilities of defining indicators for circular economy business, including the whole chain from design to recycling. Areas looked into are:
- Design: patents, RDI funding for innovations
- Material extraction: decoupling, extraction of natural resources
- Production: industrial structure, locations and staff
- Logistics: transportation of recycled raw material
- Trade and services: industrial indicators, conjunctures and industrial structure
- Consumption: sharing economy, structure of second-hand trade
- Waste: municipal waste recycling degree, recycling degree, decoupling, biogas
- Reuse and recycling: circular material use rate (CMU), producer responsibility, remanufacturing, accessibility.
The project aims at developing new statistics based on already available data and it will be reported by the end of 2020. The CIRCWASTE project also contributes to the implementation of the national waste management plan of Finland that is also monitored through quantitative and qualitative indicators[4]Finnish Ministry of the Environment (2018). From recycling to a circular economy. National Waste Plan to 2023.. The waste plan includes indicators for measuring the overall development in waste management as well as indicators for the targets in the key areas: municipal waste, construction and demolition waste, electrical and electronic equipment waste (WEEE), and biodegradable waste.
Other national indicator sets have some relation to circular economy, although developed for other purposes. National key indicators for green growth and material and resource efficiency have been defined[5]Seppälä et al. (2016). Key indicators for green growth and material and resource efficiency in Finland., comprising 19 key indicators relating to different themes and goals, and indicators on the implementation of the Sustainable Development Goals of Agenda 2030 relate in some parts to the circular economy, namely the focus areas of resource-wise economy, carbon neutral society, consumption and public procurement.[6]Prime Minister’s Office (2020). State of sustainable development Currently, as part of Finland’s ambition to become carbon neutral in 2035, all major industry sectors are creating low-carbon roadmaps. Indicators mentioned in the roadmaps refer to decrease of emissions, resource extraction and resource use, waste management, and recycling.[7]Finnish Ministry of Economic Affairs and Employment (2020). Low carbon road maps 2035.
Footnotes
- ^ Gaia Consulting (2020). Kiertotalouden indikaattorien tilannekuva. Loppuraportti 11.6.2020 (Snapshot of indicators for the circular economy. Final report 11.6.2020.) (Unpublished report for the Ministry of Economic Affairs and Employment).
- ^ Gaia Consulting (2015). Miten kiertotalouden kehitystä mitataan? Esiselvitys kiertotalouden kansallisen barometrin kehittämisestä. (How to measure circular economy development? Pre-study for the development of a national barometer for the circular economy)
- ^ SYKE (2017). Circwaste - towards circular economy in Finland
- ^ Finnish Ministry of the Environment (2018). From recycling to a circular economy. National Waste Plan to 2023.
- ^ Seppälä et al. (2016). Key indicators for green growth and material and resource efficiency in Finland.
- ^ Prime Minister’s Office (2020). State of sustainable development
- ^ Finnish Ministry of Economic Affairs and Employment (2020). Low carbon road maps 2035.
4.1.1 Accessible indicators on a national level
Political and societal activities promoting circular economy
The national programme for circular economy is in autumn 2020 developing a set of indicators that will be used for monitoring programme activities. These will be available by the end of 2020.
The state of sustainable development in Finland is followed by using ten ‘monitoring baskets for sustainable development’, published in the State of Sustainable Development report[1]Finnish Prime Minister’s Office (2020). State of Sustainable Development – report 2020.. Among the indicators are Business Finland’s funding for resource efficient and carbon neutral solutions.
As part of the national material efficiency programme, materiality reviews of individual companies have been supported by the Government for several years (but not on a large scale, yet) and are monitored on an annual basis[2]Motiva (2017). Materiaalikatselmusten tuloksia Suomessa (Results of materiality reviews in Finland). The materiality reviews measure the potential savings from resource efficiency in the production process.
Resource use
The State of Sustainable Development indicators (see above) include indicators on natural resource/raw material consumption
Statistics Finland reports environmental accounts according to the United Nations' System of Environmental-Economic Accounts (SEEA) and the EU regulation on environmental economic accounts. The accounts describe the use of natural resources, impacts caused by the use of natural resources (such as emissions into air, water or ground measured by e.g. greenhouse gases, waste and chemicals), and economic activity related to environmental protection (e.g. environmental taxes and charges, and development of environmentally friendly technology).
Circular products and production
The environmental accounts, provided by the Statistics Finland and reported to EU and UN, include statistics on the environmental goods and services sector as well as forest accounts (the resources and flows of wood material as well as their values in the national economy).
The CIRCWASTE project is developing more systematic indicators related to product and service design, materials acquisition, production and logistics, trade and services.
Circular consumption
The State of Sustainable Development indicators include some consumption related indicators. However, other than an indicator on municipal waste, there is no specific CE indicators. The indicator ‘Carbon footprint of consumption’ monitors CO2 emissions of consumption at the national level, and there is some statistical data on consumer behaviour and expenditures, including on the purchase of eco-labelled products and services. Also, it is a challenge to distinguish the circular consumption from the overall consumption. The indicator ‘Trends in municipal waste’ is still a key tool to assess circular consumption.
Although sustainable public procurement is emphasized on a national level and monitored based on sustainability objectives and criteria, the monitoring is challenged by the fact that few procurement procedures include very specific measurements for sustainability directly related to circular solutions. On an overall level, public procurement focuses mostly on energy efficiency and reducing emissions and environmental impacts.
Reuse and preparation for reuse
No systematic monitoring of reuse and preparation for reuse is in place. The CIRCWASTE project has ambitions to develop the knowledge base related to the sharing economy and the structure of second-hand trade, as well as circular material use, remanufacturing, and accessibility.
Waste generation and treatment
On a national level, Statistics Finland monitors waste generation and waste treatment in accordance with the EU standards and the national waste management plan. The national waste plan is monitored by the following indicators separately for municipal waste, construction and demolition waste, and electrical and electronic equipment waste (WEEE):
- Total waste volume by sector (tonnes / year)
- Waste treatment volumes (tonnes / year)
- Volume of hazardous waste by sector (tonnes / year)
- Hazardous waste treatment volumes (tonnes / year).
Waste recycling is monitored in the following areas by the Producer Responsibility Authority:
- The packaging waste recycling rates by fraction (glass, plastics, paper/cardboard/board, metal, wood) (% / year)
- Electrical and electronic equipment re-use volume (tonnes / year)
- Volume of recovered electrical and electronic equipment waste (tonnes / year).
Biodegradable waste aspects are monitored by the volume of biodegradable municipal waste (tonnes/year), the volume of composted biodegradable waste (tonnes / year), the volume of decomposed biodegradable waste (tonnes / year), and the number of biogas facilities.
Other circular economy related indicators in the National Waste Plan include e.g., the added value of environmental goods and services in the waste management and recycling sector (euro / year), and employment in the waste management and recycling sector[3]Statistics Finland (2019). Environmental goods and services sector statistics.
Impacts
Environmental results and impacts such as greenhouse gas emissions are measured and monitored on the national level, but not specifically for the circular economy.
Annual reporting of emissions of the greenhouse gases specified in the Kyoto Protocol to the Secretariat of the UNFCCC comprises emission calculations in a common form (CRF tables) and a related background report (National Inventory Report). Statistics Finland is the national entity responsible for the greenhouse gas inventory in Finland.
Some studies have recently been made on the impacts of circular economy on growth and renewal of companies, as well as employment, employing socio-economic impact analysis of national business and employment statistics. No regular national-level monitoring of socio-economic impacts of the circular economy is in place, partly because there are currently no well-developed means for defining the circular economy business sectors. The CIRCWASTE project aims at developing the definitions for circular economy business, and the national circular economy programme is expected to have a strong focus on impact indicators such as new business development, economic growth and employment.
4.2 Sub-national monitoring of circular economy
Finnish regions and cities are emphasising the importance of circular economy in regional and local development, and many cities have their own climate and environmental strategies and development projects. Local efforts are often linked to the circular economy and to industrial parks in the local area, run in cooperation between, for example, the public sector, waste management companies, and business communities. The industrial parks work with developing own concepts for monitoring their activities. There are not nationally developed or recognised indicator sets for monitoring circular economy within industrial parks.
The Helsinki Metropolitan Area and the Tampere and Turku regions (among others) have development strategies and programmes that include circularity aspects, with indicators mainly related to waste management and waste reduction, as well as resource efficiency.
4.2.1 Accessible indicators on a sub-national level
There are two national networks for resource smart municipalities, namely the Finnish Sustainable Communities Network (FISU) and the Towards Carbon Neutral Municipalities (Hinku) network. Both have developed indicators for resource wise municipalities in cooperation with the Finnish Environment Institute SYKE and Sitra, including:
- CO2 emissions per resident (using the ALas-model developed by the Finnish Environmental Institute)
- Material loss in tons (measuring material flows to incineration and disposal)[1]https://www.fisunetwork.fi/fi-FI/Seuranta/Materiaalihaviot
- Ecologic footprint per resident (calculated based on the National Footprint Account (NFA) produced by the Global Footprint Network (GFN)). On the demand side, the Ecological Footprint measures the ecological assets that a given population requires to produce the natural resources it consumes. On the supply side, a city, state or nation’s biocapacity represents the productivity of its ecological assets[2]Global Footprint Network (2020). Data and methodology.
The HINKU network has calculated CO2 emissions of all Finnish municipalities, also using the Alas model, for the period 2005-2018.
The CIRCWASTE project develops indicators for the sub-national level. New indicators recently made available (in 2020) include the accessibility of stations for gas fuelling and e-car charging[3]CIRCWASTE. Finland towards circular economy. https://materiaalitkiertoon.fi/fi-FI/Seuranta/Kaasu_ja_sahkoautoilu, and regional collection of textile, WEEE and plastics[4]CIRCWASTE. Finland towards circular economy. https://materiaalitkiertoon.fi/fi-FI/Seuranta/Kerayspisteiden_saavutettavuus.
Political and societal activities promoting circular economy
No indicators or data are found that monitor circular economy initiatives on a sub-national level.
Resource use
Many municipal programmes include aims of resource-wise cities, but we have not found specific quantitative indicators directly linked to circularity.
On the regional level, strategies, roadmaps, and studies include resource use related elements, such as Regional Waste Management Plans, containing longer lists of indicators related to the regional aims of waste management[5]E.g. Pirkanmaan Ympäristökeksus (2009). Etelä- ja Länsi-Suomen jätesuunnitelma vuoteen 2020 (The Regional Waste Plan for Southern and Western Finland up to 2020).
Circular products and production
No indicators on circular products and production have been identified on a sub-national level.
Circular consumption
A significant share (75%) of public procurement in Finland is carried out by municipalities and public procurement amounts to approx. 20% of the Finnish GDP. Sustainability in public procurement is monitored in municipalities and regions, and circular economy perspectives constitute a significant part of the criteria, e.g., reducing waste, promoting recycling, and increasing the use of recycled materials. As an example, the Ministry of Economic Affairs and Employment have established a competence centre for sustainable public procurement (KEINO) with the aim to support Finnish public procurers with sustainable and innovative procurement[6]KEINO competence center (2020). KEINO keeps statistics on the development of innovative and sustainable procurement (based on surveys targeting the municipalities), including data on number of procurements that have included sustainability targets (among these are “improving energy efficiency”, “reducing waste”, “reducing emissions”, “promoting recycling or the use of recycled materials”, “extended warranty period and long life”, “minimum life-cycle requirements and durability”).
Reuse and preparation for reuse
No specific activities were identified on this field, in addition to the ones mentioned in the previous section.
Waste generation and treatment
Municipalities monitor the public waste management companies and there are comprehensive indicators available in line with regular national and EU requirements (see the section on the national level). The data available does not provide a complete picture as private companies handle parts of the municipal solid waste. Regional waste management plans include indicators for different types of waste related to the regional aims of waste management. The CIRCWASTE project has developed a monitoring system for municipal solid waste from households in pilot regions[7]CIRCWASTE. Finland towards circular economy. https://materiaalitkiertoon.fi/fi-FI/Seuranta/Kotitalousjatteet.
Impacts
Environmental impacts in form of CO2 emissions are central in the monitoring of municipalities, as described in the FISU and HINKU networks, as well as the regions in Finland.
The Confederation of Finnish Municipalities has a specific office for supporting municipalities in developing and monitoring healthy and sustainable environments[8]Kuntaliitto (2020). Ymparisto.
The regional Centres for Economic Development, Transport and the Environment have the responsibility to monitor the state of the environment in the regions[9]Finnish Centre for Economic Development, Tranport and the Environment (2015). Environment. Monitoring is made on environmental impacts of human activity and indicators have only indirect links to the circular economy.
Footnotes
- ^ https://www.fisunetwork.fi/fi-FI/Seuranta/Materiaalihaviot
- ^ Global Footprint Network (2020). Data and methodology
- ^ CIRCWASTE. Finland towards circular economy. https://materiaalitkiertoon.fi/fi-FI/Seuranta/Kaasu_ja_sahkoautoilu
- ^ CIRCWASTE. Finland towards circular economy. https://materiaalitkiertoon.fi/fi-FI/Seuranta/Kerayspisteiden_saavutettavuus
- ^ E.g. Pirkanmaan Ympäristökeksus (2009). Etelä- ja Länsi-Suomen jätesuunnitelma vuoteen 2020 (The Regional Waste Plan for Southern and Western Finland up to 2020)
- ^ KEINO competence center (2020)
- ^ CIRCWASTE. Finland towards circular economy. https://materiaalitkiertoon.fi/fi-FI/Seuranta/Kotitalousjatteet
- ^ Kuntaliitto (2020). Ymparisto
- ^ Finnish Centre for Economic Development, Tranport and the Environment (2015). Environment
5. CE MONI|TORING IN ICELAND
Circular economy is a rather new topic on the Icelandic agenda and no strategy for circular economy is under development, yet.
A committee under the Prime Minister’s Office has developed a set of indicators measuring prosperity and quality of life in Iceland beyond GDP growth[1]Stjórnarráð Íslands Forsætisráðuneytið (2019). Mælikvarðar um hagsæld og lífsgæði.. The proposal includes 39 social, environmental and economic indicators, some of these directly or indirectly linking to the circular economy.
Footnotes
- ^ Stjórnarráð Íslands Forsætisráðuneytið (2019). Mælikvarðar um hagsæld og lífsgæði.
5.1 National level monitoring models and indicators
No national monitoring set for the circular economy has been developed in Iceland.
The most established national monitoring set is linked to the national implementation of the Sustainable Development Goals of Agenda 2030, and data is gathered on 70 indicators, including, e.g., the use of sustainable natural marine and energy resources.[1]Icelandic Government, Prime Minister’s Office (2019). Iceland's Implementation of the 2030 Agenda for Sustainable Development. Voluntary National Review.
Another established monitoring set is linked to Iceland’s waste prevention programme 2016–2027[2]Icelandic Government (2016a). Saman gegn sóun – Almenn stefna um úrgangsforvarnir 2016 – 2027 (“United Against Waste–General Policy on Waste Prevention 2016–2027”) and the National Plan on Waste Handling 2016–2028[3]Icelandic Government (2016b). National Plan on Waste Handling 2016–2028, both clearly indicating more holistic CE monitoring, as waste management results correlated with the national climate goals are monitored by the Icelandic action programme on climate change[4]Ministry for the Environment and Natural Resources (2018). Iceland’s Climate Action Plan for 2018-2030 – Summary.. The waste prevention programme introduces the perspective of sustainable consumption and waste prevention into the national waste management strategies. The plan on waste handling includes specific targets, as well as general commitments for changing the waste management practices in Iceland. The waste prevention programme will be accompanied by funding for waste prevention projects and for projects related to e.g. innovation in recycling.
Accessible indicators on a national level
Among the environmental indicators are e.g.: greenhouse gas emissions and the rate of renewable energy in total energy consumption (monitored by the national energy agency).
Political and societal activities promoting circular economy
The national plan on waste handling includes a broad set of targets including e.g. ban for landfill of biodegradable waste (2021), 85% minimum collection of batteries and accumulators (2024), and Maximum 5% of all waste going to landfills (2025).
The waste prevention programme “Together against waste”[5]The Environment Agency of Iceland (2020). Saman gegn sóun aims at:
- Reducing waste generation;
- Reducing greenhouse gas emissions;
- Improving the use of resources, e.g. with a focus on green innovation;
- Reducing the use of raw materials, and decreasing the environmental impacts; and
- Reducing the distribution of materials that are harmful to health and environment.
The programme proposes a range of actions with specific focus on the production of meat and fish, beverage containers and large-scale goods, but also with a general focus on food, plastic, textiles, electronics, green buildings and paper.
The state-owned Úrvinnslusjóður (Icelandic Recycling Fund), develops and monitors the prerequisites for national-level recovery and recycling rates for various types of products.
Resource use
The Environment Agency of Iceland (under the Ministry of the Environment) promotes the protection as well as the sustainable use of Iceland’s natural resources, as well as public welfare by helping to ensure a healthy environment, and safe consumer goods. The tasks include collecting and disseminating information on the state of the environment (incl. fishing, air, sea and water, nature).
Circular products and production
No indicators on circular products and production have been identified.
Circular consumption
No indicators on circular consumption have been identified.
Reuse and preparation for reuse
No indicators on reuse or preparation for reuse have been identified.
Waste generation and treatment
Recycling is in Iceland monitored mainly as the quantity of waste collected for recycling, as most is sent to recycling plants abroad.
Statistics Iceland monitors the quantity of waste handling and treatment divided into categories of waste and types of waste handling[6]Statistics Iceland. Waste handling and treatment 2014-2018. https://www.statice.is/statistics/environment/material-flow/waste/. The categories of waste recovery include: incineration with energy recovery, soil recovery, backfilling, other recycling and other recovery. The categories of disposal include incineration without energy recovery, managed landfill, and unmanaged landfill.
As part of the Waste Prevention Programme, the following indicators have been proposed:
- Fish and meat production: Quantity of fish waste sent for disposal (adjusted for total fish catch); Quantity of slaughter waste sent for disposal (adjusted for total quantity produced meat products).
- Power intensive industries: Amount of waste generated in power-intensive industry. The quantity of products produced is adjusted
- Food: Average household consumption of food per year; amount of food waste collected (both separately and with mixed waste) (data from Statistics Iceland)
- Plastics: Quantity of imported and manufactured plastic packaging (data avilable from Recycling fund); Quantity / number of plastic carrier bags that go into circulation annually (data not available, yet)
- Textiles: Market share of clothing produced in an environmentally friendly way or containing little harmful substances (data not currently available), Average household consumption of clothing per year (available from Statistics Iceland)
For electronics, green buildings and papers, the indicators are under development.
Impacts
Statistics Iceland and the Environment Agency of Iceland monitor the emission of greenhouse gases from main sectors of the Icelandic economy.[7]Statistics Iceland (2019). Greenhouse gas emissions from the economy The Environment Agency of Iceland publishes national Inventory Reports[8]Environment Agency of Iceland 2020. National Inventory Report Emissions of greenhouse gases in Iceland from 1990 to 2018..
Footnotes
- ^ Icelandic Government, Prime Minister’s Office (2019). Iceland's Implementation of the 2030 Agenda for Sustainable Development. Voluntary National Review.
- ^ Icelandic Government (2016a). Saman gegn sóun – Almenn stefna um úrgangsforvarnir 2016 – 2027 (“United Against Waste–General Policy on Waste Prevention 2016–2027”)
- ^ Icelandic Government (2016b). National Plan on Waste Handling 2016–2028
- ^ Ministry for the Environment and Natural Resources (2018). Iceland’s Climate Action Plan for 2018-2030 – Summary.
- ^ The Environment Agency of Iceland (2020). Saman gegn sóun
- ^ Statistics Iceland. Waste handling and treatment 2014-2018. https://www.statice.is/statistics/environment/material-flow/waste/
- ^ Statistics Iceland (2019). Greenhouse gas emissions from the economy
- ^ Environment Agency of Iceland 2020. National Inventory Report Emissions of greenhouse gases in Iceland from 1990 to 2018.
5.2 Sub-national monitoring of circular economy
No specific strategies for monitoring the circular economy on the sub-national level were found, apart from the waste management described in the previous section.
The City of Reykjavík has an action plan for carbon neutrality that relates to monitoring of the circular economy. Reykjavík was the first municipality to make a policy on greenhouse gas reduction, back in 2009, and an action plan on carbon neutrality in 2016. The focus of the action plan is on transport and energy use, waste and recycling, and climate change adaptation, with accompanying waste-related indicators (quantity of waste produced by the operations of City of Reykjavík). Proposed actions with relation to circular solutions include:
- Smart city solutions of buildings and city infrastructures in order to implement energy savings and reduce resources and waste
- Waste categories at local recycling centres will multiply during the time span allocated in accordance with the action plan on waste matters, and a new plat for handling biological waste is established.
A green emphasis will be mandated in all of the city's operations, and carbon-neutral purchasing will be supported. On the production side there are several good examples of circular resource use (e.g. related to the blue bioeconomy) and circular business growth, but there is no systematic monitoring of statistics related to these aspects today.
5.2.1 Accessible indicators on a sub-national level
Apart from the action plan of the City of Reykjavík, this study did not identify other indicators on subnational level in Iceland.
6. CE MONI|TORING IN NORWAY
Circular Economy is high on the agenda both for the Government and private business organisations in Norway at present, and the political ambitions for developing the society towards a circular economy is drawn up through a White Paper to Parliament no 45 (2016–17)[1]The Norwegian Government (2017). The Norwegian Government steps up the efforts to turn waste into resources and reduce marine litter. The White paper focuses much on seeing waste as resources for future production, and that it is necessary to go further in developing waste reduction and prevention as well as recycling of materials to a higher extent that at present. The Ministry of Climate and the Environment are currently working on a national strategy for circular economy, which is expected to be launched in the beginning of 2021.
There have been a number of initiatives taken by different stakeholders to develop roadmaps towards a circular economy. The Association of waste management in Norway (Avfall Norge) has developed a circular economy roadmap in 2016, with a focus on opportunities for jobs and value-added services through waste management and treatment in Norway[2]The Association of waste management (2016). The circular economy and benefit for society. The roadmap focused on the status for recycling of materials in Norway and proposed a number of action points to be taken by members of Avfall Norge as well as by the Government:
- For the waste management industry, it was pointed to the need for improved efficiency in processes along the waste value chain, for fossil-free transport of waste and to develop sector-wise standards for quality of waste materials.
- The Government was addressed with a need for a national strategy for circular economy, implementing minimum requirements to content of recycled materials in many products, by improving funding conditions for innovation and research, introducing new green taxes on virgin materials and scarce resources and to induce stronger reactions on breaking laws and regulations.
Association of Norwegian Process Industries (Norsk Industri) published their national roadmap towards circular economy in February 2018[3]Association of Norwegian Industries (2018). Towards a European Circular Economy, focusing on the opportunities for the Norwegian industry to develop competitive materials and products based on recycled materials, and by doing this also developing new technologies and the business models for more circular value chains. Some key points that were addressed in the report were:
- Need for harmonisation of laws and regulations between Norway and the EU
- Continued good communication between the industry and the Government towards a common understanding of challenges and opportunities for the process industry.
- Higher demand for products and materials based on recycled materials and low emissions, especially through the use of public procurement instruments.
- More resources to research, development, and innovation through public funding, to develop new technologies, materials and products.
In a national project aiming to develop the Process industry in Norway (Process 21 or P21), an expert group on circular economy was established, who published their report in June 2020[4]Process 21 (2020). Sirkulær økonomi. This report builds on the work that already had been done by the Association of Norwegian Process Industries, and focus on increasing the demand for environmental and resource effective products, public procurement with stronger requirements for circular solutions, harmonizing and simplifying EU laws and regulations and better funding conditions for research and innovation in the private sector. The expert group did also add four new action points in their report:
- Increase depreciation levels for projects leading to more circular economy
- Increased knowledge about material flows and the opportunities for more circular flows
- Regulatory policies and measures to reduce amount of hazardous waste
- Radical innovations towards circular solutions.
Footnotes
- ^ The Norwegian Government (2017). The Norwegian Government steps up the efforts to turn waste into resources and reduce marine litter
- ^ The Association of waste management (2016). The circular economy and benefit for society
- ^ Association of Norwegian Industries (2018). Towards a European Circular Economy
- ^ Process 21 (2020). Sirkulær økonomi
6.1 National level monitoring models and indicators
The Government, through the Ministry of Climate and Environment initiated a project late in 2019 to establish a knowledge basis for circular economy, to identify which sectors that have the best potentials for improving circularity, to identify possible indicators for circular economy in the society and to identify potential incentives and barriers towards introduction of circular economy in Norway. The project was carried out by Deloitte in Norway on behalf of the Ministry[1]Deloitte (2020): Study for a National Strategy for Circular Economy. The study consists of three sections that examine industries and industry collaborations with the greatest potential for increased circularity (section 1), barriers preventing the realisation of this potential (section 2), and policy instruments necessary to reduce barriers (section 3). It will serve as the basis for a national strategy and action plan from the Ministry to be launched in the first quarter of 2021. The report points on the need for better monitoring of circular economy status and progress in Norway, with focus on the following themes and types of indicators:
- Material intensity in products and production
- Share of recycled materials in products and materials
- Use of renewable energy resources
- Amount of waste being generated from products and production
- Share of materials being recycled in end-of-life phase of products.
In the report on potentials for increased circularity of the Norwegian society, 12 sectors were selected as a basis for evaluation, covering about 60% of Norwegian GDP and about 70% of all waste being generated in Norway. All sectors are evaluated with regard to efficiency in use of natural resources, employment, and economic value. Four sectors were identified to have the largest potential impact towards a circular economy: building and construction, wholesale and retail, primary production (agriculture and fisheries/aquaculture), and process industry. In the report, the following four knowledge gaps were identified:
- Lack of data about material consumption in general and more important use of secondary resources in products
- Lack of data on amount of waste and food waste from primary production and from the whole food chain
- Lack of statistical data on waste and waste treatment in many sectors
- Lack of data on the potential for increased circularity in many sectors in Norway.
The report has a detailed discussion about the potential for increased circularity in a number of sectors in the Norwegian society, but due to lack of relevant data on material use and to some extent reuse and recycling of materials, the potentials are not quantified[2]Deloitte (2020): Study for a National Strategy for Circular Economy.
Circularity Economy Norway has published Circularity Gap Report[3]Circle Economy (2020). The Circularity Gap Report - Norway in Norway in 2020, which conclude that Norway is 2.4% circular. The circularity number is calculated as the share of secondary resources/recycled material in the production. The report further presents the barriers and potentials of circular economy in Norway. Circular Norway took the lead of the Circularity Gap Report Norway together with the following partners; Virke, Naturvernforbundet, forbrukerrådet, Ny Analyse, RENAS, NITO, Skifte, Schibstedt, Finn, Avfall Norge and NHO.
6.1.1 Accessible indicators on a national level
Political activities promoting circular economy
No indicators on political activities promoting circular economy have been identified, but it is likely that the coming national strategy on circular economy will monitor the following circular economy activities.
Resource generation and use
Statistics Norway is reporting material flow accounts including domestic extraction, import and export of materials[1]SSB (2016). Economy-wide material flow accounts.
Directorate for mineral management in Norway develops every year the mineral statistics of Norway[2]Directorate for Mineral Management (2019). Mineralstatistikk, showing how much mineral resources that are extracted from both land-based Norway and Svalbard each year. The open published statistics are quite coarse, categorized in five main types of minerals:
- Energy minerals
- Natural stones
- Metallic minerals
- Industrial minerals
- Building raw materials.
Most information on more detailed levels are available in the data base of the Directorate, but is confidential due to few actors being involved in extraction.
Data on mineral extraction is however not coupled with data on production and products being manufactured in Norway, which means that the statistics is not in a form of indicators for resource use. This can potentially be done through input-output analyses based on national economy data.
Circular products and production
As far as registered there is not available any systematic national statistics regarding circular products and production in Norway, neither on a sector wise bases, nor as national aggregated statistics.
Through the Norwegian EPD-system, a large number of Environmental Product Declarations have been developed for Norwegian industrial products, especially from the building sector and the furniture sector. Those EPDs have in most cases good data on the circularity of each product, reflecting both the share of recycled content in the product, waste being generated through the product value chain and end-of-life treatment of materials from the product (as scenarios, as those data are not allowed to be declared).
Reuse and preparation for reuse
There are in general no official statistics on reuse of products and waste prevention in Norway, except for the WEEE fractions organized by Miljødirektoratet. Some data on reuse of textiles are available from Fretex.
Waste generation and treatment
In Norway, there are long term statistics on waste generation and waste treatment from most sectors in the society (not primary production), covering amount of waste fractions and treatment. Statistics Norway (SSB) is responsible for the collection and accounting national waste statistics. All waste accounting is based on annual statistics, but for many sectors it is often used waste factors combined with economic or production statistics as a basis to develop waste statistics. Updating waste factors have typically been done every 5–8 years through more in-depth studies and data gathering from companies, whereas amounts of waste have been estimated based in production volumes or sales turnover. One challenge is that all resources going to animal feed and industrial by-products no longer is defined as waste and therefore not in the statistics (in accordance with the Waste Directive). Waste statistics will thus only show part of the picture about circularity of waste resources in Norway.
There are a lot of statistics available about collected amounts and recycling rates of packaging in Norway, brought forward by Green Dot Norway and producer responsibility companies, e.g. Infinitum (running the deposit recycling scheme for beverage containers in Norway). NORSUS has made surveys of packaging material intensity of a set of key Norwegian household products over the last 20 years, based in a “shopping basket” methodology, giving a good overview of type and amount of packaging being used in the food, drink and household sector in Norway[3]Møller et al. 2012, Prestrud et al. (2019).. There are also statistics available on the other areas covered by Producer Responsibility Schemes, e.g., batteries, WEEE, autos, etc. Statistics cover first of all collected materials and products, and how large proportion of the waste that is recycled and reused.
There are sector wise statistics for waste generation and how the waste is treated. There are also data available from Infinitum on how much beverage bottles and boxes that are recycled through there system annually but no statistics about the use of recycled material in new bottles put on the market. There are no refillable bottle systems available in Norway at the time.
For food waste, data are available on amount of food being wasted along the value chain, on a quite detailed sector and product type level. Data are also available from some sectors on how much food waste that is prevented through redistribution of surplus food to social organisations.
A new project has started in August 2020 by the Eyde industrial cluster in collaboration with several other industrial clusters and symbioses centres in Norway to make a detailed survey of potential resources from waste flows and by-products from the Norwegian process industry. This is a spin-off from the Expert group report to the Process21-program and is financed by the Government through extra corona-funding in Norway in 2020.
Impacts
Statistics on sustainable indicators such as GHG-emissions use can be found. There are models available to calculate potential savings of GHG-emissions from circulating waste, being developed more on a research basis and applied by a number of waste companies, municipalities etc. (developed by Norsus in collaboration with Avfall Norge). There are also models available for monitoring impacts of both different waste treatment solutions and to evaluate the impacts of using recycled materials as an alternative to virgin materials in a large number of products.
Only some reports available from specific sectors, like the biogas sector on organic waste treatment and through the work that was done by Club of Rome to estimate the potential for new jobs in Norway based in their global models. However, there are limited indicators available for social impacts of circular economy actions nationally.
6.2 Sub-national monitoring of circular economy
At present there are only a few municipalities that have started their work with developing indicators which will be relevant for a circular economy. Oslo municipality has under preparation a plan for circular economy as part of their sustainability initiatives, and also indicators connected to an action plan for sustainable and reduced consumption. In this work, Oslo municipality will develop indicators for monitoring material intensity, sharing of products and materials and substitution of products and materials to be more sustainable and circular. The action plan includes both the municipal organisation as well as households, businesses in Oslo and organisations.
Kongsvinger municipality develops a circularity scanning report together with Circularity Norway, mostly focused on wood and forestry products focusing on the built environment value chain to look for potential circular pilots to increase the circularity of the value chain. Key stakeholders in the value chain are involved to develop pilots for the local business and industry. The strategies that are chosen are to increase use of secondary materials, shorten the value chain and increase capacity building.
Despite, data on waste generation and treatment, no data streams or indicators can be found across all municipalities/regions.
7. CE MONI|TORING IN SWEDEN
In 2018, the Swedish government constituted a Delegation for Circular Economy under the Swedish Agency for Economic and Regional Growth. The primary purpose of the delegation was to develop a foundation for a strategy for the transition to a circular economy. The Delegation submitted its recommendations on a circular economy strategy in 2019 with suggestions for among others to map material flows in society, include circularity in public procurement and prolong product warranty[1]Delegationen för Cirkulär Ekonomi (2019). Inspel till regeringens nationella strategi för Cirkulär Ekonomi.
The Swedish National Strategy for Circular Economy was adopted by the government in July 2020[2]The Swedish Government (2020). Cirkulär ekonomi – strategi för omställningen i Sverige. The strategy defines a vision for a circular society in Sweden - “A society in which resources are used efficiently in toxin-free circular flows, replacing new materials.” An overarching goal for the circular transition is also formulated, stating that the transition to a circular economy should contribute to fulfilling the environmental and climate goals, and the global Sustainable Development Goals. The strategy is built up by four focus areas and a number of concrete measures supporting the circular transition.
The four focus areas of Sweden’s circular economy strategy:
- A circular economy through sustainable production and product design.
- A circular economy through sustainable ways of consuming and using materials, products and services.
- A circular economy through toxin-free and circular ecocycles.
- A circular economy as a driving force for the business sector and other actors through measures to promote innovation and circular business models.
Each of the focus areas is connected to specific SDG goals. The strategy will be followed by action plans that will further define tools and concrete measures for each of the four focus areas.
In the strategy, prioritised material streams for the circular transition are pointed out. These include materials in the construction and the built environment, plastic, textiles, and food. Metals and minerals critical to innovation and renewable and biobased raw materials are also pointed out as prioritised material streams.
7.1 National level monitoring models and indicators
Monitoring of the national circular economy strategy is linked to the SDG targets and indicators. Each of the four area of focus are assigned relevant SDG’s namely: SDG3 on Good Health and Well-being; SDG8 on Good Jobs and Economic Growth; SDG9 on Innovation and Infrastructure; SDG11 on Sustainable Cities and Communities; SDG12 on Responsible Consumption and Production; SDG14 on Life Below Water. Specific targets are also selected for each focus area, as presented in Table 5. The targets each have associated indicators defined by the Inter-Agency and Expert Group on Sustainable Development Goal Indicators. Additionally, Statistics Sweden have pointed out national indicators and compiled all SDG indicators in Sweden in a national indicator list. The national indicators which are specific for Sweden are noted with “N” in the table below[1]Statistics Sweden (2020). Genomförandet av Agenda 2030 i Sverige. Delredovisning av den statistiska uppföljningen, mars 2020.
Footnotes
- ^ Statistics Sweden (2020). Genomförandet av Agenda 2030 i Sverige. Delredovisning av den statistiska uppföljningen, mars 2020
| TABLE 5. TARGETS AND INDICATORS RELATED TO THE FOUR AREAS OF ACTION | ||
| Area of action | Target | Indicator |
| A circular economy through sustainable production and product design. | Target 3.9: Reduce illnesses and deaths from hazardous chemicals | 3.9.1: Mortality rate attributed to household and ambient air pollution. |
| 3.9.2: Mortality rate attributed to unsafe water, unsafe sanitation and lack of hygiene (exposure to unsafe Water, Sanitation and Hygiene for All (WASH) services). | ||
| 3.9.3: Mortality rate attributed to unintentional poisoning | ||
| 3.9.4(N): Air quality in close proximity to the home; Amounts exposed to air pollution from traffic close to the home. | ||
| Target 8.4: Improve progressively, through 2030, global resource efficiency in consumption and production and endeavour to decouple economic growth from environmental degradation, in accordance with the 10 Year Framework of Programmes on Sustainable Consumption and Production, with developed countries taking the lead | 8.4.1: Material footprint, material footprint per capita, and material footprint per GDP | |
| 8.4.2: Domestic material consumption, domestic material consumption per capita, and domestic material consumption per GDP | ||
| Target 9.4 By 2030, upgrade infrastructure and retrofit industries to make them sustainable, with increased resource-use efficiency and greater adoption of clean and environmentally sound technologies and industrial processes, with all countries taking action in accordance with their respective capabilities | 9.4.1: CO2 emission per unit of value added | |
| 9.4.2(N): Number of workplaces, revenue, export and employees within the environmental sector in Sweden. | ||
| 9.4.3(N): The industry’s investments in environmental protection per environmental sector. | ||
| Target 12.2 By 2030, achieve the sustainable management and efficient use of natural resources | 12.2.1: Material footprint, material footprint per capita, and material footprint per GDP | |
| 12.2.2: Domestic material consumption, domestic material consumption per capita, and domestic material consumption per GDP | ||
| A circular economy through sustainable ways of consuming and using materials, products and services. | Target 8.4 Improve progressively, through 2030, global resource efficiency in consumption and production and endeavour to decouple economic growth from environmental degradation, in accordance with the 10 Year Framework of Programmes on Sustainable Consumption and Production, with developed countries taking the lead | 8.4.1: Material footprint, material footprint per capita, and material footprint per GDP |
| 8.4.2: Domestic material consumption, domestic material consumption per capita, and domestic material consumption per GDP | ||
| Target 12.3 By 2030, halve per capita global food waste at the retail and consumer levels and reduce food losses along production and supply chains, including post-harvest losses | 12.3.1: Global food loss index (a) Food loss index (b) Food waste index | |
| 12.3.1(N): Food waste per person in the entire food chain (proxy) | ||
| Target 12.7 Promote public procurement practices that are sustainable, in accordance with national policies and priorities | 12.7.1: Degree of implementation of sustainable public procurement policies and action plans | |
| 12.7.2(N): Greenhouse gas emissions from public consumption expenses | ||
| A circular economy through toxin-free and circular ecocycles. | Target 11.6 By 2030, reduce the adverse per capita environmental impact of cities, including by paying special attention to air quality and municipal and other waste management | 11.6.1: Proportion of urban solid waste regularly collected and with adequate final discharge out of total urban solid waste generated, by cities |
| 11.6.2: Annual mean levels of fine particulate matter (e.g. PM2.5 and PM10) in cities (population weighted) | ||
| 11.6.3(N): Total amounts of treated household waste per capita | ||
| 11.6.4(N): Air quality in close proximity to the home; Amounts exposed to air pollution from traffic close to the home. | ||
| Target 12.4 By 2020, achieve the environmentally sound management of chemicals and all wastes throughout their life cycle, in accordance with agreed international frameworks, and significantly reduce their release to air, water and soil in order to minimize their adverse impacts on human health and the environment | 12.4.1: Number of parties to multilateral environmental agreements on hazardous waste, and other chemicals that meet their commitments and obligations in transmitting information as required by each relevant agreement | |
| 12.4.2: Hazardous waste generated per capita and proportion of hazardous waste treated, by type of treatment | ||
| 12.4.3(N): Use of chemicals per BNP (intensity) | ||
| Target 12.5 By 2030, substantially reduce waste generation through prevention, reduction, recycling and reuse | 12.5.1: National recycling rate, tons of material recycled | |
| Target 14.1 By 2025, prevent and significantly reduce marine pollution of all kinds, in particular from land-based activities, including marine debris and nutrient pollution | 14.1.1: Index of coastal eutrophication and floating plastic debris density | |
| A circular economy as a driving force for the business sector and other actors through measures to promote innovation and circular business models. | Target 8.2 Achieve higher levels of economic productivity through diversification, technological upgrading and innovation, including through a focus on high-value added and labour-intensive sectors | 8.2.1: Annual growth rate of real GDP per employed person |
| Target 9.4 By 2030, upgrade infrastructure and retrofit industries to make them sustainable, with increased resource-use efficiency and greater adoption of clean and environmentally sound technologies and industrial processes, with all countries taking action in accordance with their respective capabilities | 9.4.1: CO2 emission per unit of value added | |
| 9.4.2(N): Number of workplaces, revenue, export and employees within the environmental sector in Sweden. | ||
| 9.4.3(N): The industry’s investments in environmental protection per environmental sector. | ||
The Swedish government monitors the status of the environment through its ‘environmental goals system’. 15 environmental quality goals specify the desired conditions of the Swedish environment and are monitored through a range of indicators, among which some are of relevance for the understanding of the progress of circular economy.
A key goal is the “Generation goal”, meaning ‘to hand-over a society to the next generation where major environmental challenges are solved without causing additional harm outside Sweden’s boundaries’[1]SEPA (2018). Generationsmålet – miljöarbete för kommande generationer.
Footnotes
- ^ SEPA (2018). Generationsmålet – miljöarbete för kommande generationer
7.1.1 Accessible indicators on national level
Quite a few indicators provide information on the transition towards circular economy.
Political activities promoting circular economy
One of the eight indicators of the Generation Goal monitor the amount of public environmental subsidies aimed at improving the environmental status in terms of climate, sustainable energy, natural resources, sustainable transportation and other environmental concerns. The subsidies are granted to companies, the public sector, private consumption, or receivers outside Sweden. The data is calculated from the state budget by the Swedish National Financial Management Authority.
The delegation of circular economy made a long list of policy tools contributing to a circular economy including the status, categorisation, appliance, industry, value chain and if the tool is involving a critical raw materials as categorised by EU[1]Hilton, S. (2018). Inventering av styrmedel för den cirkulära ekonomin.
Resource use
Another indicator concerns “material flows” and monitors the national use of materials (DMC) reflected against the national economy (GDP), hereby providing information on resource productivity (DMC/GDP) and illustrating whether decoupling between resource use and economic growth is taking place. The data on resource use and GDP is compiled by Statistics Sweden.
Share of renewable energy of total energy use is also included as an indicator in the generation goal. The share of renewable energy consists of electricity from renewables, district heating and cooling from renewable energy, use of renewables for heating and processes and renewable energy for transportation.
Circular products and production
The EU ‘eco-innovation index’ is used to monitor the Swedish eco-innovation performance. The index consists of 16 indicators related to input, activities, output, socioeconomic and resource efficiency outcomes - as presented in the table below. All indicators are added up and divided by population to create an index number. EU’s average is index 100[2]EC (2018). Eco-Innovation Index.
| TABLE 6. ECO INNOVATION INDEX | ||||
| Inputs | Activities | Outputs | Socioeconomic outcomes | Resource efficiency outcomes |
| 1. Government’s environmental and energy R&D appropriations and outlays 2. Total R&D personnel and researchers 3. Total value of green early stage investments | 4. Firms declaring to have implemented innovation activities aiming at a reduction of material input per unit output 5. Firms declaring to have implemented innovation activities aiming at a reduction of energy input per unit output 6. ISO 14001 registered organisations | 7. Eco-innovation related patents 8. Eco-innovation related academic publications 9. Eco-innovation related media coverage | 10. Exports of products from eco-industries 11. Employment in eco-industries and circular economy 12. Revenue in eco-industries and circular economy | 13. Material productivity 14. Water productivity 15. Energy productivity 16. GHG emissions intensity |
Through environmental sector data, Statistics Sweden monitors production in several subcategories, including renewable energy, heat and energy savings and secondary materials[1]Statistics Sweden (2017). Miljösektorn efter miljöområde. År 2003 - 2017. The data illustrates the size of these sectors measured in production value, number of work places and number of employees.
Several projects at Swedish universities and among companies develop indicators estimating the circularity of a production process or a product; some indicators are sector specific, some are targeting a specific fraction or material.
RISE AB has developed an indicator – the circularity metric called “C” – measuring the share of a product originating from used products. C is measured in monetary value based on market prices or cost estimations by dividing the economic value of recirculated parts with the economic value of all parts. The circularity metrics ranges from 0-1 or 0%-100%[2]Linder et al. (2017). A metric for Quantifying Product-Level Circularity. The C-indicator has been piloted in 18 companies through a project about “Measuring product circularity as a means to promote resource productivity” under Re:Source[3]Linder et al. (2018). Measuring product circularity as a means to promote resource productivity.
RISE AB found that the C-indicator was not sufficient as it is primarily measuring secondary materials. RISE are therefore developing a three-dimensional product circularity metric measuring material recirculation, utilization and endurance.
- Material recirculation corresponds with the C-indicator measuring the economic value from recirculated material.
- Utilization are calculated based on the proportion of products’ change in economic value or the users per unit of time.
- Endurance or “market entropy” is the cost of restoring a product to its original market values.
RISE AB, Chalmers and IVL are carrying out the project “LinCS – Linking circularity metrics at product and societal level” financed by SEPA. On micro-level, the project looks into the environmental impact and economic performance of circular products and business models. On macro-level, the project aims at measuring the circular transition in a way that captures rebound impacts such as changes in consumption. The two levels indicators are aimed to correspond[4]Chalmers Industriteknik (2019). LinCs – linking circularity metrics at product and society level.
KTH University is developing the tool “Green Performance Map” to map waste, water and energy flows and the number of steps that production operators take up the waste hierarchy. The tool is used to construct an indicator to measure circularity in manufacturing processes. The indicator development is ongoing.
Circular consumption
The project PROCEED aims at supporting circular public procurement through circular metrics that can help the public procurers evaluate the bids. The project describes five circularity metrics that can be applied in circular consumption[5]Williander, M. (2019). Circular public procurement toolbox – managerial guidelines for circular procurements practitioners.
Reuse and preparation for reuse
Statistics Sweden publishes data on the reuse of a range of electronic equipment such as communication equipment, appliances, lightning and the like. The statistics are based on data from importers and manufacturers reporting to SEPA[6]Statistics Sweden (2020). Avfall, elutrustning och batterier.
Waste generation and treatment
260 out of 290 municipalities and treatment plants are yearly reporting waste amounts and treatment at the Swedish Waste Web, which is managed by the Swedish Waste Management Association. Waste treatment is monitored by SEPA for 18 industrial sectors and households and divided into 51 types of waste treatment. The indicator is used to follow up on the EU waste directive, the Swedish environmental targets, and national waste plans.
The Swedish Environmental Emissions Data (SMED)[7]SMED is collecting and setting up environmental statistics and consists of IVL, Statistics Sweden, University of Agricultural and Sciences and SMHI being employed by SEPA. is setting up the waste accounts through statistical methods. Companies are yearly reporting waste amounts and treatment in their mandatory environmental reports in the SME database, and these figures are supplemented with different company surveys reporting on specific fraction of waste.
The recycling rate for packaging is included in the Statistics Sweden data sets[8]Statistics Sweden (2020). Avfall, förpackningar.
The Waste Web System comprise waste indicators on all steps in the waste hierarchy. The waste indicators form an index on resource efficiency, together calculating the resource efficiency of the individual municipalities. Each step in the waste hierarchy gives a score ranging from disposal (0), Recycling as construction materials (10), incineration with bioenergy (25), incineration with energy (25), Anaerobic digestion (50), recycling (75) and prevention (100). Prevention of waste is measured as the difference between the waste amount being expected and the actual waste amounts. The expected waste amount is calculated through a historical relation between consumption levels and waste generation, which is calculated on local level through disposable incomes[9]The Swedish Waste Management Association (2014). Avfallsindikatorer Vägledning för hur man kan mäta och följa utvecklingen mot en resurseffektiv avfallshantering.
The Swedish Waste Management Association aims at including indicators on climate emissions from different fractions at the Waste Web. In 2019, the Swedish Waste Management Association calculated the carbon footprint from downcycling as compared to upcycling[10]The Swedish Waste Management Association (2019). Klimatpåverkan från olika avfallsfraktioner.
Statistics Sweden and the consultancy Milav have carried out a project mapping out and analysing circular economy indicators that might be applied in Sweden nationally, in different industries and companies. They aspire at linking the micro and macro levels by applying the same type of indicators on all three levels. Inspired by Eurostat, they have chosen the following indicators, measuring secondary materials and waste amounts:
Footnotes
- ^ Statistics Sweden (2017). Miljösektorn efter miljöområde. År 2003 - 2017
- ^ Linder et al. (2017). A metric for Quantifying Product-Level Circularity
- ^ Linder et al. (2018). Measuring product circularity as a means to promote resource productivity
- ^ Chalmers Industriteknik (2019). LinCs – linking circularity metrics at product and society level
- ^ Williander, M. (2019). Circular public procurement toolbox – managerial guidelines for circular procurements practitioners
- ^ Statistics Sweden (2020). Avfall, elutrustning och batterier
- ^ SMED is collecting and setting up environmental statistics and consists of IVL, Statistics Sweden, University of Agricultural and Sciences and SMHI being employed by SEPA.
- ^ Statistics Sweden (2020). Avfall, förpackningar
- ^ The Swedish Waste Management Association (2014). Avfallsindikatorer Vägledning för hur man kan mäta och följa utvecklingen mot en resurseffektiv avfallshantering
- ^ The Swedish Waste Management Association (2019). Klimatpåverkan från olika avfallsfraktioner
| TABLE 7. CIRCULAR ECONOMY INDICATORS PROPOSED BY STATISTICS SWEDEN AND MILAV. | ||
| National | Industries | Companies |
| Circular Material Usage rate (CMU): the share of secondary resources in overall material use | DMC by industry and resource utilization measured in acquisition and sales values (SEK). | Share of secondary materials |
| Waste/GDP | Waste/revenue | |
| Waste/DMC | Waste/material use | |
The indicators have been chosen based on data availability and comparability across countries.
Impacts
CO2-emissions from different consumption categories are monitored, including emissions from transport, food, housing, investments and public consumption. Sweden has indicators for GHG emissions and the concentration of climate affecting substances in the atmosphere
There is no monitoring of impacts directly linked to circular economy efforts, but plenty of indicators on socio-economy, resource consumption, environmental impact and climate aspects, including the set of indicators connected to the national environmental goals[1]The Swedish Government (2020). Sveriges Miljömål.
Footnotes
- ^ The Swedish Government (2020). Sveriges Miljömål
7.2 Sub-national monitoring of circular economy
Swedish regions and municipalities are drivers of circular economy with ambitious strategies and initiatives that push forward the circular agenda.
Some regional initiatives support municipalities with circular procurement, such as it is the case in Skåne[1]Hållbar Utveckling Skåne (2020). Cirkulära Skåne, some support industrial symbiosis and circular business models, and others again support circularity of certain waste fractions. Most of the regions include circular economy in climate or environmental strategies or are working with circular economy on a project basis.
Swedish municipalities are working with circular economy through waste plans or with separate initiatives and projects focusing on reuse, procurement or business development. Several Swedish municipalities also use circular economy to achieve climate targets. The municipality of Umeå has applied OECD’s Circular Economy Scoreboard for cities and regions to assess the level of progress towards a circular economy. The CE-scoreboard consists of ten key dimensions and the three levels of advancement, namely newcomer, in progress and advanced as presented below.
Footnotes
- ^ Hållbar Utveckling Skåne (2020). Cirkulära Skåne
| TABLE 8. OECD Circular economy scoreboard for cities and regions | |||
| Dimensions | Level of advancement | ||
| Newcomer | In progress | Advanced | |
| Circular economy framework | The city/region is planning to develop a CE strategy, but has not started yet | The CE strategy is under devel-opment | Existence of a CE strategy with specific goals and priorities, actions sectors and a monitoring framework |
| Co-ordination mechanisms | The are no co-ordination mecha-nisms in place but under devel-opment | Existence of dialogues across levels of government, but not focused on the circular economy | Co-ordination mechanisms across levels of governments to set and implement a CE strategy or initiative are well estab-lished and functioning |
| Policy coherence | The CE initiatives are still not aligned with other related policy areas | The CE initiatives are aligned with some specific related policy areas | Existence of overall policy coherence between CE initiatives and related policy areas |
| Economy and finance | No current financial instruments in place but planned | Existence of a budget dedicated to environmental spending that is foreseen to be used also for CE projects | Existence of a funding programme and economic incentives for CE projects with specific objectives, prioritised sectors and a monitoring framework of the outcomes |
| Innovation | The are no spaces to test and pilot but planned | Design of spaces to test and pilot CE projects under development | Existence of spaces to test and pilot CE project |
| Stakeholder engagement | Existence of an initiatives for the mapping of the most relevant stakeholders in city/region | Existence of a dialogue with stakeholders for the design and implementation of CE strategy | Existence of participation spaces for stakeholders through which input is used for the design and implementation of CE strategies |
| Capacity building | Existence of capacity building programmes on green and sus-tainable economy fields | Existence of capacity building programmes for activities associated with designing, setting and implementing CE initiatives | Regular capacity building programmes for activities associated with designing, setting, implementing and monitoring the CE strategy |
| Green Public Pro-curement (GPP) | GPP is being developed | Existence of GPP model including environmental criteria | Existence of circular public procurement framework |
| Data and information | Identification of data on waste management and information campaigns to prevent waste generation | Existence of data on waste management and information campaigns on the CE | Existence of an information system of the CE. Data and publicly available and citizens and business informed of the opportunities related to business models and behaviours |
| Monitoring and evaluation | No monitoring or evaluation framework in place | Existence of a monitoring and evaluation framework that includes environmental aspect | Existence of a monitoring and evaluation framework that includes environmental, economic and social aspects. |
OECD suggests that a self-assessment should be followed with quantitative indicators monitoring the CE-effort.
7.2.1 Accessible indicators on a sub-national level
Political and societal initiatives promoting circular economy
No indicators measuring regional or local political initiatives promoting circular economy have been identified.
Resource use
No indicators that measure resource use at local level.
Circular products and production
No indicators that measure circular products or production at regional or local level.
Circular consumption
Besides the PROCEED project described, no indicators that measure circular public procurement have been identified.
Reuse and preparation for reuse
The municipality of Eskilstuna in 2015 opened the mall “Retuna” solely selling reused products that are donated to the mall and then sorted, repaired and upcycled. The economic turn-over is measured yearly as well as the number of jobs being generated.
Skellefteå municipality continuously measure reuse in the municipality’s recycling facilities by weight. A number of building material fractions, such as windows and doors, are monitored by number of units collected and sold. Skellefteå is monitoring this data in order to evaluate their reuse goals, which are 5 kg reusable products collected per capita and 4.5 kg reused products sold per capita.
In Stockholm, the number of reused objects is registered and weighted at a pop-up reuse station and in Sundbyberg.
Waste generation and treatment
Waste indicators on household waste are available for the municipalities as described under the national level.
Impacts
Klimatkommunerna, an association of sub-national authorities that work towards rapid climate transition, has mapped indicators relevant for reducing their carbon footprint. Several of these are correlated with circular economy and could be used as indicators, hereunder greenhouse gas emissions within the municipalities border, CO2 emissions from industry and processes in the municipality and the degree of self-sufficiency in renewable energy.
We have found no other indicators that is proven correlated with circular economy. Yet in Umeå, the climate impact from the consumption of the residents has been measured through a survey of consumption habits and input-output models[1]Umeå municipality (2019). Climate smart choice for sustainable lifestyles.
Footnotes
- ^ Umeå municipality (2019). Climate smart choice for sustainable lifestyles
8. OVERVIEW - MONI|TORING CIRCULAR ECONOMY IN THE NORDICS
The study shows that selected aspects of circular economy are monitored in all the Nordic countries, in particular aspects related to waste generation and waste treatment, secondary resources, and resource use, in accordance with EU practices. Monitoring of progress towards a sustainable society can be found, but not directly linked to the circular economy. No comprehensive monitoring system on circular economy can be identified nationally or locally. Table 9 presents the status of monitoring of the circular economy in the five countries.
| TABLE 9. MONITORING THE CIRCULAR ECONOMY IN THE NORDIC COUNTRIES | ||
| Brief history of circular economy | Status of monitoring on national level | |
| Denmark | Denmark launched its strategy for circular economy in 2018, aiming at reducing the use of virgin resources and increasing the competitiveness and productivity of Dan-ish businesses. The main focus areas are on the circular transition in SME’s, circular design, circular consumption through circular public procurement, a market for waste and secondary resources and more value from biomass and buildings. | The strategy on circular economy is monitored through indicators on resource efficiency and recy-cling. |
| Finland | Finland was the first country in the world to launch a national strategy for circular economy in 2016 and is now, under the lead of the Ministry for Economic Affairs and Employment, developing a large-scale national programme for supporting the circular transition specifically in the fields of real estate and construction, manufacturing and process industries, municipalities and regions and emerg-ing business models and technologies. | No national monitoring system on circular economy has been launched, but circular economy related measures and indicators have been developed and utilized in various contexts. The Finnish Environ-ment Institute SYKE is leading a project funded through the EU Life Programme: CIRCWASTE – Fin-land towards circular economy, in which calculation methods for circular economy indicators are estab-lished. The project provides estimations of regions’ and municipalities’ progress towards a circular economy. |
| Iceland | Iceland has no national strategy for circular economy but is developing its national waste management programme with clear elements of circular economy. | No national monitoring system on circular economy has been launched. |
| Norway | Norway is currently working on identifying which sectors have the highest potential for improving circularity, and on analysing incentives and barriers related to introduc-tion of a circular economy. The work will form the basis for a national circular economy strategy and action plan to be launched in March 2021. | With the coming strategy on circular economy, an indicator set to measure the progress towards a circular economy is expected, including indicators related to material intensity in products, secondary resources, use of renewable energy resources, amount of waste being generated from products and production, and share of materials being recycled in the end- of-life phase of products. |
| Sweden | Sweden launched its national strategy on circular devel-opment in July 2020, focusing on sustainable production and design, sustainable consumption and the use of materials, products and services, circular non-toxic loops, and circular economy as a driver for innovation and new business models. | Sweden has with the strategy on circular economy included a monitoring system based on a range of the UN SDG indicators. |
8.1 Monitoring the points of measurements
The study has identified a large number of data streams and indicators throwing light on important aspects of the points of measurement.
Political and societal activities promoting circular economy
Political activities based on a national strategy are often monitored by the involved ministries, whereas it is more difficult to identify and monitor other, more scattered, activities, like performance and efforts of businesses and municipalities. In the Nordics, monitoring of political and societal activities promoting circular economy are only found to a limited degree at project level or on specific initiatives.
The Danish circular economy strategy is monitored through a qualitative assessment of the status of the activities. An indicator of the environmental subsidies aimed at improving the environmental status are included in the Generation Goal in Sweden. Only few other indicators measuring political activities have been identified, while no systematic and continuous monitoring of societal activities promoting circular economy have been reported.
Resource use
Specific indicators on resource use are in place. All Nordic countries report on the Economy-Wide Material Flow Accounts (EW-MFA)[1]Refer to the definitions earlier in this report., a method to map resource flows in the economy providing a picture of resource use, resource flows and emissions. All Nordic countries also monitor resource use in production with indicators such as Domestic Material Consumption (DMC) and Domestic Material Input (DMI). In Denmark and Finland, Raw Material Consumption (RMC) and Raw Material Input (RMI) are also calculated[2]RMC and RMI include the resources used to extract and produce materials and products that are imported or exported and thus rather measure resource use in consumption, while the DMI and DMC indicate resource use in production..
Circular products and production
Very few examples of monitoring of circular products and production have been identified, although some proxy indicators on the extent of circular production and volume of circular products exist, such as:
- The number and turnover of eco-labelled products
- Environmental Product Declarations on buildings and furniture, which inform on circularity of these specific product categories
- The eco-innovation Index, developed by the EU, to monitor eco-innovation performance include 16 indicators, among others: green patents, green funding, export, employment and revenue in eco-industries.
Some universities, research institutions and companies are developing circularity metrics to measure the circularity of products and production processes. These (few) project-based measurements of circularity are on significant distance from sub-national or national level monitoring. The suggested circularity metrics are often based on numbers of sales and materials that are considered confidential in many sectors and therefore not publicly available.
A challenge is the national statistical systems in which the standard industrial and sectoral classifications do not support monitoring of the circular economy as circular activities often take place on the interface of different sectors.
Many companies monitor several aspects of sustainability, of which some are related to circular economy, but the data is not accessible for public authorities, and as one company’s data cannot be seen as representative for the entire population of companies, data should be retrieved from many businesses.
Circular consumption
Data streams and indicators on circular consumption strategies - such as refuse, reduce, extended lifetime, replacing products with services, repair, and maintenance - are limited in the Nordics (and internationally). The complexity of circular consumption is high, the different approaches reflect behaviours and attitudes that often requires qualitative methods to understand in detail. Therefore, each of the circular consumption strategies can advantageously be measured individually.
The Nordic data and indicators, which can inform on circular consumption and are currently available, include:
- RMC and RMI, which reflect resources used in consumption.
- A carbon footprint of consumption is available in Finland.
- Sweden includes SDG target 12.7 on Green Public Procurement in their circular economy strategy, and Finland monitors the level of GPP[3]The UN has in July 2020 submitted new draft indicators for measuring SDG 12.7. The Swedish project PROCEED shows that circularity metrics accessing the levels of circularity of a product or service can be applied in tenders to evaluate the bidders.
- Sales volume of products with environmental labels inform about the demand for eco-friendly products.
- Some information on the individual countries’ Green Public Procurement efforts is available.[4]Green Public Procurement and eco-labelling have many linkages to circular economy; the connections should be made clear in order to enable meaningful circular economy monitoring.
Reuse and preparation for reuse
No comprehensive national or subnational data on reuse have been found. A comprehensive measurement of reuse is difficult as much reuse is taking place informally between individuals and thus not being registered as a monetary transaction. Reuse taking place through more formal channels is easier to monitor. Several projects at waste companies and municipalities measure reuse, just as online reuse platforms have access to data on reuse.
Products collected for reuse is part of the Danish and Swedish waste data systems, but only sparse data are being registered. Article 9(4) of the Waste Framework Directive (WFD) and Article 12(3)(d) of the Packaging and Packaging Waste Directive (PPWD) states that by the 31 March 2019 the European Commission shall adopt implementing acts to establish a common methodology to report and monitor the reuse of products and the reuse of packaging, respectively, but such a common methodology is still pending[5]Oeko-Institut e.V. and PlanMiljø on behalf of EC (2019). Study: Methodology for the reporting of re-use of products and rules for the reporting of reusable packaging. The background report from the EU suggests that reuse is measured based on data gathered from digital reuse platforms and reuse shops combined with data from consumer surveys.
Waste quantities and handling
Data on waste amounts and waste treatment, including recycling, are available across all the Nordic countries, also data on secondary resources is available. Regulation (EC) No 2150/2002 of the European Parliament regulates how waste data should be reported; this is done by a broad range of actors leading to some biases, leaving a certain room for improvement of the data quality.
Municipalities experience difficulties in collecting and reporting data on waste fractions due to lack of uniform definitions. There is a concern that this problem can also impact statistics in other sections of a circular economy indicator framework, emphasising the need for standardized terminology and definitions and a clear taxonomy.
The Swedish Waste Management Association has created incentives for municipalities to report more precise data by providing a benchmarking facility with graphic features.
In Sweden, prevention of waste is measured as the difference between the waste amount being expected and the actual waste amounts. The expected waste amount is calculated through a historical relation between consumption levels and waste generation, calculated at local level using figures for available incomes.
Impacts
Data on environmental outcomes and impacts exist in all countries, informing on trends in (for example) CO2-emissions or land use. However, the causal linkages between circular economy policies/initiatives and the state of environment are complex and difficult to ascertain.
A few performance indicators more clearly linked to CE are available - such as the growth trends for the repair sector and the waste sector. There are also examples of accounting of the CO2-emissions of different types of waste treatment.
In Umeå municipality in Sweden, a method to measure consumption on a local level has been introduced, providing information on resource use and climate footprint.
Footnotes
- ^ Refer to the definitions earlier in this report.
- ^ RMC and RMI include the resources used to extract and produce materials and products that are imported or exported and thus rather measure resource use in consumption, while the DMI and DMC indicate resource use in production.
- ^ The UN has in July 2020 submitted new draft indicators for measuring SDG 12.7
- ^ Green Public Procurement and eco-labelling have many linkages to circular economy; the connections should be made clear in order to enable meaningful circular economy monitoring.
- ^ Oeko-Institut e.V. and PlanMiljø on behalf of EC (2019). Study: Methodology for the reporting of re-use of products and rules for the reporting of reusable packaging
8.2 Monitoring systems on circular economy
As shown, the Nordic countries monitor important aspects of the circular economy with indicators and data streams on resource use, waste, socioeconomic factors, and environmental performance. The impacts of circular economy policies and initiatives are currently hard to document and isolate to a circular transition, and the causal linkages are complex and difficult to verify. Measurements are not available on circular economy strategies aiming at higher value of resources and products, including circular products and production, reuse nor for societal and political initiatives. For these points of measurements, there are however indicators of how to measure this, this data has just not yet been collected. For circular consumption, a metric of how to measure this – including reduce and extending lifetime – needs to be developed; the UN is working on improving the SDG indicators for SDG 12.7, Green Public Procurement.
The figure below illustrates the completeness of indicators, data and monitoring options for the points of measurement investigated in the present project.
Figure 5. Points of measurement, green: data available, yellow: data to be collected, indicators are developed, red: data and indicators are missing
There is a trade-off between complexity and appliance. Simple indicator-sets or metrics do not cover all aspects of the circular economy, whereas more advanced indicator-sets require more resources for monitoring. A biased monitoring focus towards specific aspects of the circular economy - waste management and recycling – will strengthen political focus towards these aspects, reducing the overall attention on the inner loops of the circular economy.
The new Swedish approach to monitoring of the circular economy transition is linked to the SDG targets and indicators, with key aspects of the circular economy such as reduction of chemicals and pollution, resource efficiency, waste amounts and waste management, green public procurement and environmental technologies. The absence of indicators on other circular economy aspects from the inner circles – like refuse, reuse and repair – reflects the difficulties in measuring these less tangible features.
In Finland, a set of indicators to monitor the circular economy is being developed and is expected to be launched by the end of 2020. In Norway, a strategy on circular economy and a related monitoring programme are expected to be launched also late 2020.
At a subnational level, no systematic monitoring of political or societal initiatives have been identified, but some case collections of initiatives and best-practices supporting circular economy can be found. The Swedish municipality Umeå has applied the OECD scoreboard of circular economy maturity which inspires to broad monitoring of circular economy progress and initiatives. In particular in an area of transition, where the measurement of input and activities are keys to realise a circular economy.
9. POTENTIAL FOR NORDIC COOPERATION
As part of the present survey on Nordic circular economy indicators, the consultant has also investigated the Nordic stakeholders’ interest in a cooperative effort on a Nordic monitoring system for circular economy. The below conclusions are based on input received from the interviewed stakeholders.
9.1 Interest for Nordic cooperation on monitoring CE
A common Nordic monitoring system on circular economy?
The Nordic countries are, compared to many other countries, productive, wealthy and data rich, have well established statistical offices, and are front runners in the sustainable and circular transition. With these similarities lie a great potential for collaboration on monitoring the circular economy to pool resources, to enable comparisons, and to gain and share inspiration, learning, and best practices on circular economy efforts and indicators.
One informant expressed that a common Nordic vision on circular economy, followed up with a monitoring system, could be a driver of circular transition in the Nordics and could contribute to the positive branding of the Nordic region. This notion is well in line with the Nordic Vision 2030 of a green, competitive, and sustainable Nordic region, where one of the focal areas is the development of the circular economy.
A few informants were more sceptical about a Nordic monitoring system on circular economy as they focus on the differences between the countries in, e.g., industrial structures, raw material base, energy production, and the availability of renewable resources.
EU has prepared a framework for monitoring the circular economy, and some informants expressed that the development of a monitoring system on circular economy should be managed by EU, while the Nordic countries could collaborate on the implementation of such monitoring systems. In this model, the Nordic collaboration could supplement EU’s monitoring framework with specific Nordic needs[1]In a previous Nordic project in 2018, the consultant received a clear message from the UN Environmental Programme that Nordic support to development of indicators would be highly appreciated..
Some informants expressed that the Nordic collaboration could support the measurement of specific Nordic aspects of the circular economy, for example where the Nordic countries share framework conditions (consumer markets and publicly available data registers), or where the Nordics lack data streams (for example on circular products and production, circular consumption, circular public procurement and reuse).
Monitoring of aspects where data is unavailable or costly can be based on sampling through e.g. surveys, and this could be more efficient and effective on a Nordic scale (as opposed to separate, national-level surveys). This goes especially for circular aspects of consumption, production, and reuse, where no country has systematic monitoring.
The Nordic countries report waste data to the EU and waste data is continuously improved in all the Nordic countries. Sharing of waste data and monitoring experience entails a potential for Nordic countries to learn from the best of peers and to gain from complex investigations and projects; as an example, waste management might benefit from joint specifications and definitions of waste fractions. Few of the interviewees had knowledge on the established waste data systems in the other Nordic countries and options of joint monitoring are at present not utilised to a noticeable extent.
Footnotes
- ^ In a previous Nordic project in 2018, the consultant received a clear message from the UN Environmental Programme that Nordic support to development of indicators would be highly appreciated.
9.2 Relevant stakeholders in the development of CE monitoring
Comprehensive monitoring of the transition towards circular economy requires input from a multitude of actors, and each point of measurement activates different stakeholders such as data collectors, data owners, and decision makers. The interviewees pointed out the importance of having business representatives, universities, and public authorities, as well as representatives from the waste sector and statistical offices, involved in the development of a monitoring system.
Decision makers across all levels
A key purpose of monitoring circular economy is to provide information to decision makers on the status and progress towards a circular economy. Monitoring can provide valuable information on the effectiveness of the circular economy activities, identify challenges that need to be solved, and monitor if desired outcomes and impacts are reached. Monitoring is thus closely linked to decision making - on national, regional, local, or organisational level. Decision makers should acknowledge the role and value of monitoring in following up on and achieving circular economy objectives.
Several informants express that a monitoring system on circular economy will have a stronger foundation if it is linked to a circular economy strategy clearly showing the vision of a circular transition and giving a mandate to act. Resources need to be allocated to develop monitoring mechanisms, including indicator development, data collection, and data integration and management.
Sub-national governments play a key role in local and regional monitoring of circular economy progress and initiatives. As the maturity of CE varies greatly across municipalities and regions, a starting point could be to measure the framework conditions of circular economy in line with OECD’s framework (see Table 7). Some informants favour a common standard for monitoring the circular economy in order to enable comparison, and it is a general viewpoint that municipalities and regions should be engaged in developing monitoring systems on circular economy at a sub-governmental level.
Data collectors and owners
At the national level, the national governments have specified which data should be collected and are the overall owners of the national statistical agencies. Data on resource use, socioeconomic and environmental impacts are calculated by the national statistical agencies based on information about the economy, and the agencies play a key role in monitoring the circular economy.
Municipalities and waste companies play an important role in reporting waste data and also other data relevant in a circular economy context (reuse, consumption, public procurement, circular business models etc.) could be collected at the sub-national level.
Companies and consumers possess the data or knowledge required to monitor circular products and production, reuse, and circular consumption. Metrics of how these aspects can be measured need to be developed and methods of data collection implemented; this will require involvement of the business sector, universities, research collaborations and representatives of the civil society.
9.3 Opportunities and challenges - monitoring the circular economy
Understanding the value of monitoring in CE transition
A challenge for Nordic cooperation on monitoring the circular economy is a general lack of knowledge and reflection about why and how the circular economy can be monitored and, thus, a lack of experts who will power and contribute to Nordic cooperation on monitoring the circular economy.
At both national and sub-national level, the relevant data streams on sustainability performance, resource use, and waste management, are to be found in different departments. Circular economy in principle relates to the entire economy and most resort areas, and engaged politicians and experts are a prerequisite for the establishment of a more comprehensive CE monitoring system. It is noticeable that some of the interviewed informants were not aware of EU’s framework on monitoring the circular economy, which could form a starting point for a discussion of what a Nordic monitoring system on circular economy should include.
An important step to pursue joint Nordic monitoring of the circular economy is therefore to raise awareness about the value of measuring the circular economy and to engage the relevant stakeholders.
Facilitating collaboration across stakeholders
As we have seen, there is a lack of data streams on circular products and production, circular consumption, and reuse, across the Nordic region. A common Nordic challenge is that current sector-based national statistics do not give a good insight on cross-cutting activities such as the circular economy, pinpointing the need for standardised terminology and definitions for the CE framework.
Cooperation between Nordic statistical bureaus on these challenges could add value; interdisciplinary network meetings could contribute to exchange of knowledge and a discussion on how data can be collected, integrated and analysed.
Many Nordic municipalities already have close cooperation with other Nordic municipalities, also on circular economy related issues, and the Nordic cooperation could support more “low-threshold” cooperation at municipal level. The industrial associations in the Nordic countries already have good cooperation and could contribute to bringing forward relevant topics, e.g. on the EU agenda.
Building and matching capacities
CE monitoring requires an overall understanding of circular economy paired with competencies in data collection, data integration, and data analysis. A monitoring system for CE necessitates strengthening of local staff’s competences within collecting and handling data to ensure reliable analyses and information. On a national level, the competencies exist in relevant resort Ministries, but it is necessary to facilitate interdepartmental working groups on monitoring the circular economy as many civil servants are dedicated experts within a limited CE-area such as waste, environmental performance, procurement or energy consumption.
9.4 Recommendations on Nordic collaboration
There is a need for a common monitoring framework of circular economy, linked to circular economy strategies across political levels in the Nordic countries, and collaboration between the Nordic countries can be of high value (amongst others) within the following areas:
Future Nordic collaboration on circular monitoring - Areas of potential significant value
- The Nordics are mature countries in terms of data availability and effective public and private organisations and systems, and the Nordics could serve as international frontrunners in terms of pursuing and monitoring progress towards circular economy
A consolidated monitoring framework would provide the Nordic countries with a basis for cooperation and exchange of best practices in pursuing and monitoring circular economy. Internationally such a joint effort would attract considerable attention and serve as inspiration for other countries striving to become more circular.
- The Nordic countries could in cooperation define relevant indicators and identify data streams covering all aspects of the circular economy – and especially circular consumption, circular products and production, and reuse.
A monitoring system measuring only selected aspects of a circular economy may lead to distorted decisions. The Nordic Working Group on Circular Economy could facilitate a discussion of how all aspects of the circular economy could be monitored; topics include how micro data can be aggregated and the data’s representativity, comparability, and relevance.
- A joint Nordic effort could have great value in testing and piloting experimental data streams on national and sub-national level
EU is currently looking into how the inner circles can be monitored through among others innovative data streams. The Nordic countries and individual cities have the capacities to set up and test such indicators in terms of feasibility, relevance, easiness, and other parameters.
- Co-creation should go beyond the Nordic countries
A Nordic Working Group on Monitoring the Circular Economy could benefit from consulting very closely with the EU (DG ENV), the EEA, Nordic organisations national and sub-national level, and other EU stakeholder to pursue co-creation and ensure exchange of best practices. The EU strategy on circular economy is ambitious and the EU is constantly striving to improve the monitoring of circular economy. The Nordics can learn from the EU, and a collaborative, comprehensive monitoring effort in the Nordics can inspire EU’s elaboration of the monitoring framework on circular economy.
- What measure is what you get – and the monitoring system should reflect Nordic circular economy priorities
Communication on the progress towards circular economy, brought forward by the monitoring system, can inform decision makers to better support the circular economy transition, in particular if the monitoring system is related to a circular economy strategy that links resources, input, output, outcome, and impacts.
10. BIBLIO|GRAPHY
Adcock, Robert and David Collier (2001). Measurement validity: A shared standard for qualitative and quantitative research.
The Association of Waste Management (2016). The circular economy and benefit for society: https://www.avfallnorge.no/fagomraader-og-faggrupper/rapporter/the-circular-economy-and-benefits-for-society
The Association of Norwegian Industries (2018). Towards a European Circular Economy: https://www.norskindustri.no/siteassets/dokumenter/horinger-og-notater/sirkular-okonomi---industriens-hovedanbefalinger-en.pdf
Business Finland (2019). Bio and Circular Finland Programme 2019-2022: https://www.businessfinland.fi/49b2d9/globalassets/finnish-customers/02-build-your-network/bioeconomy--cleantech/biocircular-finland/bc_oneslider_final_27.3.2019_en.pdf
Chalmers Industriteknik (2019). LinCs – linking circularity metrics at product and society level: https://chalmersindustriteknik.se/en/projects/lincs-linking-circularity-metrics-at-product-and-society-level/
Circular Norway (2020). The Circularity Gap Report Norway
Danish Business Authority (2020). Reg. Stat, Erhversstyrelsens regionale statistikbank
Danish government (2018). Strategi for cirkulær økonomi – mere værdi og bedre miljø gennem design, forbrug og genanvendelse
Danish government (2019). Klimalov
The Danish Ministry for Food and Environment (2019). Statistik for emballageforsyning og indsamling af emballageaffald 2017
Danish Statistics (2020). Materialsstrømsregnskab – statistisk behandling
Delegationen för Cirkulär Ekonomi (2019). Inspel till regeringens nationella strategi för Cirkulär Ekonomi
Deloitte (2020): Study for a National Strategy for Circular Economy: https://www.regjeringen.no/contentassets/7ca1a81f57cc4611a193570e80c4dafd/deloitte_study-on-circular-economy_short-summary.pdf
The Danish Energy Agency (2020). Energi og CO2-regnskabet: https://ens.dk/ansvarsomraader/varme/energi-og-co2-regnskabet
DEPA, Danish Environmental Protection Agency (2020). Miljøtilstand.nu - Natur og biodiversitet: https://xn--miljtilstand-yjb.nu/temaer/natur-og-biodiversitet/
DEPA, Danish Environmental Protection Agency (2017). Cirkulær økonomi – virksomhedsundersøgelse
DEPA, Danish Environmental Protection Agency (2019). Miljøtilstand.nu: www.miljøtilstand.nu
DBA (2019). Genbrugsindeks: https://guide.dba.dk/publikationer/genbrugsindekset/2019/
The Capital Region of Denmark (2019). Affald og ressourcer på tværs – kortlægning af kommunale indsatser på affaldsområder i Region Hovedstaden: https://www.regionh.dk/til-fagfolk/miljoe/en-groennere-region/cirkulaer-oekonomi/Sider/Affald-og-Ressourcer-på-Tværs.aspx
Central Denmark Region (2018). Tematikker for kommuner i Region Midtjylland
Circwaste - towards circular economy in Finland: https://www.materiaalitkiertoon.fi/en-US/Circwaste
EC (2018). Eco-Innovation Index: https://ec.europa.eu/environment/ecoap/sites/ecoap_stayconnected/files/ecoi_index_eu_2018_technical_note.pdf
EC (2019). Tool #41: Monitoring arrangement and indicators.
EC (2020). Circular economy action plan: A new Circular Economy Action Plan – For a cleaner and more competitive Europe
EEA (2016). Circular economy in Europe – developing the knowledge base
E.g. Pirkanmaan Ympäristökeksus (2009). Etelä- ja Länsi-Suomen jätesuunnitelma vuoteen 2020 (The Regional Waste Plan for Southern and Western Finland up to 2020): https://helda.helsinki.fi/bitstream/handle/10138/38011/SY_43_2009.pdf?sequence
Ellen MacArthur Foundation (EMF) (2020a). Material circularity indicator. https://www.ellenmacarthurfoundation.org/resources/apply/material-circularity-indicator
Ellen MacArthur Foundation (EMF) (2020b). Circulytics – method introduction
Ellen MacArthur Foundation (EMF) (2020c). Circulytics – question indicator list
Ellen MacArthur Foundation (EMF) (2015). Potential for Denmark as a Circular Economy – a case study from delivering the circular economy – a toolkit for policy makers
Ellen MacArthur Foundation (EMF) (2019). Completing the picture: How the circular economy tackles climate change
The Environment Agency of Iceland (2020). Saman gegn sóun: https://samangegnsoun.is/
Eurostat (2018). Economy-wide material flow accounts handbook
Eurostat (2019). Material flow accounts statistics – material footprint
Eurostat (2020). Statistics explained – material flows in the circular economy
Eurostat (2020). Circular economy – Overview: https://ec.europa.eu/eurostatcircular-economy
Finnish Centre for Economic Development, Tranport and the Envirronment (2015). Environment: http://www.ely-keskus.fi/enely-en/environment
Finnish Government (2019). Inclusive and competent Finland – a socially, economically and ecologically sustainable society.
Finnish Ministry of Economic Affairs and Employment (2017). Kasvua ja työpaikkoja kestävistä ratkaisuista. Selvitys biotalouden, cleantechin ja kiertotalouden kasvun ja työpaikkojen dynamiikasta. (Growth and employment from sustainable solutions – A study into the dynamics of growth and employment in the bioeconomy, cleantech and circular economy)
Finnish Ministry of Economic Affairs and Employment (2018). Kestävää kasvua materiaalitehokkuudella Kansallisen materiaalitehokkuusohjelman päivitys 2017 (Sustainable growth through material efficiency. Update of the National Material Efficiency Programme 2017)
Finnish Ministry of Economic Affairs and Employment (2020). Low carbon road maps 2035. https://tem.fi/en/low-carbon-roadmaps-2035
Finnish Ministry of the Environment (2018). From Recycling to a Circular Economy. National Waste Plan to 2023.
Finnish Prime Minister’s Office (2020). State of sustainable development: https://kestavakehitys.fi/en/monitoring
Finnish Prime Minister’s Office (2020). State of Sustainable Development – report 2020: https://kestavakehitys.fi/en/state-of-sustainable-development-report
Freiesleben, Simon. (2020). Ingeniøren: Længe ventet klimaudspil for affald: Alle skal sortere affald i 10 fraktioner: https://pro.ing.dk/wastetech/artikel/laenge-ventet-klimaudspil-affald-alle-skal-sortere-affald-i-10-fraktioner-6736
Gaia Consulting (2015). Miten kiertotalouden kehitystä mitataan? Esiselvitys kiertotalouden kansallisen barometrin kehittämisestä. (How to measure circular economy development? Pre-study for the development of a national barometer for the circular economy)
Gaia Consulting (2020). Kiertotalouden indikaattorien tilannekuva. Loppuraportti 11.6.2020 (Snapshot of indicators for the circular economy. Final report 11.6.2020.) (Unpublished report for the Ministry of Economic Affairs and Employment).
Global Footprint Network (2020). Data and methodology: https://www.footprintnetwork.org/resources/data/
Haas et al. (2015): How circular is the global economy?
Hilton, Stephen (2018). Inventering av styrmedel för den cirkulära ekonomin: https://www.delegationcirkularekonomi.se/download/18.745dc19c170b0621a1f70f/1583759188875/1812%20Inventering%20av%20styrmedel%20f%C3%B6r%20den%20cirkul%C3%A4ra%20ekonomin.pdf
Hållbar Utveckling Skåne (2020). Cirkulära Skåne: https://www.hutskane.nu/projekt/cirkulara-skane/
Icelandic Government (2016b). National Plan on Waste Handling 2016–2028
Icelandic Government (2016a). Saman gegn sóun – Almenn stefna um úrgangsforvarnir 2016 – 2027 (“United Against Waste–General Policy on Waste Prevention 2016–2027”)
Icelandic Government, Prime Minister’s Office (2019). Iceland's Implementation of the 2030 Agenda for Sustainable Development. Voluntary National Review.
IDA (2018). Reparation af varige forbrugsgoder
ISO (2018). ISO/TC 323 Circular economy: https://www.iso.org/committee/7203984.html
KEINO competence center (2020): https://www.hankintakeino.fi/en
Kirchher et al. (2018): Coding framework of CE barriers. Meta study
Kuntaliitto (2020). Ymparisto: https://www.kuntaliitto.fi/yhdyskunnat-ja-ymparisto/ymparisto
Linder et al. (2017). A metric for Quantifying Product-Level Circularity
Linder et al. (2018). Measuring product circularity as a means to promote resource productivity
Llorente-Gonzáles, L. J. and Vence, X. (2019). Decoupling or ’defaffing’? The underlying conceptualization of circular economy in the European Union Monitoring Framework
Magnier et al. (2017). 10 Key Indicators for Monitoring the Circular Economy
Ministry for the Environment and Natural Resources (2018). Iceland’s Climate Action Plan for 2018-2030 – Summary.
Moraga et al. (2019): Circular economy indicators: what do they measure?
Motiva (2017). Materiaalikatselmusten tuloksia Suomessa (Results of materiality reviews in Finland): https://www.motiva.fi/ratkaisut/materiaalitehokkuus/materiaalikatselmukset/materiaalikatselmusten_tuloksia_suomessa
Municipality of Copenhagen (2017). CO2-neutral hovedstad
Municipality of Copenhagen (2018). Cirkulær København – Ressource og Affaldsplan 2024
Møller et al 2012, Prestrud et al. (2019). Emballasjeutviklinge i Norge: https://norsus.no/publikasjon/emballasjeutviklingen-i-norge-2018/
Nordic Circular Hotspot (2020). Navigating the Nordic Circular Economy: https://nordiccircularhotspot.org/#about
The Norwegian Government (2017). The Norwegian Government steps up the efforts to turn waste into resources and reduce marine litter: https://www.regjeringen.no/en/aktuelt/the-norwegian-government-steps-up-the-efforts-to-turn-waste-into-resources-and-reduce-marine-litter/id2558322/
OECD (2020). The Circular Economy in Cities and Regions: https://www.oecd.org/regional/cities/circular-economy-cities.htm
Oeko-Institut e.V. and PlanMiljø on behalf of EC (2019). Study: Methodology for the reporting of re-use of products and rules for the reporting of reusable packaging
PBL Netherlands (2018): Circular economy: what we want to know and can measure
Process 21 (2020). Sirkulær økonomi: https://www.prosess21.no/om-prosess-21/ekspertgrupper-og-workshops/sirkular-okonomi/
SEPA (2018). Generationsmålet – miljöarbete för kommande generationer
Seppälä et al. (2016). Key indicators for green growth and material and resource efficiency in Finland.
Sitra (2016). Leading the cycle. Finnish road map to a circular economy 2016-2025
SSB (2016). Economy-wide material flow accounts: https://www.ssb.no/en/natur-og-miljo/statistikker/materialstrom/aar/2017-12-12
Statistics Finland (2019). Environmental goods and services sector statistics
Statistics Iceland (2019). Greenhouse gas emissions from the economy: https://statice.is/statistics/environment/emission/greenhouse-gas-emissions-from-the-economy/
Statistics Sweden (2017). Miljösektorn efter miljöområde. År 2003 – 2017
Statistics Sweden (2020). Avfall, elutrustning och batterier
Statistics Sweden (2020). Avfall, förpackningar
Statistics Sweden (2020). Genomförandet av Agenda 2030 i Sverige. Delredovisning av den statistiska uppföljningen, mars 2020
Stjórnarráð Íslands Forsætisráðuneytið (2019). Mælikvarðar um hagsæld og lífsgæði.
The Swedish Government (2020). Cirkulär ekonomi – strategi för omställningen i Sverige
The Swedish Government (2020). Sveriges Miljömål: https://www.sverigesmiljomal.se/
The Swedish Waste Management Association (2014). Avfallsindikatorer Vägledning för hur man kan mäta och följa utvecklingen mot en resurseffektiv avfallshantering
The Swedish Waste Management Association (2019). Klimatpåverkan från olika avfallsfraktioner
SYKE (2017). Circwaste - towards circular economy in Finland: https://www.materiaalitkiertoon.fi/en-US/Circwaste
Trinomic et. al. (2018). Impacts of circular economy policies on the labour market
VINNOVA (2019). Mäta och öka circularitet nationellt i branscher och på företag: https://www.vinnova.se/p/mata-och-oka-cirkularitet-nationellt-i-branscher-och-pa-foretag/
WBCSD (2020). Circular Transition Indicators V1.0
Williander, Mats (2019). Circular public procurement toolbox – managerial guidelines for circular procurements practitioners
Umeå municipality (2019). Climate smart choice for sustainable lifestyles
11. ANNEX A – POINTS OF MEASUREMENT
The following section describes how the points of measurement have been derived, and how they are understood.
Political and societal activities promoting circular economy
Monitoring of political and societal activities promoting circular economy can provide information on whether sufficient input and activities are taken to promote the circular economy across sectors and in all parts of society. The Netherlands have as part of their new monitoring system on circular economy started collecting and categorising information and data on political activities supporting circular economy.
Resource use
The use of primary resources in an economy can be measured in different ways:
- Domestic material input (DMI) measures the combined weight of resources extracted in the country and resources imported and used in production.
- Domestic Material Consumption (DMC) is similar to DMI, but resources from export is deducted. DMC is currently the most widespread indicator on primary resources as it measures the amount of resources used by an economy and is relatively easy to measure. Yet, neither DMI nor DMC include the resources used to extract resources in import and export and thus underestimate the material footprint. Therefore, Eurostat has developed a method to include the resources from the extraction and processing of raw materials, where import and export are converted to raw material equivalents (RME). Raw Material Consumption (RMC) and Raw Material Input (RMI) are similar to DMC and DMI, just with the difference that import and export are measured in RME. As RME is a modelled indicator that is being based on a range of assumption of the amount of materials being used when resources are extracted and processed and thus being a modelled indicator, the statistical uncertainty is higher for RMC and RMI than DMC and DMI[1]Eurostat (2019). Material flow accounts statistics – material footprint.
Footnotes
- ^ Eurostat (2019). Material flow accounts statistics – material footprint
| TABLE A1. INDICATORS ON RESOURCE USE | |||
| Excl. export | Incl. export | Differences | |
| Production | Domestic Material Consumption (DMC): Domestic extraction of resources + Import – Export = DMI – Export | Domestic Material Input (DMI): Domestic extraction of re-sources + Import | DMI includes resources from materials and products that are exported, which DMC deducts. |
| Consumption | Raw Material Consumption (RMC): Domestic extraction of resources + Import (measured in RME) – Export (measured in RME) = DMI – Export (measured in RME) | Raw Material Input (RMI): Do-mestic extraction of resources + Import (measured in RME) | RMI includes resources from materials and products that are exported, which RMC deducts. |
| Differences | In DMC import and export of materials and products are measured in weights, whereas in RMC import and export are measured in Raw Material Equivalent (RME), which also encounter resources used to extract and produce materials and products. | In DMI import of materials and products are measured in weights, whereas in RMI import are measured in Raw Material Equivalent (RME), which also encounter resources used to extract and produce materials and products. | DMC and DMI underestimate the resource use, whereas RMC and RMI gives a more accurate picture. Yet, RMC and RMI are subject to greater uncertainty as RME is modelled on the basis of range of assumptions. |
Economy-wide material flow accounts (EW-MFA) offers a method to map resource flows in the economy in kg tons per year in both solid gaseous and liquid form (except water and air) and regard the pollution emitted to air and water. The method is developed by Eurostat and all member states and EFTA-countries are obliged to report their national EW-MFA. EW-MFA can be presented in a Sankey-diagram where the sizes of the arrows reflect the amount of materials[1]Eurostat (2018). Economy-wide material flow accounts handbook as for EU in 2017 below broke down to four materials: biomass, non-metallic mineral, fossil energy materials/carriers and metal ores[2]Eurostat (2020). Statistics explained – material flows in the circular economy. EW-MFA thus gives a picture of resource use, resource flows and how resource flows cause emissions that can contribute to access the progress towards the circular economy. From MFA, a range of indicators have been deduced among where DMC and DMI are key indicators. By deriving these indicators from MFA, the data is qualified through equalizing input with output in the economy.
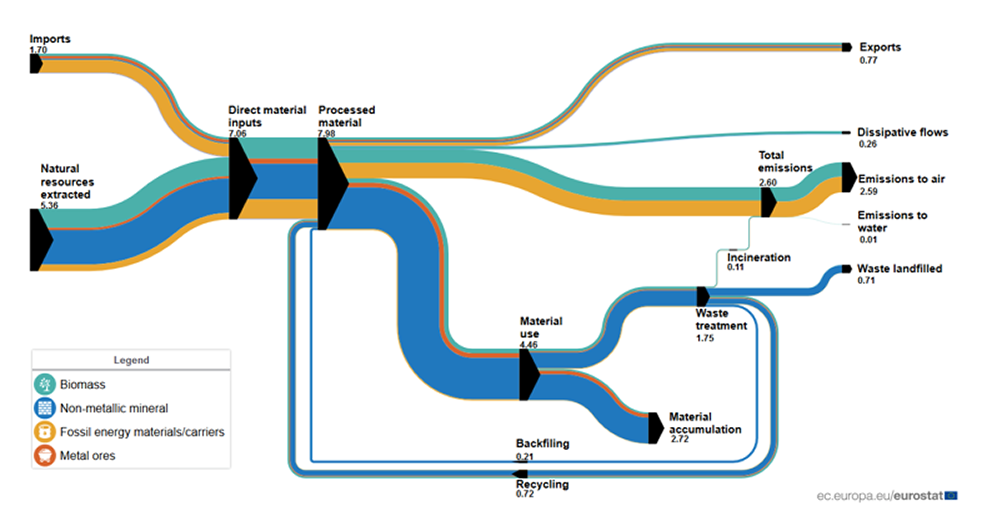
Circular products
Ellen MacArthur Foundation (EMF) understands a circular product as a product or a service that creates no waste and pollution and keeps products in use for years. The higher the strategy is on the circularity ladder, the more circular is a product, and the more circular strategies being applied in the product design, the merrier. The design of products encounters for 80% of the environmental impact of a product. Some of the strategies that can be applied to achieve circular products including:
- Extended lifetime through high quality, reusability and reparability
- Separation of materials that enables repair and reuse of the product or materials
- Less hazardous chemicals, which support recycling and create cleaner products
- Less resources, high resource-productivity and energy-efficiency in operation
- Based on secondary materials or reuse.
EMF has developed “Circulytics” that measures a company’s degree of circularity. EMF expects that Circulytics can be used to generate industry benchmarks, but it requires that many companies apply Circulytics[1]Ellen MacArthur Foundation (EMF) (2020b). Circulytics – method introduction. Circulytics is a survey with questions about organisational factors, input and output that create the basis for an assessment of the level of circularity in the company. Organisational factors, which EMF designates as “enablers”, include: Strategy and planning, innovation, people and skills, systems, processes and infrastructure as well as external engagement. Input is about biological and technical resources used. Output is about how outflow of biological and technical materials are handled, share of products/services designed along circular economy principles[2]Ellen MacArthur Foundation (EMF) (2020c). Circulytics – question indicator list. The questions can inspire to design a survey to estimate the level of circularity in businesses.
Prior to Circulytics, EMF developed the material circularity indicator (MCI), which measures how circular a products are based on its material composition through the entire lifecycle[3]Ellen MacArthur Foundation (EMF) (2020a). Material circularity indicator. MCI is an index calculated based on an index four indicators:
- Input: The amount of virgin resource, reused materials and secondary resources
- Use: Lifetime and intensity of use throughout the lifetime
- Destination after end-use: Share of incineration, recycling and reuse
- Recycling efficiency: How efficient are the recycling in terms of resource- and energy use.
MCI is assuming that secondary resources are in the same quality as virgin resources, which is rarely the case. Moreover, MCI assumes that no materials or value of materials are lost during preparation for reuse and that the weight of the product is not changing from production to disposal.
In EU’s monitoring framework for circular economy, the share of secondary resources in new applications, investments in circular products and patents in the circular sector are included as proxy indicators for circular products/production. In France’s indicator set on circular economy, the number of ecolabels holders, resource productivity and appliance of secondary resources are included. Reuse, design for long life time and design for separation is lacking in EU and France’ indicator-based reporting.
Circular production
Circular production is production with lower environmental footprint including high resource productivity and energy efficiency, few chemicals, low pollution and limited GHG-emission. France include the number of industrial symbiosis as an indicator for circular production. Likewise, resource productivity is the extraction and processing can be an indicator for circular production
Circular consumption
Consumers are key to realise a circular economy. Consumers need to buy less, captured by refuse and reduce in the circularity ladder. To extend the lifetime of products, consumers need to replace products with services, buy high quality products and repair and maintain their products.
Only few proxy indicators are applied in international monitoring systems on circular economy. EU includes green public procurement, but data is not yet collected. Likewise, “green” and “circular” are not the same, though there are commonalities in terms of cleaner products. France includes the frequency of use of sharing cars divided on types of travels and age and households cost on repair and maintenance. Waste amounts are also used as an indicator for consumption levels as both are correlated with GDP. Yet, in a circular economy waste generation (and consumption) should be decoupled from economic growth. Decoupling means that the amount of waste produced should not be defined by the unit of economic activity as it is today.
Reuse
There can be differentiated between direct and indirect reuse. Direct reuse is when a user is passing a product to another user keeping functionality and the value of the product intact. Indirect reuse is when control, cleaning or repairing are carried out before passing the product for reuse. Neither EU, France nor the Netherlands include indicators on reuse, probably because data is not accessible. Measuring reuse is challenging as many transactions are informal and are taking place between friends and family. Yet, the increasing emergence of platforms for transactions of reused products enable data on reuse from online transactions. There is no common method for reporting or measuring reuse. However, article 9(4) of the Waste Framework Directive (WFD) and Article 12(3)(d) of the Packaging and Packaging Waste Directive (PPWD) states that by the 31 March 2019 the European Commission shall adopt implementing acts to establish a common methodology to report and monitor the reuse of products and the reuse of packaging, respectively. Such a common methodology still awaits being launched[4]Oeko-Institut e.V. and PlanMiljø on behalf of EC (2019). Study: Methodology for the reporting of re-use of products and rules for the reporting of reusable packaging.
Recycling
Recycling is to decompose a product and then to recover materials from the decomposed product into new materials or products. Recycling is the most widespread circular strategy when a product is disposed. However, recycling can result in low-quality secondary materials that are not used to substitute virgin materials, but are rather used in low-quality and low-price products. Likewise, the energy use of recycling technologies can be high. Therefore, it is important to access the quality of recycling, which depends on technologies, recycling infrastructure and the type of material. EU includes recycling rates – being the rate of waste collected for recycling – for household waste and different types of packaging waste, market for secondary materials and secondary materials applied in new products. These are not directly informing on the value of the secondary materials. France do not include any indicators for recycling, while the Netherlands include how large share of waste that are being recycled, a value-based recycling index informing the price of recycling and an indicator on how large a share of a product is being recycled – where no data is currently accessible on latter two.
Waste quantities and handling
WFD defines waste as “any substance or object which the holder discards or intends or is required to discard”. Implying that materials being recycled is also considered waste. EU include waste quantities per capita, GDP and DMC, respectively. Likewise, France and the Netherlands include waste quantities measured in weight.
Circular economy impacts
A progress towards a circular economy is expected to result in a range of macro impacts: Ensuring resource security and preservation of resources, reducing carbon emissions, preserving biodiversity and contribution to the creation of economic growth and jobs. The impacts are the driving force for action promoting the circular economy. Yet, impacts are extremely difficult to isolate and are often affected by a range of other factors such as fluctuations in the economy. Likewise, trade-offs can occur across the impacts, e.g. an increase in renewables can increase land use and thus increase pressure on the nature[5]EEA (2016). Circular economy in Europe – developing the knowledge base.
Socioeconomic impacts
In EU monitoring system socioeconomic impacts are included in terms of job creation and growth. A study on impacts of circular economy policies on the labour market estimates that a circular transition will overall contribute to higher employment levels with 700,000 new jobs. Meanwhile a circular economy will also lead to a change in the sectoral composition. Sectors that process and produce raw materials will decline, while recycling and repairing sectors and service sectors will increase. The report further estimates that a circular transition will result in a 0.5% increase in GDP[6]Trinomic et. al. (2018). Impacts of circular economy policies on the labour market. Both EU, France and the Netherlands include job creation, EU and the Netherlands include circular economic growth too.
Resource impacts
As the world population and the global middle class are increasing so is the demand for natural resources – water, food, land and minerals - which are only to be found on the earth to a limited degree. Resource scarcity occurs when demand for natural resource is exceeding the supply. Natural resources are currently being used 50% faster than they can be regenerated in nature[7]EEA (2016). Circular economy in Europe – developing the knowledge base. The annual global consumption of materials is expected to double within the next 40 years. EU is very much depending on other countries for importing critical minerals. With the circular economy, the critical natural resources as well as others materials will be recirculated, circular economy thus addresses resource scarcity by increasing resource productivity and decreasing the use of resources.
Both EU and the Netherlands include resource security to access self-sufficiency of resources. The Netherlands further include water consumption and land use. Water use and land use are further impacting biodiversity.
Environmental- and climate impacts
Extraction and exploitation of natural resources are causing air, water and soil pollution affecting biodiversity and the climate. More specifically, half of the GHG-emission, 90% of biodiversity loss and water stress are due to recourse extraction and processing[8]EC (2020). A new Circular Economy Action Plan For a cleaner and more competitive Europe. EU stipulates to update its framework on monitoring circular economy to include the linkage between circularity and climate change. Likewise, the Netherlands include carbon emission in their monitoring system as they expect circular economy will result in a decrease in GHG emissions. It is well documented that circular economy offers an approach to tackle climate change by offering a path to a low-emission society[9]Ellen MacArthur Foundation (EMF) (2019). Completing the picture: How the circular economy tackles climate change.
Footnotes
- ^ Ellen MacArthur Foundation (EMF) (2020b). Circulytics – method introduction
- ^ Ellen MacArthur Foundation (EMF) (2020c). Circulytics – question indicator list
- ^ Ellen MacArthur Foundation (EMF) (2020a). Material circularity indicator
- ^ Oeko-Institut e.V. and PlanMiljø on behalf of EC (2019). Study: Methodology for the reporting of re-use of products and rules for the reporting of reusable packaging
- ^ EEA (2016). Circular economy in Europe – developing the knowledge base
- ^ Trinomic et. al. (2018). Impacts of circular economy policies on the labour market
- ^ EEA (2016). Circular economy in Europe – developing the knowledge base
- ^ EC (2020). A new Circular Economy Action Plan For a cleaner and more competitive Europe
- ^ Ellen MacArthur Foundation (EMF) (2019). Completing the picture: How the circular economy tackles climate change
12. ANNEX B - LIST OF INFORMANTS
| TABLE A2. LIST OF INFORMANTS | ||
| Country | Organisation | Informant |
| DK | Waste Company, WastePlus (AffaldPlus) | Jens Tue Olsen |
| Danish Business Authority | Karin Clausson Vibholt | |
| Danish Environmental Protection Agency | Niels Henrik Mortensen | |
| Danish Environmental Protection Agency | Ellen Lindholt Nissen | |
| Danish Industry | Iben Kinch Sohn | |
| Danish Waste Association | Mette Godiksen | |
| Københavns municipality | Kathrine Overgaard Warberg | |
| Ministry of Environment and Food | Erik Jessen | |
| Partnership for Circular Municipalities | Jesper Bøttcher | |
| Samsø municipality | Søren Stensgaard | |
| Aalborg municipality | Birgitte Krebs Schleemann | |
| Aalborg University | Heidi Simone Kristensen | |
| Aarhus municipality | Henrik D.H. Muller | |
| Aarhus municipality | Darma Louise Duus | |
| FI | Finnish Environment Institute SYKE | Camilla Sederholm |
| Finnish Environment Institute SYKE | Tiina Karppinen | |
| Ministry of Economic Affairs and Employment | Erja Fagerlund | |
| Ministry of Economic Affairs and Employment | Mika Honkanen | |
| Ministry of Environment | Sarianne Tikkanen | |
| The Finnish Innovation Fund Sitra | Riku Sinervo | |
| Statistics Finland | Johanna Pakarinen | |
| Statistics Finland | Heidi Pirtonen | |
| Statistics Finland | Niko Olsson | |
| Confederation of Finnish Industries | Tuuli Mäkelä | |
| Confederation of Finnish Industries | Matti Kahra | |
| Natural Resources Institute Finland | Juha-Matti Katajajuuri | |
| Finnish Environment Institute | Hanna Eskelinen | |
| Finnish Environment Institute | Teemu Helonheimo | |
| The Association of Finnish Local and Regional Authorities | Miira Riipinen | |
| City of Turku | Risto Veivo | |
| City of Turku | Liisa Lahti | |
| City of Turku | Outi Laikko | |
| IS | Ministry for Environment and Natural Resources | Guðmundur B. Ingvarsson |
| Environment Agency of Iceland | Birgitta Stefánsdóttir | |
| NO | Norwegian Center for Circular Economy | Camilla Brox |
| Innovation Norway | Ann-Mari Skinne | |
| Gry Kolbjørnsen Langback | ||
| Circularity Norway | Cathrine Barth | |
| Norwegian Association of Industries | Gunnar Grini | |
| Avfall Norge | Cecilie Lind | |
| Deloitte Norge | Caroline Hager | |
| SINTEF | Vibeke Stærkebye Nørstebø | |
| Statistical Office in Norway | Peder Næs | |
| Forum for sirkulær plastemballasje | Ellen Behrens | |
| Prosess 21 Expert group circular economy | Kathrine Næss | |
| Eyde-cluster | Gunnar Kulia | |
| Standard Norway | Knut Jonassen | |
| SE | Delegationen för Cirkulär ekonomi | Ylva Norén |
| Swedish Waste Management Association | Jenny Westin | |
| City of Malmö | Emma Börjesson | |
| Eskilstuna municipality | Maria Johansson | |
| Hållbar utveckling Skåne | Helena Nilsson | |
| Klimatkommunerna | Maria Ivansson | |
| Kronoberg Region | Natalie Hafdelin | |
| KTH - Royal Institute of Technology | Emma Lindahl | |
| Ministry of the Environment | Charlotta Broman | |
| Renova AB | Lia Detterfelt | |
| RISE - Research Institute of Sweden | Agnieszka Hunka | |
| Skellefteå municipality | Agneta Lantto- Forsgren | |
| SSAM - Södra Smålands Avfall och Miljö | Anders Lundgren | |
| Statistics Sweden | Louise Sorme | |
| Umeå municipality | Philip Näslund | |
About this publication
Pre-study: Indicators on circular economy in the Nordic countries
Bjørn Bauer, Nina Lander Svendsen, Elvira Borgman, Susanna Sepponen, Päivi Luoma and Ole Jørgen Hansen
ISBN 978-92-893-6896-4 (PDF)
ISBN 978-92-893-6897-1 (ONLINE)
http://dx.doi.org/10.6027/temanord2020-543
TemaNord 2020:543
ISSN 0908-6692
Cover photo: Arthur Osipyan/Unsplashed
© Nordic Council of Ministers 2020
Disclaimer
This publication was funded by the Nordic Council of Ministers. However, the content does not necessarily reflect the Nordic Council of Ministers’ views, opinions, attitudes or recommendations.
Rights and permissions
This work is made available under the Creative Commons Attribution 4.0 International license (CC BY 4.0) https://creativecommons.org/licenses/by/4.0.
Translations: If you translate this work, please include the following disclaimer: This translation was not produced by the Nordic Council of Ministers and should not be construed as official. The Nordic Council of Ministers cannot be held responsible for the translation or any errors in it.
Adaptations: If you adapt this work, please include the following disclaimer along with the attribution: This is an adaptation of an original work by the Nordic Council of Ministers. Responsibility for the views and opinions expressed in the adaptation rests solely with its author(s). The views and opinions in this adaptation have not been approved by the Nordic Council of Ministers.
Third-party content: The Nordic Council of Ministers does not necessarily own every single part of this work. The Nordic Council of Ministers cannot, therefore, guarantee that the reuse of third-party content does not infringe the copyright of the third party. If you wish to reuse any third-party content, you bear the risks associated with any such rights violations. You are responsible for determining whether there is a need to obtain permission for the use of third-party content, and if so, for obtaining the relevant permission from the copyright holder. Examples of third-party content may include, but are not limited to, tables, figures or images.
Photo rights (further permission required for reuse):
Any queries regarding rights and licences should be addressed to:
Nordic Council of Ministers/Publication Unit
Ved Stranden 18
DK-1061 Copenhagen
Denmark
pub@norden.org
Nordic co-operation
Nordic co-operation is one of the world’s most extensive forms of regional collaboration, involving Denmark, Finland, Iceland, Norway, Sweden, and the Faroe Islands, Greenland and Åland.
Nordic co-operation has firm traditions in politics, economics and culture and plays an important role in European and international forums. The Nordic community strives for a strong Nordic Region in a strong Europe.
Nordic co-operation promotes regional interests and values in a global world. The values shared by the Nordic countries help make the region one of the most innovative and competitive in the world.
The Nordic Council of Ministers
Nordens Hus
Ved Stranden 18
DK-1061 Copenhagen
pub@norden.org
Read more Nordic publications on www.norden.org/publications