
MENU
Contents
ACRONYMS AND ABBREVIATIONS
| AC | Adaptation Communication |
| BR | Biennial Reports |
| BTR | Biennial Transparency Report |
| BUR | Biennial Update Report |
| CB | Capacity-building |
| CBIT | Capacity-building Initiative for Transparency |
| CBN | Capacity-building Support Needed |
| CBR | Capacity-building Support Received |
| CCMRV | Caribbean Cooperative MRV Hub |
| CGE | Consultative Group of Experts |
| CH4 | Methane |
| CI | Conservation International |
| COP | Conference of Parties |
| CO2 | Carbon Dioxide |
| CRT | Common Reporting Tables |
| EA | Enabling Activities |
| EEA | European Environment Agency |
| Eionet | European Environment Information and Observation Network |
| ETF | Enhanced Transparency Framework |
| EU | European Union |
| FAO | Food and Agriculture Organization |
| FMCP | Facilitative, Multilateral Consideration of Progress |
| FN | Financial Support Needed |
| FR | Financial Support Received |
| GEF | Global Environment Facility |
| GCP | Global Coordination Platform |
| GGGI | Global Green Growth Institute |
| GHG | Greenhouse Gas |
| GHGMI | Greenhouse Gas Management Institute |
| GSP | Global Support Programme |
| GST | Global Stocktake |
| GWP | Global Warming Potential |
| HFC | Hydrofluorocarbon |
| ICA | International Consultation and Analysis |
| ICAT | Initiative for Climate Action Transparency |
| IPCC | Intergovernmental Panel on Climate Change |
| ISPRA | Italian National Institute for Environmental Protection and Research |
| ITMO | Internationally Transferred Mitigation Outcomes |
| LDC | Least Developing Country |
| LTS | Long-term Strategies |
| LULUCF | Land Use, Land-use Change, and Forestry |
| M&E | Monitoring & Evaluation |
| MMR | Monitoring Mechanism Regulation |
| MPG | Modalities, Procedures and Guidelines |
| MRV | Monitoring, Reporting and Verification |
| NC | National Communication |
| NDC | Nationally Determined Contribution |
| NAP | National Adaptation Plans |
| NF3 | Nitrogen Trifluoride |
| NI | National Inventory |
| NICFI | Norway's International Climate and Forest Initiative |
| NID | National Inventory Document |
| NIR | National Inventory Report |
| N2O | Nitrous Dioxide |
| ODA | Official Development Assistance |
| OECD | Organisation for Economic Co-operation and Development |
| PA | Paris Agreement |
| PATPA | Partnership on Transparency in the Paris Agreement |
| P4G | Partnering for Green Growth and the Global Goals |
| PFC | Perfluorochemical |
| QA/QC | Quality Assurance/Quality Control |
| REDD+ | Reduce emissions from deforestation and forest degradation |
| SF6 | Sulphur Hexafluoride |
| SIDS | Small Island Developing States |
| ST | Support needed and received |
| TDTN | Technology Development and Transfer Support Needed |
| TDTR | Technology Development and Transfer Support Received |
| TER | Technical Expert Review |
| UNDP | United Nations Development Programme |
| UNEP | United Nations Environment Programme |
| UNFCCC | United Nations Framework Convention on Climate Change |
| UNOPS | United Nations Office for Project Services |
| USD | United States Dollars |
| WRI | World Resources Institute |
INTRODUCTION
Developing countries, especially Least Developed Countries (LDCs) and Small Island Developing States (SIDS), often lack the technical capacity, tools and robust institutional frameworks to enable regular reporting on the implementation progress of the Paris Agreement (PA) to the United Nations Framework Convention on Climate Change (UNFCCC). Reporting is crucial for creating both a national and global overview of the state of mitigation efforts, adaptation plans and support needed and received towards enhanced ambition of all Parties’ Nationally Determined Contributions (NDCs) to meet the global goal of staying well below 2 °C of global warming above pre-industrial levels and pursuing efforts to limit temperature increase to 1.5 °C. The Enhanced Transparency Framework (ETF) of the Paris Agreement (PA) is established to build mutual trust and confidence, allow comparability and ensure accountability among Parties, and to promote effective implementation. The framework is designed with built-in flexibility, taking into account developing countries' limited capacities, especially the LDCs and SIDS, who can report at their discretion. Appendix 2 includes a map of where the LDC and SIDS are located, globally.
The Nordic countries have actively worked on strong and ambitious international climate agreements and warmly welcomed the adoption of the Paris Agreement. With the Nordic Declaration on Carbon Neutrality in January 2019, the Nordic Prime Ministers agreed that the Nordic countries would reinforce their climate goals by 2020 and work together to become carbon neutral, while committing to intensifying the focus on climate change in development cooperation. Against this backdrop the Nordic Climate and Air Pollution group (NKL) selected a consortium by UNEP DTU Partnership and NIRAS to implement the project 'Nordic Capacity-Building Support to LDCs and SIDS for the Implementation of the Transparency Framework of the Paris Agreement' from October 2019 to March 2020.
The objectives of the project are to:
- Provide the Nordic countries with an overview of ongoing capacity-building efforts to support developing countries to establish monitoring, reporting and verification (MRV) and national transparency systems to implement the ETF of the PA, especially in the LDCs and SIDS.
- Identify gaps in ongoing capacity-building support initiatives and identify the needs in developing countries, especially LDCs and SIDS, for further capacity-building support by the Nordic countries. The expert support aims to recommend further capacity-building (CB) efforts by the Nordic countries to enhance the capacity of LDCs and SIDS in order to fulfil their reporting requirements under the ETF, either by new initiatives or additional support to ongoing initiatives, on the basis of the overview and in-depth needs and gap analysis of ongoing efforts.
This Final Report addresses both objectives. The report is structured in seven chapters and refers to information and analysis of data presented in seven appendices. Chapter 1 describes the rules, modalities and procedures (MPGs) of the ETF, as they apply to developing countries, especially LDCs and SIDS. Chapter 2 gives an overview of the main international support initiatives for CB to the ETF and types of CB support provided to LDCs and SIDS. Chapter 3 maps where the Nordic countries are financing climate-related ODA projects (LDCs and SIDS). Chapter 4 identifies LDC and SIDS target countries to be considered for further CB support by the Nordic countries, based on a comparison of the findings in Chapters 2 and 3. Chapter 5 presents a synthesis of categories and types of CB gaps and needs by LDCs and SIDS based on a brief overview of literature on the topic, complemented by an analysis of original data on CB self-assessments and requests for support to implement the ETF. Chapter 6 recommends high priority areas and types of CB support to be considered for Nordic support of transparency, based on findings in Chapter 5. Finally, Chapter 7 concludes with recommendations for Nordic support to build capacity for transparency in LDCs and SIDS.
1. REQUIREMENTS OF DEVELOPING COUNTRIES, ESPECIALLY LDCS AND SIDS, TO IMPLEMENT THE ETF OF THE PA
1.1 The Enhanced Transparency Framework of the Paris Agreement
Article 13 of the PA established an ETF for action and support. The ETF is established to build mutual trust and confidence among Parties, allow comparability and ensure accountability, and to promote an effective implementation of the PA (UNFCCC Decision 1/CP.21, 2016). Its purpose is twofold:
- The purpose related to transparency of action is meant to provide a clear understanding of action taken to achieve the global mitigation objectives of the PA, namely to limit global warming at well below 2 °C and pursue efforts to limit warming to 1.5 °C. It includes tracking the progress towards achieving Parties' NDCs, and Parties' adaptation actions, to inform the global stocktake (GST).
- The purpose related to transparency of support is meant to provide clarity on support provided and received by individual Parties in the context of actions to achieve NDCs. It includes adaptation actions, financial support, technology development and transfer, capacity building and, to the extent possible, a full overview of aggregate financial support provided to inform the GST.
By demonstrating that all countries contribute to the implementation of the PA through their NDCs, and that developed countries provide support for action in developing countries, the ETF will ultimately lead to a rise in the ambition to meet the PA and build trust between Parties. An overview of the ETF is provided in Figure 1.
Figure 1: Overview of the ETF of the PA
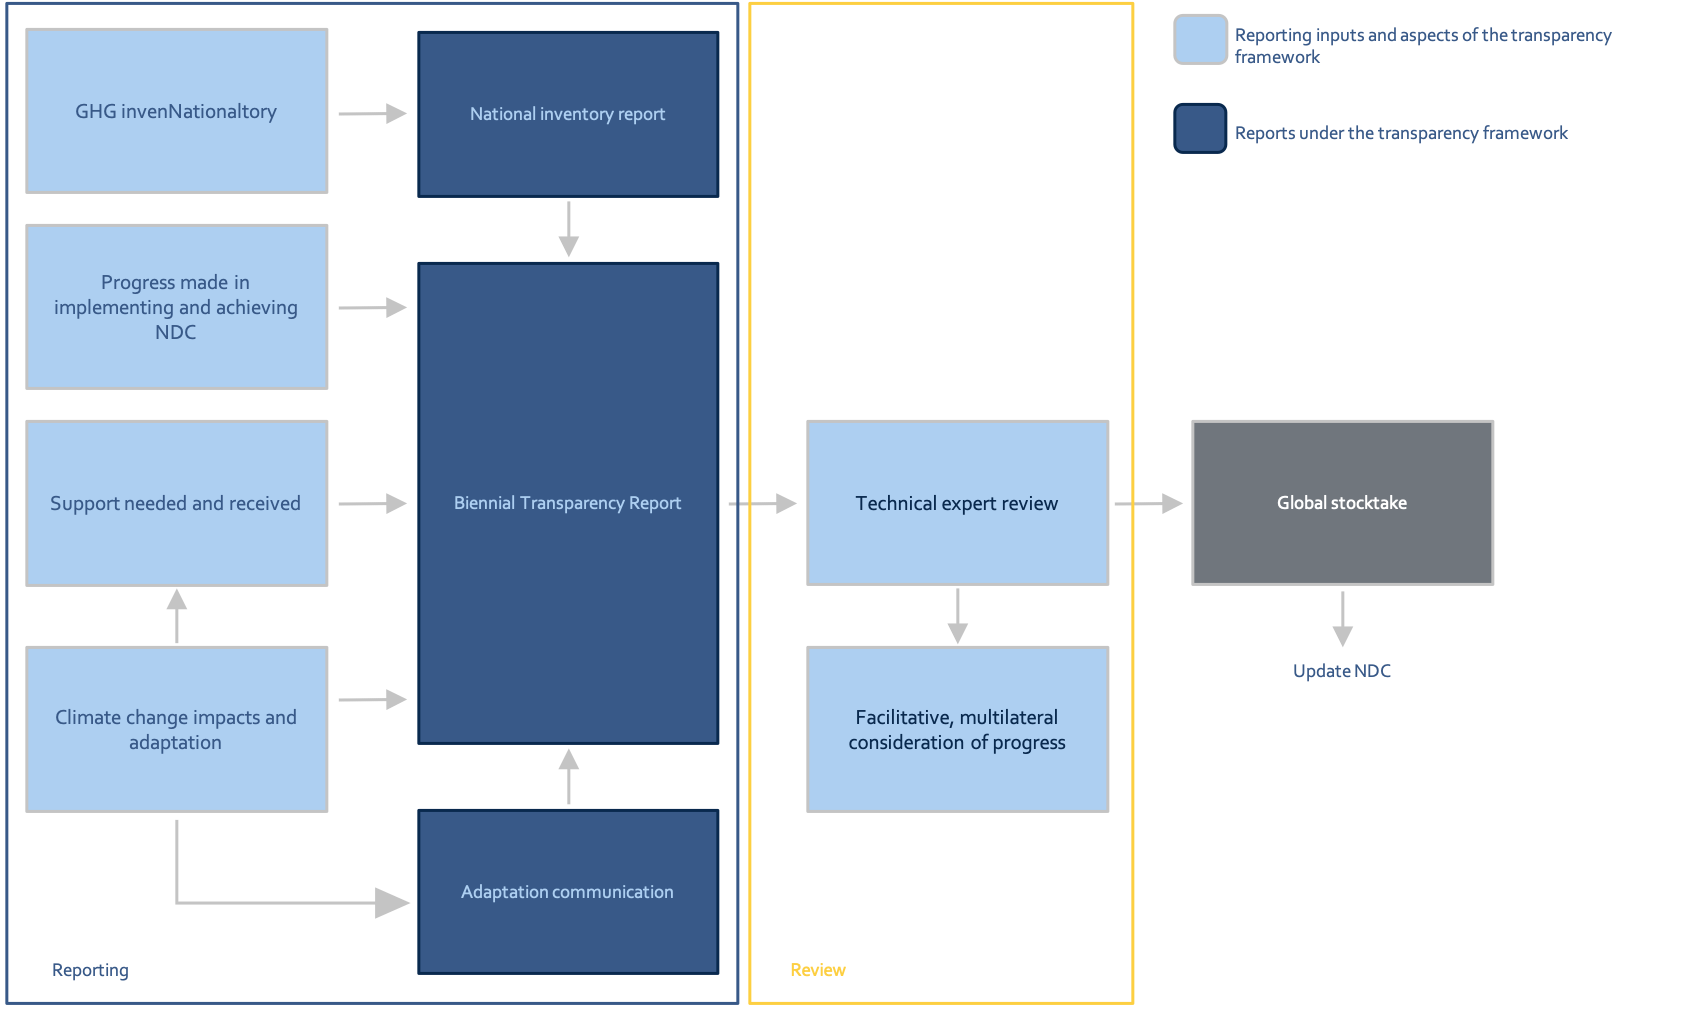
Source: ICAT Introductory Guide, 2019
In December 2018 the Parties adopted the “Katowice Climate Package” at the Conference of Parties (COP) 24 in Katowice, which provides operational details for the PA, including modalities, procedures and guidelines (MPGs) for the ETF. The MPGs describe what information to report, reporting format, timing and processes of the ETF.
The MPGs provide a clear overview of the information to report in the Biennial Transparency Reports (BTR) -- the new reporting instrument under the PA. Countries now have clear guidance on what information to report on the following aspects:
- The National Inventory Report (NIR),
- Information to track progress in implementing and achieving their NDCs,
- Information on climate change impacts and adaptation, and
- Information on support needed and received.
Figure 2, below, illustrates the changes in the process of reporting and reviewing once the ETF enters into force, by 31 December 2024 at the latest.
Figure 2: Timeline for ETF implementation
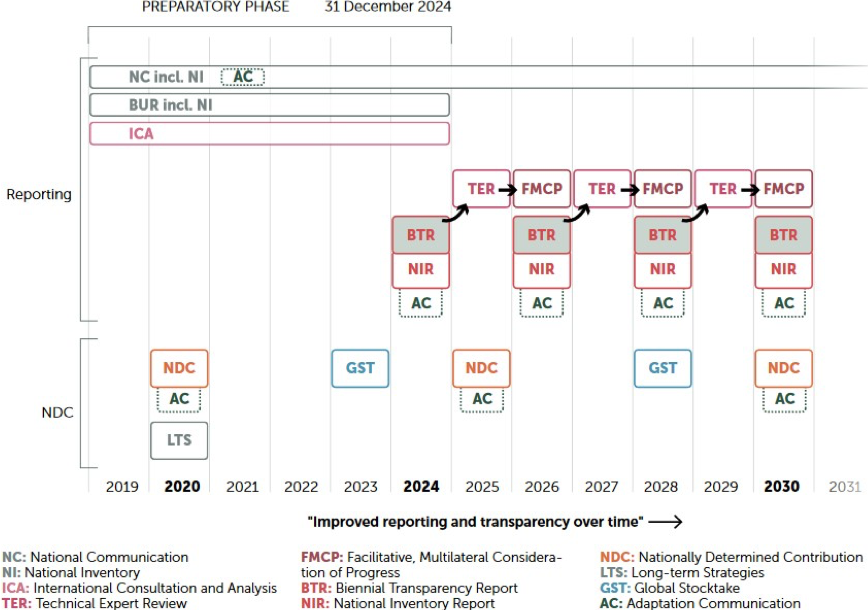
Source: UNEP DTU Partnership, 2019
The NIR is a mandatory deliverable and a component of the BTR, but it can also be submitted as a stand-alone document. The reporting of information on climate change impacts and adaptation, and information on support received is voluntary. Countries can also choose to submit an Adaptation Communication (AC) as part of their BTR, or through other reporting vehicles, such as the NDC, National Communication (NC), or National Adaptation Plan.
Countries are required to submit the NC and Biennial Update Reports (BUR), including NIR, in the period up to 2024 when the ETF enters into force. Submitting BURs will no longer be required once the ETF enters into force. In the period up to 2024, countries will be able to submit their last BUR in a consolidated report with their first BTR, applying the MPGs for the ETF. All countries will continue submitting the NC every four years and will be able to do so in a consolidated report with the BTR, the years they coincide.
The BTR will undergo a Technical Expert Review (TER) process consisting of:
- A review of the consistency of information,
- Consideration of the Party’s implementation and achievement of its NDC,
- Consideration of the Party’s support provided (for developed countries),
- Identification of areas for improvement on transparency, and
- Assistance in identifying capacity-building needs for countries that require it.
The TER will be followed by the Facilitative, Multilateral Consideration of Progress (FMCP) between parties, and will consider:
- Information in the NIR,
- Information to track progress in implementing and achieving the NDC,
- Information on transparency-related support provided to developing countries (for developed countries), and
- Information on support needed and received.
The Global Stocktake (GST) takes place every five years, starting from 2023, in parallel with the process of raising ambition of NDC submissions, which also takes place every five years, starting from 2020. The GST is meant to periodically take stock of the implementation of the PA, assess the collective progress towards achieving the goals of the PA, and, through its outcome, inform Parties' preparation of future NDCs. In addition to the ETF, Parties are also invited, by the end of 2020, to communicate long-term strategies (LTS), defining the countries' mid-century, long-term low greenhouse gas (GHG) emission development strategies.
1.2 Requirements of developing countries, especially LDCs and SIDS, to implement the ETF
For developing countries, including LDCs and SIDS, the MPGs will enter into force with the submission of a Party's last BUR, or by the end of 2024 at the latest. All countries are guided by the same set of MPGs. However, flexibility is provided to those developing country Parties that need it, due to their capacities.
Recognizing the special circumstances, LDCs and SIDS have discretion in terms of submitting their BTR. This allows Parties that need it to provide less information than otherwise required by the MPGs. However, this cannot be applied to all categories of the information requested. When flexibility is allowed, the country will have to explain why and how it has applied flexibility, and to identify the capacity constraints that justified the use of flexibility. Furthermore, the country must report and follow up on the areas where improvement is needed, provide information on progress made and a timeframe showing how the country plans to meet the full requirements. Thus, the flexibility accommodates countries with transparency-related capacity constraints, but also provides a process that allows countries to continuously improve over time, with an expectation that support for ETF implementation will be provided by developed countries.
In addition to the flexibility provision, in some cases the MPGs request information as “should”, “may” or “encouraged to report” formulations. In all cases other than “shall” requirements, information can be omitted without needing to apply the flexibility provision. Appendix 1 provides a list of information to be reported in the BTR, where flexibility can be applied.
For LDCs and SIDS, specifically, reporting information on progress and updates on implementation presents an opportunity to highlight both mitigation and adaptation efforts, while also highlighting challenges and further support needs. This information can serve to attract financial, technology and capacity-building support to overcome the identified challenges, and offers a vehicle for LDCs and SIDS to attract international support to mitigate and adapt to climate change.
The MPGs for the ETF should, therefore, not only be regarded as additional reporting requirements, but also as an opportunity for LDCs and SIDS. Applying the MPGs will allow LDCs and SIDS to strengthen national Monitoring & Evaluation (M&E) processes, thus allowing for enhanced capacities to identify, prioritize, plan, execute and communicate national mitigation and adaptation policies and measures, and communicate the support needed and received for their implementation. In this context, the expected and ongoing support for transparency by the international community and the Nordic countries can have wider, significant impacts beyond improving the information provided to the UNFCCC.
2. TYPES OF CAPACITY-BUILDING ACTIVITIES FOR TRANSPARENCY BY THE MAIN INTERNATIONAL SUPPORT INITIATIVES
2.1 Overview of the main international support initiatives to implement the ETF
Information about the main international support initiatives to developing countries, including LDCs and SIDS, has been sourced from the 'MRV Group of Friends' database[1]The database is not available to the general public, but accessible to the MRV Group of Friends members. of ongoing support initiatives for monitoring, reporting, verification (MRV) and transparency, as well as the websites of the individual initiatives. The Group is informally coordinated by the UNFCCC Secretariat and includes about 14 international institutions and countries, including UNEP DTU Partnership. An overview of the main support initiatives, and the period over which they are implemented, is provided below in Figure 3.
Footnotes
- ^ The database is not available to the general public, but accessible to the MRV Group of Friends members.
Figure 3: Timeline for implementation of the main international support initiatives
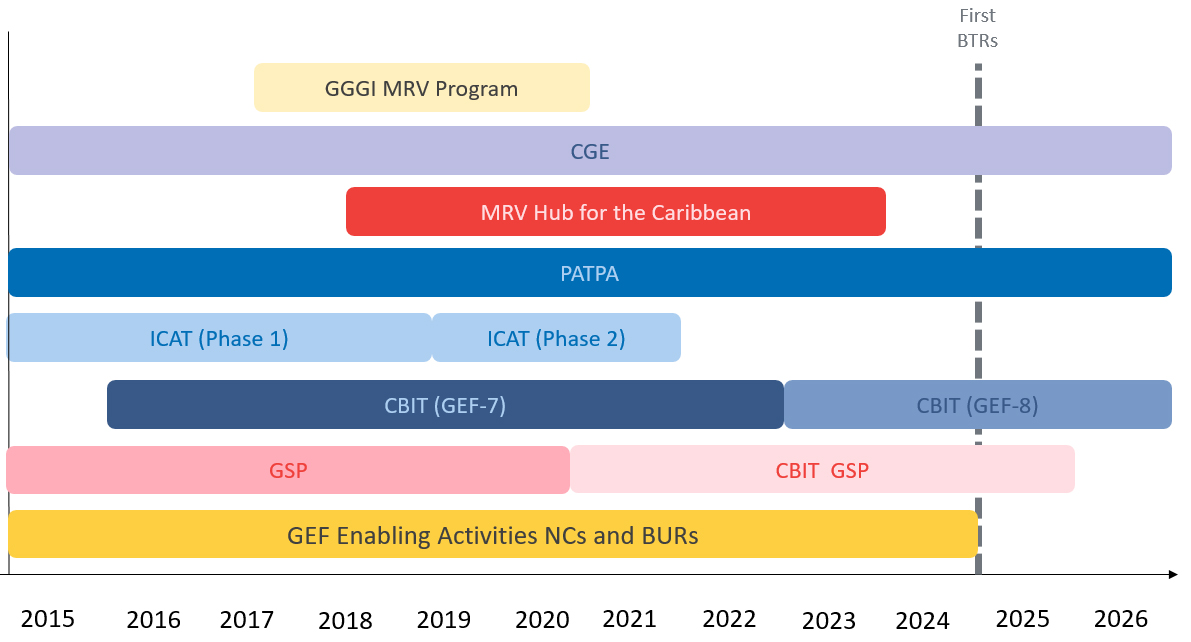
Source: Own analysis based on 'MRV Group of Friends' database and the respective initiatives' own websites, 2019. A description of the initiatives is provided in Table 2
Support provided by the Consultative Group of Experts (CGE) and the Partnership on Transparency in the Paris Agreement (PATPA) is on going and will expand into the future. Other initiatives, such as the MRV Program by the Global Green Growth Institute (GGGI) and the MRV Hub for the Caribbean are time-limited. The Initiative for Climate Action Transparency (ICAT), now in its second phase, will finish in 2021, with potential expansion and continuation. The Enabling Activities for NCs, BURs and BTRs supported by the Global Environment Facility (GEF) will continue also after 2024, as GEF supports all mandatory reporting under the UNFCCC. The size of future funding for the Capacity-building Initiative for Transparency (CBIT) is currently undetermined. The allocation for CBIT under the GEF-7 cycle of USD 55 million is exhausted and has been fully committed to CBIT projects. The Global Support Programme (GSP) for NCs and BURs by the UN Environment Programme (UNEP) and the UN Development Programme (UNDP) will finish in 2020, but will transfer into a new GEF-funded programme and will merge with the CBIT Global Coordination Platform (GCP).[1]The CBIT Global Coordination Platform is a website that hosts all CBIT projects globally. Its aim is to enable coordination among countries and agencies, and facilitate knowledge sharing and peer learning. The platform can be accessed via https://www.cbitplatform.org/ Further information about which LDCs and SIDS are supported by the initiatives is provided in Appendix 2. Analysis of the data in Appendix 2 gives an overview of the number of all support activities (both project-type and workshop-type) to all LDCs and SIDS, which can be seen in Figure 4 below.
Footnotes
- ^ The CBIT Global Coordination Platform is a website that hosts all CBIT projects globally. Its aim is to enable coordination among countries and agencies, and facilitate knowledge sharing and peer learning. The platform can be accessed via https://www.cbitplatform.org/
Figure 4: Number of support activities to all LDCs and SIDS
Source: Own analysis based on 'MRV Group of Friends' database and the respective initiatives' own websites, 2019
Figure 4 shows that all LDCs and SIDS have received at least two support activities from the main initiatives, and most countries have received three support activities. The countries that have received the most support - the 'donor darlings', receiving six support activities each - are Burkina Faso, Cambodia, Cuba, Dominican Republic, Ethiopia and Rwanda.
By ranking the international support initiatives according to the number of countries supported, an overview can be seen of the geographical outreach and size of the initiatives, as shown in Table 1. For ease of reading, workshop-type support initiatives are in bold font, while project-type support initiatives are in italic font.
Table 1: Ranking of international initiatives by number of LDCs/SIDS supported
| Ranking of initiatives | |
| Initiative | Number of countries supported |
| CGE | 78 |
| GEF Enabling Activities | 77 |
| PATPA | 46 |
| UNEP/UNDP Global Support Programme | 40 |
| CBIT | 21 |
| ICAT | 12 |
| MRV Hub for the Caribbean | 12 |
| GGGI MRV program | 7 |
Source: Own analysis based on 'MRV Group of Friends' database and the respective initiatives' own websites, 2019
The CGE and GEF Enabling Activities reach out to almost all LDCs and SIDS with support for implementation of the ETF, focusing on reporting requirements to the UNFCCC, particularly those such as NCs and BURs. PATPA and the GSP are the second largest initiatives, supporting 40–46 countries each, also focusing on reporting requirements to the ETF, particularly NCs and BURs. A common characteristic of the largest initiatives, apart from GEF Enabling Activities, is that the mode of support relies on workshops, training and dialogues, not project support.
A short description of the overall and specific aims of each initiative is provided in Table 2 below.
Table 2: Aim of international support initiatives for MRV and Transparency
| Initiative | Aim |
| Capacity-Building Initiative for Transparency (CBIT) | CBIT was established in 2015 as part of the Paris Agreement with the overall aim to help strengthen the institutional and technical capacities of non-Annex I countries, upon request, in meeting the enhanced transparency requirements of Article 13, both pre-2020 and post-2020. Specifically, CBIT has three aims: - Strengthen national institutions for transparency-related activities in line with national priorities; - Provide relevant tools, training, and assistance for meeting the provisions stipulated in Article 13 of the Agreement; - Assist in the improvement of transparency over time. |
| Initiative for Climate Action Transparency (ICAT) | The aim of ICAT is to strengthen MRV systems in a country- driven manner, particularly with respect to reporting on NDC implementation to foster greater transparency, effectiveness, ambition and trust. ICAT provides a methodological toolbox for impact assessment, capacity building and knowledge sharing to more than 30 developing countries, and covers both mitigation and adaptation. |
| Caribbean Cooperative MRV Hub (CCMRVH) | The Caribbean Cooperative MRV Hub (“MRV Hub”) is a new regional institution designed to support Member Countries in their efforts to improve MRV systems, build Paris Agreement reporting capabilities, and enhance their domestic evidence- based policymaking. |
| UNEP/UNDP Global Support Programme (GSP) | The GSP provides support to non-Annex I Parties in order to prepare NCs and BURs that are submitted to the UNFCCC. Further, the GSP works with key counterparts to provide technical guidance and assistance for the development of the NCs and BURs, as well as in the identification of priority areas of support for the implementation of NDCs. |
| Partnership on Transparency in the Paris Agreement (PATPA) | PATPA promotes practical exchange and political dialogue between countries for enhanced transparency. By bringing together climate experts from a variety of countries, the Partnership aims to strengthen transparency, communication, networking and trust between countries; build capacity and foster a mutual learning process within regions and among practitioners around the globe and identify and disseminate best practices and lessons learned. |
| GEF Enabling Activities | The GEF provides resources to non-Annex I countries to prepare NCs and BURs to comply with Convention obligations in line with COP guidance, including transparency. |
| Global Green Growth Institute (GGGI) MRV Program | GGGI's MRV program aims to support countries in establishing robust MRV systems in line with national development strategies. |
| Consultative Group of Experts (CGE) | The aim of the CGE is to assist developing country Parties to fulfil their reporting requirements under the convention, and the implementation of the ETF of the PA. |
Source: Own analysis by consortium based on consultation with Nordic countries' representatives
Each of the international support initiatives are described in further detail in Appendix 3 with regard to: 1) Funding, i.e. the size of support available to countries; 2) Implementing partners; 3) Participation in the sense of access to international support from a country perspective; 4) A list of all developing countries participating in each initiative -- also non LDCs and SIDS; 5) Results so far and planned future activities (where information is available).
2.2 Types of capacity-building activities for MRV/transparency by the main initiatives
To further describe the types of capacity-building activities provided, the initiatives are described with regard to their mode of work. Overall, two modes of capacity-building support are the most widely used: 1) project-type support and 2) workshop-type support. Project-type support is understood as in-country multi-year support activities that include, among others, comprehensive capacity-building activities, technical support, and the funding of full-time positions in the countries. Project-type support is provided by CBIT, GGGI MRV Program, GEF Enabling Activities and ICAT. Project support range from USD 1.3 million per project implemented over a 1–2 year period by CBIT[1]The average funding of all CBIT projects is USD 1,276,788. The average funding of CBIT projects in LDCs is slightly lower at USD 1,164,807, while the average funding of CBIT projects in SIDS is even lower at USD 1,066,056 (based on own analysis using data from the GEF projects database, as of 20 November 2019)., to smaller projects of about USD 250,000 per project implemented over a 1–3 year period by ICAT. Workshop-type support is understood as the provision of workshops and trainings and the facilitation of dialogue and cooperation. These activities are often 'on-off' or annual activities such as regional workshops provided by PATPA once or twice a year. Workshops/training/dialogues typically reach out to multiple countries per event, such as regional workshops, training events including webinars and sharing of knowledge resources. Workshop-type support is provided by the CGE, GSP, MRV Hub for the Caribbean, and PATPA.
Due to the length and depth of assistance provided through project-type support activities, the technical and institutional capacities built are likely higher than those through annual workshops or trainings. This is especially the case for the support provided by the GEF Enabling Activities, as countries are supported for the preparation of consecutive NCs and BURs over many years. With regard to project support, Figure 5 provides an overview of the number of countries supported by projects.
Footnotes
- ^ The average funding of all CBIT projects is USD 1,276,788. The average funding of CBIT projects in LDCs is slightly lower at USD 1,164,807, while the average funding of CBIT projects in SIDS is even lower at USD 1,066,056 (based on own analysis using data from the GEF projects database, as of 20 November 2019).
Figure 5: Overview of the number of countries supported by projects
Source: Own analysis based on 'MRV Group of Friends' database and the respective initiatives' own websites, 2019
As Figure 5 shows, 1 country is supported by 4 projects (Ethiopia), 6 countries are supported by 3 projects, 25 countries are supported by 2 projects, 45 countries are supported by 1 project and 1 country is not supported (Singapore). Countries supported by 1 project have received support from the GEF Enabling Activities. Appendix 2 provides further information on which countries receive how much support from which initiatives.
A ranking of which LDCs and SIDS receive the most and least support through projects is shown in Table 3.
Table 3: Ranking of LDCs/SIDS receiving most support through projects
| Country | Projects |
| Ethiopia | 4 |
| Burkina Faso | 3 |
| Cambodia | 3 |
| Cuba | 3 |
| Dominican Republic | 3 |
| Rwanda | 3 |
| Uganda | 3 |
Source: Own analysis based on 'MRV Group of Friends' database and the respective initiatives' own websites, 2019
Ethiopia receives support from four projects, while Burkina Faso, Cambodia, Cuba, Dominican Republic, Rwanda and Uganda receive support from three projects for capacity building to implement the ETF. The remaining 70 LDCs and SIDS receive support from one or two projects. Appendix 2 provides further detail on which international initiatives support which countries.
With regard to the mode of support through workshops/training/dialogues, Figure 6 shows the number of countries supported by the initiatives CGE, GSP, PATPA and the MRV Hub for the Caribbean.
Figure 6: Number of countries supported with workshops/training/dialogues
Source: Own analysis based on 'MRV Group of Friends' database and the respective initiatives' own websites, 2019
Figure 7 shows the number of workshop-type support activities provided to LDCs and SIDS (both as one group, blue in colour, and as separate groups, orange and grey). The figure shows that most countries have received two or three workshop-type support activities, and only eight countries have received just one workshop activity (Afghanistan, Bahrain, Cook Islands, Mauritania, South Sudan, Suriname, Yemen). All countries have received at least one workshop-type support activity, leaving no country without support. Further details on which countries have received how much support is provided in Appendix 2.
Figure 7: Number of workshop/training/dialogue activities provided to LDCs/SIDS
Source: Own analysis based on 'MRV Group of Friends' database and the respective initiatives' own websites, 2019
3. WHERE THE NORDIC COUNTRIES FINANCE ODA IN LDCS AND SIDS, RELEVANT TO CLIMATE ACTIVITIES AND THE ETF
This chapter presents an analysis of LDCs and SIDS where the Nordic countries have recently or are currently financing climate change-related ODA work or political supported initiatives. The focus is on all climate change-related aid work provided by the Nordic countries, as transparency- related support provided up to now is minor and would not provide a conclusive analysis.
Specifically, this overview is aimed at the identification of LDCs and SIDS with established relationships with the Nordic countries. It is assumed that an active and strong presence by Nordic ODA support indicates a prioritization of LDCs and SIDS for Nordic countries, and that established working relations imply existing systems, which are able to provide further capacity-building support for transparency.
The following section identifies global and regional initiatives supporting LDCs and SIDS, where the Nordic countries are active. These initiatives can be used as vehicles to support thematic transparency-related capacity-building support.
3.1 Overview of global and regional initiatives supported by the Nordic countries
The Nordic countries are deeply involved in global and regional initiatives. The nature of these initiatives is diverse and covers, for example, research, training, promotion, political support and implementation of MRV of the PA. Below is a presentation of initiatives that could be relevant for implementation of the ETF. A takeaway point from Table 4 is that if a program already covers climate change training, it could integrate the ETF as a component, if relevant.
The overview in Table 4 is not exhaustive, and is based on information provided by the Nordic countries on relevant global and regional initiatives. It lists some of the most important initiatives potentially relevant to ETF activities. All the initiatives cover at least one LDC or SIDS. The overview also includes a short description, ideas for ETF action, and a link to the homepage for further information.
Table 4: Overview and description of initiatives
| Initiatives |
| 2050 Pathways Platform Description: The platform is a multi-stakeholder initiative launched at COP22 by High- Level Climate Champions Laurence Tubiana and Hakima El Haite to support countries seeking to develop long-term, net zero GHG, climate-resilient and sustainable development pathways. ETF: Although not directly related to the ETF, the creation of emission scenarios is a central aspect of transparency and something that could contribute to the enhancement of countries' NDC scenarios and targets. Link: 2050 Pathways Platform |
| Biofuture Platform Description: This initiative aims to be an action-oriented, country-led, multi-stakeholder mechanism for policy dialogue and collaboration among leading countries, organizations, academia and the private sector. It is conscious of the need to accelerate development and scale up deployment of modern, sustainable low-carbon alternatives to fossil-based solutions in transport, chemicals, plastics and other sectors. ETF: Although not directly related to the ETF, use of biofuels in the transport sector is complex and often transboundary. Therefore, it can be an advantage to look at the ETF through this initiative. Link: Biofuture Platform |
| Clean Cooking Alliance Description: The Clean Cooking Alliance works with a global network of partners to build an inclusive industry that makes clean cooking accessible to the three billion people who live without it. ETF: Although not directly related to the ETF, clean cooking has been a priority for most LDCs and SIDS, and the initiative has the potential to spread the ETF in a cost-effective way to many countries with the same circumstances. Link: Clean Cooking Alliance |
| Danish Energy Partnership Programme Description: The Danish Energy Agency cooperates with several governments in order to contribute to their reduction of carbon emissions and assist in their energy transition to becoming a low-carbon economy. In Ethiopia the focus is the wind sector. ETF: Although not directly related to the ETF, it is possible to link the wind sector initiative with an ETF effort in the renewable energy sector. Link: Danish Energy Partnership Programme (DEPP) |
| Global Alliance for Buildings and Construction (ABC) Description: The Global ABC’s key goals include raising ambitions to meet the Paris climate goals. While the sector is a major emitter, it also holds huge potential for improvement. Work is being put into raising the level of ambition in retrofitting existing buildings and future-proofing the investments that will go into new buildings over the next 15 years. At COP25 the initiative also focused on the aspects of NDC. EFT: The mix between the public and private sectors in this initiative could be a strong vehicle for ETF activities. Link: Global Alliance for Buildings and Construction |
| Norway's International Climate and Forest Initiative Description: Norway's International Climate and Forest Initiative (NICFI) aims at supporting efforts to reduce greenhouse gas emissions from deforestation and forest degradation in developing countries (REDD+). ETF: Monitoring is a key element in REDD+ and, therefore, could be an effective way to enhance ETF through this initiative. Link: Norway's International Climate and Forest Initiative |
| P4G - Partnering for Green Growth and the Global Goals 2030 Description: P4G – Partnering for Green Growth and the Global Goals 2030 – is a new initiative, commenced in 2018, with the ambition of becoming the world’s leading forum for developing concrete public-private partnerships at scale to deliver on the SDGs and the Paris Climate Agreement. ETF: P4G is supporting specific large projects and should be explored to determine whether the ETF could be an integrated part of each approved project, for instance in Ethiopia. Link: P4G -Partnering for Green Growth and the Global Goals 2030 |
| Strengthened institutions for a sustainable climate – A global capacity building programme Description: The Swedish Environmental Protection Agency has, in close collaboration with several Swedish agencies as well as national and international organisations, developed a capacity-building programme addressing the challenges of climate change and unsustainable urbanisation. The programme is funded by SIDA and will run for an initial 4-year period (2019 – 2022). ETF: The programme will support the development of robust transparency systems (MRV) under the Paris Agreement, and processes for inclusive and sustainable urban planning. The ETF should be an integrated part of the MRV system, and therefore explore whether all aspects of the ETF are integrated. Link: Strengthened institutions for a sustainable climate – A global capacity building programme. |
| The “4 per 1000” Initiative Description: The aim of the initiative is to demonstrate that agriculture, and in particular agricultural soils, can play a crucial role where food security and climate change are concerned. ETF: The initiative could be a vehicle for transparency-related capacity building in the Agriculture sector. Link: The “4 per 1000” Initiative |
| The advanced international training programme Climate Change - Mitigation and Adaptation Description: The programme is designed for decision makers in developing countries who hold positions in their home organisation with a mandate to initiate change on the local to national level. ETF: It is recommended to explore whether the ETF can be part of the training programme, as it could be cost-effective. Link: The advanced international training programme Climate Change |
| The Global Research Alliance on Agricultural Greenhouse Gases Description: The Global Research Alliance is focused on research, development and extension of technologies and practices that help deliver ways to grow more food (and more climate-resilient food systems) without increasing greenhouse gas emissions. As part of the initiative, potential mitigation research is done. ETF: Although not directly related to the ETF, the research can be a useful input when setting up the ETF. Link: The Global Research Alliance on Agricultural Greenhouse Gases |
Source: Own analysis based on consultation with Nordic countries' representatives, and the respective initiatives' own websites, 2019
Global and regional initiatives can be a platform for developing ETF activities in a cost- effective manner, as they cover multiple countries and more stakeholders for the same activities. The initiatives have the potential for a smooth transfer of knowledge between countries, including the LDCs and SIDS in the above-mentioned initiatives. For example, the “Global Alliance for Buildings and Construction” initiative can potentially prepare MRV tools and guidelines for the building sector. The tools and guidelines should be prepared so the private sector, such as equipment suppliers and contractors, could use them when implementing solutions in the countries and also as an integrated part of the training and marketing they are performing. Using the initiative promotes the developed material easier, which can be used by more stakeholders under the initiative, potentially resulting in a very high outreach. The initiative, if supported with expertise in the ETF, can also contribute to the detailed set-up and operation of the ETF in a country and the practical implementation of the MPGs. If it is done through one of the above-noted initiatives it can be smoothly transferred and implemented in the selected LDCs and SIDS.
An overview of the Nordic countries’ support to these initiatives is provided in Table 5. For each initiative, the participating LDCs and SIDS and the Nordic countries supporting the initiative are indicated. The notion of 'support' covers both political and financial support.
Table 5: Overview of global and regional initiatives supported by the Nordic countries
| Initiative | LDCS/SIDS participating | Denmark | Norway | Sweden | Finland | Iceland |
| 2050 Pathways Platform | Ethiopia, Fiji and Marshall Island | X | X | X | X | |
| Biofuture Platform | Mozambique | X | X | X | ||
| Clean Cooking Alliance | Bangladesh, Uganda Partner countries: Afghanistan, Burkina Faso, Cambodia, Central Africa Republic, DR Congo, Ethiopia, Lao, Lesotho, Liberia, Malawi, Myanmar, Nepal, Niger, Rwanda, Sudan, Tanzania, Togo and Uganda | X | X | X | X | |
| Danish Energy Partnership Programme | Ethiopia | X | ||||
| Global Alliance for Buildings and Construction | Djibouti, Senegal | X | X | X | ||
| Norway's International Climate and Forest Initiative | Guyana, Ethiopia, Liberia, Tanzania and DR Congo | X | ||||
| P4G - Partnering for Green Growth and the Global Goals 2030 | Ethiopia | X | ||||
| Strengthened institutions for a sustainable climate – A global capacity-building programme | Ethiopia, Mozambique and Uganda | X | ||||
| The “4 per 1000” Initiative | Cambodia, Senegal | X | X | X | ||
| The advanced international training program Climate Change - Mitigation and Adaptation | Mozambique and Zambia | X | ||||
| The Global Research Alliance on Agricultural Greenhouse Gases | DR Congo, Dominican Republic, Ethiopia, Malawi, Senegal and Uganda | X | X | X | X | |
| Total initiatives | 6 | 5 | 8 | 6 | 1 |
Source: Own analysis based on consultation with Nordic countries' representatives, and the respective initiatives' own websites, 2019
Most initiatives cover several LDCs/SIDS, while a few cover only one LDC. Ethiopia is a high priority country and is involved in most initiatives. Ethiopia, Mozambique, Uganda and DR Congo are members and/or partner countries in at least three of the initiatives, each.
3.2 Overview of bilateral initiatives to LDCs and SIDS supported by the Nordic countries
The overview of bilateral initiatives to LDCs and SIDS focuses exclusively on public climate financing. This section aims to identify countries where the Nordic countries have established strong working relations, indicating that the LDCs and SIDS in question are priority countries with systems in place that can absorb capacity-building support. It is assumed that there is a higher probability of effective implementation of capacity-building support due to existing contacts, ongoing work and co-operation.
Sources of data for the analysis come from three sources:
- OECD development finance statistics capture an integrated picture of both bilateral and multilateral climate-related external development finance. Both adaptation and mitigation projects are covered as part of the climate-related activities.[1]http://www.oecd.org/dac/financing-sustainable-development/development-finance-topics/climate-change.htm
- Under the UNFCCC Annex I Parties are requested to submit their BURs to the secretariat every two years. The third BUR (BUR3) should have been submitted to the secretariat by 1 January 2018.
- The European Environment Information and Observation Network (Eionet) is a partnership network of the European Environment Agency (EEA) and its 39 member and cooperating countries. The countries have an obligation to report to the EU and GHG Monitoring Mechanism Regulation (MMR). The MMR has now been substituted by Governance of the Energy Union and Climate Action and the first report will be in 2021.
Data from the three sources is overlapping, as they report the same activities. ODA is an important part of the OECD reporting and is therefore used to make an overview of the projects covering climate financing for LDCs and SIDS, covering the period 2012–2017.
Table 6, below, presents all the LDCs and SIDS that Nordic countries have provided climate-related ODA support to.[2]Climate-Related ODA, as defined for OECD DAC Rio Markers, Nordic countries' own reporting. Appendix 5 provides a more detailed breakdown of the support, which shows how many climate-related projects each Nordic country has in each LDC and SIDS.
Footnotes
- ^ http://www.oecd.org/dac/financing-sustainable-development/development-finance-topics/climate-change.htm
- ^ Climate-Related ODA, as defined for OECD DAC Rio Markers, Nordic countries' own reporting.
Table 6: List of LDCs and SIDS countries supported by Nordic countries with climate-related ODA
| LDCs and SIDS countries supported by more than 100 Nordic climate-related projects |
| Ethiopia (212 projects), Mozambique (107 projects), Nepal (152 projects), Tanzania (213 projects), Uganda (181 projects) |
| LDCs and SIDS countries supported from 11 to 100 Nordic climate-related projects |
| Afghanistan (38 projects), Angola (22 projects), Bangladesh (98 projects), Bhutan (34 projects), Burkina Faso (23 projects), Burundi (28 projects), Cambodia (56 projects), Democratic Republic of the Congo (81 projects), Guyana (20 projects), Haiti (31 projects), Lao (17 projects), Liberia (20 projects), Madagascar (39 projects), Malawi (99 projects), Mali (78 projects), Myanmar (73 projects), Niger (25 projects), Papua New Guinea (11 projects), Rwanda (20 projects), Somalia (58 projects), South Sudan (18 projects), Sudan (17 projects), Togo (19 projects), Zambia (90 projects) |
| LDCs and SIDS countries supported from 1 to 10 Nordic climate-related projects |
| Belize (1 project), Benin (6 projects), Central African Republic (4 projects), Chad (6 projects), Cuba (4 projects), Djibouti (6 projects), Fiji (3 projects), Gambia (6 projects), Guinea (2 projects), Guinea-Bissau (5 projects), Lesotho (4 projects), Maldives (2 projects), Mauritania (6 projects), Mauritius (1 project), Senegal (10 projects), Sierra Leone (5 projects), Solomon Islands (1 project), Timor-Leste (1 project), Tuvalu (2 projects), Yemen (4 projects) |
| LDCs and SIDS countries not supported through Nordic climate-related projects |
| Antigua and Barbuda, Bahamas, Bahrain, Barbados, Cabo Verde, Comoros, Cook Islands, Dominica, Dominican Republic, Eritrea, Grenada, Jamaica, Kiribati, Marshall Islands, Micronesia, Nauru, Niue, Palau, São Tomé and Principe, Saint Kitts and Nevis, Saint Lucia, Saint Vincent and the Grenadines, Samoa, Seychelles, Singapore, Suriname, Tonga, Trinidad and Tobago, Vanuatu |
Source: Own analysis based on consultation with Nordic countries' representatives
Table 6 shows that 5 LDCs and SIDS (green colour) have been supported by more than 100 climate-related projects from the Nordic countries; 24 LDCs and SIDS have benefitted from support from 11 to 100 climate-related projects (blue colour) and 20 LDCs and SIDS has been supported from 1 to 10 climate-related projects (yellow colour). Lastly, 29 LDCs and SIDS have not received climate-related support (red).
Looking through the list of 1,959 projects reported to the OECD, very limited attention has been given to the ETF. The main international support initiatives to the ETF are presented in Chapter 2 of this report. Figure 8 provides an overview to further identify which LDCs and SIDS are supported the most by Nordic countries and projects.
Figure 8: LDCs and SIDS countries supported by Nordic ODA projects
Source: Own analysis based on OECD DAC reported information by the Nordic countries between 2012 and 2017
The analysis identifies the LDCs and SIDS that have received the most climate-relevant ODA finance from Nordic countries, as follows:
- 5 Nordic countries are all supporting 5 LDCs and SIDS (Ethiopia, Mali, Mozambique, Somalia and Uganda), with a total of 636 climate-related projects;
- 4 of the Nordic countries are supporting 6 LDCs and SIDS (Afghanistan, Bangladesh, Malawi, Myanmar, Nepal and Tanzania), with a total of 673 climate-related projects;
- 3 of the Nordic countries are supporting 14 LDCs and SIDS (Angola, Bhutan, Burkina Faso, Burundi, Cambodia, Haiti, Liberia, Madagascar, Niger, Senegal, South Sudan, Sudan, Togo and Zambia), with a total of 432 climate-related projects;
- 2 of the Nordic countries are supporting 7 LDCs and SIDS (Benin, DR Congo, Lao, Lesotho, Mauritania, Papua New Guinea and Rwanda), with a total of 145 climate-related projects;
- 1 Nordic country is supporting 17 LDCs and SIDS (Belize, Central African Republic, Chad, Cuba, Djibouti, Fiji, Gambia, Guinea, Guinea-Bissau, Guyana, Maldives, Mauritius, Sierra Leone, Solomon Islands, Timor-Leste, Tuvalu and Yemen), with a total of 73 climate-related projects.
In summary, the Nordic countries have prioritised few and nearly the same countries for climate-related support. A detailed breakdown of number of projects in each LDC/SIDS country for each of the five Nordic countries is presented in Annex 5.
4. LDCS AND SIDS TARGET COUNTRIES FOR NORDIC CB SUPPORT TO TRANSPARENCY
This chapter builds on the findings of Chapters 2 and 3 to identify potential target countries (LDCs and SIDS) for Nordic CB support to transparency, based on a set of explicit criteria. Country identification also served to reach out to target countries to schedule interviews during COP25 in Madrid, to inform the analysis of gaps and provide recommendations for Nordic transparency-related capacity-building efforts.
4.1 Ranking of LDCs and SIDS according to international project support and Nordic support received
To start narrowing down potential target countries for Nordic CB support, the LDCs and SIDS where the Nordic countries have been most active through climate change-related ODA projects (Table 6) and where the least support for transparency is provided by the international initiatives (Table 23, in Appendix 2) are selected. This combination of criteria enables the identification of countries that are both under-served, in terms of transparency support, and have well-established working relations with the Nordic countries. The data, which enables a comparison of support to LDCs/SIDS by Nordic countries with CB support provided by international initiatives, is presented in Appendix 4.
Results of the analysis are presented in the following figures. The figures rank LDCs and SIDS that have received the least support from international CB initiatives for transparency, according to the number of support projects from Nordic countries. All LDCs and SIDS listed have received support from GEF Enabling activities. Figure 9 ranks the countries that have received the least transparency-related support (only one project-type support[1]Note that support from international initiatives to workshops/training/dialogue is not included in the analysis of CB needs by LDCs and SIDS countries. The workshop-type support typically targets multiple countries to attend regional or global events. As this modality of CB support is not tailored to country specific needs but rather focuses on generic, ETF technical issues and knowledge sharing among many countries, it is not included in this analysis.). Figure 10 ranks the countries that have received two transparency-related project-type support activities, while Figure 11 ranks the countries that have received three (one country has received four) transparency project-type support projects. Countries with no Nordic support are excluded from the figures. The countries colour coded 'orange' in the figures represent those with less than 10 Nordic support provisions, while countries coloured 'green' have received more than 10 support provisions.
Footnotes
- ^ Note that support from international initiatives to workshops/training/dialogue is not included in the analysis of CB needs by LDCs and SIDS countries. The workshop-type support typically targets multiple countries to attend regional or global events. As this modality of CB support is not tailored to country specific needs but rather focuses on generic, ETF technical issues and knowledge sharing among many countries, it is not included in this analysis.
Figure 9: Ranking of LDCs and SIDS with least transparency support by number of Nordic support projects
Source: Own analysis based on 'MRV Group of Friends' database 2019 and the OECD DAC reported information by the Nordic countries between 2012 and 2017.
If the Nordic countries are aiming to target support to LDCs and SIDS with a strong history of Nordic country presence, but with a poor presence of transparency-related activities, then countries with green colour coding in Figure 9 should be prioritised, followed by the green ones in Figures 10 and 11.
Figure 10: Ranking of LDCs and SIDS with medium transparency support by number of Nordic support projects
Source: Own analysis based on 'MRV Group of Friends' database 2019 and the OECD DAC reported information by the Nordic countries between 2012 and 2017
Figure 11: Ranking of LDCs and SIDS with most transparency support by number of Nordic support projects
Source: Own analysis based on 'MRV Group of Friends' database 2019 and the OECD DAC reported information by the Nordic countries between 2012 and 2017
The fading of the colour of the green and orange bars over the three graphs illustrates an increasing number of project-type support received by international transparency initiatives. This represents the declining prioritization of potential countries for further CB support by Nordic countries. Ethiopia, the only country receiving four transparency project-type support, has the faintest colour coding.
Assuming that the Nordic countries intend to further support countries with established relationships and prioritize LDCs and SIDS, which have received the least or medium support from international support initiatives (one or two projects only, see Figures 9 and 10), a shortlist for Nordic CB support to transparency is suggested as follows:
- LDCs and SIDS with the least capacity for transparency and Nordic ODA support: Nepal, Zambia, Democratic Republic of Congo, Mali, Somalia, Bhutan, Burundi, Niger, Angola, Guyana, South Sudan (Figure 9).
- LDCs and SIDS with medium capacity for transparency and Nordic ODA support: Tanzania, Mozambique, Malawi, Bangladesh, Myanmar, Madagascar, Afghanistan, Haiti, Liberia, Togo, Lao PDR, Sudan, Papua New Guinea (Figure 10).
4.2 Examples of country-specific challenges and needs
The following section includes identified transparency needs and gaps from the countries selected according to criteria presented in Annex 7. The information is sourced from a review of the latest NCs and interviews during COP25 in Madrid. Remote interviews have been attempted with the two countries that were not reached during COP, however they did not respond after COP either and are therefore left out. The information included in the NCs predates the ETF and MPG, and tends to be focused on the needs related to GHG inventories, while the interviews provide more insights on the broader aspects of transparency support needed.
The interviews were designed to capture the following information:
- Key priorities – and the gaps to meet these – for MRV/transparency in relation to the ETF requirements;
- Key challenges to meet the ETF requirements;
- Type of CB support most needed to implement the ETF;
- Mode of CB support deemed as most effective;
- Preference of partners with which to build capacity for implementing the ETF;
- Other information or issues regarding the CB needs to implement the ETF.
NEPAL:
Nepal's NDC lists the following mitigation targets:
- 80% RE penetration by 2050;
- Reduced dependency on fossil fuels by 50%, by 2050;
- 20% RE expansion by 2020, compared to 2010;
- 20% share of electric vehicles (EV) by 2020, compared to 2010;
- Electrical (hydro-powered) rail network by 2040;
- Maintain 40% of the total area of the country under forest cover;
- REDD+ to reduce about 14 million tCO2-eq by 2020.
For adaptation, Nepal presents the following priorities:
- Building Climate Resilience of Watersheds in Mountain Eco-regions;
- Building Resilience to Climate Related Hazards;
- Mainstreaming Climate Change Risk Management in Development;
- Building Climate Resilient Communities through Private Sector Participation.
The country has submitted two NCs (the latest in 2014) and no BURs, although the first BUR and the third NC are in the making, but not ready to be submitted yet. Nepal has only received one transparency-related support project -- GEF Global Support Programme. Per capita emissions in 2010 are estimated at 1.3 tCO2eq/cap, with an estimated 11% reduction in per capita emissions by 2030, based on its NDC ambition (Paris Equity Check, 2020). There are 152 registered Nordic country support initiatives between 2012–2017 OECD DAC reporting.
Nepal states that the lack of quality data and absence of country-specific emission factors for the various emission-related activities are the main restraining factors to developing detailed and precise GHG inventories. For example, Nepal's unique type of traditional agriculture is not reflected in IPCC methodologies, and there is no suitable emission factor developed that could be applied.
During COP25, an interview was conducted with the National Focal Point for Climate Change and Chief of the Climate Change Management Division. The Focal point explained that the country is just at the beginning of establishing MRV/transparency systems for the three tiers of government: federal, provincial, and local. One main challenge will lie in collecting data for all tiers in a coordinated manner. The new climate policy has identified several core areas for climate reporting -- including gender, research and technology, finance. These are cross-cutting areas, which require review and access to the necessary information to make the society climate-resilient. As climate resilience is a priority, adaptation communication is also a priority for Nepal. Another priority is research targeting the younger generation, which promotes development of skills for CC and transparency. In terms of preferred modes of support, longer-term projects are most helpful to building capacities. It is necessary to first identify the needs at the local level and for the communities, although workshops and research can also be helpful. In terms of preferred partners for support delivery, inputs from universities and collaboration with private sector are highlighted. All collaborations should be coordinated by the government to work with various partners by setting up a Committee for partnerships and collaborations, including universities, civil society, etc.
The following list specifies gaps and barriers identified through interviews held during COP25:
- Lack of research and baseline information for forestry and land-use for the third NC;
- Limited information available for the industrial sector;
- Fragmented skills and data in various institutions;
- CB for elected bodies at various levels needed to enhance transparency at multiple levels of government;
- Need to customize the IPCC 2006 Guideline to the Nepal context.
ZAMBIA:
Zambia's NDC presents an unconditional target (with limited international support) of 25% emission reductions compared to BAU, equivalent to 20,000 Gg CO2eq. The conditional target is 47% emission reductions compared to BAU, equivalent to 38,000 Gg CO2eq. Focus sectors on mitigation are Sustainable Forest Management, Sustainable Agriculture, Renewable Energy and Energy Efficiency. Adaptation priorities are in strategic productive systems agriculture, wildlife and water. Zambia has only received one transparency-related support project -- GEF Global Support Programme. Per capita emissions in 2010 are estimated at 2.3 tCO2eq/cap, with an estimated 8% reduction in per capita emissions by 2030, based on its NDC ambition (Paris Equity Check, 2020). There are 90 registered Nordic country support initiatives between 2012–2017 OECD DAC reporting.
The following transparency-related challenges and gaps are identified through a review of Zambia's latest NC:
- Lack of a Quality Assurance/Quality control (QA/QC) system in place to ensure routine and consistent checks required for data integrity, correctness and completeness from different data sources;
- Lack of harmonization between Zambia’s energy balance reporting classification with that of the UNFCCC;
- Lack of reliable biomass activity data and appropriate emission factors for biomass combustion and charcoal production;
- Lack of reliable activity data for determination of GHG emissions for HFCs and SF6 under industrial processes for the following activities: road paving with asphalt, pulp and paper production, food and beverages, refrigeration and air conditioning, and consumption of SF6 in electrical equipment (transformers);
- Lack of assessment of uncertainties and absence of QA/QC system, and use of default emission factors for the Agriculture sector, unreliable activity data for animal waste management, agricultural soils, and burning of agriculture crops;
- Lack of assessment of uncertainties and absence of QA/QC system, and use of default emission factors and unreliable activity data for the LULUCF sector;
- Lack of complete activity data on solid waste management and wastewater flow from all utilities and industries, pit latrines and incineration.
In general, studies need to be undertaken to improve on the activity data and/or emission factors for the following sectors: Agriculture, LULUCF, Industrial Processes and Waste. Furthermore, QA/QC systems for the various sectors need to be established.
During COP25, an interview was conducted with representatives from the Ministry of Lands, Natural Resources and Environmental Protection, and the Acting Deputy Director of the National Institute for Scientific and Industrial Research. The interviewees explained that Zambia has limited international support to transparency and MRV. Currently, Zambia only receives support through the NDC Partnership, which, in practice, is one person assigned to the task. General support for all UNFCCC-related reporting and the setting up of a permanent national MRV system is needed. The priority is to build up a robust and sustainable system for reporting, which will require the Ministries, Research Institutes and Universities to be boosted in the number of employees, and their respective staff to receive training. Zambia would like to boost expertise in the five inventory sectors: Energy, Industrial Processes, Agriculture, Land Use Change and Forestry, and Waste. However, they need support from international experts in order to perform training for these five sectors. Support from international experts will also be needed to set up the national MRV system.
4.3 Identification of potential countries for targeted transparency-related support by the Nordic countries
The following analysis provides an expanded selection of potential countries for targeted transparency support by the Nordic countries. In this analysis, countries that have received ICAT and GGGI MRV support are included. ICAT and GGGI MRV project support is limited in scope and budget per country (EURO 250.000 per country for ICAT), compared to CBIT funding (up to USD 2 million per country for medium-sized projects). Therefore, there still might be a need for transparency-related capacity-building support in the countries, where these initiatives are ongoing or finalized. By contrast, CBIT provides comprehensive country support, and therefore it is assumed that it will cover most of the needed capacity enhancement priorities in targeted countries. In addition, the terms of the assignment state that the analysis should consider countries or regions, where the Nordics have not yet been actively supporting aid work, so that the analysis also covers countries with no involvement or support from the Nordic countries. Finally, as transparency on climate impacts and adaptation is also one of the reporting requirements under the PA (although not mandatory), the analysis includes the assessment of submitted National Adaptation Plans (NAPs) under the transparency capacity assessment.
The following selection criteria have been applied:
- Representative of the LDC category;
- Representative of the SIDS category;
- Underserved countries in terms of international transparency-related project-type support initiatives, excluding CBIT;
- Little transparency capacity illustrated by poor track record in UNFCCC reporting (number of NCs, BUR and NAPs submitted);
- Nordic support relations, illustrating existing working relations and systems in place that can actually receive capacity-building support;
- Size of GHG emissions, preferably targeting larger emitters and countries with rapidly increasing GHG emissions;[1]To assess the size of GHG emissions, the analysis consulted the NDC factsheets provided by the Paris Equity Check: http://paris-equity-check.org/the-science.html
- Ambition of GHG emissions reduction, as specified in countries' NDCs;
- Geographical balance, if possible -- between Africa, Asia & Pacific, and Latin American & the Caribbean;
- Political stability.[2]To assess the political stability and the ability to conduct in-country activities, the website of the Finnish Foreign Ministry was consulted on their travel advice to countries.
Tables 7 and 8 highlights, in green, the LDCs that comply with three of the selection criteria. Dark green colour highlights countries that comply with the most criteria (four), while light green colour highlights countries that comply with three criteria. Dark grey text in bold identifies high income SIDS and territories, which are not eligible to receive official development assistance (ODA) according to the OECD-DAC list in 2020. Blue-coloured text illustrates excluded LDCs soon to move away from LDC status. Red-coloured text illustrates excluded countries that do not comply with the political stability criteria.
Footnotes
- ^ To assess the size of GHG emissions, the analysis consulted the NDC factsheets provided by the Paris Equity Check: http://paris-equity-check.org/the-science.html
- ^ To assess the political stability and the ability to conduct in-country activities, the website of the Finnish Foreign Ministry was consulted on their travel advice to countries.
Table 7: Ranking of LDCs with one project-type transparency support, according to number of Nordic support projects received, and emission profile
| Country | Region | GEF EA | ICAT | GGGI MRV | Total project support | Nordic support | NC | NC/ BUR/ NAPS | Rank of worldwide emissions 2010 | Per-capita 2010 emissions (tCO2eq /cap) | Per-capita reduction (% from 2010 - 2030) | |
| LDC | Angola* | Africa | 1 | 1 | 22 | 1 | 1 | 62 | 3.7 | -24% | ||
| LDC | Bhutan | Asia | 1 | 1 | 34 | 2 | 2 | 167 | 2.9 | -10% | ||
| LDC | Burundi | Africa | 1 | 1 | 28 | 3 | 3 | 155 | 0.5 | 766% | ||
| LDC | CAR | Africa | 1 | 1 | 4 | 2 | 2 | 110 | 5.7 | -22% | ||
| LDC | Chad | Africa | 1 | 1 | 6 | 2 | 2 | 106 | 2.3 | -17% | ||
| LDC | DRC | Africa | 1 | 1 | 81 | 3 | 3 | 83 | 0.7 | 18% | ||
| LDC | Djibouti | Africa | 1 | 1 | 6 | 2 | 2 | 169 | 1.9 | 22% | ||
| LDC | Eritrea | Africa | 1 | 1 | 2 | 2 | 152 | 1.3 | -2% | |||
| LDC | Gambia | Africa | 1 | 1 | 6 | 2 | 2 | 164 | 1.4 | -38% | ||
| LDC | Guinea | Africa | 1 | 1 | 2 | 2 | 2 | 120 | 1.8 | -11% | ||
| LDC | Lesotho | Africa | 1 | 1 | 4 | 2 | 2 | 156 | 2.3 | -3% | ||
| LDC | Mali | Africa | 1 | 1 | 78 | 3 | 3 | 94 | 2.2 | 42% | ||
| LDC | Mauritania | Africa | 1 | 1 | 6 | 4 | 5 | 138 | 3.3 | -1% | ||
| LDC | Mozambique | Africa | 1 | 1 | 2 | 107 | 1 | 1 | 95 | 1.3 | -13% | |
| LDC | Myanmar | Asia | 1 | 1 | 2 | 73 | 1 | 1 | 49 | 2.1 | -8% | |
| LDC | Nepal | Asia | 1 | 1 | 152 | 2 | 2 | 92 | 1.3 | -11% | ||
| LDC | Niger | Africa | 1 | 1 | 24 | 3 | 3 | 113 | 1.3 | 59% | ||
| LDC | Senegal | Africa | 1 | 1 | 2 | 10 | 3 | 3 | 111 | 1.9 | 25% | |
| LDC | Somalia | Africa | 1 | 1 | 58 | 1 | 1 | 107 | 2.9 | -16% | ||
| LDC | South Sudan | Africa | 1 | 1 | 18 | 1 | 1 | 86 | 4.4 | -16% | ||
| LDC | Sudan | Africa | 1 | 1 | 2 | 17 | 2 | 3 | 50 | 3.4 | -16% | |
| LDC | Tanzania | Africa | 1 | 1 | 2 | 213 | 2 | 2 | 67 | 1.6 | -33% | |
| LDC | Yemen | Middle East | 1 | 1 | 4 | 3 | 4 | 87 | 1.7 | -33% | ||
| LDC | Zambia | Africa | 1 | 1 | 90 | 2 | 2 | 98 | 2.3 | -8% |
Source: Own analysis
Table 8 highlights, in green, the SIDS that comply with three or more of the selection criteria. Dark green colour highlights countries that comply with the most criteria (four), while light green colour highlights countries that comply with three criteria.
Table 8: Ranking of SIDS (incl. LDC-SIDS) according to number of Nordic support received
| Country | Region | GEF EA | ICAT | GGGI MRV | Total project support | Nordic support | NC | NC/ BUR/ NAPS | Rank of worldwide emissions 2010 | Per-capita 2010 emissions (tCO2eq /cap) | Per-capita reduction (% from 2010 - 2030) | |
| SIDS | Bahamas | Caribbean | 1 | 1 | 2 | 2 | 163 | 6.8 | 3% | |||
| SIDS | Bahrain | Middle East | 1 | 1 | 2 | 2 | 91 | 28.5 | 24% | |||
| SIDS | Barbados | Caribbean | 1 | 1 | 2 | 2 | 168 | 6 | -19% | |||
| SIDS | Belize | Caribbean | 1 | 1 | 2 | 1 | 3 | 3 | 172 | 3 | 3% | |
| SIDS | Cabo Verde | Africa | 1 | 1 | 3 | 3 | 173 | 1.8 | 26% | |||
| LDC/SIDS | Comoros | Africa | 1 | 1 | 2 | 2 | 175 | 0.9 | -54% | |||
| SIDS | Cook Islands | Pacific | 1 | 1 | 2 | 2 | 195 | 4.2 | 24% | |||
| SIDS | Dominica | Caribbean | 1 | 1 | 2 | 2 | 188 | 3.2 | -72% | |||
| SIDS | Fiji | Pacific | 1 | 1 | 3 | 2 | 3 | 165 | 2.8 | 26% | ||
| SIDS | Grenada | Caribbean | 1 | 1 | 2 | 3 | 183 | 3.2 | -11% | |||
| LDC/SIDS | Guinea Bissau | Africa | 1 | 1 | 5 | 3 | 3 | 166 | 1.4 | -5% | ||
| SIDS | Guyana | Caribbean | 1 | 1 | 20 | 2 | 2 | 158 | 4.7 | -13% | ||
| LDC/SIDS | Kiribati | Pacific | 1 | 1 | 2 | 2 | 2 | 194 | 1 | -44% | ||
| SIDS | Marshall Islands | Pacific | 1 | 1 | 2 | 2 | 2 | 191 | 3.4 | -48% | ||
| SIDS | Micronesia | Pacific | 1 | 1 | 2 | 2 | 190 | 1.7 | -38% | |||
| SIDS | Nauru | Pacific | 1 | 1 | 2 | 2 | 196 | 4.4 | 49% | |||
| SIDS | Niue | Pacific | 1 | 1 | 2 | 2 | 198 | 4.1 | 23% | |||
| SIDS | Palau | Pacific | 1 | 1 | 2 | 2 | 185 | 12.4 | -42% | |||
| SIDS | Saint Kitts and Nevis | Caribbean | 1 | 1 | 2 | 2 | 184 | 5.2 | 84% | |||
| SIDS | Saint Lucia | Caribbean | 1 | 1 | 3 | 4 | 180 | 2.9 | 24% | |||
| SIDS | Saint Vincent and the Grenadines | Caribbean | 1 | 1 | 2 | 3 | 181 | 3.2 | 10% | |||
| SIDS | Samoa | Pacific | 1 | 1 | 2 | 2 | 178 | 2.8 | -14% | |||
| LDC/SIDS | São Tomé and Principe | Africa | 1 | 1 | 3 | 3 | 192 | 1 | -16% | |||
| SIDS | Seychelles | Africa | 1 | 1 | 2 | 2 | 179 | 5.5 | 51% | |||
| SIDS | Singapore | Asia | 0 | 4 | 7 | 81 | 10.4 | 42% | ||||
| LDC/SIDS | Solomon Islands | Pacific | 1 | 1 | 2 | 1 | 2 | 2 | 182 | 0.7 | -38% | |
| SIDS | Suriname | Caribbean | 1 | 1 | 2 | 2 | 159 | 6.8 | 34% | |||
| LDC/SIDS | Timor-Leste | Asia | 1 | 1 | 1 | 1 | 1 | 170 | 1.2 | 13% | ||
| SIDS | Tonga | Pacific | 1 | 1 | 2 | 3 | 186 | 2.3 | -8% | |||
| SIDS | Trinidad and Tobago | Caribbean | 1 | 1 | 2 | 2 | 2 | 60 | 60.6 | 16% | ||
| LDC/SIDS | Tuvalu | Pacific | 1 | 1 | 2 | 2 | 2 | 197 | 2 | -51% | ||
| LDC/SIDS | Vanuatu | Pacific | 1 | 1 | 2 | 2 | 176 | 2.6 | -27% |
Source: Own analysis
Countries that comply with four criteria are marked dark green. Countries that comply with three criteria are marked light green. SIDS not eligible for ODA have dark grey-coloured text in bold. LDCs moving away from LDC status have blue-coloured. Countries with political instability are coloured red.
The countries that meet most of the criteria on the LDC list, excluding countries soon to graduate from LDC status, not eligible to receive ODA and with political instability, are:
- Djibouti
- Has received transparency support only through the GEF enabling activities
- Has only submitted 2 NCs
- Is expected to experience a 22% increase in per capita emissions by 2030 (baseline 2.2 tCO2 per capita in 2010)
- Mali
- Has received transparency support only through the GEF enabling activities
- Has been supported by 78 Nordic initiatives
- Is expected to experience a 42% increase in per capita emissions by 2030 (baseline 1.9 tCO2 per capita in 2010)
- Myanmar
- Has been supported by 73 Nordic initiatives
- Has only submitted 1 NC
- Is ranked as the 49th largest contributor to emissions worldwide
- Nepal
- Has received transparency support only through the GEF enabling activities
- Has been supported by 152 Nordic initiatives
- Has only submitted 2 NCs
- Niger
- Has received transparency support only through the GEF enabling activities
- Has been supported by 24 Nordic initiatives
- Is expected to experience a 59% increase in per capita emissions by 2030 (baseline 1.3 tCO2 per capita in 2010)
- Zambia
- Has received transparency support only through the GEF enabling activities
- Has been supported by 90 Nordic initiatives
- Has only submitted 2 NCs
The countries that meet most of the criteria on the SIDS list are:
- Guyana
- Has received transparency support only through the GEF enabling activities
- Has been supported by 78 Nordic initiatives
- Has only submitted 2 NCs
- Has relatively high emissions per capita (baseline 4.7 tCO2 per capita in 2010)
- Nauru
- Has received transparency support only through the GEF enabling activities
- Has only submitted 2 NCs
- Has high emissions per capita (baseline 4.4 tCO2 per capita in 2010)
- Is expected to experience a 49% increase in per capita emissions by 2030
- Niue
- Has received transparency support only through the GEF enabling activities
- Has only submitted 2 NCs
- Has high emissions per capita (baseline 4.1 tCO2 per capita in 2010)
- Is expected to experience a 23% increase in per capita emissions by 2030
- Suriname
- Has received transparency support only through the GEF enabling activities
- Has only submitted 2 NCs
- Has high emissions per capita (baseline 6.8 tCO2 per capita in 2010)
- Is expected to experience a 34% increase in per capita emissions by 2030
Additionally, the following SIDS comply with three of the selection criteria (equal to the criteria compliance of the selected LDCs):
- Palau
- Has received transparency support only through the GEF enabling activities
- Has only submitted 2 NCs
- Has high emissions per capita (baseline 12.4 tCO2 per capita in 2010)
- Timor-Leste
- Has received transparency support only through the GEF enabling activities
- Has only submitted 2 NCs
- Is expected to experience a 13% increase in per capita emissions by 2030 (baseline 1.2 tCO2 per capita in 2010)
5. GAPS AND NEEDS IN CB EFFORTS TO LDCS AND SIDS TO IMPLEMENT THE ETF
Challenges and gaps in capacity-building efforts vary between countries, due to their respective national circumstances, specific needs and priorities. Generally, capacity-building efforts under the UNFCCC can be divided into two main aspects (Dagnet et al., 2019):
- Capacity building at the governance level aimed at improving the national institutional structures, mechanisms, procedures, policies and laws.
- Capacity building to perform core technical functions for specific information requirements -- e.g. gather, analyse and report specific information.
This division can also be applied to the case of capacity building for transparency. Capacity building is needed at the institutional level in order to develop governance systems to implement the ETF, and at the technical, human capacity level through training and knowledge-sharing to raise awareness of specific information available and develop skills -- e.g. application of IPCC methodology to be able to report GHG inventories.
The identification of gaps and challenges depends on the perspective from which these are analysed. Taking an international transparency perspective, challenges and gaps can be framed around the ability to submit timely communications to the UNFCCC, the ability to use high IPCC tier level methodologies for GHG inventory, or the availability of data to respond to both shall and should reporting requirements in BTRs. From a country perspective, challenges and gaps are more related to the ability to assess the effectiveness of national policies, such as capacity to assess sustainable development impacts of climate policies, alignment with national development plans, and availability of priority sectors' activity data for improved planning. The LDC and SIDS needs and gaps to implement the ETF are mapped from both perspectives. Section 5.1 reviews the existing literature on transparency to identify issues and gaps from an international perspective. Sections 5.2, 5.3 and 5.4 present original analysis of countries’ self-reported needs and gaps, identified through CBIT funding proposals (5.2), CBIT self-assessments (5.3) and interviews with two countries during COP25 (5.4).
The international perspective is mapped through the following approaches:
- Available literature on reporting challenges and gaps, including self-expressed challenges and gaps in NCs
- Results of Task 2 on coverage of international capacity-building efforts and submitted NCs and BURs
The country perspective is mapped through:
- Available statements on country priorities and gaps in capacity-building efforts in existing literature
- CBIT project proposal applications
- CBIT Global Coordination Platform country self-assessment tool on the state of national transparency systems
- Interview responses from selected countries during COP25
5.1 Review of literature on transparency issues for LDCs and SIDS
Existing literature on developing country needs and gaps in relation to the ETF is limited (WRI, 2019; IIED, 2019 & GEF, 2019). This is not unexpected due to the short time since the ETF and MPGs entered the international scene, respectively since the Paris Agreement in 2015 and the Katowice 'rulebook' including MPGs for transparency in 2018. The UNFCCC Consultative Group of Experts (CGE) conducted surveys with national focal points, NC and BUR project coordinators, national GHG inventory coordinators, and sectoral or thematic experts from 86 developing country Parties between May and July 2019. The survey maps problems, constraints and lessons learned by developing country Parties during the process and preparation of NCs and BURs, gauging emerging needs resulting from the ETF of the PA (UNFCCC, 2019).
The UNFCCC survey indicated that only 24% of the respondents (117) were familiar enough with the MPGs to identify their needs and start planning for the implementation of the ETF.
Key capacity-building needs identified for preparing and reporting BTRs include:
- The national GHG inventory
- Tracking progress of implementation and achievement of NDCs
- Climate change impacts and adaptation
- Support needed and received
For all countries, needs related to institutional arrangements, methodologies and tools was a recurrent theme for capacity-building needs, under the four topics listed above. In particular, the need for formalizing MRV processes, retaining institutional capacities, and the need for establishing an MRV system. The need to strengthen institutional arrangements and coordination was predominant. Under methodologies and tools, the need for practical tools and guidance and technical capacities were highlighted. In addition, the need for enhancement of assessments for vulnerability and adaptation, tracking and reporting of support needed and received were also identified.
In terms of the countries' own priorities for capacity building, they are listed in sequence of relative importance, as follows:
- Methods or practical guidelines for tracking progress of implementation and achievement of NDCs (42%)
- Understanding the relationship between MRV and transparency of climate action and support, and the tracking or monitoring of Sustainable Development Goal indicators (19%)
- Formalizing a data collection and management process (18%)
For further details on results of the CGE UNFCCC survey and insights from literature representing an international perspective on LDCs and SIDS capacity-building gaps and needs, see Appendix 6.
5.2 Analysis of CBIT support requests reflecting country needs and gaps for CB
Looking at CBIT funds to developing countries can provide some information on the transparency-related needs and priorities expressed. Figure 12, below, illustrates the percentage of specific types of CB activities included in approved CBIT projects.
Figure 12: CBIT Project Priorities per Type of Activity (as of April 30, 2019)
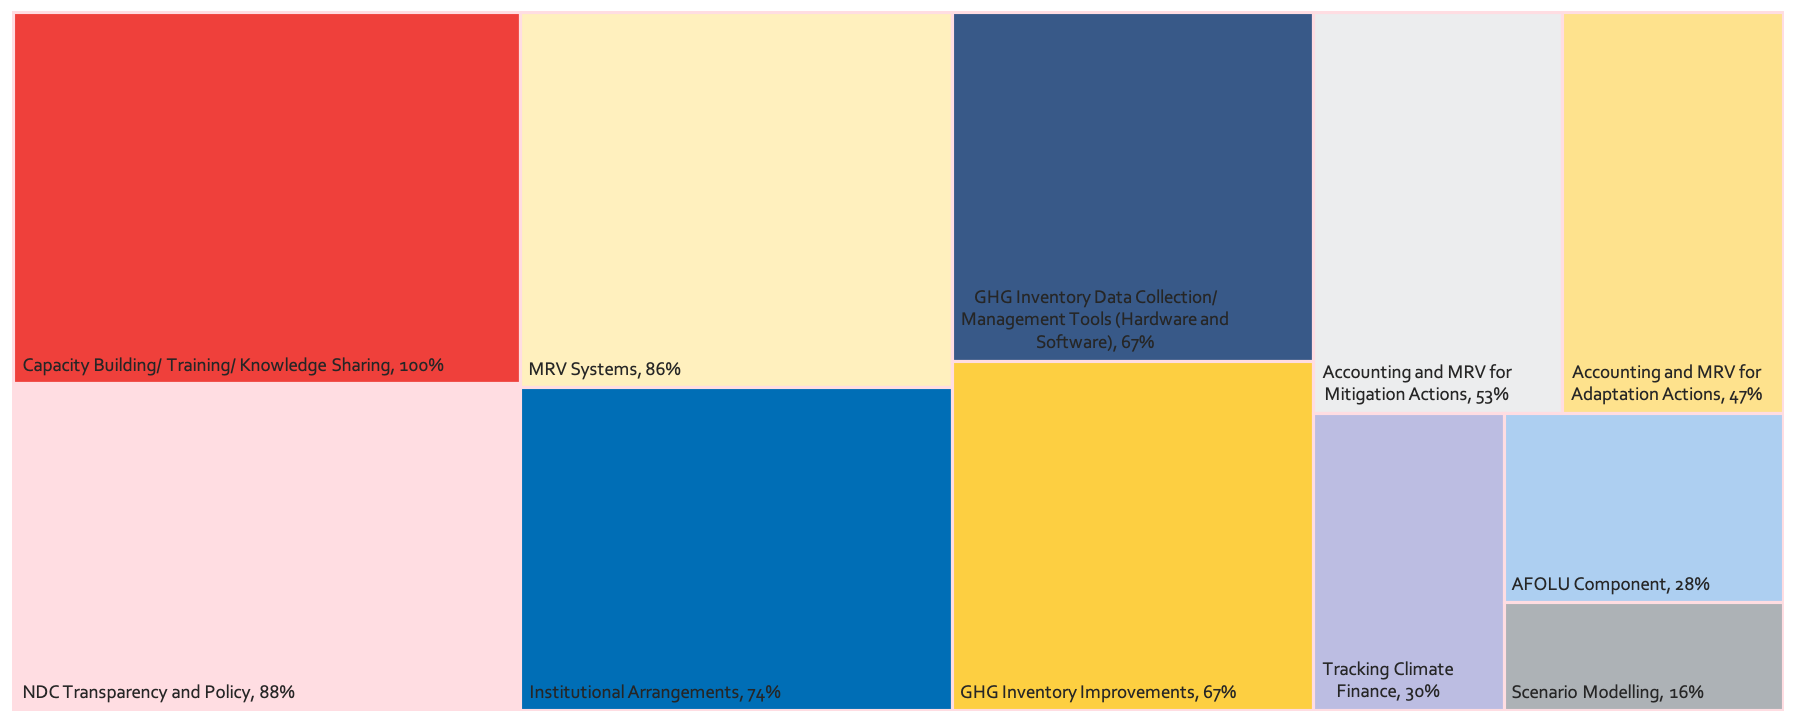
Source: GEF, 2019: Progress report on the Capacity-Building Initiative for Transparency
A majority of CBIT-approved projects focus on capacity building, knowledge sharing, and training activities, as well as activities to strengthen institutional arrangements, MRV systems, and NDC transparency and policy design. Scenario modelling of economic and/or GHG emissions trends are seldom included in project proposals, and less than a third of the projects included a project-component on reporting of support needed and received (GEF, 2019).
Even though adaptation is a priority for most developing countries, only 47% of CBIT proposals included a component related to the establishment or improvement of MRV for adaptation activities (GEF, 2019). Approximately 28% included a component related to improvements of GHG emissions from the AFOLU sector, reflecting the sector's relative importance in terms of emissions in the countries, and the challenges countries have in quantifying and reporting sectoral emissions and removals, due to limited data and technical capacities (GEF, 2019).
Focusing on LDCs and SIDS, there is a similar prioritisation, although LDCs and SIDS seem to have more focus on support needed for GHG Inventory Data Collection and Management Tools, and general GHG Inventory improvements (GEF, 2019).
Looking beyond approved CBIT projects, and analysing LDCs and SIDS Project Identification Forms (PIF) submitted to the GEF for CBIT funding, a specific set of trends arise. Figure 13 and Figure 14 illustrate the number of outputs LDCs and SIDS have included in their PIFs, as it relates to a specific set of categories. The last five categories are aligned with the reporting inputs and aspects of the transparency framework, as illustrated in Figure 1, while the first four categories are cross-cutting. Out of the 11[1]11 LDCs: Bangladesh, Burkina Faso, Cambodia, Ethiopia, Lao PDR, Liberia, Madagascar, Rwanda, Sierra Leone, Togo and Uganda analysed PIFs submitted by LDCs, most outputs sought were related to GHG inventory support, with a main focus on the procedural aspects of GHG inventory development. This is followed by outputs related to transparency of NDC actions, with the focus staying on the procedural aspects. Capacity-building support on stakeholder knowledge-transfer and institutional aspects of transparency appear to also be a relatively high priority.
Footnotes
- ^ 11 LDCs: Bangladesh, Burkina Faso, Cambodia, Ethiopia, Lao PDR, Liberia, Madagascar, Rwanda, Sierra Leone, Togo and Uganda
Figure 13: Distribution of outputs of LDCs in CBIT PIF submitted to the GEF
Source: Martinez, et al., 2019: Implementing the enhanced transparency framework: early insights from the capacity-building initiative for transparency
Looking at sectoral representation, Agriculture and Land use/Forestry were prioritized by all PIFs analysed, followed by Energy (renewables and efficiency) and Waste.
Table 9: Sectoral prioritisation for LDCs in analysed CBIT PIFs
| Country | Energy (RE & EE) | Industrial Processes | Transport | Agriculture | Land use and Forestry | Waste | Cross-sector |
| Uganda | X | X | X | X | X | ||
| Cambodia | X | X | |||||
| Liberia | X | X | X | X | X | ||
| Madagascar | X | X | X | X | X | X | X |
| Ethiopia | X | X | X | ||||
| Bangladesh | X | X | X | ||||
| Rwanda | X | X | X | X | |||
| Burkina Faso | X | X | X | ||||
| Togo | X | X | X | X | X | ||
| Sierra Leone | X | X | X | X | |||
| Lao PDR | X | X | X |
Source: Own analysis by Martinez, G. S., 2019, UNEP DTU Partnership
Looking at SIDS, the focus of the 5[1]5 SIDS: Papua New Guinea, Antigua and Barbuda, Dominican Republic, Cuba, Jamaica analysed PIFs shifts and is much more centred around transparency support for NDC actions. Moreover, 7 outputs focus on support for procedural aspects, 5 on institutional aspects and capacity building, and 5 on support for procedural aspects of climate change impacts and adaptation. According to PATPA, LDCs and SIDS would highly benefit from basic training on GHG inventory, and SIDS' focus on NDC tracking might illustrate the difference in priorities between international UNFCCC reporting requirements and national priorities, as mentioned at the start of this chapter.
Footnotes
- ^ 5 SIDS: Papua New Guinea, Antigua and Barbuda, Dominican Republic, Cuba, Jamaica
Figure 14: Distribution of outputs of SIDS in CBIT PIF submitted to the GEF
Source: Martinez, et al., 2019: Implementing the enhanced transparency framework: early insights from the capacity-building initiative for transparency
In terms of sectoral representation, Agriculture and Land use/Forestry were again prioritized, followed by Energy (renewables and efficiency), Industrial Processes and Transport.
Table 10: Sectoral prioritisation for LDCs in analysed CBIT PIFs
| Country | Energy (RE & EE) | Industrial Processes | Transport | Agriculture | Land use and Forestry | Waste | Cross-sector |
| Papua New Guinea | X | X | |||||
| Antigua and Barbuda | X | X | X | X | X | X | X |
| Dominican Republic | X | X | X | X | X | ||
| Cuba | X | X | |||||
| Jamaica | X | X | X | X | X | X | X |
Source: Own analysis by Martinez, G. S., 2019, UNEP DTU Partnership
5.3 Self-assessment of 19 LDCs and SIDS capacity-building needs
The CBIT Global Coordination Platform's self-assessment tool is designed to help countries define the state of their national transparency systems and identify the corresponding gaps and needs, through guiding questions and complementary information collected directly from country representatives. It also enables countries to submit additional information on their priorities for capacity building.
The tool is made in the form of a questionnaire, covering the information that Parties to the Paris Agreement shall regularly provide, as defined in the enhanced transparency framework established by Article 13 of the Paris Agreement. The questionnaire has four sections, each with a number of sub-sections asking specific questions about the countries' capacity to prepare the required information, as follows:
- National greenhouse gas inventory
- Responsible institution for coordination and implementation of inventory activities – sub-section with 5 questions
- Engagement of stakeholders – sub-section with 9 questions
- Data collection and management – sub-section with 12 questions
- Methodologies used – sub-section with 6 questions
- Quality assurance and control procedures – sub-section with 11 questions
- Progress made in implementing and achieving NDCs
- Institutional arrangements – sub-section with 7 questions
- Data collection and management – sub-section with 5 questions
- Procedures for monitoring progress – sub-section with 8 questions
- Climate change impacts and adaptation
- Institutional arrangements – sub-section with 8 questions
- Data collection and procedures – sub-section with 7 questions
- Methodologies for planning and monitoring – sub-section with 6 questions
- Financial, technology transfer, and capacity-building support needed and received
- Institutional arrangements – sub-section with 5 questions
- Procedures for reporting support needed – sub-section with 7 questions
- Procedures for reporting support received – sub-section with 7 questions
The self-assessment tool has previously been used by focal points of the CBIT projects, who are typically part of the team engaged in transparency and MRV work in the country (see Table 23 for details on countries). The questions in the self-assessment are close-ended but there is always an open answer option, to be used if the available closed answer options are not appropriate to describe the country situation. The answers provide an indication of the level of country 'readiness' in the topic being asked about. After the country completes its self-assessment, the answers are examined and scored against a 'readiness' scale, and a summary sheet is created and shared with the country. Finally, there is a follow-up discussion with the country to validate the results in the summary sheet and make adjustments, when necessary. Upon validation by the country, the results of the self-assessment are published in the CBIT Global Coordination Platform.
The results of the self-assessment tool provide an indication of the level of capacity (on a scale ranging from 0 to 100%) that a country has to meet the information requirements specified in the ETF. This level of capacity can of course change over time because of ongoing capacity-building efforts or due to changes in the country context -- e.g. poor retention of qualified staff, changes in organizational structure at the ministry level. The results presented in this document pertain to the self-assessment of capacity done by a sample of 44 developing countries, of which 12 are LDCs, 7 are SIDS, and 25 are other developing countries (Figure 15). These self-assessments were done throughout the last quarter of 2018 and first semester of 2019.
Figure 15: Country users of the self-assessment tool (2019)
Source: Own analysis by Cardoso, A., 2020, UNEP DTU Partnership
In terms of level of capacity for reporting a national GHG inventory, the analysis of the self-assessments shows that on average LDCs and SIDS have somewhat lower levels of capacity than other developing countries -- 60% for SIDS and LDCs, and 67% for other developing countries. The majority of other developing countries have a level of capacity for national GHG inventory within 57% and 89%, whereas the majority of SIDS is within 53% and 77%, and the majority of LDCs is within 57% and 73%. This can be seen in Figure 16, which shows the shape of the distribution of capacity levels to produce and report a GHG inventory, the variability (minimum and maximum values), and the central values (average and median).
For the different groups of countries assessed (LDCs, other developing countries, and SIDS), the box-and-whisker chart of Figure 16 shows, on a scale of 0 to 100:
- The minimum value of capacity level in the group - for example, in the LDC group this value is 35 (the low end of the whiskers)
- The average value of capacity level in the group - for example, in the LDC group this value is 60 (the dot in the light blue box)
- The median value of capacity level in the group - for example, in the LDC group this value is 64 (the black line in the light blue box)
- The maximum value of capacity level in the group - for example, in the LDC group this value is 73 (the high end of the whiskers)
- The mid-spread dispersion of capacity level in the group, which is a measure of where the middle 50% of countries are - for example, there is more spread in the group of other developing countries than in the groups of LDCs and SIDS (the coloured boxes). This means that the group of other developing countries is less homogeneous.
Figure 16: Distribution of countries' capacity levels to report information on national GHG inventory
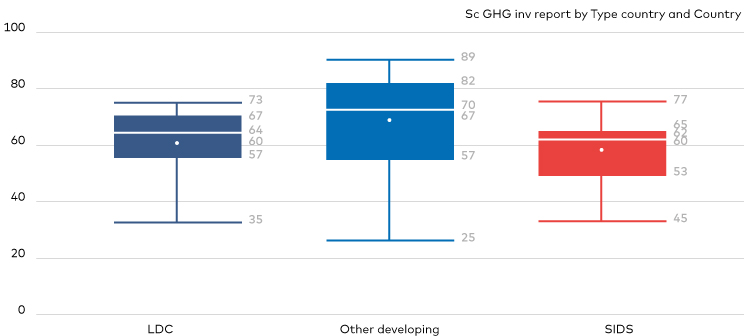
Source: Own analysis by Cardoso, A., 2020, UNEP DTU Partnership
The areas of the GHG inventory where LDCs and SIDS are lagging somewhat behind other developing countries are methodologies and procedures for data collection and management. Figure 17 (left) shows that half of the LDC and SIDS countries in the sample have a capacity level on methodologies for GHG inventory between 44% and 64%, whereas the capacity level in half of other developing countries is within 48% and 81%. There is a more accentuated difference in the levels of capacity on data collection and management procedures for GHG inventory, as shown in Figure 17 (right). The capacity level on data collection and management procedures in the majority of the other developing countries is within 54% and 81%, whereas in the LDCs this level ranges between 21% and 73%, and in SIDS countries it is within 32% and 61%. Half of the LDCs have a capacity level on data collection and management procedures for GHG inventory below 43%, whereas in half of SIDS countries it is below 50%.
For the different groups of countries assessed (LDCs, other developing countries, and SIDS), the box-and-whisker charts of Figure 17 show, on a scale of 0 to 100:
- The minimum value of capacity level in the group - the low end of the whiskers
- The average value of capacity level in the group - the dot in the coloured box
- The median value of capacity level in the group - the black line in the light blue box
- The maximum value of capacity level in the group - the high end of the whiskers
- The mid-spread dispersion of capacity level in the group, which is a measure of where 50% of the countries are - the coloured box
Figure 17: Distribution of countries' capacity levels on methodologies (left) and data collection and management procedures for GHG inventory (right)
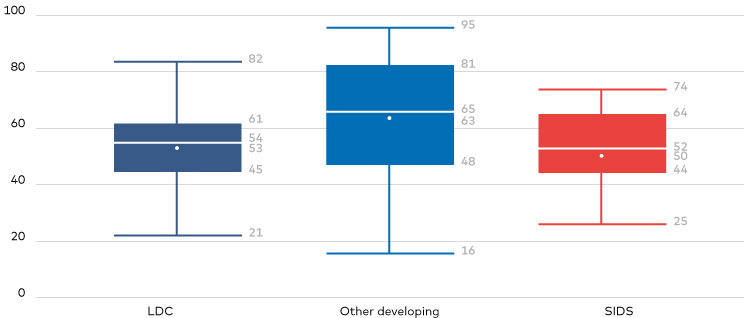
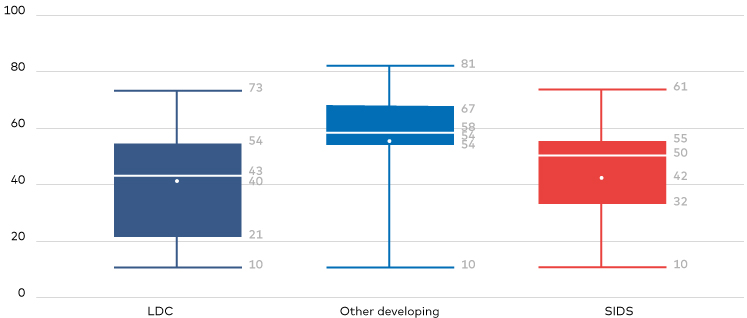
Source: Own analysis by Cardoso, A., 2020, UNEP DTU Partnership
In general, countries' assessment of the capacity level to report information on the implementation and achievement of NDCs is lower than the capacity level to report on national GHG inventory. This is expected because the implementation of NDCs is supposed to start in 2020 and the first time countries will report about it will be in 2024. Conversely, all countries that used the self-assessment tool have gone through at least one round of reporting information on GHG inventory through a National Communication. Moreover, a significant number of countries have also submitted one Biennial Update Report.
The results of the self-assessment show that there is a less accentuated difference between LDCs and other developing countries in terms of their assessed levels of capacity for reporting information on NDC implementation, and that SIDS have lower levels of capacity than both LDCs and other developing countries. Figure 18 shows that the average level of capacity for reporting on NDC implementation range is 53% in other developing countries, 46% in LDCs, and 37% in SIDS. The difference is explained by the lower assessed capacity by SIDS in terms of institutional arrangements and methodologies for monitoring NDCs. All countries in the sample have significant gaps in terms of data collection and management procedures, where the average level of capacity is 28% for LDCs, 31% for SIDS, and 44% for other developing countries.
For the different groups of countries assessed (LDCs, other developing countries, and SIDS), the box-and-whisker chart of Figure 18 shows, on a scale of 0 to 100:
- The minimum value of capacity level in the group - the low end of the whiskers
- The average value of capacity level in the group - the dot in the coloured box
- The median value of capacity level in the group - the black line in the light blue box
- The maximum value of capacity level in the group - the high end of the whiskers
- The mid-spread dispersion of capacity level in the group, which is a measure of where 50% of the countries are - the coloured box
Figure 18: Distribution of countries' capacity levels to report information about implementation and achievement of NDCs
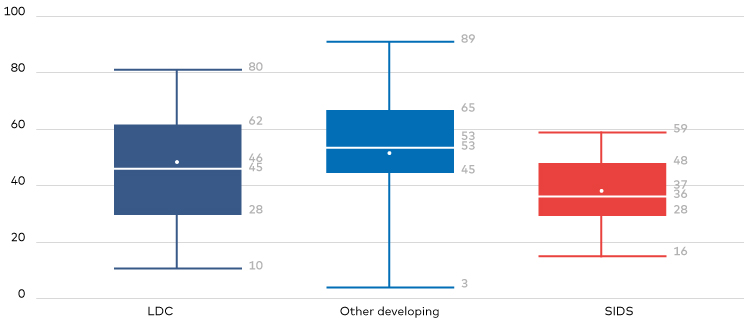
Source: Own analysis by Cardoso, A., 2020, UNEP DTU Partnership
In terms of reporting information on climate change impacts and adaptation, the LDCs assessed a somewhat higher level of capacity than SIDS and other developing countries. The average level of capacity for reporting climate change impacts and adaptation actions is 49% in LDCs, and 42% in SIDS and other developing countries (Figure 19). The capacity levels of SIDS and other developing countries are very similar in terms of institutional arrangements for reporting adaptation, methodologies, and data collection and management procedures. In all of these, the LDCs have, on average, higher levels of capacity. In all countries, the gaps in capacity are higher for data collection and management procedures in adaptation reporting.
For the different groups of countries assessed (LDCs, other developing countries, and SIDS), the box-and-whisker chart of Figure 19 shows, on a scale of 0 to 100:
- The minimum value of capacity level in the group - the low end of the whiskers
- The average value of capacity level in the group - the dot in the coloured box
- The median value of capacity level in the group - the black line in the light blue box
- The maximum value of capacity level in the group - the high end of the whiskers
- The mid-spread dispersion of capacity level in the group, which is a measure of where 50% of the countries are - the coloured box
Figure 19: Distribution of countries' capacity levels to report information about climate change impacts and adaptation
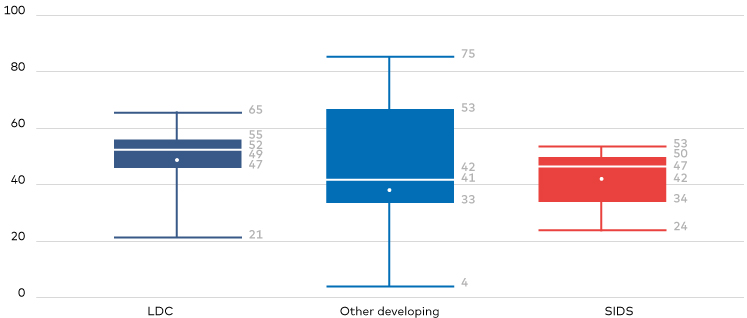
Source: Own analysis by Cardoso, A., 2020, UNEP DTU Partnership
Despite countries having experience in reporting on adaptation through their National Communication, the average capacity level for reporting on adaptation is approximately 20 points lower than for reporting on national GHG inventory.
The experience of countries in reporting information about support needed and received is quite limited. As such, the capacity levels for reporting this kind of information are the lowest. On average, the capacity level is 34% for LDCs, 35% for other developing countries, and 43% for SIDS (Figure 20). The SIDS consistently reported higher levels of capacity in all aspects related to the reporting of support, namely the institutional arrangements, the procedures for reporting support needed, and the procedures for reporting support received. In all countries, capacity gaps are slightly higher in procedures for reporting support needed than in support received.
For the different groups of countries assessed (LDCs, other developing countries, and SIDS), the box-and-whisker chart of Figure 20 shows, on a scale of 0 to 100:
- The minimum value of capacity level in the group - the low end of the whiskers
- The average value of capacity level in the group - the dot in the coloured box
- The median value of capacity level in the group - the black line in the light blue box
- The maximum value of capacity level in the group - the high end of the whiskers
- The mid-spread dispersion of capacity level in the group, which is a measure of where 50% of the countries are - the coloured box
Figure 20: Distribution of countries' capacity levels to report information about support needed and received
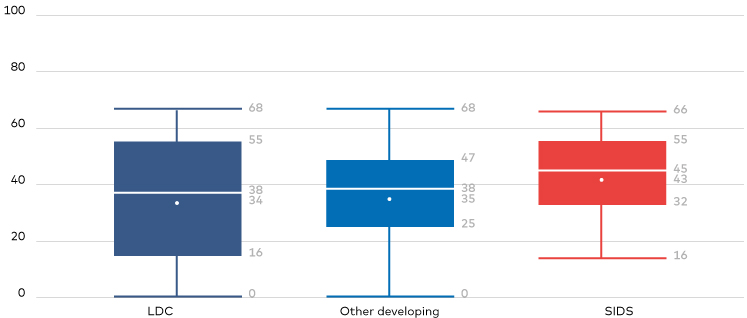
Source: Own analysis by Cardoso, A., 2020, UNEP DTU Partnership
There are no significant differences in terms of capacity levels for institutional arrangements in the reporting of information about GHG inventory, tracking of NDCs, adaptation, and support needed and received. Overall, the average levels of capacity for this aspect range between 40% and 67%, which denotes the existence of capacity gaps, although there are larger capacity gaps in data collection and management procedures.
5.4 Synthesis of categories and types of gaps and needs
Summarizing the gaps and needs in capacity-building efforts to LDCs and SIDS to implement the ETF, there are some general observations that can be used to highlight general trends, and to guide formulation of recommendations for Nordic countries' transparency support. In general, there are very low capacities on data collection and management, procedures for reporting on NDC progress and achievement, and procedures for reporting support needed. SIDS also have limited reporting capacities on climate change impacts and adaptation, especially in terms of institutional arrangements, and data collection and management and procedures. Additionally, there appears to be a large gap for SIDS on methodologies for NDC progress and achievement. In terms of priorities, LDCs seem to prioritise capacity building for GHG inventory improvements, followed by NDC progress and achievement, while SIDS seem to priorities building capacities in NDC progress and achievement, followed by climate change impacts and adaptation.
Table 11 illustrates gaps in transparency capacity (score 1–100) for different CB needs areas for LDCs and SIDS, respectively. Areas with the biggest gaps are marked in green; medium capacity in yellow; and higher capacity is marked in red. The priorities for CB enhancement for LDCs and SIDS is based on the number of outputs related to each CB needs area countries have requested support to CBIT. The higher the number, the more countries have requested support related to the respective area. The CB needs areas with highest support requested are marked in green.
Table 11: Matrix of prioritized gaps and needs by LDCs and SIDS
| ETF reporting components | CB needs areas | Gaps in transparency capacity (average) | Priority for CB | ||
| LDCs | SIDS | LDCs | SIDS | ||
| GHG Inventory | Institutional arrangements | 70 | 70 | 38 | 5 |
| Methodologies | 53 | 52 | |||
| Data collection and management and procedures | 40 | 42 | |||
| NDC progress and achievement | Institutional arrangements | 67 | 47 | 32 | 19 |
| Methodologies | 42 | 34 | |||
| Data collection and management and procedures | 28 | 31 | |||
| Climate change impacts and adaptation | Institutional arrangements | 53 | 38 | 2 | 9 |
| Methodologies | 56 | 51 | |||
| Data collection and management and procedures | 42 | 34 | |||
| Support needed and received | Institutional arrangements | 46 | 59 | 3 | 0 |
| Procedures for reporting support needed | 28 | 39 | |||
| Procedures for reporting support needed | 28 | 29 | |||
Source: Own analysis
The left column lists overall ETF reporting requirements. The second column lists CB needs areas based on the CBIT self-assessment tool. The third column identifies areas where capacities are lowest, based on the CBIT self-assessment tool, as discussed in section 5.3. The last column identifies priorities based on CBIT PIF outputs under the same categories as reporting inputs and aspects of the transparency framework, as presented in Figure 13 and Figure 14.
Expressed types of CB support needed by LDCs and SIDS
The CBIT PIF sample analysed, and the NDC priority sectors reveal some trends in terms of priority sectors for transparency-related support. This information might be relevant in the potential choice to utilize existing international and regional initiatives supported by the Nordic countries. Where some of these initiatives focus on specific sectors, these could be used as a channel for transparency-related CB in the given sector to participating LDCs and SIDS. This information is also useful in case the Nordic countries choose to deliver CB through bilateral programmes. Specific Nordic countries' capacities in the respective sectors could be utilized to deliver targeted transparency support through existing REDD+ capacities for forestry sector support or support transparency activities in the energy sector through capacities with LEAP, for example.
The sample of LDCs seem to prioritize, in particular, the Agriculture and Land Use Change and Forestry sectors, followed by Energy and Waste. The sample of SIDS also prioritize Agriculture and Land use Change and Forestry. It should also be noted that NDC priorities, in general, tend to include the energy sector; therefore the CBIT PIF sample, in addition to identifying priority sectors, likely also illustrates where capacities lack. Some transparency capacities and data in the energy sector tend to be in place, compared to other sectors.
6. RECOMMENDATIONS FOR NORDIC SUPPORT TO TRANSPARENCY
In this chapter, priority areas for capacity building for LDCs and SIDS to implement the ETF (identified in Chapter 5) are assessed, regarding how well they fit the international initiatives, programmes and Nordic support activities (as identified and described in Chapter 2). Through a scoring approach, the most suitable programmes/initiatives/support activities have been identified. To validate assessment results, the consultant had a dialogue with the representatives of the initiatives to clarify initial interest and views on the identified priority areas.
6.1 High priority areas for LDCs and SIDS
Based on the analyses in previous chapters, the following can be concluded.
Countries complying with UNFCCC reporting requirements by submitting one or more BURs and participating in the International Consultation and Analysis (ICA) are assumed to have more capacities and be better prepared to respond to the new requirements of the ETF. Therefore, capacity-building support for enhanced transparency should focus on countries that are underperforming in terms of UNFCCC reporting, in line with the analysis under Task 2. Furthermore, the focus of new initiatives should target countries that have received less support and are more limited in their capacities, so as to build basic institutional and technical capacities to be able to generate reports on a continuous basis, in line with the analysis under Task 2. Therefore, it is recommended that the Nordic countries remain updated on the advancements of participating countries under the different international initiatives, to target the countries most in need of support.
Specifically, the results from Chapter 5 led to the following conclusions:
- The two ETF reporting components, 1) GHG Inventory (LDCs) and 2) NDC progress and achievement (LDCs and SIDS), have been identified as both highest priority and highest gap in knowledge.
- The capacity-building needs cover 1) Institutional arrangements, 2) Methodologies, and 3) Data collection, management and procedures.
- Both LDCs and SIDS have Agriculture and Land use Change and Forestry as highest sectoral priority.
6.2 Types of CB for transparency to be considered by Nordic stakeholders
CB support for transparency is split into three types, which can be structured as a menu of options or “work packages” to recipient countries, namely:
- GHG Inventory
- Reporting NDC progress and achievement
- Agriculture and Land use Change and Forestry
The following provides some general insights on the types of capacity-building support identified for each ETF reporting component, to be considered when designing a transparency support programme.
6.2.1 GHG inventory
Institutional arrangements
Institutional arrangements should be formalized by establishing data-sharing protocols or memorandums of understanding with the relevant institutions to facilitate data sharing (UNFCCC CGE, 2019). The institutional arrangements and relevant mandates should be supported by the creation of a legal instrument mandating the preparation of the national GHG inventory and the continuous disclosure of activity data by major GHG emitters to the designated entity responsible for the national GHG inventory (UNFCCC CGE, 2019). This will contribute to making the process more sustainable (PATPA, 2019). The involvement of the national statistical agencies can assist the inventory preparation process and the cross-fertilisation of capacities between the institutions. The creation of a coordination mechanism, such as a working group comprising key ministries, is key to improving the quality of the national GHG inventory and the efficiency of the data collection process (UNFCCC CGE, 2019). It is important to consider and explore ways of engaging more national experts in the capacity-building initiatives, instead of contracting consultants to lead the national GHG inventory process, in order to prevent the loss of knowledge and expertise of temporarily employed consultants. The establishment of a dedicated team or unit in key institutions serving as the focal point for data sharing and management can improve data collection and address the issue of data loss resulting from staff turnover (UNFCCC CGE, 2019). The Zambia interview delegate stressed the importance of building up a robust and sustainable system for reporting and inventories, which will require Ministries, Research Institutes and Universities to boost the number of employees and the appropriate training for the staff. Zambia would like to implement this approach.
Methodologies
Capacity building is needed in the understanding and application of the 2006 IPCC Guidelines for National Greenhouse Gas Inventories and IPCC inventory software, and for identifying appropriate and consistent methods for estimating emissions, to ensure a reliable and consistent time series (UNFCCC CGE, 2019). Countries have also expressed the need to establish national emission factors to ensure more accuracy in the estimation of national emissions from key sectors (UNFCCC CGE, 2019). Basic training on how to do GHG inventories would be highly useful in LDCs and SIDS that have not yet submitted a BUR, while countries with more experience could benefit from advanced training on GHG inventories (PATPA, 2019).
Data collection and management and procedures
When providing support for GHG inventory improvements, the establishment of national
GHG inventory data management systems are central. The systems should also function as an archive and make accessible to the relevant stakeholders the background data and information, procedures and steps undertaken, assumptions made, and functions performed by key stakeholders (UNFCCC CGE, 2019). When providing data to the system, users should be enabled to document the steps in the data collection process to help maintain institutional memory and create a basis for a larger data depository (UNFCCC CGE, 2019). There is a need to improve the data collection system, storing of data and QA/QC procedures in LDCs and SIDS.
6.2.2 Reporting NDC progress and achievement
National Arrangements
The capacity-building support should aim to develop in-house expertise and arrangements to make the process sustainable (PATPA, 2019). The strengthening of coordination with enforcement entities, including ministries and other stakeholders at different governance levels, can facilitate data collection and use of policy instruments (UNFCCC CGE, 2019). There is a need to develop or strengthen a mechanism for tracking and verifying GHG emission reductions resulting from various mitigation actions across all sectors (UNFCCC CGE, 2019). This system should build upon the lessons learned and existing mechanisms in the GHG inventory process. There needs to be institutional arrangements in place to properly identify and prioritise adaptation actions, which are included in almost all NDCs from LDCs (IIED, 2019). These arrangements can build on the NDC process but also expand on stakeholder participation to allow for adaptation of relevant participation. Aiming for continuous reporting will contribute to enhancing the technical capacity of experts and institutions (UNFCCC CGE, 2019).
Methodologies
The inclusion of sustainable development co-benefits in assessing mitigation actions provides more comprehensive mitigation assessments and makes mitigation measures more attractive for policymakers (UNFCCC CGE, 2019), which can contribute to an increased ambition in the NDCs. There is a need to identify and apply appropriate methodologies and progress indicators, to track the progress and quantify the effects of NDC actions (UNFCCC CGE, 2019), especially for countries that use qualitative targets in their NDC -- particularly frequent for LDCs (IIED, 2019). Work on climate impacts and adaptions should strive to build upon capacities built through models, estimates and analyses from previous NCs (UNFCCC CGE, 2019). There will be cases where appropriate and practical methodologies and tools for vulnerability and adaptation assessment, climate modelling and projections will have to be identified (UNFCCC CGE, 2019).
Data collection and management and procedures
For future mitigation assessments it could be important and supportive, if progress indicators are developed. The progress indicators can be set-up for future mitigation assessments, but it should also be possible to explore, whether the indicators can be used for already gathered data. Building on existing data collection processes can facilitate NDC reporting and support clear reporting with indicators. Strengthening the network of meteorological stations and observation systems can assist in improving data availability. There is a need to develop or upgrade the technology infrastructure to enhance the quality of observational and meteorological data (UNFCCC CGE, 2019).
6.2.3 Agriculture and land use change and forestry
The agriculture, land use change and forestry sectors are characterised by having both an adaptation and mitigation component. This combination could be attractive for any potential support programme. Below is a list of ideas of high priorities identified from various sources.
National Arrangements
Improved national LULUCF MRV in terms of implementation of the principles of accuracy, completeness, transparency and comparability in accordance with the IPCC Good Practice Guidance for LULUCF. The setting-up of the national LULUCF MRV should be done in conjunction with other priority sectors in LDCs and SIDS.
Methodologies
Adaptation has attracted less attention for methodology development to enable good monitoring and reporting. Therefore, there is a need for further development of methodologies and approaches for assessing adaptation, adaptation co-benefits and resilience to be part of systematic monitoring and reporting. The methodologies and processes for measuring and monitoring mitigation co-benefits of adaptation are relatively well defined under the UNFCCC national communications, national inventories, and biennial update reports compared to adaptation. Consequently, further development of methods and approaches for assessing adaptation, adaptation co-benefits and resilience are recommended. As an example, carbon stock is the amount of carbon that has been sequestered from the atmosphere and is now stored within the ecosystem. It has a huge global impact and there is no agreed methodology. Therefore a common method for estimating the carbon stock in LDCs and SIDS could have a big impact. Developing synergies with existing agricultural databases and information systems are also mentioned as an area with potentially substantial impact.
Data collection and management and procedures:
Support for the digitalisation of agriculture by promoting the application of digital tools in LDCs and SIDS to enable more effective implementation and measurement of results from climate actions in the agricultural sector could be a priority. Agriculture has been behind other sectors in the development and implementation of digital tools. Digital tools are good for transparency reporting and go well with, for instance, real-time farmer decision support systems, more effective and accurate measurement of results, as well as commercial action in the market, like buying and selling of products. The forestry sector can also benefit from digital tools, especially to document more precisely the actual situation, which is important in the national reporting to the UNFCCC. In both the agricultural and forestry sectors in LDCs and SIDS, there is a need to improve the data collection system, data storing and QA/QC procedures.
6.3 International transparency initiatives
Table 12, below, presents how potential international support initiatives could be expanded to support the priority areas identified, based on the analyses in Chapter 5.
For the priority areas Inventory; NDC progress and achievement; and Agriculture and Land use Change and Forestry, the scoring is based on whether the topic has been included in the initiative. The initiatives are very different. For instance, one is a platform for exchange of information; another is built to facilitate potential grant support. The scoring is based on whether the initiative is suitable to administer funding used for capacity building in LDCs and SIDS. In the event that the Nordic countries would like to support an initiative, it is also important that they can influence how the funding is used. It is a sensitive parameter, as this can be interpreted differently. It is included in the scoring, as it is an attention point for potential future support.
The higher the score, the better the fit between the activities of the initiatives and the priority areas. High scoring = 3, Medium scoring = 2 and Low scoring =1.
Table 12: Scoring of international initiatives to support CB for transparency for LDCs and SIDS
| Inventory LDC | NDC progress and achievement LDC and SIDS | Agriculture and Land use Change and Forestry | Potential influence by Nordic donor | Score | Rationale and comments | |
| CBIT | 3 | 3 | 2 | 1 | 9 | The focus is transparency and the main priorities can be supported. It can be difficult to influence how the potential support shall be administered. |
| ICAT | 3 | 3 | 2 | 2 | 10 | The focus is transparency and the main priority can be supported. It seems that Nordic countries could have significant influence on prioritisation of the funding. |
| CCMRVH | 3 | 3 | 2 | 1 | 9 | The focus is transparency and the main priorities can be supported. A weak point is that it only covers the Caribbean. |
| GSP | 2 | 2 | 2 | 1 | 7 | The activities can cover transparency, but it is not the main focus. |
| PATPA | 3 | 3 | 2 | 1 | 9 | The focus is transparency and the main priorities can be supported. |
| GEF EA | 2 | 2 | 2 | 1 | 7 | The activities cover transparency, as one element for the support to the UNFCCC reporting. |
| GGGI | 2 | 2 | 2 | 2 | 8 | The activities can cover transparency, but it is not the main focus. GGGI is already executing bilateral Nordic support. |
| CGE | 3 | 3 | 2 | 1 | 8 | The focus is transparency and the main priorities can be supported. |
Source: Own analysis
For all the initiatives, it seems like the priority area 'Agriculture and Land use Change and Forestry' could be included, although it is not a focus area in the description of most of the initiatives. All the initiatives are expected to potentially cover 'Agriculture and Land use Change and Forestry', hence they all have the same scoring for this. In general, all the initiatives have a high score, as they are pre-selected as relevant for transparency activities.
ICAT provides country-driven support. Nordic countries could provide funding through ICAT, and influence the choice of countries to support with the additional funds provided. The volume of support is much smaller than CBIT, but support is targeted to address countries' main gaps and needs. ICAT also provides more flexible and swifter support and administrative procedures. Current implementation approaches provide a competitive process, where Nordic countries' specific expertise and tools have a high priority of being selected for capacity development.
CBIT is now mainstreamed into the GEF Trust Fund and is fully integrated into the GEF-7 cycle (2018–2022) with a funding of USD 55 million. When the GEF-8 replenishment negotiations start, the Nordic countries may influence funding priorities through the Council. CBIT prioritises LDCs and SIDS. However, as GEF delivers through its accredited agencies, the Nordic countries have little direct control over the process or potential use of their specific expertise and tools.
GSP will finish in 2020 but will transfer into a new GEF-funded programme and will merge with the CBIT Global Coordination Platform.
If the Nordic countries opt for providing transparency support through CCMRVH, it will only cover few LDCs and SIDS, and the support will be given through already existing set-up.
Based on the above information, it is recommended that ICAT be explored as the highest priority in case the Nordic countries would like to give support through the international support initiatives. It should be noted that all the initiatives support transparency as their key objective.
6.4 Nordic supported initiatives
Table 13, below, presents the potential international programmes with Nordic support and the priority areas, based on the analyses in Chapter 5.
The higher the score, the better the fit between the activities in the programmes and the priority areas. High scoring = 3, Medium scoring = 2 and Low scoring =1.
Table 13: Scoring of Nordic initiatives to support CB for transparency to LDCS and SIDS
| Programme | Inventory LDC | NDC progress and achievement LDC and SIDS | Agriculture and Land use Change and Forestry | Score | Rationale and comments |
| 2050 Pathways Platform | 1 | 1 | 2 | 4 | Limited attention to Inventory and NDC progress. |
| Biofuture Platform | 1 | 1 | 1 | 3 | Limited attention to Inventory and NDC progress. |
| Clean Cooking Alliance | 1 | 1 | 1 | 3 | Limited attention to Inventory and NDC progress. |
| Danish Energy Partnership Programme | 1 | 1 | 1 | 3 | Limited attention to Inventory and NDC progress. |
| Global Alliance for Buildings and Construction (ABC) | 1 | 1 | 1 | 3 | Limited attention to Inventory and NDC progress. |
| Norway's International Climate and Forest Initiative | 3 | 3 | 3 | 9 | The programme is suitable as it could cover the high priority transparency tasks.Supplementary forest is one of the priority areas for LDC/SIDS. |
| P4G - Partnering for Green Growth and the Global Goals 2030 | 1 | 1 | 1 | 3 | Limited attention to Inventory and NDC progress. |
| Strengthened institutions for a sustainable climate – A global capacity building programme | 3 | 3 | 2 | 8 | The programme is suitable as it covers the high priority transparency tasks and supplementary forest is one of the priority areas. |
| The “4 per 1000” Initiative | 1 | 2 | 3 | 6 | The attention is not transparency, but it can be covered. The focus is the agricultural sector. |
| The advanced international training programme Climate Change - Mitigation and Adaptation | 1 | 1 | 2 | 4 | Limited attention to Inventory and NDC progress. |
| The Global Research Alliance on Agricultural Greenhouse Gases | 1 | 1 | 3 | 5 | Limited attention to Inventory and NDC progress. |
Source: Own analysis
The three initiatives with the highest potential for being aligned with the priorities of the LDCs and SIDS are (shown by the green colour in the table above):
- Norway's International Climate and Forest Initiative;
- Strengthened institutions for a sustainable climate – A global capacity building programme;
- The “4 per 1000” Initiative.
Norway's International Climate and Forest Initiative is one programme. However it does have several different strands focusing on different aspects of deforestation and forest degradation (bilateral partnerships, multilateral channels, private sector cooperation etc). The Norway's International Climate and Forest Initiative has partnership agreements with the following five LDCs or SIDS: Guyana, Ethiopia, Liberia, Tanzania and DR Congo. From Table 6 it can be observed that both Ethiopia and Tanzania have the most Nordic climate-related project support. Guyana, Liberia and DR Congo are in the second highest category with Nordic climate-related project support out of four categories.
Strengthened institutions for a sustainable climate – A global capacity-building programme that supports the following three LDCs: Ethiopia, Mozambique and Uganda. These three countries are in the category with the most Nordic climate-related project support.
The “4 per 1000” initiative has two LDCs. Cambodia and Senegal are part of the consortium of this initiative. Cambodia is in the second highest category with Nordic climate-related project and Senegal is in the third, out of four, category.
6.5 Nordic direct bilateral cooperation and through NDF/NEFCO
The purpose of this section is to explore, whether bilateral cooperation and the NDF/NEFCO are suitable for being part of transparency capacity building activities.
It is an overall assessment, as the Nordic countries are presented as one group, though each country has its own profile for bilateral cooperation. This is also the case for NDF and NEFCO, as each fund has its own characteristics. For both the bilateral cooperation and the NDF and NEFCO, the individual deviations are considered minor compared to the overall grouping. Table 14, below, presents the potential suitability for bilateral cooperation and through the NDF and NEFCO for the three priority areas identified in Chapter 5.
For the priority areas Inventory; NDC progress and achievement; and Agriculture and Land use Change and Forestry, the scoring is based on whether the topic has been included in former or ongoing bilateral programmes or through the Nordic Funds.
Table 14: Scoring of Nordic bilateral cooperation and funds to support CB for transparency to LDCs and SIDS
| Inventory LDC | NDC progress and achievement LDC and SIDS | Agriculture and Land use Change and Forestry | Score | Rationale | |
| Nordic countries | 2 | 1 | 3 | 6 | The Nordic countries have significant experience with agricultural, land use change and forestry through decades of bilateral cooperation. Inventory support has been part of several projects. NDC progress is still a new topic, so limited activities have been initiated. |
| NDF and NEFCO | 1 | 1 | 1 | 3 | Both NDF and NEFCO have limited experience with the three proposed priority areas. |
Source: Own analysis
All the Nordic countries have experience in bilateral cooperation with SIDS/LDCs with capacity building in the climate space and many have inventory and reporting as tasks as part of the biltaral projects. Nordic countries also have 'Agriculture and Land use Change and Forestry' as part of the bilateral cooperation. It has not been the purpose of this assignment to do an in-depth analysis of the Nordic programmes. Overall, it seems that the Nordic countries could adapt the bilateral programmes so that they fit to the priorities identified for the LDCs and SIDS in relation to transparency support. Bilateral programmes can have the advantage of being easier to directly involve the ETF negotiators under the UNFCCC from the Nordic countries, to support the preparation and implementation of the programmes.
Both NEFCO and NDF do not have significant experience in implementing inventory, NDC reporting and projects within ‘Agriculture and Land use Change and Forestry’. NDF is supporting few projects within this area, but mainly as additional funding through other projects.
In case the Nordic countries would like to explore developing ETF support through the Nordic Funds, the ongoing NEFCO project for cooperative approaches under Article 6 of the Paris Agreement could be considered and extended in scope.
6.6 Consultations
To collect stakeholder views and feedback, the decision was made to consult with the programmes that have the best alignment with priorities proposed by SIDS and LDCs. On 31 January 2020 the following initiatives and institutions were invited to share their views, with a deadline of 4 February 2020:
- ICAT
- CBIT
- Norway's International Climate and Forest Initiative
- Strengthened institutions for a sustainable climate – A global capacity building programme
- The “4 per 1000” Initiative
- NEFCO
Views regarding bilateral cooperation were not requested during the consultation, as the draft final report is being commented on by country representatives in the NKL Steering Group.
ICAT has commented that only half of ICAT countries are LDCs and/or SIDS. A specific analysis of gaps and needs for this group of countries has not been done. The ICAT initiative focuses on the establishment of MRV/transparency systems in countries with a focus on tracking mitigation policies and actions in the context of NDC implementation. Most of the work done under ICAT is related to “The ETF reporting component NDC progress and achievement”. Some countries have, however, identified activities under ICAT focusing explicitly on GHG inventory. In general, country activities related to inventories are considered in the broader context of the ETF. For example, some countries are working on improving GHG data inventories but it is usually in the context of the broader ETF. A few countries have asked for support regarding GHG inventory methodologies, including Peru and Dominican Republic -- but only as a minor activity in their work plans. In terms of sectors, Agriculture and Forestry were not the most targeted sectors under ICAT. Under ICAT, cross-sectoral and energy-related activities are the most common, followed by transport and waste.
CBIT was not available to respond within the consultation period, however, in their progress report to GEF (November 2019), the following priorities for CB support to transparency were reported: Overall, the project activities proposed by LDCs and SIDS are similar to the overall portfolio for all countries (as shown in Appendix 3, Figure 1). However, there are some differences in the proportion of countries prioritizing certain activities, namely: 1) GHG inventory data collection and management tools, and overall GHG inventory improvements, 2) tracking climate finance, and 3) NDC transparency and policy design.
Norway's International Climate and Forest Initiative responded that they are already working on transparency issues related to forests and land use, forest policies, land ownership, etc. The initiative works in bilateral partnerships with countries, as well as through multilateral institutions such as the FAO and the World Bank. For further information see https://www.regjeringen.no/no/tema/klima-og-miljo/klima/klima--og-skogsatsingen/id2000712/ and http://www.fao.org/gfoi/activities.
SIDA commented that for the Strengthened institutions for a sustainable climate – A global capacity building programme, they have identified the same priorities and are working with them, both the GHG Inventory and the ETF reporting component NDC progress and achievement. It has been noted that gaps in the energy and transport sectors have also been identified by the programme.
NEFCO responded that it could be useful to add a transparency component of the existing crediting schemes related to Article 6 of the Paris Agreement.
These consultations were held over a short period with limited response. However, the feedback confirms that the identified priorities are already considered for support to SIDS and LDCs.
7. CONCLUSIONS
On the basis of previous chapters’ overview and analysis of ongoing CB efforts to implement the ETF to meet LDCs and SIDS needs and gaps for support, the study finds that the Nordic countries have good opportunities to further promote effective ETF activities in line with country priorities through:
- A focus on 12 target countries[1]Excluding countries with a fragile political situation, high income SIDS not eligible for ODA and countries that are expected to graduate away from LDC status shortly.: Djibouti, Guyana, Mali, Myanmar, Nauru, Niue, Nepal, Niger, Palau, Suriname, Timor-Leste and Zambia.
- A focus on LDC and SIDS high priority ETF reporting components: 1) GHG inventory and 2) NDC progress and achievement. Capacity-building needs covering: 1) institutional arrangements, 2) methodologies, and 3) data collection, management and procedures. Both LDCs and SIDS identify agriculture and land use change and forestry as the highest sectoral priority.
- Adding a component to ongoing Nordic or bilateral programs for implementation of country-specific CB needs for MRV/transparency, for instance through: 1) Norway's International Climate and Forest Initiative, 2) Strengthened institutions for a sustainable climate, 3) '4 per 1000' Initiative, and 4) the NEFCO program.
- New CB activities added to ongoing international support initiatives, for instance through ICAT, but more initiatives could be supported.
In the context of enhanced transparency requirements and the limited funding available by existing international CB initiatives, there is an urgent need for further CB support to LDCs and SIDS before the ETF enters into force by December 2024. The need for CB support to implement the ETF is emphasized by the status of UNFCCC negotiations to finalize details of the ETF 'rulebook' towards a conclusion by COP26 (postponed to 2021 due to Covid-19). An overall recommendation for Nordic support is to fast-track design of additional or new CB programs by building on existing international and Nordic initiatives tailored to country-specific needs and gaps, to meet ETF requirements in line with national priorities.
Footnotes
- ^ Excluding countries with a fragile political situation, high income SIDS not eligible for ODA and countries that are expected to graduate away from LDC status shortly.
REFERENCES
CBIT, 2019: Capacity-building Initiative for Transparency, available at: https://www.thegef.org/topics/capacity-building-initiative-transparency-cbit
CCMRVH, 2019: Caribbean Cooperative MRV Hub, available at: https://ghginstitute.org/2018/08/27/caribbean-cooperative-mrv-hub-ccmrvh/
Dagnet, Y., Cogswell, N., Bird, N., Bouyé, M., Rocha, M., 2019: Building capacity for the Paris Agreement’s enhanced transparency framework: What can we learn from countries’ experiences and UNFCCC processes?, Project for Advancing Climate Transparency, World Resource Institute working paper
GEF, 2019: GEF Enabling activities, available at: https://www.thegef.org/project/enabling- activities-preparation-initial-communication
GEF, 2019: Progress report on the Capacity-Building Initiative for Transparency, Global Environment Facility 57th GEF Council Meeting, December 17-19, 2019, Washington, D.CWashington, D.C., available at: https://www.thegef.org/sites/default/files/council-meeting-documents/EN_GEF.C.57.Inf_.06_Progress%20Report%20on%20the%20CBIT.pdf
Government of Guyana, 2012: Guyana Second National Communication to the United Nations Framework Convention on Climate Change
Government of Nepal, 2014: Nepal Second National Communication to the United Nations Framework Convention on Climate Change, Ministry of Science, Technology and Environment
GGGI, 2019: MRV Program by the Global Green Growth Institute, available at: https://gggi.org/tag/mrv/
ICAT, 2019: Initiative for Climate Action Transparency, available at: https://climateactiontransparency.org/
ICAT Introductory Guide, 2019: Introductory Guide - Overview of the ICAT series of guidance documents, 34 June 2019, Initiative for Climate Action Transparency
IIED, 2019: Meeting the enhanced transparency framework: what next for the LDCs? International Institute for Environment and Development, Policy and planning; Climate change Briefing, October 2019
OECD DAC data, 2019: Climate Change: OECD DAC External Development Finance Statistics, http://www.oecd.org/dac/financing-sustainable-development/development-finance- topics/climate-change.htm
OECD DAC, 2020: DAC List of ODA Recipients for reporting on aid in 2020. OECD DAC List of ODA Recipients, https://www.oecd.org/dac/financing-sustainable-development/development-finance-standards/daclist.htm
Paris Equity Check, 2020: http://paris-equity-check.org/the-science.html
PATPA, 2019: Partnership for Transparency in the Paris Agreement, https://www.transparency- partnership.net/
PATPA, 2019: COP24: Implications for capacity building for transparency in developing countries, Partnership on Transparency in the Paris Agreement, News 29.04.2019, https://www.transparency-partnership.net/news/cop24-implications-capacity-building-transparency-developing-countries
Republic of Fiji, 2014: Second National Communication to the United Nations Framework Convention on Climate Change
Martinez, G. S., Maier, S. C., Farias, F. E., Kapijimpanga, D. R., Desgain, D. D., Cardoso, A., Staun, F., 2019: Implementing the enhanced transparency framework: early insights from the capacity building initiative for transparency. UNEP DTU working paper series 2019: 1.
UNEP DTU Partnership, 2019: Unfolding the reporting requirements for Developing Countries under the Paris Agreement’s Enhanced Transparency Framework
UNEP/UNDP GSP, 2019: Global Support Programme, http://www.un-gsp.org/
UNFCCC Decision 1/CP.21, 2016: Decision 1/CP.21 Adoption of the Paris Agreement
UNFCCC, 2019: Biennial Report Submissions by Annex I Parties, https://unfccc.int/process-and- meetings/transparency-and-reporting/reporting-and-review-under-the-convention/national- communications-and-biennial-reports-annex-i-parties/third-biennial-reports-annex-i
UNFCCC, 2019: Problems, constraints and lessons learned as well as capacity-building needs for the preparation of national communications and biennial update reports. Technical paper by the Consultative Group of Experts, https://unfccc.int/documents/200999
UNFCCC, 2019: Problems, constraints and lessons learned as well as capacity-building needs for the preparation of national communications and biennial update reports, Technical paper by the Consultative Group of Experts, 24 October 2019
UNFCCC CGE, 2019: Consultative Group of Experts, available at: https://unfccc.int/CGE
Zambian Ministry of Lands, Natural Resources and Environmental Protection, 2014: Second National Communication to the United Nations Framework Convention on Climate Change (UNFCCC)
APPENDIX 1 - LIST OF INFORMATION TO BE REPORTED IN THE BTR WHERE FLEXIBILITY CAN BE APPLIED
When reporting information in the BTR, developing country Parties have the flexibility to provide less information. Flexibility cannot be applied to all categories of information, and in some cases the MPGs request information through “should” and “may” formulations, so the flexibility provision does not need to be applied, and information can be omitted without having to explain in which area, why and how. The tables below list the information requested for the BTR. Flexibility provisions are highlighted in 'bold', while information that is 'should', 'may' and 'encouraged' to be provided is marked in 'italic'.
Table 15: Information to be provided in the NIR
| Category of information | BN BN NIR (part of BTR or stand alone) |
| Reporting form | - National Inventory Document (NID) - Common Reporting Tables (CRT) |
| Submission requirements | - Each Party shall provide a national inventory report |
| IPCC guidelines | - Use IPCC Guidelines 2006, and any subsequent version or refinement |
| Key categories | - Identify key categories with threshold at 95% (85% if flexibility is needed) - Provide individual and cumulative percentage contributions per category - For each category, both level and trend shall be reported at least for first and last reporting year of the time series |
| Gases | - CO2, CH4, N2O, HFCs, PFCs, SF6 and NF3 (flexibility to report at least CO2, CH4, N2O, and any additional gas of the following, HFCs, PFCs, SF6 and NF3) - CO, NMVOCs, SOx, NOx, indirect CO2 from atmospheric oxidation of CH4, CO and NMVOCs (should) - Use the 100-year time-horizon GWP, provided in the IPCC Fifth Assessment Report, to report aggregate emissions and removals of GHGs, expressed in CO2e |
| Time series | - The latest reporting year shall be no more than 2 years prior to the submission of the NIR (or 3 years prior to the submission if flexibility is needed)
- Time series shall start from 1990 (if flexibility is needed, they should cover as a minimum the reference years for the respective NDC and a consistent annual time series from at least 2020 onwards) |
| Uncertainty | - Uncertainty for all source and sink categories, shall be quantitatively estimated and qualitatively discussed, at least the starting year and the latest reporting year of the inventory time series (qualitative analysis where quantitative data is unavailable if flexibility is needed) |
| Completeness | - Emissions from a category should be considered insignificant if the likely level of emissions is below 0.05% of the national total GHG emissions, excluding LULUCF and 500 kt CO2 eq, whichever is lower. Total national aggregate of estimated emissions for all gases from categories considered insignificant shall remain below 0.1% of the national total GHG emissions, excluding LULUCF. (If flexibility to instead consider emissions insignificant if the likely level of emissions is below 0.1% of the national total GHG emissions, excluding LULUCF, and 1,000 kt CO2 eq, whichever is lower. The total national aggregate of estimated emissions for all gases from categories considered insignificant, in this case, shall remain below 0.2% of the national total GHG emissions, excluding LULUCF) |
| QA/QC | - Each Party shall elaborate an inventory quality assurance/quality control (QA/QC) and provide information on general inventory QC procedures in accordance with the IPCC guidelines. (If flexibility is needed this provision is only encouraged) |
| National circumstances | - Information on national circumstances and institutional arrangements: National entity/focal point, inventory preparation process, archiving of information for reported time series, process for approval of inventory |
Table 16: Information to be provided on national circumstances and institutional arrangements relevant to progress made in implementing and achieving the NDC
| Category of information | BTR requirements |
| National Circumstances, and how they affect GHG emissions and removals over time | Government structure |
| Population profile | |
| Geographical profile | |
| Economic profile | |
| Climate profile | |
| Sector details | |
| Institutional arrangements for domestic implementation, monitoring, reporting, archiving of information and stakeholder engagement related to the implementation and achievement of the NDC | Legal arrangements |
| Institutional arrangements | |
| Administrative arrangements | |
| Procedural arrangements | |
| Arrangements for tracking ITMO | |
| Changes in institutional arrangements |
Table 17: Information to be provided on the NDC and to track its progress on implementation and achievement
| Category of information | BTR requirements |
| Description of NDC target | Target |
| Target year(s) or period(s), and whether they are single-year or multi-year target(s) | |
| Reference point(s), level(s), baseline(s), base year(s) or starting point(s), and their respective value(s) | |
| Time frame(s) and/or periods for implementation | |
| Scope and coverage, including, as relevant, sectors, categories, activities, sources and sinks, pools and gases | |
| Intention to use cooperative approaches that involve the use of ITMOs towards NDC | |
| Any updates or clarifications of previously reported information | |
| Indicator(s) to track NDC progress | Describe, for each indicator how it is related to the target |
| Provide the information/value for each indicator for the reference point(s), level(s), baseline(s), base year(s) or starting point(s), and update the information with any recalculation of the GHG inventory | |
| Provide the most recent information for each indicator for each reporting year during the implementation period of the NDC | |
| Compare the most recent information for each selected indicator to track progress made in implementing the NDC | |
| Describe each methodology and/or accounting approach used for target(s), the construction of baselines and each indicator identified | Key parameters, assumptions, definitions, data sources and models used |
| IPCC guidelines used | |
| Metrics used | |
| Any sector, category or activity-specific assumptions, methodologies and approaches consistent with IPCC guidance | |
| Methodologies used to estimate mitigation co-benefits of adaptation actions and/or economic diversification plans | |
| Methodologies associated with any cooperative approaches that involve the use of ITMOs | |
| Methodologies used to track progress arising from the implementation of policies and measures | |
| Any other methodologies related to the NDC, and conditions and assumptions relevant to the achievement of the NDCs | |
| How the methodology in each reporting year is consistent with the methodology or methodologies used when communicating the NDC | |
| Methodological inconsistencies with the Party’s most recent NIR, if applicable | |
| How double counting of net GHG emission reductions has been avoided |
Table 18: Information to be provided on mitigation policies and measures, actions and plans, including those with mitigation co-benefits resulting from adaptation actions and economic diversification plans, related to implementing and achieving the NDC
| Category of information | BTR requirements |
| Information on actions, policies and measures (tabular format in BTR) | Name |
| Description | |
| Objectives | |
| Type of instrument (regulatory, economic instrument or other) | |
| Status (planned, adopted or implemented) | |
| Sector(s) affected | |
| Gases affected | |
| Start year of implementation | |
| Implementing entity or entities | |
| Estimates of expected and achieved GHG emissions reductions (encouraged, if flexibility is needed) | |
| Costs (may) | |
| Non-GHG mitigation benefits (may) | |
| How the mitigation actions interact with each other (may report) | |
| Information on actions, policies and measures (in narrative format or annex to the BTR) | Methodologies and assumptions used to estimate the GHG emissions reductions or removals by each action, policy and measure |
| Those actions, policies and measures that are no longer in place compared with the most recent BTR, and why they are no longer in place (should report) | |
| Actions, policies and measures that influence GHG emissions from international transport (should report) | |
| How the actions, policies and measures are modifying longer- term trends in GHG emissions and removals (should report) | |
| Assessment of economic and social impacts of response measures (encouraged to provide detailed information) | |
| Adaptation actions and/or economic diversification plans resulting in mitigation co-benefits | Sectors and activities associated with response measures |
| Social and economic consequences from the response measures action | |
| Challenges and barriers to address the consequences | |
| Actions to address the consequences |
Table 19: Information to be provided on projections of greenhouse gas emissions and removals (Flexibility for developing countries on the whole category of GHG projections)
| Category of information | BTR requirements |
| Time coverage | From the latest NIR, and covering at least 15 years beyond the next year ending in zero or five. (Extend their projections at least to the end point of their NDC, if flexibility is needed) |
| Time coverage with flexibility | At least to the end point of the NDC |
| Structure (flexibility to report less detailed information) | Graphical and tabular formats |
| On a sectoral basis and by gas, as well as for the national total | |
| With and without LULUCF | |
| ‘With measures’ projection | |
| ‘With additional measures’ projection and ‘without measures’ projection, if relevant | |
| Presented relative to actual inventory data for the preceding years | |
| NDC Indicators | Projections of key indicators to determine progress towards its NDC are also to be provided |
| Methodologies | Models and/or approaches used and key underlying assumptions and parameters used for projections (e.g. gross domestic product growth rate/level, population growth rate/level) |
| Changes in the methodology since the most recent BTR | |
| Assumptions on policies and measures included in the ‘with measures’ projection and ‘with additional measures’ projection, if included | |
| Sensitivity analysis for any of the projections, together with a brief explanation of the methodologies and parameters used |
Table 20: Information related to climate change impacts and adaptation (Should provision, not mandatory and flexibility not needed)
| Category of information | BTR Requirements |
| National circumstances, institutional arrangements and legal frameworks relevant for adaptation | Institutional arrangements and governance, for assessing and addressing impacts of climate change |
| Legal and policy frameworks and regulations | |
| Biogeophysical characteristics | |
| Demographics | |
| Economy | |
| Infrastructure | |
| Information on adaptive capacity | |
| (Should) | |
| Impacts, risks and vulnerabilities | Current and projected climate trends and hazards (Should) |
| Observed and potential impacts of climate change, including sectoral, economic, social and/or environmental vulnerabilities (Should) | |
| Approaches, methodologies and tools used, and associated uncertainties and challenges (Should) | |
| Adaptation priorities and barriers | Domestic priorities and progress towards these priorities |
| Adaptation challenges and gaps and barriers to adaptation (Should) | |
| Adaptation strategies, policies, plans, goals and actions to integrate adaptation into national policies and strategies | Implementation of adaptation actions in accordance with the global goal for adaptation (Should) |
| Adaptation goals, actions, objectives, undertakings, efforts, plans, strategies, policies, programmes and efforts to build resilience (Should) | |
| How best available science, gender perspectives and indigenous, traditional and local knowledge are integrated into adaptation (Should) | |
| Development priorities related to climate change adaptation and impacts (Should) | |
| Adaptation actions and/or economic diversification plans leading to mitigation co-benefits (Should) | |
| Efforts to integrate climate change into development efforts, plans, policies and programming, including related capacity-building activities (Should) | |
| Nature-based solutions to climate change adaptation (Should) | |
| Stakeholder involvement (Should) | |
| Progress on implementation of adaptation | Implementation of the actions identified (Should) |
| Steps taken to formulate, implement, publish and update national and regional programmes; strategies and measures, policy frameworks and other relevant information (Should) | |
| Implementation of adaptation actions identified in current and past adaptation communications, including efforts towards meeting adaptation needs (Should) | |
| Implementation of adaptation actions identified in the adaptation component of NDCs (Should) | |
| Coordination activities and changes in regulation, policies and planning (Should) | |
| Information on implementation of supported adaptation actions, and the effectiveness of already implemented adaptation measures (May) | |
| Monitoring and evaluation of adaptation actions and processes | Approaches and systems for monitoring and evaluation (Should) |
| Achievements, impacts, resilience, review, effectiveness and results (Should) | |
| Approaches and systems used, and their outputs (Should) | |
| Assessment of, and indicators for, how adaptation increased resilience and reduced impacts; when adaptation is not sufficient to avert impacts; and how effective implemented adaptation measures are (Should) | |
| Implementation on transparency of planning and implementation; how support programmes meet specific vulnerabilities and adaptation needs; how adaptation actions influence other development goals; and good practices, experience and lessons learned from policy and regulatory changes, actions and coordination mechanisms (Should) | |
| Information related to the effectiveness and sustainability of adaptation actions, including ownership, stakeholder engagement, alignment of adaptation actions to national and sub-national policies, and replicability; and the results of adaptation actions and the sustainability of those results (Should) | |
| Information related to averting, minimizing and addressing loss and damage associated with climate change impacts | Observed and potential climate change impacts, including those related to extreme weather events and slow onset events, drawing upon the best available science (Should) |
| Activities related to averting, minimizing and addressing loss and damage associated with the adverse effects of climate change (Should) | |
| Institutional arrangements to facilitate the implementation of activities related to averting, minimizing and addressing loss and damage (Should) | |
| Cooperation, good practices, experience and lessons learned | Science, planning and policies (Should) |
| Policy, innovation and pilot/demonstration projects (Should) | |
| Integration of adaptation actions into planning at different levels (Should) | |
| Cooperation to share information and to strengthen science, institutions and adaptation (Should) | |
| Area, scale and types of cooperation and good practices (Should) | |
| Improving durability and effectiveness of adaptation actions (Should) | |
| Helping developing countries identify effective adaptation practices, needs, priorities, and challenges and gaps, in such a way that is consistent with encouraging good practices (Should) | |
| Strengthening scientific research and knowledge related to climate, including research and systematic observation and early warning systems; vulnerability and adaptation; and monitoring and evaluation (Should) |
Table 21: Information to report on support needed and received, in common tabular format (Should provision, flexibility not needed)
| FN | FR | TDTN | TDTR | CBN | CBR | ST | |
| Title | X | X | X | X | X | X | X |
| Programme/project description | X | X | X | X | X | X | X |
| Channel | X | X | |||||
| Recipient Entity | X | X | X | X | |||
| Implementing entity | X | X | X | ||||
| Type of technology | X | X | |||||
| Estimated or actual amount (domestic currency and USD) | X | X | X | ||||
| Expected or actual time frame | X | X | X | X | X | X | X |
| Expected or utilized financial instrument (e.g. grant, concessional/non- concessional loan, equity, guarantee) | X | X | |||||
| Status (committed or received) | X | ||||||
| Type of support (mitigation, adaptation or cross-cutting) | X | X | X | X | X | X | |
| Sector and subsector | X | X | X | X | |||
| Whether the activity will contribute to technology development and transfer and/or capacity building | X | X | |||||
| Status of activity (planned, ongoing or completed) | X | X | X | X | |||
| Whether the activity is anchored in a national strategy and/or an NDC | X | ||||||
| Expected and achieved use, impact and estimated results | X | X | X | X | X | X | X |
FN= Financial support needed; FR= financial support received; TDTN= technology development and transfer support needed; TDTR= Technology development and transfer support received; CBN= Capacity-building support needed; CBR= Capacity-building support received; ST= Support needed and received for the implementation of Article 13 of the PA and transparency activities.
Table 22: Information to report on support needed and received (Should provision, flexibility not needed)
| Information to report | BTR requirements |
| National circumstances, institutional arrangements and country-driven strategies | The systems and processes used to identify, track and report support needed and received |
| A description of the challenges and limitations to identify, track and report support needed and received | |
| Information on country priorities and strategies, and on any aspects of the Party's NDC under Article 4 of the Paris Agreement that need support | |
| Underlying assumptions, definitions and methodologies used to: | a) Convert domestic currency into USD; |
| b) Estimate the amount of support needed; | |
| c) Determine the reporting year or time frame; | |
| d) Identify support as coming from specific sources; | |
| e) Determine support as committed, received or needed; | |
| f) Identify and report status of the supported activity (planned, ongoing or completed); | |
| g) Identify and report the channel (bilateral, regional or multilateral); | |
| h) Identify and report the type of support (mitigation, adaptation or cross-cutting); | |
| i) Identify and report the financial instrument (grant, concessional loan, non-concessional loan, equity, guarantee or other); | |
| j) Identify and report sectors and subsectors; | |
| k) Report on the use, impact and estimated results of the support needed and received; | |
| l) Identify and report support as contributing to technology development and transfer and capacity building; | |
| m) Avoid double counting in reporting information on support needed and received for the implementation of Article 13 of the Paris Agreement and transparency-related activities, including for transparency-related capacity building, when reporting such information separately from other information on support needed and received. | |
| Information on financial support needed, including information requested in Table 21 | Sectors for which the Party wishes to attract international finance, including existing barriers to attracting international finance |
| Description of how the support will contribute to its NDC and to the long-term goals of the Paris Agreement | |
| Information on financial support received | Information requested in Table 21 |
| Information on technology development and transfer | Plans, needs and priorities related to technology development and transfer, including those identified in Technology Needs Assessments, where applicable |
| Support needed, including information requested in Table 21 | Technology development and transfer-related needs for the enhancement of endogenous capacities and technologies |
| Information on technology development and transfer support received, including information requested in Table 21 | Case studies, including key success and failure stories |
| How the support contributes to technology development and transfer, endogenous capacities and know-how | |
| The stage of the technology cycle supported, including research and development, demonstration, deployment, diffusion and transfer of technology | |
| Information on capacity- building support needed, including information requested in Table 21 | The approach a Party seeks to take to enhance capacity-building support |
| Country-specific capacity-building needs, constraints and gaps in communicating those needs, and an explanation of how the capacity-building support needed would improve the provision of such information | |
| Processes for enhancing public awareness, public participation and access to information in relation to capacity building | |
| Information on capacity- building support received, including information requested in Table 21 | Case studies, including key success and failure stories |
| How support received has enhanced a Party’s capacity | |
| Capacity-building support received at the national and, where appropriate, sub-regional and regional level, including priorities, participation and the involvement of stakeholders | |
| Information on support needed and received for the implementation of Article 13 and transparency-related activities, including for transparency-related Capacity building, including information requested in Table 21 | Support needed and received for preparing reports pursuant to Article 13 |
| Support needed and received for addressing the areas for improvement identified by the technical expert review teams |
APPENDIX 2 - OVERVIEW OF INTERNATIONAL TRANSPARENCY SUPPORT INITIATIVES TO LDCS AND SIDS
Table 23: Overview of International transparency support initiatives to LDCs and SIDS
| MODE OF SUPPORT | PROJECT | WORKSHOP/TRAINING/DIALOGUE | ||||||
| Initiative Country | GEF Enabling Activities | CBIT | ICAT | GGGI MRV program | UNDP/UNEP Global Support Programme | PATPA | MRV Hub for the Caribb ean | Consultative Group of Experts |
| Afghanistan | 1 | 1 | 0 | 0 | 0 | 0 | 0 | 1 |
| Angola | 1 | 0 | 0 | 0 | 1 | 1 | 0 | 1 |
| Antigua and Barbuda | ||||||||
| (SIDS) | 1 | 1 | 0 | 0 | 0 | 0 | 1 | 1 |
| Bahamas (SIDS) | 1 | 0 | 0 | 0 | 0 | 0 | 1 | 1 |
| Bahrain (SIDS) | 1 | 0 | 0 | 0 | 0 | 0 | 0 | 1 |
| Bangladesh | 1 | 1 | 0 | 0 | 0 | 1 | 0 | 1 |
| Barbados (SIDS) | 1 | 0 | 0 | 0 | 0 | 0 | 1 | 1 |
| Belize (SIDS) | 1 | 0 | 1 | 0 | 1 | 0 | 1 | 1 |
| Benin | 1 | 1 | 0 | 0 | 1 | 1 | 0 | 1 |
| Bhutan | 1 | 0 | 0 | 0 | 0 | 1 | 0 | 1 |
| Burkina Faso | 1 | 1 | 0 | 1 | 1 | 1 | 0 | 1 |
| Burundi | 1 | 0 | 0 | 0 | 0 | 1 | 0 | 1 |
| Cabo Verde (SIDS) | 1 | 0 | 0 | 0 | 1 | 1 | 0 | 1 |
| Cambodia | 1 | 1 | 1 | 0 | 1 | 1 | 0 | 1 |
| Central African Republic | 1 | 0 | 0 | 0 | 0 | 1 | 0 | 1 |
| Chad | 1 | 0 | 0 | 0 | 1 | 1 | 0 | 1 |
| Comoros (LDC/SIDS) | 1 | 0 | 0 | 0 | 0 | 1 | 0 | 1 |
| Cook Islands (SIDS) | 1 | 0 | 0 | 0 | 0 | 0 | 0 | 1 |
| Cuba (SIDS) | 1 | 1 | 1 | 0 | 1 | 1 | 0 | 1 |
| Democratic Republic of Congo | 1 | 0 | 0 | 0 | 0 | 1 | 0 | 1 |
| Djibouti | 1 | 0 | 0 | 0 | 0 | 1 | 0 | 1 |
| Dominica (SIDS) | 1 | 0 | 0 | 0 | 0 | 0 | 1 | 1 |
| Dominican Republic (SIDS) | 1 | 1 | 1 | 0 | 1 | 1 | 0 | 1 |
| Eritrea | 1 | 0 | 0 | 0 | 0 | 1 | 0 | 1 |
| Ethiopia | 1 | 1 | 1 | 1 | 0 | 1 | 0 | 1 |
| Fiji (SIDS) | 1 | 0 | 0 | 0 | 1 | 0 | 0 | 1 |
| Gambia | 1 | 0 | 0 | 0 | 1 | 1 | 0 | 1 |
| Grenada (SIDS) | 1 | 0 | 0 | 0 | 0 | 0 | 1 | 1 |
| Guinea | 1 | 0 | 0 | 0 | 1 | 1 | 0 | 1 |
| Guinea Bissau (LDC/SIDS) | 1 | 0 | 0 | 0 | 1 | 1 | 0 | 1 |
| Guyana (SIDS) | 1 | 0 | 0 | 0 | 0 | 0 | 1 | 1 |
| Haiti (LDC/SIDS) | 1 | 1 | 0 | 0 | 1 | 1 | 0 | 1 |
| Jamaica (SIDS) | 1 | 1 | 0 | 0 | 0 | 0 | 1 | 1 |
| Kiribati (LDC/SIDS) | 1 | 0 | 0 | 1 | 1 | 0 | 0 | 1 |
| Lao PDR | 1 | 1 | 0 | 0 | 1 | 1 | 0 | 1 |
| Lesotho | 1 | 0 | 0 | 0 | 0 | 1 | 0 | 1 |
| Liberia | 1 | 1 | 0 | 0 | 1 | 1 | 0 | 1 |
| Madagascar | 1 | 1 | 0 | 0 | 1 | 1 | 0 | 1 |
| Malawi | 1 | 1 | 0 | 0 | 0 | 1 | 0 | 1 |
| Maldives (SIDS) | 1 | 0 | 1 | 0 | 0 | 1 | 0 | 1 |
| Mali | 1 | 0 | 0 | 0 | 1 | 1 | 0 | 1 |
| Marshall Islands (SIDS) | 1 | 0 | 0 | 1 | 1 | 0 | 0 | 1 |
| Mauritania | 1 | 0 | 0 | 0 | 0 | 0 | 0 | 1 |
| Mauritius (SIDS) | 1 | 1 | 0 | 0 | 0 | 1 | 0 | 1 |
| Micronesia (SIDS) | 1 | 0 | 0 | 0 | 1 | 0 | 0 | 1 |
| Mozambique | 1 | 0 | 1 | 0 | 1 | 1 | 0 | 1 |
| Myanmar | 1 | 0 | 0 | 1 | 1 | 1 | 0 | 1 |
| Nauru (SIDS) | 1 | 0 | 0 | 0 | 1 | 0 | 0 | 1 |
| Nepal | 1 | 0 | 0 | 0 | 0 | 1 | 0 | 1 |
| Niger | 1 | 0 | 0 | 0 | 1 | 1 | 0 | 1 |
| Niue (SIDS) | 1 | 0 | 0 | 0 | 0 | 0 | 0 | 1 |
| Palau (SIDS) | 1 | 0 | 0 | 0 | 1 | 0 | 0 | 1 |
| Papua New Guinea (SIDS) | 1 | 1 | 0 | 0 | 1 | 0 | 0 | 1 |
| Rwanda | 1 | 1 | 1 | 0 | 1 | 1 | 0 | 1 |
| Saint Kitts and Nevis (SIDS) | 1 | 0 | 0 | 0 | 0 | 0 | 1 | 1 |
| Saint Lucia (SIDS) | 1 | 0 | 0 | 0 | 0 | 0 | 1 | 1 |
| Saint Vincent and the Grenadines (SIDS) | 1 | 0 | 0 | 0 | 0 | 0 | 1 | 1 |
| Samoa (SIDS) | 1 | 0 | 0 | 0 | 1 | 0 | 0 | 1 |
| São Tomé and Principe (LDC/SIDS) | 1 | 0 | 0 | 0 | 1 | 1 | 0 | 1 |
| Senegal | 1 | 0 | 1 | 0 | 1 | 1 | 0 | 1 |
| Seychelles (SIDS) | 1 | 0 | 0 | 0 | 0 | 1 | 0 | 1 |
| Sierra Leone | 1 | 1 | 0 | 0 | 1 | 1 | 0 | 1 |
| Singapore (SIDS) | 0 | 0 | 0 | 0 | 1 | 1 | 0 | 1 |
| Solomon Islands (LDC/SIDS) | 1 | 0 | 0 | 1 | 1 | 0 | 0 | 1 |
| Somalia | 1 | 0 | 0 | 0 | 0 | 1 | 0 | 1 |
| South Sudan | 1 | 0 | 0 | 0 | 0 | 0 | 0 | 1 |
| Sudan | 1 | 0 | 1 | 0 | 0 | 1 | 0 | 1 |
| Suriname (SIDS) | 1 | 0 | 0 | 0 | 0 | 0 | 0 | 1 |
| Tanzania | 1 | 0 | 1 | 0 | 0 | 1 | 0 | 1 |
| Timor-Leste (LDC/SIDS) | 1 | 0 | 0 | 0 | 1 | 1 | 0 | 1 |
| Togo | 1 | 1 | 0 | 0 | 1 | 1 | 0 | 1 |
| Tonga (SIDS) | 1 | 0 | 0 | 0 | 1 | 0 | 0 | 1 |
| Trinidad and Tobago (SIDS) | 1 | 0 | 1 | 0 | 1 | 0 | 1 | 1 |
| Tuvalu (LDC/SIDS) | 1 | 0 | 0 | 0 | 1 | 0 | 0 | 1 |
| Uganda | 1 | 1 | 0 | 1 | 0 | 1 | 0 | 1 |
| Vanuatu (LDC/SIDS) | 1 | 0 | 0 | 0 | 1 | 0 | 0 | 1 |
| Yemen | 1 | 0 | 0 | 0 | 0 | 0 | 0 | 1 |
| Zambia | 1 | 0 | 0 | 0 | 0 | 1 | 0 | 1 |
| TOTAL | 77 | 21 | 12 | 7 | 40 | 46 | 12 | 78 |
Figure 21: Map of SIDS countries

Source: ITU based on UN-OHRLLS
Figure 22: Map of LDC countries

Source: ITU based on UN-OHRLLS
APPENDIX 3 - DESCRIPTION OF EACH INITIATIVE REGARDING TYPES OF CAPACITY-BUILDING ACTIVITIES PROVIDED
| CBIT | Capacity-building Initiative for Transparency |
| Start | 2015 |
| End | - |
| Funding | An initial funding of USD 61.7 million through an established CBIT Trust Fund (2016–2018). Proposals for both full-sized projects (more than USD 2 million) and medium-sized projects (up to USD 2 million), as per the established policies and procedures of the GEF, are considered. Now CBIT is mainstreamed into the GEF Trust Fund and is fully integrated into the GEF-7 cycle (2018–2022), with a funding of USD 55 million. This makes it not possible for countries to provide earmarked CBIT funding in the future. |
| Implementing Partners | Technical support projects are implemented by GEF executing agencies such as UNDP, the Food and Agriculture Organization (FAO), Conservation International (CI) and UNEP including UNEP DTU Partnership, in more than 45 developing countries. |
| Participation | All developing countries can access CBIT support through GEF implementing agencies, including UNEP and UNDP. CBIT proposals from SIDS and LDCs are prioritized, as per the CBIT Programming Directions. |
| Countries involved* | Afghanistan, Antigua and Barbuda, Argentina, Armenia, Azerbaijan, Bangladesh, Benin, Bosnia Herzegovina, Botswana, Burkina Faso, Cambodia, Chile, China, Colombia, Comoros, Costa Rica, Cote d'Ivoire, Cuba, Dominican Republic, Equatorial Guinea, Eritrea, Eswatini, Ethiopia, Georgia, Ghana, (Guinea), Haiti, Honduras, India, Indonesia, Jamaica, Kenya, Lao PDR, Lebanon, Madagascar, Liberia, Malawi, (Mali), Mauritius, Mexico, Mongolia, Montenegro, Morocco, (Mozambique), Namibia, Nicaragua, North Macedonia, Panama, Papua New Guinea, Peru, Rwanda, (Senegal), Serbia, Seychelles, Sierra Leone, South Africa, Sri Lanka, (Sudan), Thailand, Togo, Uganda, Uruguay, (Zambia) and (Zimbabwe) More countries are preparing project proposals, including Mauritania, Somalia, Lesotho, Maldives and Fiji. |
| Mode of work | In-country projects with a project length of two to four years. The projects under CBIT are country-driven. |
| Results so far | 1 project has been concluded 17 projects are under implementation 8 projects have been approved, but are not yet implementing 33 project concepts have been approved CBIT projects cover a wide range of activities, including institutional arrangements, GHG inventory data collection and methodologies for tracking adaptation actions. Overall, countries prioritize project activities on capacity building, knowledge sharing and training, as well as GHG inventory data collection and management tools. CBIT projects by LCDs and SIDS have targeted activities that are similar to the overall project portfolio of all CBIT countries, as seen below. However, the share of countries among LDCs and SIDS that have prioritised GHG inventory data collection and management tools and GHG inventory improvements is higher than in the overall CVIT project portfolio; accounting and MRV for adaptation action, among others, is slightly lower among LDCs and SIDS. Figure 1: LDC/SIDS CBIT project priorities per type of activity compared to overall portfolio as of December 2019 (GEF, 2019) ** Website: https://www.thegef.org/sites/default/files/council-meeting-documents/EN_GEF.C.57.Inf_.06_Progress%20Report%20on%20the%20CBIT.pdf |
| *Countries in brackets are part of regional/global CBIT projects. | |
**Figure 1: LDC/SIDS CBIT project priorities per type of activity compared to overall portfolio as of December 2019 (GEF, 2019)
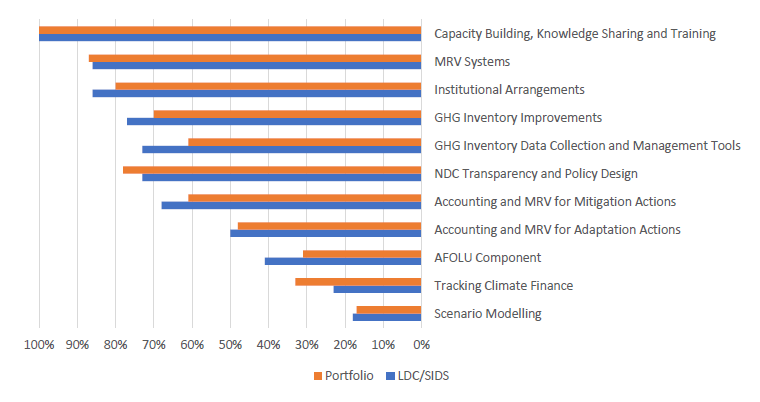
| ICAT | Initiative for Climate Action Transparency |
| Start | 2015 (first phase), 2019 (second phase) |
| End | 2021 |
| Funding | Funding of about USD 30 million from the Federal Ministry for the Environment, Nature Conservation and Nuclear Safety of Germany (BMUB); Ministry for Environment, Land and Sea Protection of Italy (ISPRA); Children's Investment Fund Foundation and Climate Works. |
| Implementing Partners | ICAT is a multi-donor and multi-partner initiative managed by the United Nations Office for Project Services (UNOPS) located in Copenhagen and Bonn, and implemented by multiple partners including UNEP DTU Partnership (leading CB support to more than 30 countries and methodology development for the ICAT Transformational Change Methodology and the ICAT Sustainable Development Methodology), the Italian National Institute for Environmental Protection and Research (ISPRA), Verra, the World Resources Institute (WRI) and others. |
| Aim of the initiative | The Initiative for Climate Action Transparency is a neutral multi-donor fund to support countries in assessing the impacts of their climate policies and actions and reporting progress to foster greater transparency, effectiveness, ambition and trust. The aim of ICAT is to strengthen monitoring, reporting and verification (MRV) systems in a country-driven manner, particularly with respect to reporting on NDC implementation. ICAT provides methodological work, capacity building and knowledge sharing to countries, and covers both mitigation and adaptation. A dedicated ICAT adaptation project, with focus on building capacity for transparent and effective climate adaptation actions, is currently being implemented in four countries. |
| Participation | Selected countries are invited to join ICAT. No prioritization of LDCs and SIDS. |
| Countries involved | Argentina, Belize, Brazil, Cambodia, Chine, Colombia, Costa Rica, Cuba, Dominican Republic, Ecuador, Ethiopia, Ghana, India, Iran, Kenya, Maldives, Morocco, Mozambique, Peru, Philippines, Rwanda, Senegal, South Africa, Sri Lanka, Sudan, Tanzania, Thailand, Trinidad and Tobago, Tunisia and Vietnam ICAT Adaptation: Bangladesh, India, South Africa and Dominican Republic |
| Mode of work | In-country projects with a project length of approximately two years and provision of 10 guidance documents, specifically developed under ICAT. The projects under ICAT are country-driven. |
| Results so far | ICAT Series of Assessment Guides developed for impact assessment of policies and actions to track progress of NDC implementation for mitigation available here # 30 countries supported in phase 1 and phase 2 # 5 countries supported for transparency of NDC adaptation actions Website: https://climateactiontransparency.org/ |
| CCMRVH | Caribbean Cooperative MRV Hub |
| Start | 2018 |
| End | 2023 |
| Funding | Funding of EUR 2,988,114 by the International Climate Initiative (IKI) |
| Implementing partners | The MRV Hub is a project by the Greenhouse Gas Management Institute (GHGMI). |
| Participation | Targeted towards the English-Caribbean Community (CARICOM) countries. All countries involved have LDC/SIDS status. |
| Countries involved | Antigua and Barbuda, Barbados, the Bahamas, Belize, Dominica, Grenada, Guyana, Jamaica, St. Kitts and Nevis, St. Lucia, St. Vincent and the Grenadines, and Trinidad and Tobago |
| Mode of work | Activities of the MRV Hub include multi-country working sessions, bilateral mentoring trips, training sessions, fellows and interns, tool and guidance development, and strengthening data management systems. The MRV Hub is flexibly designed to adapt to evolving country needs for climate transparency. |
| Results so far | Kick-off meeting with 37 country representatives was held at St. George’s University in Grenada, February 5-6, 2019. The MRV Hub organized its first training session on “Introduction to the 2006 Intergovernmental Panel on Climate Change (IPCC) Guidelines for National Greenhouse Gas Inventories” on March 14 2006. The MRV Hub workshop had participation by 9 individuals from 9 Hub countries (Antigua and Barbuda, The Bahamas, Belize, Grenada, Guyana, Jamaica, St. Kitts and Nevis, Saint Lucia, and Trinidad and Tobago). The MRV Hub is conducting bilateral scoping trips with Caribbean countries. Website: https://ghginstitute.org/2018/08/27/caribbean-cooperative-mrv-hub-ccmrvh/ |
| UNEP/UNDP GSP | Global Support Programme |
| Start | 2015 |
| End | 2020 (GSP website will be merged with CBIT Global Coordination Platform) |
| Funding | Funding of USD 7.15 million by the Global Environment Facility |
| Implementing partners | The Programme is supported by GEF and is jointly implemented by UNDP and UNEP including UNEP DTU Partnership. |
| Participation | Any non-Annex 1 country can request support, no specification for SIDS and LDCs. |
| Countries involved | All non-Annex 1 countries |
| Mode of work | GSP has engaged countries in a range of capacity-development and advisory activities, the main ones being: regional workshops, country-specific workshops, reviewing written products for countries (mainly GHG inventories, NCs, and ToRs for technical experts), webinars/online training, translating key sections of the UNFCCC and IPCC-related guidelines, elaborating country case studies, facilitating access to resources through the GSP website, and more recently establishing regional peer-to-peer learning networks. |
| Results so far | To date, 13 regional workshops (with 116 countries participating), 14 national workshops (in 12 countries), and 6 webinars were arranged, co-arranged and/or co-funded by GSP. GSP has also assisted 32 countries in reviewing 25 GHG inventories, 10 NCs, and 2 BURs. So far, 3 regional networks have been established, with more in the pipeline. Additionally, 16 countries have received request-based support, where GSP has reviewed technical TORs. Stakeholders interviewed uniformly expressed an appreciation of GSP support in terms of relevance, quality and utility. Website: http://www.un-gsp.org/ |
| Name of the initiative | Partnership for Transparency in the Paris Agreement (PATPA) |
| Start | 2010 (former name 'International Partnership on Mitigation and MRV', renamed in 2016 at COP22 to be aligned with the Paris Agreement) |
| End | - |
| Funding | Amount of funding not available. Many activities are funded by the Government of Germany. The Cluster Francophone is co-funded by the Belgian, French and Swiss Environment Ministries. The Cluster Lusophone is supported by Germany, the UNDP/UNEP Global Support Program, the Governments of Brazil and Belgium, the Community of Portuguese Language Countries (CPLP) and the Portuguese Government. |
| Implementing partners | The Partnership was launched in 2010 by South Africa, South Korea and Germany. Today, more than 100 countries participate in the various activities of PATPA. Support is provided in collaboration with a wide range of partners, including CBIT, ICAT, the NDC Partnership, UNEP DTU Partnerships and many others. |
| Participation | The Partnership is open to new countries. Countries with an emerging climate agenda can get involved. |
| Countries involved | Regional Clusters are open to all countries in the respective regions. |
| Mode of work | Global support through: Partnership Meetings on the fringes of UN climate negotiations; Policy Dialogue during Annual Partnership Retreats and Global Peer-exchange, Capacity-building and Policy Dialogue Events, e.g. International workshop on BURs. Regional support through: Capacity-building activities and peer-to-peer learning through technical workshops in five regional and language groups -- Anglophone African Group; Asian-Pacific Regional Group; Regional Groups for Latin America and Caribbean (Spanish-speaking); Francophone Cluster for French-speaking countries and the Lusophone Cluster for Portuguese-speaking countries. In-country support through: Ad-hoc support to countries for Nationally Determined Contributions (NDC), low emission development strategy (LEDS) or transparency systems through the Climate Helpdesk. The Climate Helpdesk provides support to countries on tools for NDC updates and implementation, alignment of monitoring and evaluation of adaptation actions and the establishment of institutional arrangements. Other support: Knowledge products and knowledge sharing, for example through newsletters and webinars. |
| Results so far | Today, more than 100 countries participate in PATPA's activities. Following the entry into force of the Paris Agreement 2016, the Partnership focused on its implementation, and particularly on the rollout of the enhanced transparency framework. Website: https://www.transparency-partnership.net/ |
| Name of the initiative | GEF Enabling activities |
| Start | Ongoing |
| End | |
| Funding | GEF funding through country allocation The funding is similar for all developing countries, and is as follows: USD 500,000 for a National Communication USD 352,000 for a Biennial Update Report |
| Implementation focus | The GEF stands ready to respond to additional COP guidance on Convention obligations and the transparency framework subject to resource availability. The GEF may also support actions and activities to sustainably develop and enhance the capacity of countries to prepare their NCs and BURs through, for example, the GSP that provides logistical and technical support, capacity building, and knowledge management activities, with a view to facilitating the timely preparation and submission of NCs and BURs. |
| Participation | Any non-Annex 1 country can request support, no specification for LDCs and SIDS |
| Countries involved | All non-Annex 1 countries |
| Mode of work | Project support for developing NCs and BURs. It takes an average of 10 years from the first NC to the second NC submission, and an average of 5.8 years from the second to the third NC submission. NCs provide information on greenhouse gas (GHG) inventories, measures to mitigate and to facilitate adequate adaptation to climate change, and any other information that the Party considers relevant to the achievement of the objective of the Convention. NCs are submitted every four years. BURs provide an update of the information presented in NCs, in particular on national GHG inventories, mitigation actions, constraints and gaps, including support needed and received. The first BUR was to have been submitted by December 2014, or consistent with the Party's capabilities or level of support, and every two years thereafter as a summary of their NC or a stand-alone report. |
| Results so far | -1 country has submitted its 5th and 6th NC; no LDCs or SIDS have submitted more than four NCs -6 countries have submitted their 4th NC; LDCs and SIDS who have submitted two NCs are: Mauritania and Singapore -70 countries have submitted their 3rd NC; LDCs and SIDS who have submitted three NCs are: Antigua and Barbuda, Bangladesh, Belize, Benin and Burundi, Cabo Verde, Democratic Republic of the Congo, Dominican Republic, Guinea-Bissau, Jamaica, Madagascar, Mali, Mauritius, Niger, Rwanda, Saint Lucia, Sao Tome and Principe, Senegal, Sierra Leone, Togo, Yemen -140 countries have submitted their 2nd NC; LDCs and SIDS who have submitted two NCs are: Afghanistan, Bahamas, Bahrain, Barbados, Burkina Faso, Cambodia, Central African Republic, Chad, Comoros, Cook Islands, Cuba, Djibouti, Dominica, Eritrea, Ethiopia, Fiji, Gambia, Grenada, Guinea, Guyana, Haiti, Honduras, Kiribati, Lao PDR, Lesotho, Malawi, Maldives, Marshall Islands, Micronesia, Nauru, Nepal, Niue, Palau, Papua New Guinea, Saint Kitts and Nevis, Saint Vincent and the Grenadines, Samoa, Seychelles, Solomon Islands, Sudan, Suriname, Tonga, Trinidad and Tobago, Tuvalu, Uganda, Tanzania, Vanuatu, Zambia -154 countries have submitted their 1st NC; LDCs and SIDS who have submitted two NCs are: Angola, Equatorial Guinea, Liberia, Mozambique, Myanmar, Somalia, South Sudan, Timor-Leste A synthesis report on BURs and NCs compiled by the UNFCCC secretariat on the implementation of the framework for capacity building in developing countries indicates that many non-Annex I Parties reported having strengthened institutional arrangements for national communications to meet enhanced and more frequent reporting obligations. They have done this by establishing subcommittees and sectoral working groups responsible for specific chapters of national reports. Nevertheless, the absence of a robust coordinating body at the institutional level, in addition to the lack of technical expertise to address different sections of national reports, were highlighted by some developing countries as key constraints in the preparation of national communications and biennial update reports. In order to improve the quality of their national reports, some Parties emphasized the need to consider them as an ongoing activity and not a one-time project. Several developing countries identified funding as key to strengthening institutional arrangements and organizing appropriate staff training. Website: https://www.thegef.org/project/enabling-activities-preparation-initial-communication |
| Name of the initiative | MRV Program by the Global Green Growth Institute (GGGI) |
| Start | 2017 |
| End | 2020 |
| Funding | N/A |
| Implementing partners | The MRV program was launched upon request from GGGI member and partner countries to support their efforts to track progress and enhance transparency in measuring, verifying, and reporting greenhouse gas emissions and climate change mitigation efforts towards NDC implementation under the PA. |
| Participation | Selected member and partner countries. The Program supports SIDS in developing national MRV systems, starting with the Solomon Islands. |
| Countries involved | Burkina Faso, Colombia, Ethiopia, Lao PDR, Marshall Islands, Mexico, Mongolia, Myanmar, Peru, Qatar, Solomon Islands, Thailand and Uganda |
| Mode of work | Support includes: Technical support for sector-specific MRV guidelines and MRV Masterplan; Practical policy guidance, review and quality assurance; Capacity-building training for national experts and relevant stakeholders; MRV analysis for projects to be financed through national finance vehicles (NFVs) and other mechanisms; Knowledge sharing for potential replication and expansion in region. |
| Results so far | In 2018, GGGI carried out rapid assessments including gaps and challenges in reporting, as well as institutional, legal, and procedural arrangements for establishing national MRV systems in Mongolia, Myanmar, Lao PDR, and Uganda. Based on these assessments, GGGI is initiating the development of national MRV Master Plans to analyse appropriate models for effective MRV systems to identify green investment opportunities as part of the next NDC target-setting process. The government of Ethiopia has established a national MRV system and registry to track progress of its Climate Resilient Green Economy (CRGE) national development strategy. GGGI has hosted intensive capacity-building trainings, and produced teaching materials to further support proper management of Ethiopia’s existing MRV scheme. Since 2017, GGGI has hosted the MRV forum in Latin America to transfer lessons learned for potential replication and prompt joint mitigation actions with enhanced transparency for Latin American countries. Website: https://gggi.org/tag/mrv/ |
| CGE | Consultative Group of Experts |
| Start | 2019 (CGE originally established in 1999) |
| End | 2026 |
| Funding | Funding to the UNFCCC |
| Implementing partners | The CGE consists of five members from each of the regions of non- Annex 1 Parties (Africa, Asia and the Pacific, and Latin America and the Caribbean), six members from Annex 1 Parties, and three members from international organisations. At COP24 in Katowice 2018, its mandate was extended for eight years. The current work plan of the CGE covers the year 2019 and includes, among others, the identification of collaborations with the LDC Expert Group and/or the Adaptation Committee. |
| Participation | Open to all developing country Parties, no specification for LDCs and SIDS |
| Countries involved | N/A (All LDCs and SIDS were invited to join the regional training workshop on institutionalization of data management for GHG inventory) |
| Mode of work | Knowledge delivery: Regional hands-on training workshops; webinars; in-country support, upon request by countries; training of technical experts; MRV/Transparency Helpdesk; expert database Knowledge products; E-Learning; development and dissemination of tools and handbooks. Other: Assessment of transparency gaps and needs; organization of informal CGE forum on MRV/transparency; provision of IT support tools (CGE virtual team room for countries). |
| Results so far | In 2019: - 3 regional hands-on training workshops on institutionalizing data management for national GHG inventory were organised, and 106 national experts (38 female and 68 male) from 91 developing country Parties were trained through these workshops. - 3 pre-workshop webinars were organised to prepare the nominated national experts for the workshop. - A toolbox on institutional arrangements to support MRV/transparency of climate action and support, and a technical guide to help developing country Parties prepare for the implementation of the enhanced transparency framework under the Paris Agreement were developed. - A CGE informal forum on support for the existing MRV arrangements under the Convention and to prepare for the enhanced transparency framework under the Paris Agreement was organised. Website: https://unfccc.int/CGE |
APPENDIX 4 - COMPARISON OF INTERNATIONAL CB SUPPORT PROJECTS FOR TRANSPARENCY TO LDCS AND SIDS WITH NORDIC ODA FINANCE TO THE COUNTRIES
Table 24: Comparison of international CB support projects for transparency to LDCs and SIDS with Nordic ODA finance to the countries
| SUPPORT | INTERNATIONAL PROJECTS | NORDIC PROJECTS | |||||||||||
| Initiative | GEF Enabling Activities | CBIT | ICAT | GGGI MRV program | Project TOTAL | Denmark | Norway | Sweden | Finland | Iceland | Country TOTAL | ||
| Country | |||||||||||||
| LDC | Afghanistan | 1 | 1 | 0 | 0 | 2 | 9 | 15 | 10 | 4 | 38 | ||
| LDC | Angola | 1 | 0 | 0 | 0 | 1 | 13 | 6 | 3 | 22 | |||
| SIDS | Antigua and Barbuda (SIDS) | 1 | 1 | 0 | 0 | 2 | 0 | ||||||
| SIDS | Bahamas (SIDS) | 1 | 0 | 0 | 0 | 1 | 0 | ||||||
| SIDS | Bahrain (SIDS) | 1 | 0 | 0 | 0 | 1 | 0 | ||||||
| LDC | Bangladesh | 1 | 1 | 0 | 0 | 2 | 17 | 43 | 35 | 3 | 98 | ||
| SIDS | Barbados (SIDS) | 1 | 0 | 0 | 0 | 1 | 0 | ||||||
| SIDS | Belize (SIDS) | 1 | 0 | 1 | 0 | 2 | 1 | 1 | |||||
| LDC | Benin | 1 | 1 | 0 | 0 | 2 | 4 | 2 | 6 | ||||
| LDC | Bhutan | 1 | 0 | 0 | 0 | 1 | 2 | 28 | 4 | 34 | |||
| LDC | Burkina Faso | 1 | 1 | 0 | 1 | 3 | 11 | 11 | 1 | 23 | |||
| LDC | Burundi | 1 | 0 | 0 | 0 | 1 | 20 | 6 | 2 | 28 | |||
| SIDS | Cabo Verde (SIDS) | 1 | 0 | 0 | 0 | 1 | 0 | ||||||
| LDC | Cambodia | 1 | 1 | 1 | 0 | 3 | 19 | 26 | 11 | 56 | |||
| LDC | Central African Republic | 1 | 0 | 0 | 0 | 1 | 4 | 4 | |||||
| LDC | Chad | 1 | 0 | 0 | 0 | 1 | 6 | 6 | |||||
| LDC/SIDS | Comoros (LDC/SIDS) | 1 | 0 | 0 | 0 | 1 | 0 | ||||||
| SIDS | Cook Islands (SIDS) | 1 | 0 | 0 | 0 | 1 | 0 | ||||||
| SIDS | Cuba (SIDS) | 1 | 1 | 1 | 0 | 3 | 4 | 4 | |||||
| LDC | Democratic Republic of Congo | 1 | 0 | 0 | 0 | 1 | 62 | 19 | 81 | ||||
| LDC | Djibouti | 1 | 0 | 0 | 0 | 1 | 6 | 6 | |||||
| SIDS | Dominica (SIDS) | 1 | 0 | 0 | 0 | 1 | 0 | ||||||
| SIDS | Dominican Republic (SIDS) | 1 | 1 | 1 | 0 | 3 | 0 | ||||||
| LDC | Eritrea | 1 | 0 | 0 | 0 | 1 | 0 | ||||||
| LDC | Ethiopia | 1 | 1 | 1 | 1 | 4 | 12 | 139 | 33 | 18 | 10 | 212 | |
| SIDS | Fiji (SIDS) | 1 | 0 | 0 | 0 | 1 | 3 | 3 | |||||
| LDC | Gambia | 1 | 0 | 0 | 0 | 1 | 6 | 6 | |||||
| SIDS | Grenada (SIDS) | 1 | 0 | 0 | 0 | 1 | 0 | ||||||
| LDC | Guinea | 1 | 0 | 0 | 0 | 1 | 2 | 2 | |||||
| LDC/SIDS | Guinea Bissau (LDC/SIDS) | 1 | 0 | 0 | 0 | 1 | 5 | 5 | |||||
| SIDS | Guyana (SIDS) | 1 | 0 | 0 | 0 | 1 | 20 | 20 | |||||
| LDC/SIDS | Haiti (LDC/SIDS) | 1 | 1 | 0 | 0 | 2 | 25 | 1 | 5 | 31 | |||
| SIDS | Jamaica (SIDS) | 1 | 1 | 0 | 0 | 2 | 0 | ||||||
| LDC/SIDS | Kiribati (LDC/SIDS) | 1 | 0 | 0 | 1 | 2 | 0 | ||||||
| LDC | Lao PDR | 1 | 1 | 0 | 0 | 2 | 14 | 3 | 17 | ||||
| LDC | Lesotho | 1 | 0 | 0 | 0 | 1 | 2 | 2 | 4 | ||||
| LDC | Liberia | 1 | 1 | 0 | 0 | 2 | 15 | 4 | 1 | 20 | |||
| LDC | Madagascar | 1 | 1 | 0 | 0 | 2 | 30 | 6 | 3 | 39 | |||
| LDC | Malawi | 1 | 1 | 0 | 0 | 2 | 63 | 15 | 6 | 15 | 99 | ||
| SIDS | Maldives (SIDS) | 1 | 1 | 1 | 0 | 2 | 2 | 2 | |||||
| LDC | Mali | 1 | 0 | 0 | 0 | 1 | 16 | 24 | 33 | 3 | 2 | 78 | |
| SIDS | Marshall Islands (SIDS) | 1 | 0 | 0 | 1 | 2 | 0 | ||||||
| LDC | Mauritania | 1 | 0 | 0 | 0 | 1 | 5 | 1 | 6 | ||||
| SIDS | Mauritius (SIDS) | 1 | 1 | 0 | 0 | 2 | 1 | 1 | |||||
| SIDS | Micronesia (SIDS) | 1 | 0 | 0 | 0 | 1 | 0 | ||||||
| LDC | Mozambique | 1 | 0 | 1 | 0 | 2 | 14 | 45 | 37 | 3 | 8 | 107 | |
| LDC | Myanmar | 1 | 0 | 0 | 1 | 2 | 8 | 45 | 12 | 8 | 73 | ||
| SIDS | Nauru (SIDS) | 1 | 0 | 0 | 0 | 1 | 0 | ||||||
| LDC | Nepal | 1 | 0 | 0 | 0 | 1 | 10 | 104 | 7 | 31 | 152 | ||
| LDC | Niger | 1 | 0 | 0 | 0 | 1 | 13 | 8 | 4 | 25 | |||
| SIDS | Niue (SIDS) | 1 | 0 | 0 | 0 | 1 | 0 | ||||||
| SIDS | Palau (SIDS) | 1 | 0 | 0 | 0 | 1 | 0 | ||||||
| SIDS | Papua New Guinea (SIDS) | 1 | 1 | 0 | 0 | 2 | 10 | 1 | 11 | ||||
| LDC | Rwanda | 1 | 1 | 1 | 0 | 3 | 4 | 16 | 20 | ||||
| SIDS | Saint Kitts and Nevis (SIDS) | 1 | 0 | 0 | 0 | 1 | 0 | ||||||
| SIDS | Saint Lucia (SIDS) | 1 | 0 | 0 | 0 | 1 | 0 | ||||||
| SIDS | Saint Vincent and the Grenadines (SIDS) | 1 | 0 | 0 | 0 | 1 | 0 | ||||||
| SIDS | Samoa (SIDS) | 1 | 0 | 0 | 0 | 1 | 0 | ||||||
| LDC/SIDS | São Tomé and Principe (LDC/SIDS) | 1 | 0 | 0 | 0 | 1 | 0 | ||||||
| LDC | Senegal | 1 | 0 | 1 | 0 | 2 | 1 | 7 | 2 | 10 | |||
| SIDS | Seychelles (SIDS) | 1 | 0 | 0 | 0 | 1 | 0 | ||||||
| LDC | Sierra Leone | 1 | 1 | 0 | 0 | 2 | 5 | 5 | |||||
| SIDS | Singapore (SIDS) | 0 | 0 | 0 | 0 | 0 | 0 | ||||||
| LDC/SIDS | Solomon Islands (LDC/SIDS) | 1 | 0 | 0 | 1 | 2 | 1 | 1 | |||||
| LDC | Somalia | 1 | 0 | 0 | 0 | 1 | 5 | 22 | 17 | 11 | 3 | 58 | |
| LDC | South Sudan | 1 | 0 | 0 | 0 | 1 | 5 | 10 | 3 | 18 | |||
| LDC | Sudan | 1 | 0 | 1 | 0 | 2 | 5 | 11 | 1 | 17 | |||
| SIDS | Suriname (SIDS) | 1 | 0 | 0 | 0 | 1 | 0 | ||||||
| LDC | Tanzania | 1 | 0 | 1 | 0 | 2 | 8 | 116 | 58 | 31 | 213 | ||
| LDC/SIDS | Timor-Leste (LDC/SIDS) | 1 | 0 | 0 | 0 | 1 | 1 | 1 | |||||
| LDC | Togo | 1 | 1 | 0 | 0 | 2 | 12 | 6 | 1 | 19 | |||
| SIDS | Tonga (SIDS) | 1 | 0 | 0 | 0 | 1 | 0 | ||||||
| SIDS | Trinidad and Tobago (SIDS) | 1 | 0 | 1 | 0 | 2 | 0 | ||||||
| LDC/SIDS | Tuvalu (LDC/SIDS) | 1 | 0 | 0 | 0 | 1 | 2 | 2 | |||||
| LDC | Uganda | 1 | 1 | 0 | 1 | 3 | 32 | 97 | 32 | 8 | 12 | 181 | |
| LDC/SIDS | Vanuatu (LDC/SIDS) | 1 | 0 | 0 | 0 | 1 | 0 | ||||||
| LDC | Yemen | 1 | 0 | 0 | 0 | 1 | 4 | 4 | |||||
| LDC | Zambia | 1 | 0 | 0 | 0 | 1 | 26 | 47 | 17 | 90 | |||
| TOTAL | 77 | 21 | 12 | 7 | 117 | 166 | 1,045 | 510 | 188 | 50 | 1,959 | ||
APPENDIX 5 - LIST OF LDCS AND SIDS COUNTRIES SUPPORTED BY EACH NORDIC COUNTRY WITH CLIMATE-RELATED ODA
Appendix 5 and Table 25 present all the LDCs and SIDS that each of the Nordic countries have provided climate-related ODA support to12. The table shows that 5 LDCs and SIDS (green colour) have been supported by more than 100 climate-related projects from the Nordic Countries; 24 LDCs and SIDS have benefitted from support from 11 to 100 climate-related projects (light grey colour); and 20 LDCs and SIDS have been supported by 1 to 10 climate-related projects (yellow colour). However, 29 LDCs and SIDS have not received climate-related support (red colour).
Table 25: List of LDCs and SIDS countries supported by Nordic countries with climate-related ODA
| LDCs and SIDS Countries | Denmark | Norway | Sweden | Finland | Iceland | Total |
| Afghanistan | 9 | 15 | 10 | 4 | 38 | |
| Angola | 13 | 6 | 3 | 22 | ||
| Bangladesh | 17 | 43 | 35 | 3 | 98 | |
| Belize | 1 | 1 | ||||
| Benin | 4 | 2 | 6 | |||
| Bhutan | 2 | 28 | 4 | 34 | ||
| Burkina Faso | 13 | 11 | 1 | 23 | ||
| Burundi | 20 | 6 | 2 | 28 | ||
| Cambodia | 19 | 26 | 11 | 56 | ||
| Central African Republic | 4 | 4 | ||||
| Chad | 6 | 6 | ||||
| Cuba | 4 | 4 | ||||
| Democratic Republic of the Congo | 62 | 19 | 81 | |||
| Djibouti | 6 | 6 | ||||
| Ethiopia | 12 | 139 | 33 | 18 | 10 | 212 |
| Fiji | 3 | 3 | ||||
| Gambia | 6 | 6 | ||||
| Guinea | 2 | 2 | ||||
| Guinea-Bissau | 5 | 5 | ||||
| Guyana | 20 | 20 | ||||
| Haiti | 25 | 1 | 5 | 31 | ||
| LDCs and SIDS Countries | Denmark | Norway | Sweden | Finland | Iceland | Total |
| Lao | 14 | 3 | 17 | |||
| Lesotho | 2 | 2 | 4 | |||
| Liberia | 15 | 4 | 1 | 20 | ||
| Madagascar | 30 | 6 | 3 | 39 | ||
| Malawi | 63 | 15 | 6 | 15 | 99 | |
| Maldives | 2 | 2 | ||||
| Mali | 16 | 24 | 33 | 3 | 2 | 78 |
| Mauritania | 5 | 1 | 6 | |||
| Mauritius | 1 | 1 | ||||
| Mozambique | 14 | 45 | 37 | 3 | 8 | 107 |
| Myanmar | 8 | 45 | 12 | 8 | 73 | |
| Nepal | 10 | 104 | 7 | 31 | 152 | |
| Niger | 13 | 8 | 4 | 25 | ||
| Papua New Guinea | 10 | 1 | 11 | |||
| Rwanda | 4 | 16 | 20 | |||
| Senegal | 1 | 7 | 2 | 10 | ||
| Sierra Leone | 5 | 5 | ||||
| Solomon Islands | 1 | 1 | ||||
| Somalia | 5 | 22 | 17 | 11 | 3 | 58 |
| South Sudan | 5 | 10 | 3 | 18 | ||
| Sudan | 5 | 11 | 1 | 17 | ||
| Tanzania | 8 | 116 | 58 | 31 | 213 | |
| Timor-Leste | 1 | 1 | ||||
| Togo | 12 | 6 | 1 | 19 | ||
| Tuvalu | 2 | 2 | ||||
| Uganda | 32 | 97 | 32 | 8 | 12 | 181 |
| Yemen | 4 | 4 | ||||
| Zambia | 26 | 47 | 17 | 90 | ||
| Antigua and Barbuda, Bahamas, Bahrain, Barbados, Cabo Verde, Comoros, Cook Islands, Dominica, Dominican Republic, Eritrea, Grenada, Jamaica, Kiribati, Marshall Islands, Micronesia, Nauru, Niue, Palau, São Tomé and Principe, Saint Kitts and Nevis, Saint Lucia, Saint Vincent and the Grenadines, Samoa, Seychelles, Singapore, Suriname, Tonga, Trinidad and Tobago, Vanuatu | No support provided by the Nordic countries to this group of LDCs/SIDS | |||||
Source: Own analysis based on OECD DAC reported information by the Nordic countries between 2012 and 2017
APPENDIX 6 - INSIGHTS FROM THE UNFCCC SURVEY AND SUPPORTING LITERATURE (2019)
Looking at the problems and constraints related to the UNFCCC reporting requirements, the survey identified the following issues, by order of rated significance:
National GHG Inventories:
- Data collection process (including establishment of a database, data sharing system)
- Coordination across sectors/institutions to collect and share data
- Availability of data that is consistent with reporting guidelines
- Institutional capacity to retain skills/knowledge gained from training
- Quality data (consistency, completeness, accuracy, etc.)
- Technical capacity to understand and apply IPCC guidelines
- Technical capacity to perform uncertainty assessment
- Data management process (including documentation, archiving, QA/QC protocols, uncertainty management)
- Definition of roles and responsibilities across the involved institutions
- Policy or legal arrangements that mandate the preparation of national reports
- Improvement planning
- Technical capacity to perform key category analysis
- Awareness of stakeholders, especially in the private sector
- Accessibility of data for confidentiality reasons
- Technical capacity to use IPCC software
- Leadership (e.g. an entity appointed to undertake/coordinate data collection and sharing, web-based knowledge management platform) (UNFCCC, 2019)
Most developing countries do not have the necessary institutional arrangements, human resources, and data availability to develop full inventories every two years with the level of detail required by the MPGs and IPCC guidelines (Dagnet et al., 2019). Current arrangements are often based on external consultants, and there is a lack of formal contracts and arrangements to allow for timely data collection from governmental and non-governmental sources. Insufficient legislative and policy support, and lack of mandates for climate change initiatives were found to lead to inadequate institutional capacities to maintain national reporting processes on a regular basis (UNFCCC, 2019). Countries expressed challenges to sustainably collect, manage, and analyse relevant data. A disconnect between the data collection entities and the data custodians leads to a mismatch in data availability and data needed for national reporting. Data archiving is seldom structured and centralised. Countries also lack technical capacities to apply IPCC guidelines, and have expressed the need for support to calculate national emission factors that could improve the accuracy of GHG inventories (UNFCCC, 2019 and Dagnet et al., 2019). LDCs have specifically identified challenges related to lack of data or its availability in electronic format, absence of time series data, quality issues, including data reliability, lack of disaggregation or lack of primary source data (IIED, 2019).
Reporting on mitigation actions:
- Institutional capacity to retain skills/knowledge gained from training
- Methods for quantification of direct and indirect effects of mitigation actions
- Coordination across sectors/institutions to collect and share data
- Definition of roles and responsibilities across the involved institutions
- Policy or legal arrangements that mandate the preparation of national reports
- Practical guidelines or methods for setting baselines, target values, indicators, etc.
- Practical tools for conducting mitigation assessment (e.g. sector-specific modelling)
- Availability of data that is consistent with reporting guidelines
- Data management process (including documentation, archiving, QA/QC protocols, uncertainty management)
- Quality data (consistency, completeness, accuracy, etc.)
- Data collection process (including establishment of a database, data-sharing system, web-based knowledge management platform)
- Awareness of stakeholders, especially in the private sector
- Technical capacity to interpret/analyse/translate data and information gathered from modelling
- Technical capacity to use the available tools
- Accessibility of data for confidentiality reasons
- Leadership (e.g. an entity appointed to undertake/coordinate data collection and sharing)
- Improvement planning
Lack of data and high data uncertainty was found to hinder identifying and developing mitigation options, and assessing mitigation measures. There is a lack of technical capacity in the application of models, methods and tools to establish baselines and scenarios, establish targets, select progress indicators, uncertainty management and abatement cost analysis (UNFCCC, 2019). In particular, LDCs, which in many cases use qualitative targets e.g. preparation and implementation of policies and legal frameworks, need capacities to develop suitable indicators to track progress of these qualitative targets (IIED, 2019).
Reporting on climate change impacts and adaptation:
- Practical guidelines on the development of baseline/socioeconomic scenarios for vulnerability and adaptation assessment
- Practical tools to conduct vulnerability and adaptation assessment (e.g. sector-specific modelling, regional/downscaling climate models)
- Technical capacity to interpret/analyse/translate data and information gathered from modelling
- Coordination across sectors/institutions to collect and share data
- Institutional capacity to retain skills/knowledge gained from training
- Technical infrastructure (e.g. weather stations, forecasting systems, networks) serving as a basis for monitoring climate data
- Data collection process (including establishment of a database, data-sharing system, web-based knowledge management platform)
- Quality data (consistency, completeness, accuracy, etc.)
- Technical capacity to use the available tools
- Availability of data that is consistent with reporting guidelines
- Definition of roles and responsibilities across the involved institutions
- Data management process (including documentation, archiving, QA/QC protocols, uncertainty management)
- Policy or legal arrangements that mandate the preparation of national reports
- Awareness of stakeholders, especially in the private sector
- Improvement planning
- Leadership (e.g. an entity appointed to undertake/coordinate data collection and sharing)
- Accessibility of data for confidentiality reasons
Countries expressed challenges in developing climate change scenarios, due to lack of standard methodologies and tools, limited available data, and the lack of funds and in-country expertise needed to carry out technical studies (UNFCCC, 2019), even though they see the need to bring climate risk modelling into national and sectoral plans (Dagnet et al., 2019). For example, in Saint Lucia the currently applied large-scale modelling cannot be integrated into current plans, and there is a need to downscale the climate risk model to fit the national and sectoral contexts (Dagnet et al., 2019). LDCs, specifically, lack functional M&E systems or indicators to track progress in adaptation action (IIED, 2019). There is a need for research on the domestic sectoral impacts of climate change, to be able to integrate this information into national planning (Dagnet et al., 2019).
Reporting on support needed and received:
- Allocation of responsibilities for MRV of support
- Data collection process (including establishment of a database, data-sharing system, web-based knowledge management platform)
- Process for the coordination of support received
- Availability of data
- Process or approach for integrating processes to report to various donors on support received
- Data management process (including documentation, archiving, QA/QC protocols)
- Guidelines or standards for identifying support needs and reporting on support received, including common definitions of relevant terminology and approaches
- Improvement planning
- Identification of all relevant stakeholders related to MRV of support
- Accessibility of data for confidentiality reasons
Countries expressed the lack of a common classification for financial support as climate finance or development assistance, as a factor leading to unclear understanding of what climate finance is, resulting in challenges in operationalising data collection processes and procedures (UNFCCC, 2019). For LDCs, specifically, there is little precedent on reporting on support received; data is often dispersed across multiple actors (IIED, 2019). Countries also expressed the need for support in establishing frameworks to track and manage finance received. For example, Cambodia noted that its financial management mechanisms to effectively implement climate action are not in place, and that it is currently focusing on building the needed climate change financing and monitoring and evaluation frameworks (Dagnet et al., 2019). Another concern of developing countries is the need for support to actually access international climate, which requires familiarity with the procedures and processes of some providers (Dagnet et al., 2019).
APPENDIX 7 - CRITERIA FOR SELECTION OF COUNTRIES FOR IN-DEPTH ASSESSMENT OF CB NEEDS FOR TRANSPARENCY
In this step, the focus is on the 23 countries that have received the least support by way of international transparency initiatives, as listed in Figure 9. The aim is to select four LDCs/SIDS to be invited to stakeholder interviews during COP25 in Madrid, for an in-depth assessment of their CB needs for transparency. This information serves as examples of country-specific needs and priorities to inform the analysis and provide inputs for recommendations to the Nordic countries. To further narrow down the countries, the following list of selection criteria is applied based on consultations with the NKL Steering Group:
- Representative of the LDC category
- Representative of the SIDS category
- Under-served countries, in terms of international transparency-related project-type support initiatives
- Little transparency capacity, illustrated by poor track record in UNFCCC reporting (number of NCs and BURs submitted)
- Prior Nordic support, illustrating existing working relations and systems in place that can actually receive capacity-building support
- Size of GHG emissions, preferably targeting larger emitters, and countries with rapidly increasing GHG emissions
- Ambition of GHG emissions reduction, as specified in countries' NDCs
- Geographical balance, if possible (between Africa, Asia & Pacific and Latin American & the Caribbean)
- Political stability[1]To assess the political stability and the ability to conduct in-country activities, the website of the Finnish Foreign Ministry was consulted on their travel advice to countries
The criterion 'Transparency capacity' is defined in this analysis by the number of NCs and BURs submitted by LDCs and SIDS. While the number of NCs and BURs is a limited indicator of transparency capacity, it is the best available indicator to quickly assess countries’ capacities for transparency and MRV activities. The preparation of NCs and BURs is a major multi-year transparency-related exercise in all countries. Therefore, countries receive support for the preparation of every consecutive NC or BUR.[2]So far, 154 countries have submitted their first NC, 140 and 70 countries have submitted their second and third NC, respectively. Only 6 countries have submitted their fourth NC, while only Mexico has submitted a fifth and sixth NC. Consequently, countries that have submitted three or four NCs are considered to have the highest transparency capacity, whereas those that have submitted only one NC are considered to have the least transparency capacity. The majority of LDCs and SIDS have submitted two NCs, while fewer have submitted one or three NCs. Mauritania is the only country that has submitted four NCs and a BUR.
Regarding the criteria size of GHG emissions, some key indicators[3]The key indicators are sourced through The Paris Equity Check, which provides a quantitative assessment of the NDCs, and 'Factsheets’ for all countries, providing indicators assessing their current emissions, and estimations of future indicator values, based on their submitted NDCs. http://paris-equity-check.org/the-science.html are used to rank countries:
- Rank of worldwide emissions, classifying the countries' relevance in terms of global share of emissions
- Per-capita 2010 emissions, classifying the countries' relevance in terms of carbon intensity
- Per-capita reduction (% from 2010–2030), an estimated change in emission per capita in 2030, based on the ambition expressed in the countries' respective NDCs
To ensure equal representation of LDCs and SIDS in the selection of countries, the country list has been filtered according to each category, as seen in Table 26 and Table 27, below. Countries that are classified as both LDCs and SIDS have been included in the list of SIDS. The tables contain the countries that have only received one transparency-related project-type support. In both tables, the LDCs and SIDS highlighted in green are the ones that meet the following criteria:
- Have received more than 10 support projects by Nordic countries
- Have only submitted 1 or 2 National Communications
- The larger emitters on the list, in terms of global share of emissions. The larger emitters in terms of carbon intensity (emissions per capita in 2010)[4]It has to be noted that the term 'large emitters' here is seen in relative terms to other LDCs/SIDS in Table 79 and Table 810. All LDCs and SIDS have very low GHG emissions compared to many other developing countries.
- The countries with highest expected growth in emissions
The colour intensity indicates the countries that meet most of the criteria.
Footnotes
- ^ To assess the political stability and the ability to conduct in-country activities, the website of the Finnish Foreign Ministry was consulted on their travel advice to countries
- ^ So far, 154 countries have submitted their first NC, 140 and 70 countries have submitted their second and third NC, respectively. Only 6 countries have submitted their fourth NC, while only Mexico has submitted a fifth and sixth NC.
- ^ The key indicators are sourced through The Paris Equity Check, which provides a quantitative assessment of the NDCs, and 'Factsheets’ for all countries, providing indicators assessing their current emissions, and estimations of future indicator values, based on their submitted NDCs. http://paris-equity-check.org/the-science.html
- ^ It has to be noted that the term 'large emitters' here is seen in relative terms to other LDCs/SIDS in Table 79 and Table 810. All LDCs and SIDS have very low GHG emissions compared to many other developing countries.
Table 26: Ranking of LDCs with one project-type transparency support, according to number of Nordic support projects received, and emission profile
| LDCs only | COUNTRIES | SUPPORT PROVISION | TRANSPARENY CAPACITY | GHG EMISSIONS and NDC AMBITION | ||||
| Status | Country | Project TOTAL | Nordic TOTAL | Number of NCs (BUR) | Rank of worldwide emissions 2010 | Per-capita 2010 emissions (tCO2eq/cap) | Per-capita reduction (% from 2010 - 2030) | |
| LDC | Angola | 1 | 22 | 1 | 62 | 3.7 | -24% | |
| LDC | Bhutan | 1 | 34 | 2 | 167 | 2.9 | -10% | |
| LDC | Burundi | 1 | 28 | 3 | 155 | 0.5 | 766% | |
| LDC | Central African Republic | 1 | 4 | 2 | 110 | 5.7 | -22% | |
| LDC | Chad | 1 | 6 | 2 | 106 | 2.3 | -17% | |
| LDC | Democratic Republic of Congo | 1 | 81 | 2 | 83 | 0.7 | 18% | |
| LDC | Djibouti | 1 | 6 | 2 | 169 | 1.9 | 22% | |
| LDC | Gambia | 1 | 6 | 2 | 164 | 1.4 | -38% | |
| LDC | Guinea | 1 | 2 | 2 | 120 | 3.2 | -11% | |
| LDC | Lesotho | 1 | 4 | 2 | 156 | 2.3 | 3% | |
| LDC | Mali | 1 | 78 | 3 | 94 | 2.2 | 0.42% | |
| LDC | Mauritania | 1 | 6 | 4(1) | 138 | 3.3 | -1% | |
| LDC | Nepal | 1 | 152 | 2 | 92 | 1.3 | -11% | |
| LDC | Niger | 1 | 25 | 3 | 113 | 1.3 | 59% | |
| LDC | Somalia | 1 | 58 | 1 | 107 | 2.9 | -16% | |
| LDC | South Sudan | 1 | 18 | 1 | 86 | 4.4 | -16% | |
| LDC | Yemen | 1 | 4 | 3 | 87 | 1.7 | -33% | |
| LDC | Zambia | 1 | 90 | 2 | 98 | 2.3 | -8% | |
| The table highlights, in green, the LDCs that comply with three or more of the selection criteria. Dark green colour highlights countries that comply with the most criteria (four), while light green colour highlights countries that comply with three criteria. Blue-coloured text illustrates countries soon to move away from LDC status. Red-coloured text illustrates countries that do not comply with the political stability criteria. Source: Own analysis | ||||||||
Table 27: Ranking of SIDS (including LDC-SIDS) according to number of Nordic support received
| SIDS only (incl. LDC- SIDS) | COUNTRIES | SUPPORT PROVISION | TRANSPARENCY CAPACITY | GHG EMISSIONS and NDC AMBITION | ||||
| Status | Country | Project TOTAL | Nordic TOTAL | Number of NCs | Rank of worldwide emissions 2010 | Per-capita 2010 emissions (tCO2eq/cap) | Per-capita reduction (% from 2010 - 2030) | |
| SIDS | Guyana (SIDS) | 1 | 20 | 2 | 158 | 4.7 | -13% | |
| LDC/SIDS | Guinea Bissau (LDC/SIDS) | 1 | 5 | 3 | 166 | 1.4 | 5% | |
| SIDS | Fiji (SIDS) | 1 | 3 | 2 | 165 | 2.8 | 26% | |
| LDC/SIDS | Tuvalu (LDC/SIDS) | 1 | 2 | 2 | 197 | 2 | -51 | |
| LDC/SIDS | Timor-Leste (LDC/SIDS) | 1 | 1 | 1 | 170 | 1.2 | 13% | |
| The table highlights, in green, the SIDS that comply with three or more of the selection criteria. Dark green colour highlights countries that comply with the most criteria (four), while light green colour highlights countries that comply with three criteria. Source: Own analysis | ||||||||
About this publication
Nordic Capacity-Building Support to LDCs and SIDS for the Implementation of the Transparency Framework of the Paris Agreement
Karen Holm Olsen, Federico Canu, Susanne Konrad and Ana Cardoso, UNEP DTU Partnership.
Morten Pedersen and Mila Christensen, NIRAS
ISBN 978-92-893-6653-3 (PDF)
ISBN 978-92-893-6654-0 (ONLINE)
http://dx.doi.org/10.6027/temanord2020-519
TemaNord 2020:519
ISSN 0908-6692
© Nordic Council of Ministers 2020
Disclaimer
This publication was funded by the Nordic Council of Ministers. However, the content does not necessarily reflect the Nordic Council of Ministers’ views, opinions, attitudes or recommendations.
Rights and permissions
This work is made available under the Creative Commons Attribution 4.0 International license (CC BY 4.0) https://creativecommons.org/licenses/by/4.0.
Translations: If you translate this work, please include the following disclaimer: This translation was not produced by the Nordic Council of Ministers and should not be construed as official. The Nordic Council of Ministers cannot be held responsible for the translation or any errors in it.
Adaptations: If you adapt this work, please include the following disclaimer along with the attribution: This is an adaptation of an original work by the Nordic Council of Ministers. Responsibility for the views and opinions expressed in the adaptation rests solely with its author(s). The views and opinions in this adaptation have not been approved by the Nordic Council of Ministers.
Third-party content: The Nordic Council of Ministers does not necessarily own every single part of this work. The Nordic Council of Ministers cannot, therefore, guarantee that the reuse of third-party content does not infringe the copyright of the third party. If you wish to reuse any third-party content, you bear the risks associated with any such rights violations. You are responsible for determining whether there is a need to obtain permission for the use of third-party content, and if so, for obtaining the relevant permission from the copyright holder. Examples of third-party content may include, but are not limited to, tables, figures or images.
Photo rights (further permission required for reuse):
Any queries regarding rights and licences should be addressed to:
Nordic Council of Ministers/Publication Unit
Ved Stranden 18
DK-1061 Copenhagen
Denmark
pub@norden.org
Nordic co-operation
Nordic co-operation is one of the world’s most extensive forms of regional collaboration, involving Denmark, Finland, Iceland, Norway, Sweden, and the Faroe Islands, Greenland and Åland.
Nordic co-operation has firm traditions in politics, economics and culture and plays an important role in European and international forums. The Nordic community strives for a strong Nordic Region in a strong Europe.
Nordic co-operation promotes regional interests and values in a global world. The values shared by the Nordic countries help make the region one of the most innovative and competitive in the world.
The Nordic Council of Ministers
Nordens Hus
Ved Stranden 18
DK-1061 Copenhagen
pub@norden.org
Read more Nordic publications on www.norden.org/publications