
- Full page image w/ text
- Table of contents
- FOREWORD
- ACKNOWLEDGEMENTS
- 1. EXECUTIVE SUMMARY
- 2. INTRODUCTION
- 3. METHODOLOGY
- 3.1 The Energy Trilemma
- 3.2 The energy crisis and security of supply
- 3.3 The energy value chain
- 3.4 Scope of the study
- 3.5 Delimitations
- 3.6 Data collection
- 3.7 Description of data sources
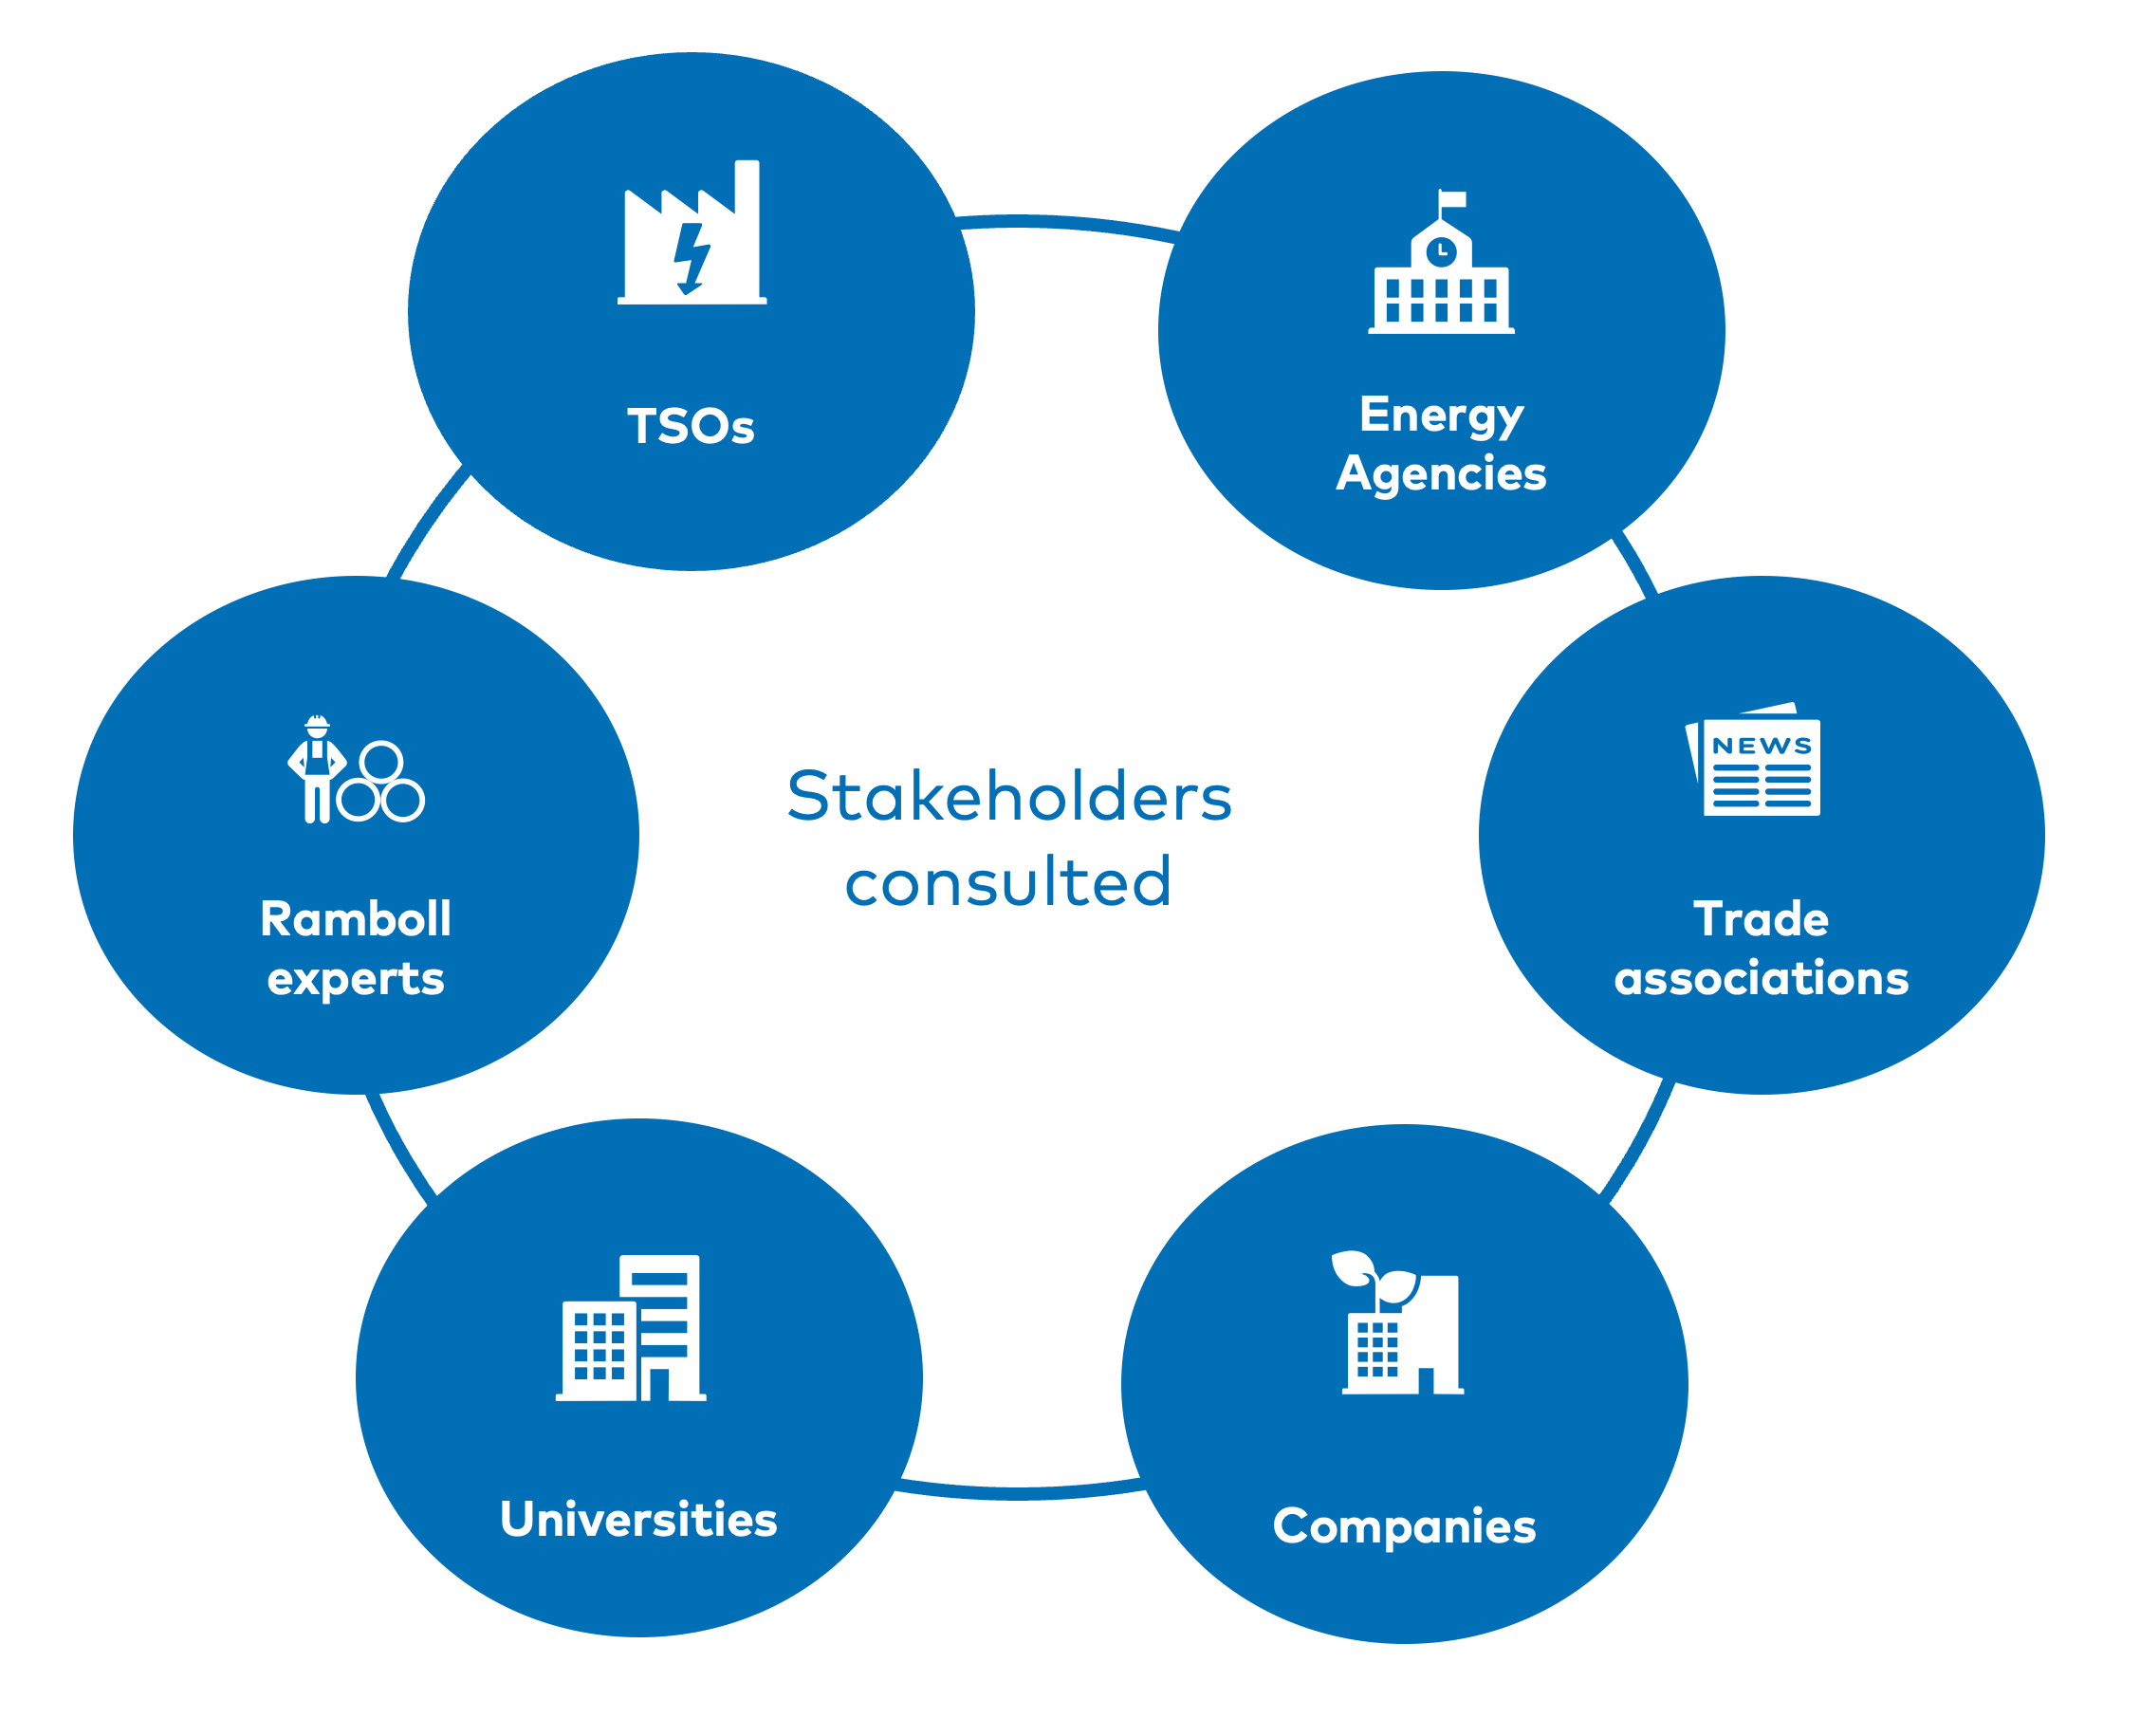
- 3.8 Interviews
- 3.9 Assessment of the data used
- 3.10 Report structure
- 4. INTERNATIONAL ENERGY SYSTEMS AND MARKETS
- 4.1 The electricity system
- 4.2 Natural gas and electricity prices in Europe
- 4.3 The energy system in Iceland
- 5. DRIVERS, PREPAREDNESS AND RESPONSES
- 5.1 Electricity market structure
- 5.2 Decommissioned controllable electric capacity
- 5.3 Balancing electricity supply and demand
- 5.4 Lack of electric grid infrastructure
- 5.5 Inflexible electricity demand
- 5.6 Weather-dependent energy supply
- 5.7 Increasing energy-import dependency
- 5.8 Reductions in natural gas supply
- 5.9 Preparedness of the Nordic countries
- 5.10 Responses to alleviate pressure on household finances
- 6. RISK SCREENING
- 6.1 Long approval processes
- 6.2 Modest public infrastructure acceptance
- 6.3 Inadequate electricity market design
- 6.4 High mineral and energy supply dependencies
- 6.5 Lack of electric grid infrastructure
- 6.6 Absence of sustainable long-term energy storage
- 6.7 Unchanged consumer behaviour
- 6.8 Increased weather dependence
- 6.9 Inadequate energy crisis management
- 6.10 Labour shortages
- 7. MITIGATION MEASURES AND GAP ANALYSES
- 7.1 Accelerated permitting for electricity generation and grid infrastructure
- 7.2 Public inclusion in energy infrastructure
- 7.3 Adapt electricity market design
- 7.4 Strategic sourcing of metals and minerals
- 7.5 Strategic sourcing of fuels
- 7.6 Development of electric grid infrastructure
- 7.7 Energy infrastructure and integration
- 7.8 Information campaigns and digital applications
- 7.9 Energy generation diversification
- 7.10 Energy crisis mechanisms
- 7.11 Tripartite negotiations
- 8. TARGETING NORDIC ADDED VALUE
- 8.1 Policy recommendations
- 9. BIBLIOGRAPHY
- 10. APPENDIX 1: ENERGY BALANCE PER COUNTRY
- 11. APPENDIX 2: BRIEF DESCRIPTIONS OF NON-HIGH RISK FACTORS
- 12. APPENDIX 3: NATIONAL RESPONSES TO RELIEVE PRESSURE ON HOUSEHOLD FINANCES
- About this publication
MENU
CONTENTS
This publication is also available online in a web-accessible version at https://pub.norden.org/nordicenergyresearch2023-02
FOREWORD
The Nordic region has a vision to become the most sustainable and integrated region in the world. Secure, affordable and clean energy is fundamental to realising this. Yet, in view of unprecedented energy prices and geopolitical risk, it remains unclear whether energy supply chains, power grids, raw materials, or enabling technologies can be secured to meet the demands of an electrified society in the long term.
Today, the Nordic region faces an energy trilemma – three conflicting challenges to delivering a secure, affordable, and sustainable energy transition. We must meet energy demand reliably, withstand system shocks, and prepare for a sharp increase in electrification, all while providing equitable access to abundant energy, and delivering a positive climate and environmental impact.
Recently, a confluence of factors led energy and commodity prices to surge in the Nordics and exposed the need for resilient energy infrastructure. As countries exited COVID-19 lockdown, energy demand exceeded fossil fuel supplies. The Russian invasion of Ukraine exacerbated supply disruptions. Energy annual inflation in Europe rose throughout 2022, pushing overall inflation to record levels. Meanwhile, rising prices of critical raw materials increased the cost of technologies enabling the energy transition.
In response, the European Commission created the Just Energy Transition Fund and a toolbox for action and support aimed at consumers and industry. The Nordic countries offered varying levels of support to households most affected by the high electricity prices. These actions demonstrate that energy security must be viewed in an economic, social, and sustainability context. Energy prices and infrastructure investment have societal consequences, for affordability, public acceptance, economic distribution, job creation, climate and environment.
Energy security is a prerequisite for national security and industry competitiveness, with strategic, political and economic implications for countries and individuals, as well as for Nordic and international cooperation. If the Nordic countries are to meet their ambitious electrification goals, policymakers must consider the vulnerabilities of a decarbonising energy system, and ensure our interlinked systems remain resilient.
This report reviews factors that drove the most severe energy crisis in recent memory, with an emphasis on electricity markets, the preparedness of the Nordic countries, and how they responded. Risks to the Nordic energy transition are identified, and measures in place to mitigate these risks are assessed. Where no such measures exist, actions are proposed to address the gaps. The recommendations herein define national, Nordic, and international actions to increase energy security and emergency preparedness, such that our societies are ready for the energy crises of the future.
Klaus Skytte
CEO, Nordic Energy Research
ACKNOW|LEDGE|MENTS
This publication was funded by the Energy Sector within the Nordic Council of Ministers. The report was prepared by Ramboll Management Consulting and Ramboll Energy (Ramboll). The Nordic Committee of Senior Officials for Energy Policies has overseen the preparation of this publication. Quality assurance has been provided by the Nordic Electricity Market Group. Nordic Energy Research was the contracting authority and coordinator of this work.
Jens Riis at Ramboll was the project manager and had overall responsibility for implementing the study. Ask Tonsgaard Hjordt Brüel is the project owner at Ramboll.
Marton Leander Vølstad at Nordic Energy Research coordinated the project.
Team at Nordic Energy Research
Marton Leander Vølstad
Adviser
Team at Ramboll
Ask Tonsgaard Hjordt Brüel
Global Head of Energy & Utility
Ramboll Management Consulting
Jens Riis
Senior Management Consultant
Strategic Sustainability Consulting, Denmark
Søren Møller Thomsen
Consultant
Ramboll Energy, Denmark
Line Knudsen
Consultant
Social and Economic Impacts, Denmark
Mikael Toll
Senior Advisor
Ramboll Resilience, Sweden
Per Jørgensen
Head of Gas Infrastructure
Ramboll Energy, Denmark
Disclaimer
The opinions expressed in this publication are those of the consultants. They do not necessarily reflect the views of the Nordic Council of Ministers, Nordic Energy Research, or any entities they represent. The individuals and organizations that contributed to this publication are not responsible for any judgements herein.
Christine Lunde Rasmussen
Senior Market Manager
Social and Economic Impacts, Denmark
Erik Vaet
Consultant
Strategic Sustainability Consulting, Norway
Jouni Laukkanen
Country Market Director
Ramboll Energy, Finland
Lauri Larvus
Market Director
Strategic Sustainability Consulting, Finland
André Smith
Country Market Director
Ramboll Energy, Norway
Dag A. Nilsen
Lead Business Developer
Ramboll Energy, Norway
John Ammentorp
Country Market Director
Ramboll Energy, Denmark
Simon Jansson
Country Market Director
Ramboll Energy, Sweden
The Nordic Committee of Senior Officials for Energy Policies
Julie Louring Eriksen
Danish Ministry of Climate, Energy and Utilities
Maria Kekki,
Finnish Ministry of Economic Affairs and Employment
Erla Sigríður Gestsdóttir
Icelandic Ministry of Environment, Energy and Climate
Johan Vetlesen
Norwegian Ministry of Petroleum and Energy
David Freed
Swedish Ministry of Rural Affairs and Infrastructure
Proofreading
The report was proofread by Alistair Gage at Samtext Norway AS.
Contact
Comments and questions are welcome and should be addressed to:
- Marton Leander Vølstad, Nordic Energy Research, e-mail: marton.leander.volstad@nordicenergy.org
- Jens Riis, Rambøll Management Consulting A/S, e-mail: jsrs@ramboll.com
For enquiries regarding the presentation of results or distribution of the report, please contact Nordic Energy Research.
Additional materials, press coverage, presentations etc. can be found at www.nordicenergy.org.

1. EXECUTIVE SUMMARY
The Nordic countries are experiencing an unprecedented energy crisis, characterised by dramatic increases in energy prices caused by a significant reduction in the primary energy supply. High electricity prices for end-consumers is one of the major spill-over effects from continental Europe, along with a reduction in natural gas supplies from Russia. The energy supply crisis has also prompted some regulators to warn of planned outages in winter 2022–2023. Faced with these interrelated problems, both the EU and individual member states, including the Nordic countries, have rolled out a raft of crisis management schemes to help consumers weather the situation financially. Energy cost increases have been felt across the Nordics, although the resulting negative socio-economic impacts such as energy poverty[1][1] The EU Commission defines energy poverty as follows: Energy poverty occurs when energy bills represent a high percentage of consumers’ income, or when they must reduce their household's energy consumption to a degree that negatively impacts their health and well-being. among the poorest income groups, have been felt less in the Nordic countries than in other European economies. In effect, the Nordic economies have shown a degree of socio-economic resilience in the face of the energy crisis.
In addition, recent underlying structural developments (e.g. decommissioning of controllable economic capacity, lack of infrastructure, inflexible demand, energy import dependency) have played a key role in the crisis, as described in the eight drivers of the crisis highlighted later in the report. The problems in energy markets in general, and electricity markets specifically, could impact security of supply in the years ahead.
This report aims to provide recommendations, at national, Nordic, EU, and international level to enable policymakers to ensure that energy systems can strike the desired balance between the elements of the Energy Trilemma of sustainability, affordability and security of supply. Critically, bearing in mind that factors relating to security of supply and electricity markets are the primary focus of the report, the report is structured as follows: identification and analysis of the drivers responsible for the electricity supply crisis, evaluation of individual Nordic countries’ exposure, preparedness and responses to these drivers, identification of the future risks that Nordic electricity systems will be exposed to, and an assessment of whether appropriate and effective risk-mitigation measures are in place. The report is subject to a number of delimitations, including relating to geopolitical threats, and is based on data collected up to 30 September 2022. The report had a submission deadline of the end of November 2022. This was followed by a review process involving Nordic Energy Research and the Nordic Council of Ministers and the report was finalised in January 2023.
Furthermore, although the Nordic energy systems are heterogeneous, the systems’ many shared characteristics mean that the recommendations formulated in this report can be used to inform national decision-making processes across the Nordics, and to strengthen inter-Nordic collaboration. Nonetheless, it should be noted that further analysis, i.e., in the form of detailed impact assessments, is needed to determine how each recommendation can, or should, be implemented in each country. This report makes 17 recommendations, at respectively national, Nordic and EU/International level, as listed below.
Footnotes
- ^ [1] The EU Commission defines energy poverty as follows: Energy poverty occurs when energy bills represent a high percentage of consumers’ income, or when they must reduce their household's energy consumption to a degree that negatively impacts their health and well-being.
Recommendations:
National
- Implement fixed timelines and shorten permitting processes for generation and infrastructure assets while considering the relevant perspectives of local communities.
- Ensure a high-quality labour supply for the energy sector by developing long-term national roadmaps, including to determine whether and how the sector should be prioritised.
- Apply goal-oriented impact assessments as a basis for decision-making, addressing short- and long-term system-wide perspectives. The goals and assessments should balance all aspects of the Energy Trilemma and consider the benefits that a reliable energy supply can create for other sectors of society. In this context, the number of scenarios in national energy planning should be increased to encompass multiple energy system changes.
- Increase system capacity and flexibility through existing energy assets that are currently not fully utilised, e.g., by prolonging lifetimes or other means, in order to maintain affordable prices and security of supply. This should not overly delay the green energy transition.
- Reinforce electricity crisis management so that it is properly dimensioned and well-planned at local, national and Nordic level. It should be borne in mind that since electricity is both a traded commodity and a basic societal need, adopting a cautious approach during crisis situations remains pivotal. This is because both inaction and suboptimal policy decisions could result in market disruptions and risk creating future, even more acute crises.
- Strengthen the energy industry’s long-term attractiveness and competitiveness within important sectors such as energy asset manufacturing, electricity generation, heat production, extraction of critical raw materials, energy service companies and grid infrastructure.
Nordics
- Diversify sources of energy generation, carriers, and storage in line with national climate targets, including hydrogen and biofuel infrastructure. Leverage the respective strengths of different technologies and energy carriers and opportunities to develop local energy systems while limiting excessive dependence on any single technology, facility or supply route.
- Review ways of continuously adapting the electricity market model to meet society’s needs and desires to deliver a green and just energy transition, while maintaining a high security of supply. Based on developments in 2022, markets have not been able to balance the various elements of the Energy Trilemma. In this context, adequate roles, responsibilities for market actors, governments and the number of market interconnections should be considered.
- Formulate shared plans and set requirements for yearly and multi-year long-term energy storage to replace fossil-fuel storage. This could involve different energy carriers, e.g., hydrogen, methanol, ammonia, pumped hydro storage and biogas.
- Strengthen and share the knowledge foundation for addressing public opposition to energy infrastructure, e.g., through various forms of financial compensation and enhanced stakeholder dialogue in project design and development.
- Support a flexible demand-side response by utilising existing knowledge and developing new technologies and infrastructure to facilitate energy efficiency, system flexibility and ancillary services.
- Strengthen Nordic electricity grid infrastructure to avoid bottlenecks and renewable energy curtailment in connection with the increased electrification of society.
- Re-emphasise the importance of Nordic collaboration across energy markets and systems while highlighting each country’s responsibility for positively contributing to regional, national and Nordic security of supply.
- Share findings from nationally applied financial support schemes to help consumers weather the current crisis and thereby safeguard future policymaking against undesired distributional effects relating to both energy poverty and long-term market developments.
- Limit import dependency on the metals and minerals required for the green energy transition by promoting sustainable mining in the Nordics. Consider making the region a global leader in mining on the back of high environmental and ethical standards.
EU and international
- Coordinate policy responses between Nordic countries around EU initiatives, thus making them increasingly applicable to the specific nature of the Nordic markets.
- Assess the need for setting up a comprehensive stockholding system for various types of fuels and energy carriers to improve security of supply through EU-wide regulations. This should be achieved by leveraging existing knowledge, including in relation to oil and international processes, in order to alleviate the current situation and prevent similar scenarios arising in the future.
| A perfect storm – eight drivers impacting the Nordic energy crisis | |
| The crisis is complex and not caused by a single event or scenario. The study has identified eight drivers that collectively have played a key role in triggering the current electricity crisis, and jointly created a perfect storm of compounding problems. These eight drivers would therefore have been likely to impact the electricity system and led to long-term security of supply challenges, even if Russia had not reduced its supply of natural gas to Europe. The drivers are listed and described below, though the extent to which each driver has impacted the current situation is not quantified. | |
 | Electricity market structure The structure of the electricity markets in the Nordic countries and Europe has produced a set of derivative effects that were not foreseen at their inception, for example in relation to the decommissioning of thermal capacity. Thus, some of the subsequent drivers of the crisis are a direct result of the electricity market structure. |
 | Decommissioned controllable electric capacity The decommissioning of thermal power plants due to price competition, and nuclear power plants due to political opposition, have resulted in a lack of baseload capacity in the electricity system during periods of unfavourable weather conditions. |
 | Balancing electricity supply and demand Decarbonisation targets and the resulting focus on the development of renewable energy have heightened the requirements for balancing supply and demand in the electricity system. Going forward, electricity prices are expected to be increasingly volatile, necessitating long-term energy storage. |
 | Lack of electric transmission infrastructure Underinvestment in both electrical grid infrastructure capable of handling intermittent flows of energy and in cross-border interconnectors has created bottlenecks in Sweden and Norway, which in turn have led to asymmetric pricing trends in the Nordics. |
 | Inflexible electricity demand Nordic electricity systems have historically been characterised by a high security of supply at low electricity prices and electricity is perceived as a public good throughout the region. Furthermore, the fact that demand in wholesale electricity markets is inflexible means that prices can dramatically increase, since decreases in consumer consumption are not enough to reduce demand and stabilise electricity prices. This has led to significant cost increases for consumers. |
 | Increasing energy-import dependency Reduced exports of Russian oil, gas and coal have had a major impact on electricity prices in Europe. Energy supply disruptions are not unlikely for the winters of 2022–2023 and 2023–2024. While the Nordic countries are well prepared, connections to Europe make the region as a whole vulnerable. |
 | Reduced supply of natural gas Reduced extraction of natural gas within the European Union, in combination with a gradual reduction in the foreign supply of natural gas, has created high sourcing prices for LNG and natural gas. Increasing production costs and costs of buying natural gas and electricity for end-consumers are some of the consequences of this development. |
 | Weather-dependent electricity generation The Nordic countries are exposed to a weather-dependent electricity supply as baseload generation via hydro power and peak capacity are contingent on weather conditions. Other energy sources that will increasingly be utilised going forward such as wind and solar are naturally also dependent on weather conditions. |
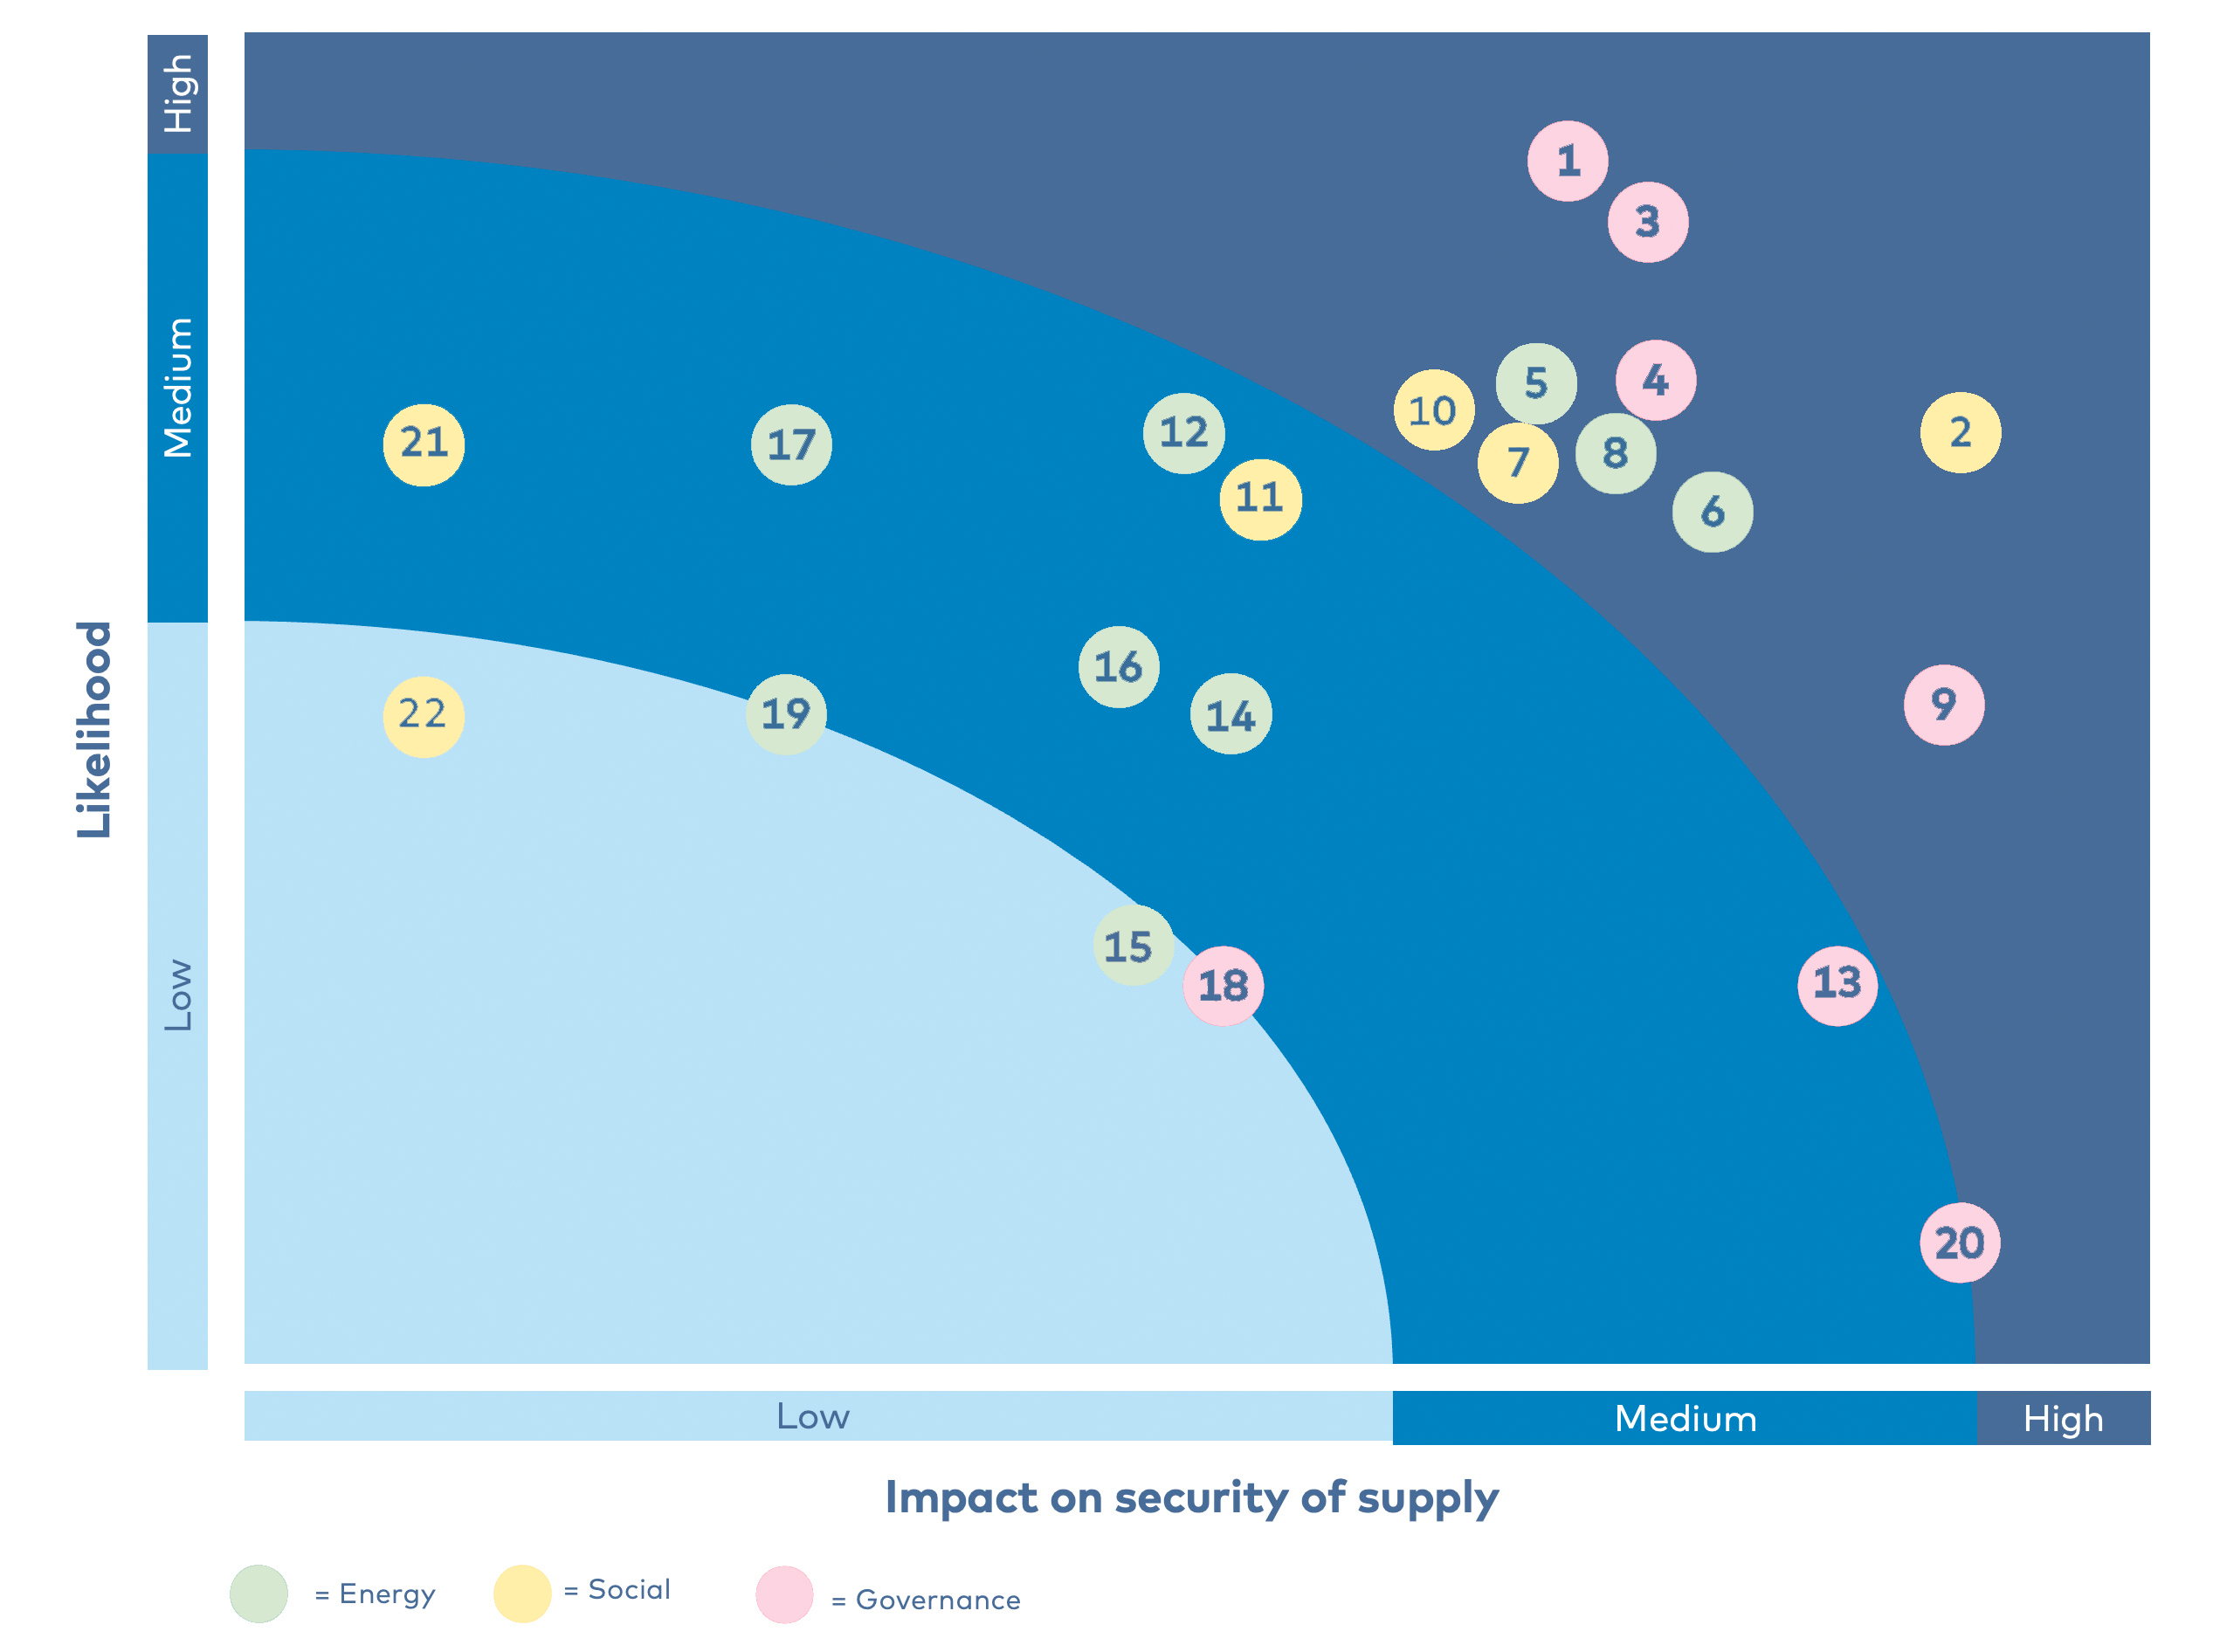
Risks influencing the Nordic security of electricity supply
The risk screening identified 22 risks which were ranked based on their likelihood and their impact on security of supply. This resulted in the identification of ten high-risk factors (shown below in
| RISK | POTENTIAL IMPACT ON THE VALUE CHAIN |
| Long approval processes | Long approval processes can hinder society’s ability to build enough renewable capacity and electric grid infrastructure at a quick enough pace to transmit electricity from the generation site to load centres to meet customer demand. Given the significant requirements for electrification associated with the green energy transition and the desire for energy independence, continued long approval processes could reduce the ability of the Nordic societies to meet these challenges. |
| Modest public infrastructure acceptance | This risk may impact the whole electricity value chain depending on the extent of public opposition to the installation of the infrastructure. Moreover, the problem is likely to increase over time as renewable electricity generation and additional electric grid infrastructure become more visible in the landscape. Renewable energy sources require more land per energy produced than traditional types of energy generation. |
| Inadequate electricity market design | There is a risk that the current electricity market is not designed to facilitate a smooth green energy transition while balancing the two other dimensions of the Energy Trilemma. Potential intervention from regulators has created insecurities in the market and affected market operations. For example, reduced controllable electricity generation capacity in the market could lead to load-shedding and price increases for consumers. Therefore, the existing market design should be developed to facilitate a suitable balance between the various dimensions of the Energy Trilemma. |
| High mineral and fossil energy supply dependencies | Supply dependencies could impact the ability of society to deliver the green energy transition at a sufficient pace, while creating security of supply issues around fossil fuels and minerals in the event of supply disruptions. This could impact consumers through high prices and the availability of electricity. |
| Lack of electric grid infrastructure | Appropriate and adequate electrical grid infrastructure is the foundation of a well-functioning energy system and electricity market. Transmission problems caused by lack of electrical infrastructure could therefore negatively impact the system’s entire value chain. |
| Lack of sustainable long-term energy storage | The potential lack of sustainable long-term energy storage as a means for supplying peak electricity demand during periods of unfavourable weather conditions could negatively impact overall security of supply and the resulting prices consumers pay. |
| Unchanged consumer behaviour | The inability of consumers to exercise demand-side response during peak hours, and change their behaviour impacts overall security of supply. |
| Increased weather dependence | A significant scarcity of generation capacity, i.e. as the result of limited availability of different energy sources (hydro and renewables), could impact the ability of society to meet electricity demand. |
| Insufficient energy crisis management | Energy-crisis management that does not consider the system-wide effects of initiatives at Nordic and EU levels could impact the entire electricity value chain. |
| Labour shortages | Any labour shortages in the energy sector have consequences throughout the value chain since assets cannot be developed and maintained. This makes labour shortages a system-wide risk. |
Mitigation measures and gap analysis on responses to the crisis
Following the risk screening, selected mitigation measures applied during the ongoing energy crisis were mapped against the identified high-risk factors. The main purpose was to identify whether the applied mitigation measures were an adequate and efficient response to the identified risks, or whether a risk-mitigation gap existed. The results of the gap analysis established that significant gaps are associated with one risk (“gap exists”), that gaps are partially addressed (“gap remains”) for eight risks and that gaps are fully addressed for one risk (“no gap”). The findings are based on a qualitative assessment of the data foundation for this report and have been subject to the report’s validation process (see Section 3.9.1).
The mitigation measures presented in Table 2 below demonstrate that the mitigation measures and cases discussed may not be the most appropriate options to implement in all the Nordic countries. They are merely examples of the applied mitigation measures, presented with the aim of assessing how well the Nordic electricity market is equipped to ensure supply security going forward.
| RISK | MEASURE | |
| Long approval processes | Accelerated permitting for electricity generation and grid infrastructure | GAP REMAINS |
| Modest public infrastructure acceptance | Public inclusion in electricity infrastructure | GAP REMAINS |
| Inadequate electricity market design | Analyse adaptation measures for electricity market design | GAP REMAINS |
| High mineral and fossil energy supply dependencies | Strategic sourcing of metals | GAP EXISTS |
| High mineral and fossil energy supply dependencies* | Strategic sourcing of fuels | GAP REMAINS |
| Lack of electric grid infrastructure | Electric grid infrastructure | GAP REMAINS |
| Lack of sustainable long-term energy storage | Energy infrastructure integration | GAP REMAINS |
| Unchanged consumer behaviour | Information campaigns and digital applications | NO GAP |
| Increased weather dependence | Electricity generation diversification | GAP REMAINS |
| Inadequate energy crisis management | Energy crisis management | GAP REMAINS |
| Low workforce availability | Tripartite negotiations | GAP EXISTS |
| *Separate mitigating measures are applied for the “high mineral and fossil energy supply dependencies”. The risk is addressed collectively as it relates to both dependencies. | ||
2. INTRODUCTION
Secure access to abundant and affordable energy is critical for societies and a cornerstone of well-functioning economies. The Nordic governments' participation in the Paris Agreement’s goal of limiting the global temperature increase to well below 2oC compared with pre-industrial levels has created a desire to accelerate the pace of the green energy transition. Governments are consequently being challenged to balance the three dimensions of the Energy Trilemma of security, affordability and sustainability, which, while often conflicting, do offer some synergies.
The current energy crisis in the Nordic region is the result of the decisions society has made regarding how energy systems are designed and has essentially been underway for some time. The crisis originated in the summer of 2021 following the European Union’s rapid economic recovery after the COVID-19 lockdowns, and the war in Ukraine has resulted in substantial energy price rises across Europe and the Nordic countries. (Prices in Iceland have remained stable.) Low water levels in Norwegian reservoirs, warm weather in Europe during the summer of 2022, reduced availability of French nuclear power, and a weakened energy infrastructure are other factors that have contributed to the crisis.
The energy crisis has raised concerns about the ability of Nordic societies to maintain secure access to abundant and affordable energy. This makes securing an appropriate balance within the Energy Trilemma a key priority for policymakers going forward.
This report aims to provide recommendations to enable policymakers to achieve the desired balance in the Energy Trilemma and to provide a basis for an affordable, secure energy transition. We have adopted the following approach to achieve this: (1) analyse the drivers of the crisis, (2) evaluate the Nordic countries’ exposure to the crisis, preparedness and responses to these drivers, (3) identify the future risks the Nordic electricity systems are exposed to and (4) determine whether appropriate and effective mitigation measures are in place to manage the identified risks. Based on this assessment, this report presents several national, regional and international policy recommendations. In light of current crisis, this report has been tasked with providing recommendations with an emphasis on how to achieve energy security, with affordability and sustainability as important second priorities.


3. METHODOLOGY
3.1 The Energy Trilemma
- Security is the ability to supply current and future energy demand reliably and withstand and recover from system shocks through effective crisis management.
- Affordability is the ability to provide universal access to reliable, affordable and abundant energy for residential and industrial consumers. This dimension also encompasses job creation in relation to expanding renewable energy and transmission infrastructure. Finally, it covers public acceptance of the implemented mitigation initiatives in general.
- Sustainability is the extent to which the green energy transition mitigates potential climate impacts by transitioning from fossil-based to renewable energy systems. This dimension focuses on the effectiveness of the decarbonisation process and the efficiency of energy generation, transmission and distribution.
Footnotes
- ^ World Energy Council, World Energy Trilemma Index, 2022. Website reference: https://www.worldenergy.org/transition-toolkit/world-energy-trilemma-index.

3.2 The energy crisis and security of supply
3.3 The energy value chain

3.4 Scope of the study
Electricity and gas markets
Affordability
Sustainability
3.5 Delimitations
- Cybersecurity: Applying novel digital solutions is a key element of many aspects relating to security of supply, for example, demand-side management and automated grid balancing. However, increasing digitalisation of critical electricity infrastructure presents a significant risk of cyberattacks that could potentially jeopardise electricity supply security.
- Geopolitics: An increasingly changed world order with energy as a central element of geopolitics could potentially affect the perceived credibility of various national trading partners. Moreover, geopolitical movements could also make electricity infrastructure vulnerable to sabotage or similar, potentially requiring increased operational security from asset owners.
- Inflation: Inflation effects from initiatives to address affordability concerns among Nordic households and corporates are not considered, although potentially relevant as these could further contribute to economy-wide inflation, and hence the ability to pay for electricity-related goods.
3.6 Data collection
Period for data collection
Focus on the Energy Trilemma
3.7 Description of data sources
3.8 Interviews
| NO. | ORGANISATION | COUNTRY FOCUS | ENERGY TRILEMMA FOCUS | VALUE CHAIN FOCUS |
| 1 | Ramboll Energy | Nordics general | The full Energy Trilemma | Full value chain |
| 2 | Svenska Kraftnät | Sweden | Security & Sustainability | Transmission |
| 3 | Energinet | Denmark | Security & Sustainability | Transmission |
| 4 | Ramboll Resilience | Nordics general | Security & Sustainability | Full value chain |
| 5 | Fingrid | Finland | Security & Sustainability | Transmission |
| 6 | Energia | Finland | Security & Sustainability | Full value chain |
| 7 | The National Energy Authority of Iceland | Iceland | Security & Sustainability | Consumers |
| 8 | Statnett | Norway | Security & Sustainability | Transmission |
| 9 | The Danish Utility Regulator | Denmark | Security | Generation; Consumption |
| 10 | The Nordic Council of Ministers | Nordics general | Affordability | Consumption |
| 11 | Mandag Morgen | Denmark | Affordability | Consumption |
| 12 | The Danish Energy Agency | Denmark | Security & Sustainability | Generation; Transmission |
| 13 | The Finnish Energy Authority | Finland | Security & Sustainability | Generation; Consumption |
| 14 | Samfunnsbedriftene | Norway | Affordability | Consumption |
| 15 | Concito | Nordics general | Affordability | Consumption |
| 16 | The Finnish Trade Unions | Finland | The full Energy Trilemma | Consumption |
| 17 | Landsnet | Iceland | Security & Sustainability | Full value chain |
| 18 | The Norwegian Energy Regulation Authority | Norway | Security | Generation; Transmission |
| 19 | Landsvirkjun | Iceland | Security & Sustainability | Generation; Transmission |
| 20 | Ørsted | Nordics general | Security & Sustainability | Full value chain |
| 21 | CPH Infrastructure Partners | Nordics general | Security & Sustainability | Generation; Transmission |
| 22 | Siemens Energy | Nordics general | Security & Sustainability | Transmission |
| 23 | DTU Wind And Energy Systems | Nordics general | Security & Sustainability | Full value chain |
| 24 | The Danish Trade Union Confederation | Denmark | Affordability | Consumers |
| 25 | The Swedish Energy Agency | Sweden | Affordability | Consumers |
3.9 Assessment of the data used
Consequently, this report relies on data with a ‘documented effect’ to map drivers and a ‘seeming effect’ for risks, mitigation initiatives and recommendations (see Figure 5). Specifically, data analysed from one source, has been compared with conclusions from other sources, ensuring the validity of the arguments despite the relative lack of proven effects of the data.
With this data foundation, the report mixes top-down and bottom-up analysis approaches. While reports considered from international institutions and regulatory interventions from the EU and at national level apply a top-down approach, insights from relevant stakeholders are considered through interviews that leverage bottom-up approaches.

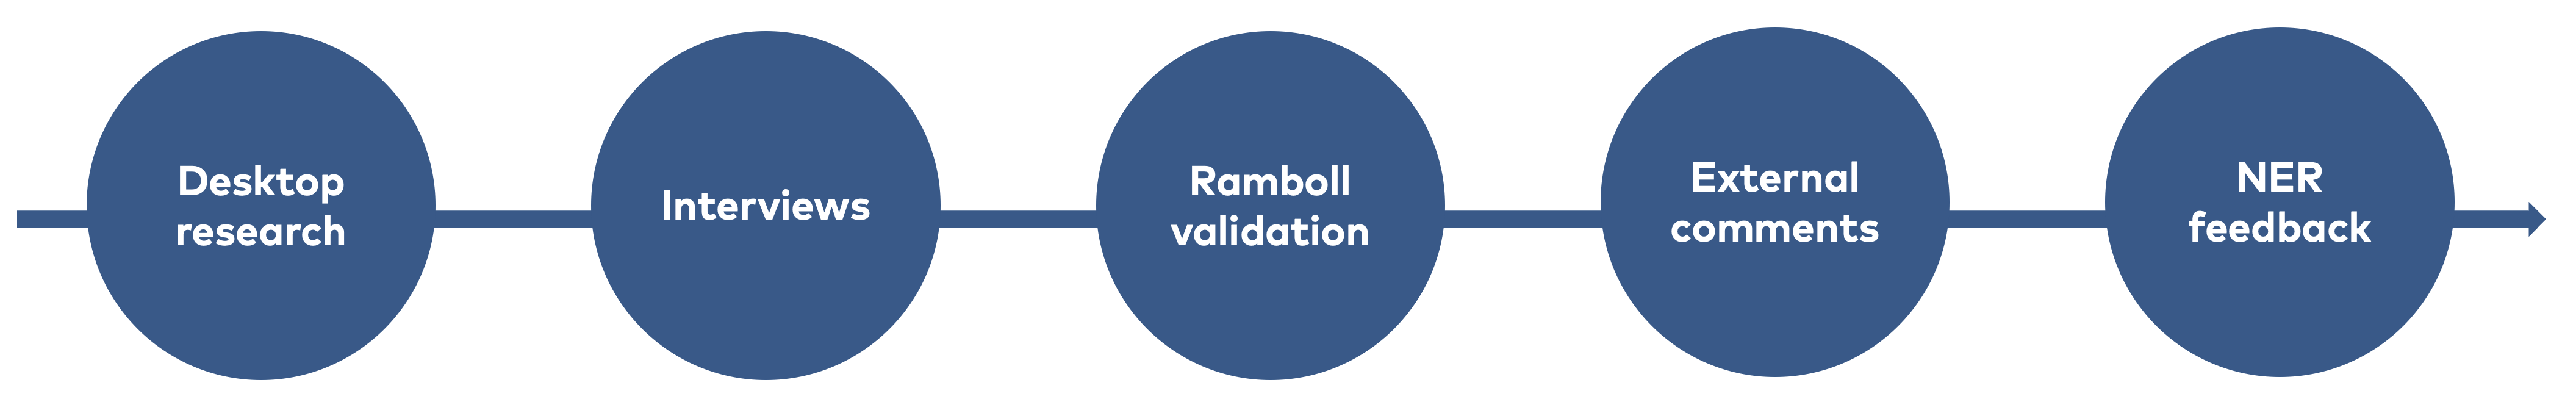
3.9.1 Validation
3.10 Report structure

3.10.1 The European and Nordic energy systems
3.10.2 Mapping of drivers
3.10.3 Identifying and assessing key risks
As discussed previously, this report does not consider the changing geopolitical environment, which could potentially give rise to sabotage and cybersecurity concerns. These risk categories could potentially have disastrous consequences for security of supply and should be analysed in a separate report. The list developed for this report consisted of approximately 25 risks spanning the short, medium and long term. Each of the risks is plotted in a risk matrix, enabling the identification of high-risk factors, for which we will subsequently suggest several mitigation measures. The applied risk matrix is shown below in
3.10.4 Mapping mitigation measuremitigation measures and gap analyseis

3.10.5 Policy recommendations

4. INTERNATIONAL ENERGY SYSTEMS AND MARKETS
This section provides an overview of the European electricity and natural gas systems. We assess Iceland separately due to the fact that it is not experiencing the electricity crisis to the same extent as the rest of Europe. We present the existing systems rather than future scenarios, as the current electricity crisis is impacting the existing systems. Another important reason to focus on the European electricity and natural gas systems is that the underlying drivers causing the electricity crisis discussed in the subsequent chapter are propagated across European borders. Therefore what happens in Europe affects the Nordic countries.
Local energy systems such as district heating and cooling networks are not described, since these have not negatively impacted the current electricity crisis. District heating networks are significantly more expensive for long-distance energy transmission than gas and electricity, which is why the district heating zones are divided into geographically isolated areas. High heating prices in one area do not spread to adjoining areas as in the case of electricity and gas. While district heating and cooling systems could be part of a future solution to balance the Energy Trilemma, they have not negatively impacted the current electricity crisis.
Although we examine the Nordic countries as one, there are several differences between the individual countries’ energy supply systems worth highlighting:
 | Finland has historically relied on imports of energy. The primary energy production has been nuclear and renewables (mainly hydro and solid biomass). Importing oil from Russia for further refinement and exporting to the world market, with Sweden as the main customer, has been a profitable industry. Electricity is mainly imported from Sweden and Russia. |
 | Sweden has historically relied on imports of energy. The primary energy production has been nuclear and renewables (mainly hydro and solid biomass). In most years Sweden is a net exporter of electricity but a net importer of oil and natural gas. |
 | Norway’s large hydrocarbon production capacity makes it a net exporter of energy. The main export product from oil and gas production has changed from oil to natural gas. In most years, Norway is also a net exporter of electricity from its hydropower plants – albeit at a comparatively much lower level than oil and natural gas. |
 | Denmark has oscillated between being a net importer and exporter of energy depending on its oil and gas production in the North Sea. The main energy import has generally been coal for the large central power plants and oil for onward export. In recent years, electricity has also been net imported from neighbouring countries. |
 | Iceland is in a unique situation compared to the other Nordic countries as it is nearly self-sufficient in energy, and its energy prices have remained stable. The competitive situation is also different as Landsvirkjun (the national energy company) is the majority shareholder in the TSO. Moreover, there is a lack of transparency in the market regarding pricing. Lack of rainfall has created supply issues for a few energy-intensive industries. |
In the following section we present the European electricity and natural gas system. The European electricity system is interconnected, and electricity is shared across borders. We also present the electricity market structure. Finally, we present an overview of the European natural gas system and the market. In
4.1 The electricity system
Due to the heightened focus on decarbonisation, the current electricity system is expected to change in the years to come. For example, new interconnectors will be built to ensure high supply security when domestic power plant capacity is reduced, and to develop a common European electricity market. Furthermore, a number of central power plants have been decommissioned, mothballed or converted to biomass with reduced capacity. Biomass-based power plants are expected to be gradually replaced by wind turbines and solar cells. The development of uncontrollable renewables like wind and solar will create a need for intermediate energy storage or alternative backup production. Controllable power generation (reservoir hydro, thermal power plants, nuclear) does not present the same problems.
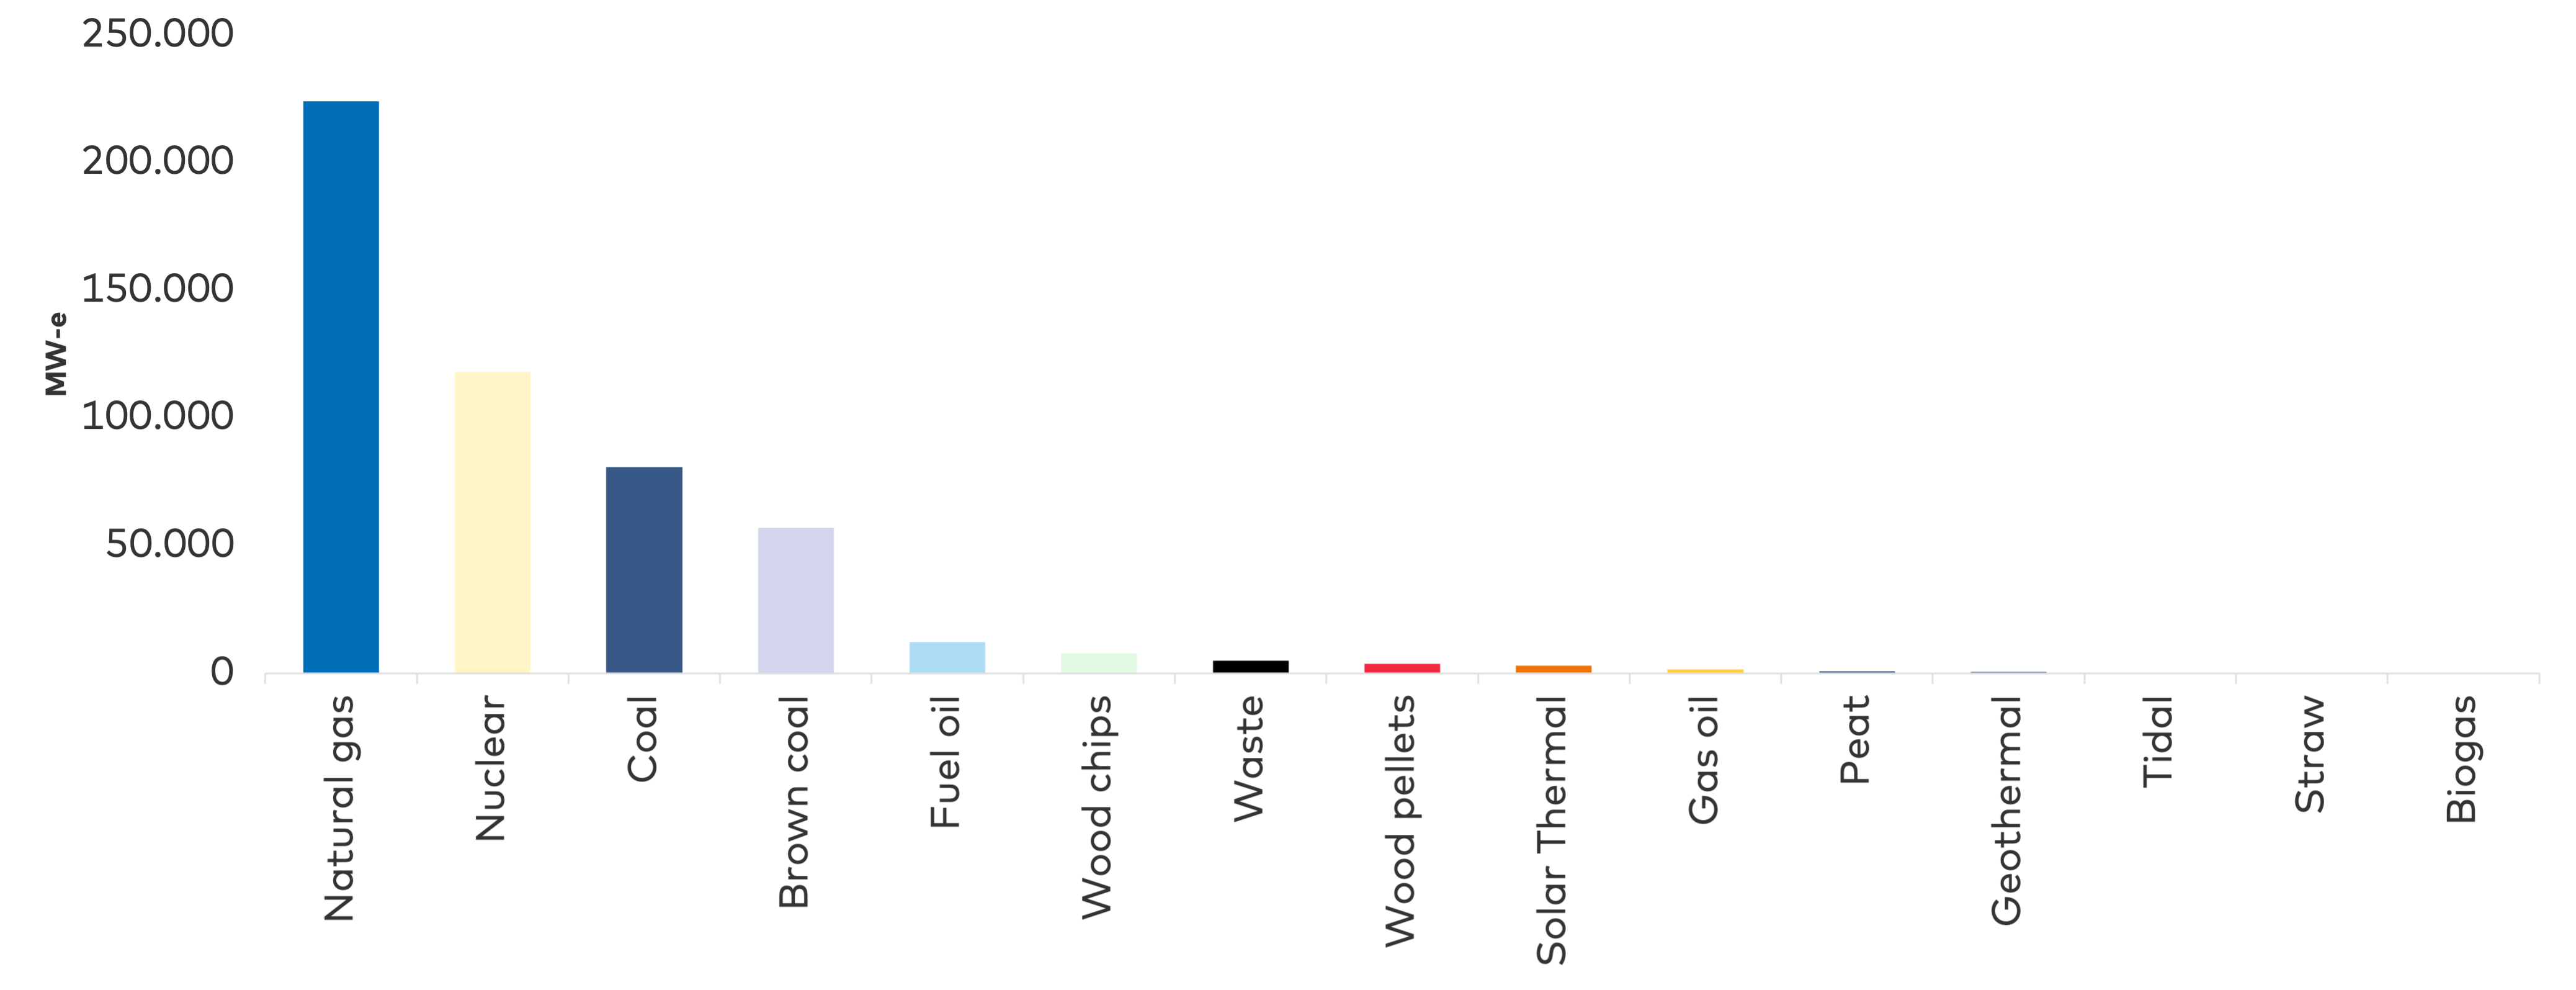
Thermal power plants in Europe
Historically, the European electricity system has largely relied on electricity production from power plants. With the exception of hydropower, the electricity produced has come from nuclear and fossil-fuelled power plants. With increasing renewable energy production, the requirement for power plants will switch from energy production to system-bearing properties. Today 73% of power plant capacity in Europe is based on fossil fuels, and 23% on nuclear. The remaining 4% is based on other energy sources.


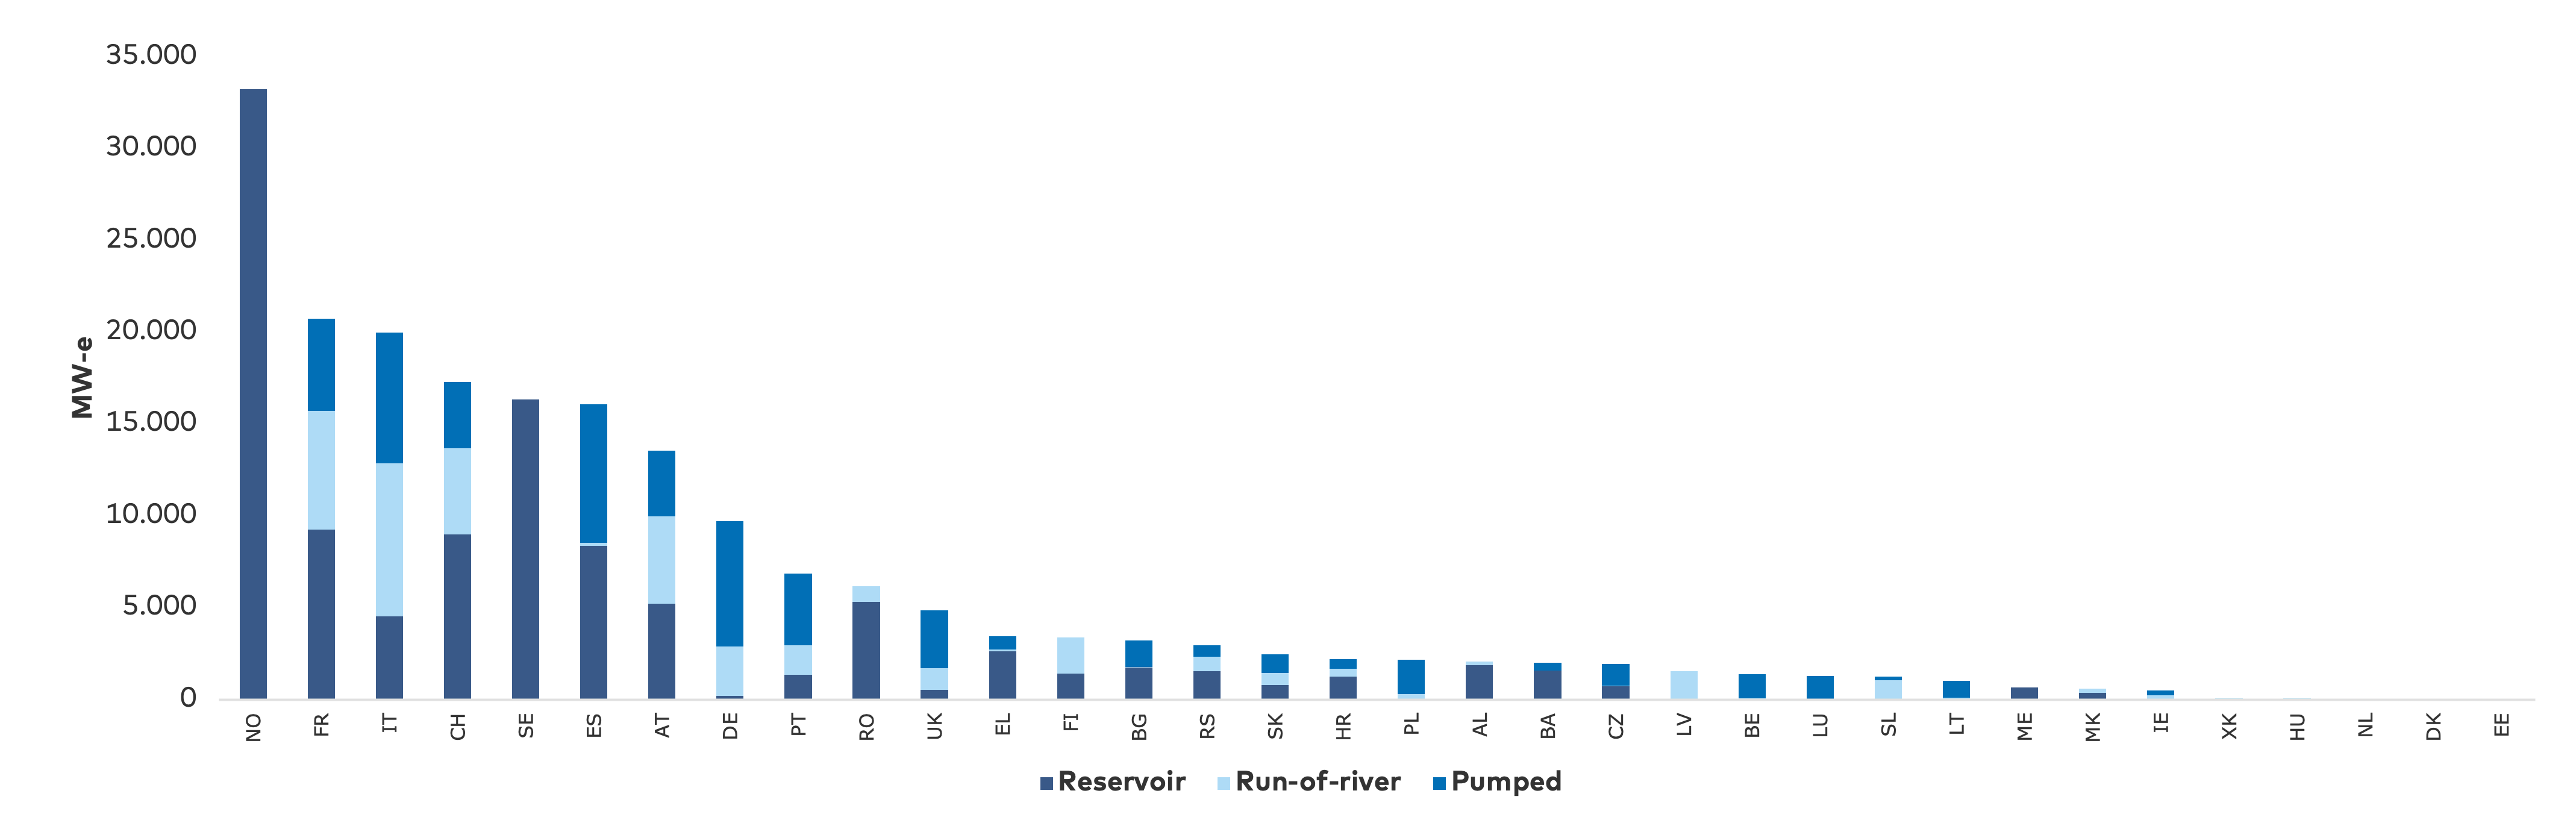
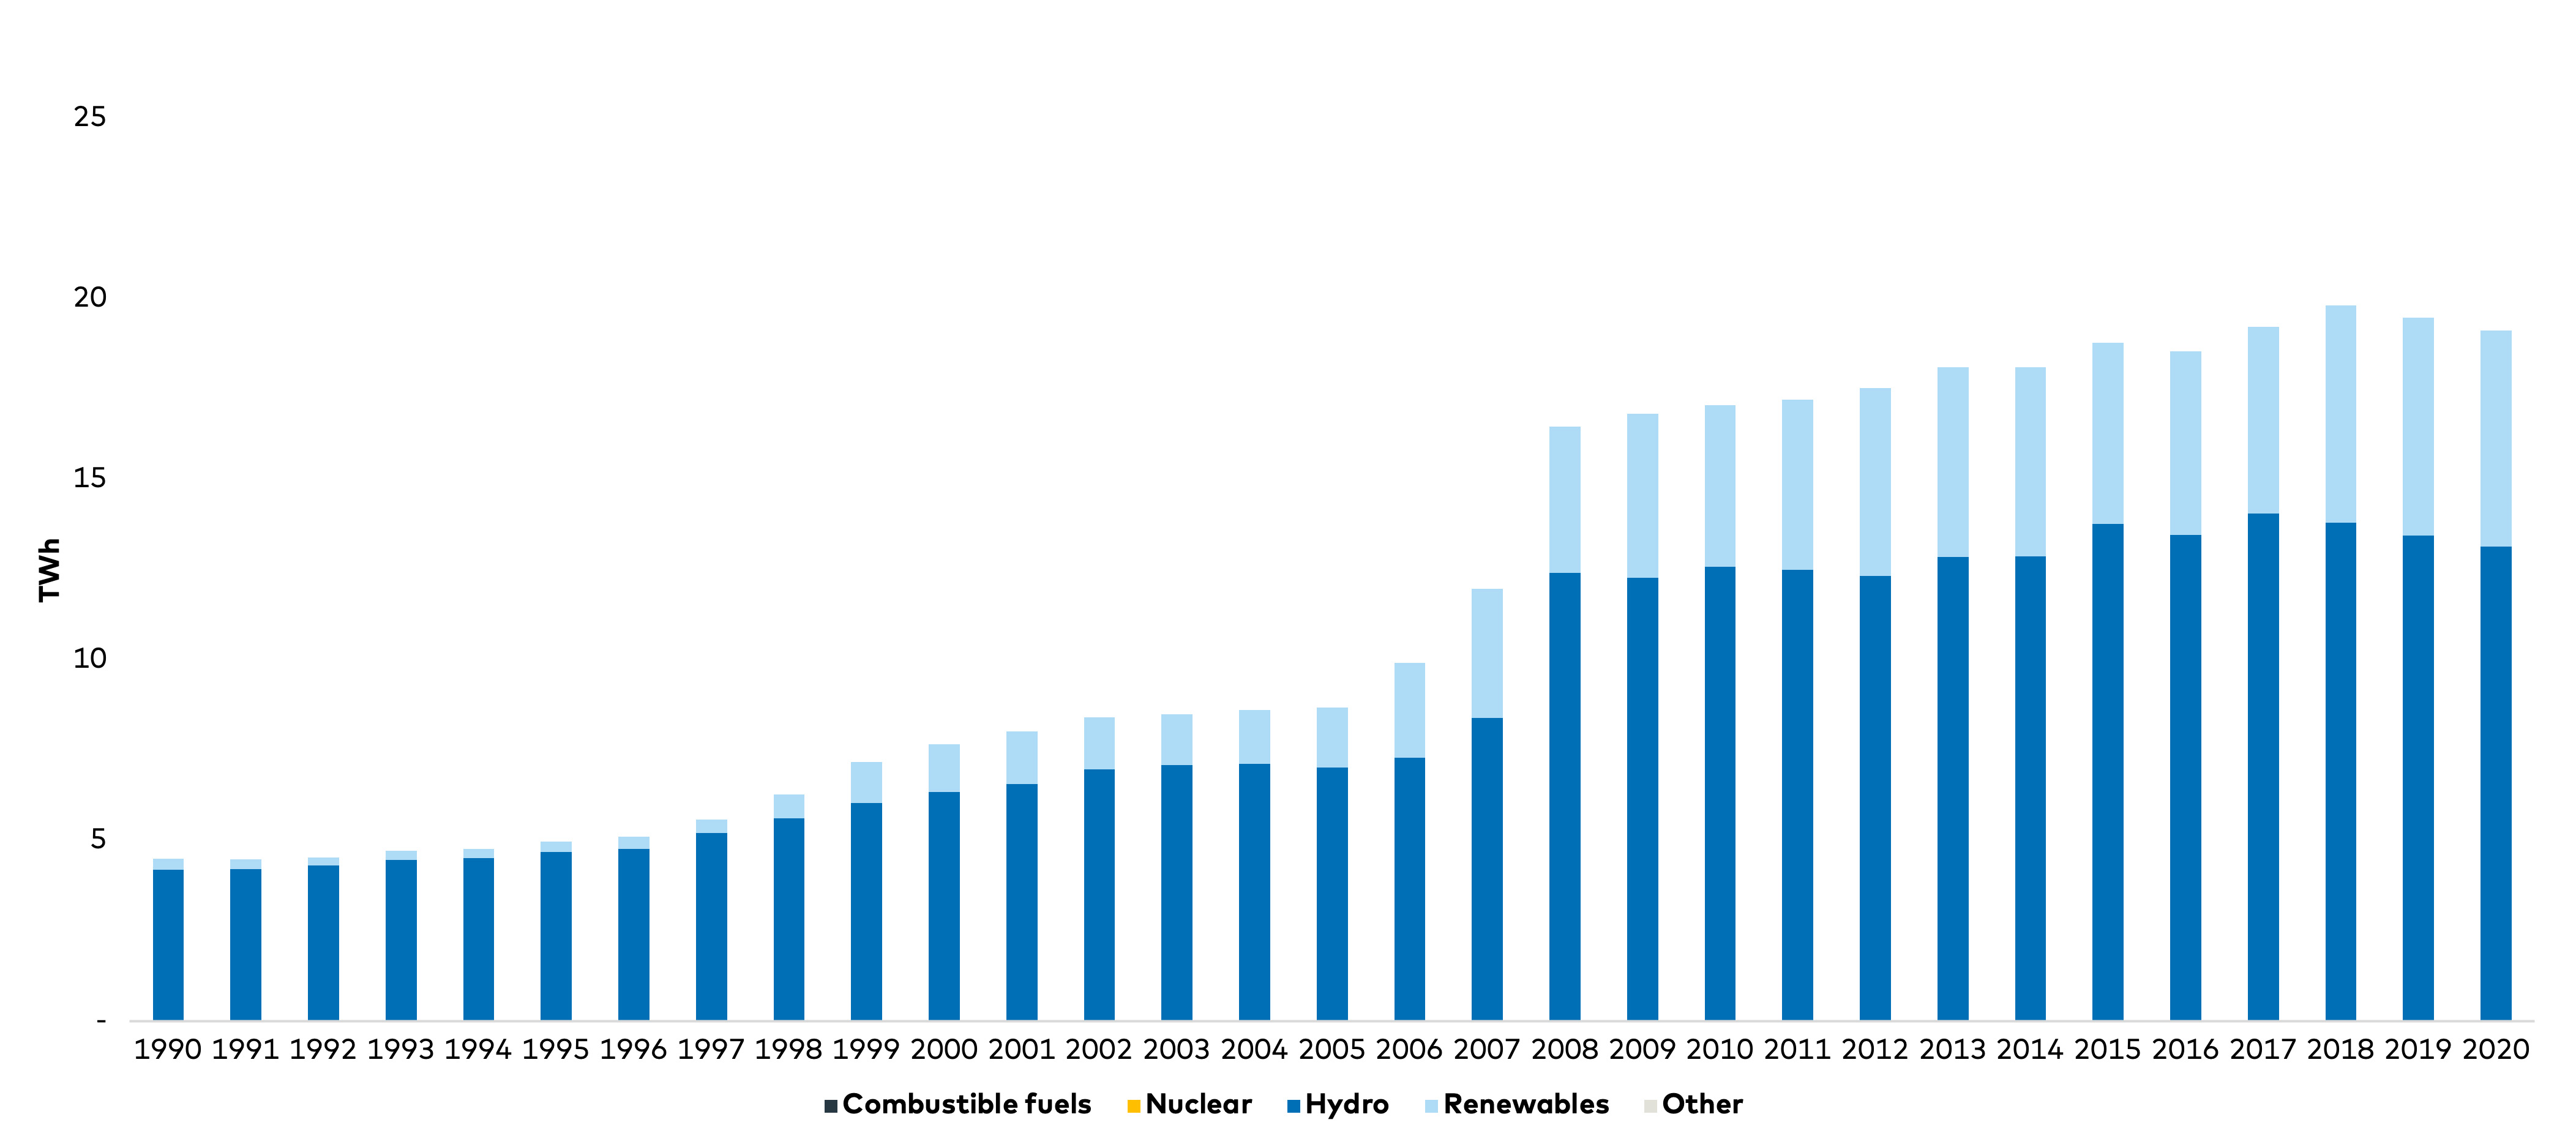
4.1.1 Hydropower plants in Europe
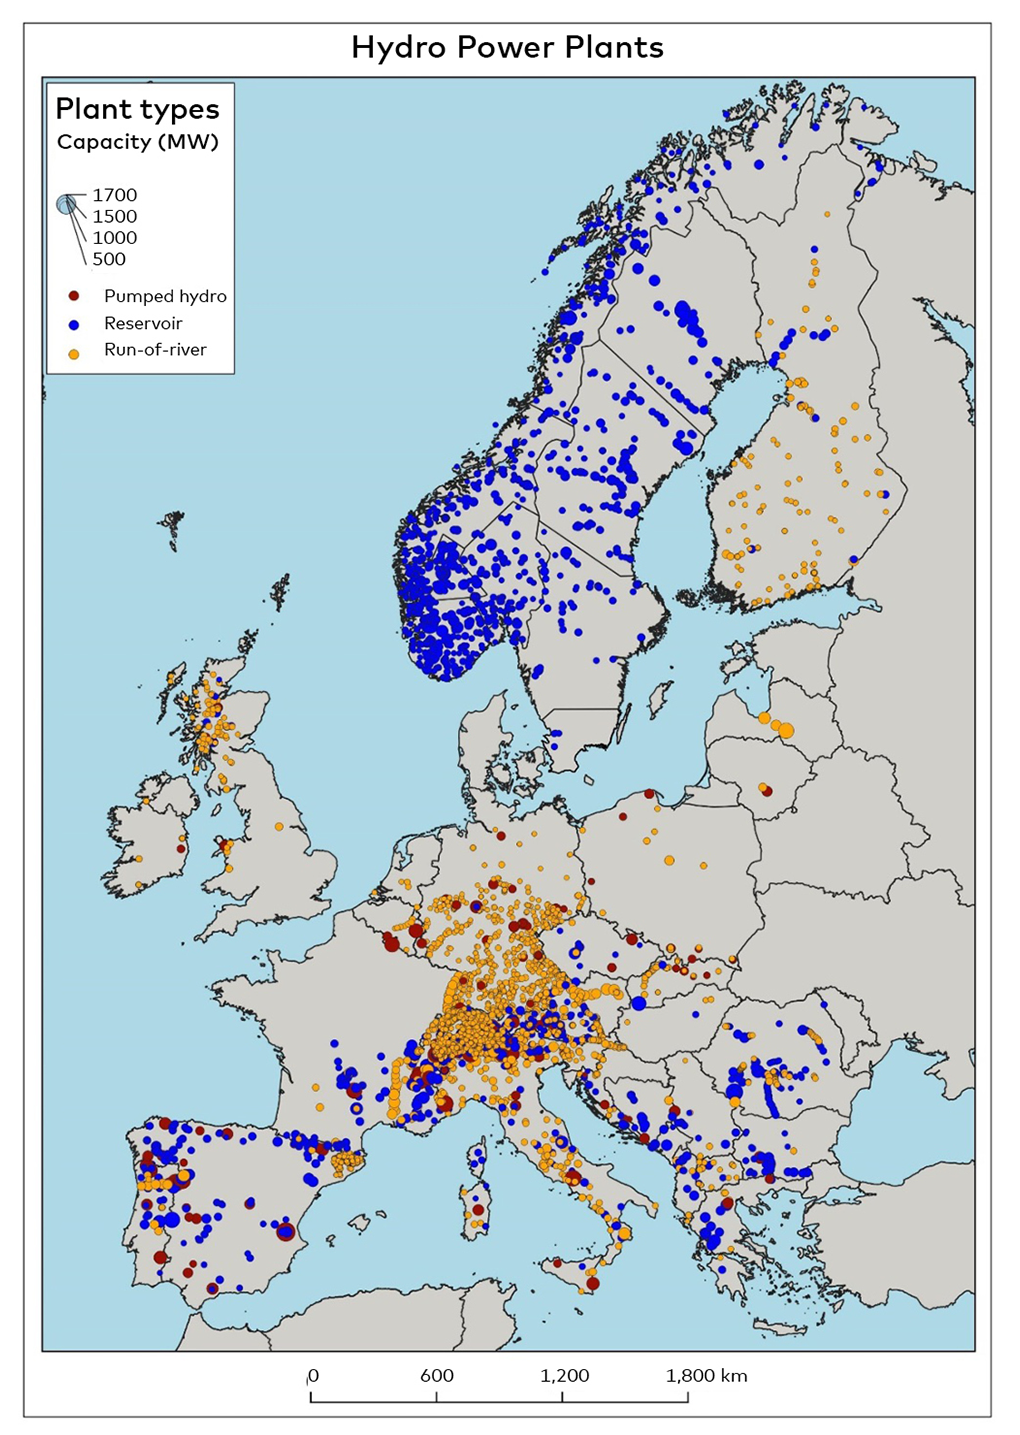
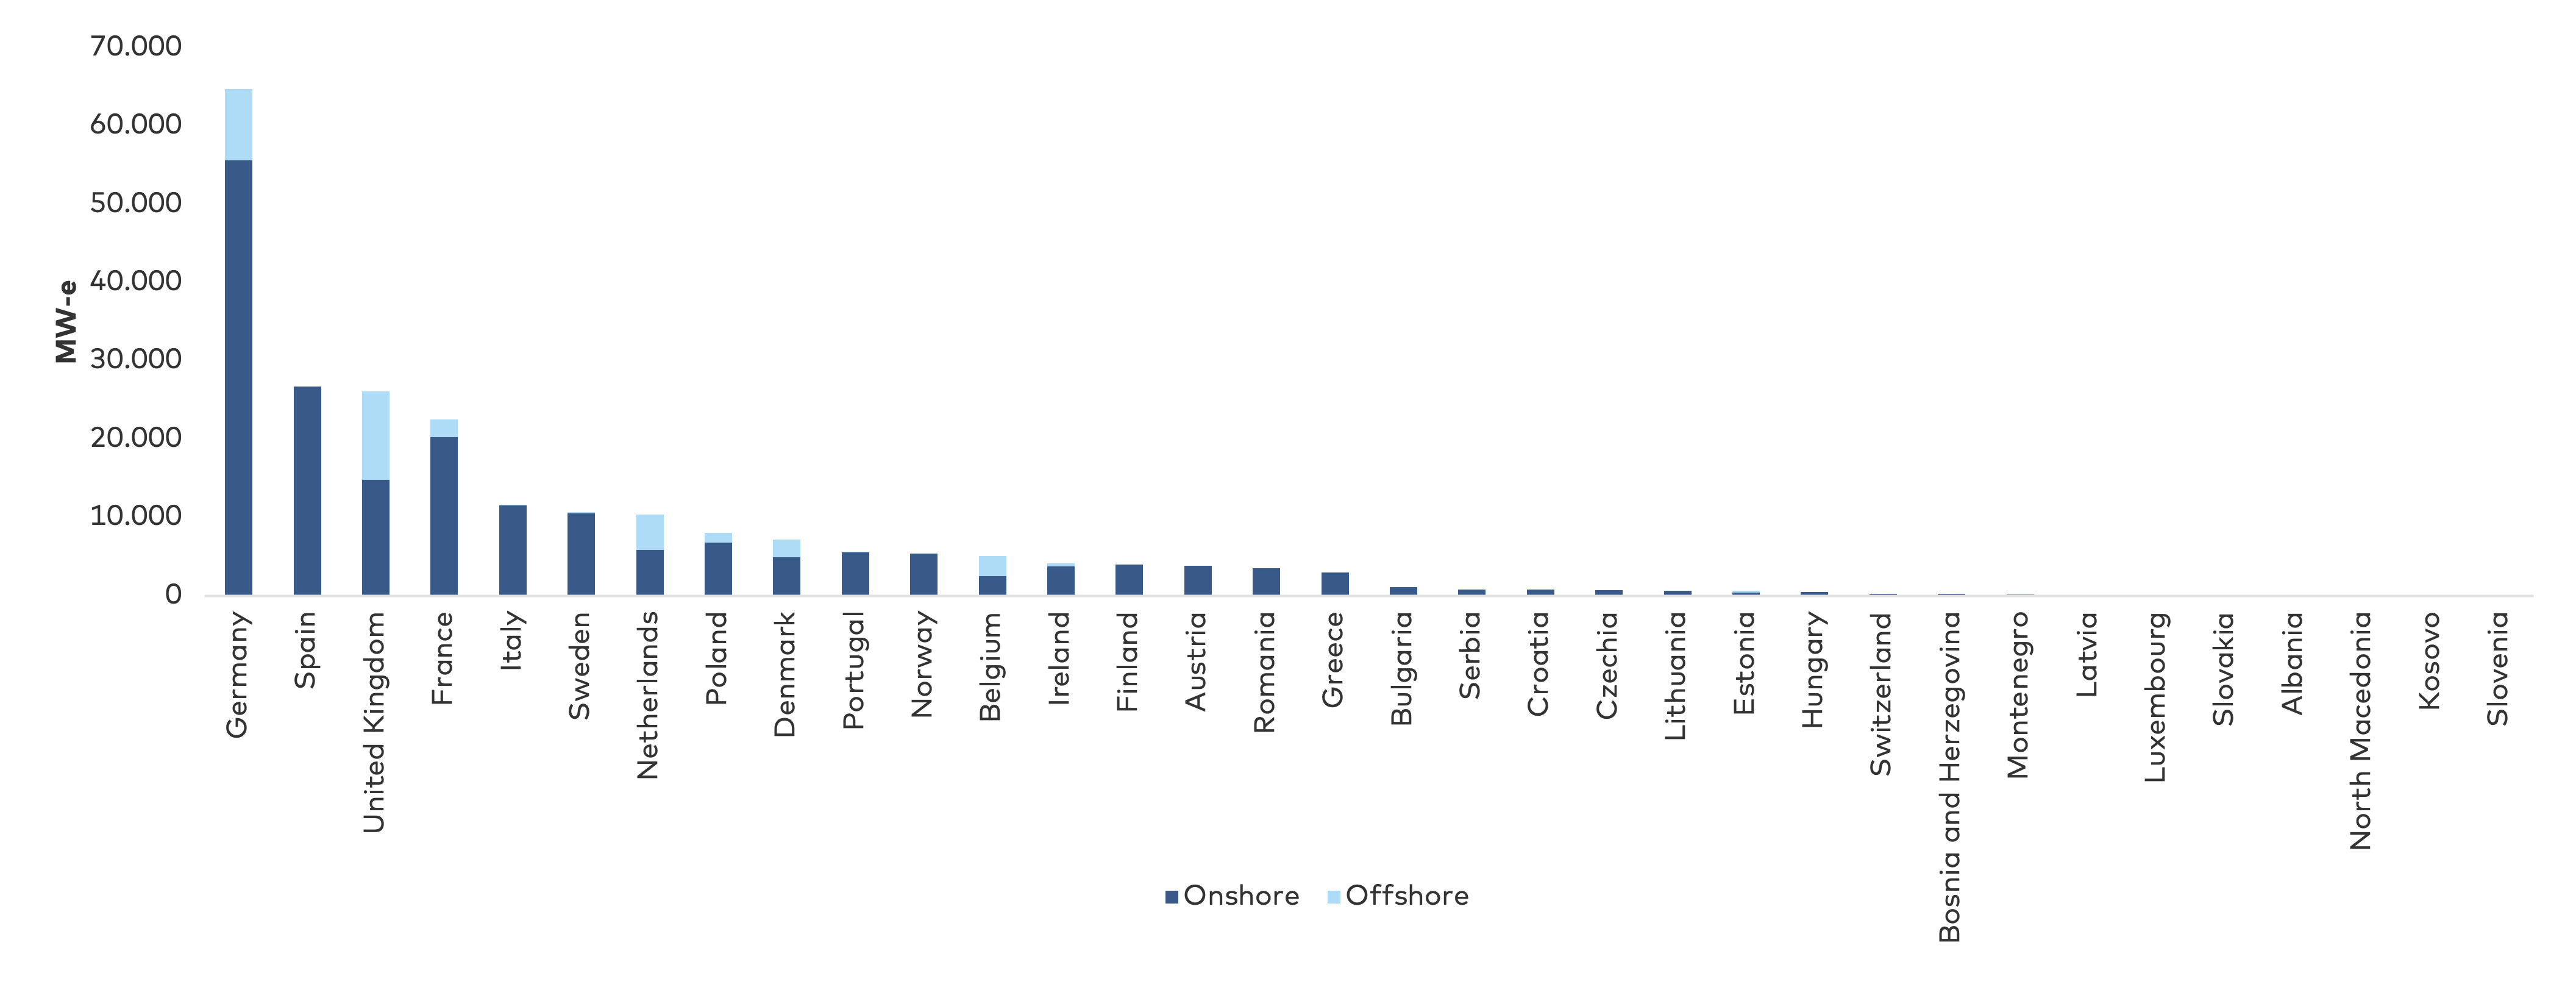
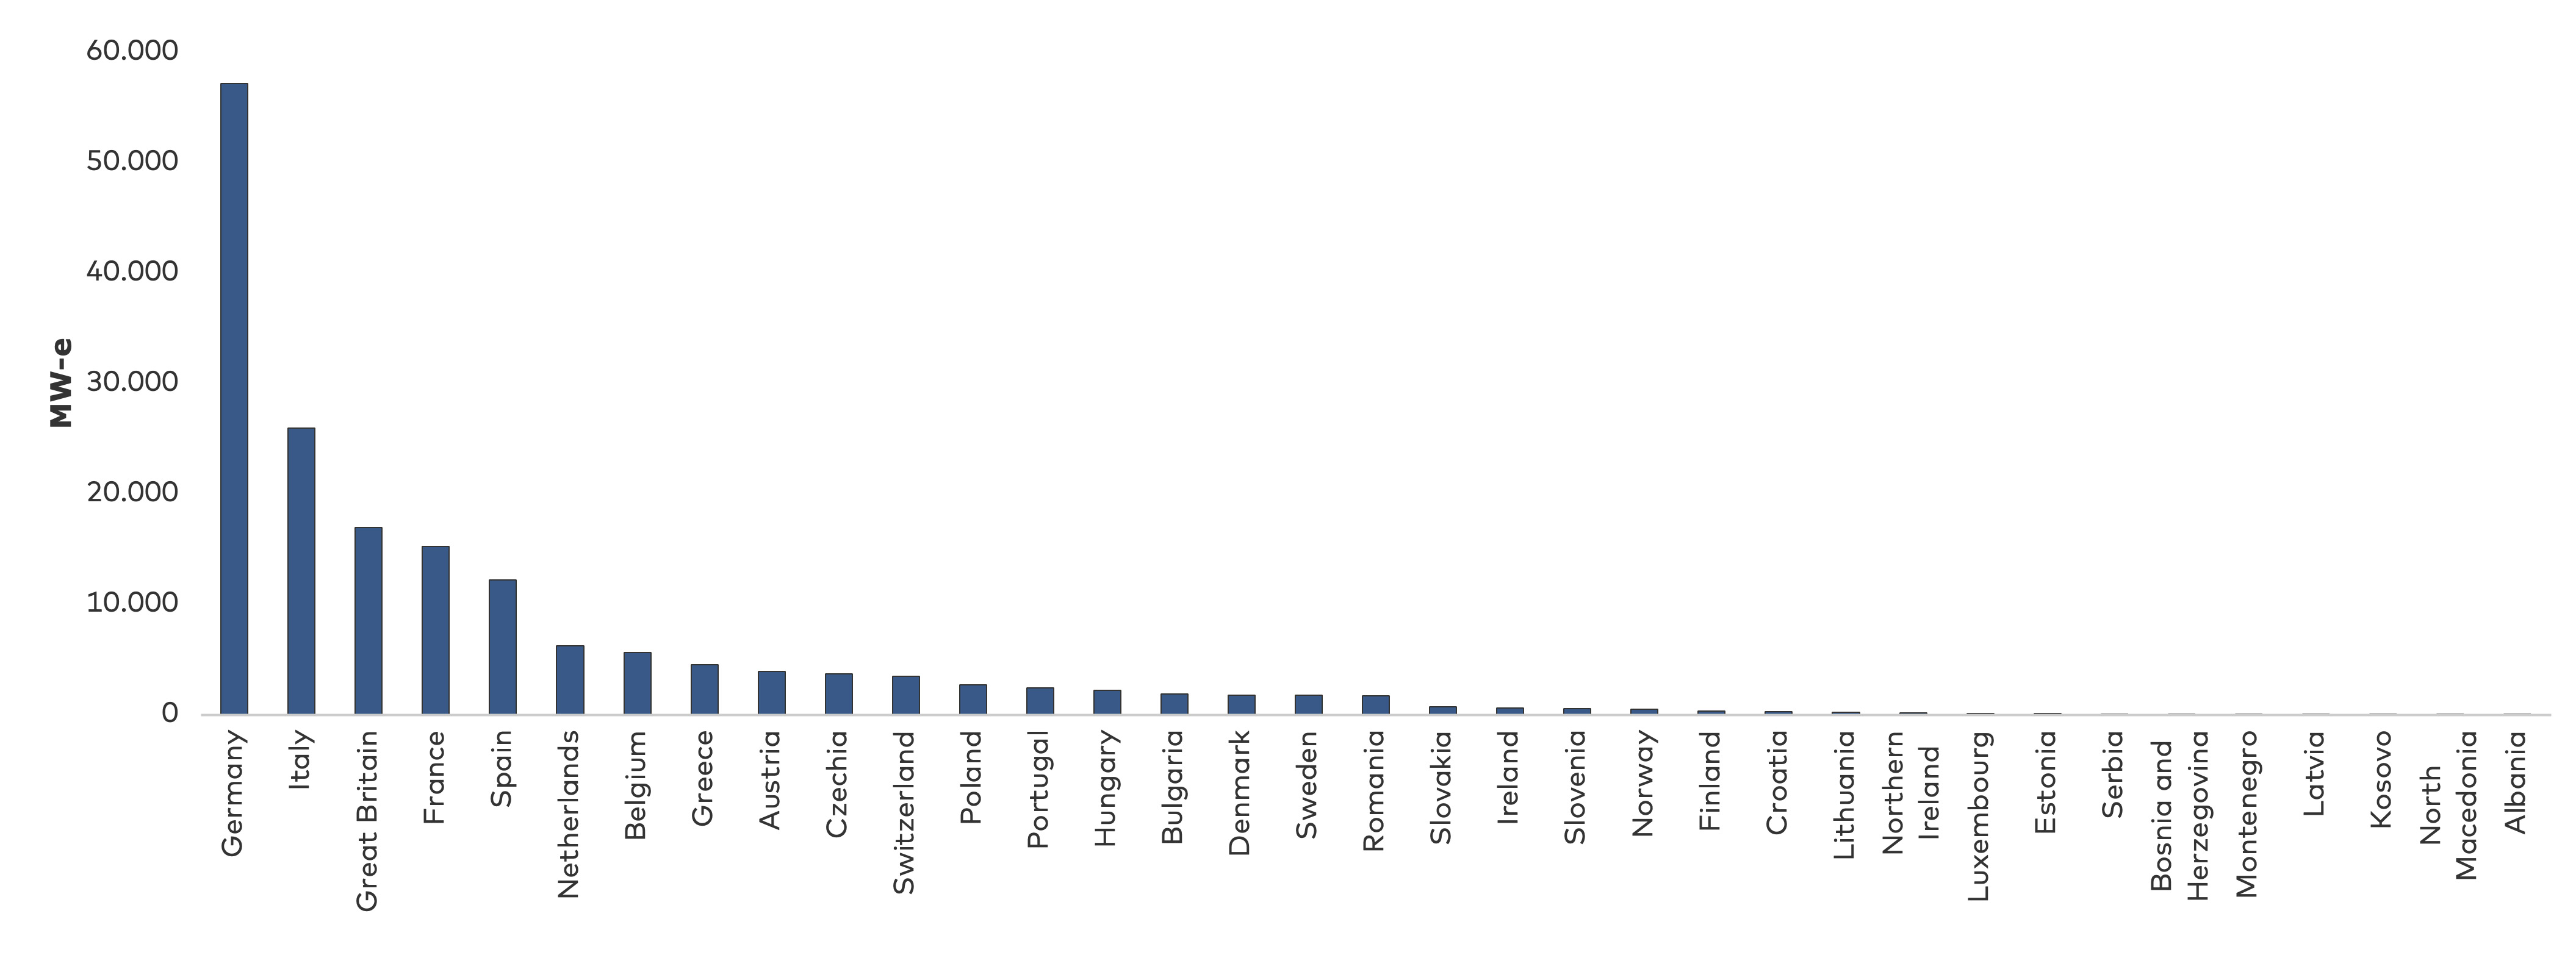
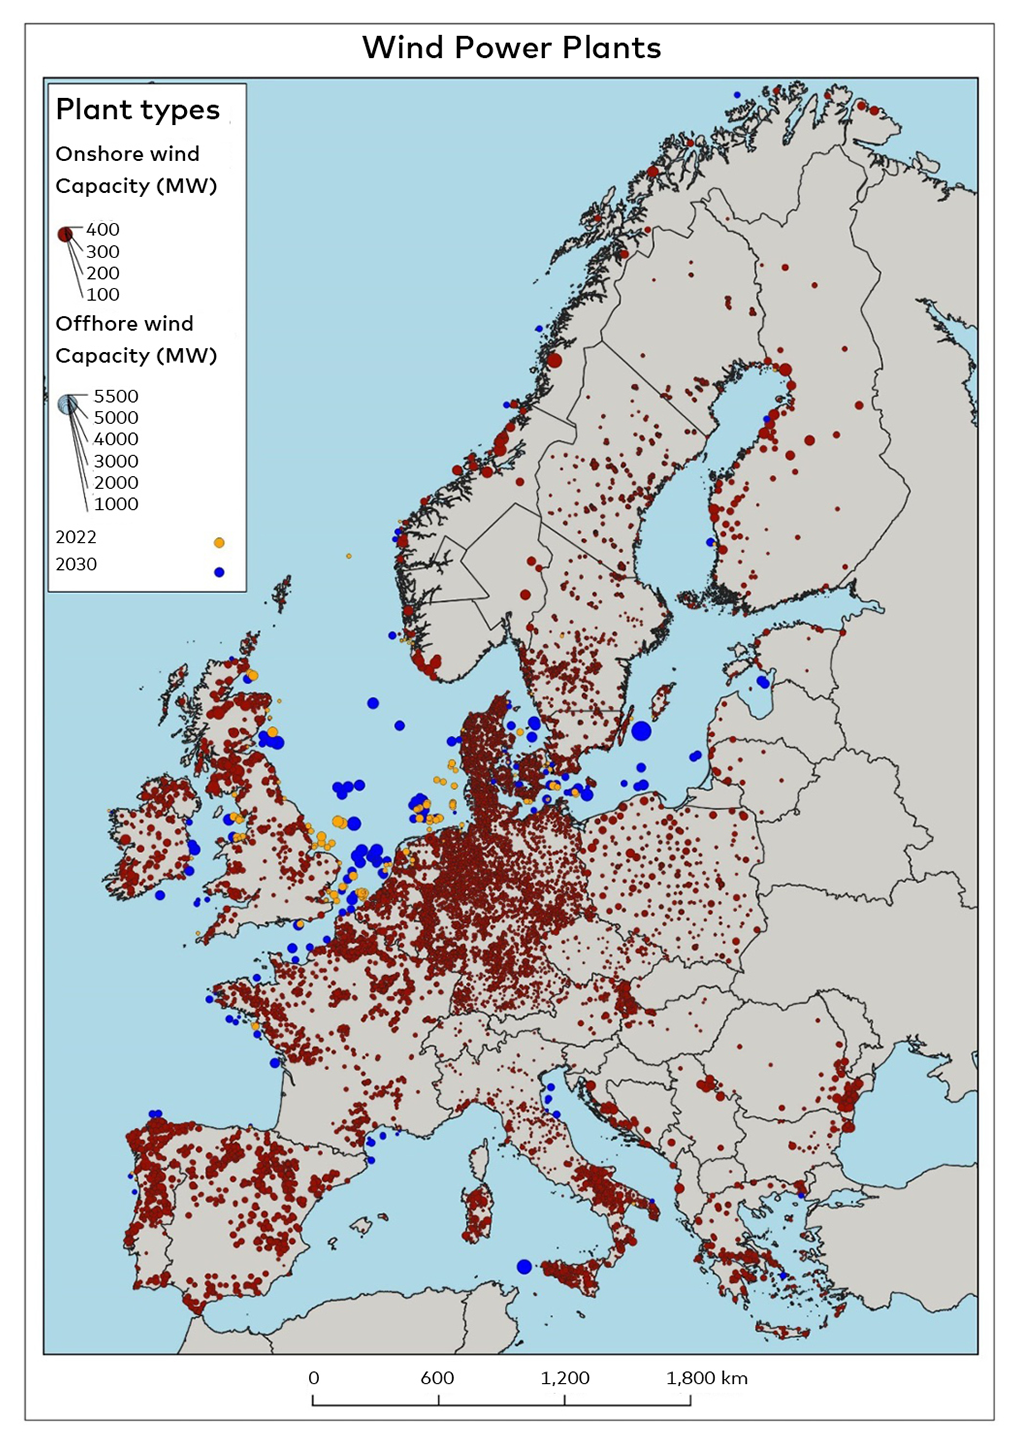
4.1.2 Renewable energy in Europe
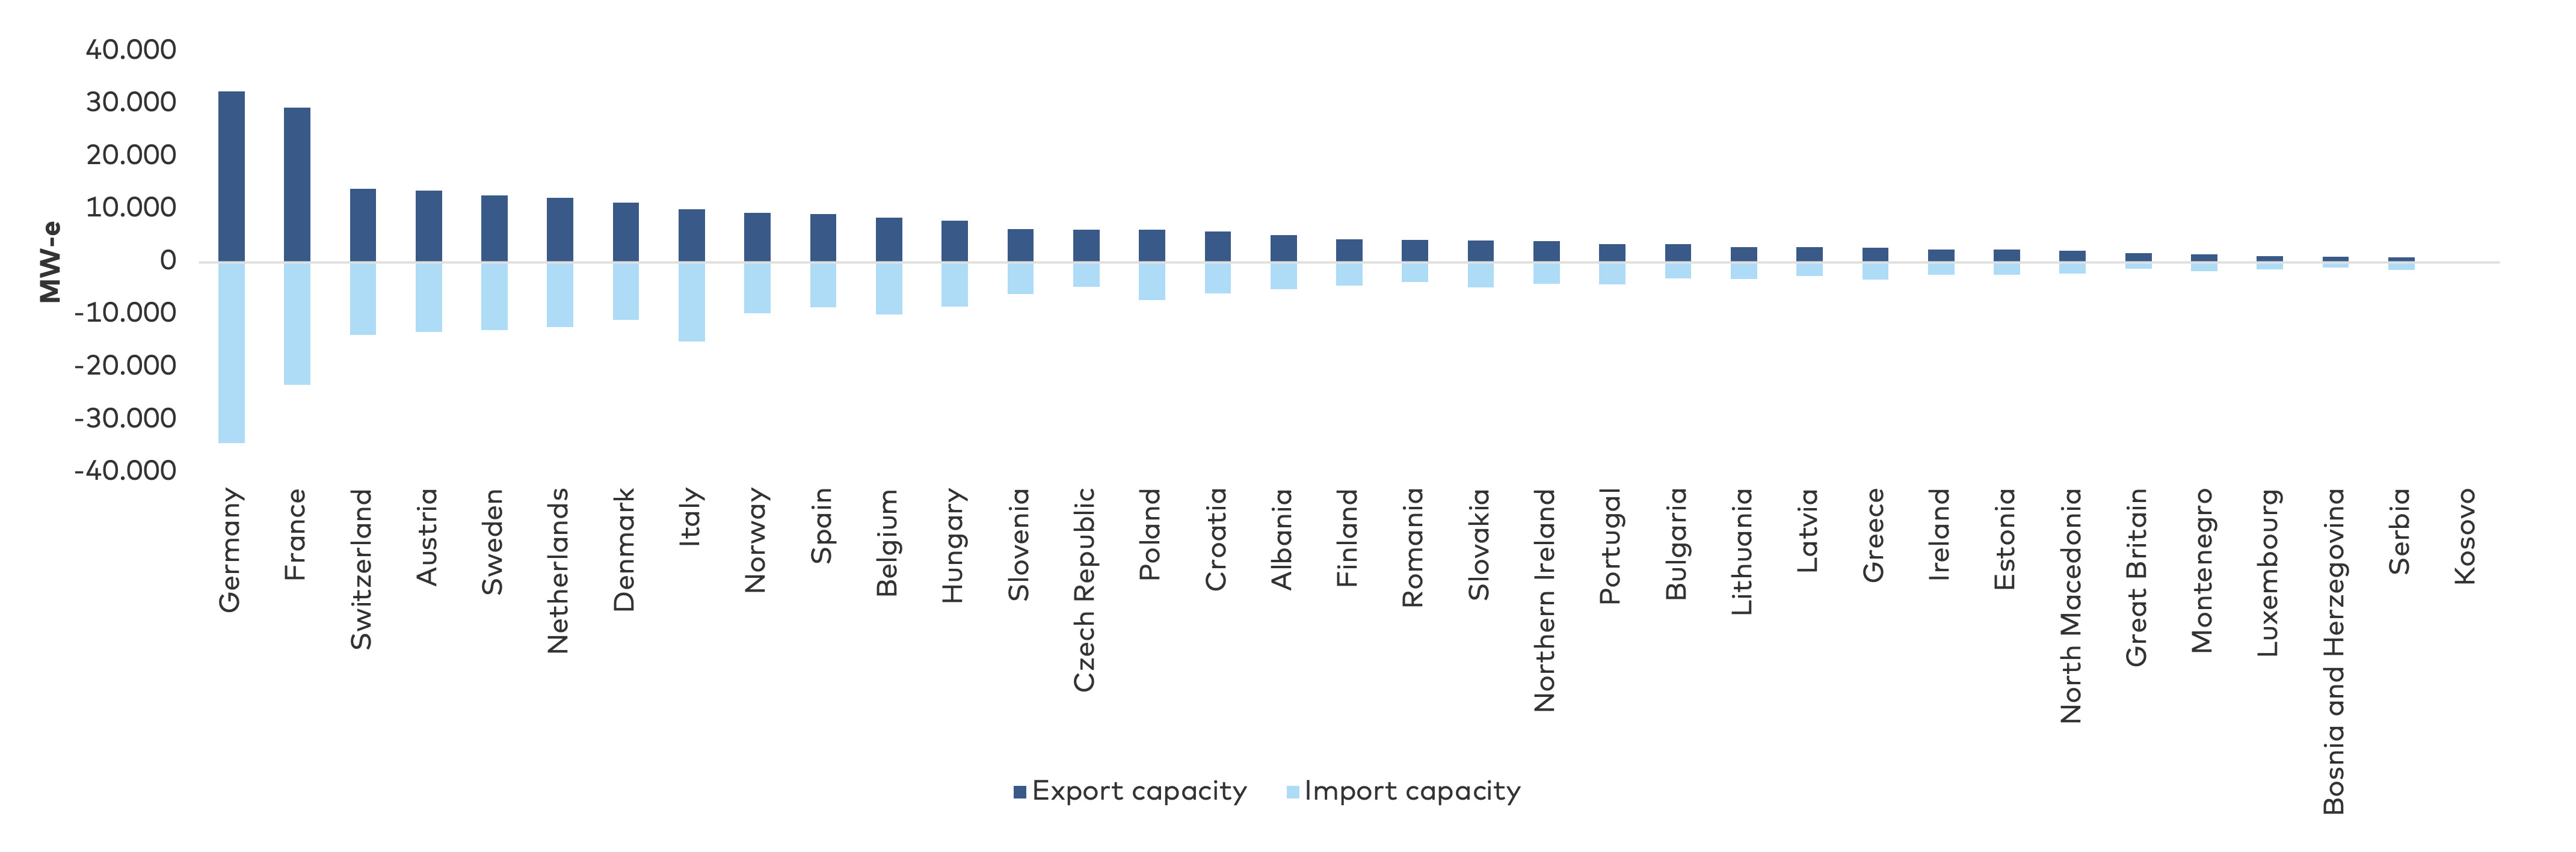
4.1.3 Interconnectors and electric transmission in Europe
The electricity market zones with interconnectors within Europe are shown on the map in
The transmission system in Europe is shown on the map in
The development of cross-border energy infrastructure (electric, natural gas, hydrogen, etc.) is, to some extent, governed by the Projects of Common Interest (PCI) in the European Union.


4.1.4 The electricity market structure in the Nordic countries
The futures market is active from the day before operations until years ahead. On the day before operation, trading takes place on the day-ahead market. By noon 12.00 – after the market has closed – the balance-responsible parties submit binding action plans for consumption, production and trading for the following day. Operator plans are subsequently approved by the system operator but can be changed up to 45 minutes prior to operation via trading on the intraday market, which is open from 2 p.m. and up to one hour before operating hours. From this point, responsibility for balancing the system lies solely with the system operator, which can adapt production through several system services. The system operator maintains the balance by buying electricity (up-regulation) or selling electricity (down-regulation) in the regulation market. At the same time, the frequency of the network is stabilised by operating automatic reserves. The structure of the wholesale market is presented in
In addition to being responsible for the electricity markets as shown in


The natural gas system in Europe
The European natural gas system is shown on the map in
4.1.5 Natural gas market
- Shippers are commercial actors engaging in wholesale gas transport in the transmission system. The shippers purchase transport rights to deliver the gas to one or more gas suppliers in the distribution systems. The shipper is responsible for balancing deliveries into the transmission system and despatches out of the transmission system.
- Gas suppliers supply consumers with gas and invoice them for the gas received.
- The storage customer owns the gas that has been transferred by the shipper for storage in the gas storage facilities. The storage customer can sell the gas from the storage facility to a shipping company or another storage customer.
- The retail market is responsible for the distribution of gas from the transmission system to consumers and retail trade in gas to the end consumer.
- The gas transmission system is operated and owned by the TSO, who is responsible for volume balancing and the management of gas supply in the event of emergencies.
- The gas distribution systems are owned by the distribution companies.
- The gas storage facilities are owned and operated by GSOs or commercial actors. The storage facilities are operated on commercial terms. The storage facilities sell a product that allows the storage customer to store, inject and extract gas. This means that the storage facilities both compete with each other and are providers of other flexibility services.

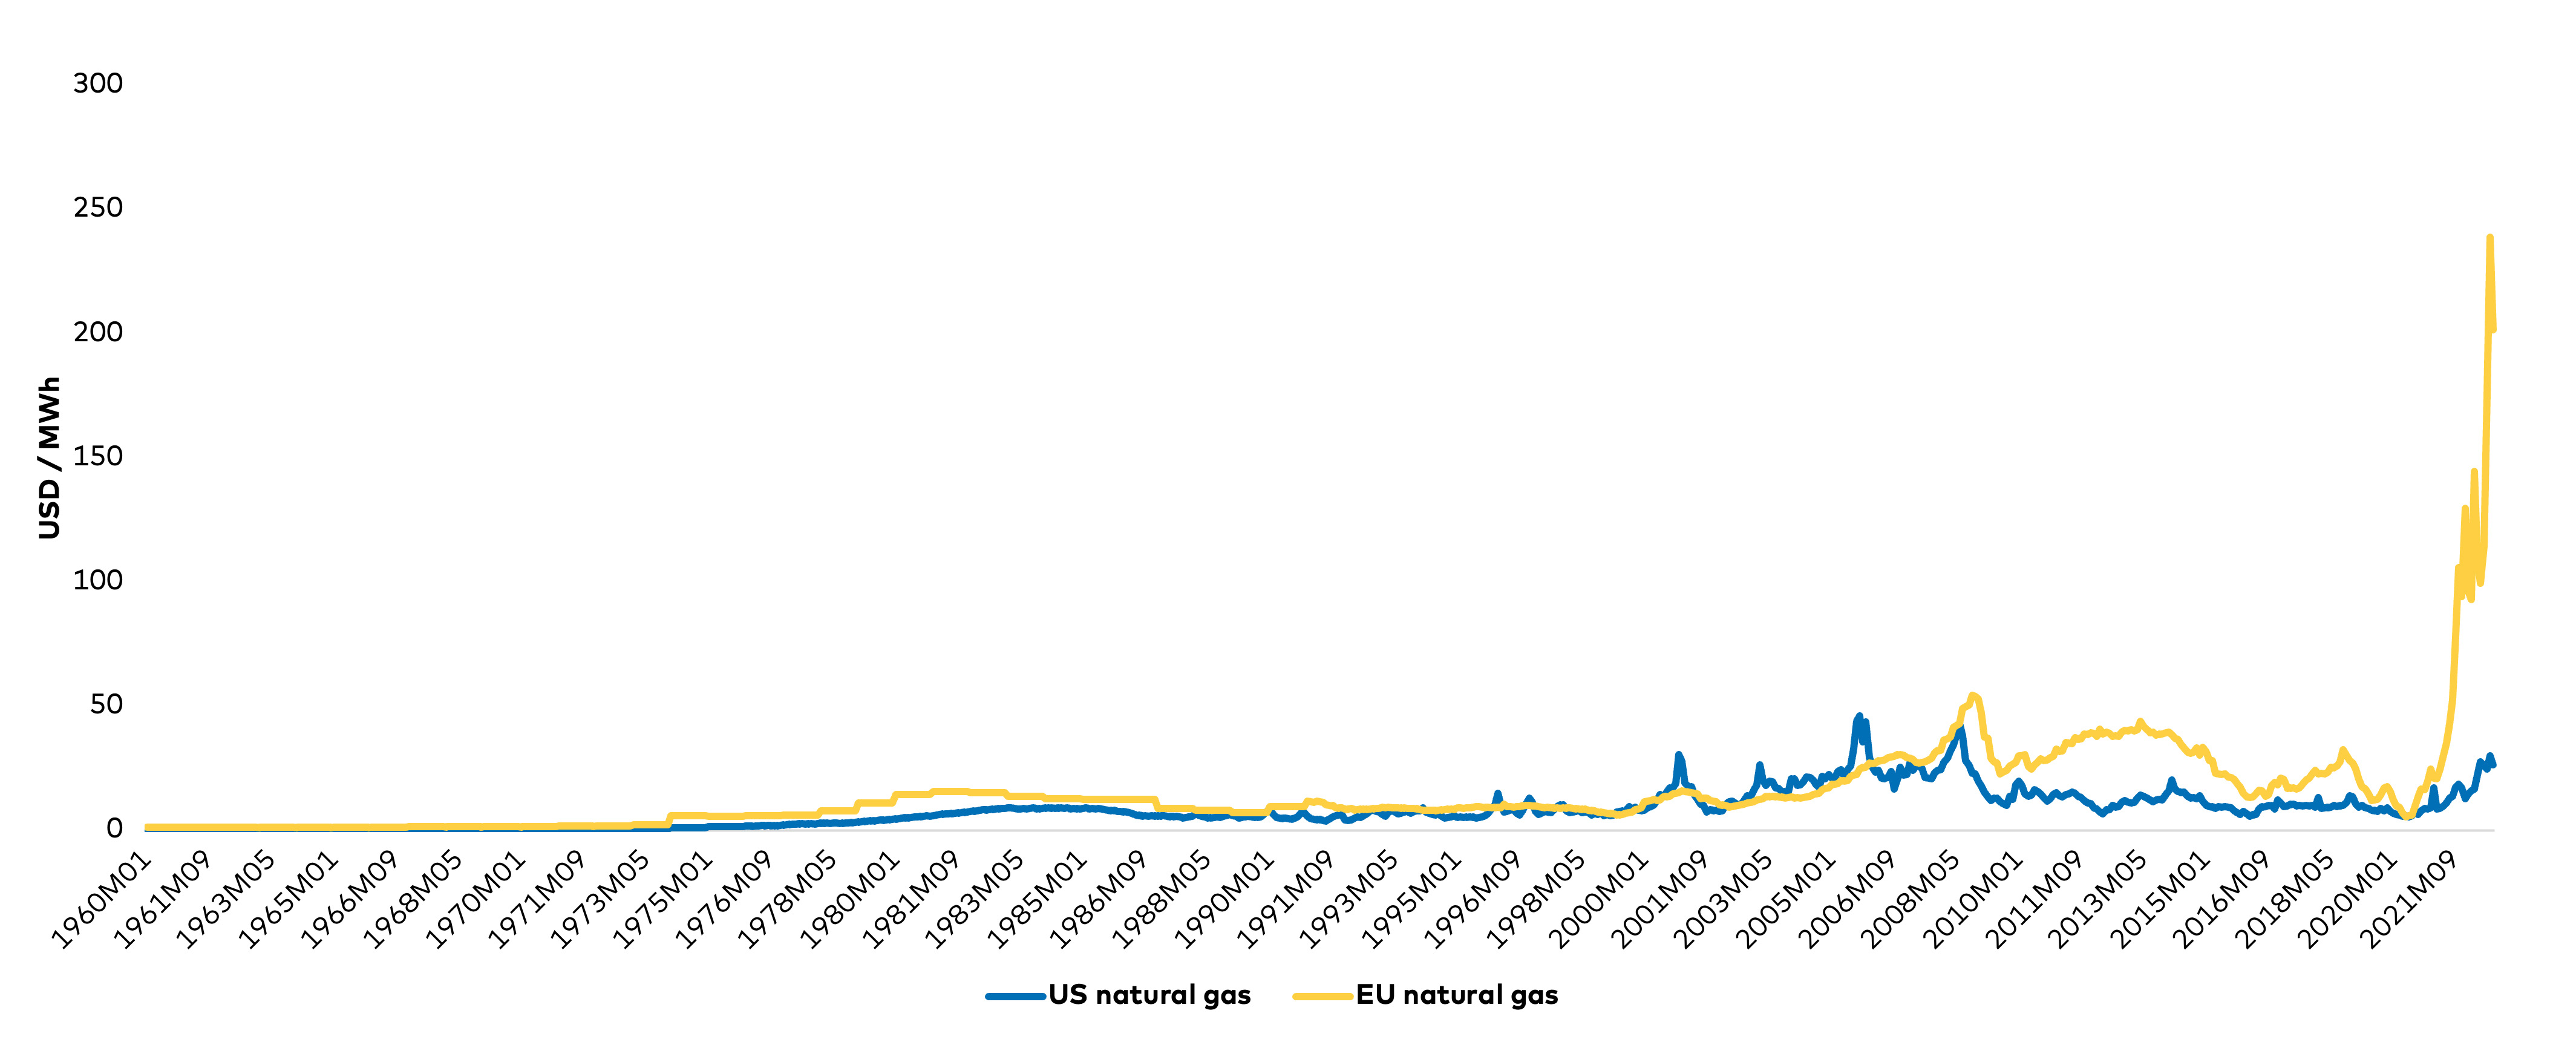
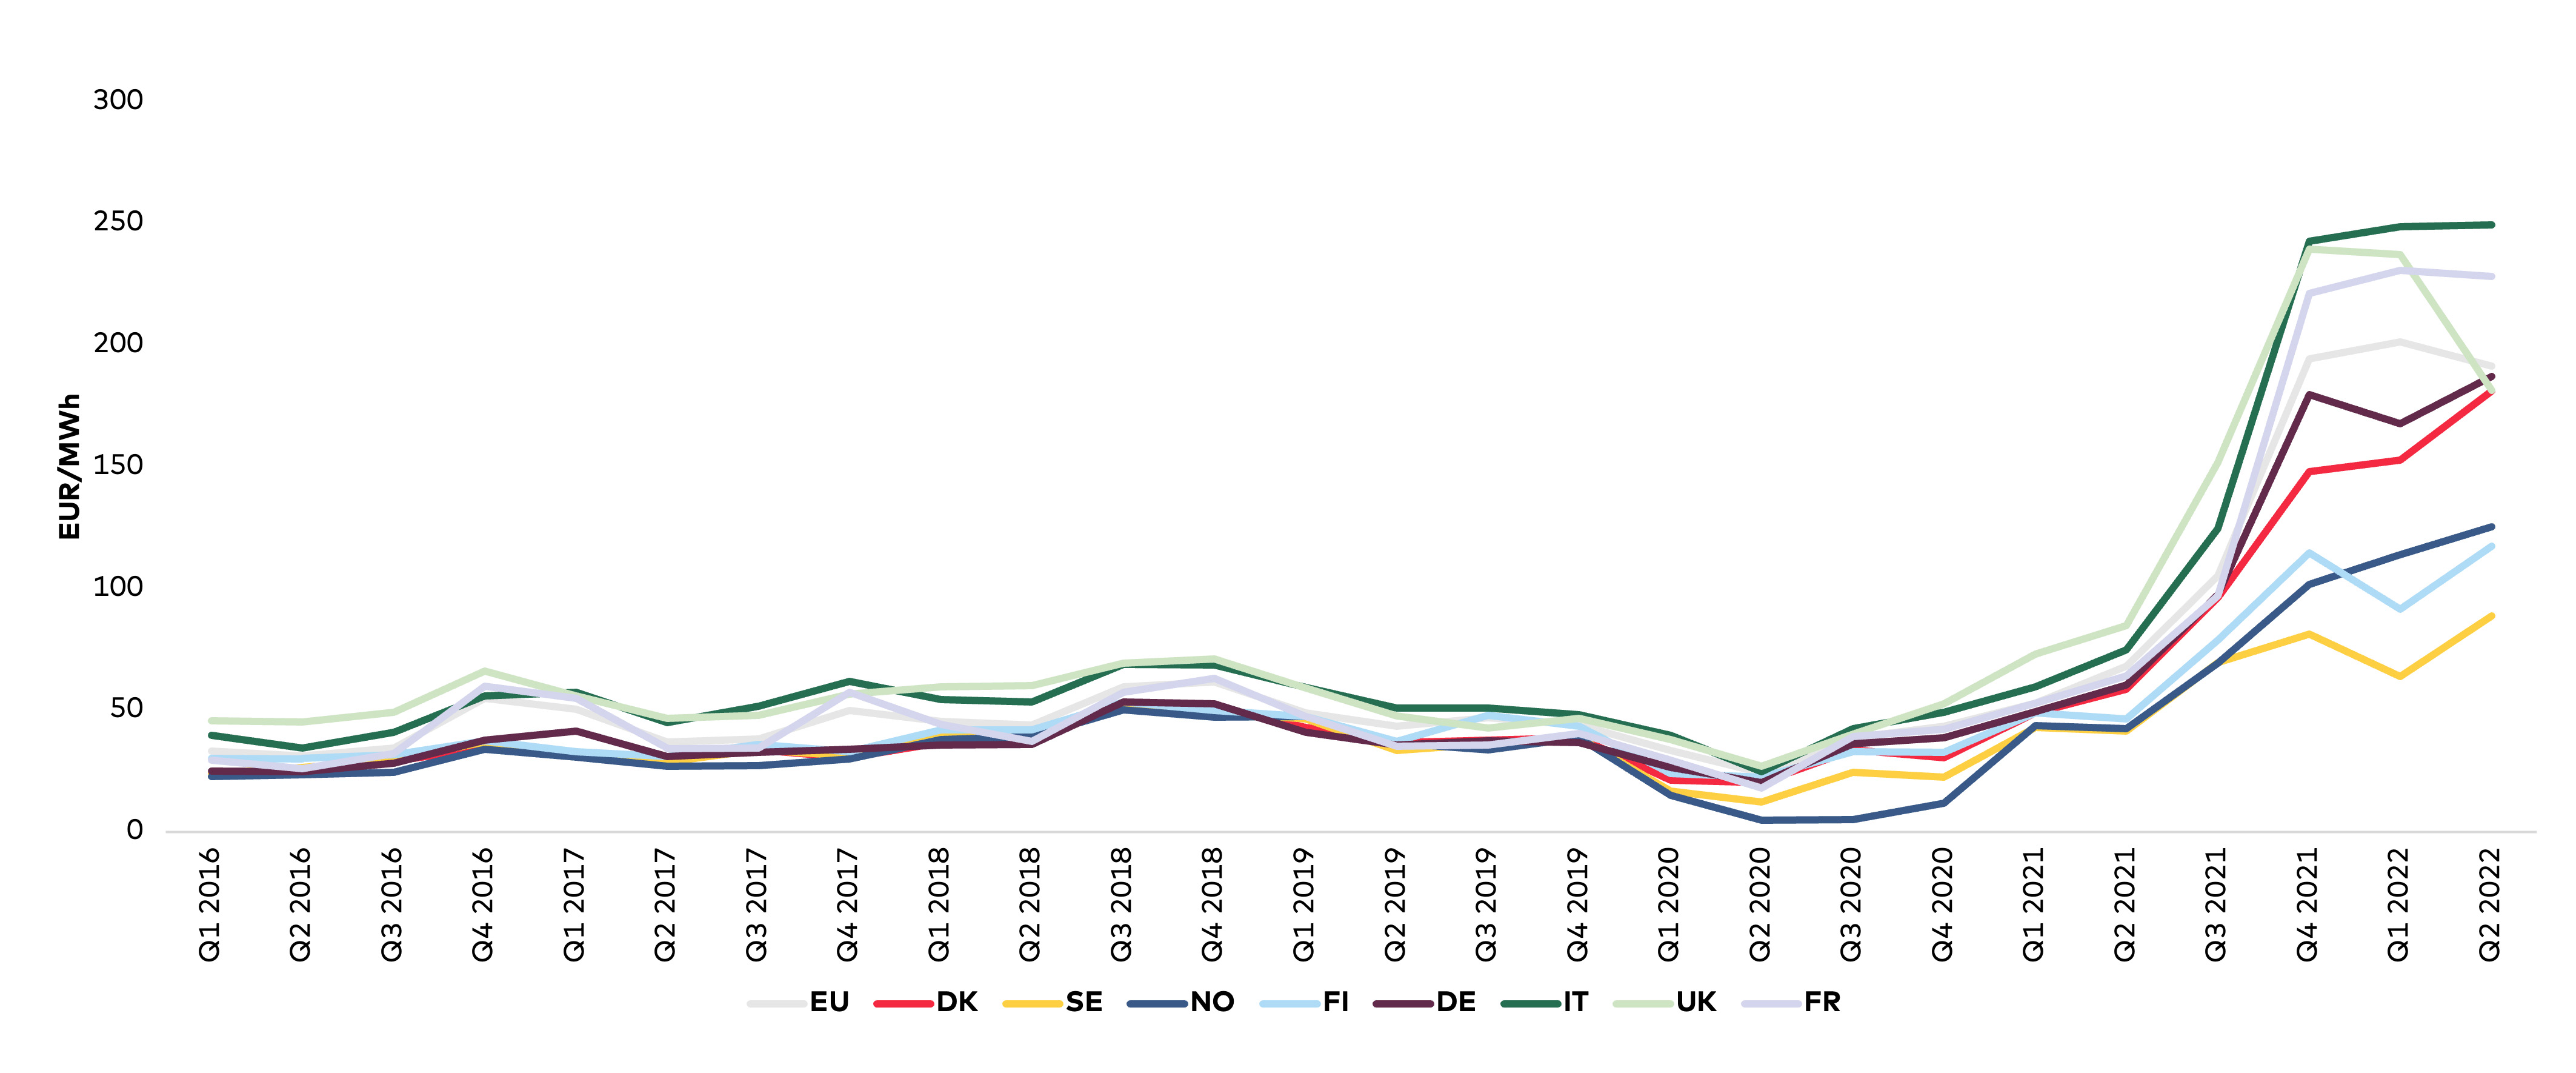
4.2. Natural gas and electricity prices in Europe
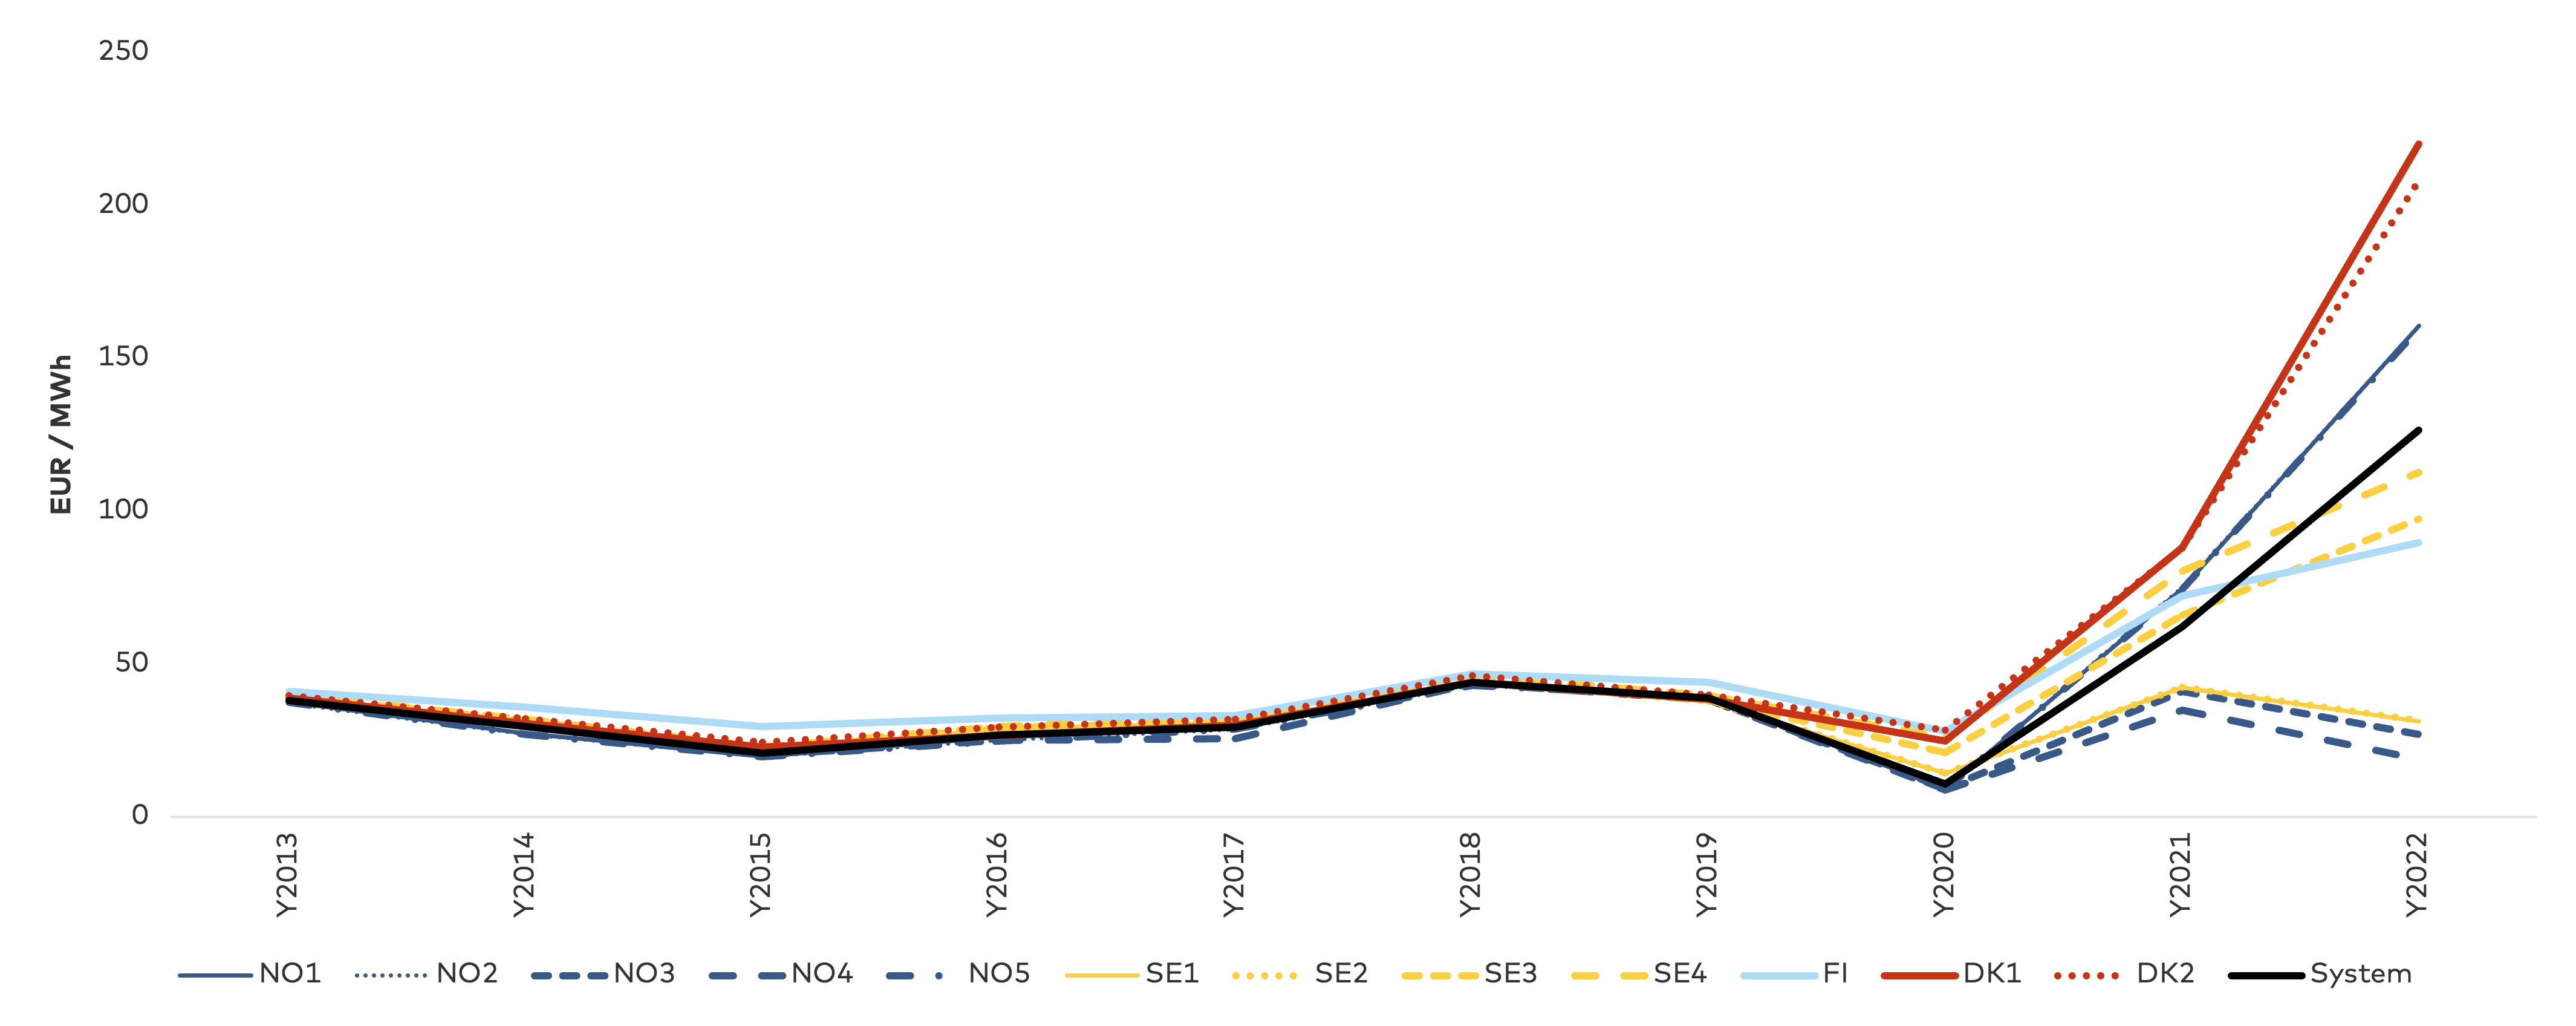
The energy crisis is generally manifesting in high natural gas and electricity prices increases. As shown in Figure 25, the natural gas price is more than four times higher than any previous peak price. The same can be said of the electricity price in
4.3 The energy system in Iceland

Power-intensive industries, mainly aluminium smelters, use around 80% of all electricity produced in Iceland, while other businesses use around 15% and homes 5%. A number of energy-intensive industries, combined with high heating demand, a small population and low-cost electricity production, make Iceland the largest per capita producer of electricity in the world.
One distinguishing feature of the electricity market in Iceland is the dominant size of the publicly owned generator Landsvirkjun. Today, most of the hydropower plants in Iceland are owned by Landsvirkjun, and the company generates about 73% of all electricity in Iceland. The company’s dominant position among energy producers in Iceland results in limited direct competition in the wholesale market. The largest share of Landsvirkjun’s energy generation goes to large industrial consumers (minimum of 80 GWh annual consumption), with most of the energy locked up in long-term power purchase agreements (PPAs).
The electricity transmission system is operated by Landsnet, and the company’s majority shareholder is the power producer Landsvirkjun (65%). While local distributors distribute energy to the retail market, large users are connected directly to the transmission network and contract with the TSO, Landsnet and Landsvirkjun on supply.
Due to its isolated energy system and limited import of fuels, Iceland is not directly affected by the current energy crisis in Europe. However, the effects can be felt indirectly through increased oil and petroleum prices, and air travel prices. Energy prices in Europe will also indirectly affect Iceland through higher goods prices as production costs rise in Europe.
While electricity prices have risen in Europe over the past year, they have remained stable in Iceland. This has resulted in growing demand for energy from industries in Iceland and increased interest from international industrial companies in relocating to Iceland. While Iceland has historically produced an energy surplus, growing demand from a diverse group of actors is putting pressure on the market. In recent years, a number of data centres have relocated to Iceland, and energy-intensive industries, such as food producers and the biotechnology industry, have also shown an interest in joining them. The increasing demand from larger consumers for renewable electricity, combined with a need for decarbonisation in the transport and the fishing industry, could affect the country's energy security.
5. DRIVERS, PREPAREDNESS AND RESPONSES
This section of the report analyses the drivers behind the crisis, the preparedness of each of the Nordic countries and their respective responses to the crisis. Before taking a closer look at each of these aspects, we briefly describe the drivers, preparedness and responses.
Drivers
The current energy crisis is ultimately the result of the decisions societies have made in planning their energy systems. The drivers described below could perhaps have been avoided if other technological visions and different energy infrastructure projects had been adopted. Discourse around our future energy supply is essential to ensure a successful green energy transition while balancing the three pillars of the Energy Trilemma of security, affordability and sustainability.
The drivers we have identified are shown in

This report argues that the current energy crisis has not been caused by a single incident or driver. Instead, it is a complex problem with several underlying causes triggered by the reduction in Russian fuel supplies, the unavailability of nuclear capacity in France, the drought in Europe and a speedy economic recovery following the COVID-19 lockdowns etc.
Even if Russia had not reduced its natural gas supply to Europe, the drivers we describe in the following would still have been present, creating issues for the energy system in terms of long-term security of supply. The drivers should not be viewed as standalone factors, since they are interdependent and consequently impact each other. While some of the drivers are already known to impact security of supply and energy prices, the manifestation of all drivers simultaneously has created a perfect storm, resulting in potential supply disruptions and high prices. In reality, it is the underlying risk factors, triggered by reduced fuel supplies from Russia, that have created the current energy crisis.
The extent to which each driver has impacted the current situation is not quantified. Such calculations are reserved for any subsequent report. For the time-being, we simply argue that there are a series of underlying causes that have contributed to the current energy crisis and that it is the manifestation of all the drivers simultaneously that has caused a perfect storm in the energy markets.
Preparedness
The energy system in each of the five Nordic countries is unique, even though the product consumers receive is the same – electricity, gas, heat, etc. The system each nation has built to generate and distribute electricity is different. These differences are attributable to natural conditions, organisational structures and investment in different technological visions.
Moreover, the relevance of security of supply, affordability and sustainability would essentially appear to change depending on current societal trends. There is generally a focus on one or two of these elements, which skews decision-making towards one of the three dimensions in the Energy Trilemma. With the advent of the energy crisis, we have recently gone from a situation with economic growth and low-interest rates and a focus on sustainability to a situation with a focus on security of supply and affordability of energy. Adopting a narrow focus on one of these factors generally appears to trigger a set of unintended effects with implications for security of supply.
The impact of the drivers in terms of security of supply at national level is analyzed by assessing each country’s exposure and comparing it to other countries. The Nordic countries have been impacted differently by each of the drivers, mainly as a consequence of the composition of each country’s energy system (mix of supply sources, infrastructure, degree of policy interventions and dependency on imports). This has resulted in different preparedness levels among the Nordic countries. The analysis also shows that each of the Nordic countries’ electricity systems offers its own distinct advantages, which can be leveraged in a common Nordic market.
Responses
The Nordic governments have applied different initiatives to respond to the energy crisis with a view to mitigating energy poverty. While the increase in energy costs unleashed by the crisis have been felt by consumers, the Nordic countries have shown a degree of resilience and have been less affected by changes in energy poverty than other countries. Here it should be borne in mind that an increase in energy costs generally has a greater impact on the poorest households, and that this has also been the case in the Nordics, but to a substantially lesser degree than in the rest of Europe.
5.1 Electricity market structur
Influence on the energy crises
The electricity market structure in the Nordic countries and Europe had several unintended effects not envisioned at its inception. We will touch upon these separately in the following as we discuss the decommissioning of power plants and the introduction of subsidized renewable energy. The reason why some power plants were decommissioned is reflected in the dynamics of the marginal pricing principle applied in energy-only markets. The structure of the electricity market is viewed as a prerequisite for some of the subsequent drivers.
Context
The Nordic countries (excluding Iceland) were the first to reform electricity markets in Europe, together with England and Wales. While the Nord Pool electricity market traces its origins to 1932, it began to resemble its modern form with the deregulation of Norwegian electricity markets in 1991, followed by the addition of neighbouring Scandinavian countries Sweden (1996), Finland (1998) and Denmark (1999). The Baltic countries were added later, along with new transmission lines aimed at linking market areas. The electricity markets in the Nordic countries are closely connected to the rest of Europe, with a goal of creating an internal energy market connecting all EU member states via a single liberalised electricity market. The idea is based on the agenda of the free movement of capital, goods and people. The planning of energy infrastructure is mostly agreed upon at a national level. In contrast, the development of new Projects of Common Interest (PCI), such as interconnectors, is agreed upon at the EU level and between countries.
The reformed electricity markets in most western European countries are increasingly being coupled. Electricity is sold between the Nord Pool countries and the north-westnorth-western European markets through market coupling price mechanisms. In the event of In cases with no bottlenecks in the European electricity system, hydropower in Norway can, in principle, compete with nuclear power in France.
The electricity markets in Europe are developed as zonal markets. This means that the market operator has defined an area (market zone) where the electricity price is uniform. Any congestion within that zone is settled in the real-time markets or through bilateral contracts with the TSO. An internally congested zone will be expensive to operate, which calling s for either grid reinforcements or splitting of the zone into more zones. Such a situation can, for example, be seen in Germany, where there is only one one market zone is operated. Due to grid constraints, the wind farms in northern Germany cannot supply the electricity demand in the south of the country during periods of high windwindy periods, which causes wind production to be curtailed and conventional generators to be put into operation.
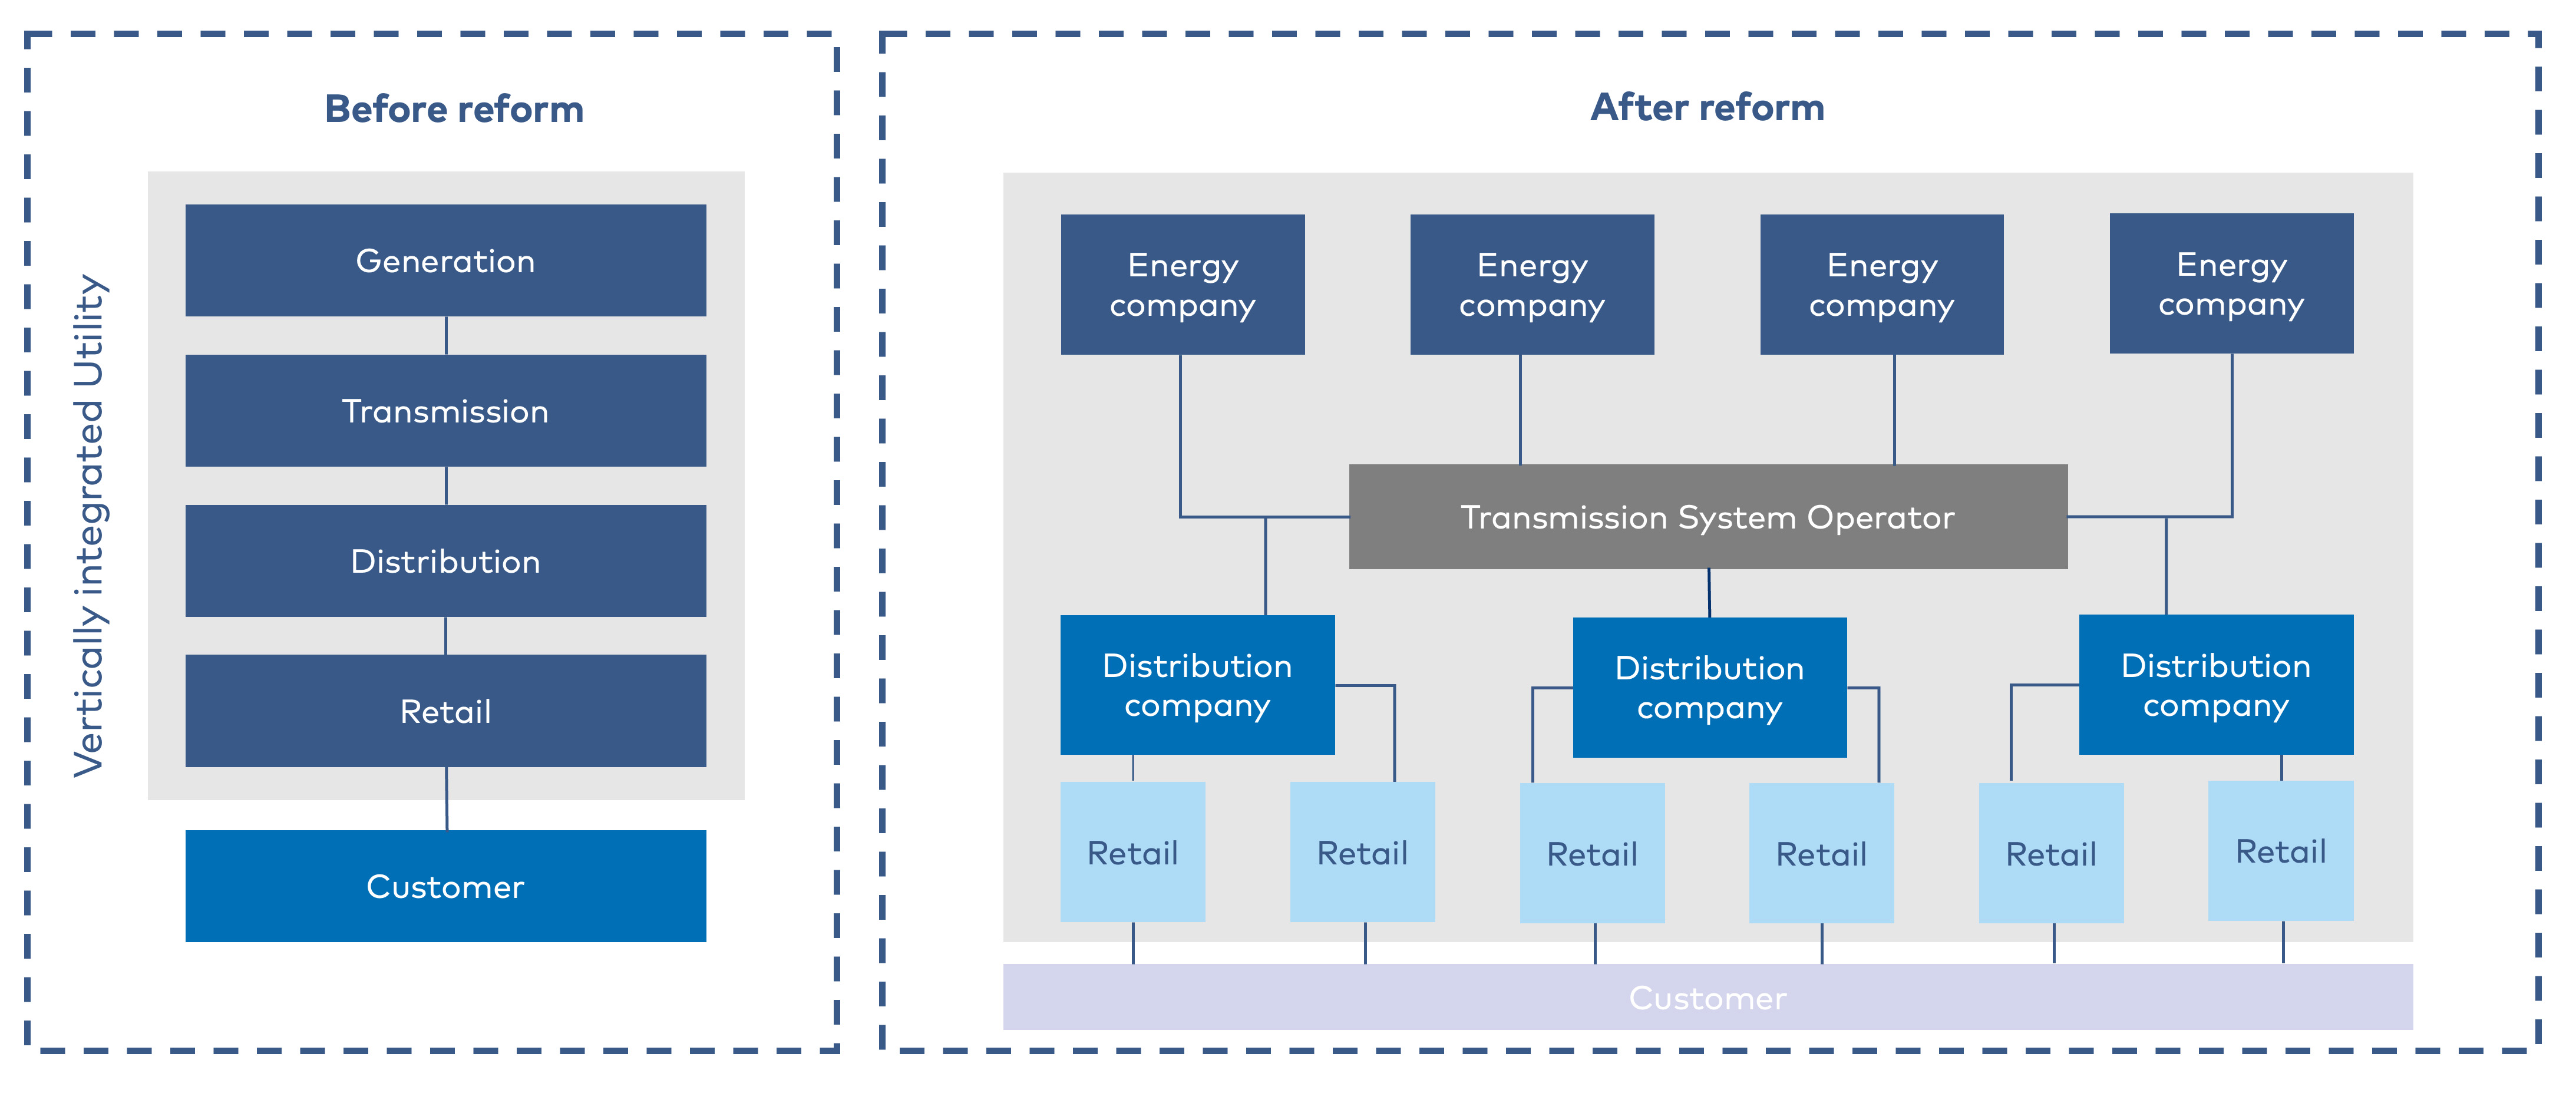
By reforming the electricity markets, vertically integrated monopolies were gradually dissolved with the aim of building a more competitive and flexible electricity market with competitive prices. As a result, companies could no longer generate, transport, trade and supply electricity while managing the transmission and distribution networks. Although there are national differences, today the effect of the reform today is a market that which operates based on the marginal pricing principle in energy-only market structures in which where new entrants can participate. The general reform of the operation of the electricity market is illustrated in
Consequences
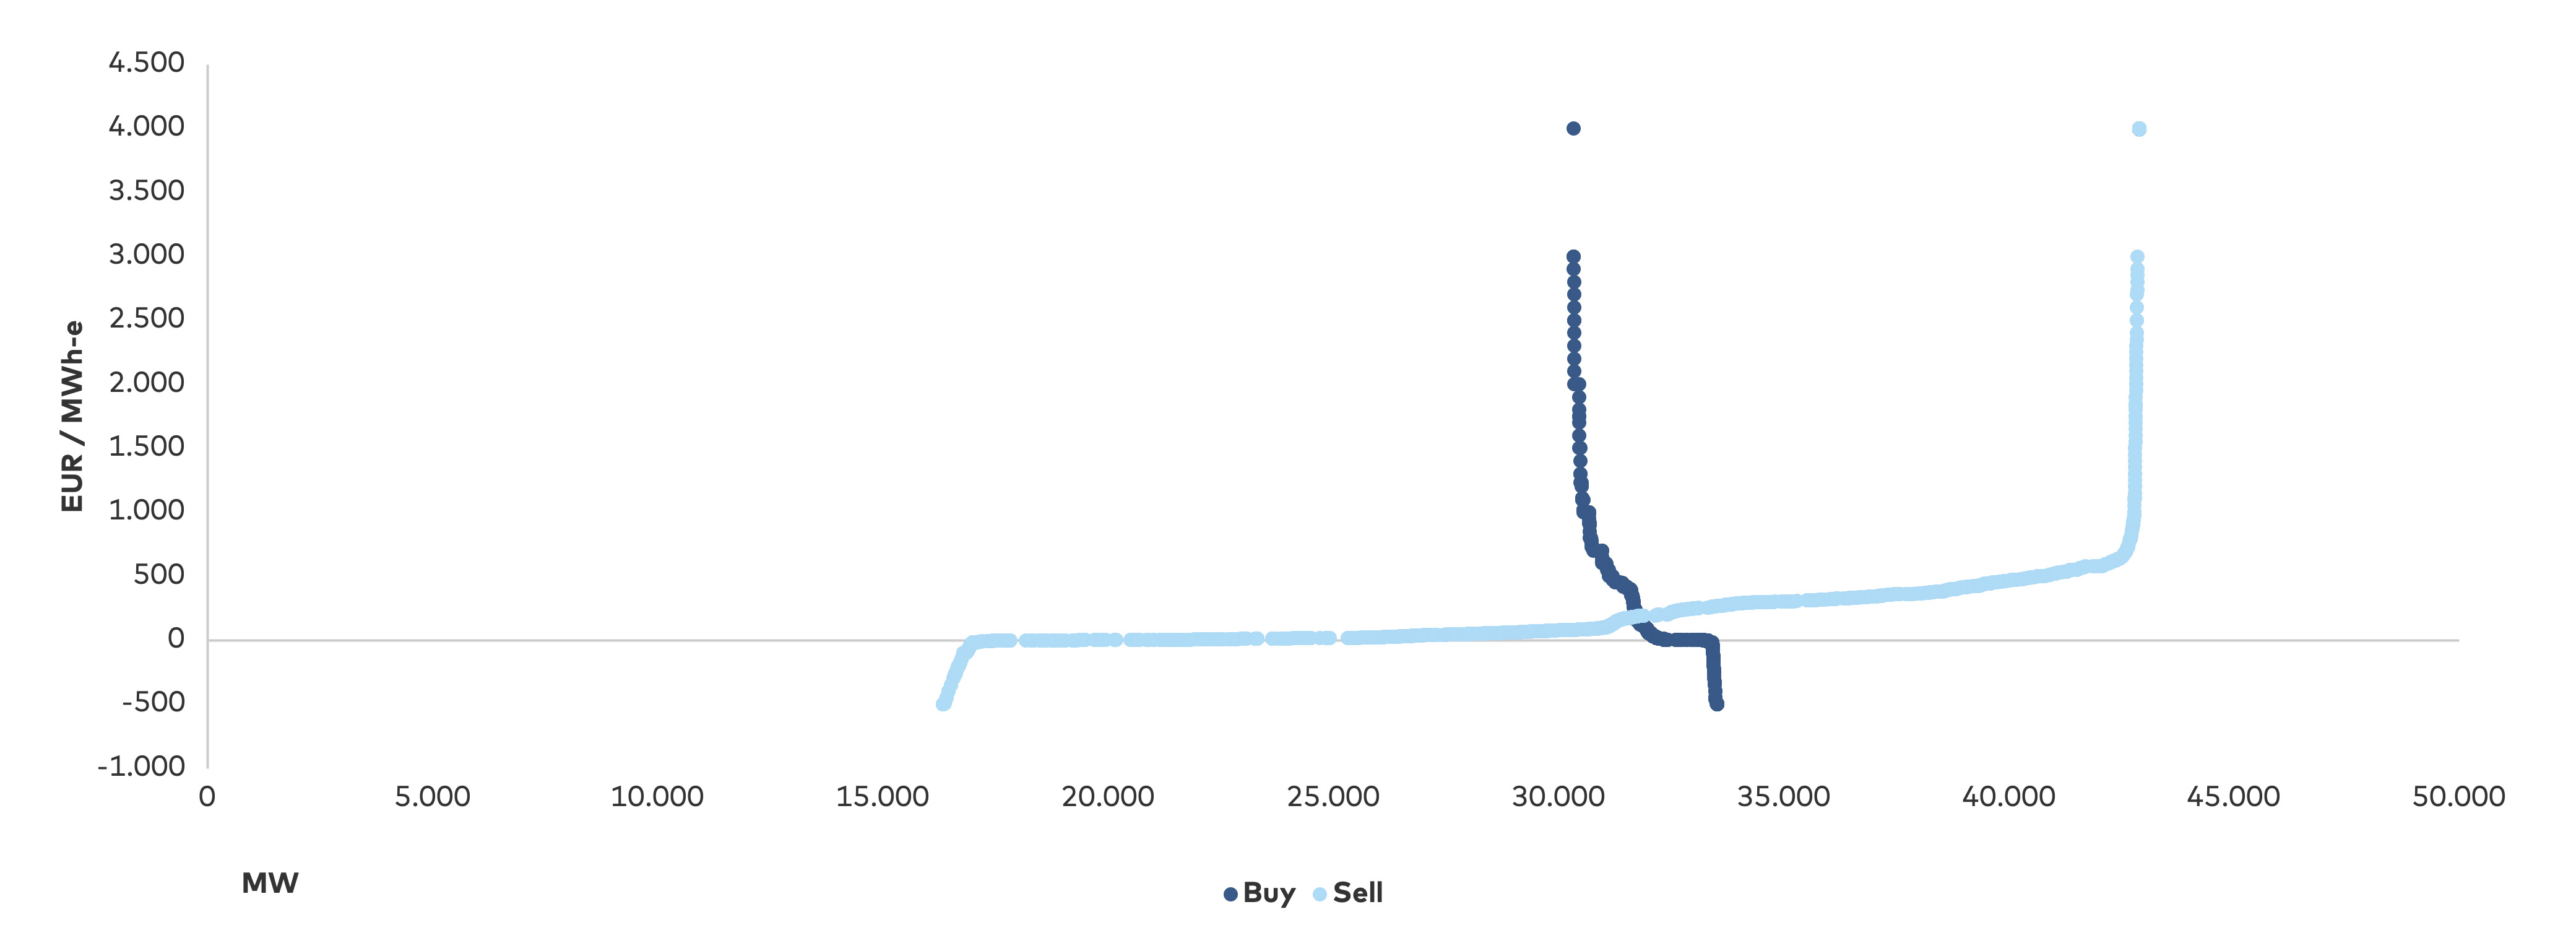
The principle of the energy-only market is that each supplier and consumer bid their marginal cost (excluding capital and fixed costs) of production and consumption into a market pool. Any profit made by the generators makes a contribution to capital and fixed costs. The demand curve reflects consumers’ willingness to pay for electricity. The intersection between the supply and demand curve sets the market price for electricity. Baseload generators with a low marginal cost recover their capital and fixed costs when more expensive generators are setting the market price. Peak load generators, with the highest marginal cost in the system, will only recover their capital and fixed costs when the market price is above the marginal cost of any generator – demand sets the price. Such price spikes occur when the total available generation capacity cannot supply demand. Peak-load generators hence only recover their capital and fixed costs when there is insufficient generation to supply demand, which in turn results in load-shedding and price spikes. The principle should, in theory, lead to investment incentives in new generation and an optimal mix of technologies.
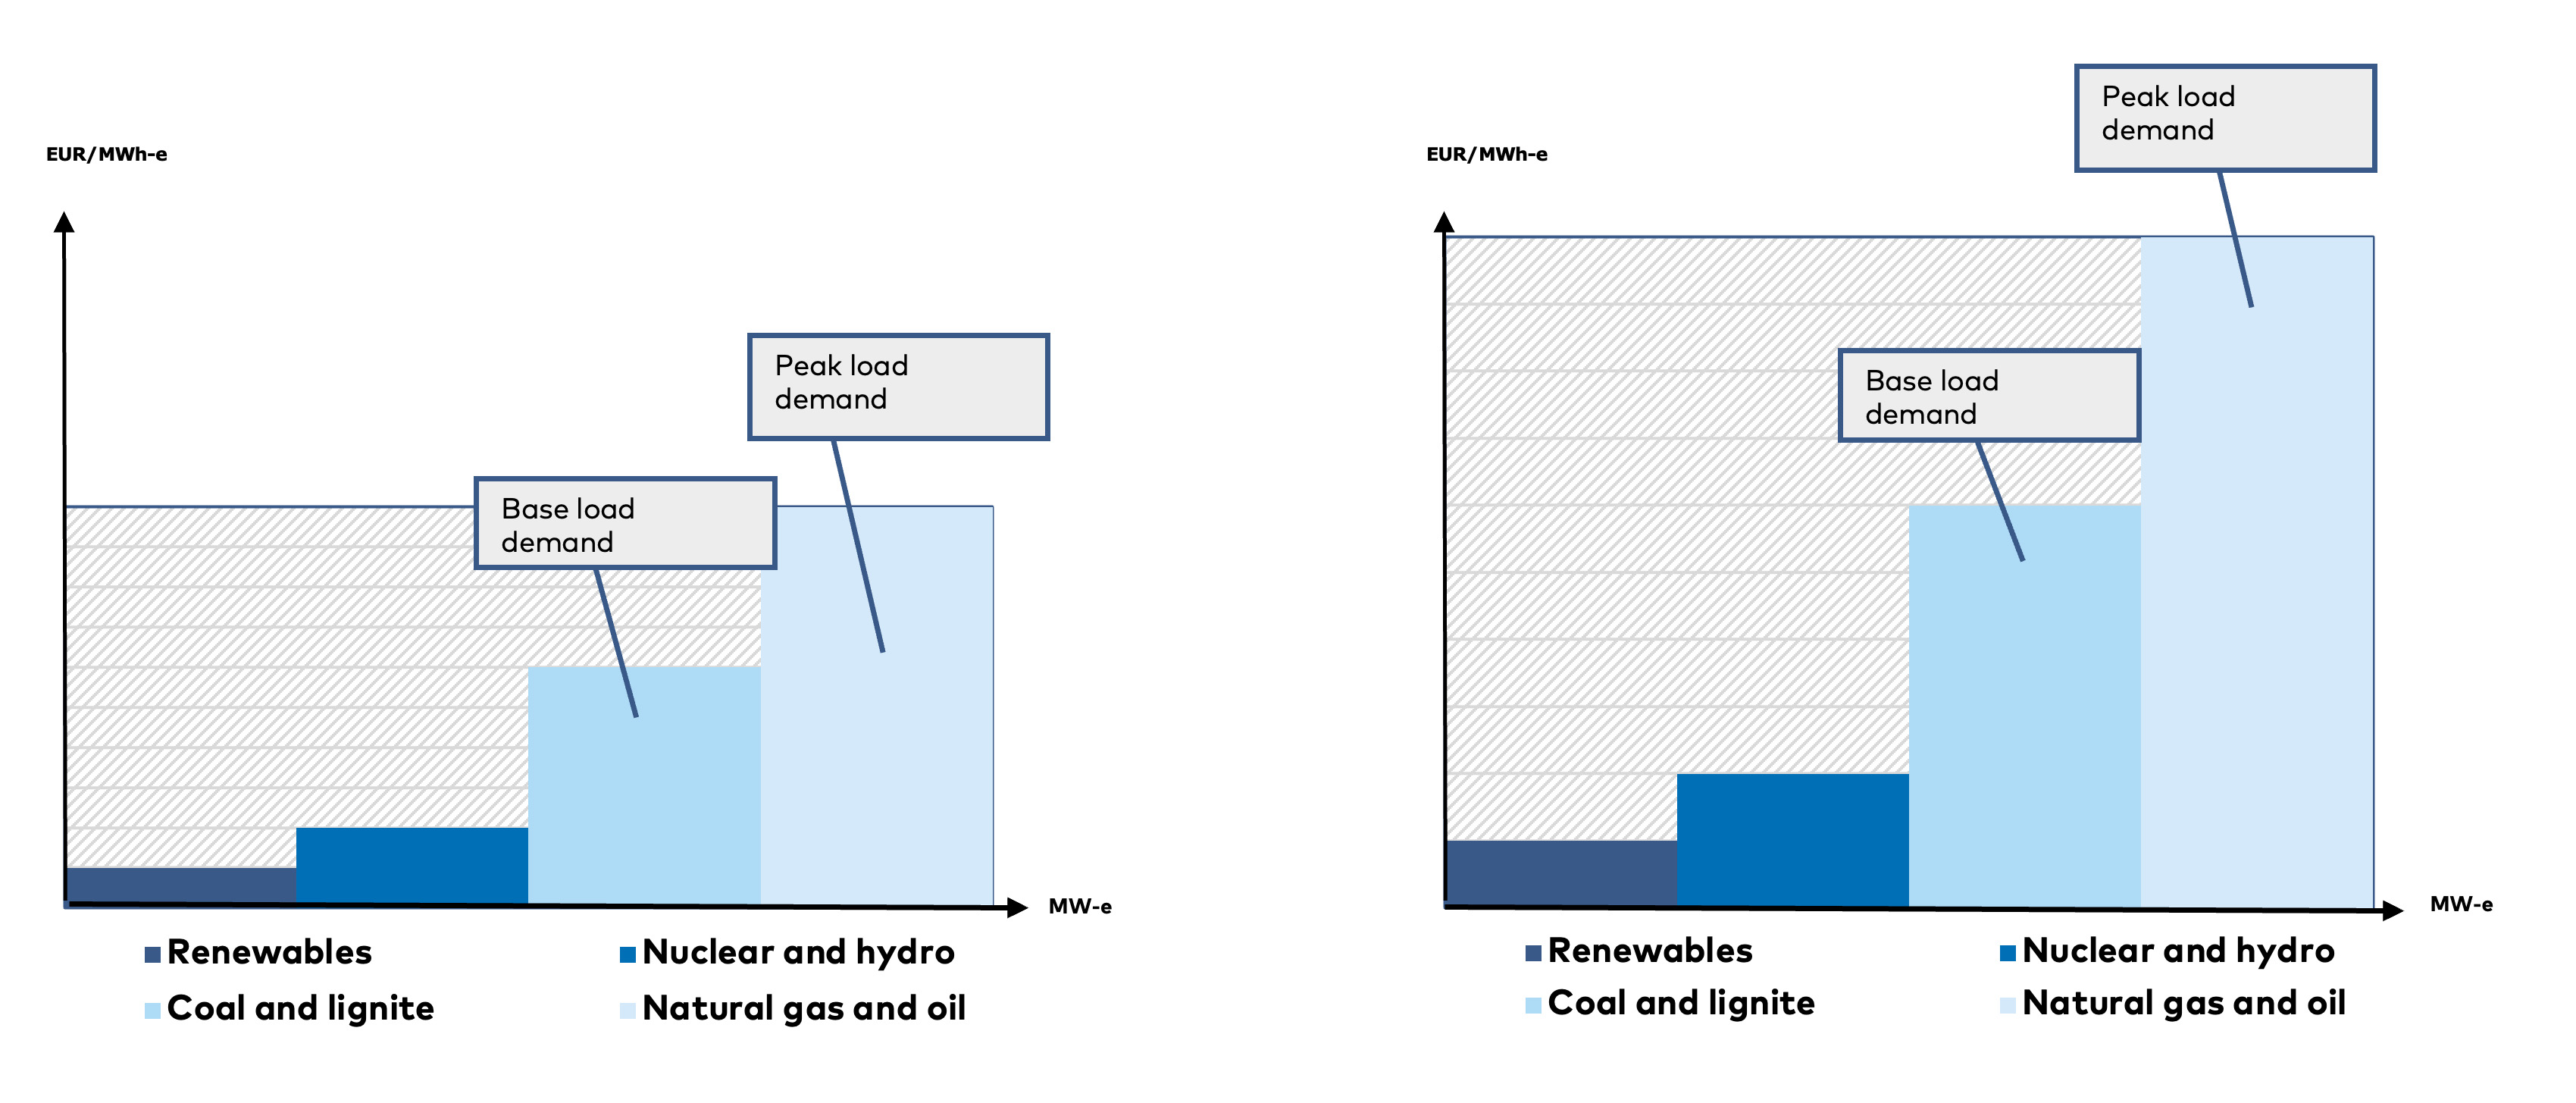
Because price-setting in the European electricity markets is based on the last dispatched marginal unit (the most expensive unit required during operation), the electricity price is typically determined by gas- and sometimes oil-fired power plants – ultimately depending on the fossil fuel and CO2 prices and the renewable energy production.
The principle of the influence of increasing fossil fuel prices on market-wide electricity prices, as witnessed during the energy crisis, is outlined in
During the energy crisis, a price cap of 40 €/MWh was imposed on natural gas in the Iberian market. Direct payments to the gas-fired power plants cover the difference between the wholesale gas price and the cap, meaning that in practice the peak electricity price is capped. Consumers pay a lower price for the electricity provided that the government provides a direct payment. The net result is lower costs of energy for consumers.
Impact on the value chain
The impact of the marginal pricing principle in energy-only markets is primarily that generators must make the necessary revenue during peak price hours to cover capital and fixed costs and that consumers, in situations of bottlenecks between market zones, will be exposed to significant price increases. The following market drivers are a direct result of the operating principle of the energy-only market.
FOCUS ON ICELAND
The Icelandic parliament adopted the European Union Directive on competition and unbundling of the internal energy market in 2003 through The Electricity Act (no. 65/2003). With the new energy law, Landsvirkjun was no longer obligated to supply users in the country with an adequate supply of electricity; instead, the supply of electricity was to be determined by market dynamics. No public authority has responsibility for security of supply. Nonetheless, the Icelandic electricity market has a different structure to that of the other Nordic countries, as there are fewer actors throughout the value chain.
A long HVDC cable connecting Iceland and the United Kingdom, Icelink, has been proposed. Were the cable be built, the Icelandic electricity system would be connected to Europe.
5.2 Decommissioned controllable electric capacity
Impact on the energy crisis
Context
Consequences
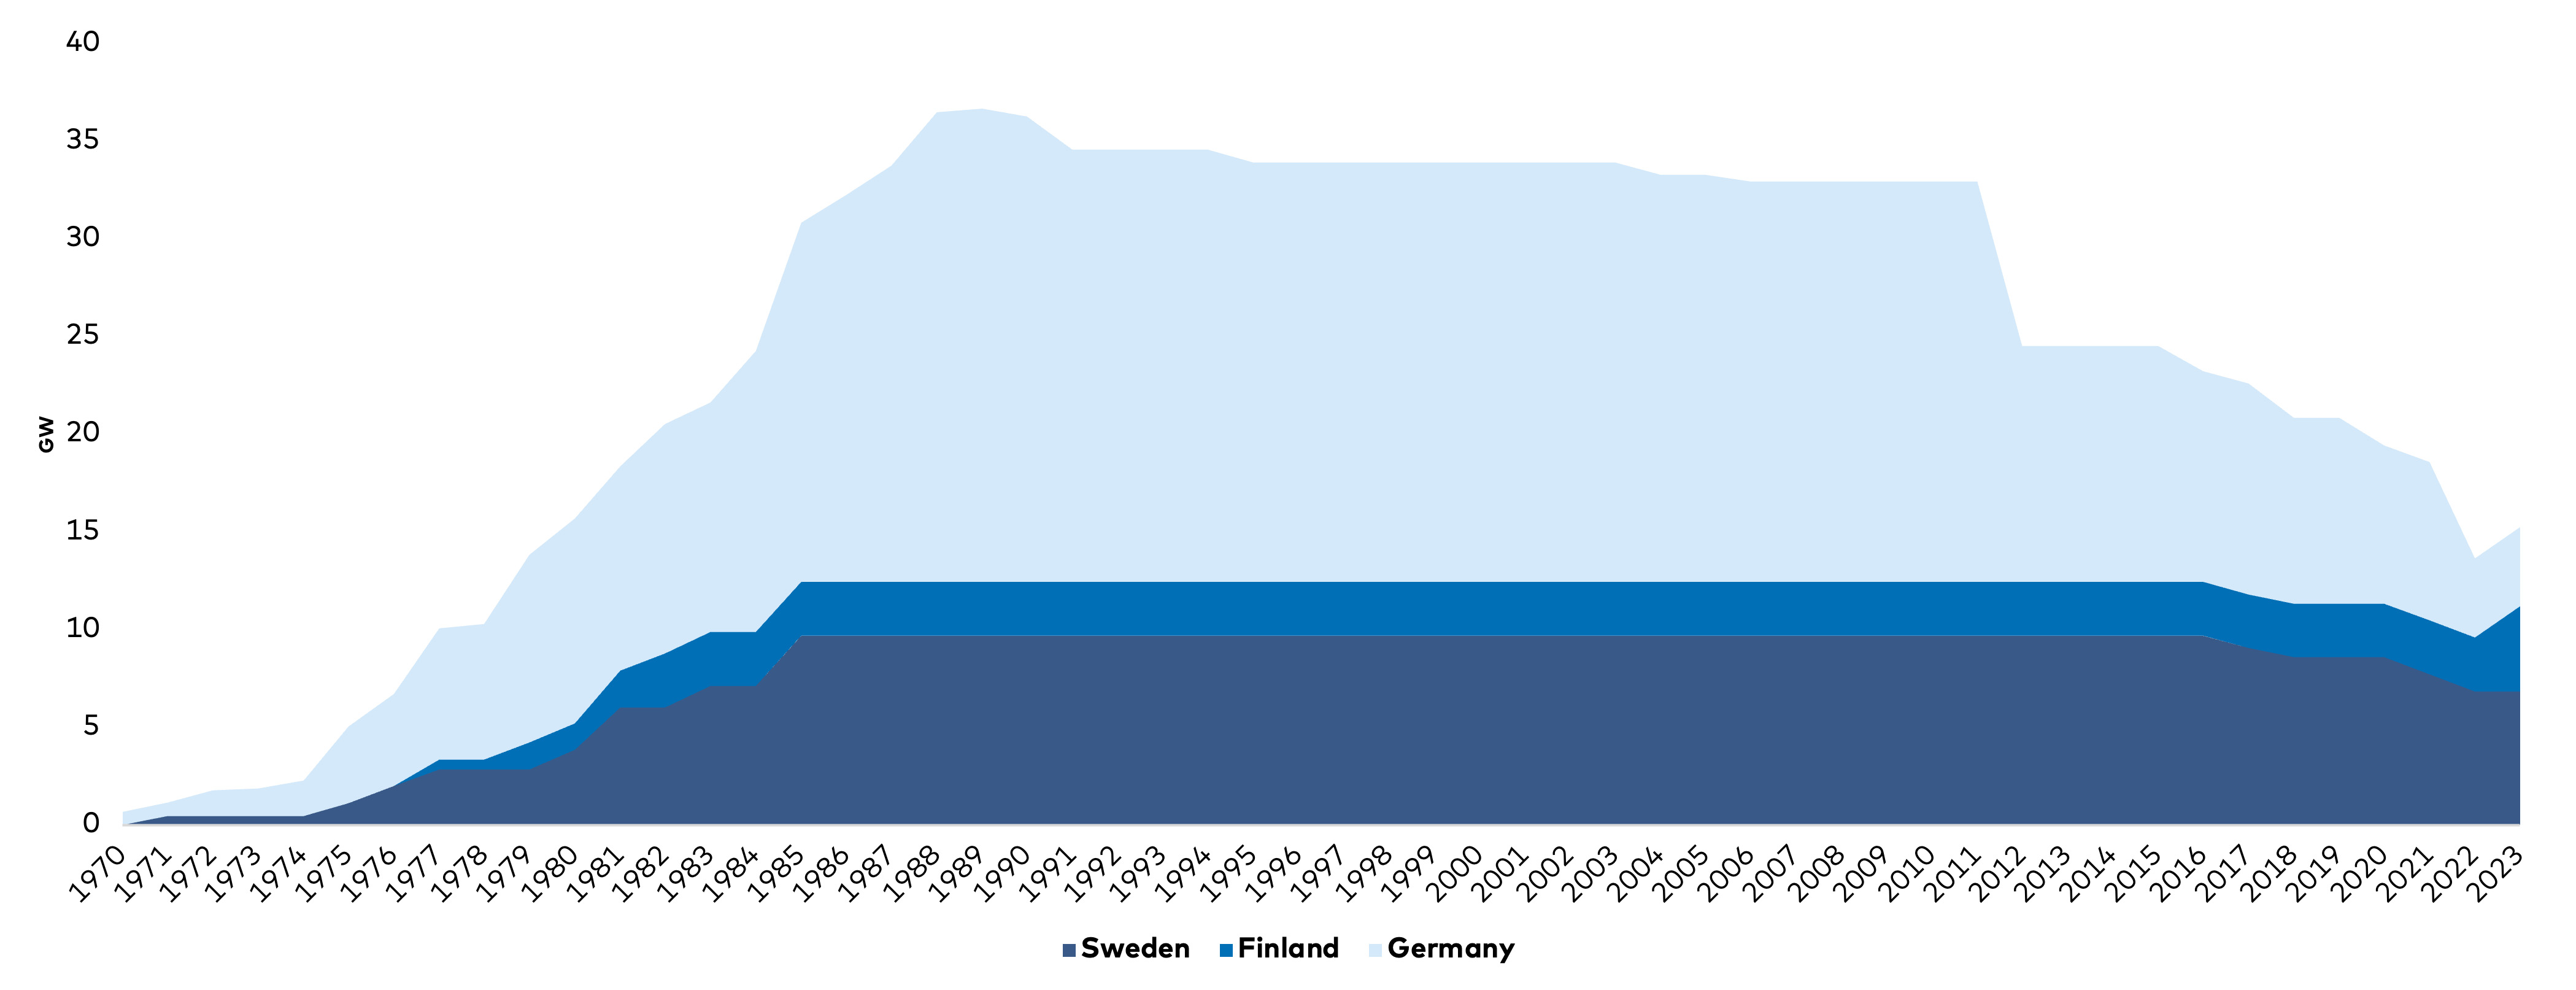
The development of nuclear power plant capacity in Finland, Sweden and Germany is shown in

 Denmark
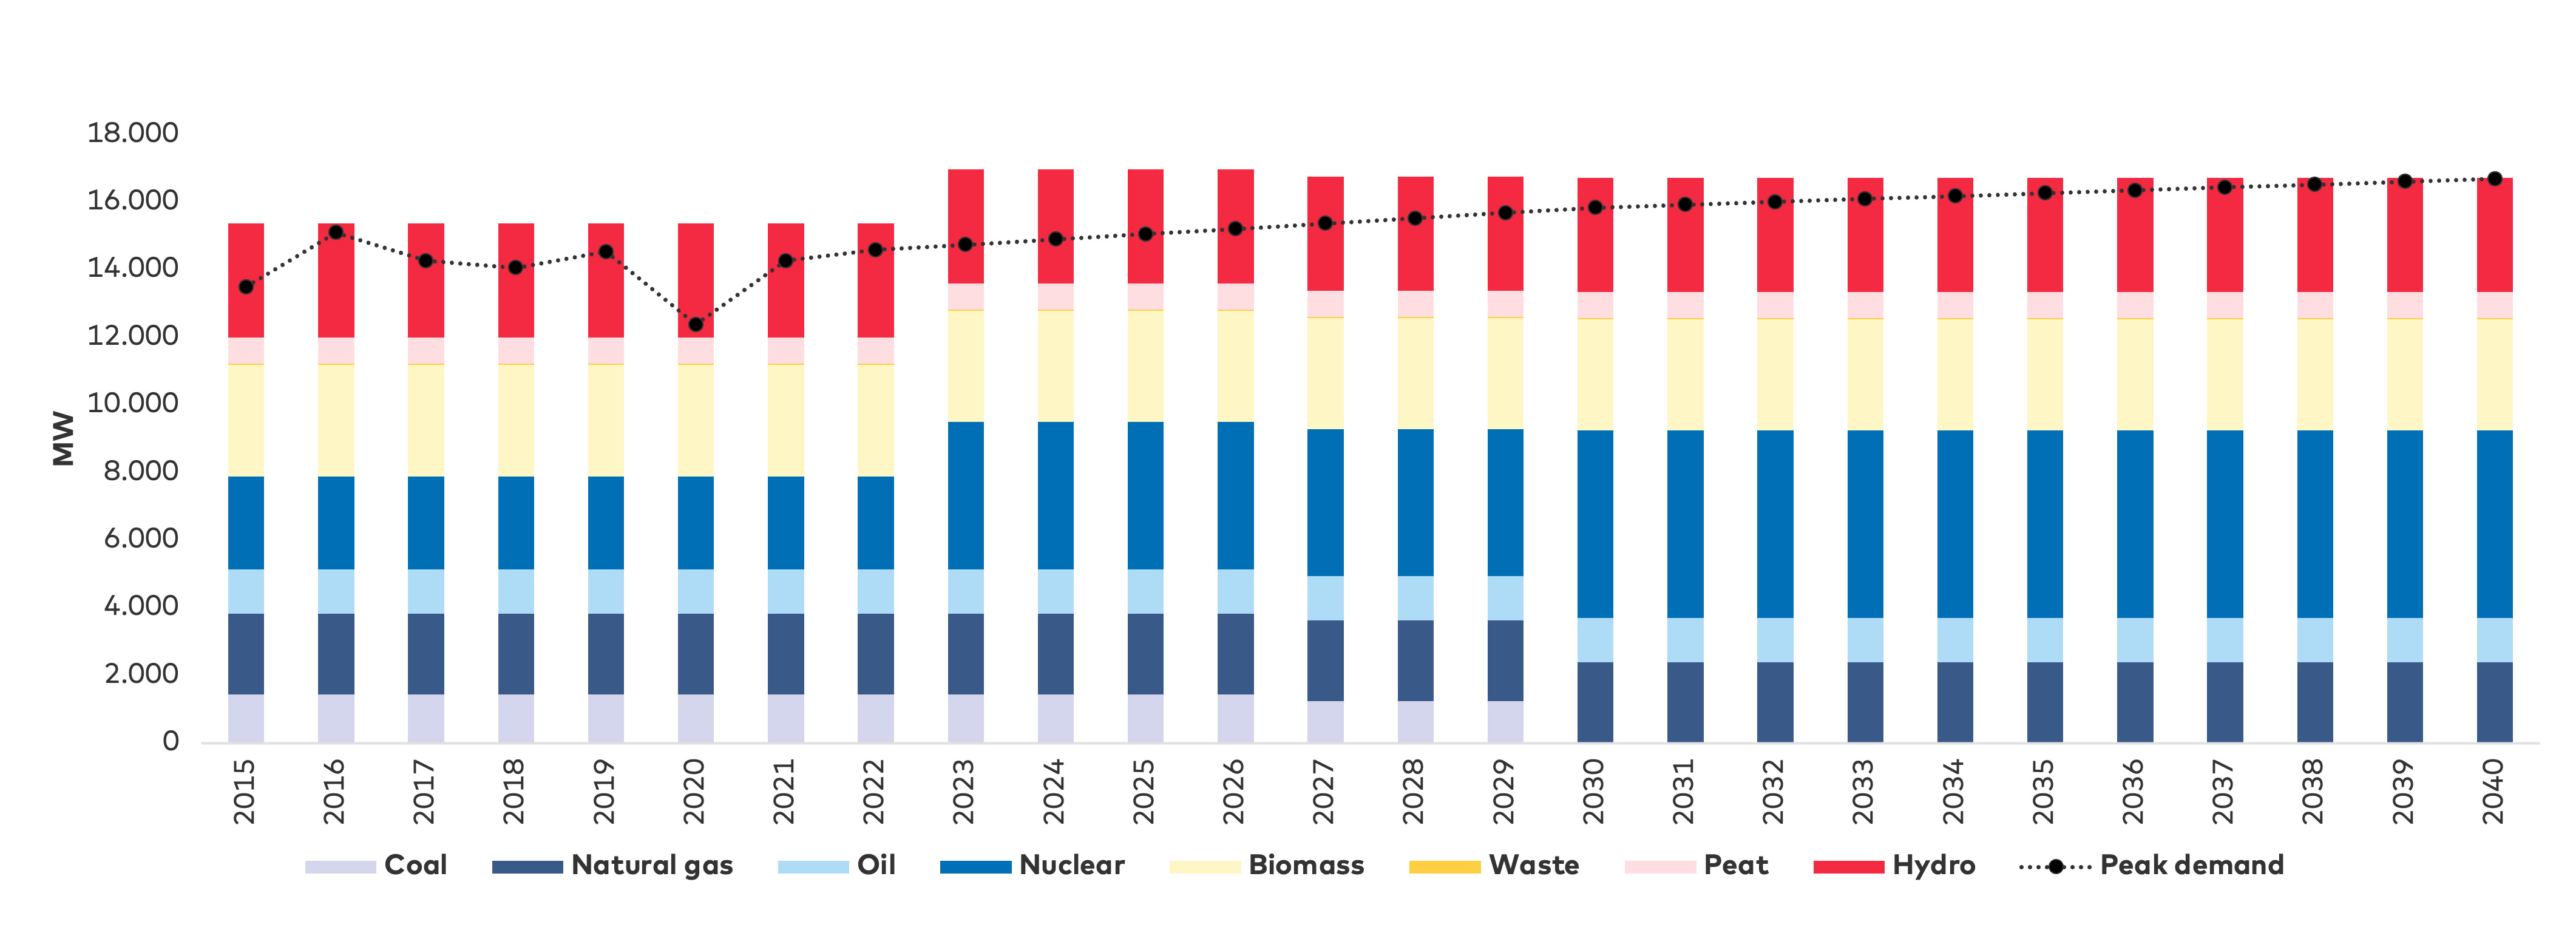
 Finland
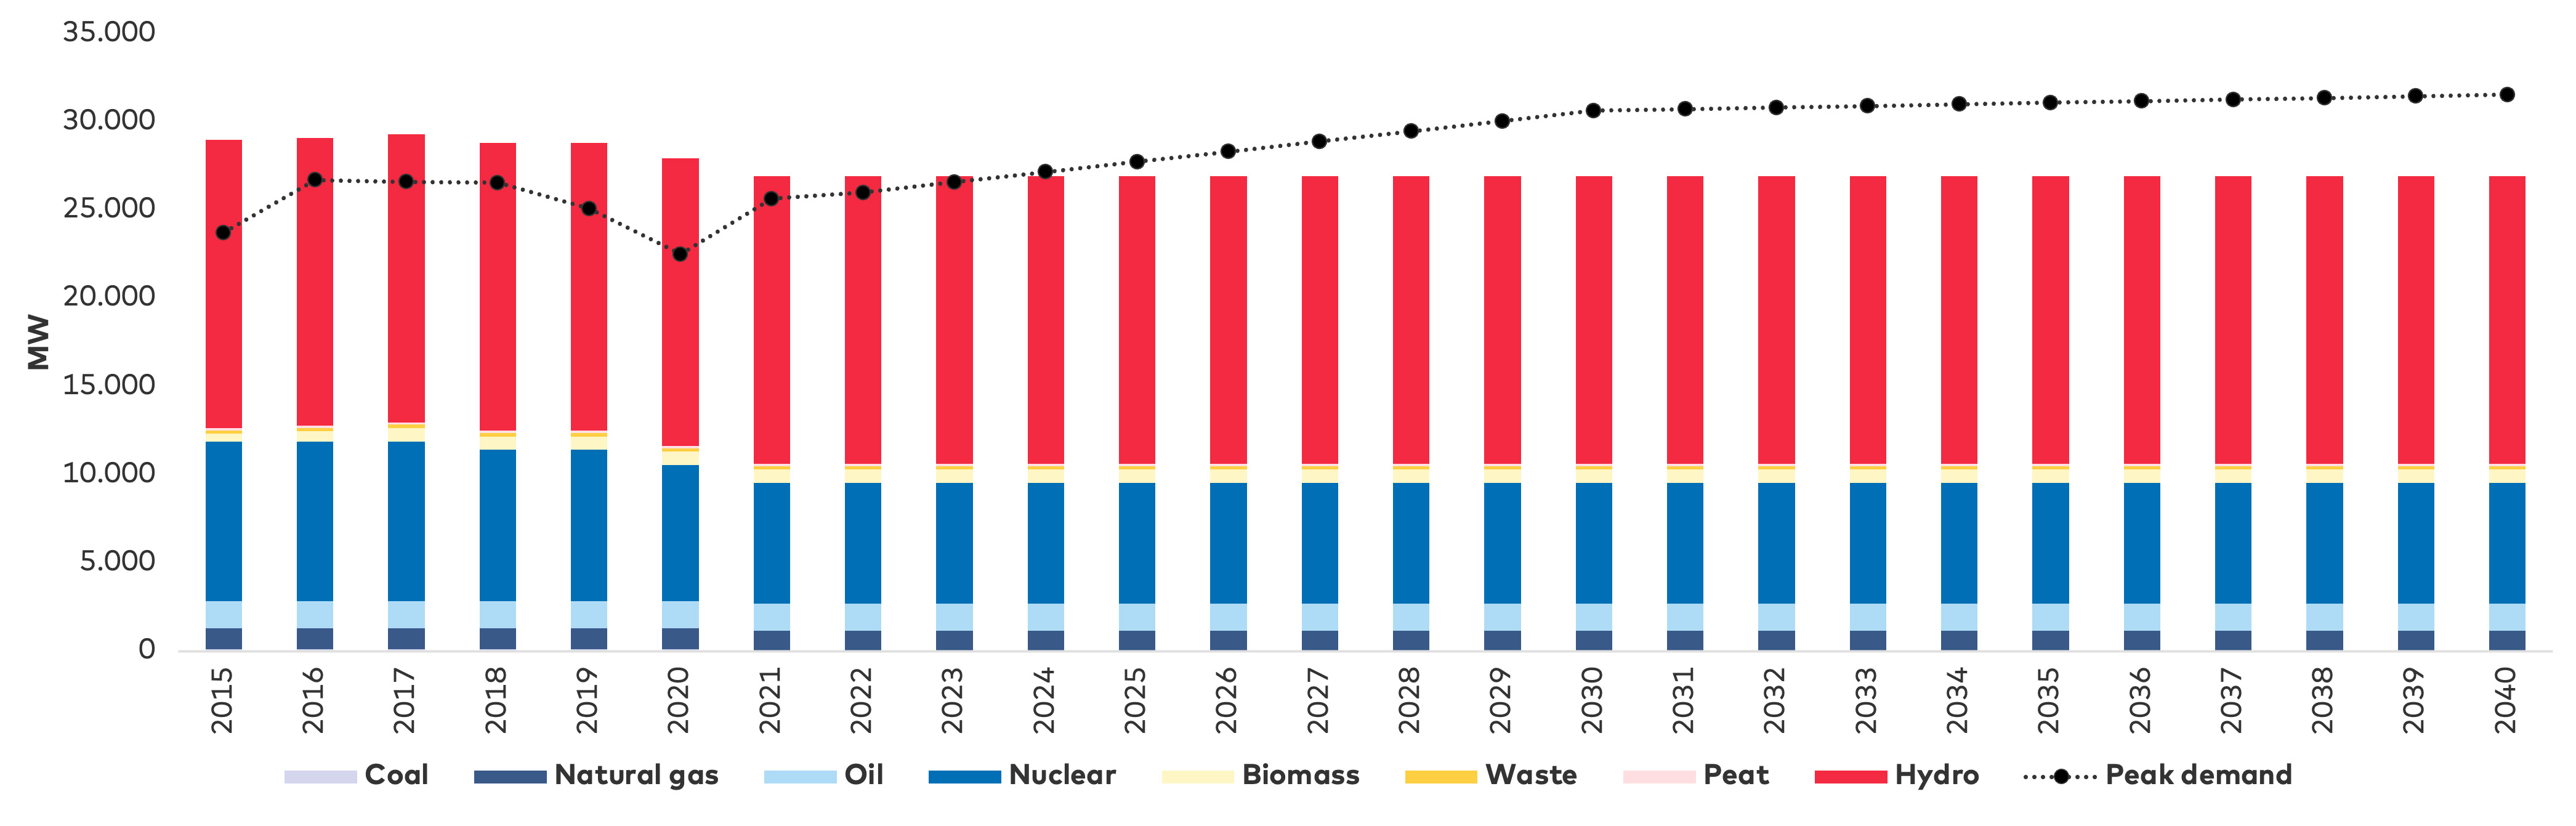
 Sweden
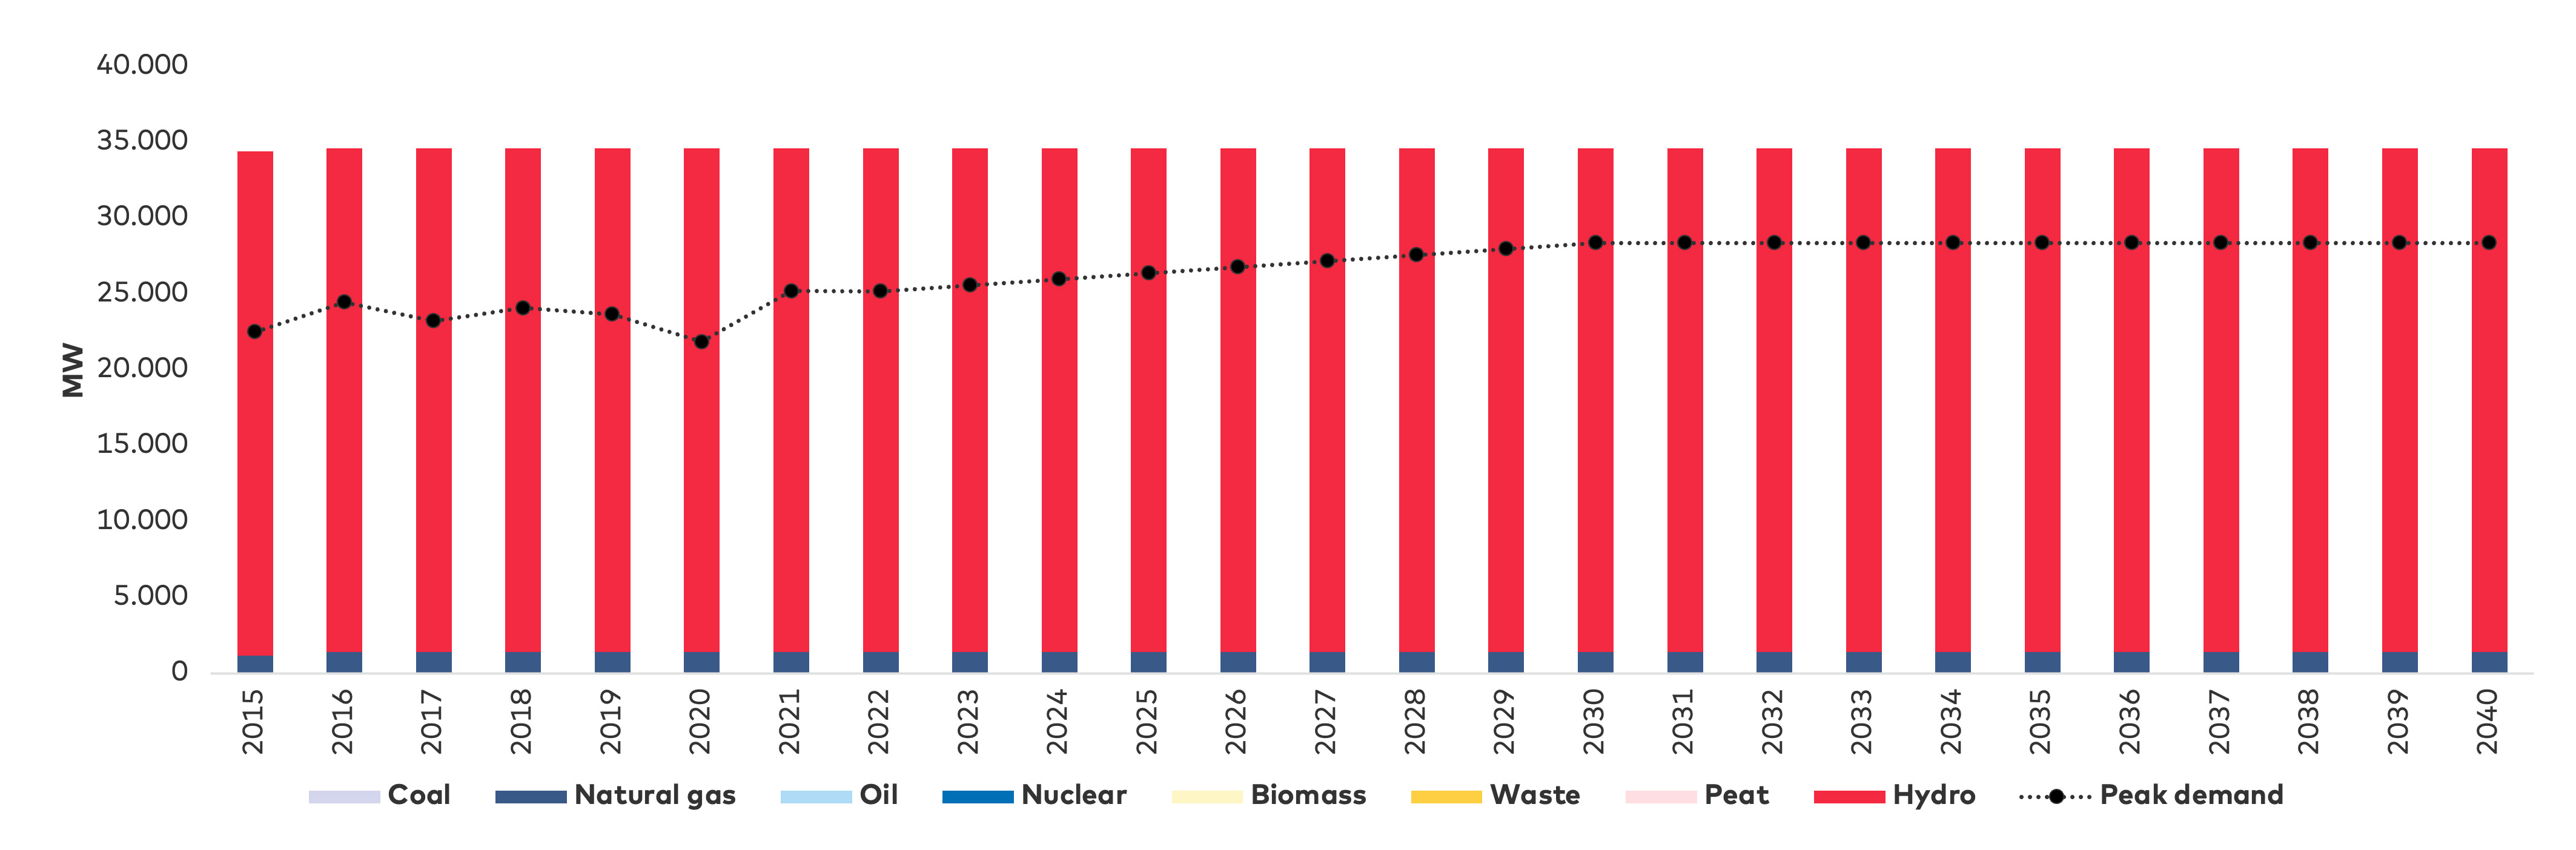
 Norway
The development of nuclear power plant capacity in Finland, Sweden and Germany is shown in Figure 33. Germany had planned to close all its nuclear reactors by 2023, but has decided to keep the remaining plants in operation due to the energy crisis. Sweden has also closed some reactors, whereas Finland has increased capacity with the addition of the Olkiluoto 3 reactor. Overall, the total nuclear capacity in central/northern Europe has decreased significantly over the last decade.
High electricity prices throughout the day usually indicate a lack of baseload capacity, since peak plants dictate the price even at low demand. This development is most prevalent in countries where the majority of electricity production comes from thermal power plants. Although the Nordic countries generally appear to be safeguarded against a significant reduction in security of supply due to their reliance on hydro and nuclear power, a reduction in security of supply may be experienced, as power plants are decommissioned and electrification of society increases. Additionally, grid interconnectors from the Nordics to central Europe increase the likelihood of spill-over effects, thereby challenging generation capacity, security of supply and low electricity prices in the Nordics. Despite this, electricity demand in the Nordic countries is expected to increase due to the need for the electrification of society in order to fulfil national climate targets, although it is expected that much of this demand will be supplied by renewable energy. However, supply disruptions can occur during unfavourable conditions for wind and solar.
Nuclear power in France is an important part of the electricity mix in Europe and provides most of the country’s electricity production. However, only 30 out of 56 nuclear reactors are currently operating. This exposes France to potential electricity supply disruptions and increases in electricity prices in the rest of Europe. During 2022, nuclear reactors have been out of operation due to a mix of technical and environmental issues. The latter included biodiversity concerns in connection with increased water temperatures in rivers due to discharge of water from the reactors. Nuclear power plants in the Nordics are nonetheless located by the sea, making the risk exposure to environmental standards less than those experienced by France in 2022. However, technical issues are also present, including in the Nordics, as reflected in the delay in the start-up of the Olkiluoto 3 reactor.
Impact on the value chain
The main impact on the value chain is a lack of generation capacity in countries relying on power plants to supply electricity demand. The closure of nuclear power plants or decreased capacity due to a mix of technical and/or environmental issues also play a role here. Electricity exchange via interconnectors creates spill-over effects between countries. The security of supply is hence reduced in all countries. Furthermore, the lack of baseload capacity allows more expensive power plants, such as gas-fired power plants, to set the electricity price during many hours in line with the marginal pricing theory.

FOCUS ON ICELAND
There has been no significant decommissioning of controllable electric capacity in Iceland.
5.3 Balancing electricity supply and demand
Impact on the energy crisis
Context
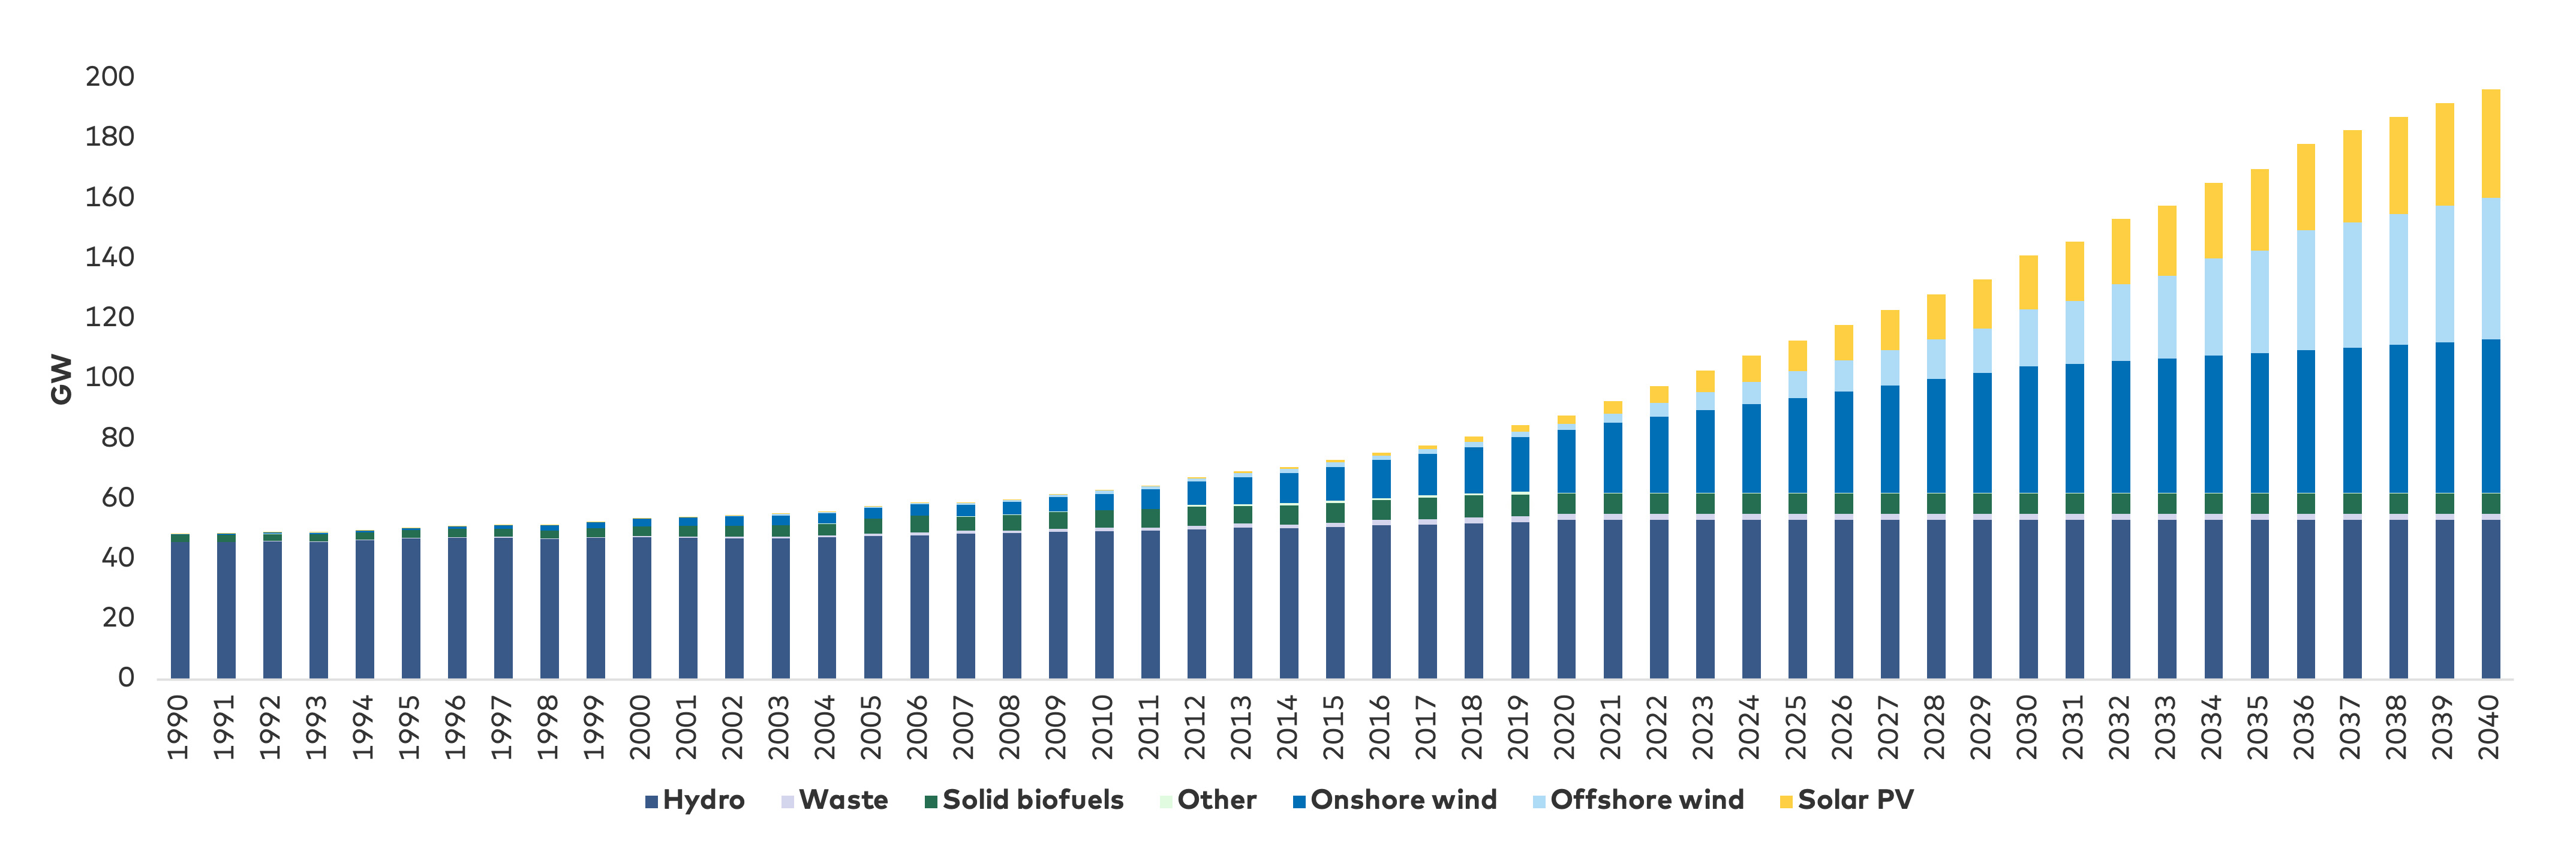
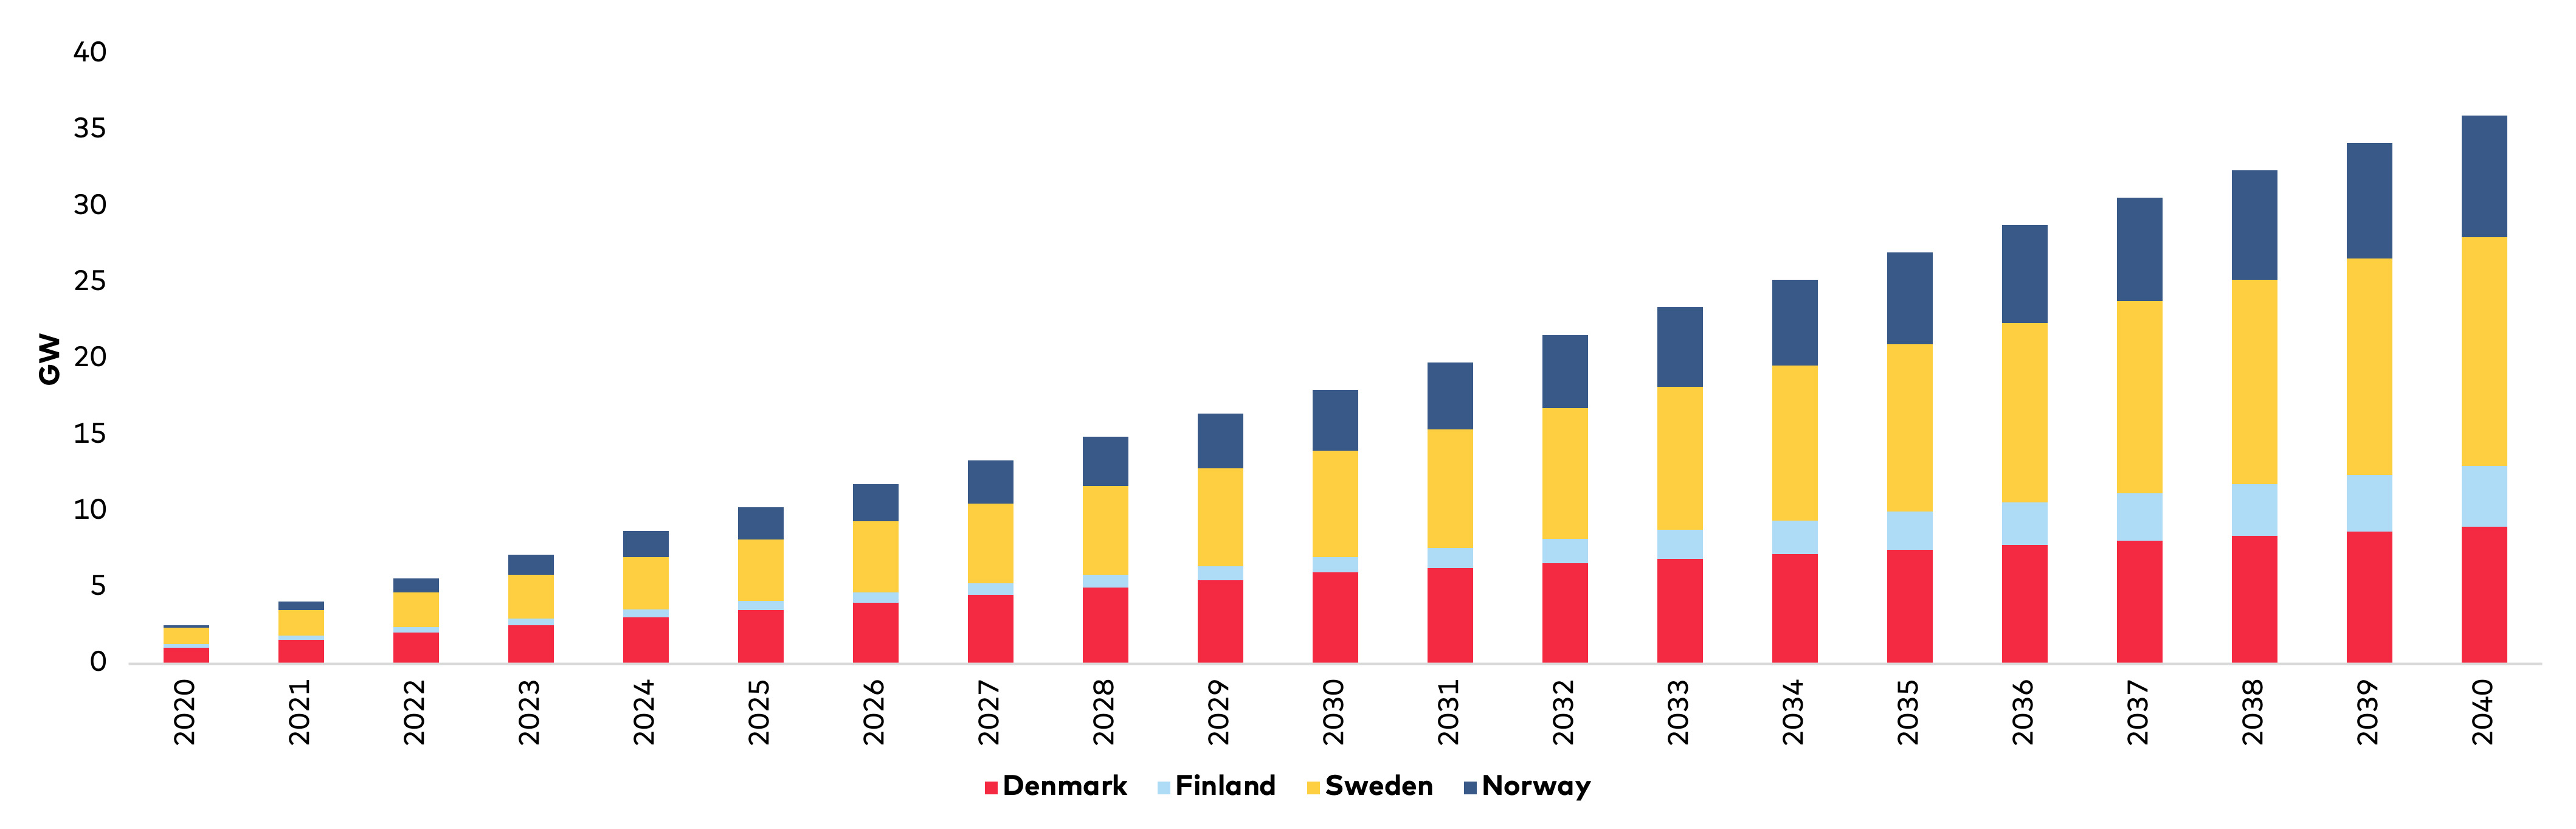
Given the importance of the energy sector for reaching these decarbonisation targets across society, the integration of renewable energy has become a key policy priority. Historically, the Nordic countries have led the way in integrating renewables into the energy mix. The high reliance on hydro and nuclear power has also ensured very low CO2 emissions from the electricity sector in comparison with other regions. Further development of wind and solar will increase the volume of renewables. The historical and projected development of low-carbon electric capacity in the Nordic countries are shown in
| Denmark | Finland | Iceland | Norway | Sweden | |
| Carbon neutrality | 2050 | 2035 | 2040 | 2030 | 2045 |
| Application of carbon sinks (offsetting) | Yes | Yes | Yes | Yes | Yes |
| 2030 CO2 reduction target | 70% | 60% | 40% | 50-55% | 63%* 70%** |
| 2050 CO2 reduction target | No | 90-95% | No | 90-95% | 85% |
| Legally binding | Yes | Yes | Yes | Yes | Yes |
| *Emission reduction covered by the EU Effort Sharing regulation ** Domestic transport excluding aviation | |||||


Consequences
One consequence of the increased integration of renewables in the electricity generation mix is a weather-dependent electricity system. This in turn necessitates a heightened focus on forecasting supply and demand to balance the system. The fact that demand from consumers does not coincide with renewable electricity production gives rise to a need for dispatchable energy resources to supply demand during these hours. The use of energy storage to reschedule production or a combination of energy storage and dispatchable energy is also possible. The Nordic countries have historically relied on conventional power plants and hydropower to provide this flexibility. Given the reduction in power plant capacity, there is a need to identify other sources that can reliably produce electricity during these periods.
The use of subsidies to stimulate interest in developing renewables has created a situation in the electricity market where renewable energy generators are able to bid at a very low (even negative) marginal price. This has increased the number of hours with negative electricity prices. Other issues relating to the integration of renewable energy include higher regulation costs and the creation of bottlenecks between electricity market zones as well as internally within countries due to major price variations caused by the lack of electric transmission infrastructure .
Impact on the value chain
Renewable energy integration impacts producers, grid operators and consumers throughout the value chain. Grid operators need to invest in balancing measures to avoid outages and strengthen electric transmission infrastructure in order to decrease the risk of congestion between the generation site and load centres. Consumers are required to deliver demand-side flexibility to reduce the price paid for electricity by spreading out the demand to match supply.
FOCUS ON ICELAND
Due to the isolated nature of the energy market in Iceland, production capacity must be higher than demand. This excess capacity has decreased in recent years and, according to Landsnet’s predictions, may fall below the threshold in the coming years. In 2021, electricity demand was approaching the power plants’ total installed capacity, complicating the balancing of electricity generation. Demand for electricity, combined with a dry year in 2021 and bottlenecks in the transmission system, led the National Power Company of Iceland to reduce the electricity supply to, among others, fishmeal factories. This meant that fishmeal factories had to burn oil to power their buildings. Electricity prices, however, remain stable.
Since variable renewable energy sources such as wind and solar have not been significantly developed in Iceland, the problems relating to shorter-term balancing are not relevant.
5.4 Lack of electric grid infrastructure
Impact on the energy crisis
Context
Improvements in the electric transmission network are mainly necessitated by imbalances between the regions where production and consumption take place, for example, northern Sweden, which has high production and southern Sweden, which has high demand. Improvements in the electric distribution networks (local networks) are required to reduce local/regional bottlenecks that create local capacity shortages. One challenge is that most renewable energy capacity has been connected at a low-voltage distribution level.
Another sometimes forgotten challenge with renewable energy development is that it requires more electrical infrastructure to transmit the energy from production sites to load centres compared to fossil-based generation. This is because the capacity factors for wind and solar are lower than fossil sources by nature. The fact that the energy crisis is partially attributable to the lack of electric grid infrastructure to handle fluctuating renewable electricity production leaves Europe highly vulnerable to changes in weather conditions and disruptions in fuel supply.
Consequences
Sweden’s central location means that other Nordic countries will be impacted by the resilience and stability of the Swedish transmission grid. Three significant changes have driven new electricity exchange patterns during the energy crisis: (1) decommissioning of nuclear power plants in Sweden, (2) increased wind power in northern Sweden and (3) new interconnectors between Norway and Germany and between Norway and the United Kingdom. These changes have increased electricity flows from Finland to SE3 and onwards to NO1 as well as from SE2 to SE3, resulting in congestion between SE2 and SE3 and reduced capacity between SE3 and NO1 to safeguard operational security. These flow patterns are expected to increase following the commissioning of Olkiluoto 3.
The reduced capacity in the corridor between NO1 and SE3, as well as between SE2 and SE3, affects power prices in the whole Nordic system by impacting the ability to trade energy east–west and north–south. This has created price differences between electricity market bidding zones, especially in the southern and northern parts of Norway and Sweden. Long lead times on the infrastructure between SE2 and SE3 have also contributed to this development.
Impact on the value chain
Underinvestment in electric grid infrastructure primarily impacts the ability to transport energy from production sites to load centres. Furthermore, the long lead times associated with developing infrastructure projects can impact the ability to respond to physical infrastructure challenges caused by the relatively rapid roll-out of renewable energy generation capacity. Both elements result in increased price differences between electricity market bidding zones.

FOCUS ON ICELAND
The transmission system in Iceland is ageing, and there are problems with expanding transmission capacity. Delays in the maintenance of the transmission system, lack of investment and increased electricity demand have caused tolerance limits of the network to be reached, and there are also transmission constraints between different parts of Iceland.
The average age of transmission lines (per km) in Iceland is 44 years, where the designated lifetime of lines is 50 years. System bottlenecks mean that many parts of Iceland are affected by transmission capacity constraints, which cause energy insecurity and hinder the development of industry in certain areas.
A storm in 2019 represented one of the most extreme weather events experienced by the Icelandic power system, causing major damage to transmission lines. As a result, a decision was made to speed up the construction of new transmission system lines. The development of a new transmission network started in 2019, and is due to be completed in 2030. The development has met some opposition, and approval procedures such as obtaining construction permits from municipalities and environmental impact assessments have made the process slower than expected.
5.5 Inflexible electricity demand
Impact on the energy crisis
Context
However, this does not necessarily mean that end-users do not reduce their electricity consumption during peak hours if electricity prices are high. Consumers are increasingly being exposed to real-time electricity prices, and are moving from fixed price to variable price contracts with electricity distributors in order to align consumption with periods of low electricity prices.
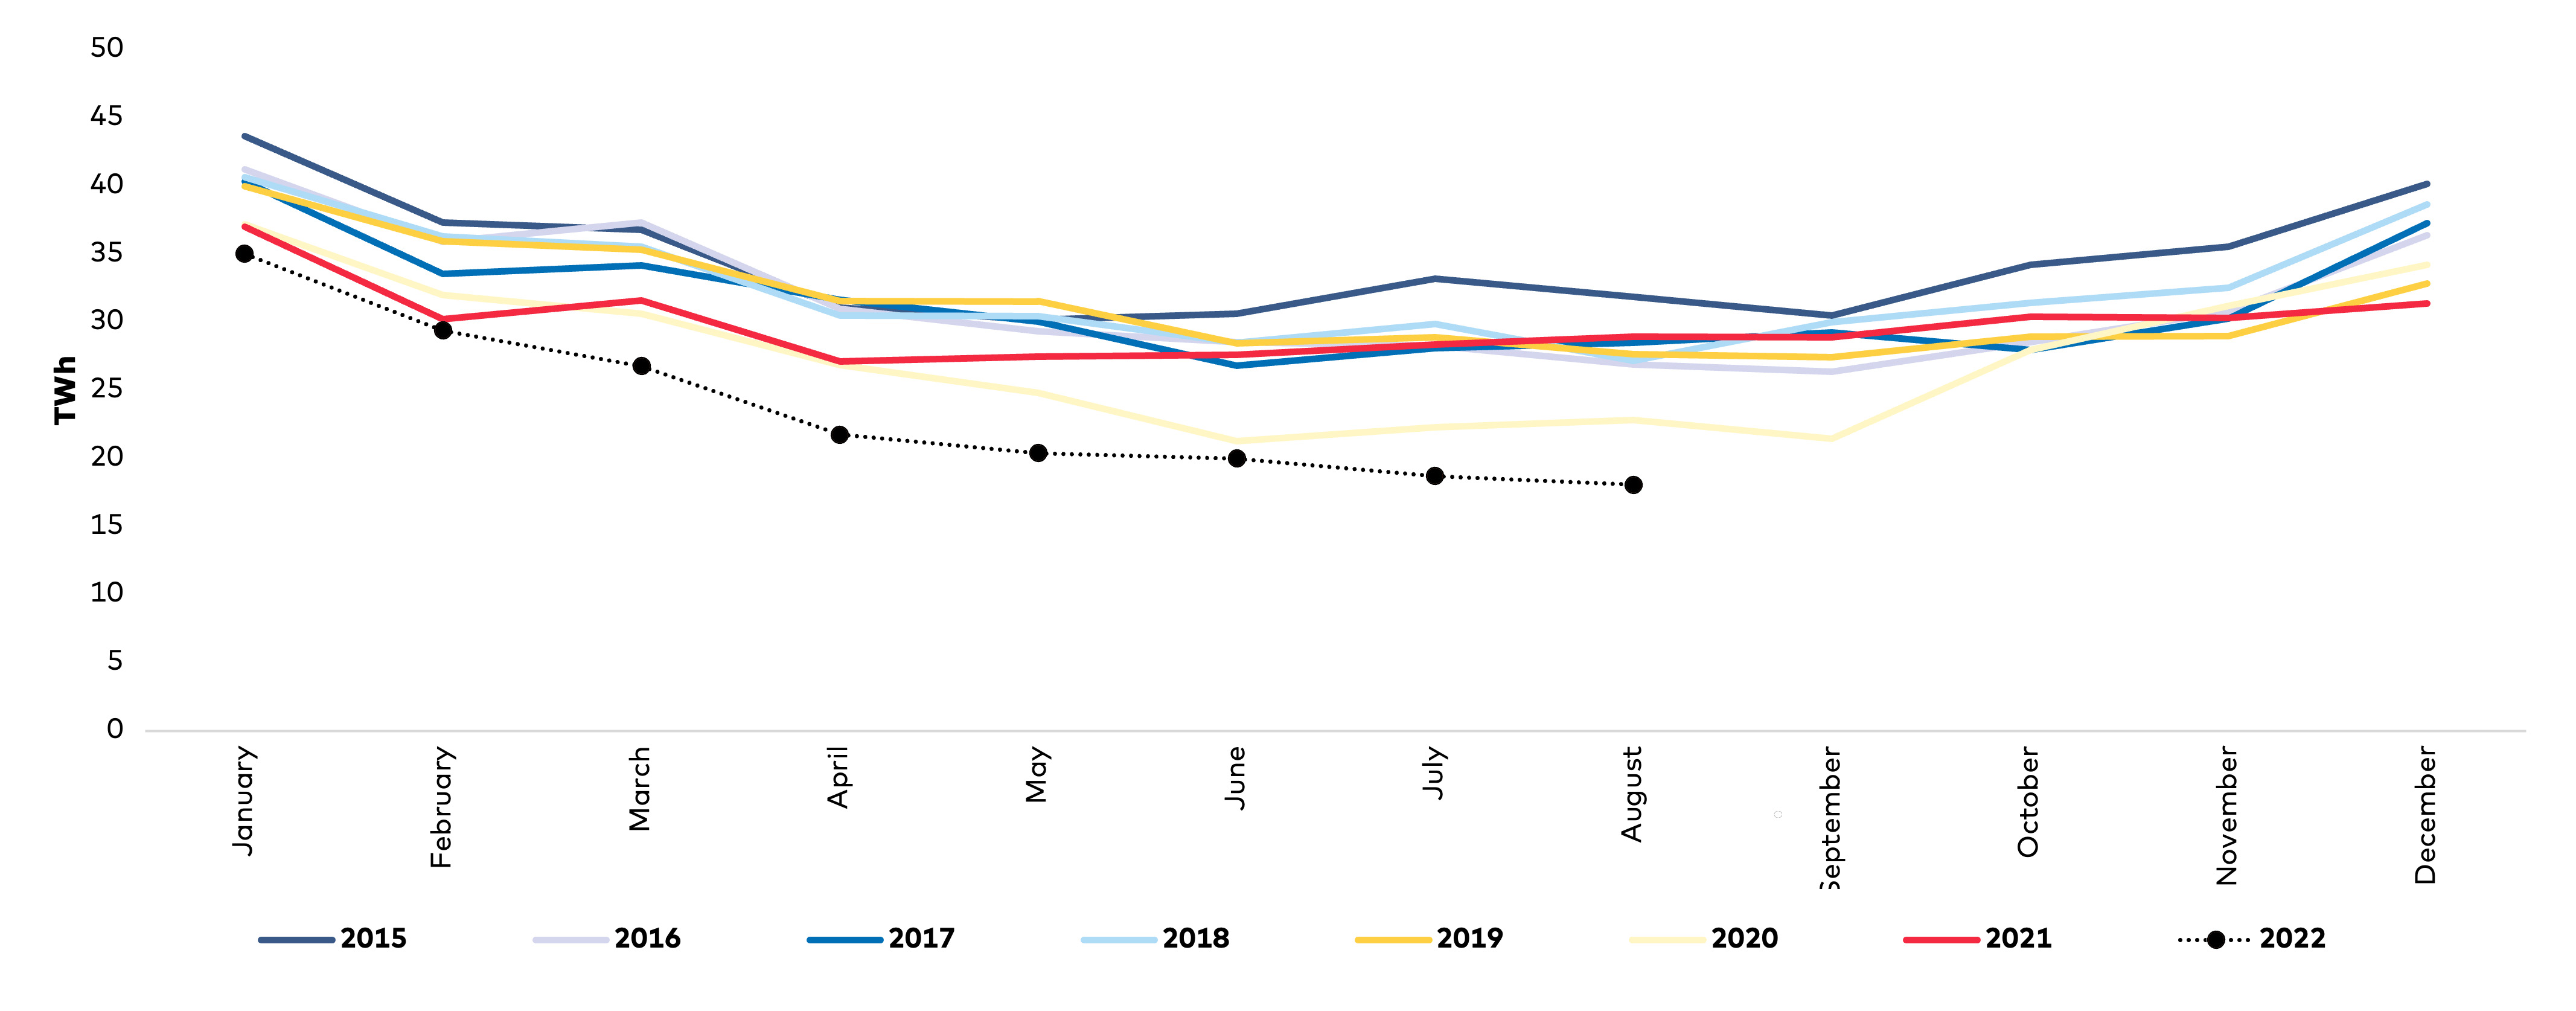
Realised Nordic electricity demand per month for the period 2015–2022 can also be seen in
Consequences
The inflexible demand and the decrease in baseload capacity from hydro and nuclear power has led to concerns about potential brownouts in the Nordic countries during hours of peak demand. A risk of power shortages for winter 2022–2023 has been highlighted in some of the Nordic countries, see
Impact on the value chain
| DENMARK | SWEDEN | NORWAY | FINLAND | ICELAND | |
| Risk reported publicly | ! | ! | ! | √ | X |
| √ = Risk reported X = Risk not reported. ! = Heightened awareness | |||||
FOCUS ON ICELAND
Around 80% of all electricity production in Iceland is used by a few large energy-intensive companies, with most of the energy locked up in long-term power-purchase agreements (PPAs). For example, the largest and longest PPA in Iceland is a 4.9 TWh/year contract between Landsvirkjun and Alcoa, with a duration of 40 years.
Historically, energy-intensive companies have shown an interest in relocating their operations to Iceland. For a long time, the majority of companies interested in Icelandic energy were aluminium smelters. However, in recent years more high-intensive electricity industries have joined this group, including data centres.
Iceland has enjoyed very stable electricity prices, and the government has not been required to intervene to support affordability. An inflexible demand side is not a problem if the production of electricity is controllable.
5.6 Weather-dependent energy supply
Impact on the energy crisis
Context
Consequences
Norwegian hydropower has generally benefitted from high electricity prices. However, low reservoir levels have resulted in calls to reduce Norway’s electricity exchange with other countries in order to conserve supplies. This illustrates that the weather has an influence not only on renewable energy production but also on other types of generation. However, the need to supply demand during periods of low wind and peak demand remains. For example, Denmark relies on power plants and electricity imports to meet demand when there is a lack of production from renewable energy. Going forward there is therefore a need for sustainable annual and multi-year long-term energy storage possibilities.
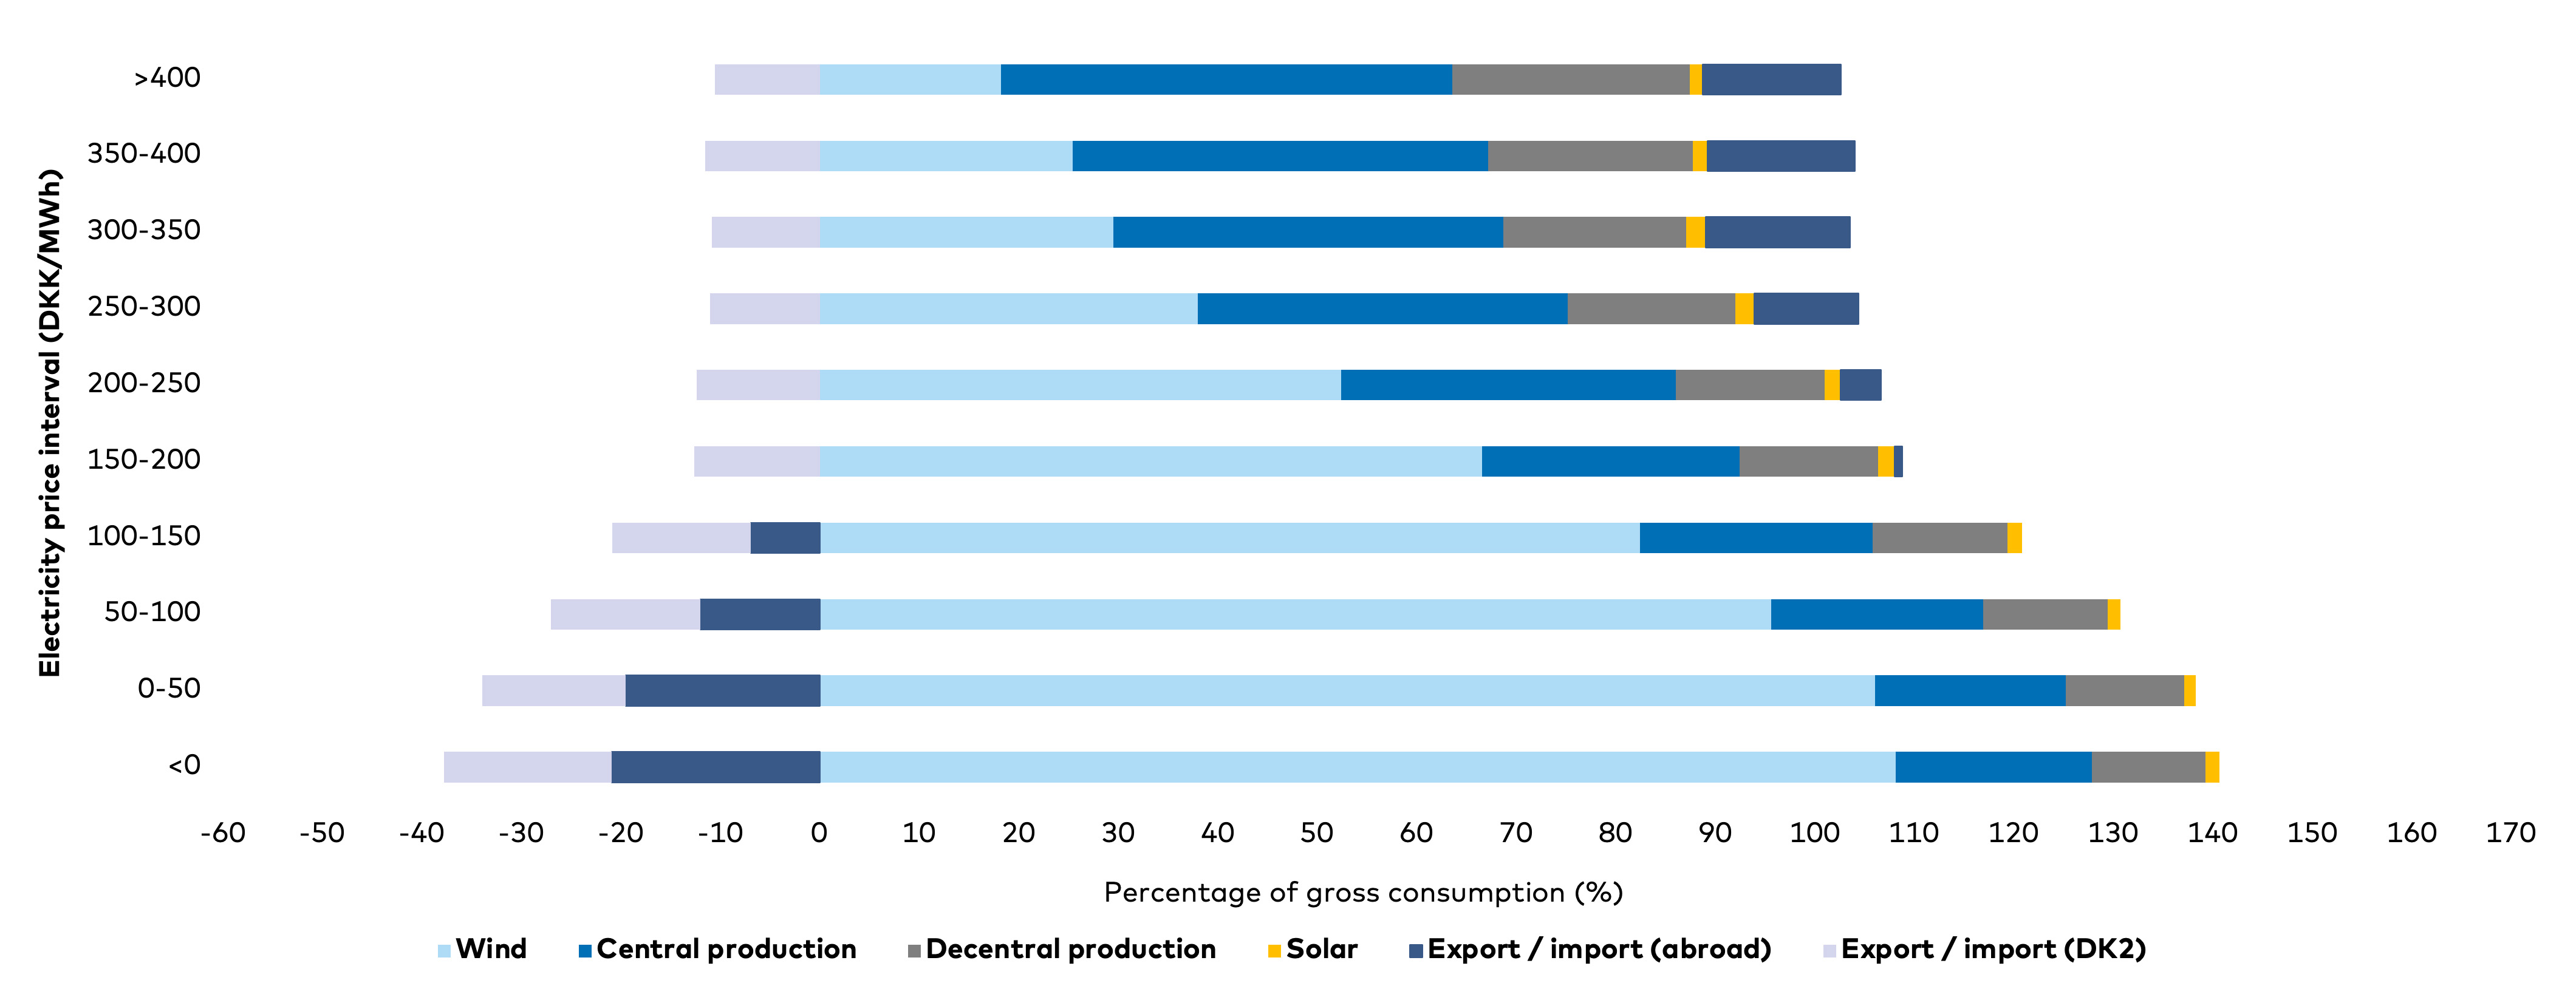
The general impact of wind energy on electricity prices and electricity flows is shown in
Impact on the value chain
Security of supply can be weakened when there is low availability of multiple energy supply options at the same time due to unfavourable weather conditions. Reduced availability of conventional power plants (as explained in

FOCUS ON ICELAND
Hydropower accounts for 70% of total electricity generation in Iceland. Since hydropower depends on weather conditions, power generation is likely to vary accordingly. Glaciers play an important role in the hydropower system in Iceland and glacier melt during warm and dry summer periods is likely to cause a variation in hydropower electricity generation. Wet, dry and normal years occur in Iceland, and in dry years, hydro facilities are at risk of water shortages. Conversely, extra power generation opportunities can be wasted in wet years due to a lack of buyers, i.e., demand, or transmission problems. Critically, as previously mentioned, there was a lack of water inflow in 2021, which led to the curtailment of the national electricity supply.
5.7 Increasing energy-import dependency
Impact on the energy crisis
Context
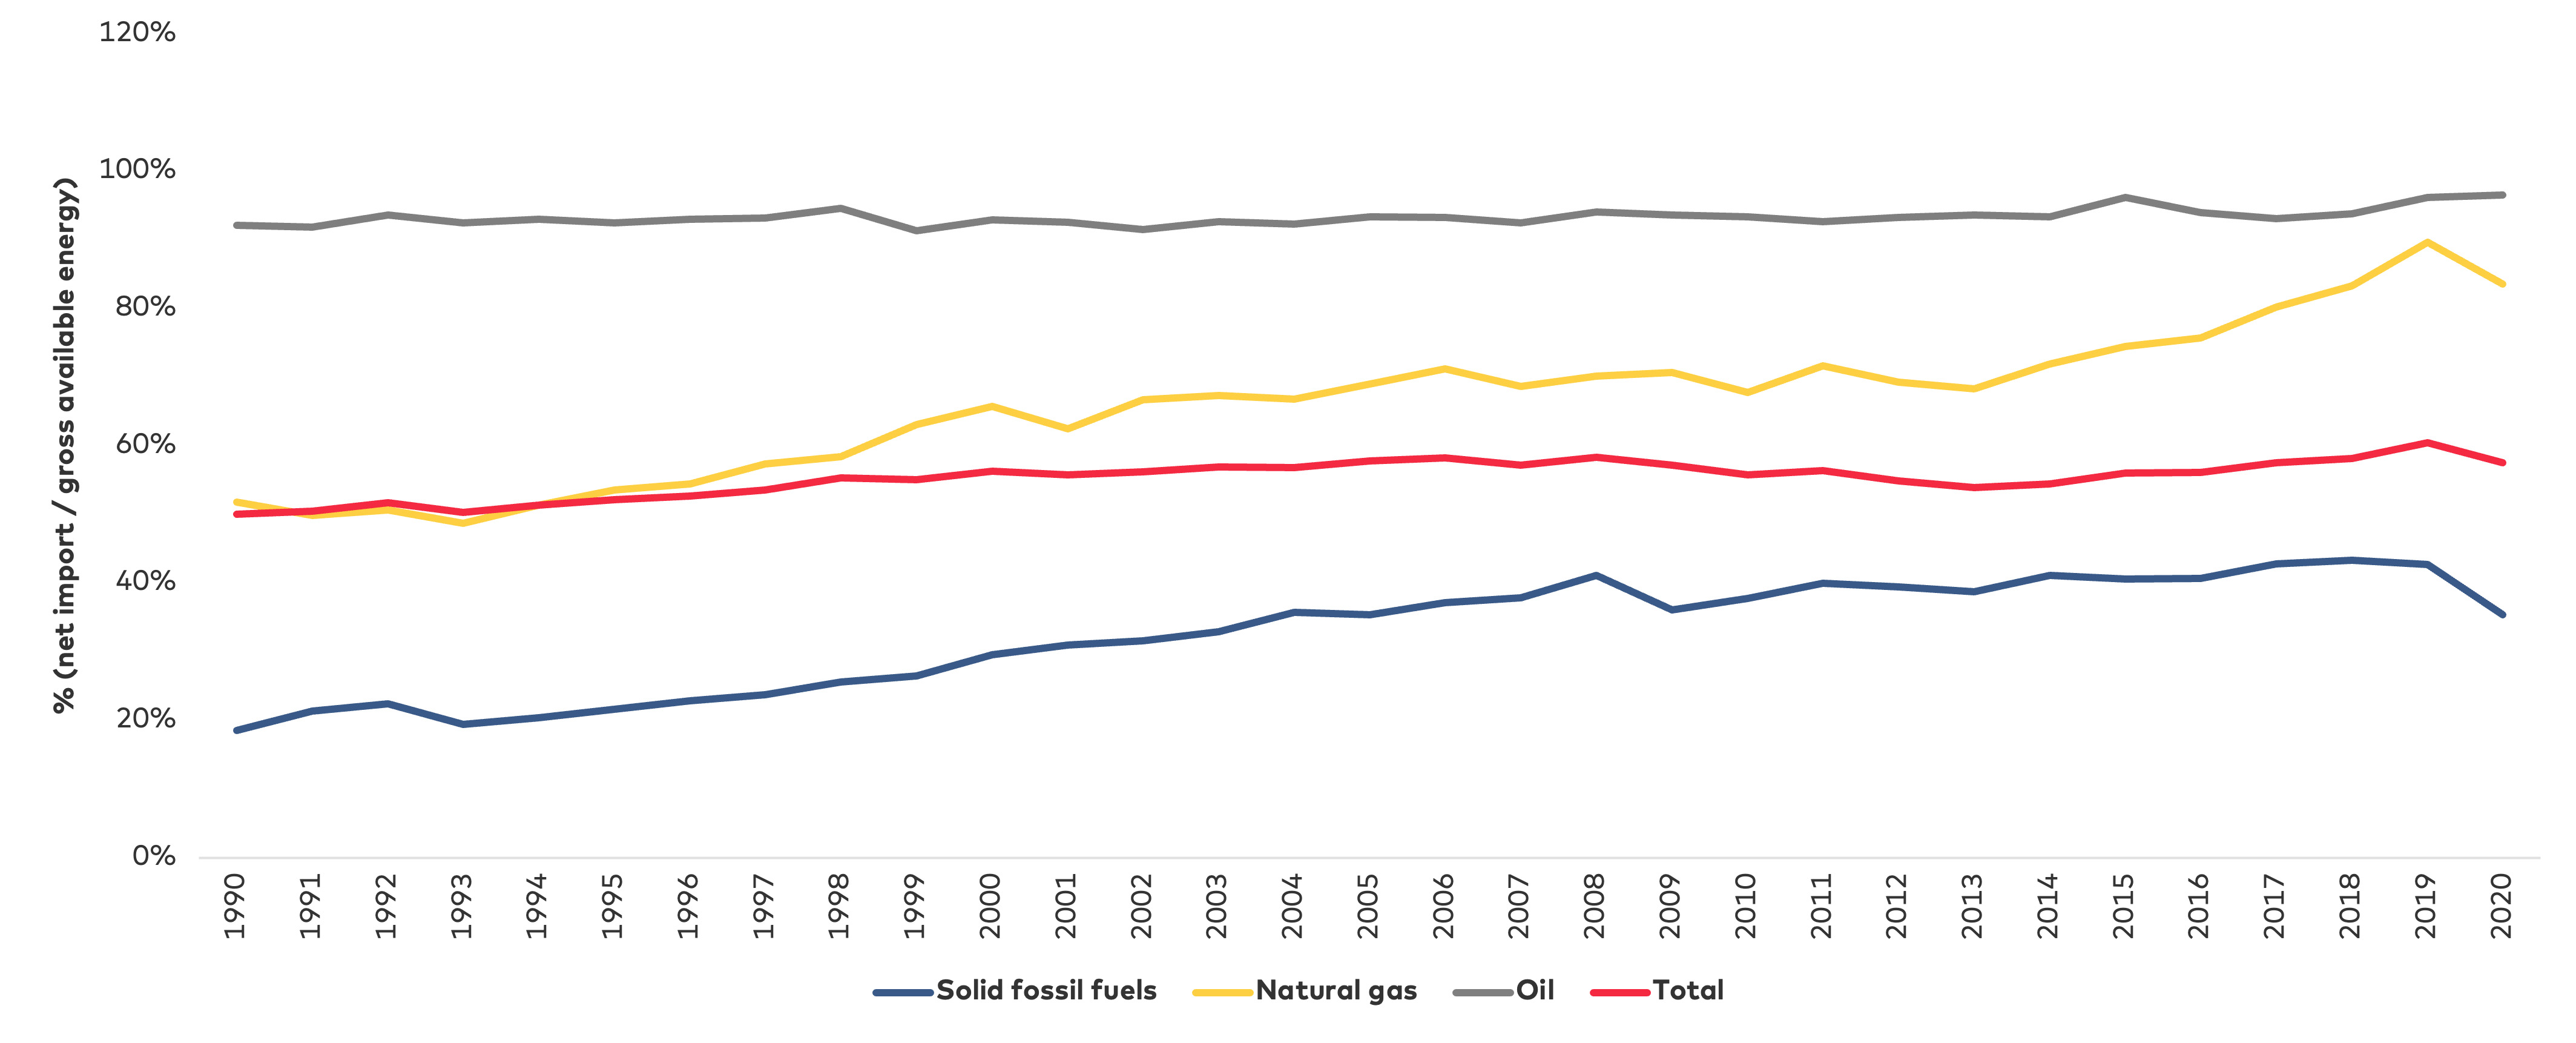
Consequences
Europe’s import dependency and reliance on Russian supply as its main source of energy imports is an important driver of the current energy crisis. Following the 1970’s oil crisis, most countries started to diversify their fuel purchases across countries to avoid becoming dependent on a single energy supplier. The problem then was reliance on oil supplies from OPEC; today, it is reliance on supplies from Russia. However, the two situations are comparable. Since Europe’s dependency on imports of Russian natural gas has been very high, energy supply disruptions cannot be disregarded for the coming winters before other energy supply chains are available at the same level as before the conflict with Russia. Connection to Europe via interconnectors and gas pipelines from the Nordic countries and the general global nature of fuel markets have created a spill-over effect for high energy prices. The energy supply challenges in Europe have been transplanted to the Nordic countries.
Impact on the value chain
The lack of diversification of energy resources and dependency on imports from Russia impact the value chain across primary energy sources. Mitigating the current situation will require diversification of energy resources and suppliers in order to provide the necessary level of security for the energy supply.
FOCUS ON ICELAND
The driver is not relevant to Iceland since 90% of primary energy use comes from domestic low-carbon energy sources. The other 10% mainly derives from oil imported from Norway.
5.8 Reductions in natural gas supply
Impact on the energy crisis
Context
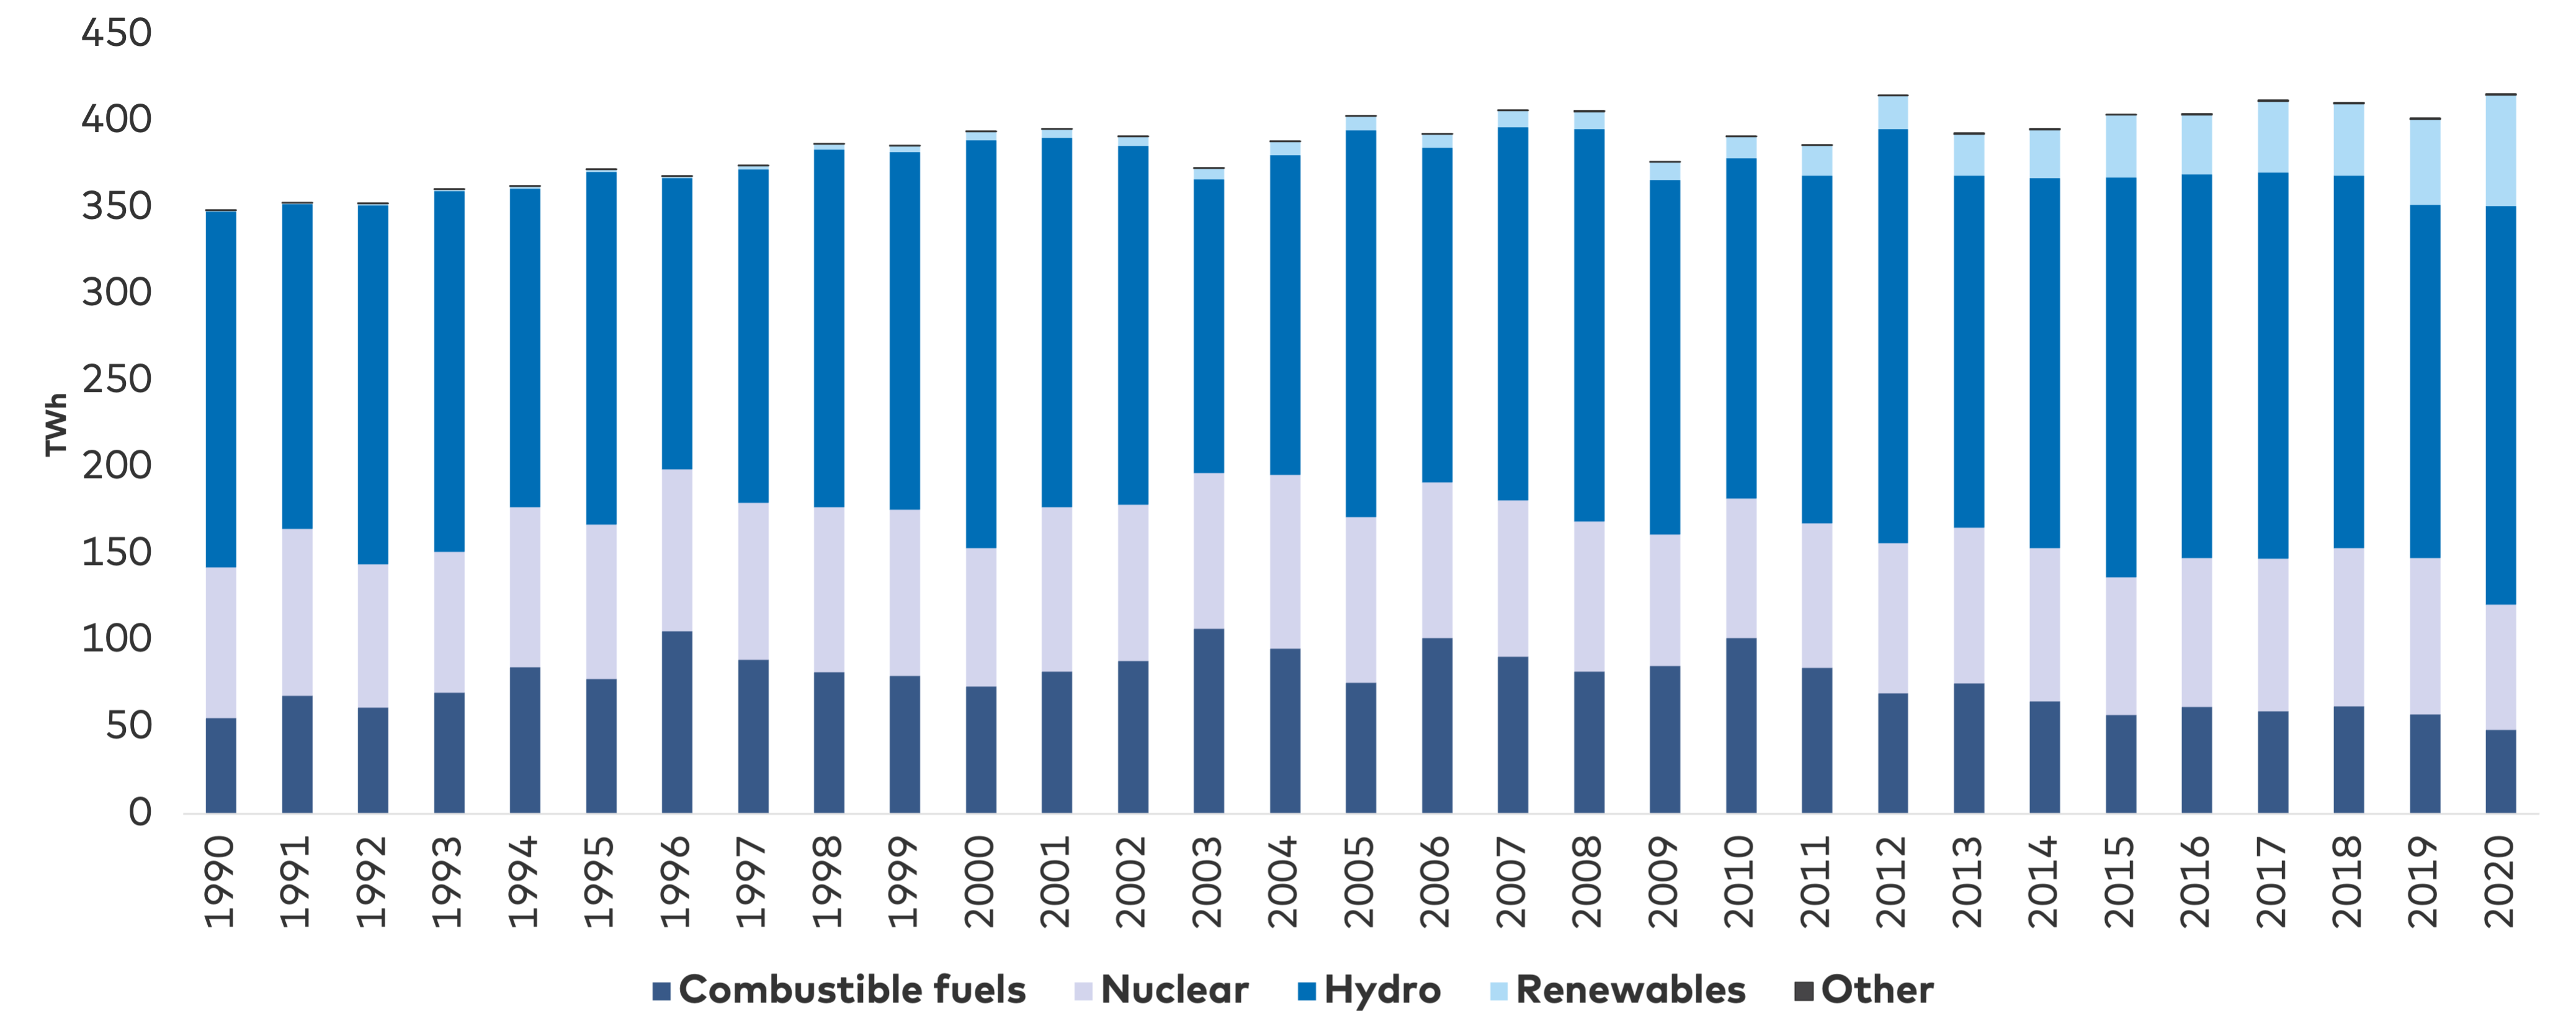
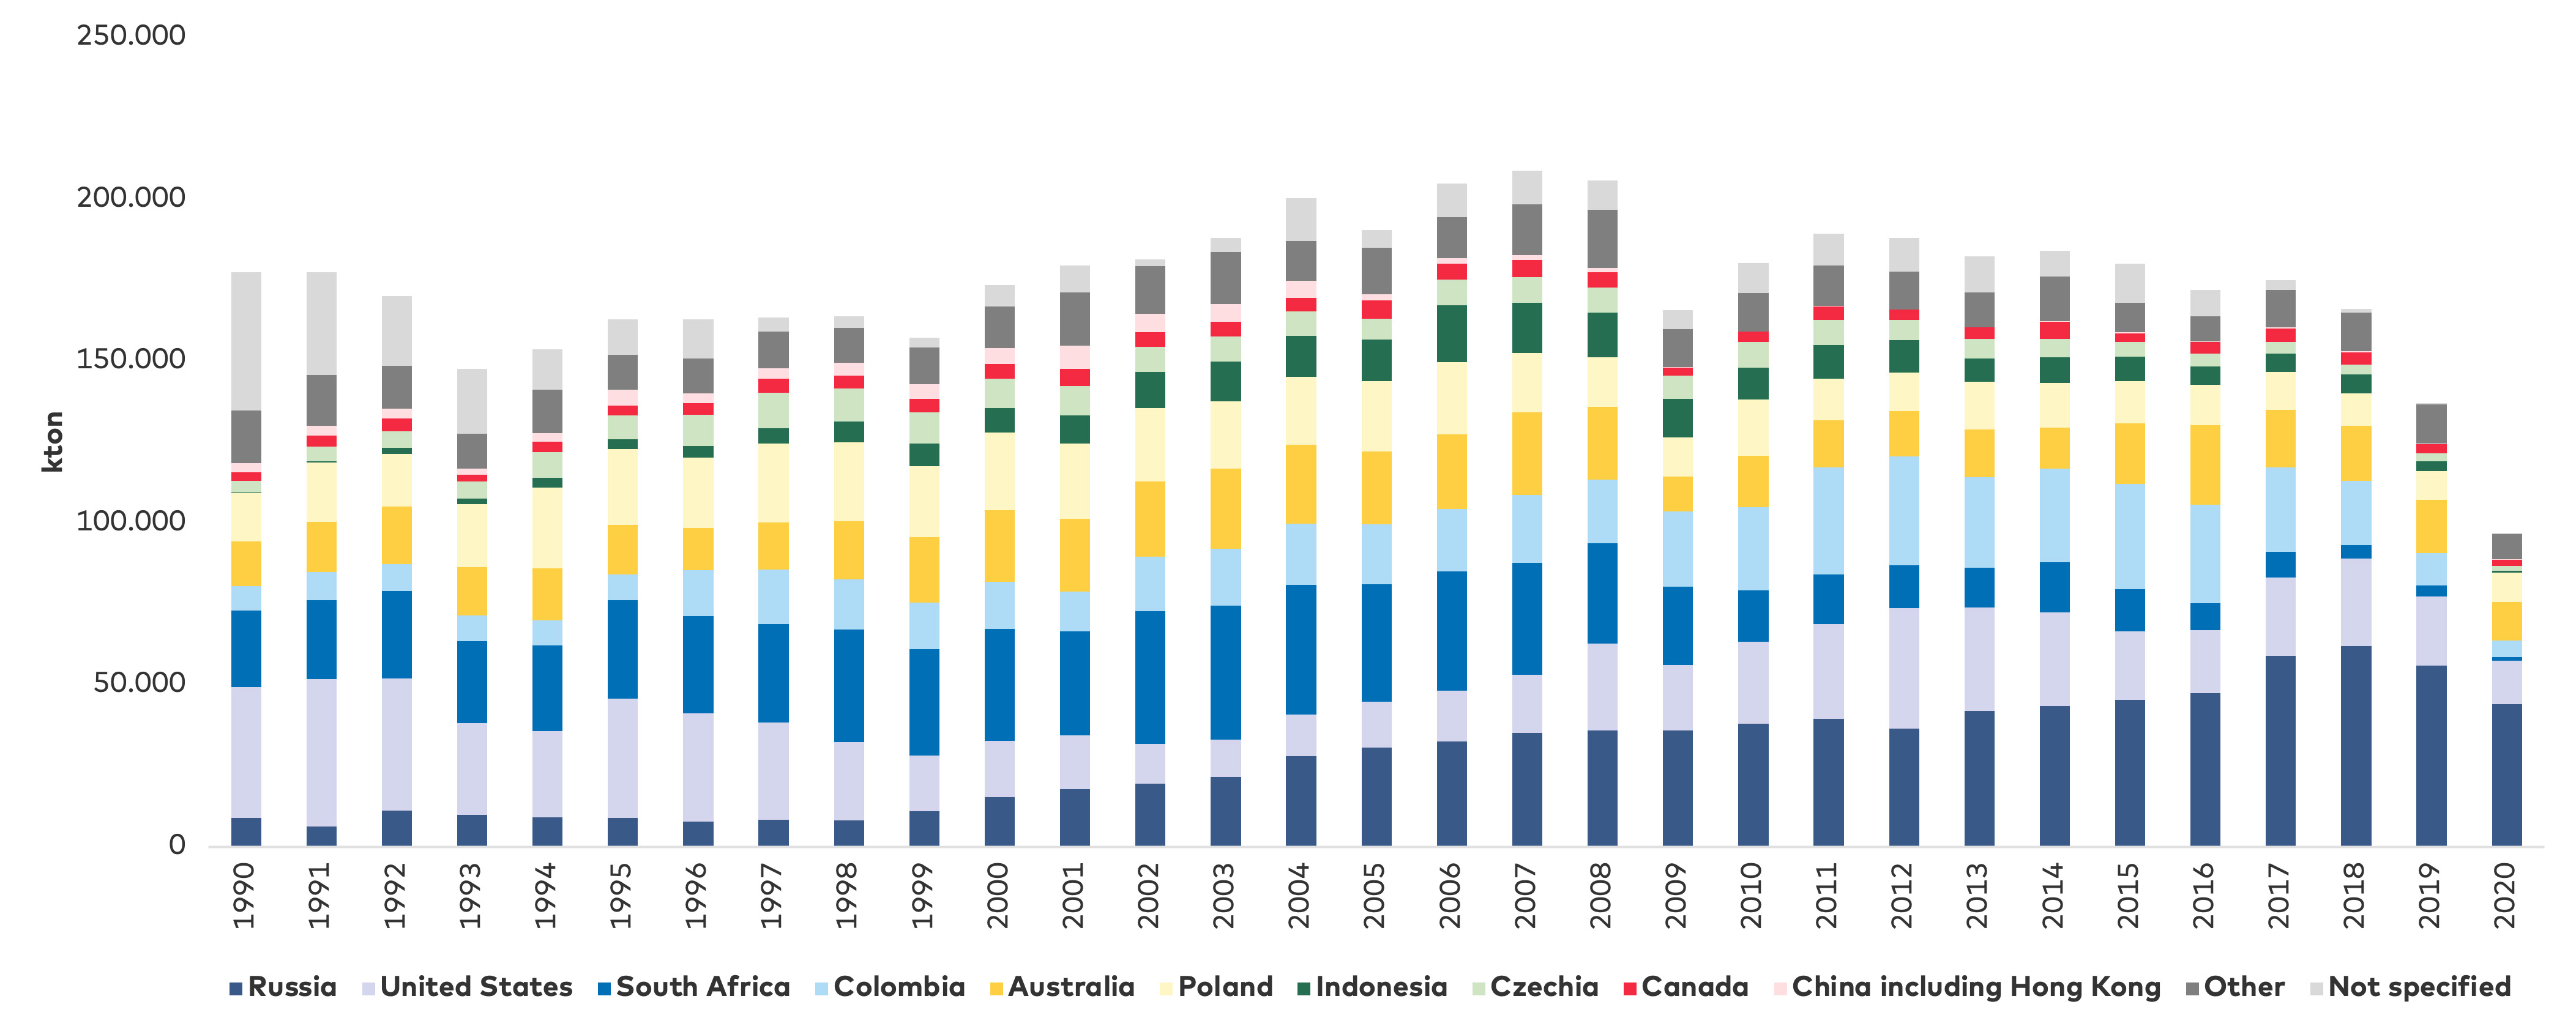
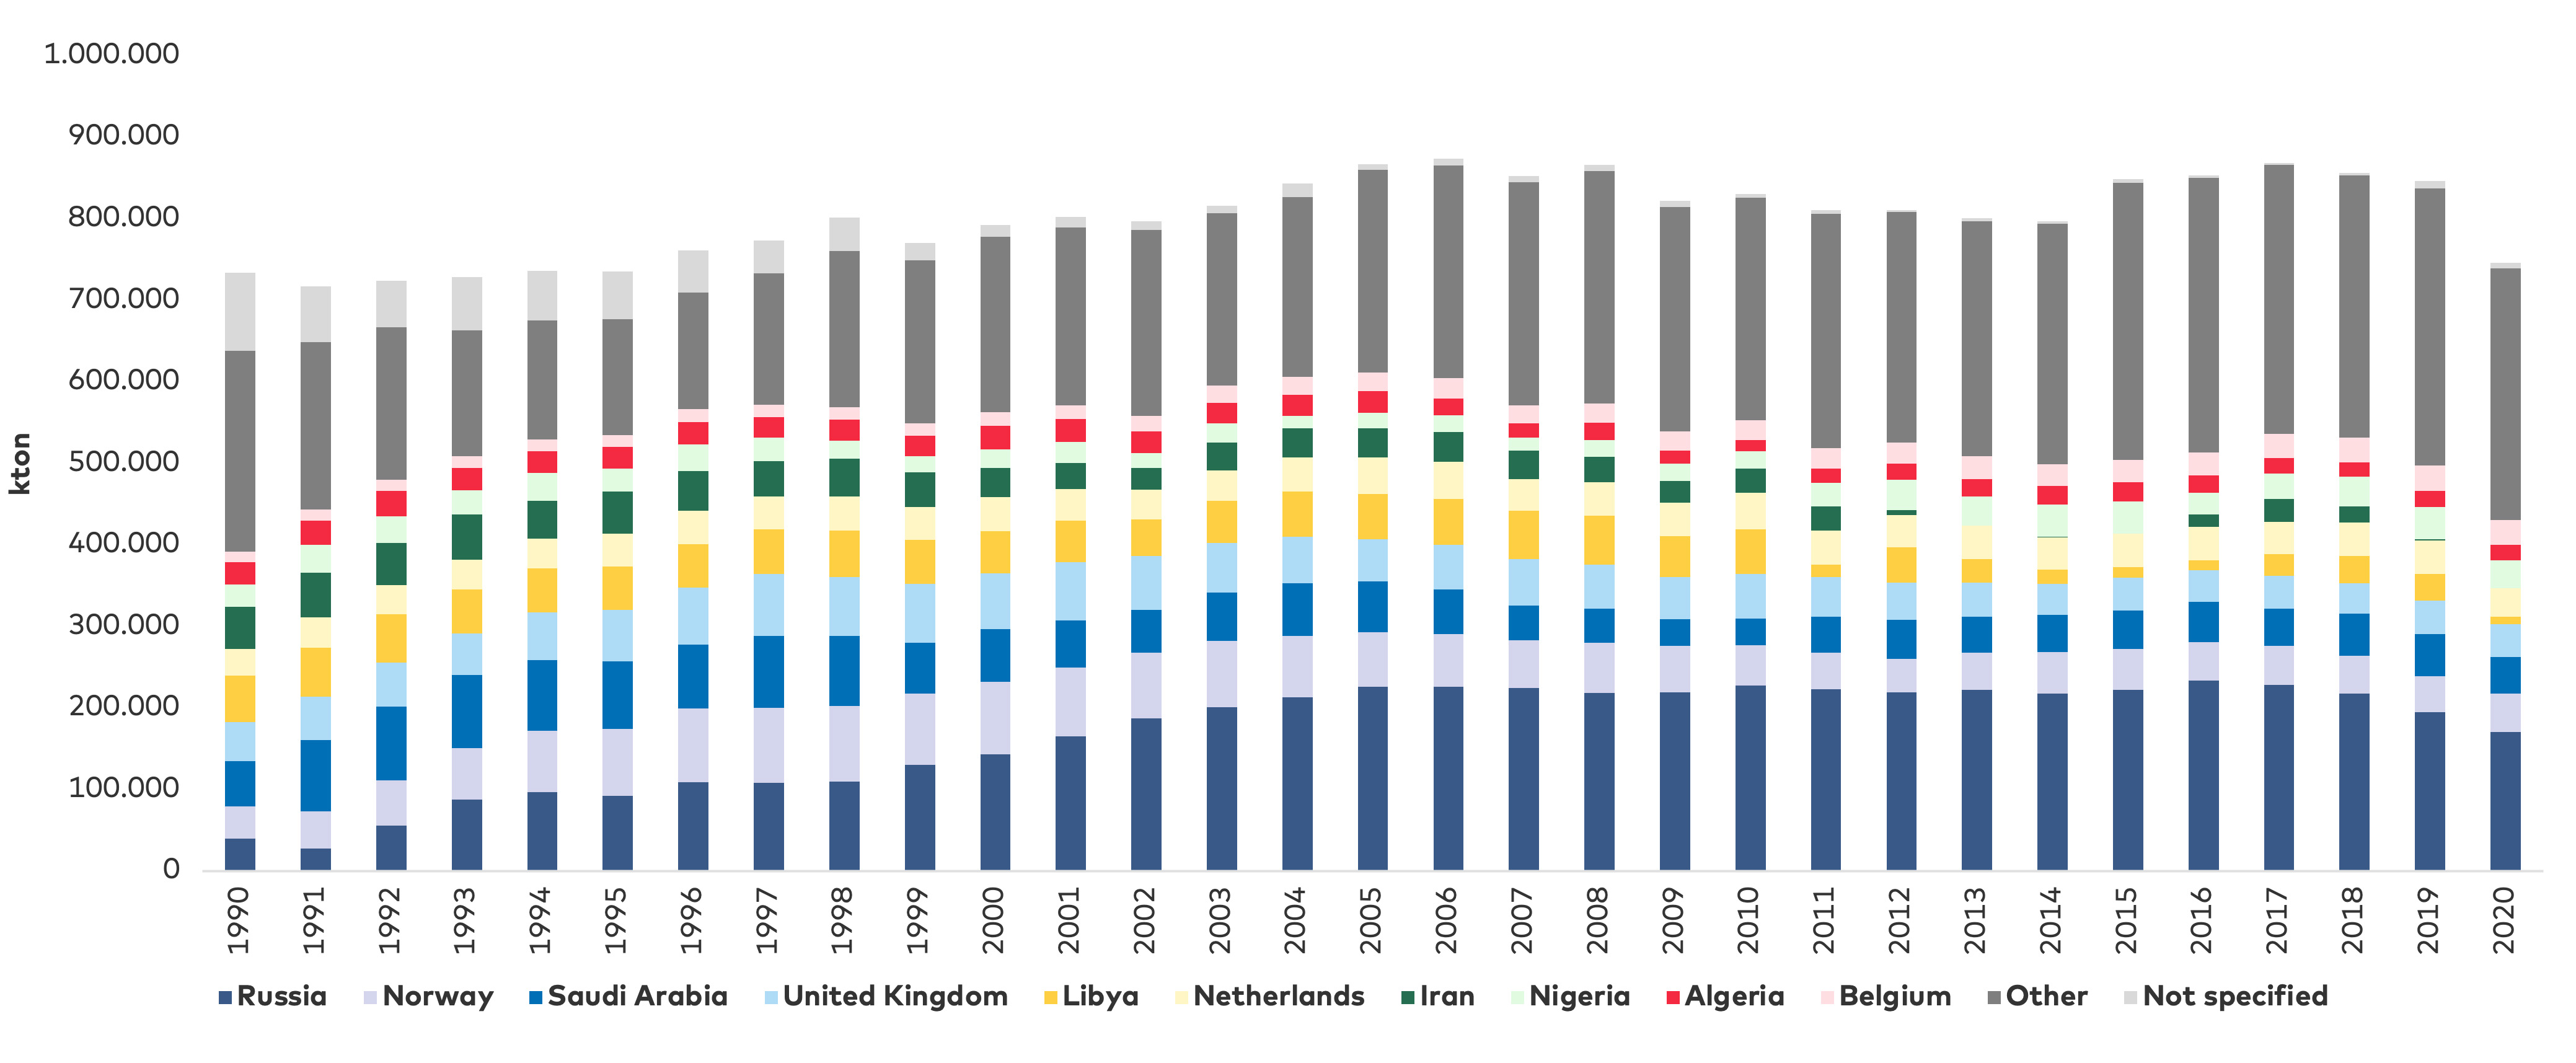
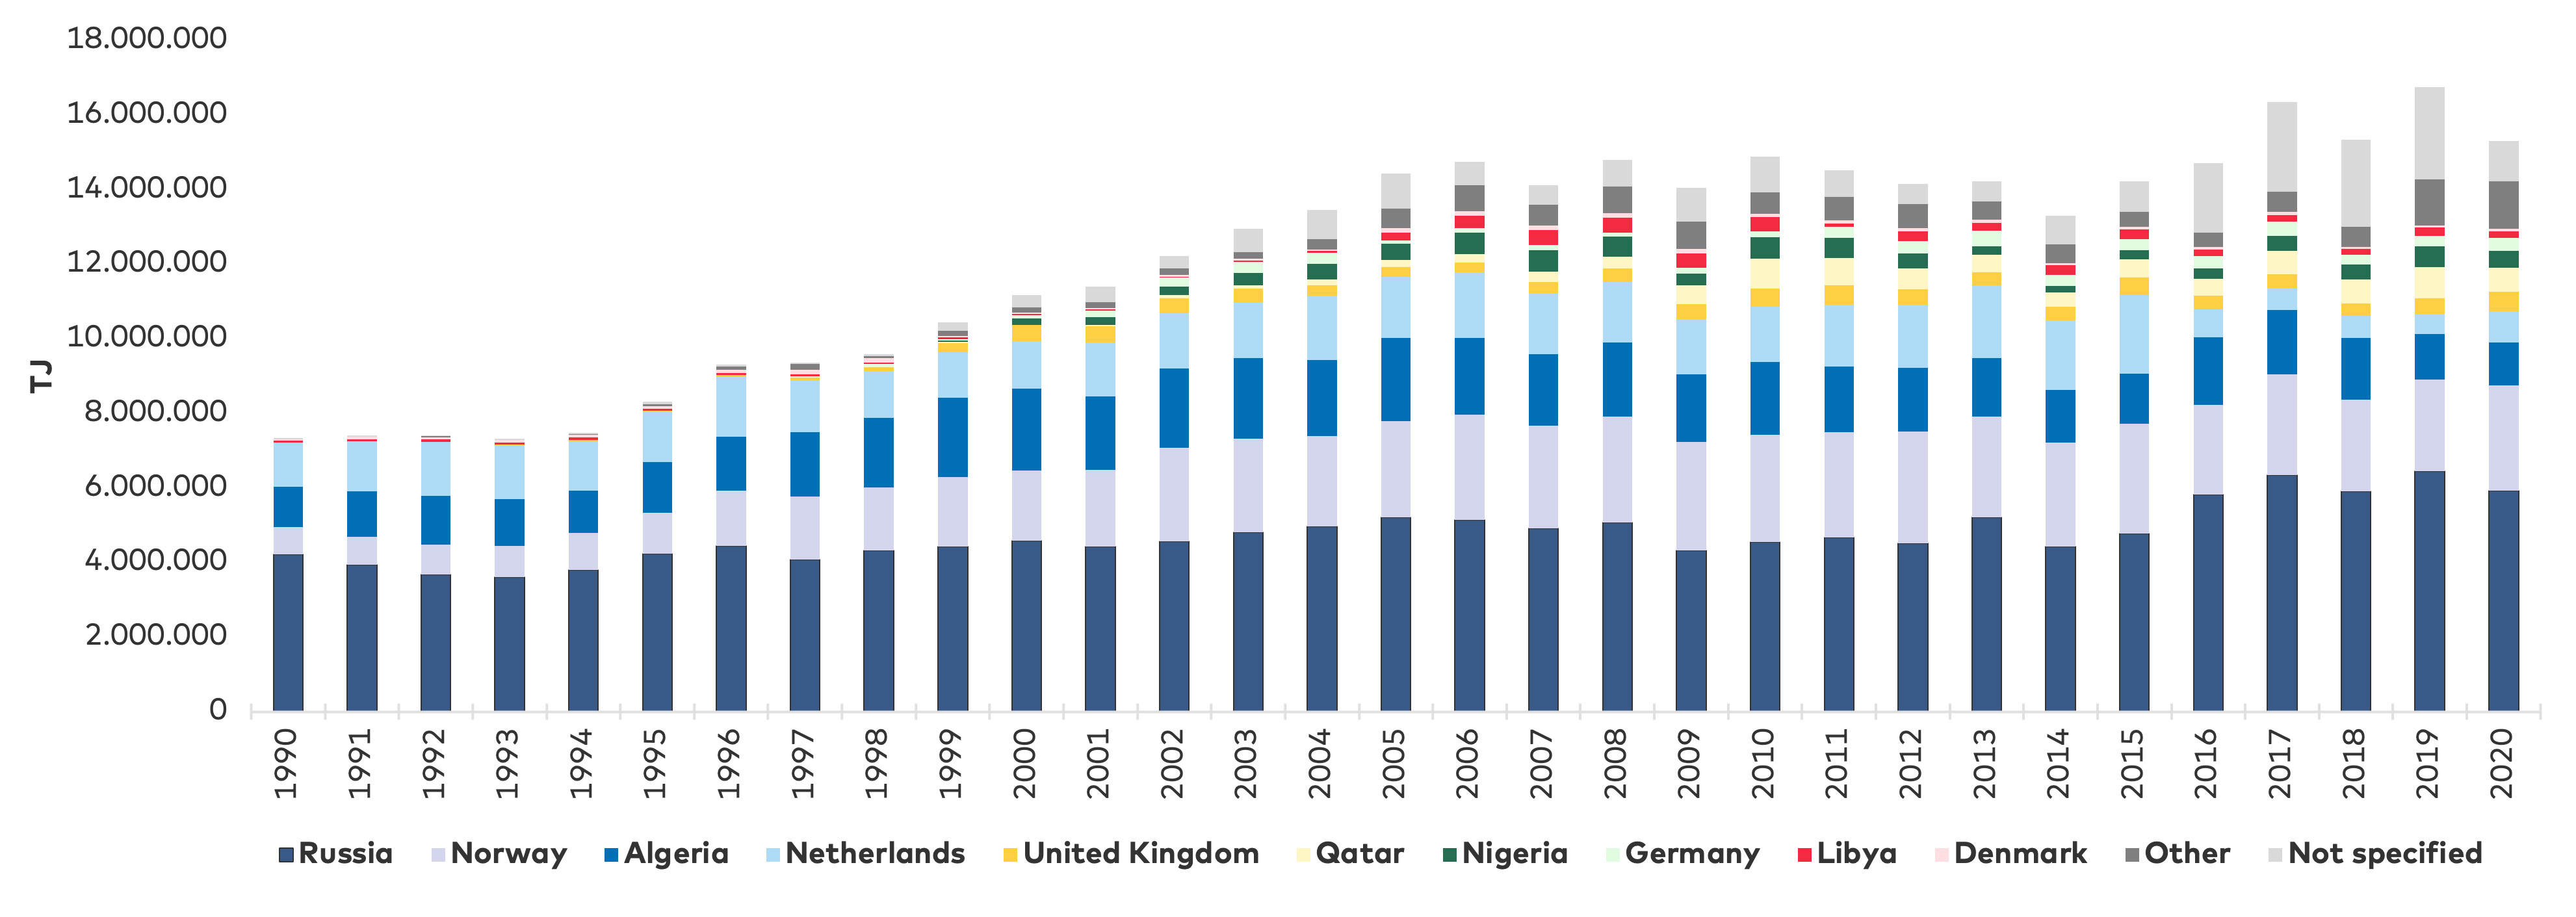
Norway is the largest producer of hydrocarbons within the Nordics. Denmark also produces hydrocarbons, albeit on a much smaller scale. A more comprehensive overview of the Nordic countries hydrocarbon activities based on data from 1990 to 2020 can be found in
Consequences
One consequence of underinvestment in natural gas production in the EU and a significant reduction in gas supplies from Russia is that power plants based on natural gas have been exposed to the historically high production costs impacting the electricity market. For example, in 2019 the decision was taken to close Europe’s largest natural gas field near Groningen in the Netherlands. Production was expected to cease in mid-2022, though this closure has since been postponed to 2023. Moreover, Denmark’s largest gas field, Tyra, will remain closed for redevelopment until 2023. Nonetheless, crisis management measures designed to increase the security of the natural gas supply have been implemented, including a requirement that natural gas storage facilities through LNG out-sourcing be filled to 80% capacity before the winter.
Following the reduction in natural gas supplies from Russia and within the EU, ENTSO-G concluded that the gas storage situation may well be worse in winter 2023–2024: “Without preparedness for Winter 2023–2024, the situation could deteriorate over the next gas year 2022–2023: storage facilities would be depleted in April 2023 and sites in Central and South-Eastern Europe would be less than 15% full on 1 October 2023, leaving the EU more exposed to risks of SoS in winter 2023–2024”[1].
Impact on the value chain
Lower natural gas production in the EU and a reduction in the supply of natural gas supplies from Russia have impacted the value chain through a lack of available natural gas as a primary energy source for storage and generation. This in turn has significantly affected both the natural gas and electricity price for end-consumers. Natural gas-fired power plants have been setting high electricity prices for many hours.
Footnotes
- ^ ENTSOG, Yearly Supply Outlook 2022/2023, 2022Website reference: https://www.entsog.eu/sites/default/files/2022-07/SO0036-22_Yearly_Supply_Outlook_2022-2023_2.pdf
FOCUS ON ICELAND
Not relevant as Iceland does not use natural gas.
5.9 Preparedness of the Nordic countries
| NO EFFECT | LOW | MEDIUM | HIGH | ||
| DRIVER | DENMARK | FINLAND | ICELAND | NORWAY | SWEDEN |
| Electricity market structure | Several power plants have been decommissioned or mothballed. Profit margins on electricity sales were significantly reduced before the energy crisis, leading to a greater focus on district heating (CHP plants) as revenue-providers. Peak demand can no longer be supplied domestically. | Additional nuclear capacity and wind will improve the capacity balance. No significant closure of baseload plants such as hydro and nuclear has been observed. Spill-over effects from neighbouring countries and electricity import reliance have affected prices and domestic security of supply. | The electricity market structure is different from the other Nordic countries with fewer market players. No actor is legally responsible for security of supply. One company produces 73% of all energy in Iceland and is also the country's majority shareholder in the TSO. | The first Nordic country to deregulate its electricity market was Norway. No hydropower plants have been closed, and trade across borders has been profitable. Spill-over effects of high electricity prices from central Europe during the energy crisis have been observed. | The structure of the electricity market zones in Sweden splits the country into high and low-price zones. Production is concentrated in the north and demand in the south. Strategic reserves are deployed as peak load plants. Re-drawing of the market zones has been discussed. Price signals indicate a lack of baseload and electric grid infrastructure. |
| Decommissioned controllable electric capacity | The decommissioning of power plants has already had and will continue to have an impact on the capacity balance due to the expected increase in electricity demand. Demand response, energy storage and sector coupling are currently not delivering the equivalent services of power plants. | The closure of power plant capacity in other countries and reduced electricity imports from Russia have had an impact. New nuclear capacity will increase security of supply and reduce dependency on electricity imports. Some power plants have been closed, but new nuclear capacity will improve the capacity balance. | No electric capacity has been decommissioned. | No hydropower electric capacity has been decommissioned. Mongstad gas-fired power station has been mothballed. Spill-over effects from other countries in terms of higher electricity prices have been observed. | Decommissioning of nuclear capacity and reduced electricity from CHP has had a negative effect on the capacity balance, reducing security of supply. This has resulted in higher reliance on electricity imports from neighbouring countries. Demand response, energy storage, and sector coupling have so far not been able to replace nuclear power plants. |
| Electricity supply and demand balancing | Denmark is impacted by the integration of renewables in terms of the additional grid balancing services that need to be delivered. Interconnectors are used extensively to integrate renewables. Export during high renewable production and import during low renewable production have been observed. | Reliance on nuclear and hydro power for baseload electricity production and lower development of renewable energy (in 2022) in comparison to the other Nordic countries ensures a generally lower requirement for short-term balancing. Future build-out of renewables is significant. | Excess energy capacity has decreased in recent years due to increased electricity demand, resulting in occasional shortages of energy supply. | Norway relies on short-term controllable hydropower. From a longer perspective, production is dependent on water inflow. Wet, dry and normal years occur. Seasonal storage is possible if conditions or requirements for this are present. | The location of renewable energy generation and challenges around transportation to loading centres due to bottlenecks in the transmission system has created a need for additional grid balancing services. |
| Lack of electric grid infrastructure | Low price differentials between the two market zones have been observed. The transmission problems in Germany and Sweden have impacted renewable energy integration. Future challenges are expected to increase. | Electric grid infrastructure is expected to be further developed in the future. Increased build-out of interconnectors to Sweden and Norway is expected. Direct connections to central Europe are not possible. | An ageing transmission network, lack of investment in infrastructure, bottlenecks in the network and increased energy demand have had an impact. | Increasing electricity prices impact Norwegian consumers via interconnectors and a lack of domestic infrastructure. Producers have increased revenues through exports. Price differences exist between northern and southern Norway. Domestic transmission is needed. | Lack of investments in grid infrastructure together with renewable energy development have resulted in electricity price differences between north and south Sweden. Long permitting times for new grid infrastructure have impacted current needs. |
| Inflexible electricity demand | Energy efficiency measures have been promoted to reduce vulnerability during the energy crisis. A short-term demand response is required to integrate renewable energy. However, the required demand response is not currently available in the wholesale electricity market. | Electricity production in Finland can cope with inflexible demand more easily as most generation is controllable. The reduction in electricity supplies from Russia is expected to be compensated by the new nuclear power plant, Olkiluoto 3. Demand response is needed to avoid outages. | Inflexible demand has recently impacted Iceland, with a large share of electricity locked up in long-term PPAs, and increased energy demand from energy-intensive industries. | Dry years for hydro power are currently handled through increased electricity imports via interconnectors. Historically, reductions in demand have been necessary. Short-term variations in demand can be supplied by hydropower. | Integration of renewable energy requires a short-term demand response. The price differences across Sweden require a level of demand response to high prices that has not yet been observed. Demand is not sufficiently impacting price setting to substantially reduce electricity prices. |
| Weather-dependent energy supply | Changing weather conditions in the form of wind and solar radiation have a high short-term impact due to the significant development of renewable energy. More focus on forecasting demand and supply will be required. | Precipitation for the hydropower plants affects the long-term operation of the system. The development of renewable energy is still at a lower comparative level than in other Nordic countries in 2022. Significant build-out of renewables is expected. | 70% of total electricity generation comes from hydro power, meaning that low precipitation and glacial runoff have an impact on long-term operations. | Changes in precipitation cause changes in water inflow to the reservoirs. Foreign connections ensure supply during dry years. The system is designed to handle fluctuations in water inflow to the reservoirs. | Changed weather conditions affect both hydropower and renewable energy generation. In practice, short-term and long-term balancing challenges will have to be managed. |
| Increasing energy import dependency | Reductions in domestic hydrocarbon production have increased reliance on foreign supply, increasing import dependency. | Reductions in energy imports from Russia have made security of supply dependent on the commissioning of Olkiluoto 3. Electricity prices have been affected by imports from the Baltics.. | No changes have been observed. | Rising oil and natural gas prices have substantially boosted revenues from hydrocarbon sales. | Higher energy prices have impacted Sweden in general. Import dependency has not changed in recent years. |
| Natural gas supply reductions | Biogas has been able to supply an increasing share of demand for natural gas. Furthermore, the opening of Baltic Pipe has increased the natural gas supply options. Natural gas prices have been increasing. | Finland has been impacted by its high reliance on natural gas supplies from Russia; Other gas routes can replace Russia e.g. LNG imports or the Baltic-connector. | No demand for natural gas. | Norway has benefitted from natural gas supply disruptions through higher sales volumes and prices. | Sweden is in the same situation as Denmark, as the natural gas system in Sweden is only connected via Denmark. |
5.10 Responses to alleviate pressure on household finances
| RESPONSE AND INTENDED EFFECT | DENMARK | FINLAND | NORWAY | SWEDEN | ICELAND |
| Subsidy/grant/cheque | ● | ● | ● | ● | ● |
| Lower energy tariffs/taxes | ● | ● | ● | ● | ● |
| Incentivise energy efficiency/technology | ● | ● | ● | ● | ● |
| Postponements of bills | ● | ● | ● | ● | ● |
| Information campaigns | ● | ● | ● | ● | ● |
| Public energy savings | ● | ● | ● | ● | ● |
| Tripartite negotiations | ● | ● | ● | ● | ● |
| Investment in research | ● | ● | ● | ● | ● |
| ● = Implemented initiative | ● = Adopted not implemented yet | ● = Not adopted |
Compared with the other European countries, the responses in Nordic countries have been less extensive in terms of monetary support, as measured as a percentage of GDP (See
Despite government intervention to provide financial help to households, European energy poverty is expected to generally increase as a result of rising energy costs. The EU’s Joint Research Centre (
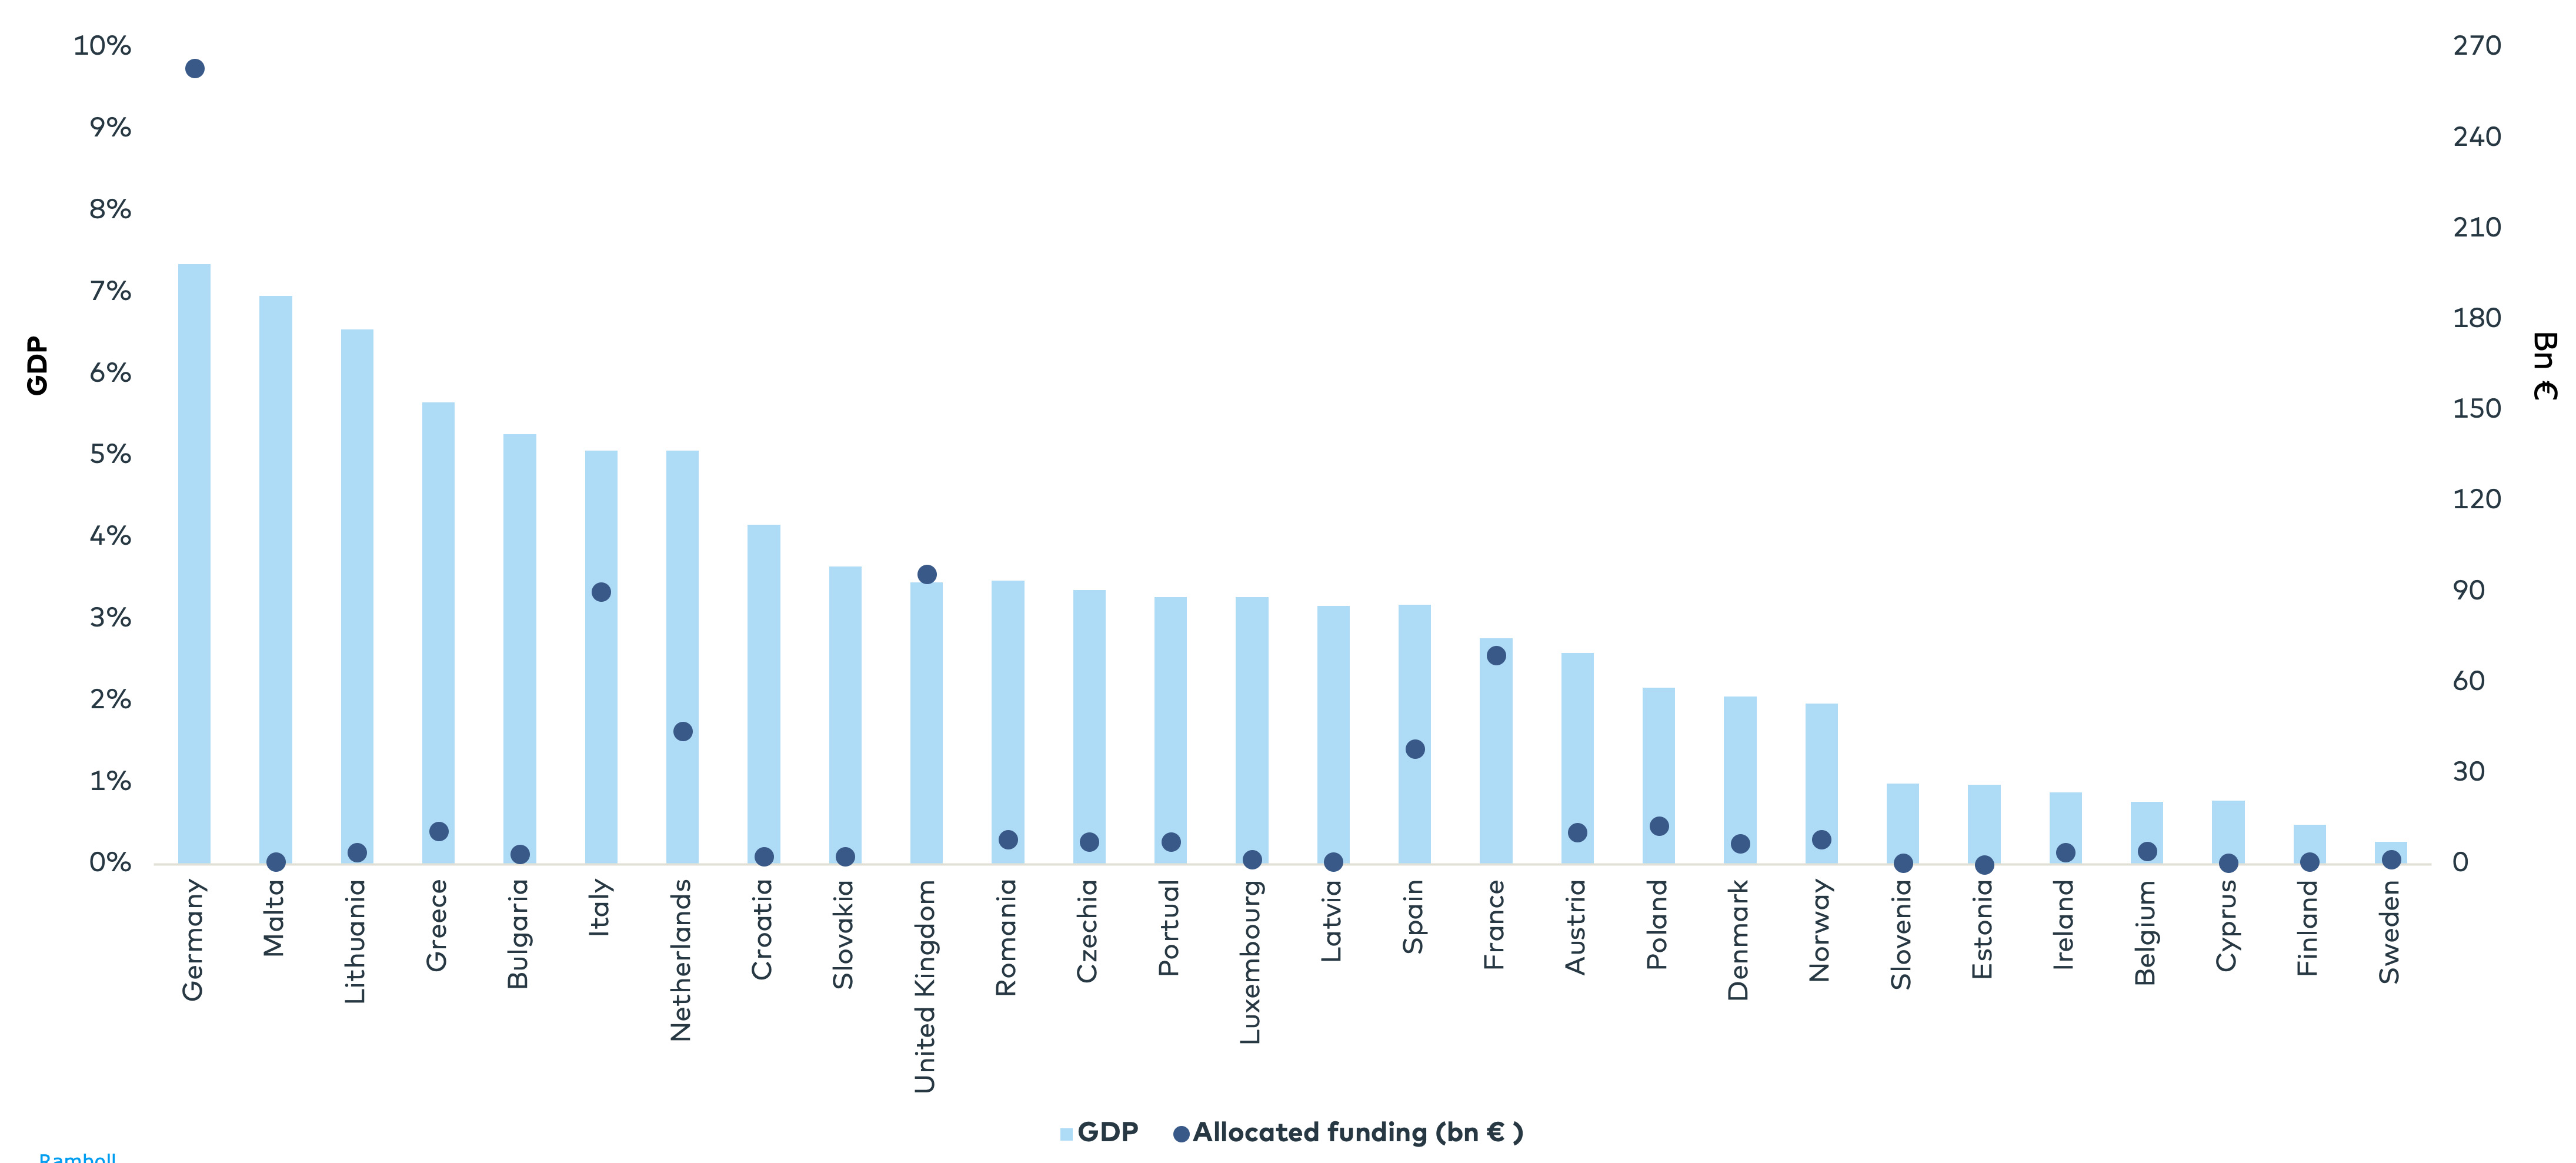
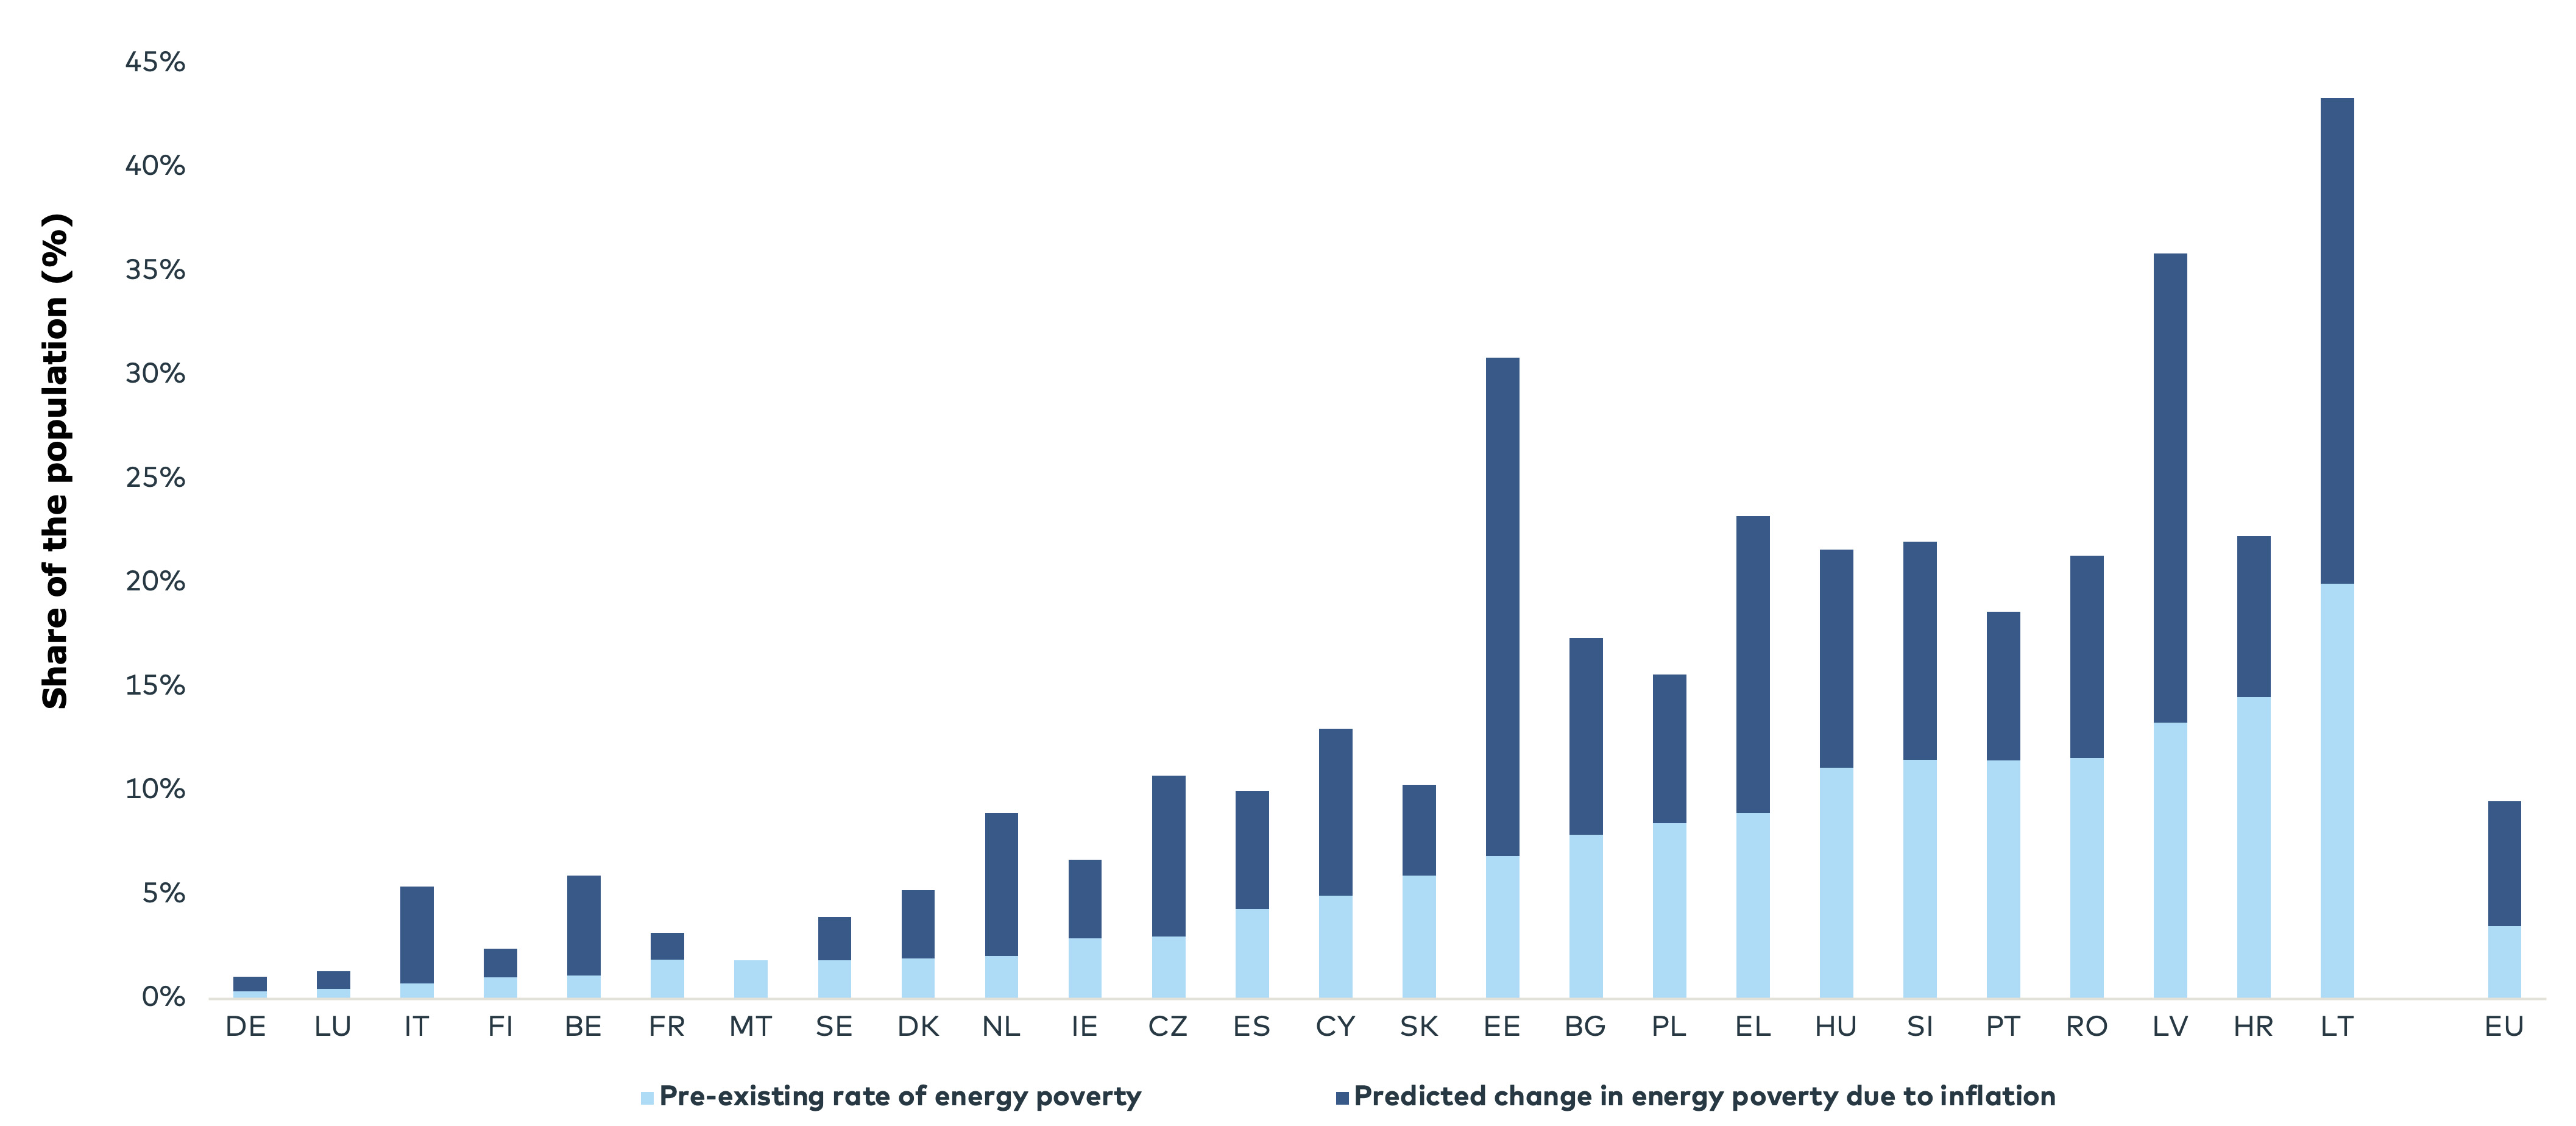
Energy poverty is generally more prevalent among lower-income groups, since price increases affect these households more as a percentage of income and spending. This can also be seen when analysing the distributional impact of energy prices on high income and low income households in 2022 (
In this context, it is worth noting that Sweden and Finland both experienced a low heterogeneous impact of energy price increases and low predicted changes in energy poverty and also allocated less funding as a percentage of GDP for counteractive measures. In contrast, Denmark has been hit slightly harder. Therefore, while there has been an increase in the cost of living and energy poverty, the crisis has not impacted Nordic households to the same extent as in other European countries.
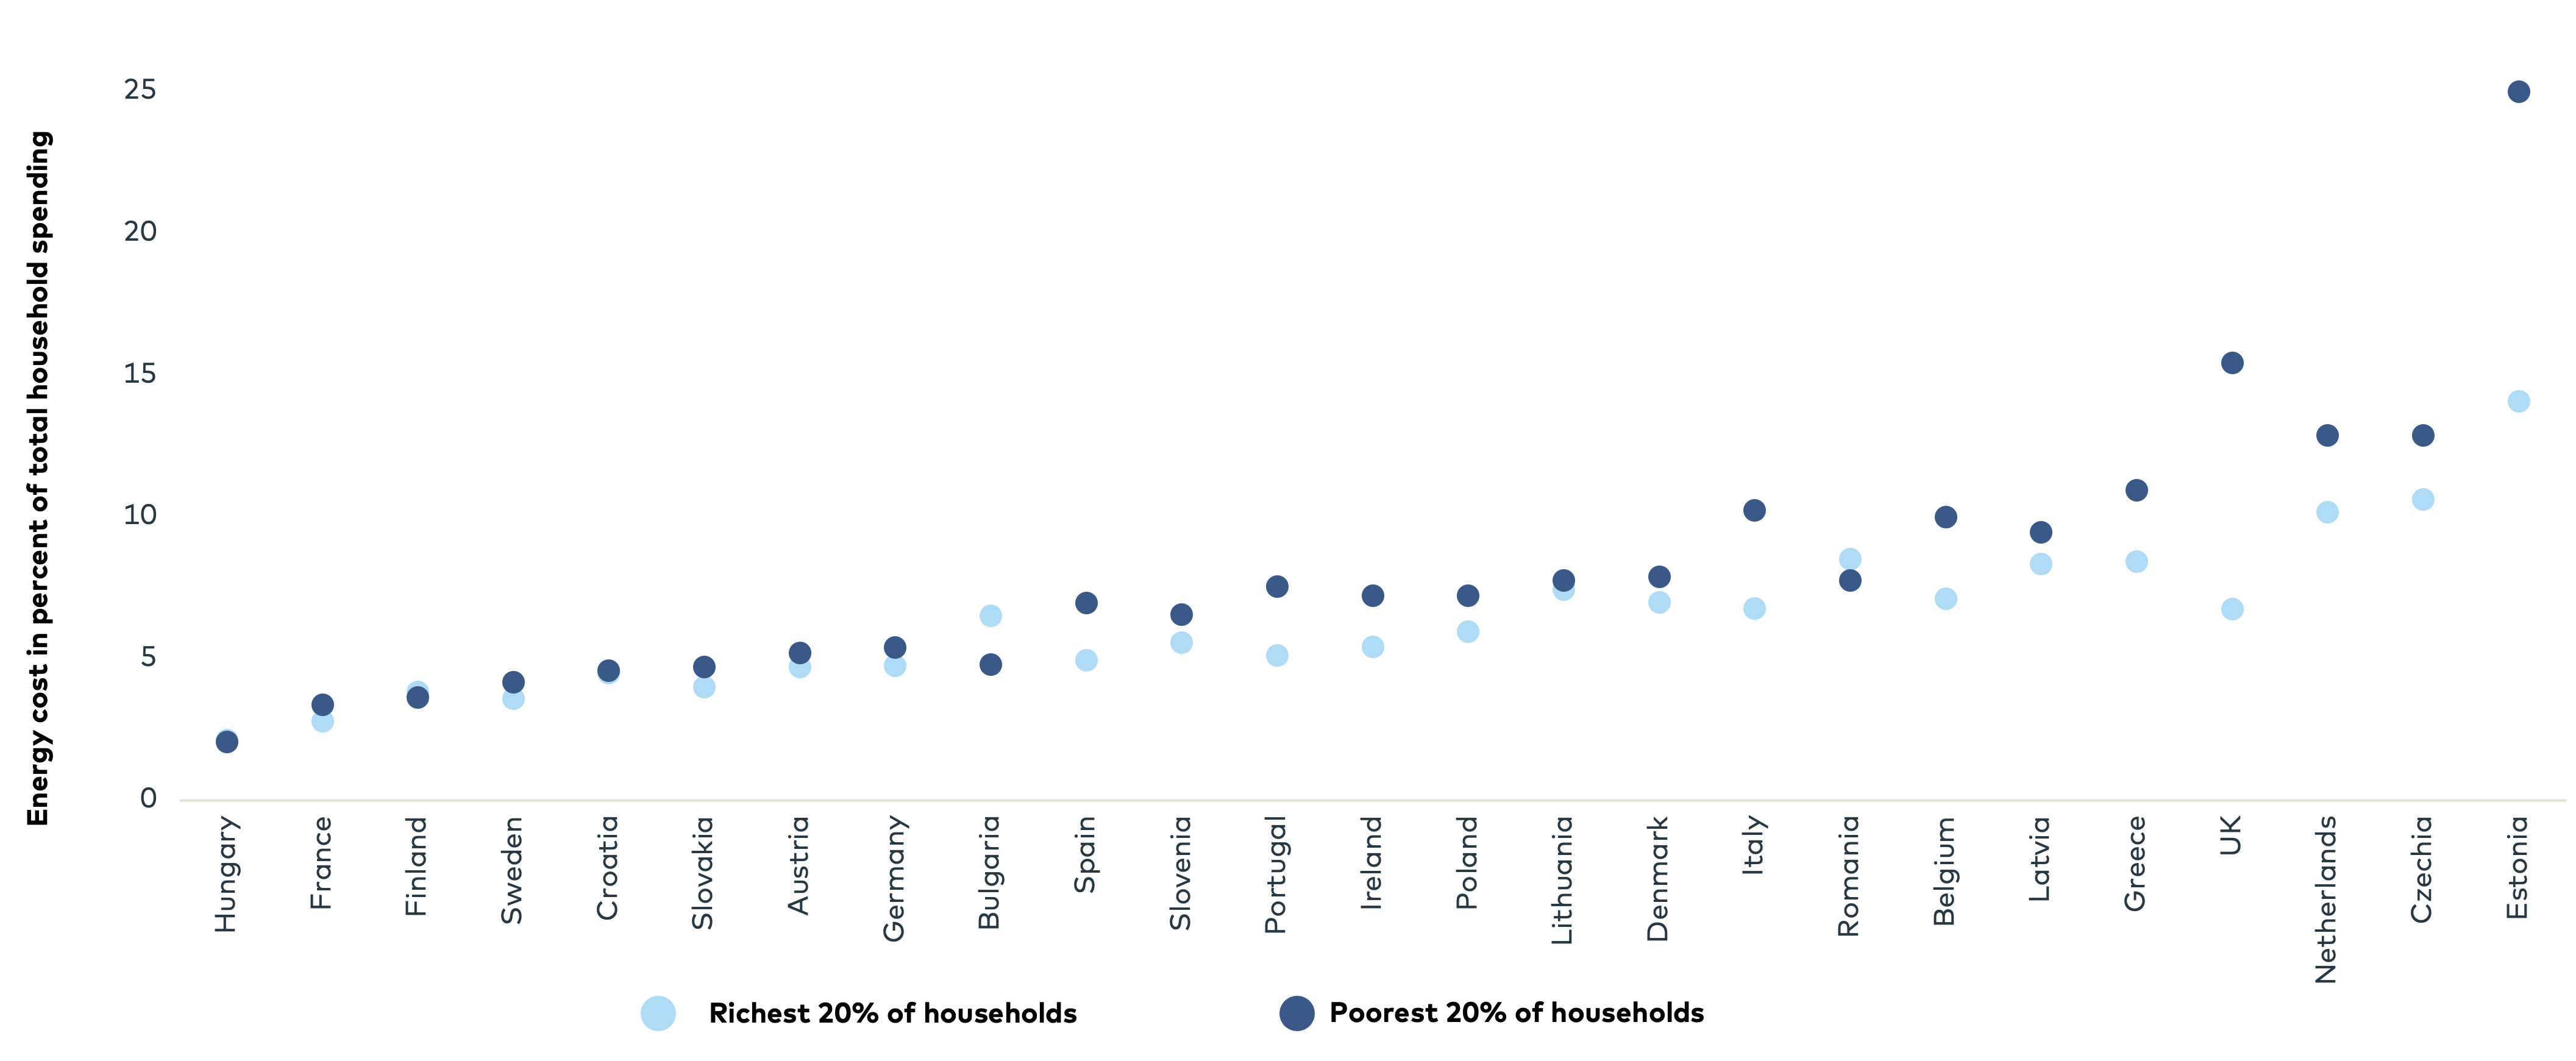

6. RISK SCREENING
This section includes a risk screening of the Nordic electricity market, with the aim of investigating, identifying and evaluating key risk factors for the energy transition in the form of potential supply chain issues and price shocks going forward. The risks have been identified through literature screening and interviews with key stakeholders in the energy market.
Risks are mapped and ranked in terms of their impact on security of supply and the likelihood that they will materialise. This enabled the creation of a risk matrix to obtain an overview of the high-, medium- and low-risk factors affecting the Nordic electricity supply. As already mentioned, delimitations, geopolitical movements potentially leading to sabotage etc. and cybersecurity concerns are not considered in the scope of this report. These risk categories have a relatively low likelihood of materialising, but could have disastrous consequences for security of supply if they did, indicating that these risks – and similar risk factors - should be thoroughly analysed in a separate report. The identified high-risk factors are described applying the analysis structure highlighted in
| Based on Ramboll asessment | Based on Ramboll assessment | ||||
| No. | Risk name | Category | Risk occurence | Impact on SoS | Likelihood |
") | ") | ||||
| ● = High | ○ = Low | ||||
| Risk to security of supply / Likelihood / Possible consequense in the value chain | Based on Ramboll assessment | ||||
| Impact on affordability | Evaluation | ||||
 | |||||
| Impact on sustainability | Evaluation | ||||
 | |||||
| ● = Low | ● ● = Medium | ● ● ● = High | |||
The risk screening identified ten high-risk factors, nine medium and three low-risk factors. Four high-risk factors relate to governance issues, three to energy and three to social issues. Of the top five high-risk factors, three relate to governance issues, namely: approval processes for infrastructure projects, market design in terms of ensuring the required capacity at low and stable prices, and country dependence in terms of concentration of where materials and fuels are sourced from to avoid external security of supply concerns. Public acceptance of infrastructure and electricity grid infrastructure is also in the top 5. The results are presented in
Based on identified high-risk factors,
| NO. | RISK NAME | CATEGORY | OCCURENCE |
| 1 | Long approval processes | Governance | Short-term |
| 2 | Modest public infrastructure acceptance | Social | Short-term |
| 3 | Inadequate electricity market design | Governance | Short-term |
| 4 | High mineral and fossil energy supply dependencies | Governance | Medium-term |
| 5 | Lack of electric grid infrastructure | Energy | Short-term |
| 6 | Absence of sustainable long-term energy storage | Energy | Medium-term |
| 7 | Unchanged consumer behaviour | Social | Short-term |
| 8 | Increased weather dependence | Energy | Short-term |
| 9 | Insufficient energy crisis management | Governance | Short-term |
| 10 | Labour shortage | Social | Medium-term |
| 11 | GHG goals opposition | Social | Medium-term |
| 12 | Material intensity | Energy | Medium-term |
| 13 | Decreased collaboration | Governance | Short-term |
| 14 | Climate tunnel vision | Energy | Short-term |
| 15 | Climate adaptation | Energy | Long-term |
| 16 | Electrification | Energy | Long-term |
| 17 | Delayed transition | Energy | Medium-term |
| 18 | Corporate trading partners | Governance | Medium-term |
| 19 | Inertia | Energy | Long-term |
| 20 | Energy company default | Governance | Short-term |
| 21 | Energy affordability (retail) | Social | Short-term |
| 22 | Enegry affordability (corporate) | Social | Short-term |
6.1 Long approval processes
| NO. | RISK NAME | CATEGORY | RISK OCCURENCE | IMPACT ON SOS | LIKELIHOOD |
| 1 | Long approval processes | Governance | Long-term | ") | |
| ● = High | ○ = Low |
Risk to security of supply
Extensive and long approval processes account for a significant part of the approximately 10-year lead times for infrastructure and energy generation projects (the Baltic Pipe was commissioned six years after the feasibility study). In particular for land-based generation and infrastructure, the challenge in obtaining approval for a project remains an issue. While there is a reason for the long approval processes, e.g., the need for public involvement and environmental impact assessments, in practice the long approval processes can hinder society’s ability to build out renewable energy generation capacity together with the required electric grid infrastructure. This in turn limits society’s opportunities to increase security of supply and energy independence in the long run.
Likelihood
The likelihood of continued long approval processes is significant, primarily due to requirements for environmental impact assessments and public involvement in the process despite public debate and awareness around the topic. For example, the selected EU countries have four times more wind capacity awaiting permits than under construction (with significant planned capacity, for which a permitting process has not yet started). This is shown in
Potential impact on the value chain
Long approval processes can inhibit society’s ability to build enough renewable generation and electric grid infrastructure to transmit energy from the generation site to load centres to enable consumers to use the energy where needed. Considering the significant requirements for electrification associated with the green energy transition and the desire for energy independence, continued long approval processes could compromise the ability of the Nordic societies to meet these challenges.
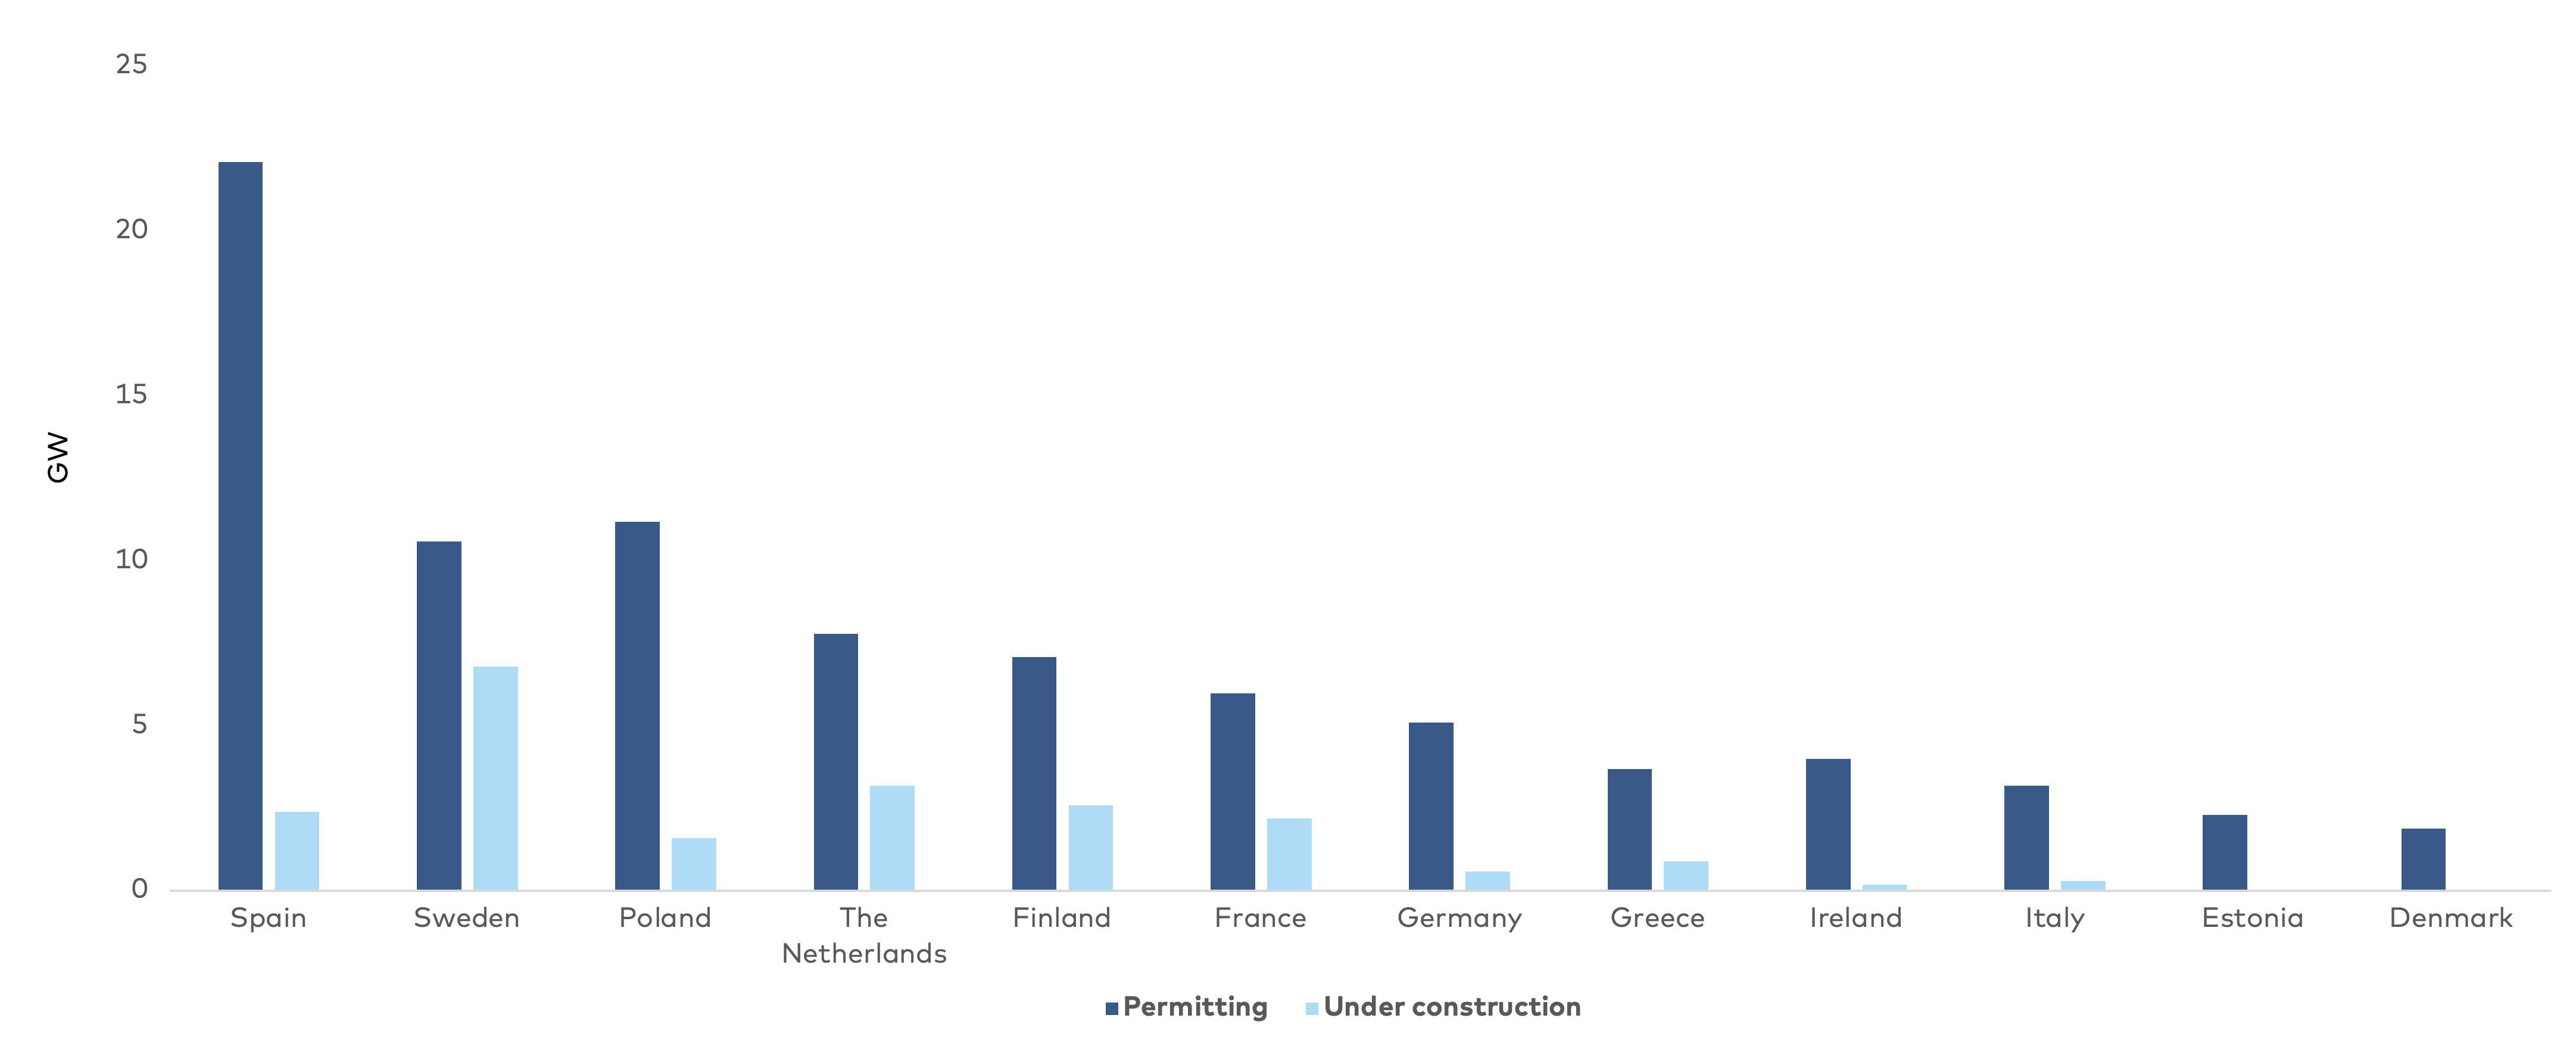
| IMPCAT ON AFFORDABILITY | EVALUATION | ||||
| Long permitting processes reduce the effectiveness of price signals in energy markets, resulting in both unnecessarily high prices for consumers and inefficient market functions. Consequently, consumers pay a price premium due to bottlenecks in the transmission system. Electric grid infrastructure cannot be built quickly enough to respond to the expected increase in demand and construction of renewable energy. High bottleneck revenues (price differences between zones) in the wholesale market signal the need for additional transmission capacity. However, while approval processes drag on, the price mechanism does not deliver the desired effect. Consumers are exposed to high electricity prices as a result of long approval processes. Eventually, the build-out of renewable energy either must slow down, or production is curtailed as sufficient electric grid infrastructure is not available. Long approval processes affect electricity prices, consumers and security of supply, and slow down the green energy transition. |  | ||||
| IMPACT ON SUSTAINABILITY | EVALUATION | ||||
| Long approval processes challenge the pace of the green energy transition due to the lack of renewable generation and electric grid infrastructure. Fossil-based generation is then required to supply demand and balance the electricity system. |  | ||||
| ● = Low | ●● = Medium | ●●● = High | |||
6.2 Modest public infrastructure acceptance
| NO. | RISK NAME | CATEGORY | RISK OCCURENCE | IMPACT ON SOS | LIKELIHOOD |
| 2 | Modest public infrastructure acceptance | Engergy | Short-term | | |
| ● = High | ○ = Low |
Risk to security of supply
Public opposition to the construction of new energy infrastructure is not a new phenomenon – wind turbines, nuclear power plants, transmission lines, CO2 storage, etc have all met with public opposition in the past. Resistance to energy infrastructure in citizens' backyards is very high – and arguably often with good reason. A desire to prioritise biodiversity over new renewable generation and electric infrastructure is also an emerging topic. Opposition from the public and NGOs has provided to be a significant challenge that could lead to delayed or cancelled projects.
Likelihood
The Nordic countries have historically focused on developing effective and sustainable sources of energy, an approach that is also broadly supported by the general public. However, when it comes to implementing new wind farms and electric transmission projects, public opposition can either delay or prevent the project from being executed. A report from the Nordic Council of Ministers concludes that a lack of public acceptance could slow down or even block the expansion of renewable energy and energy infrastructure.
Potential impact on the value chain
The risk may impact the whole energy value chain depending on the strength of public opposition to the installation of the infrastructure. Moreover, the problem is likely to get worse over time as renewable energy generation and additional electric grid infrastructure become more visible in the landscape. Renewable energy sources require more land per energy produced than traditional types of energy production.
| IMPCAT ON AFFORDABILITY | EVALUATION | ||||
| If energy projects are either delayed or blocked completely, this will affect the prices of energy since it will not be possible to meet demand. Given the expected electrification of society, public opposition could significantly impact security of supply. | | ||||
| IMPACT ON SUSTAINABILITY | EVALUATION | ||||
| If sustainable energy projects are either delayed or blocked completely, this will affect sustainable energy production and the green energy transition. | | ||||
| ● = Low | ●● = Medium | ●●● = High | |||
6.3 Inadequate electricity market design
| NO. | RISK NAME | CATEGORY | RISK OCCURENCE | IMPACT ON SOS | LIKELIHOOD |
| 3 | Inadequate electricity market design | Governance | Short-term | | |
| ● = High | ○ = Low |
Risk to security of supply
Failures in electricity markets are particularly important because electricity is perceived as a public good. In addition, environmental costs of production are high, information is imperfect due to the high complexity of the electricity system and economics of scale put up a barrier for new market entrants. Trading electricity on a market platform in the same way as any other commodity rather than as a public good diminishes security of supply.
Leaving market players to develop future energy technologies within uncertain political framework conditions has a cost for society. Market players want lower risks and certainty when it comes to visions for society. Uncertainty relating to subsidies, preferred infrastructure and public funding increase the market risk and shorten the long-term planning perspective. A framework where externality costs are known, and development plans and assumptions are discussed as part of a long-term planning process is required to keep costs down and reach society’s goals of decarbonisation. Information on the long-term electricity system and market development are necessary. Short-sightedness in electricity system planning and decision-making processes comes at a high cost for consumers and security of supply.
Likelihood
The Nordic countries' electricity market has generally functioned well, facilitating substantial price increases in 2022. However, the market structure will require a radical overhaul to accommodate the new renewable energy future and to balance the dimensions of the Energy Trilemma. An inadequate focus on balancing power and capacity requirements in energy-only markets impacts security of supply. Continuing with the current market structure poses a risk of not only energy shortages but also an inability to integrate renewable energy.
Potential impact on the value chain
Market players experience risks, which in turn causes uncertainty in the market. Uncertain politically determined framework conditions affect the operation of the market. Reduced controllable electric capacity in the market can cause load-shedding and increased prices for consumers. The existing market regulation must be developed to accommodate a renewable energy system where other commodities and services are relevant.
| IMPCAT ON AFFORDABILITY | EVALUATION | ||||
| As seen during the electricity crisis, prices could continue at very high-levels, impacting affordability for consumers, and resulting in continuing volatility in price-setting. In the worst-case scenario people will not be able to pay their bills. Societal costs are expected. | | ||||
| IMPACT ON SUSTAINABILITY | EVALUATION | ||||
| If the market structure is not aligned with the needs of a renewable energy system, we could find ourselves in a situation where we cannot utilise the renewable energy produced, reducing the intended sustainability of renewable energy projects. | | ||||
| ● = Low | ●● = Medium | ●●● = High | |||
6.4 High mineral and energy supply dependencies
| NO. | RISK NAME | CATEGORY | RISK OCCURENCE | IMPACT ON SOS | LIKELIHOOD |
| 4 | High mineral and fossil energy supply dependencies | Governance | Medium-term | | |
| ● = High | ○ = Low |
Risk to security of supply
The Nordic countries depend on a small number of countries for the extraction and processing of metals and minerals required to build renewable energy generation. Production of many green energy transition minerals is more geographically concentrated than for oil and natural gas (Figure 55). With respect to processing, many important metals are processed in China, potentially making supplies vulnerable to shocks, e.g. trade restrictions, COVID lockdowns or other factors.
When it comes to the sourcing of fossil fuel products, there is not such a substantial dependency on imports to the Nordic region. This is mainly due to the production of hydrocarbons in Norway. The other Nordic countries, except to some degree Denmark, need to import fossil-fuels from other countries.
Likelihood
Given the current reliance on the import of the metals and minerals required for the green energy transition, the likelihood of mineral dependencies is classified as high. Due to the ongoing focus on accelerating the green energy transition, the lack of minerals could be a problem in the medium-term due to the fact that supply chains are not sufficiently mature for an accelerated green energy transition. Import dependencies for energy are also a cause for concern. The reduction in Russian energy exports to Europe highlight the vulnerability of overreliance on one country for energy supplies. Similar situations could be envisaged in the future and have occurred in the past.
Potential consequences for the value chain
Mineral and energy supply dependencies could compromise society’s ability to deliver the green energy transition at a sufficient pace, while creating security of supply issues for fossil fuels in the event of supply disruptions. This would mainly impact the consumer through high prices, as generation capacities will naturally decrease.

| IMPCAT ON AFFORDABILITY | EVALUATION | ||||
| Dependence on a limited number of countries for supplies of fossil fuels and clean energy metals and minerals could, in the event of supply disruptions, significantly increase the cost of energy as well as the cost of the green energy transition. The materials required to build the necessary renewable energy generation capacity could also increase the cost of the green energy transition. Reliance on a few countries could cause a market situation where certain product prices are manipulatively high. |  | ||||
| IMPACT ON SUSTAINABILITY | EVALUATION | ||||
| Potential supply disruption of the metals and minerals needed to build renewable energy generation could delay the green energy transition by extending the lifetime of existing fossil-based capacity. | | ||||
| ● = Low | ●● = Medium | ●●● = High | |||
6.5 Lack of electric grid infrastructure
| NO. | RISK NAME | CATEGORY | RISK OCCURENCE | IMPACT ON SOS | LIKELIHOOD |
| 5 | Lack of electric grid infrastructure | Energy | Short-term | | |
| ● = High | ● = Low |
Risk to security of supply
Underinvestment in the electric grid infrastructure – both at transmission and distribution level – required for the green energy transition and electrification of society could reduce developers’ willingness to invest in new renewable energy generation, for example, due to issues with grid connectivity, congestion or higher tariff levels on the producer side.
Development of the electric transmission infrastructure in the Nordic countries is needed to be able to respond to changed power flows due to different types of supply and demand patterns. New interconnectors to Europe also have an impact. The ability to balance uneven supply and demand patterns remains important tin order to ensure system stability and security of supply.
Likelihood
The likelihood of underinvestment in electric transmission infrastructure is assessed as high, given the requirements for the build-out of the infrastructure for the electrification and the green energy transition. In addition, future power flows are likely to be different. This will necessitate reorganisation of the transmission infrastructure, something that up to now has not proved successful. Nonetheless, TSOs are continuously highlighting the need for additional infrastructure and the measures that are being taken to endeavour to mitigate this risk. Distribution systems also need to be developed, because renewables have traditionally been connected at low-voltage levels. Bottlenecks in local electric distribution systems are also to be expected.
Potential impact on the value chain
Appropriate electric grid infrastructure is the cornerstone of a well-functioning system and electricity market. Because of this, transmission problems caused by a lack of electric infrastructure impact the full value chain.
| IMPCAT ON AFFORDABILITY | EVALUATION | ||||
| The electric grid infrastructure’s inability to respond to congestion and integrate a large share of renewables could create price differentials between bidding zones and potentially lead to significant price variances between electricity market zones. | | ||||
| IMPACT ON SUSTAINABILITY | EVALUATION | ||||
| Electric grid infrastructure is essential for ensuring a green energy supply. The negative impact of any inability to integrate renewable energy due to the failure to develop existing infrastructure and invest in new infrastructure is substantial. | | ||||
| ● = Low | ●● = Medium | ●●● = High | |||
6.6 Absence of sustainable long-term energy storage
| NO. | RISK NAME | CATEGORY | RISK OCCURENCE | IMPACT ON SOS | LIKELIHOOD |
| 6 | Absence of sustainable long-term energy storage | Energy | Long-term | ") | |
| ● = High | ○ = Low |
Risk to security of supply
Maintaining sufficient capacity in large gas caverns and fuel stockpiles at power plant sites has traditionally played a key role in ensuring security of supply during the winter season. In this connection, the EU requirement for countries to ensure that gas cavern storage facilities are 80% full before winter 2022/2023 has played an important role in maintaining security of supply. Using coal and oil-based power plants could be one way of maintaining security of supply during coming winters. Nonetheless, it remains important to further develop existing strategic reserves within other primary energy sources, e.g., hydro or biomass, to guarantee security of supply. Long-term storage of methanol, ethanol or ammonia could also contribute in this context.
Likelihood
The likelihood of insufficient long-term energy storage is high, given the reliance on a scarce global market for LNG and the inability to source natural gas from Russia. Moreover, it is not expected to be possible to rely on PtX for long-term storage of energy in the short and medium term, impacting the likelihood of sustainable energy storage in the future. Sector coupling and use of district heating networks could be an option for energy storage in the medium to long term.
Potential impact on the value chain
The potential absence of sustainable long-term energy storage as a means of supplying electricity during the winter, when renewable generation is less effective, impacts overall security of supply and the associated prices consumers pay.
| IMPCAT ON AFFORDABILITY | EVALUATION | ||||
| Maintaining appropriate capacity in strategic reserves across feedstocks is an important means of maintaining stable energy prices during the winter season. In periods of high import prices for LNG, it could be worth exploring oil- or coal-based storage from an affordability perspective. Moreover, due to the expected significant cost of utilising PtX solutions for long-term energy storage, continued use of fossil-based primary energy could also be beneficial from a cost perspective. | | ||||
| IMPACT ON SUSTAINABILITY | EVALUATION | ||||
| There is currently a significant technological gap in terms of storing large volumes of renewable energy for longer periods, e.g., through PtX (sector coupling could be one alternative). This in turn could slow the pace of the green energy transition due to the fact that fossil-based primary energy is needed to ensure security of supply. Extending the lifetimes of fossil-fuel plants is a likely outcome here. | | ||||
| ● = Low | ●● = Medium | ●●● = High | |||
6.7 Unchanged consumer behaviour
| NO. | RISK NAME | CATEGORY | RISK OCCURENCE | IMPACT ON SOS | LIKELIHOOD |
| 7 | Unchanged consumer behaviour | Social | Short-term | | |
| ● = High | ○ = Low |
Risk to security of supply
General high demand for energy and periods of peak demand during the day (e.g., in the morning and early evening) constitute a high risk for the security of the energy supply. This risk may lead to planned load-shedding. Consumers in the Nordic countries are generally accustomed to high energy consumption due to generally low energy prices, as access to affordable energy is considered a public good (access to essential services is ensured by universal social welfare services).
Likelihood
Energy demand is generally inelastic, making the likelihood of unchanged consumer behaviour high. In particular among retail consumers in the Nordics, electricity is perceived as a public good, decreasing the desire for change, in this case reducing energy consumption. While there have been significant demand reductions for natural gas (Table 9), 90% of consumers are still willing to pay the maximum price for electricity in the wholesale market (
Potential impact on the value chain
Consumer behaviour and the propensity to exercise demand response mainly impact other consumers’ ability to source energy when required.
| DENMARK | FINLAND | SWEDEN | |
| Decrease | 18% | 51% | 17% |
| IMPCAT ON AFFORDABILITY | EVALUATION | ||||
| Continued inelastic consumer behaviour across society drives up prices significantly, potentially leading to energy poverty among some income groups. At the same time, higher general energy and peak demand prices impact the competitiveness of businesses. Furthermore, when considering the distributional effects of rising electricity prices, where cost-of-living increases have a greater impact on lower income households, this could have implications for the just transition. In Denmark and Sweden the increase in the cost of living has had a greater impact on lower-income than high-income households, while both groups have been more or less equally affected in Finland. | | ||||
| IMPACT ON SUSTAINABILITY | EVALUATION | ||||
| Inelastic consumer demand, in combination with the increasing electrification of society (heating, transport etc.), requires a significant build-out of renewable energy. | | ||||
| ● = Low | ●● = Medium | ●●● = High | |||
6.8 Increased weather dependence
| NO. | RISK NAME | CATEGORY | RISK OCCURENCE | IMPACT ON SOS | LIKELIHOOD |
| 8 | Unchanged consumer behaviour | Social | Short-term | | |
| ● = High | ○ = Low |
Risk to security of supply
The energy system is reliant on multiple weather-dependent energy sources for generation. Therefore, when changing weather conditions result in limited availability of multiple energy sources simultaneously, as discussed above and as seen in 2022, the system will have scarce resources to generate the energy required to supply demand. Especially when there is a scarce supply of dispatchable energy resources (fossil-based resources, nuclear and hydro), supplying peak demand remains a significant issue. In the event of insufficient precipitation in the Baltic Sea region, adequacy risks emerge in southern Sweden, southern Norway and east Denmark. In a low nuclear scenario, adequacy risks substantially increase in southern Sweden and in Finland, which will be reliant on electricity imports.
Likelihood
The likelihood of limited availability of multiple energy sources simultaneously is assessed to be high. This is mainly due to the recently experienced situation when limited Nordic hydro resources production, low levels of natural gas and LNG supplies and low levels of production from nuclear power plants in central Europe due to high temperatures all occurred at the same time. A focus on increasing energy independence through the build-out of renewables could perhaps reduce the likelihood in the long term. On the other hand, the increasingly volatile weather conditions expected in future as a result of climate change will impact weather-dependent generation.
Potential impact on the value chain
The consequence of limited availability of multiple energy portfolios is a significant scarcity of generation capacity, potentially impacting the ability of society to meet electricity demand.
| IMPCAT ON AFFORDABILITY | EVALUATION | ||||
| Scarcity of energy resources will significantly increase energy prices for consumers – in practice, raising concerns about energy poverty and job creation across society. | | ||||
| IMPACT ON SUSTAINABILITY | EVALUATION | ||||
| Potential limited availability of renewable energy generation could increase public acceptance of the use of fossil-based primary energy resources, delaying the green energy transition. | | ||||
| ● = Low | ●● = Medium | ●●● = High | |||
6.9 Inadequate energy crisis management
| NO. | RISK NAME | CATEGORY | RISK OCCURENCE | IMPACT ON SOS | LIKELIHOOD |
| 9 | Inadequate energy crisis management | Governance | Short-term | | |
| ● = High | ○ = Low |
Risk to security of supply
In an increasingly interconnected and interdependent energy system where generation is contingent on weather conditions, coordinated and well-managed energy planning plays a pivotal role in maintaining security of supply. This makes it vital not to make hasty decisions in a crisis with potentially far-reaching consequences for the energy market, e.g., relating to market design or an increase in electricity demand (district heating, electrification etc.) before renewable capacity is in place. The interventions currently set in motion have been relatively cautious, as depicted by the ACER methodology in Figure 56.
Given the current high degree of coordination, the likelihood is classified as medium. Energy planning is currently coordinated at Nordic and European level through e.g., the Nordic Regional Coordination Centre, ENTSO-E, EU institutions, etc. Continuous knowledge-sharing through these organisations enables collaboration across public stakeholders, which materialises in shared development plans and scenarios. The risk of uncoordinated planning and decision-making in a crisis makes this risk particularly relevant. WindEurope reports that inflationary cost pressures, slow permitting processes and uncertainty around the EU’s emergency electricity market interventions are stalling orders for new wind turbines (Q3 wind turbines orders fell by 36% in 2022 compared to 2021). These risks must be addressed.
Potential impact on the value chain
The consequence of inadequate energy crisis management that fails to consider the system-wide effects of initiatives at Nordic and EU level could impact the entire electricity value chain, e.g. if impacts of a redesign of the market structure are not carefully analysed.
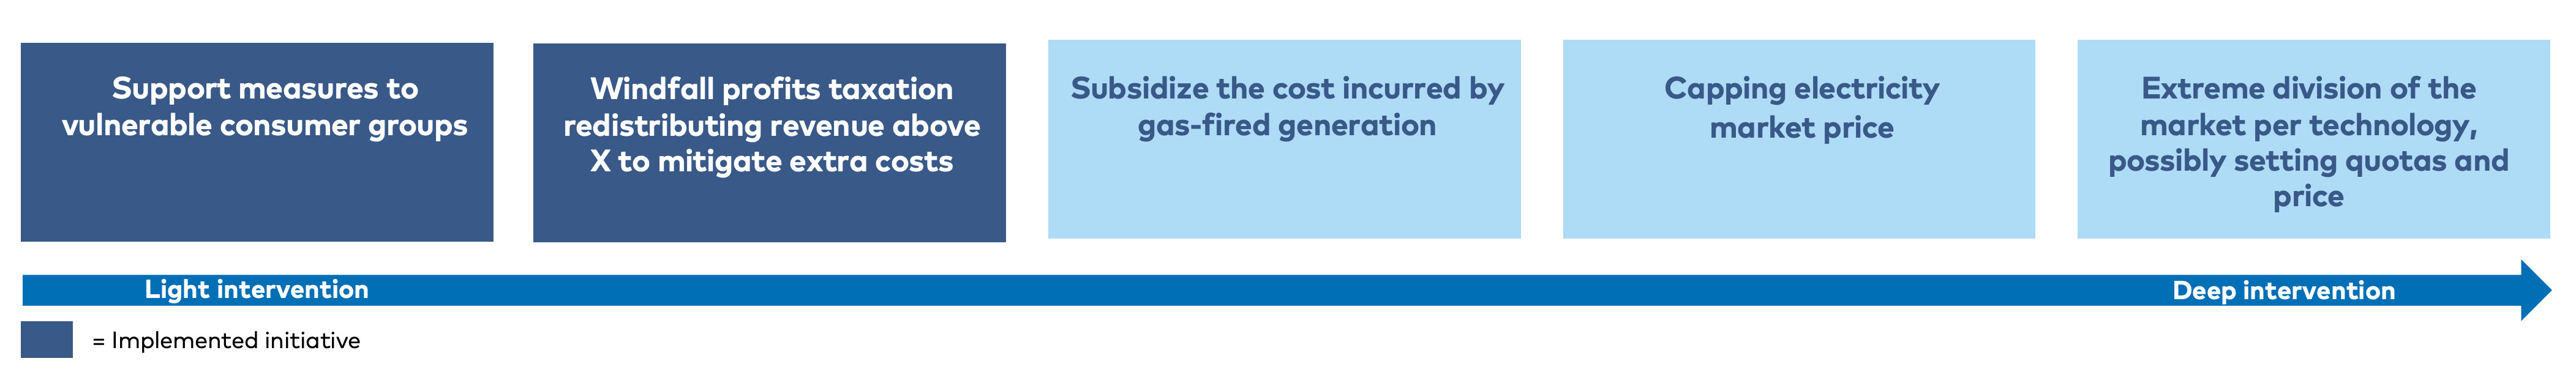
| IMPCAT ON AFFORDABILITY | EVALUATION | ||||
| Crisis management and the risk of hasty decision-making directly impact price setting, job creation/jobs required for the green energy transition and public acceptance of infrastructure. This could potentially lead to a more acute crisis going forward with negative implications for all affordability-related issues. | | ||||
| IMPACT ON SUSTAINABILITY | EVALUATION | ||||
| Uncoordinated crisis management measures could potentially delay the green energy transition by decreasing investments in transmission and generation infrastructure, particularly given the expected increased volatility of electricity prices. | | ||||
| ● = Low | ●● = Medium | ●●● = High | |||
6.10 Labour shortages
| NO. | RISK NAME | CATEGORY | RISK OCCURENCE | IMPACT ON SOS | LIKELIHOOD |
| 10 | Labour shortages | Social | Medium-term | ◐ | ● |
| ● = High | ● = Low |
Risk to security of supply
The green energy transition requires an appropriately and sufficiently skilled workforce. Moreover, skilled labour is also needed to optimise and strengthen the infrastructure required to develop a renewable energy system. Skilled workers play a key role in ensuring security of supply, and appropriate human resources will be required to boost energy independence.
Likelihood
A lack of skilled labour has already contributed to supply chain disruptions and project delays in the energy sector, making it highly likely that this risk will materialise in future. The IEA estimates that the energy sector requires more higher-skilled workers than other industries due to the extensive degree of research and innovation in the sector. The number of new positions in energy is expected to more than compensate for the loss of fossil fuel jobs. It is estimated that 14 million new clean energy jobs will be created worldwide by 2030 and that 16 million workers will shift to new roles relating to the green energy transition. Some 60% of these new jobs will require some degree of post-secondary training. Finally, experts report that there is already a shortage of skilled workers, and that this, in combination with general pressure on employment markets, will present further challenges for investments in renewables.
Potential impact on the value chain
Labour shortages in the energy sector have consequences throughout the value chain as they prevent assets from being developed and maintained. In practice, this makes labour shortages a system risk.
| IMPCAT ON AFFORDABILITY | EVALUATION | ||||
| Inadequately skilled workers in the energy sector will impact opportunities to build affordable energy projects. In the long run, this will affect consumers’ access to affordable energy due to the fact that the supply of energy will not increase. | | ||||
| IMPACT ON SUSTAINABILITY | EVALUATION | ||||
| A lack of skilled workers in the energy sector will impact opportunities to execute the investments required to accelerate the green energy transition. This encompasses research in renewable energy and innovation, as well as the installation of wind turbines, solar panels and PtX technologies. | | ||||
| ● = Low | ●● = Medium | ●●● = High | |||

7. MITIGATION MEASURES AND GAP ANALYSES
In this section, mitigation measures are mapped against the high-risk factors identified and described in the previous section in order to evaluate whether existing mitigation measures addressing the identified high-risk factors can be applied to increase security of supply. To this end, a gap-fit assessment was also performed to determine whether the mitigation measures were an effective response to the current energy crisis. The focus was thus to identify mitigation measures at respectively national, Nordic and EU level that have been applied during the current energy crisis.
The presented mitigation measures and associated case examples may not be the optimal options to implement in all the Nordic countries, but are rather intended to provide examples of mitigation measures and cases that have been discussed and applied by policymakers. The examples were specifically chosen to assess how well the Nordic energy market is equipped to ensure supply security going forward. Mitigation measures were categorised to evaluate their assumed effect in the time horizon as well as whether the initiatives have had a tangible and documented impact.
The process of identifying mitigation measures to respond to high-risk factors is shown in

The review of the mitigation measures and gap analyses reveals that there are significant gaps associated with one risk (“gap exists”), that gaps are partially addressed (“gap remains”) for eight risks and that gaps are fully addressed for one risk (“no gap”). A summary of the gap analysis is presented below in
Based on the mitigation measures and gap analyses, this report provides policy recommendations that can inform decision-making to ensure security of supply while taking account of affordability and sustainability considerations in energy systems. Recommendations, which are made at national, Nordic and international (EU) level, can be found in
| RISK | MEASURE | DOCU-MENTED IMPACT | DO THE MEASURES ADEQUATELY AND EFFICIENTLY MITIGATE IDENTIFIED RISK? | GAP ANALYSIS |
| ↑ = Positive | ↓ = Negative | → = Mixed | ? = No documentation | |
| Long approval processes | Accelerated permitting for electricity generation and grid infrastructure | ? | Measures designed to facilitate faster permitting are in the regulatory pipeline; however, given the implementation timeline for PCI projects and experiences from Denmark regarding a one-stop-shop, it is questionable whether initiatives will have the desired effect. Moreover, there is a need for structural measures to address permitting procedures for electric grid infrastructure in general, and not just by providing access to PCI and additional financing. There is still a gap with regard to addressing the risk of slow approval processes. | GAP REMAINS |
| Modest public infrastructure acceptance | Public inclusion in energy infrastructure | ↑ | Various measures exist and are, to some extent, being applied to help mitigate risks associated with infrastructure acceptance. Nonetheless, these risks do not currently appear to be being managed systematically and adequately, as public opposition to grid infrastructure and electricity generation assets is still being encountered. The identified measures are not certain to mitigate the identified risks. | GAP REMAINS |
| Inadequate electricity market design | Analyse adaptation measures for design of the electricity market | ? | It is not proposed that the listed measures be implemented without a thorough examination of the required changes to the Nordic electricity market structure. A discussion and examination of the societal value and price for security of supply must be initiated. A gap remains when it comes to measures to design a electricity market that is fit to meet societal needs in terms of price stability, security of supply and sustainability. | GAP REMAINS |
| High mineral and fossil energy supply dependencies | Strategic sourcing of metals | ? | Identified mitigation measures relating to metal supply dependencies do not mitigate identified risks. In the short term, there is a need to develop a long-term strategy at Nordic and EU level for sourcing the metals and minerals required for the green energy transition. With the Critical Raw Materials Act, such a process has been started. In the long term, the option to grow national mining industries in Sweden, Norway and Finland should be further explored. | GAP EXISTS |
| High mineral and fossil energy supply dependencies* | Strategic sourcing of fuels | ? | Measures have been efficiently implemented but are not adequate to address the potential gap in the short term. Further long-term diversification is likely necessary. In the short term, the EU has applied various measures to safeguard natural gas supplies through increased sourcing of LNG to replace pipeline gas from Russia and to top up strategic reserves. Even so, there is a residual risk of a 30 bcm shortfall of natural gas next winter at EU level. In the medium term, the energy partnership between the EU and Norway would appear to have been strengthened, but there is a general need to diversify supply partners to reduce vulnerabilities to supply disruptions. | GAP REMAINS |
| Lack of electric grid infrastructure | Electric grid infrastructure | ↑ | Measures to mitigate the risk of underinvestment in electric grid infrastructure are required. The level of integrated grid planning at regional and international level must be increased. Access to public planning assumptions may be an option. Such a development is contingent on accelerating permitting processes, public inclusion in infrastructure projects, etc., as discussed. In essence, a gap remains that needs to be addressed despite a number of initiatives already being in place. | GAP REMAINS |
| Absence of sustainable long-term energy storage | Energy infrastructure integration | ↑ | Measures to develop the required energy infrastructure are important. The varying nature of the Nordic countries means that there is no one-size-fits-all solution. However, general requirements for energy storage levels could be a relevant measure. Developing energy infrastructure for energy vectors other than electricity (molecule network and storage) will also be necessary to ensure renewable energy integration and security of supply. In essence, a gap remains. | GAP REMAINS |
| Unchanged consumer behaviour | Information campaigns and digital applications | → | Since it is difficult to radically change the general public’s energy consumption, and given that energy-saving campaigns, digital applications and addressing consumption in public buildings are generally being considered in all the Nordic countries, this risk is assessed to be adequately addressed. Further evaluation of the impact of initiatives is required. | NO GAP |
| Increased weather dependence | Energy generation diversification | ↑ | The Nordic countries have addressed the need to diversify generation capacity in the short term (extending fossil-based generation). In the medium term, strategies have been applied and considered to include additional feedstocks for electricity generation, e.g., biogas and adding additional nuclear capacity to the grid. In the long term, coupling through other energy vectors could be an option. Long-term storage of energy, nonetheless, remains an issue. In essence, while measures exist to address the weather-dependency of renewable energy generation capacity, the identified measures do not adequately and efficiently address the needs for diversification of capacity and the steps society needs to take to engage in long-term storage of energy. A gap remains. | GAP REMAINS |
| Insufficient energy crisis management | Energy crisis management | → | While appropriate stakeholders will be consulted, there is always a risk associated with making large-scale changes to an existing system. Due to the market response to uncertainties around appropriate and effective crisis management, it is concluded that the existing measures only partially address identified risks. | GAP REMAINS |
| Labour shortage | Tripartite negotiations | → | Given the substantial need for labour to support the green energy transition, this risk is not appropriately addressed. The need for labour support requires a broader strategic plan addressing how to tackle the lack of skilled workers. Solutions include increasing energy-related education and more national planning on needed availability (skills and volume). However, tools (e.g., tripartite negotiations) are available to expand the labour supply and should be applied, supplemented by additional measures. Personnel from other sectors or countries may be engaged. | GAP EXISTS |
| *Separate mitigation measures are applied for the “high mineral and fossil energy supply dependencies”. The risk is addressed collectively as it relates to both dependencies. | ||||
7.1 Accelerated permitting for electricity generation and grid infrastructure
| RISK: LONG APPROVAL PROCESSES | GAP REMAINS | ||
| MEASURE | IMPLEMENTENTATION STAGE | EFFECT TIME HORIZON | DOCUMENTED IMPACT |
| Accelerated permitting for electricity generation and grid infrastructure | Proposed | Medium-term | → |
| ↑ = Positive | ↓ = Negative | → = Mixed | ? = No documentation |
Description of measure
The following is a structural measure proposing a more effective approval process to accelerate the green energy transition – relating to new electricity generation and grid infrastructure.
The EU Commission has commissioned a study on how to tackle slow and complex permitting processes for renewable energy projects (the final recommendations are expected in April 2023), and introduced an amendment to the Renewable Energy Directive, which proposes shortening the maximum permitting time to two years from when the first permit application is submitted. In addition, dedicated ‘go-to' areas for renewables are proposed to provide a shortened and simplified permitting process in areas with lower environmental risks. In these areas, projects will need to be permitted within one year. If implemented, this would involve significant changes to the existing approval processes. An important measure is nonetheless to ensure that measures relating to approval processes are technology-neutral with regard to renewable energy. Given local conditions, appropriate national flexibility also needs to be included in the legislation. To ensure that the legislation is changed appropriately, regulatory changes must be properly considered and cannot be implemented overnight.
As discussed throughout the report, there is a need to develop the electric grid infrastructure to accommodate a future with more renewable energy production. A structural measure to address permitting for electricity grid projects is required. The updated version of the Trans-European Networks for Energy (TEN-E) regulation adopted in June 2022, is the EU Commissions' response to this challenge. The TEN-E regulation establishes 11 priority corridors for transmission infrastructure relating to electricity, offshore grids, and hydrogen infrastructure, addressing the need for transmission of electricity onshore and offshore. Infrastructure projects can be accepted under the Projects of Common Interest (PCI) framework, enabling projects to receive permitting faster and obtain financial assistance from the EU. Designation as a PCI ensures that projects are treated in the fastest way possible, limiting the permitting procedure to 3.5 years.
Case examples
The EU’s interim report on tackling slow and complex permitting relating to electricity generation assets concludes that administration could be streamlined through digitisation measures that establish clear roles and responsibilities, supported by a one-stop-shop that manages the approval process across agencies. A similar arrangement can be envisaged for grid infrastructure projects. The Danish Energy Agency facilitates such a one-stop-shop and acts as a point of contact for seven other authorities. Nonetheless, the approval process remains significant, resulting in 9–11-year project development timelines for offshore wind. With such a constraint on project development time, planned renewable energy projects will not be finalised before the next decade, despite a one-stop-shop being in place to facilitate a smooth process.
While the TEN-E regulation could accelerate permitting for selected transmission cables, opening a few trans-European energy corridors does not solve the overarching problem in the Nordic or European countries. The measure could induce more political risk and incentives to wait for EU-funding and lower costs of financing, resulting in a less equal playing field and influencing the energy markets. If the required electric grid infrastructure projects are to be built in time, the permitting procedures do not only need to be fast-tracked for some trans-European projects –. measures targeting permitting processes for domestic grid projects will also be required.
Target group and impact on the value chain
The target group is renewable energy project developers, TSOs and DSOs. The purpose of faster approval processes is to enable a build-out of renewables and establish the necessary electric grid infrastructure in Europe and the Nordics. Ultimately, this will reduce energy import dependency and maintain more stable electricity prices for consumers.
Gap analysis: Do the measures adequately and efficiently mitigate the identified risk?
Measures designed to achieve faster permitting are in the regulatory pipeline; however, due to the implementation timeline of PCIs and experiences from Denmark regarding a one-stop-shop, it is questionable whether the initiatives will have the desired effect. Moreover, there is a need for structural measures to address permitting procedures for electric grid infrastructure in general, and not only by providing access to PCI and additional financing. A gap remains when it comes to addressing the risk of slow approval processes.
7.2 Public inclusion in energy infrastructure
| RISK: MODEST PUBLIC INFRASTRUCTURE ACCEPTANCE | GAP REMAINS | ||
| MEASURE | IMPLEMENTENTATION STAGE | EFFECT TIME HORIZON | DOCUMENTED IMPACT |
| Public inclusion in energy infrastructure | Considered | Short-term | → |
| ↑ = Positive | ↓ = Negative | → = Mixed | ? = No documentation |
Description of measure
This is a structural measure designed to increase public acceptance by enabling the local population to benefit financially from local electricity generation projects. A financial benefit can be provided by allowing neighbouring residents and/or municipalities to invest in the energy project, e.g., by receiving a payment per kWh from the producer or paying less tax. When residents and municipalities are able to benefit economically from an energy project, they view the project in a more positive light and are more likely to support it. The greater public acceptance of energy infrastructure projects, the lower the likelihood of project delays or blocking.
Another way to increase acceptance structurally is to engage in stakeholder dialogue with local residents during project origination, ensuring co-ownership. This can be relevant for both electricity generation and grid infrastructure projects. Such measures are designed to involve local residents in a dialogue process as early as possible and before the project begins, allowing the view of local residents to be considered during the project origination, e.g., in spatial planning. Allowing local residents and municipalities to feel that they can influence the development of projects from an early stage rather than just be presented with adopted plans has a positive effect on public infrastructure acceptance.
Case examples
It is vital to provide opportunities for local residents to benefit financially through participation. The framework for achieving such financial benefits remains important and should be adapted to local conditions. In Norway, hydropower permits always have in-bult benefit-sharing and compensation mechanisms. Local communities, therefore, view hydropower as a stable source of income due to annual licensing fees. In addition, hydropower producers are obliged to make reparations to the affected ecosystems and outdoor recreation areas, e.g., through donations. In aggregate, this has a positive impact on local support. Denmark has previously implemented a “buyer’s rights scheme” which offers local residents the opportunity to purchase a 20% stake in electricity generation assets. However, the scheme was abolished in 2020 as it was it was not working as intended, in that the scheme only attracted limited local interest and shares were predominantly purchased by few investors who did not necessarily have local affiliations. Other measures are now being applied to increase benefit-sharing and a renewable energy bonus.
Regarding public engagement during project origination, stakeholder dialogue has been an important asset in achieving local acceptance of projects in Ireland. The wind energy association recommends that project developers engage in stakeholder dialogue at a very early stage of the project development. In this way, issues can be resolved early, and the possibility of an appeal later in the planning process can be avoided, as the public and local population accept the presence of the assets. The OECD Due Diligence Guidance for Meaningful Stakeholder Engagement can be applied in a best-case scenario. Another measure to inform the public and achieve acceptance could be to designate large areas for energy production in the long term, hence enabling stakeholders to plan accordingly. This also gives the general public and local population greater opportunities to accept the physical presence of infrastructure. Sweden has designated the area around the Barsebäck nuclear power plant as one such area.
Target group and impact on the value chain
The target groups are the energy companies, TSOs, DSOs and residents living next to the energy infrastructure. Ultimately, the measures are intended to help corporate stakeholders, and the local population accelerate the green energy transition in a way that satisfies all parties.
Gap analysis: Do the measures adequately and efficiently mitigate the identified risks?
Various measures exist and are, to some extent, already being applied to mitigate risks associated with infrastructure acceptance. Nonetheless, these risks do not appear to be dealt with systematically and adequately as public opposition to grid infrastructure and electricity generation assets is still being encountered. Hence the identified measures do not adequately and efficiently mitigate the identified risks.
7.3 Adapt electricity market design
| RISK: INADEQUATE ELECTRICITY MARKET DESIGN | GAP REMAINS | ||
| MEASURE | IMPLEMENTENTATION STAGE | EFFECT TIME HORIZON | DOCUMENTED IMPACT |
| Adapt electricity market design | Considered | Short-term | ? |
| ↑ = Positive | ↓ = Negative | → = Mixed | ? = No documentation |
Description of measure
- Electricity market zones: The Nordic (and European) electricity markets have been developed as zonal markets, in a trade-off that ensures uniform electricity prices across a wide area. One alternative is nodal markets, where the electricity price is set per node. The node can be an electrical substation. In such a market, the electricity price reflects local grid congestion. Theoretically, a nodal market is more efficient than a zonal market but presents an opportunity for market manipulation due to lower market liquidity. ACER is currently proposing a restructuring of the existing bidding zones in Europe. Five countries (Germany, France, Italy, the Netherlands, and Sweden) are being asked to address the need to redefine the existing market zones. We may find that ongoing re-definition of electricity market zones is required depending on differences in the timing of developments in electric grid infrastructure, renewable energy and flexible demand response. It is extremely important to take account of spatial and temporal aspects in demarcating electricity market zones.
- Capacity payments: Before the energy crisis, increasing renewable energy production resulted in lower electricity prices, which in turn led to the decommissioning of power plants. (See discussion in Section 5). Capacity payments are one way of ensuring adequate electric capacity. There are many different ways to provide capacity payments, including through capacity markets, strategic reserves and setting target capacities. The UK operates a capacity market, providing all bidders with the price of the highest bid accepted. In Denmark, a capacity payment was previously paid to small gas engines, which has now been abolished. Strategic reserves have been established in Sweden and Finland, with dedicated power plants entering the market in peak situations. A strategic reserve is currently being discussed for the DK2 market area, where conventional power plant capacity is expected to be insufficient. However, the proposal was rejected by the EU. These recent developments indicate that a discussion of the price for security of supply and evaluation of the best mechanism to ensure adequate capacity are needed.
- Aggregator and flexibility markets: The current electricity market regulation permits participation in plants above a certain size through market-responsible parties. Market platforms are being developed to allow distributed energy resources to participate through aggregators. The involvement of decentralised electricity markets, without a central operator, in the wider electricity market is also being trialled. One challenge present in various electricity markets is that re-dispatch costs in balancing markets have increased substantially due to the influence of renewable energy. It has also been observed that renewable energy is being curtailed as it cannot be utilised due to grid bottlenecks. The aggregator and flexibility market solutions not only have to reduce the cost of system operation but must also allow better integration of renewable energy. We are yet to see commercial market solutions, but many are being developed.
- Framework conditions: Changes in the framework conditions, encompassing flexible distribution and transmission tariffs, and flexible electricity taxes, are vital to ensure better integration of renewable energy. Price signals sent to end-consumers are currently not sensitive to renewable energy production. The changes in framework conditions must ensure that sector coupling is prioritised. With increasing renewable energy production, it is important to ensure that market platforms and framework conditions are designed to secure improved sector coupling.
Case example
Because an increasing volume of energy is traded on the special regulation market, Energinet has initiated work to transfer the handling of surplus power to the intraday market, which will allow participation from power plants outside Denmark, including Norwegian hydropower. Integration of German wind power affects multiple countries and requires measures across the Nordic countries.
Target group and impact on the value chain
The target groups are, in principle, the entire value chain. Consumers, producers, TSOs, and DSOs are all impacted by the electricity market structure.
| 2020 | 2019 | 2018 | 2017 | 2016 | |
| Received from TenneT (Germany) (GWh) | 3,901 | 1,914 | 1,598 | 1,210 | 554 |
| Down-regulation at Danish actors (GWh) | 3,048 | 1,312 | 1,114 | 781 | 337 |
| Stop/reduction of production on central power plants | 35 % | 46 % | 53 % | 64 % | 51 % |
| Start of electric boilers in % | 17 % | 22 % | 21 % | 22 % | 28 % |
| Stop of wind turbines in % | 48 % | 32 % | 26 % | 14 % | 21 % |
| Average price for down-regulation (DKK/MWh) | -172 | -92 | -69 | -69 | -69 |
| Used for up-regulation in balancing market, netting (GWh) | 853 | 602 | 484 | 429 | 217 |
| Netting in % of transferred amount from TenneT | 22 % | 31 % | 30 % | 35 % | 39 % |
| Average price for netting in balancing market (DKK/MWh) | 118 | 284 | 280 | 199 | 142 |
Gap analysis: Do the measures adequately and efficiently mitigate the identified risks?
It is not proposed that the listed measures be implemented without a thorough examination of the required changes to the Nordic electricity market structure. The overall message is that energy, in general, is a public good, and not like most other commodities, must be considered. A discussion and examination of the societal value or price for security of supply must be initiated. In aggregate, a gap remains with regard to facilitating an electricity market that is fit to deliver societal needs in terms of price stability, security of supply and sustainability.
7.4 Strategic sourcing of metals and minerals
| RISK: HIGH MINERAL AND FOSSIL ENERGY SUPPLY DEPENDENCIES | GAP EXISTS | ||
| MEASURE | IMPLEMENTENTATION STAGE | EFFECT TIME HORIZON | DOCUMENTED IMPACT |
| Strategic sourcing of metals and minerals | Considered | Short and long-term | ? |
| ↑ = Positive | ↓ = Negative | → = Mixed | ? = No documentation |
Description of measure
In the short term, this is an emergency measure to diversify the sourcing of metals and minerals needed for the green energy transition. As discussed, the Nordics depend on a small number of countries to extract and process metals and minerals. Within processing, China is the dominant supply country (Figure 55), while the Democratic Republic of Congo supplies nearly 70% of the world market for cobalt and Chile 30% of the copper market (see Figure 58). There are hence significant import needs related to metals and minerals. Strategic sourcing and diversification of the supply chain are a necessity to reduce the risk of supply disruptions.
In the long term, this is a structural measure aimed at ensuring an appropriate and stable supply of the metals and minerals needed for the green energy transition. Metals and mineral supply chains are not geared to an accelerated green transition. To increasingly diversify the supply chain and reduce the risk of supply disruptions, one initiative could be to implement a new set of industrial policies to facilitate extraction of critical raw materials in the Nordic region. The relevant national authorities in the Nordic countries have discovered significant underground resources of critical raw materials that would enable the Nordics to supply almost all critical raw materials defined by the EU, although imports would likely still be required.
The Nordic countries offer an unexploited potential to supply Europe and the Nordics with much-needed metals and minerals.
Case examples
Strategic sourcing and diversification in the short term could be switched to regions where supply chains are shorter and less exposed to external factors such as political risks or pandemics. To respond to this, the EU has announced the development of the Critical Raw Materials Act, intended to secure a more resilient supply chain (i.e. less reliant on a small number of supply routes or countries) in which sustainability is embedded. The Act is subject to public consultation until 25 November 2022, and is expected to be adopted in Q1 2023 and subsequently enacted through the relevant EU institutions. Moreover, considering the abundance of many of the required metals and minerals for renewable energy technologies, sourcing could be changed to Finland, Sweden and Norway.
To support the long-term development of the mining sector, the Finnish government proposed an amendment to the Mining Act on 8 September 2022, which is expected to enter into force on 1 March 2023. The legislation aims to improve opportunities for local influence on mining projects while increasing business prospects and enhancing the environmental impacts of mining projects. Considering the +10-year (the IEA estimates 16 years) development timeline for mining projects, further action is needed if the Nordics are to successfully supply the EU with metals and minerals for the green energy transition.
Target group and impact on the value chain
The target group is the supply chain responsible for mining metals and minerals. The measure is designed to emphasise the need for a stable and secure supply of the metals and minerals needed to accelerate the green energy transition.

Gap analysis: Do the measures adequately and efficiently mitigate the identified risks?
Identified mitigation measures relating to metal and energy supply dependencies do not adequately and efficiently mitigate identified risks. In the short term, there is a need to develop a long-term strategy at Nordic and EU level for sourcing the metals and minerals needed for the green energy transition. With the Critical Raw Materials Act, such a process has been started. To ensure resilience, the sourcing of metals and minerals could be switched to focus on the Nordics, given the abundance of many (but not all) of the needed metals. In the long term, the option to grow national mining industries in Sweden, Norway and Finland could also be explored.
7.5 Strategic sourcing of fuels
| RISK: HIGH MINERAL AND FOSSIL ENERGY SUPPLY DEPENDENCIES | GAP REMAINS | ||
| MEASURE | IMPLEMENTENTATION STAGE | EFFECT TIME HORIZON | DOCUMENTED IMPACT |
| Strategic sourcing of fuels | Adopted | Short and medium-term | ↑ |
| ↑ = Positive | ↓ = Negative | → = Mixed | ? = No documentation |
Description of measure
This is an emergency measure intended to diversify supply routes through strategic sourcing to enable the Nordics and the EU to stockpile reserve primary energy sources for the coming winters. One way to reduce the risk of supply disruptions and maintain supply security is to diversify across supply routes, countries and the fossil fuels required for electricity generation (LNG, oil, coal etc.). This includes the capability to switch fuel for power plants and industrial processes in the event of supply disruptions or high prices for some commodities, as experienced in 2022. Should supply disruptions occur, end-consumers will then be more flexible and less vulnerable. Strategic sourcing of fossil fuels, including diversification, also requires the construction of necessary infrastructure, e.g., LNG terminals, to source fuels on global markets.
Case example
To address sourcing issues in the short term, the EU has proposed a Council Regulation intended to aggregate EU demand for LNG with the aim of negotiating better prices and reducing the risk of member states outbidding each other on the global market. This will also ensure security of supply across the EU.
In the first half of 2022, LNG accounted for 25% of national gas imports, mainly from the US and Qatar, with imports of US LNG doubling between January and October 2022 compared to full-year 2021. Gas exports from Norway are set to rise by 8% in 2022, mainly on the back of an increase in pipeline gas, to a total of 122 billion cubic metres (bcm). Whether these initiatives are sufficient to meet gas demand in 2023–2024 remains to be seen. The IEA concludes that a full shutdown of Russian pipeline gas supplies, combined with a return of Chinese LNG imports to their 2021 levels, would lead to a shortfall of 30 bcm (EU gas consumption in 2021 totalled 412 bcm) in Europe during the summer of 2023, the period when gas storage sites need to be refilled. Figure 59 shows the 30 bcm demand gap.
As a short and medium-term measure, Norway and the EU have agreed to strengthen their close cooperation in the field of energy, with a view to further expanding the scope of their partnership beyond 2030[1]. Although there are increased prospects for Norway to sell natural gas and oil to the EU, there is a general need to reevaluate sourcing strategies for fossil fuels to achieve increased diversification as a means to decrease vulnerability in the event of supply shocks. Diversification of supply within solid fossil fuels should be one focus area, as the supply chain for oil and petroleum-based products is already well diversified. (See
Target group and impact on the value chain
The target group is thermal power plants and end-consumers of fossil fuels for heating. The measures are intended to ensure the resilience of supply chains and reasonable prices, thereby maintaining security of supply for consumers.
Footnotes
- ^ European Commission, Joint EU-Norway statement on strengthening energy cooperation, 2022 Website reference: https://ec.europa.eu/commission/presscorner/detail/en/STATEMENT_22_3975
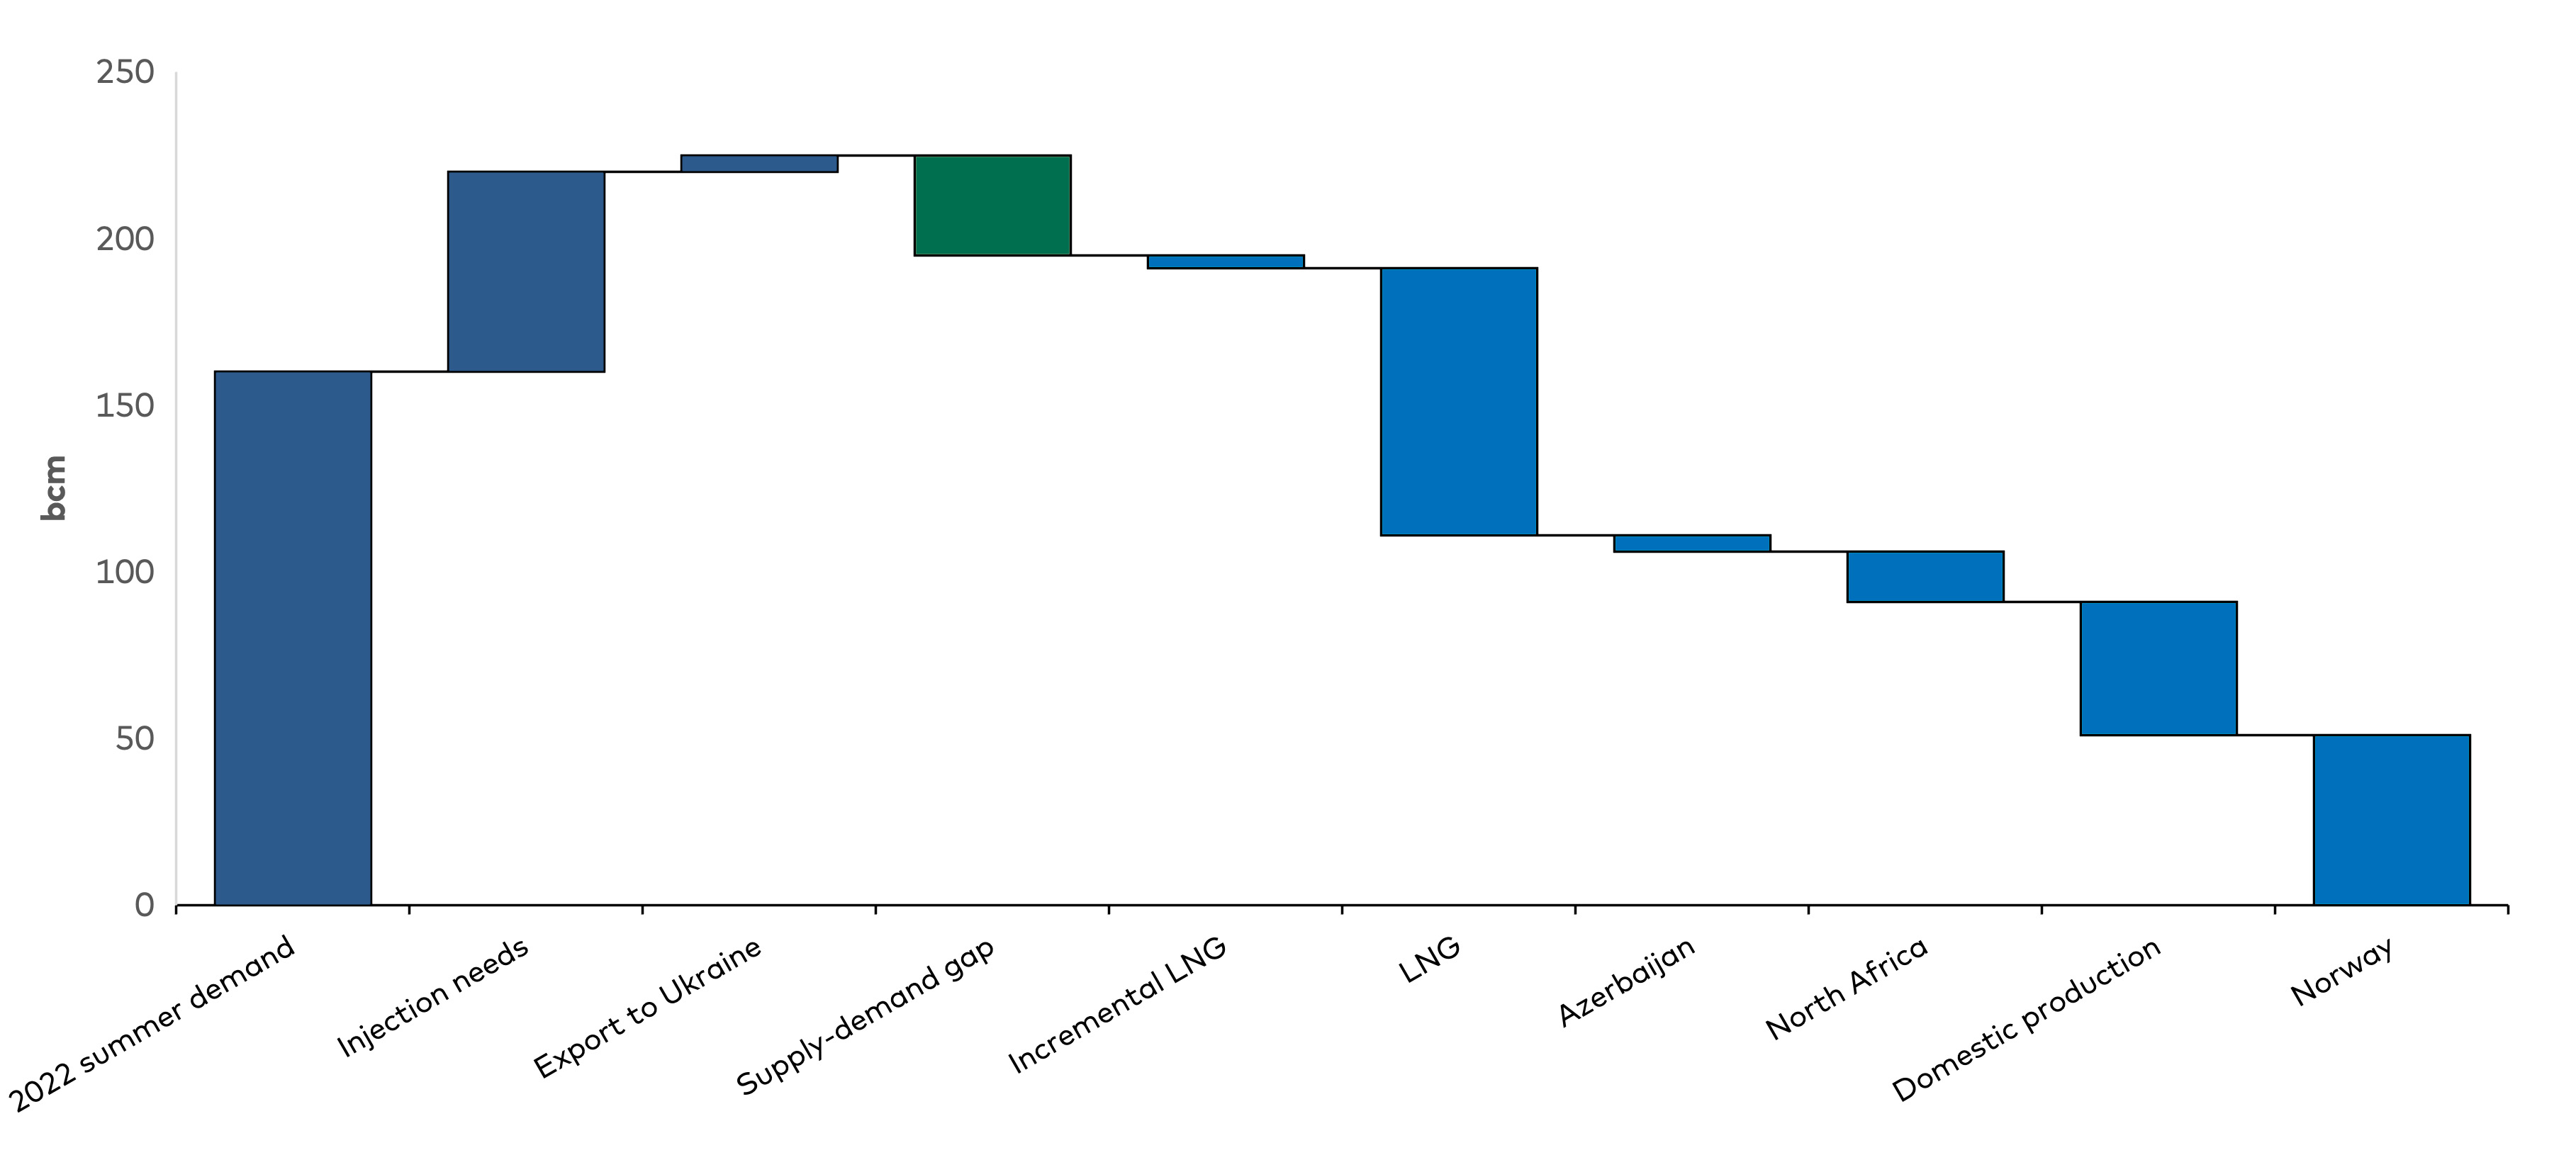
Gap analysis: Do the measures adequately and efficiently mitigate the identified risks?
In the short term, the EU has applied various measures to safeguard natural gas supplies through increased sourcing of LNG to replace pipeline gas from Russia and to top up strategic reserves. Nonetheless, there is residual risk of a 30 bcm shortfall in natural gas next winter (approximately 7% of total demand in 2021). In the medium term, the energy partnership with Norway appears to have been strengthened. However, there is a general need to diversify supply partners within fossil fuels in order to reduce vulnerabilities to supply disruptions. The applied mitigation measures relating to the strategic sourcing of fossil-fuels are assessed to have been implemented efficiently. However, these are likely to address the potential demand gap in the short term. Moreover, further long-term diversification measures will probably be necessary in the medium term.
7.6 Development of electric grid infrastructure
| RISK: LACK OF ELECTRIC GRID INFRASTRUCTURE | GAP REMAINS | ||
| MEASURE | IMPLEMENTENTATION STAGE | EFFECT TIME HORIZON | DOCUMENTED IMPACT |
| Development of electric grid infrastructure | Considered | Medium-term | ↑ |
| ↑ = Positive | ↓ = Negative | → = Mixed | ? = No documentation |
Description of measure
It is vital to ensure appropriate investments in grid infrastructure (transmission and distribution) and associated maintenance in order to provide the foundations for an efficient flow of electricity from the renewable energy generation site to load centres. (See discussion in Section 5). Development and maintenance of grid infrastructure is important because changed power flows from generation sites or new interconnectors could make it difficult for the system to provide the required flexibility to respond to new demands. The changed geographical location of consumption and physical impacts on infrastructure from climate change should also be considered in this context. This is particularly relevant bearing in mind the long-term planning required to build new transmission lines and interconnectors.
Case example
TSOs already engage in considerable planning efforts to ensure that necessary electric transmission infrastructure is available to secure a steady supply of affordable and sustainable electricity. To facilitate this process, each Nordic TSO is developing a 10-year plan integrated into a common Nordic and regional Baltic transmission infrastructure plan. Future power balances and generation centres have been identified in order to assess system needs, including changed power flows. Nevertheless, due to the required pace of the green energy transition, the desire to increase energy independence and the general electrification of society, it is still unclear whether the build-out of the electricity grid can keep up pace given the long development times discussed above. Here it will essentially be important to follow the development of transmission infrastructure in central Europe. If the infrastructure is not developed, it will not be possible to export sufficient renewable electricity production from the Nordic countries. Curtailment may be the result. The alternative is to develop new renewable generation in combination with e-fuel production. Providing access to public planning assumptions on the future development of the electricity system and establishing a coordinated electricity grid development plan between TSOs and DSOs to increase sector coupling could be an option.
Target group and impact on the value chain
The measure's target group is TSOs, DSOs and utility companies where the aim is to enable these parties to plan and develop the electric grid infrastructure required to facilitate the green energy transition.
Gap analysis: Do the measures adequately and efficiently mitigate the identified risks?
Measures to mitigate the risk of investments in electric grid infrastructure are required. The level of integrated grid planning at regional and international level must be increased. Providing access to public planning assumptions could be an option. The development is contingent on accelerated permitting processes, public inclusion in infrastructure projects, etc., as discussed above. In essence, a gap remains that needs to be addressed.
7.7 Energy infrastructure and integration
| RISK: LACK OF SUSTAINABLE LONG-TERM ENERGY STORAGE | GAP EXISTS | ||
| MEASURE | IMPLEMENTENTATION STAGE | EFFECT TIME HORIZON | DOCUMENTED IMPACT |
| Energy infrastructure and integration | Adopted | Long-term | ↑ |
| ↑ = Positive | ↓ = Negative | → = Mixed | ? = No documentation |
Description of measure
Renewable energy development increases the need for flexible producers/consumers in order to ensure stability. Integration between the electricity system and other energy vectors is important. District heating and cooling (DH&C) systems, which operate according to the fluctuating electricity prices caused by renewable energy, can provide the same ancillary services as gas engines and electric batteries. Using heat pumps and electric boilers and storing the heat for later use in thermal storage, and using CHP plants, DH&C systems could offer both long-term energy storage and flexibility. The same is true of the gas systems used in PtX processes and gas CHP plants. Functional demands on the level of energy storage could be imposed to ensure security of supply. This relates to hydro reservoirs, gas cavern storage facilities, large pit thermal energy storages and fuel stocks at power plants. The requirements must be designed to ensure supply security and stable energy prices. The solution could impose functional demands on actors outside the energy markets.
Case example
The European Council has adopted a regulation designed to ensure that gas storage capacities in the EU are topped up before the winter season. Underground gas storage facilities must be filled to at least 80% of capacity before winter 2022–2023 and to 90% before the following winter periods. The measure is necessary because gas storage facilities were previously market-driven with no requirements for filling levels. Following the oil crisis in the 1970s, strategic oil reserves have also been in place to ensure supply in the event of supply disruptions. Similar strategic requirements for other fuel types can be envisioned. Today, it could be fuel stocks at power plants (coal, biomass, etc.), and in the future, PtX fuels could be regulated by equal reserve requirements.
The underlying energy infrastructure required to integrate renewables must also be in place. The construction of district heating infrastructure in Denmark provides one example of such a scheme. The Heat Supply Act of 1979 provided the framework for heat supply planning in all municipalities and defined responsibilities and procedures for interaction between the Ministry and the regional and local authorities. The main objectives were to develop the most cost-effective heat supply for society and to reduce oil dependency. The Act provided the framework to determine the optimal zoning between natural gas and district heating grids and for utilisation of surplus heat from power generation. It also provided the local authorities with an instrument to oblige consumers to be connected to the grids and enabled the state to force district heating plants whose sole heat source was heavy oil to use natural gas. The existing district heating infrastructure could also help integrate renewable energy into the electricity system
A further example is provided by the European Hydrogen Backbone development project that aims to establish a hydrogen network throughout Europe[1]. The development of new hydrogen pipelines in Sweden, Finland and the Baltic Sea marks a new development for the Nordic countries. The aim is for hydrogen production from the Nordic countries to feed central European consumption, in much the same way as the existing electricity network. The general discussion will be whether energy should be moved via molecules (hydrogen network ) or electrons (electricity network). Developing a hydrogen pipeline network with associated energy storage in caverns could provide additional flexibility for integrating renewable energy. The alternative would be to move the energy via methanol or ammonia. This would also require a yet-to-be-developed CO2 infrastructure. The envisioned hydrogen network is shown in
Target group and impact on the value chain
The target group is society. The need to develop a mechanism to ensure security of supply through energy storage level requirements and the necessary energy infrastructure has been highlighted by the energy crisis.
Footnotes
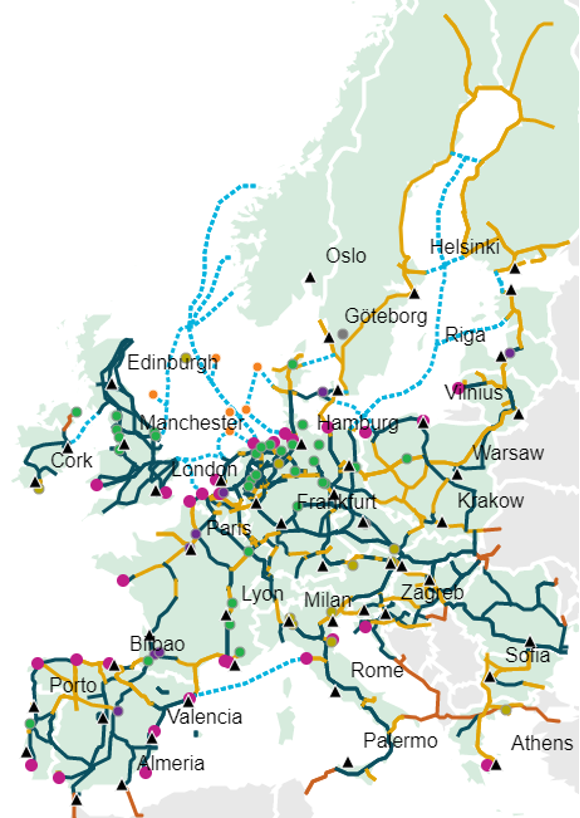
Gap analysis: Do the measures adequately and efficiently mitigate the identified risks?
Measures to develop the required energy infrastructure are important. The differing characteristics of the Nordic countries mean there is no one-size-fits-all solution. However, general requirements relating to energy storage levels could be one relevant measure. Developing energy infrastructure for energy vectors other than electricity will also be necessary to ensure renewable energy integration and security of supply. In essence, a gap remains.
7.8 Information campaigns and digital applications
| RISK: UNCHANGED CONSUMER BEHAVIOUR | NO GAP | ||
| MEASURE | IMPLEMENTENTATION STAGE | EFFECT TIME HORIZON | DOCUMENTED IMPACT |
| Information campaigns and digital applications | Implemented | Short-term | → |
| ↑ = Positive | ↓ = Negative | → = Mixed | ? = No documentation |
Description of measure
Across the Nordic countries, several information campaigns have been aimed at the general public as an emergency measure designed to reduce electricity consumption. The public energy authorities have carried out some information campaigns, while other campaigns are being implemented by private actors in the energy sector. These communication campaigns provide consumers with information about how they can reduce their energy bills, e.g., by consuming energy when it is cheapest (avoiding peak hours), substituting expensive energy sources and implementing energy-efficiency measures. In addition, non-verbal communication campaigns have been deployed in several countries. These include reducing the temperature in public buildings and turning off the lights around monuments. These non-verbal campaigns also remind consumers that we are in an energy crisis and that everyone has a duty to save energy. Digital applications applied to monitor the prices of energy during the day have proved a popular and effective tool for consumers to plan their energy consumption. Private entrepreneurs have primarily developed digital applications.
Case example
The impact of information campaigns depends on the individual campaign’s structure and design, the platform it is published on and how this fits with the target group for the information campaign. Since no evaluation of these information campaigns has been conducted, it is difficult to highlight individual campaigns.
While the specific impact of different information and digital applications cannot be determined at this stage, savings are being made. In Finland, nearly 9 out of 10 people reported energy savings, according to Fingrid resulting in a 7% year-on-year reduction in electricity demand between September 2021 and September 2022. At least some of these savings may be attributable to generally higher temperatures. Moreover, digital applications help consumers plan their energy consumption when it is cheapest. These digital applications have proven to be popular and offer major potential for added energy efficiency. Nonetheless, it is hard to radically change the public’s patterns of consumption since peak hours are determined by societal structures, and in particular the labour market. Consequently, no potential gap has been identified.
Target group and impact on the value chain
The public authorities are the target stakeholder as they are (often) the originator of the communication campaigns and are responsible for formulating the campaigns in a manner that contributes to energy savings at end-consumer level.
Gap analysis: Do the measures adequately and efficiently mitigate the identified risks?
Given that energy-saving campaigns, digital applications and addressing consumption in public buildings are generally being considered across all countries, it is assessed that this risk is adequately and efficiently addressed.
7.9 Energy generation diversification
| RISK: INCREASED WEATHER DEPENDENCE | GAP REMAINS | ||
| MEASURE | IMPLEMENTENTATION STAGE | EFFECT TIME HORIZON | DOCUMENTED IMPACT |
| Energy generation diversification | Implemented | Short, medium and long-term | ↑ |
| ↑ = Positive | ↓ = Negative | → = Mixed | ? = No documentation |
Description of measure
There is a need to structurally diversify generation capacity to safeguard security of supply when multiple energy sources are in low supply. As discussed, this was the case in 2022 when reduced nuclear generation, was accompanied by more expensive power plant operation based on natural gas, and potentially lower electricity exports from Norway due to low hydro reservoir levels. The generation mix ultimately must be able to supply energy capacity during peak-demand hours. Given that renewables are by nature weather-dependent, energy resources not reliant on weather conditions are needed to balance the system.
Various options exist in the short, medium, and long term to diversify energy generation. In the short term, keeping existing power plant capacity operational (thermal and nuclear) is an option to provide flexibility. At the same time, the application of oil- or coal-based capacity could be a more cost-effective solution during the ongoing energy crisis. In the medium term, one structural measure to handle this issue, and to increase baseload capacity while diversifying generation sources, is to increasingly build generation capacity with an alternative feedstock, e.g., waste-to-energy, biogas, e-fuel generators or nuclear. Further build-out of renewables and adequate energy storage could also help achieve a positive capacity balance.
In the long term, diversification through PtX technologies and sector coupling are also options to balance the system and provide diversification sources (see energy infrastructure and integration measure).
Case example
To provide short-term flexibility, Denmark and Finland have extended the lifetime of coal and oil plants to provide flexibility in the coming winters. To diversify generation in the medium term, the Swedish government has announced plans to change its 2045 goal of having an energy system based on 100% renewables to a 100% fossil-free system. This further highlights the need to build additional nuclear capacity to ensure baseload in the energy system.
Denmark has also announced plans to further develop the biogas sector, which currently provides approx. 25% of gas consumption, thereby decreasing the use of natural gas. Pumped hydro could also be an alternative generation source in Norway in a scenario with a continued volatile price setting. In the long term, the nations surrounding the Baltic Sea have agreed to install 19.6 GW of offshore wind by 2030, thus emphasising the need to add additional renewable generation capacity.
Target group and impact on the value chain
The target group of the measure are regulators and energy generation companies. Regulators need to develop a regulatory framework that incentivises energy generation companies to invest in technologies that contribute to achieving an appropriate energy mix. This will make it easier for the TSOs to balance supply and demand for energy.
Gap analysis: Do the measures adequately and efficiently mitigate the identified risks?
The Nordic countries have addressed the need to diversify generation capacity in the short term by extending the operation of fossil-fuel-based power plants. In the medium term, strategies have been applied and considered to include additional feedstocks for electricity generation, e.g., biogas (which could also help decarbonise energy-intensive industries) and adding additional nuclear capacity to the grid. In the long-term, sector coupling, e.g., through energy storage in district heating systems (see energy storage measure), can be applied to store energy. Long-term storage of energy, nonetheless, remains an issue. In essence, while measures exist to address the weather dependency of generation capacity, the identified measures do not adequately and efficiently address the need for diversification and determining how society needs to engage in long-term storage of energy.
7.10 Energy crisis mechanisms
| RISK: INADEQUATE ENERGY CRISIS MANAGEMENT | GAP REMAINS | ||
| MEASURE | IMPLEMENTENTATION STAGE | EFFECT TIME HORIZON | DOCUMENTED IMPACT |
| Energy crisis mechanisms | Decided | Short-term | ↑ |
| ↑ = Positive | ↓ = Negative | → = Mixed | ? = No documentation |
Description of measure
Stakeholders across the energy market are concerned about the long-term consequences of hasty decision-making to respond to high energy prices, especially interventions in the structure of the electricity market. This has been mentioned in interviews and in reports from private-sector organisations. Important elements in crisis mechanisms to avoid unintended effects of flawed policymaking and spur public democratic debate therefore remain the involvement of third parties (agencies, universities etc.), continuity planning and nuanced impact assessments. For crisis management to function well, mechanisms need to be planned to reduce potential negative impacts and to allow the market to function well after a crisis. In addition, mechanisms should preferably be well-known to energy market participants. Mechanisms should nonetheless be tailored to specific national and local conditions.
Case example
A variety of measures have been applied to safeguard against unintended effects. At EU level, ACER is heavily involved in connection with the potential design of a new price benchmark for LNG and redesign of the electricity market to deliver affordable electricity, safeguard the system against future shocks and enhance alignment with agreed climate targets. In this connection, it is important to make thorough analysis and impact assessments to mitigate potential negative impacts from intervening in the electricity market structure.
At international level, the IEA’s energy stockholding system is an example of an effective and well-functioning crisis mechanism. The IEA’s energy stockholding system was created following the oil crisis in the early 1970s and requires each IEA member country to hold oil stocks equivalent to at least 90 days of imports to respond to potential supply disruptions. The IEA applied its crisis mechanism to ensure adequate oil supplies by releasing the two largest ever emergency oil stocks on 1 March and 1 April 2022. This is the fifth application of the system since the 1970s.
Target group and impact on the value chain
The target group is all energy market stakeholders, meaning that substantial changes to the electricity market structure would affect the entire value chain.
Gap analysis: Do the measures adequately and efficiently mitigate the identified risks?
While appropriate stakeholders will be consulted, there is always a risk associated with making large-scale changes to an existing system. Due to the market response to uncertainties around appropriate and effective crisis management, it is concluded that the existing measures only partially address identified risks.
7.11 Tripartite negotiations
| RISK: LABOUR SHORTAGE | GAP EXISTS | ||
| MEASURE | IMPLEMENTENTATION STAGE | EFFECT TIME HORIZON | DOCUMENTED IMPACT |
| Tripartite negotiations | Implemented | Long-term | → |
| ↑ = Positive | ↓ = Negative | → = Mixed | ? = No documentation |
Description of measure
Tripartite negotiations are a structural measure that supports workforce availability by prioritising initiatives to ensure sufficient skills, wages and working conditions in critical sectors. In this case, prioritisation of labour market measures in the energy sector could ensure that appropriate skills and a sufficient scale of labour are available to implement the planned energy projects.
Case example
Norway has implemented an energy agreement between employee and employer organisations. The agreement includes several initiatives targeting employees in the energy sector. The agreement consists of wage supplements and guaranteed wage rates for several groups in the sector. Another focus of the agreement is to increase workers’ skills so that these match the demanded skills. The wage increases and the skills enhancement measures are intended to enable the companies to carry out the tasks they have been assigned by employing a large enough workforce with the appropriate skills. Other elements such as sustainability, accessibility to technology and retirement policies are included in the agreement.
No evaluation of the newly implemented labour market initiative in the Norwegian tripartite negotiation has been conducted. However, experiences from other sectors support the view that wage and working conditions play a role in attracting labour to certain sectors. Thus, up-skilling employees in the energy sector can make the workforce more qualified. However, in interviews, experts highlight a gap between the skills demanded by companies and the green skills possessed by the workforce, indicating that further measures are required in this context.
Target group and impact on the value chain
The target stakeholder group in a tripartite negotiation includes the employer organisation, the employee organisation and the government. The duration of a tripartite negotiation depends on a single negotiation. In Norway, the collective agreement for the energy sector lasts three years (2022–2024). Sufficient and qualified workforce availability is necessary to accelerate the energy transition and boost security of supply through energy independence, thereby creating positive impacts throughout the value chain.
Gap analysis: Do the measures adequately and efficiently mitigate the identified risks?
Given the substantial need for labour to support the green energy transition, this risk is not appropriately and efficiently addressed. The need for extra labour requires a broader strategic plan addressing how to manage the lack of skilled workers in order to support the green transition. Solutions include increasing energy-related education and more national planning on needed availability (skills and volume). However, the tools (e.g., tripartite negotiations) are in place to expand the labour supply and should be applied, supplemented by additional measures.

8. TARGETING NORDIC ADDED VALUE
8.1 Policy recommendations
National
- Implement fixed timelines and shorten permitting processes for generation and infrastructure assets while considering the relevant perspectives of local communities.
- Ensure a high-quality labour supply for the energy sector by developing long-term national roadmaps, including to determine whether and how the sector should be prioritised.
- Apply goal-oriented impact assessments as a basis for decision-making, addressing short- and long-term system-wide perspectives. The goals and assessments should balance all aspects of the Energy Trilemma and consider the benefits that a reliable energy supply can create for other sectors of society. In this context, the number of scenarios in national energy planning should be increased to encompass multiple energy system changes.
- Increase system capacity and flexibility through existing energy assets that are currently not fully utilised, e.g., by prolonging lifetimes or other means, in order to maintain affordable prices and security of supply. This should not overly delay the green energy transition.
- Reinforce electricity crisis management so that it is properly dimensioned and well-planned at local, national and Nordic level. It should be borne in mind that since electricity is both a traded commodity and a basic societal need, adopting a cautious approach during crisis situations remains pivotal. This is because both inaction and suboptimal policy decisions could result in market disruptions and risk creating future, even more acute crises.
- Strengthen the energy industry’s long-term attractiveness and competitiveness within important sectors such as energy asset manufacturing, electricity generation, heat production, extraction of critical raw materials, energy service companies and grid infrastructure.
Nordics
- Diversify sources of energy generation, carriers, and storage in line with national climate targets, including hydrogen and biofuel infrastructure. Leverage the respective strengths of different technologies and energy carriers and opportunities to develop local energy systems while limiting excessive dependence on any single technology, facility or supply route.
- Review ways of continuously adapting the electricity market model to meet society’s needs and desires to deliver a green and just energy transition, while maintaining a high security of supply. Based on developments in 2022, markets have not been able to balance the various elements of the Energy Trilemma. In this context, adequate roles, responsibilities for market actors, governments and the number of market interconnections should be considered.
- Formulate shared plans and set requirements for yearly and multi-year long-term energy storage to replace fossil-fuel storage. This could involve different energy carriers, e.g., hydrogen, methanol, ammonia, pumped hydro storage and biogas.
- Strengthen and share the knowledge foundation for addressing public opposition to energy infrastructure, e.g., through various forms of financial compensation and enhanced stakeholder dialogue in project design and development.
- Support a flexible demand-side response by utilising existing knowledge and developing new technologies and infrastructure to facilitate energy efficiency, system flexibility and ancillary services.
- Strengthen Nordic electricity grid infrastructure to avoid bottlenecks and renewable energy curtailment in connection with the increased electrification of society.
- Re-emphasise the importance of Nordic collaboration across energy markets and systems while highlighting each country’s responsibility for positively contributing to regional, national and Nordic security of supply.
- Share findings from nationally applied financial support schemes to help consumers weather the current crisis and thereby safeguard future policymaking against undesired distributional effects relating to both energy poverty and long-term market developments.
- Limit import dependency on the metals and minerals required for the green energy transition by promoting sustainable mining in the Nordics. Consider making the region a global leader in mining on the back of high environmental and ethical standards.
EU and international
- Coordinate policy responses between Nordic countries around EU initiatives, thus making them increasingly applicable to the specific nature of the Nordic markets.
- Assess the need for setting up a comprehensive stockholding system for various types of fuels and energy carriers to improve security of supply through EU-wide regulations. This should be achieved by leveraging existing knowledge, including in relation to oil and international processes, in order to alleviate the current situation and prevent similar scenarios arising in the future.
9. BIBLIOGRAPHY
- ACER, ACER has decided on alternative electricity bidding zone configurations, 2022
- Website reference: https://www.acer.europa.eu/events-and-engagement/news/acer-has-decided-alternative-electricity-bidding-zone-configurations
- ACER, Final Assessment of the EU Wholesale Electricity Market Design, 2022. Website reference: https://acer.europa.eu/Official_documents/Acts_of_the_Agency/Publication/ACER's%2520Final%2520Assessment%2520of%2520the%2520EU%2520Wholesale%2520Electricity%2520Market%2520Design.pdf
- Bruegel, European natural gas demand tracker, 2022. Website reference: https://www.bruegel.org/dataset/european-natural-gas-demand-tracker
- Bruegel, National fiscal policy responses to the energy crisis, 2022. Website reference: https://www.bruegel.org/dataset/national-policies-shield-consumers-rising-energy-prices
- Confederation of Danish Industries, Wind farms must be approved significantly faster, 2022. Website reference: https://www.danskindustri.dk/di-business/arkiv/nyheder/2022/7/vindmolleparker-skal-godkendes-vasentlig-hurtigere (Only available in Danish)
- Danish Energy Agency, FAQ on the energy situation, 2022. Website reference: https://ens.dk/ansvarsomraader/forsyning/faq-om-energisituationen
- Danish Government, Action Plan for a Green Denmark in 2030, 2021. Website reference: https://www.regeringen.dk/media/10651/pjece-koereplan-for-et-groent-danmark.pdf (Only available in Danish)
- Danish Government, The Marienborg Declaration – Baltic Sea Energy Security Summit, 2022. Website reference: https://www.regeringen.dk/media/11544/the-marienborg-declaration-_300822.pdf
- Danish Ministry of Climate, Energy and Utilities, 2022. Website reference: https://kefm.dk/klima-og-vejr/klimaindsatsen-i-danmark
- Danish Ministry of Climate & Energy; More green heat and phasing out of natural gas, 2022. Website reference: https://kefm.dk/Media/637917337579992546/Faktaark%20gr%C3%B8n%20varme%20og%20udfasning%20af%20gas.pdf
- ESMOV, Towards Better Energy Efficiency Policies, Accessed 2022. Website reference: https://article7eed.eu/?page_id=433
- Energidanmark, Netherlands to close down Europe’s largest gas field 2019, Accessed 2022. Website reference: https://www.energidanmark.com/market-info/news/news/news-2019/09/netherlands-to-close-down-europe-s-largest-gas-field/
- Energimyndigheten, Sweden’s Energy Situation, 2022. Website reference: https://www.energimyndigheten.se/trygg-energiforsorjning/fakta-om-energilaget/sveriges-energilage/ (Only available in Swedish)
- ENTSOG, Yearly Supply Outlook 2022–2023, 2022. Website reference: https://www.entsog.eu/sites/default/files/2022-07/SO0036-22_Yearly_Supply_Outlook_2022-2023_2.pdf
- Energinet, Baltic Sea Transmission System Operators prepare to manage risks on electricity adequacy, 2022. Website reference: https://en.energinet.dk/About-our-news/News/2022/11/02/Baltic-Sea-Transmission-System-Operators-prepare-to-manage-risks-on-electricity-adequacy
- Energinet, Statics special regulation, Accessed 2022. Website reference: https://energinet.dk/El/Systemydelser/Nyheder-om-systemydelser/Statistik-over-specialregulering-2020
- Energinet, Price of reserves, Accessed 2022. Website reference: https://energinet.dk/El/Systemydelser/indkob-og-udbud/Pris-paa-reserver (Only available in Danish)
- ENTSO-E, Power Plants in Europe Transparency Platform, 2020. Website reference: https://transparency.entsoe.eu/dashboard/show
- Eurelectric, Power Barometer, 2022. Website reference: https://powerbarometer.eurelectric.org/
- European Hydrogen Backbone, 2022. Website reference: https://ehb.eu/page/european-hydrogen-backbone-maps
- European Investment Bank, Energy crisis makes public banks even more important, 2022. Website reference: https://www.eib.org/en/stories/energy-crisis-net-zero-transition
- Eurostat, Environment and energy, 2022. Website reference: https://ec.europa.eu/eurostat/databrowser/explore/all/envir?lang=en&subtheme=nrg.nrg_quant.nrg_quanta&display=list&sort=category&extractionId=NRG_BAL_C
- European Commission, Energy poverty in the EU, 2022. Website reference: https://energy.ec.europa.eu/topics/markets-and-consumers/energy-consumer-rights/energy-poverty-eu_enEuropean Commission, Technical Support for RES policy development and implementation – Simplification of permission and administrative procedures for RES installations, 2022. Website reference: https://op.europa.eu/en/publication-detail/-/publication/0e9db9fa-d653-11ec-a95f-01aa75ed71a1/language-en
- European Commission, Commission makes additional proposals to fight high energy prices and ensure security of supply 2022. Website reference, https://ec.europa.eu/commission/presscorner/detail/en/IP_22_6225
- European Commission, Joint EU-Norway statement on strengthening energy cooperation, 2022. Website reference: https://ec.europa.eu/commission/presscorner/detail/en/STATEMENT_22_3975
- European Hydrogen Backbone, European Hydrogen Backbone Maps, Accessed 2022. Website reference: https://ehb.eu/page/european-hydrogen-backbone-map
- Finish Ministry of Finance, Climate Neutral Finland 2035, 2022. Website reference: https://www.treasuryfinland.fi/investor-relations/sustainability-and-finnish-government-bonds/climate-neutral-finland-2035
- Global Energy Observatory, Power Plant Database, 2020. Website reference: http://globalenergyobservatory.org/
- Government of Finland, Amending Mining Act to strengthen citizen influence, economic prospects and environmental aspects, 2022. Website reference: https://valtioneuvosto.fi/en/-/1410877/amended-mining-act-to-strengthen-citizen-influence-economic-prospects-and-environmental-aspects
- Government of Iceland, Hydro Power Plants, Accessed 2022. Website reference: https://www.government.is/topics/business-and-industry/energy/hydro-power-plants/
- Government of Iceland, Energy, Accessed 2022. Website reference: https://www.government.is/topics/business-and-industry/energy/
- Government of Iceland, Infrastructure Development, 2020. Website reference: Government House | Infrastructure development (stjornarradid.is)
- Icelandic Government, Climate Action Plan, 2020. Website reference: https://www.government.is/library/01-Ministries/Ministry-for-The-Environment/201004%20Umhverfisraduneytid%20Adgerdaaaetlun%20EN%20V2.pdf
- IEA, World Energy Employment, 2022. Website reference: https://www.iea.org/reports/world-energy-employment
- IEA, Never too early to prepare for next winter – Europe’s gas balance for 2023-2024, 2022. Website reference: https://www.iea.org/reports/never-too-early-to-prepare-for-next-winter
- IEA, Global Energy Crisis, 2022. Website reference: https://www.iea.org/topics/global-energy-crisis
- IEA, Oil Security Policy, Accessed 2022. Website reference: https://www.iea.org/reports/oil-security-policy
- IEA, The Role of Critical Minerals in Clean Energy Transitions, 2022. Website reference: https://www.iea.org/reports/the-role-of-critical-minerals-in-clean-energy-transitions/executive-summary
- Fingrid, Several uncertainties in the adequacy of electricity in the coming winter, 2022. Website reference: https://www.fingrid.fi/en/news/news/2022/several-uncertainties-in-the-adequacy-of-electricity-in-the-coming-winter--finns-should-be-prepared-for-possible-power-outages-caused-by-electricity-shortages/
- Icelandic Energy Agency, OS-2021-T008-01: Primary Energy Use in Iceland 1940-2020, 2021. Website reference: OS-2021-T008-01.pdf (orkustofnun.is) (Only available in Icelandic)
- Icelandic Ministry of Energy, Environment and Climate, 2022, Issues and Challenges of Renewable Energy. Website reference: URN_State_of_Energy_Issues_EN_Web.pdf (stjornarradid.is)
- Icelandic Ministry of Industry and Innovation, 2020, Skýrsla starfshóps um orkuöryggi á heildsölumarkadi fyrir raforku. Website reference: Skýrsla starfshóps um orkuöryggi_LOKAEINTAK.pdf (stjornarradid.is) (Only available in Icelandic)
- IMF, How Europe Can Protect the Poor from Surging Energy Prices, 2022. Website reference: https://www.imf.org/en/Blogs/Articles/2022/08/03/how-europe-can-protect-the-poor-from-surging-energy-price
- IMF, Surging Energy Prices in Europe in the Aftermath of the War: How to Support the Vulnerable and Speed up the Transition Away from Fossil Fuels, 2022. Website reference: https://www.imf.org/en/Publications/WP/Issues/2022/07/28/Surging-Energy-Prices-in-Europe-in-the-Aftermath-of-the-War-How-to-Support-the-Vulnerable-521457
- EU Commission Joint Research Centre, The effect of rising energy and consumer prices on household finances, poverty and social exclusion in the EU, 2022. Website reference: https://publications.jrc.ec.europa.eu/repository/handle/JRC130650
- Lars Christensen, 2016, Our Energy 2030. Website reference: Iceland-Energy-2030.pdf (si.is)
- Joint Research Centre, European Power Plant Database, 2017. Website reference: https://ec.europa.eu/jrc/en/publication/joint-research-centre-power-plant-database-jrc-ppdb-european-power-plant-database-energy-modelling
- Jensen, Tue V., de Sevin, Hugo, Greiner, Martin, & Pinson, Pierre., The RE-Europe data set, 2017. Website reference: https://zenodo.org/record/999150#.X8imA9hKi70
- Joint Research Centre, European Hydro Power Plant Database, 2020. Website reference: https://github.com/energy-modelling-toolkit/hydro-power-database
- Judicial information (Retsinformation), Proposal to amend act on the promotion of renewable energy, the act on electricity supply and the equalization act and the personal income tax, 2020. Website reference: https://www.retsinformation.dk/eli/ft/201912L00114 (Only available in Danish)
- Landsnet (Transmission system operator), Langtímaáætlun um þróun flutningskerfis raforku, 2021. Website reference: library (landsnet.is) (Only available in Icelandic
- New Climate Economy, The sustainable infrastructure imperative, 2016. Website reference: https://newclimateeconomy.report/2016/wp-content/uploads/sites/4/2014/08/NCE_2016Report.pdf
- Nordic Council of Ministers (2021): Nordic Co-operation Programme on Energy Policy 2022-2024. Website reference: https://www.norden.org/en/publication/nordic-co-operation-programme-energy-policy-2022-2024
- Nordic Innovation, The Nordic Supply Potential of Critical Metals and Minerals for a Green Energy Transition, 2022. Website reference: https://www.nordicinnovation.org/critical-metals-and-minerals
- Nordic TSOs, Nordic Grid Development Perspective 2021, Accessed 2022. Website reference: https://en.energinet.dk/About-our-news/News/2021/11/02/Nordic-Grid-Development-Perspective-2021-paves-the-way-towards-climate-neutral-Nordic-power-system
- Nordpool, System price curve data, 2022. Website reference: https://www.nordpoolgroup.com/en/elspot-price-curves
- Norwegian Ministry of Climate and Environment, Norway Climate Action Plan for 2021-2030, 2021. Website reference: https://www.regjeringen.no/contentassets/a78ecf5ad2344fa5ae4a394412ef8975/en-gb/pdfs/stm202020210013000engpdfs.pdf (Only available in Norwegian)
- OECD, Due Diligence Guidance for Meaningful Stakeholder Engagement in the Extractive Sector, 2017. Website reference: https://www.oecd-ilibrary.org/docserver/9789264252462-en.pdf?expires=1668021359&id=id&accname=guest&checksum=EC494A3FDC1B47F665F23F4F65B12CC
- Orkustofnun (Icelandic National Energy Authority), Primary energy use, 2022. Website reference: OS-2021-T008-01.pdf (orkustofnun.is)
- Open Models, Data on Power Plants, 2020. Website reference: https://wiki.openmod-initiative.org/wiki/Data
- Open Power System Data, Power Plant Data Packages, 2020. Website reference: https://open-power-system-data.org
- Landsvirkjun, The Electricity Market, Accessed 2022. Website reference: Raforkumarkaðurinn - Orka úr 100% endurnýjanlegum orkugjöfum (landsvirkjun.is) (Only available in Icelandic)
- Reuters, Finland warns of power outage risk over nuclear plant startup delay, 2022. Website reference: https://www.reuters.com/business/energy/finlands-ol3-nuclear-reactor-faces-new-delay-blow-power-supply-2022-12-09
- Reuters, ,Norway risks “pressed” electricity market in winter of 2023, Statnett says, 2022. Website reference: https://www.reuters.com/business/energy/norway-risks-pressed-electricity-market-winter-2023-statnett-says-2022-05-24/
- Reuters, OPEC+ agrees deep oil production cuts, Biden calls it short-sighted, 2022. Website reference: https://www.reuters.com/business/energy/opec-heads-deep-supply-cuts-clash-with-us-2022-10-04/
- Reuters, Norway grid operator says government should not curb winter power exports,2022. Website reference: https://www.reuters.com/business/energy/norway-should-not-restrict-power-exports-winter-grid-operator-says-2022-09-30/
- Reuters, Norway may limit power exports to preserve hydropower – government, 2022. Website reference: https://www.reuters.com/article/norway-electricity-hydropower-idUKL8N2ZK4EJ
- Reuters, Norway boosts hydropower, challenging effort to fill reservoirs, 2022. Website reference: https://www.reuters.com/business/energy/norway-boosts-hydropower-challenging-effort-fill-reservoirs-2022-08-17/
- Reuters, EU to require countries to fill gas storage 90% before winter, 2022. Website reference: https://www.reuters.com/business/energy/eu-require-countries-fill-gas-storage-90-before-winter-draft-2022-03-2
- Rúv (Icelandic National Broadcasting Service), 2022. Website reference: https://www.ruv.is/frett/2022/11/01/mesta-verdbolga-i-sogu-evrunnar?itm_source=parsely-api (Only available in Icelandic)
- RÚV (Icelandic National Broadcasting Service), 2022. Website reference: https://www.ruv.is/frett/2022/09/09/mikil-eftirspurn-erlendis-fra-eftir-islenskri-raforku?term=orkuver%C3%B0&rtype=news&slot=82 (Only available in Icelandic)
- Rúv (Icelandic National Broadcasting service), Rafmagn fyrir 100.000 heimili í súginn árlega, 2021. Website reference: Rafmagn fyrir 100.000 heimili í súginn árlega | RÚV (ruv.is) (Only available in Icelandic)
- Statistics Iceland, Electricity prices to homes and industry in the Nordic Countries, 2022. Website reference: https://www.statice.is/statistics/environment/energy/energy-prices/
- Swedish Energy Agency, National interest energy production and energy distribution Barsebäck, 2019. Website reference: https://www.energimyndigheten.se/4ac647/globalassets/fornybart/riksintressen/varmekraft/beslut-ri-barseback_20190415.pdf (Only available in Swedish)
- Swedish Energy Agency, The energy situation, 2023. Website reference: https://ens.dk/ansvarsomraader/forsyning/faq-om-energisituationen
- Swedish Government, Sweden’s climate policy framework, 2021. Website: https://www.government.se/articles/2021/03/swedens-climate-policy-framework/
- Total Energies, Tyra, a major offshore project at the core of our climate strategy, Accessed 2022. Website reference: https://totalenergies.com/projects/gas-green-gases/tyra-major-offshore-project-at-the-core-of-our-climate-strategy
- University of South Carolina, Hierarchy of social evidence, Accessed 2022. Website reference: https://libguides.usc.edu/c.php?g=908742&p=6554344
- WindEurope, Low wind turbine orders call for step change in Europe‘s energy security strategy, 2022. Website reference: https://windeurope.org/newsroom/low-wind-turbine-orders-call-step-change-europe-energy-security-strategy/
- Wikipedia, Power Stations by Country, 2021. Website reference: https://en.wikipedia.org/wiki/Category:Power_stations_by_country
- World Energy Council, World Energy Trilemma Index, 2022. Website reference: https://www.worldenergy.org/transition-toolkit/world-energy-trilemma-index
10. APPENDIX 1: Energy balance per country
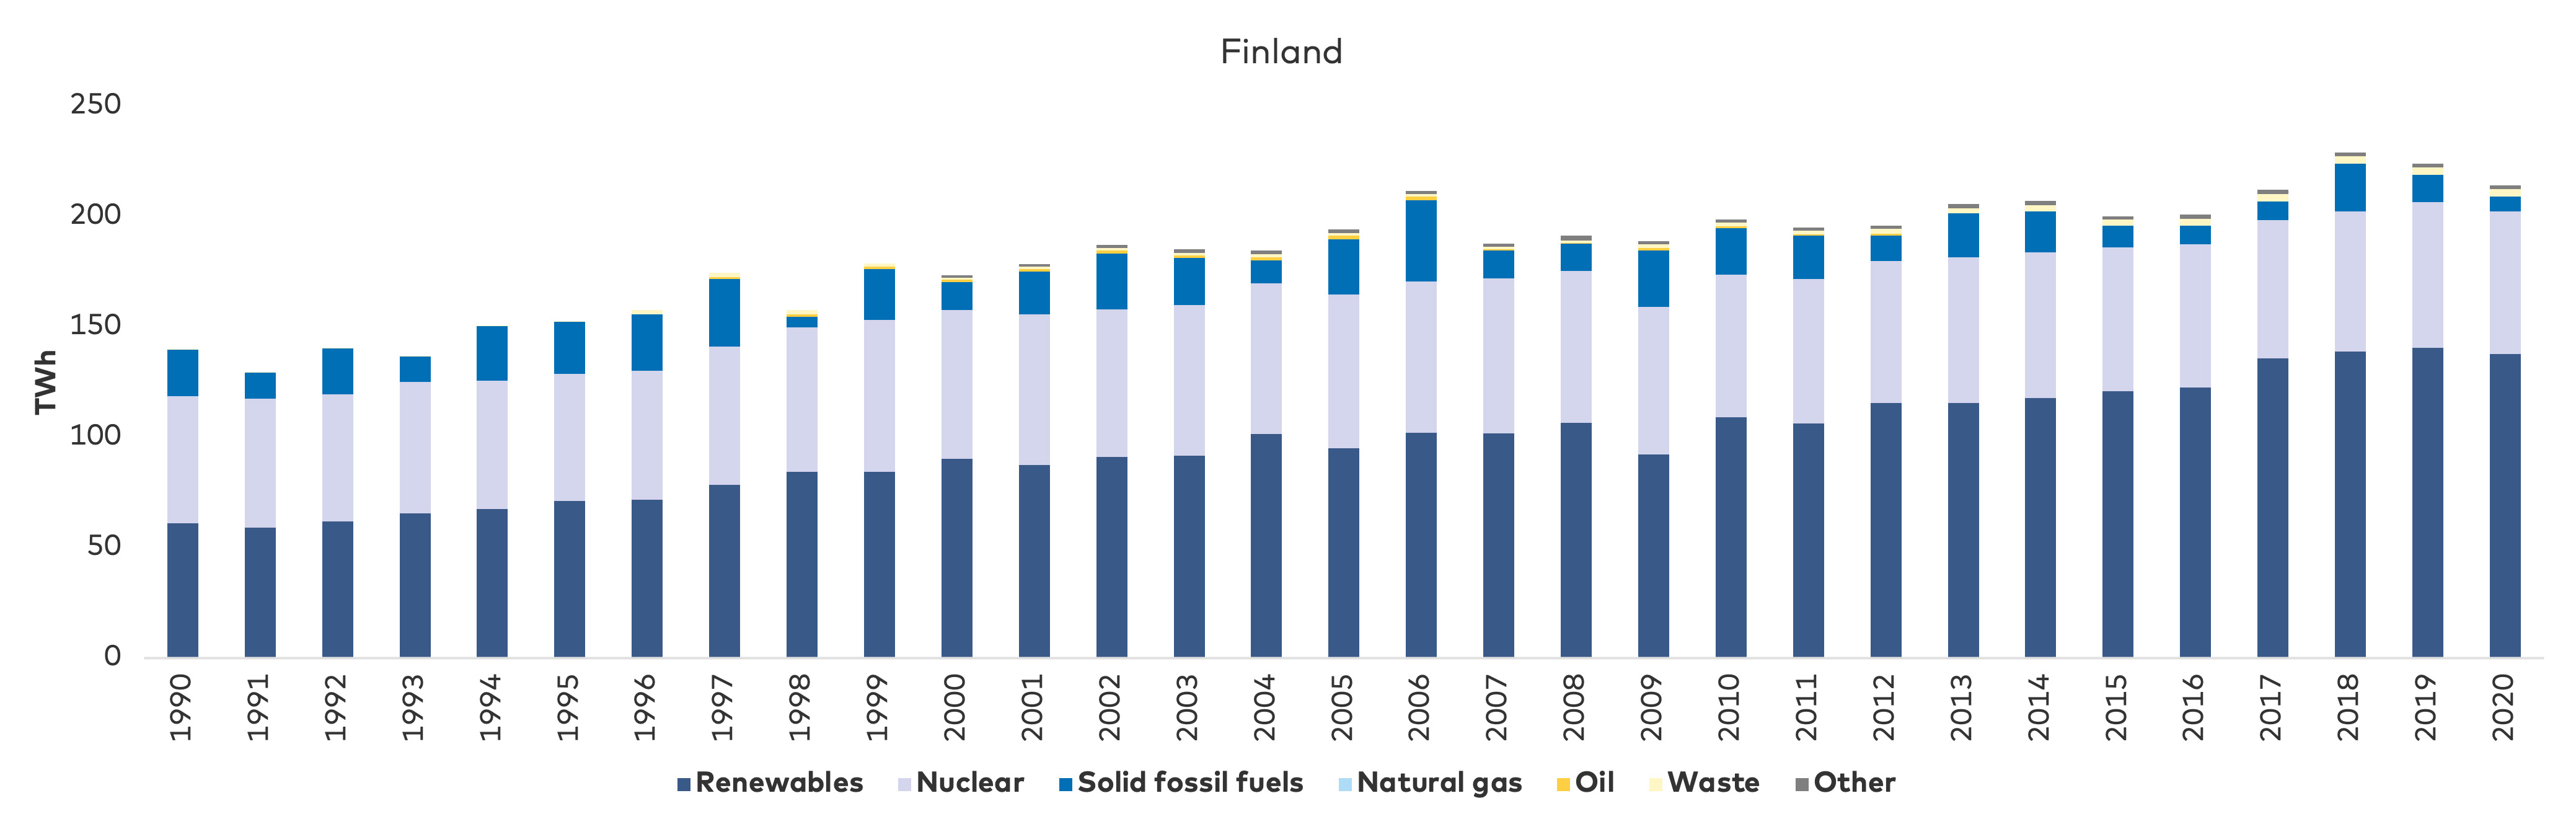
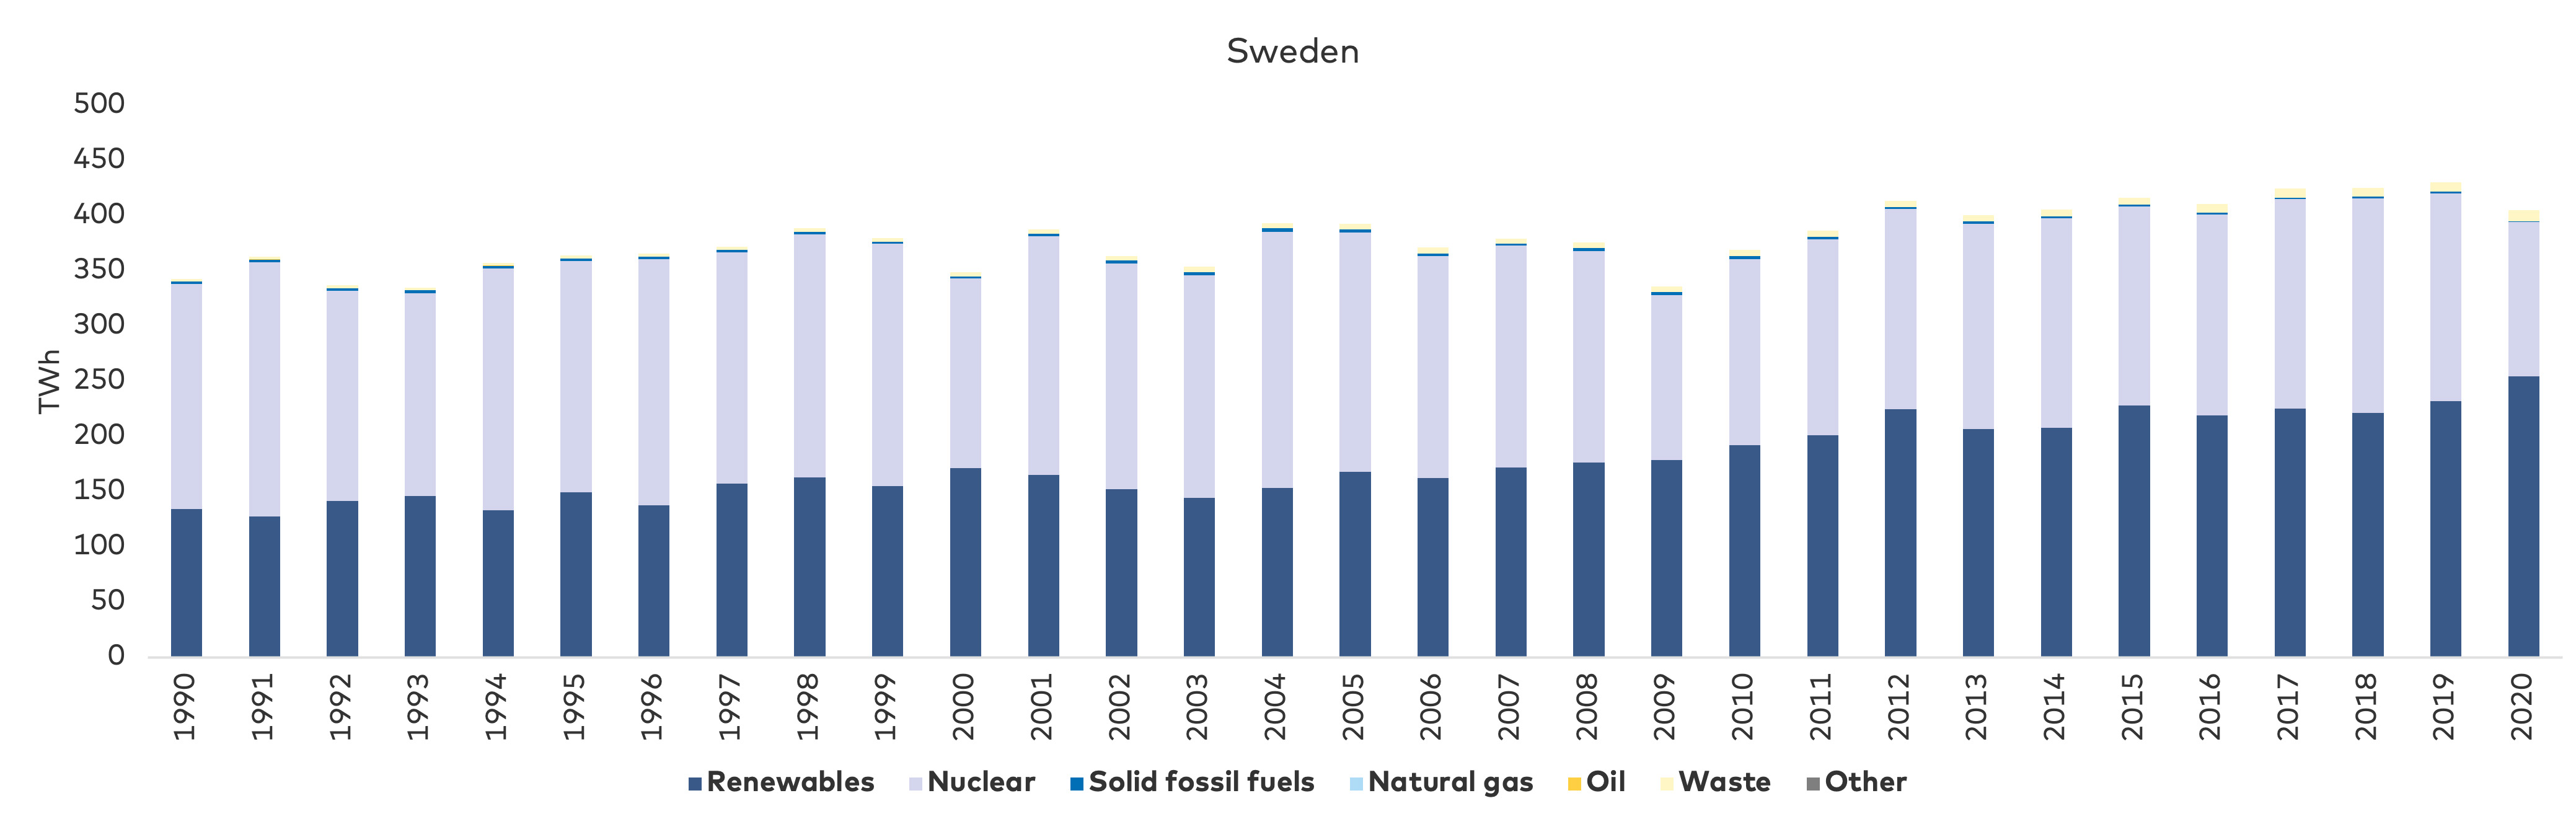
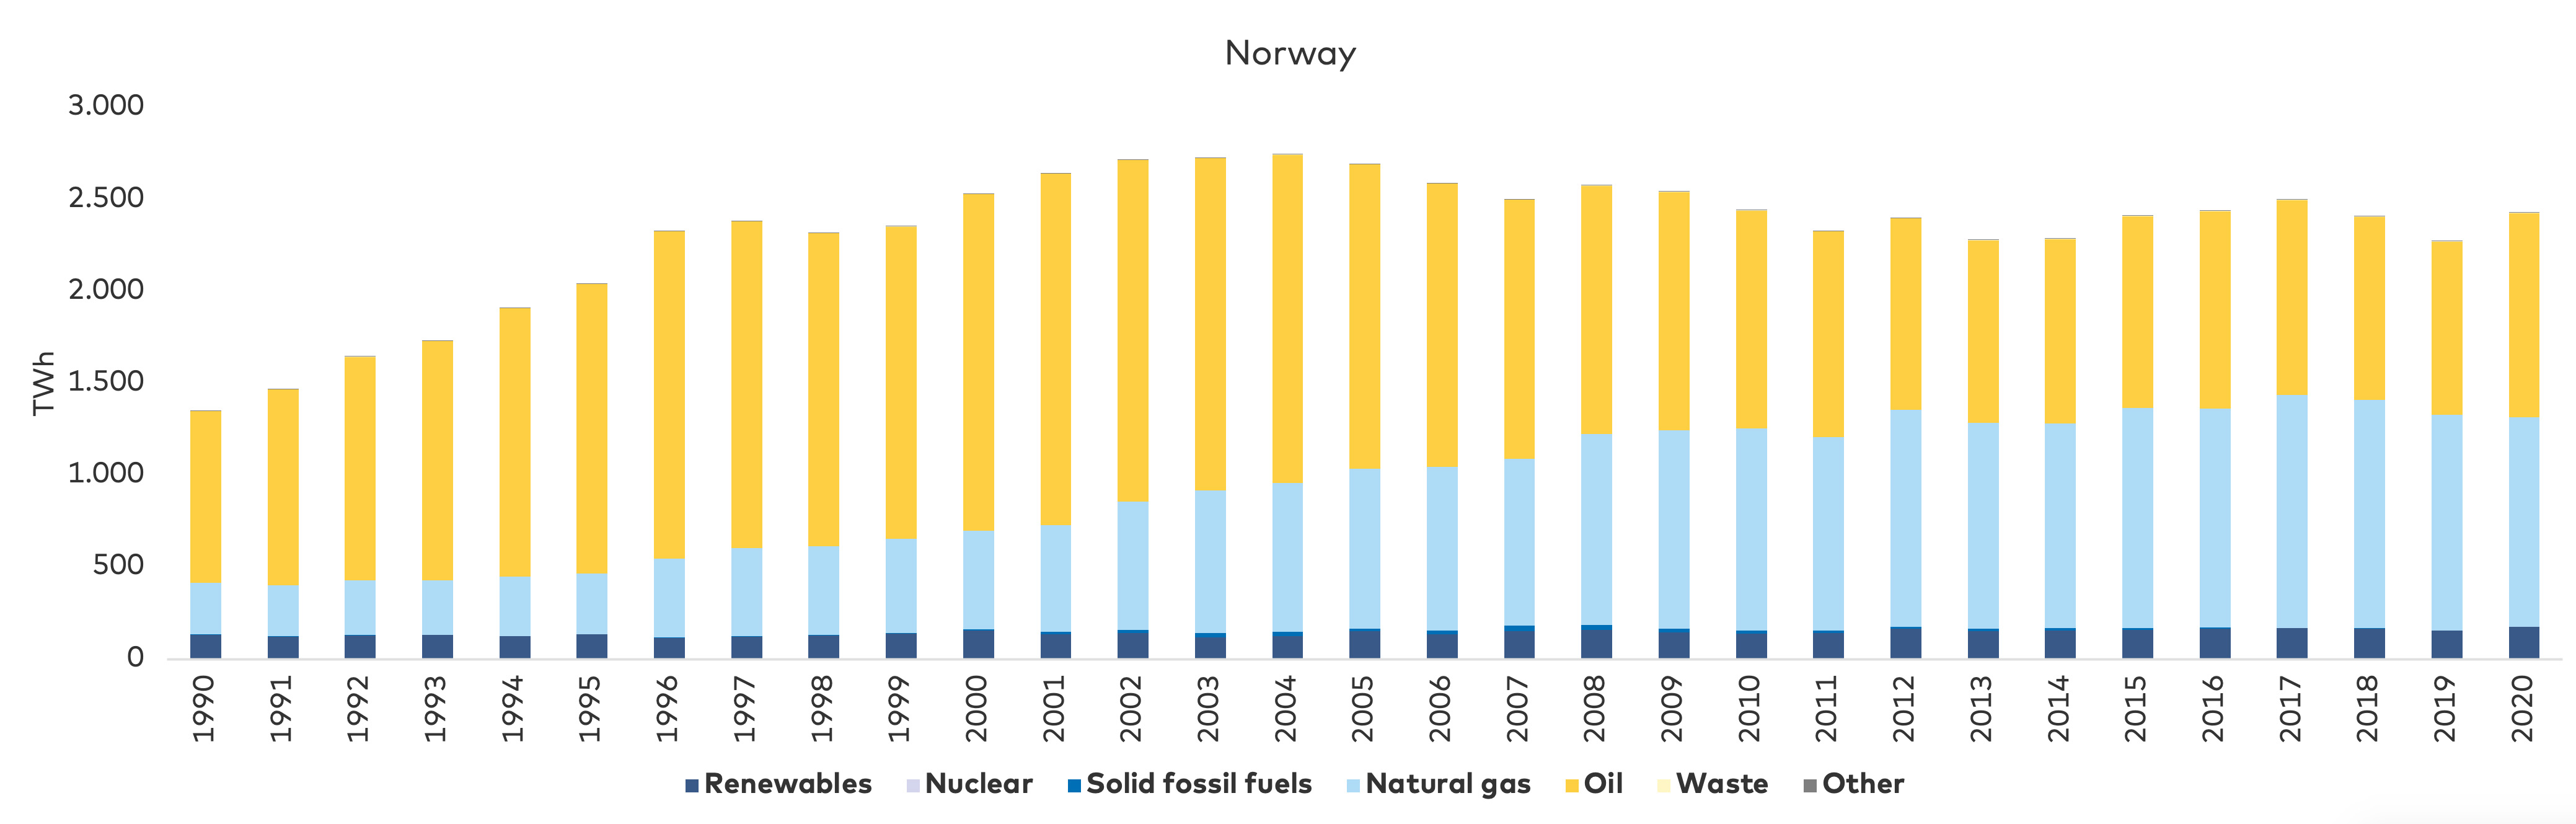
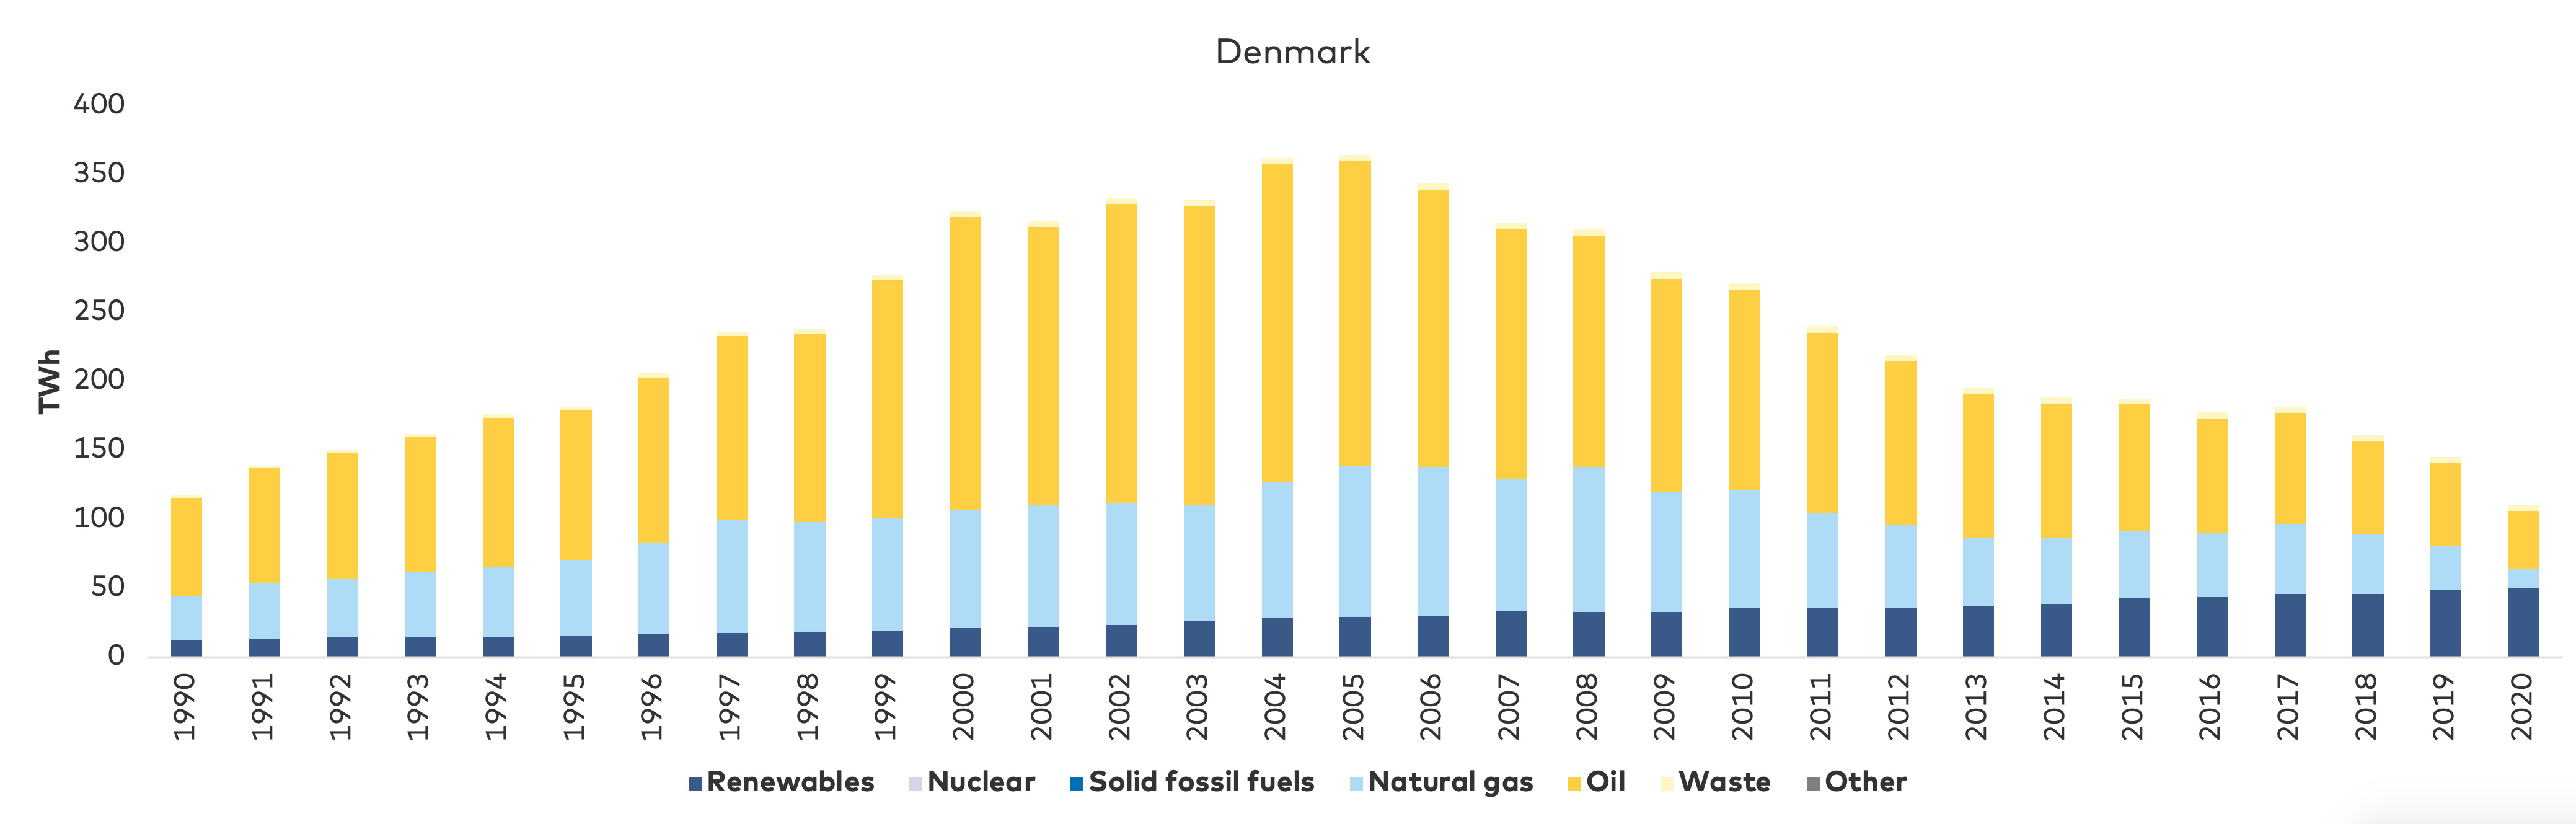
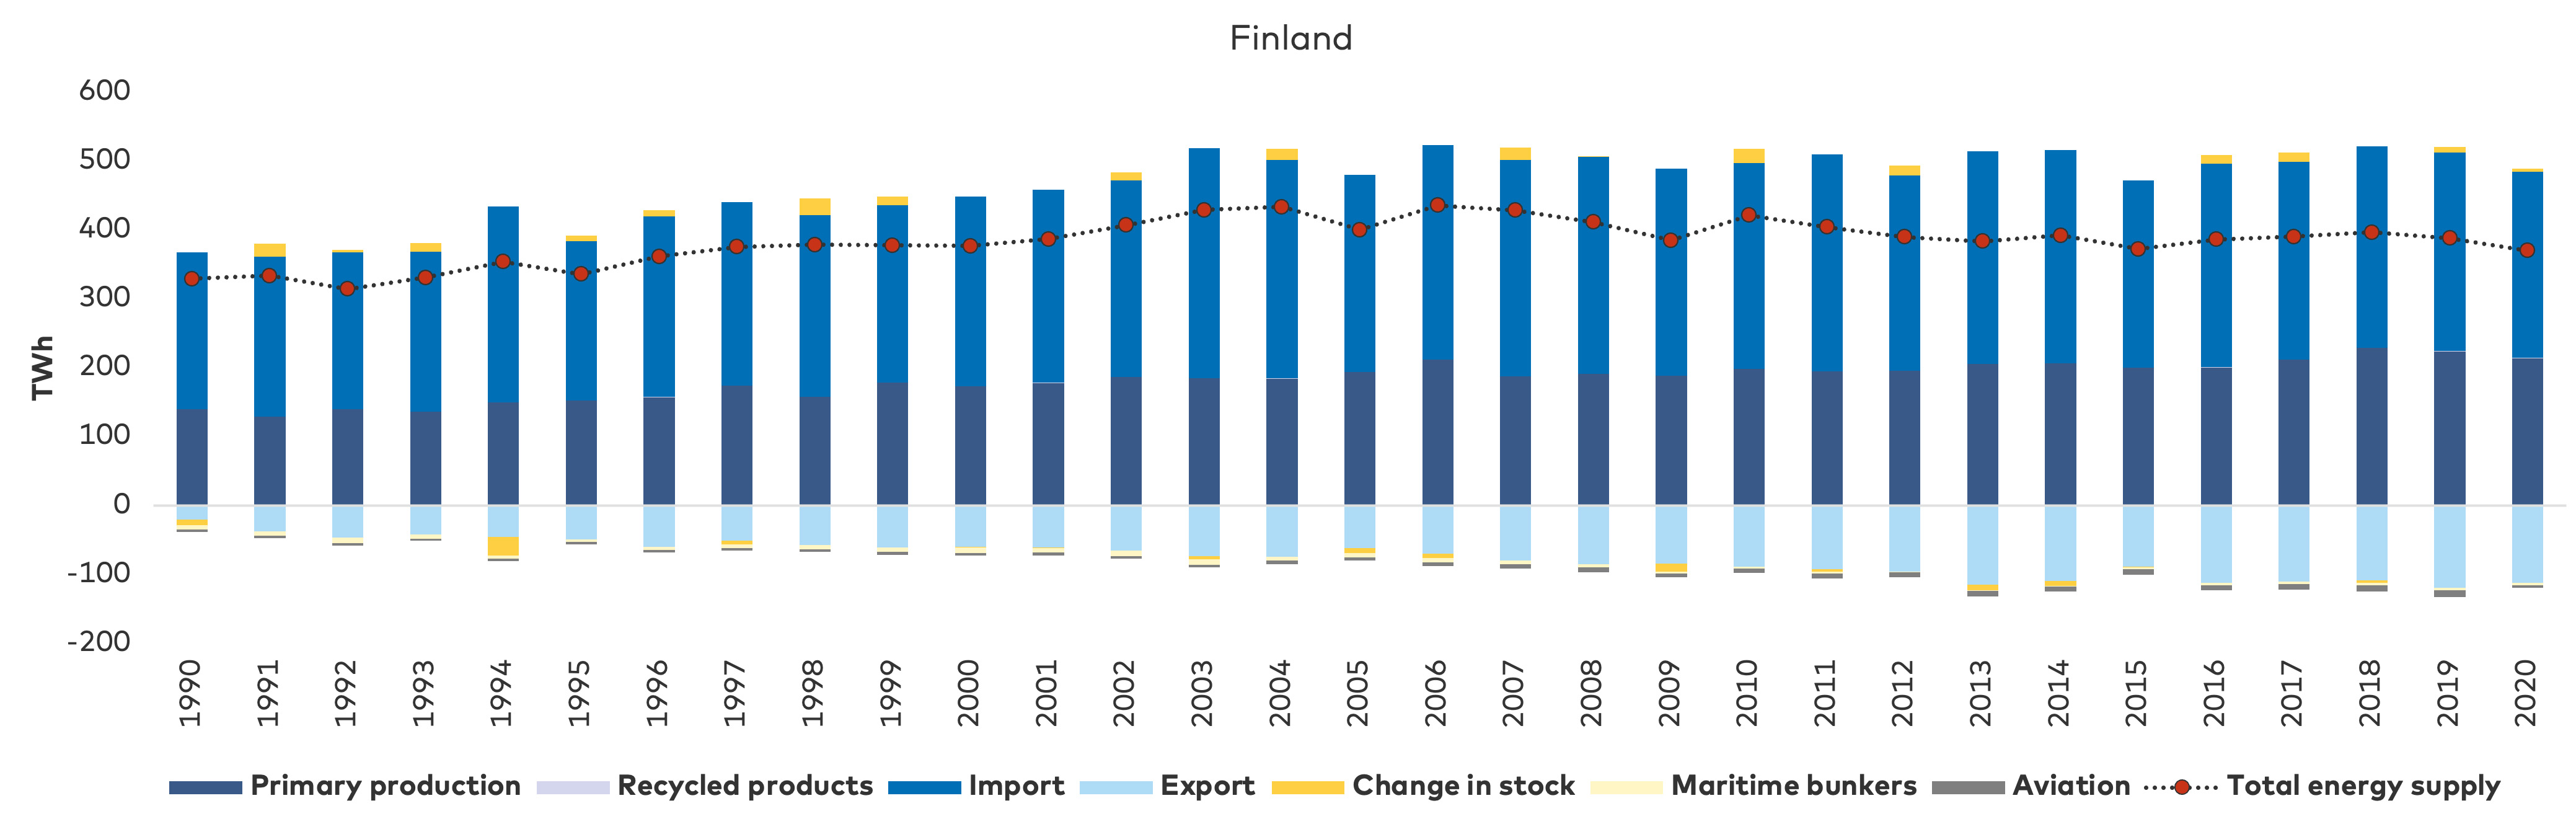
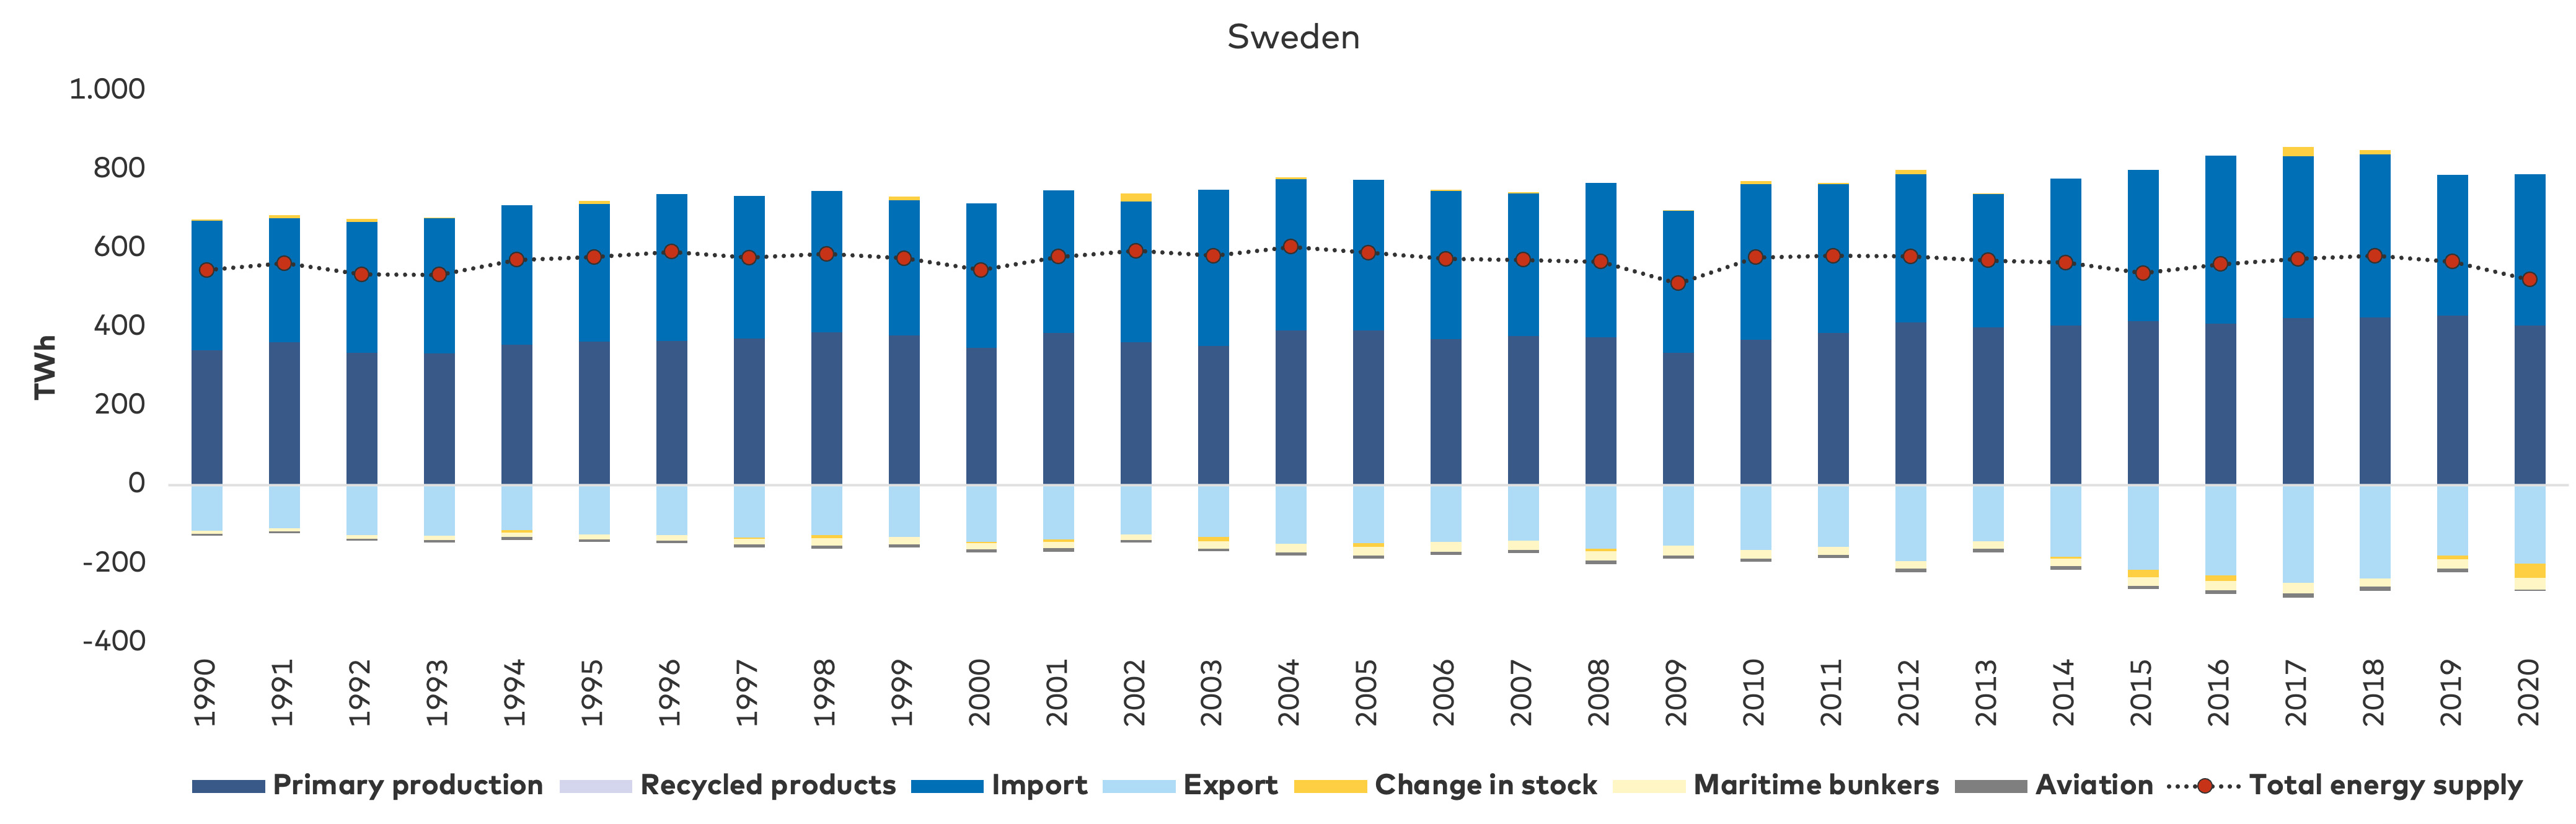
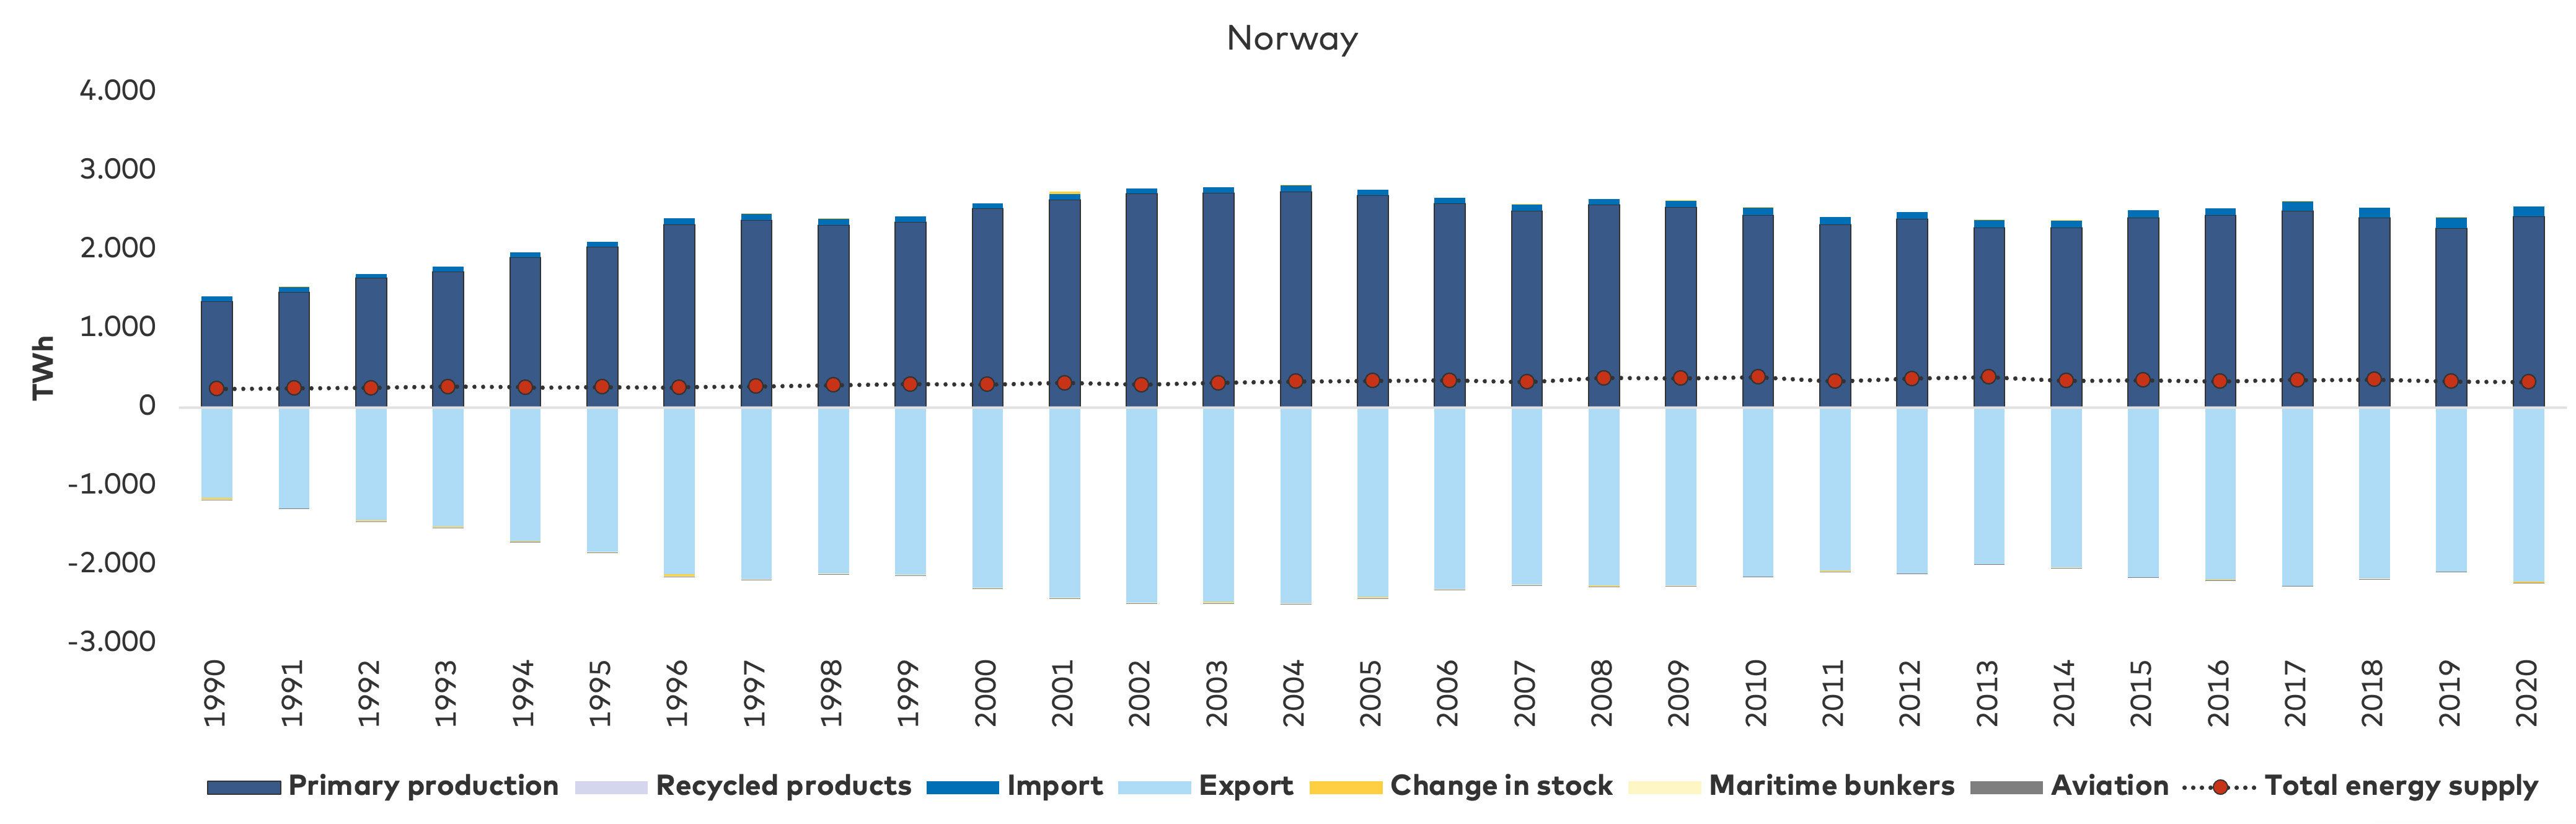
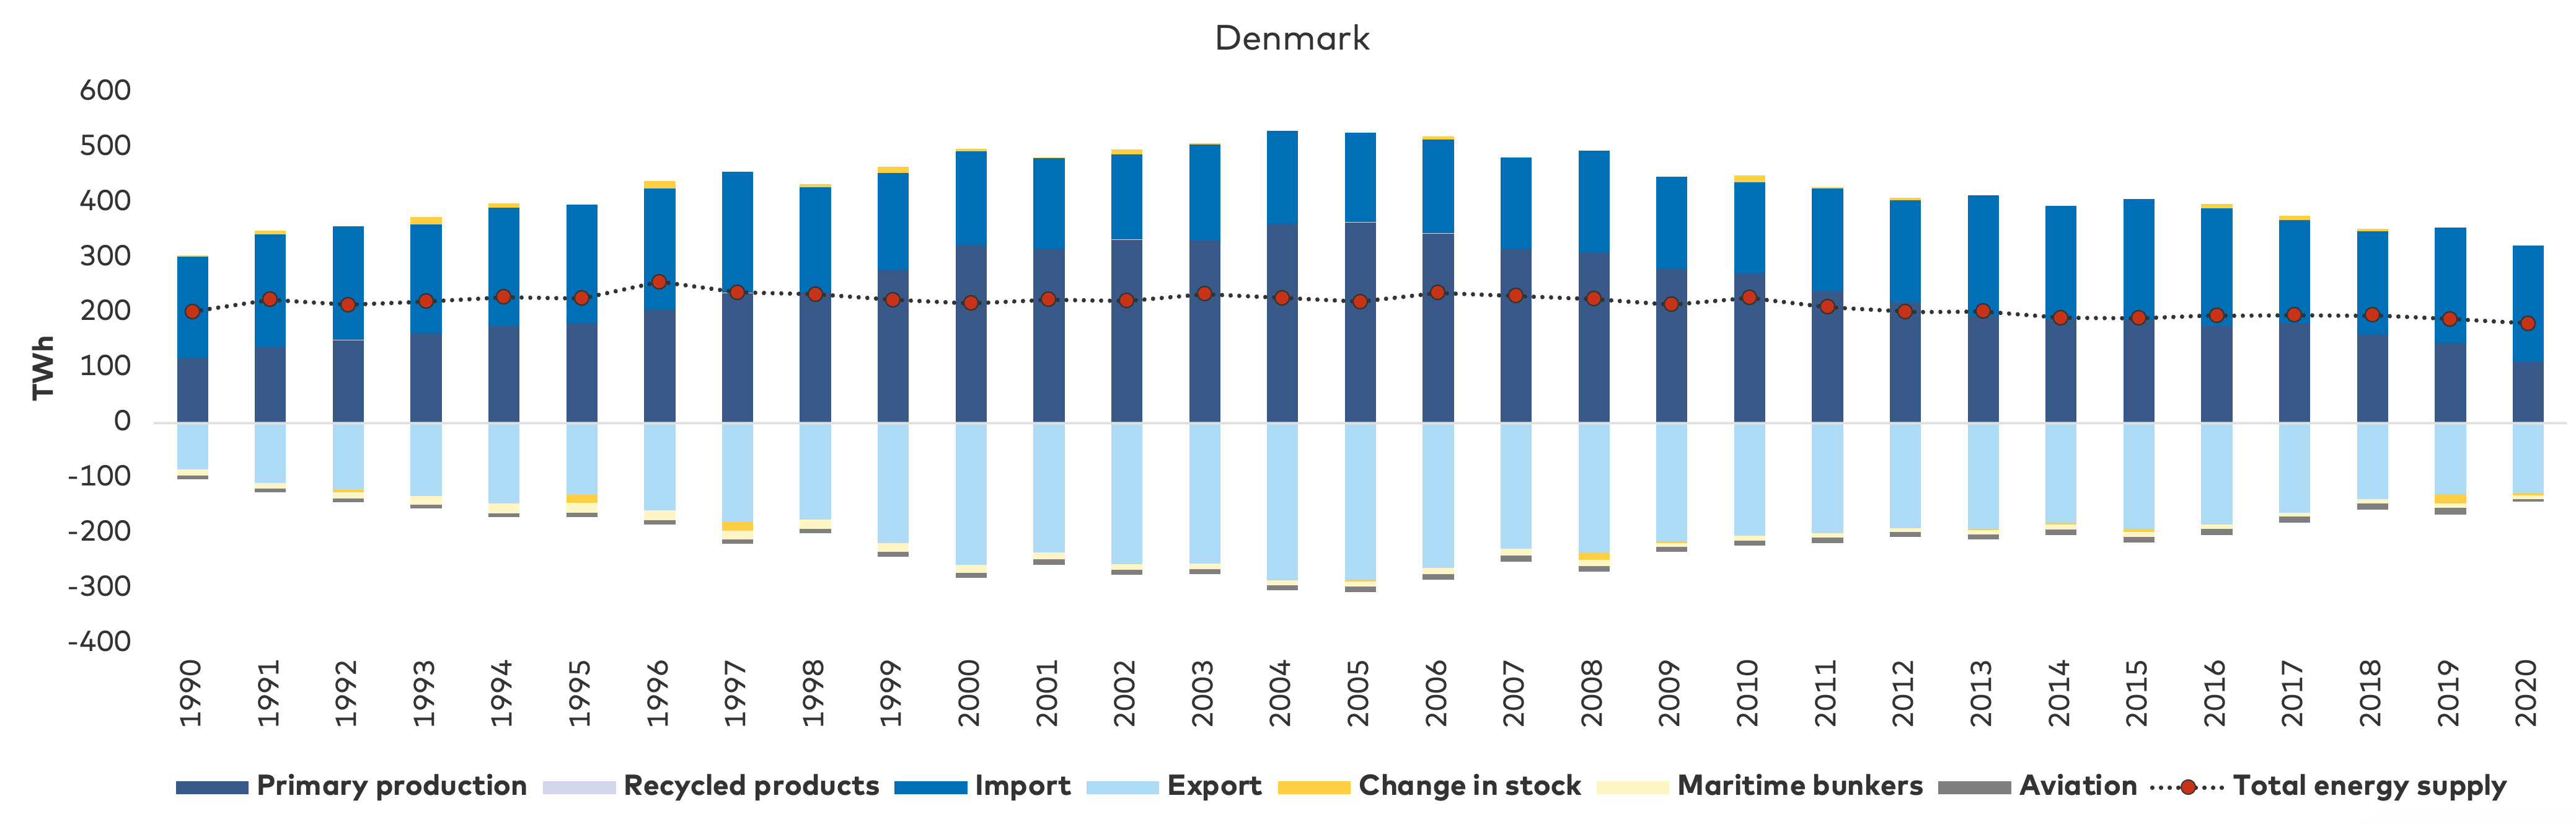

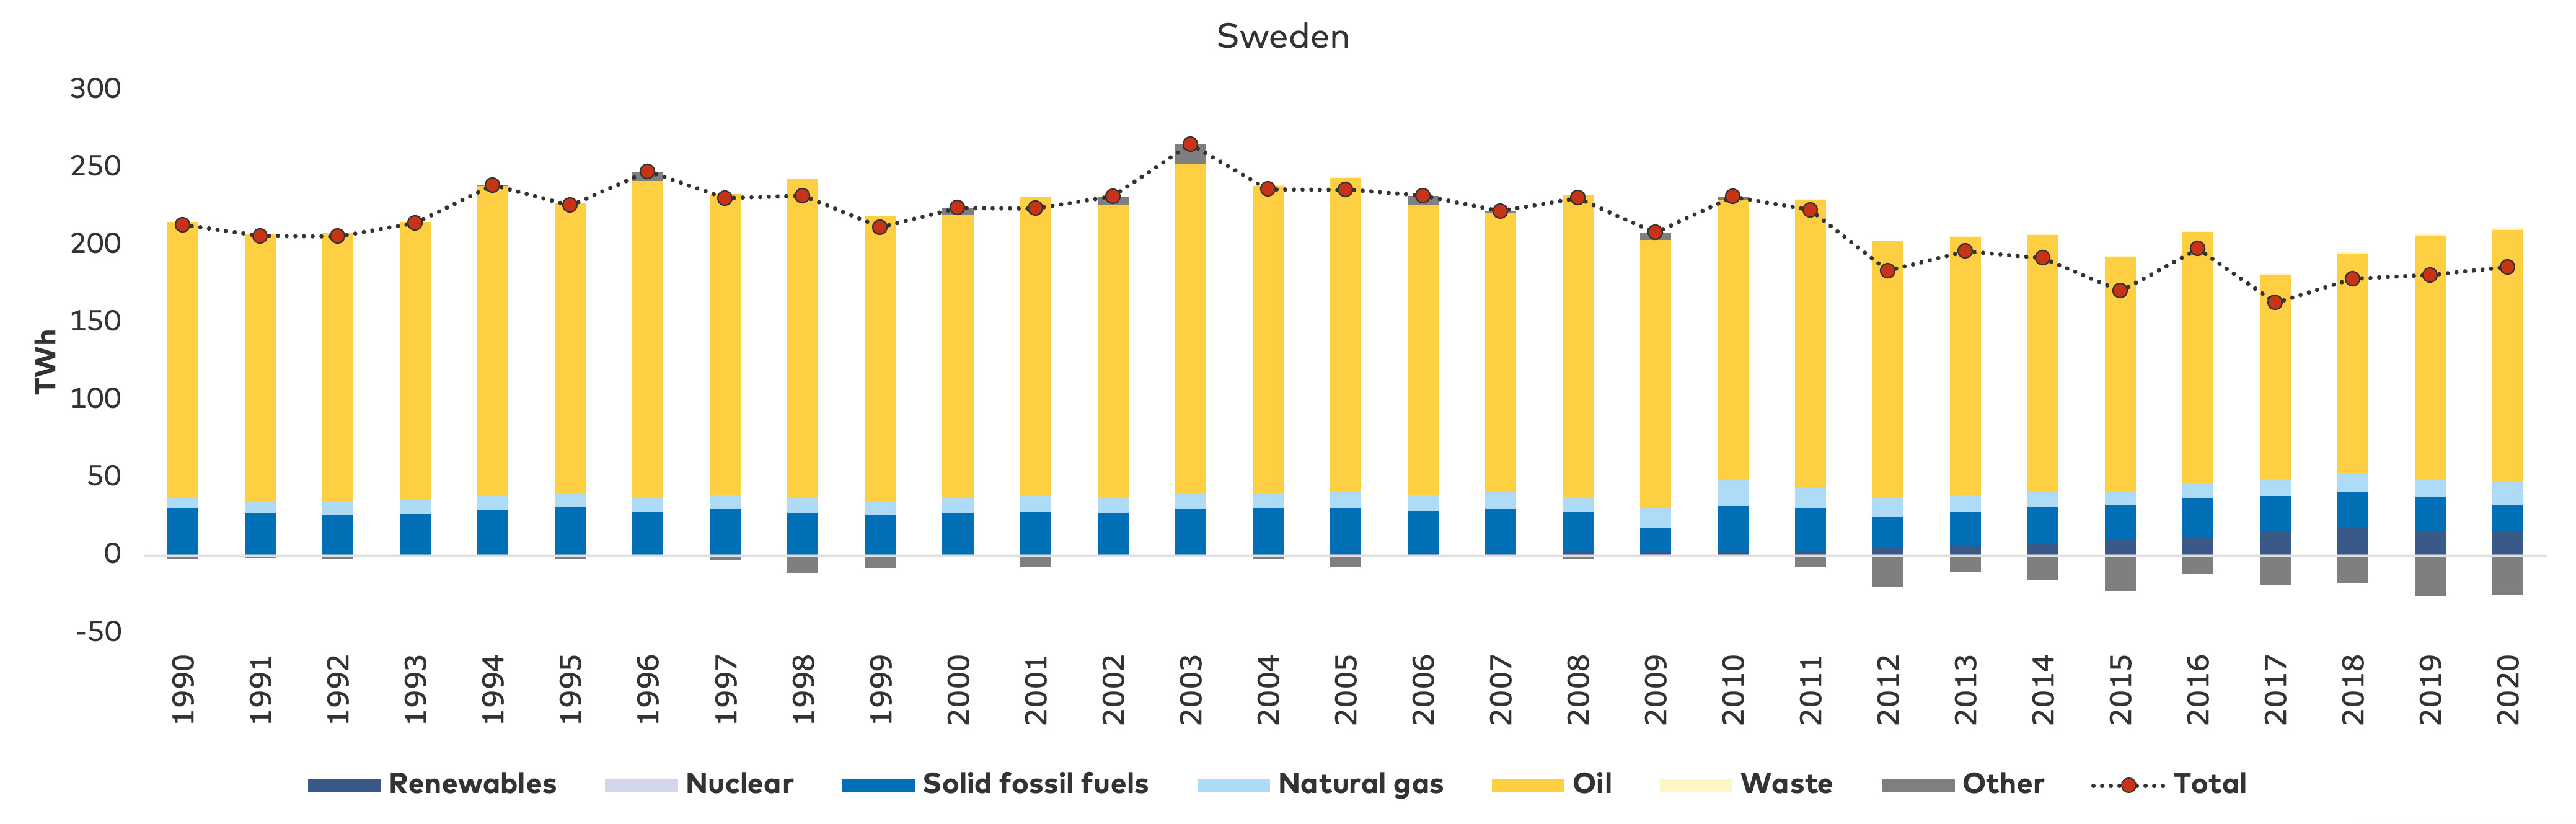
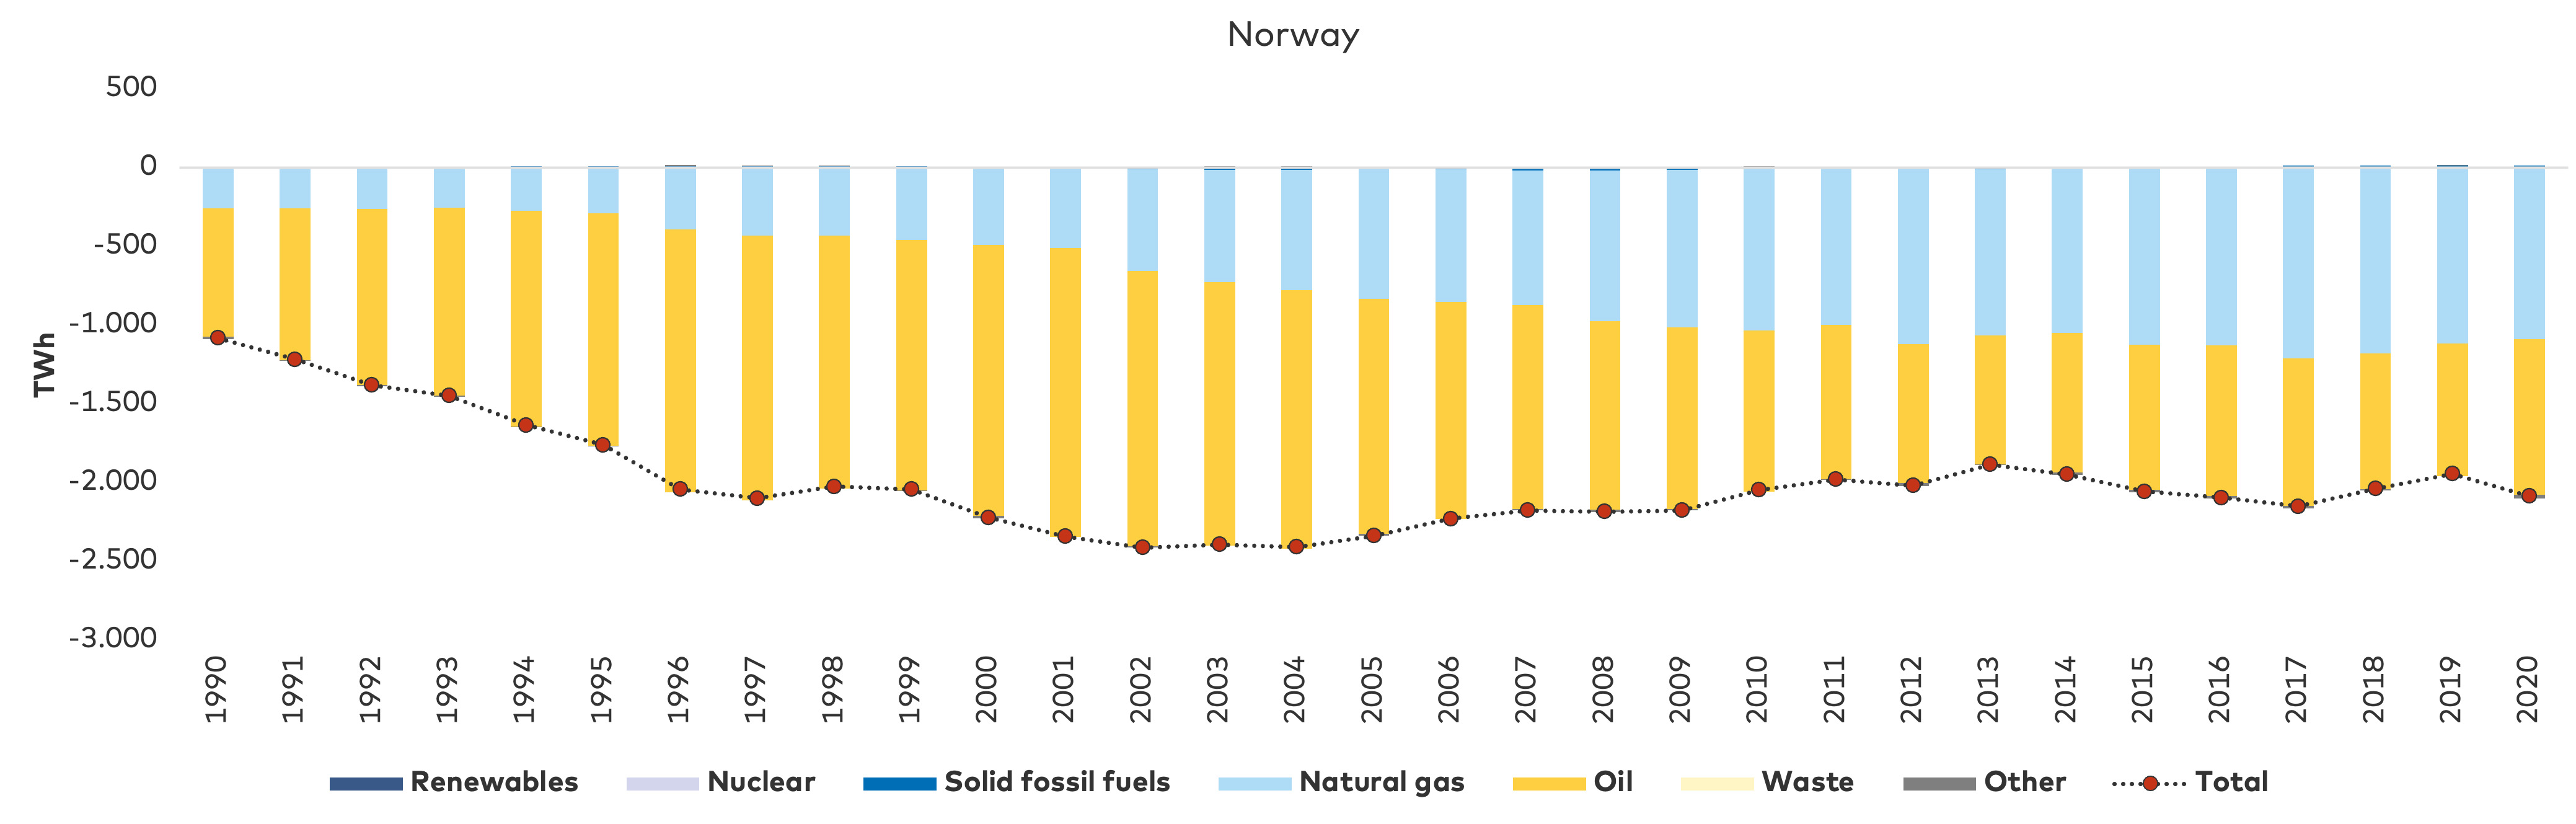
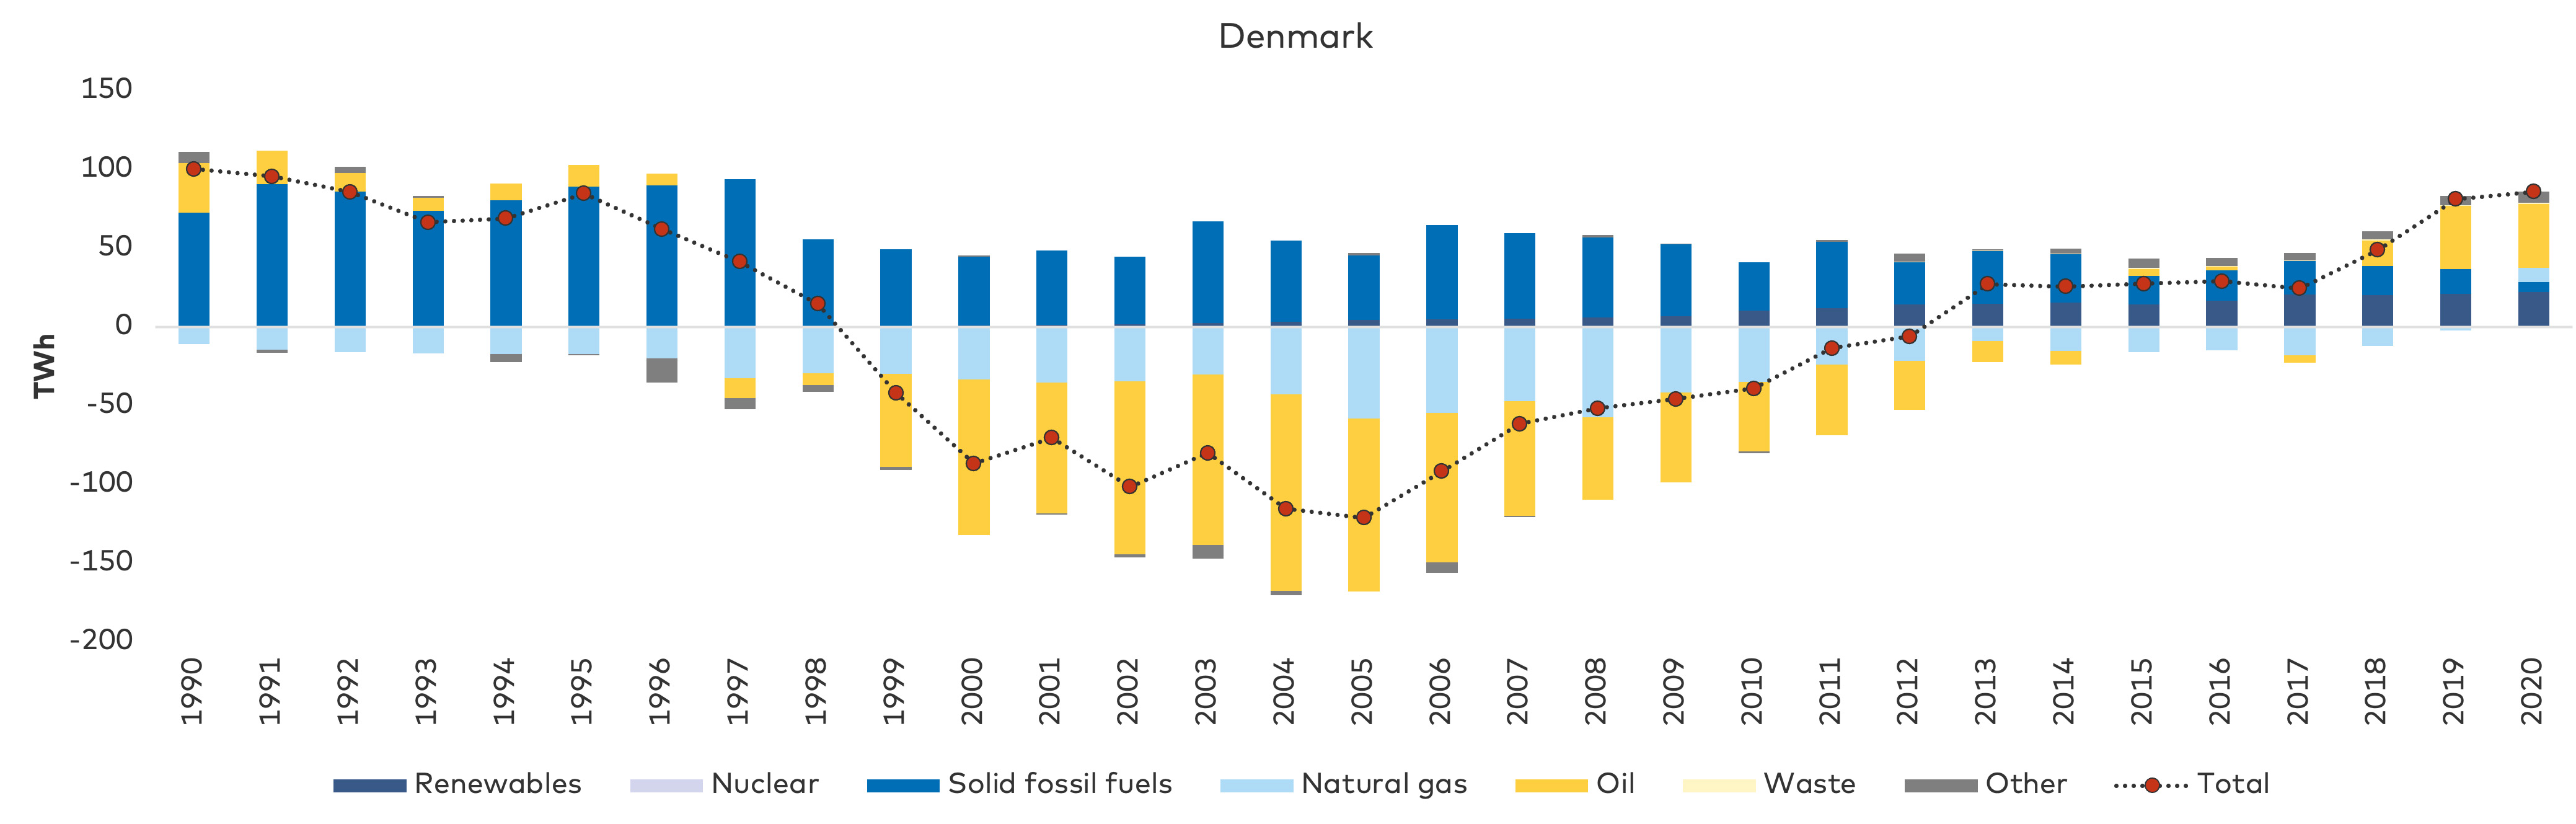
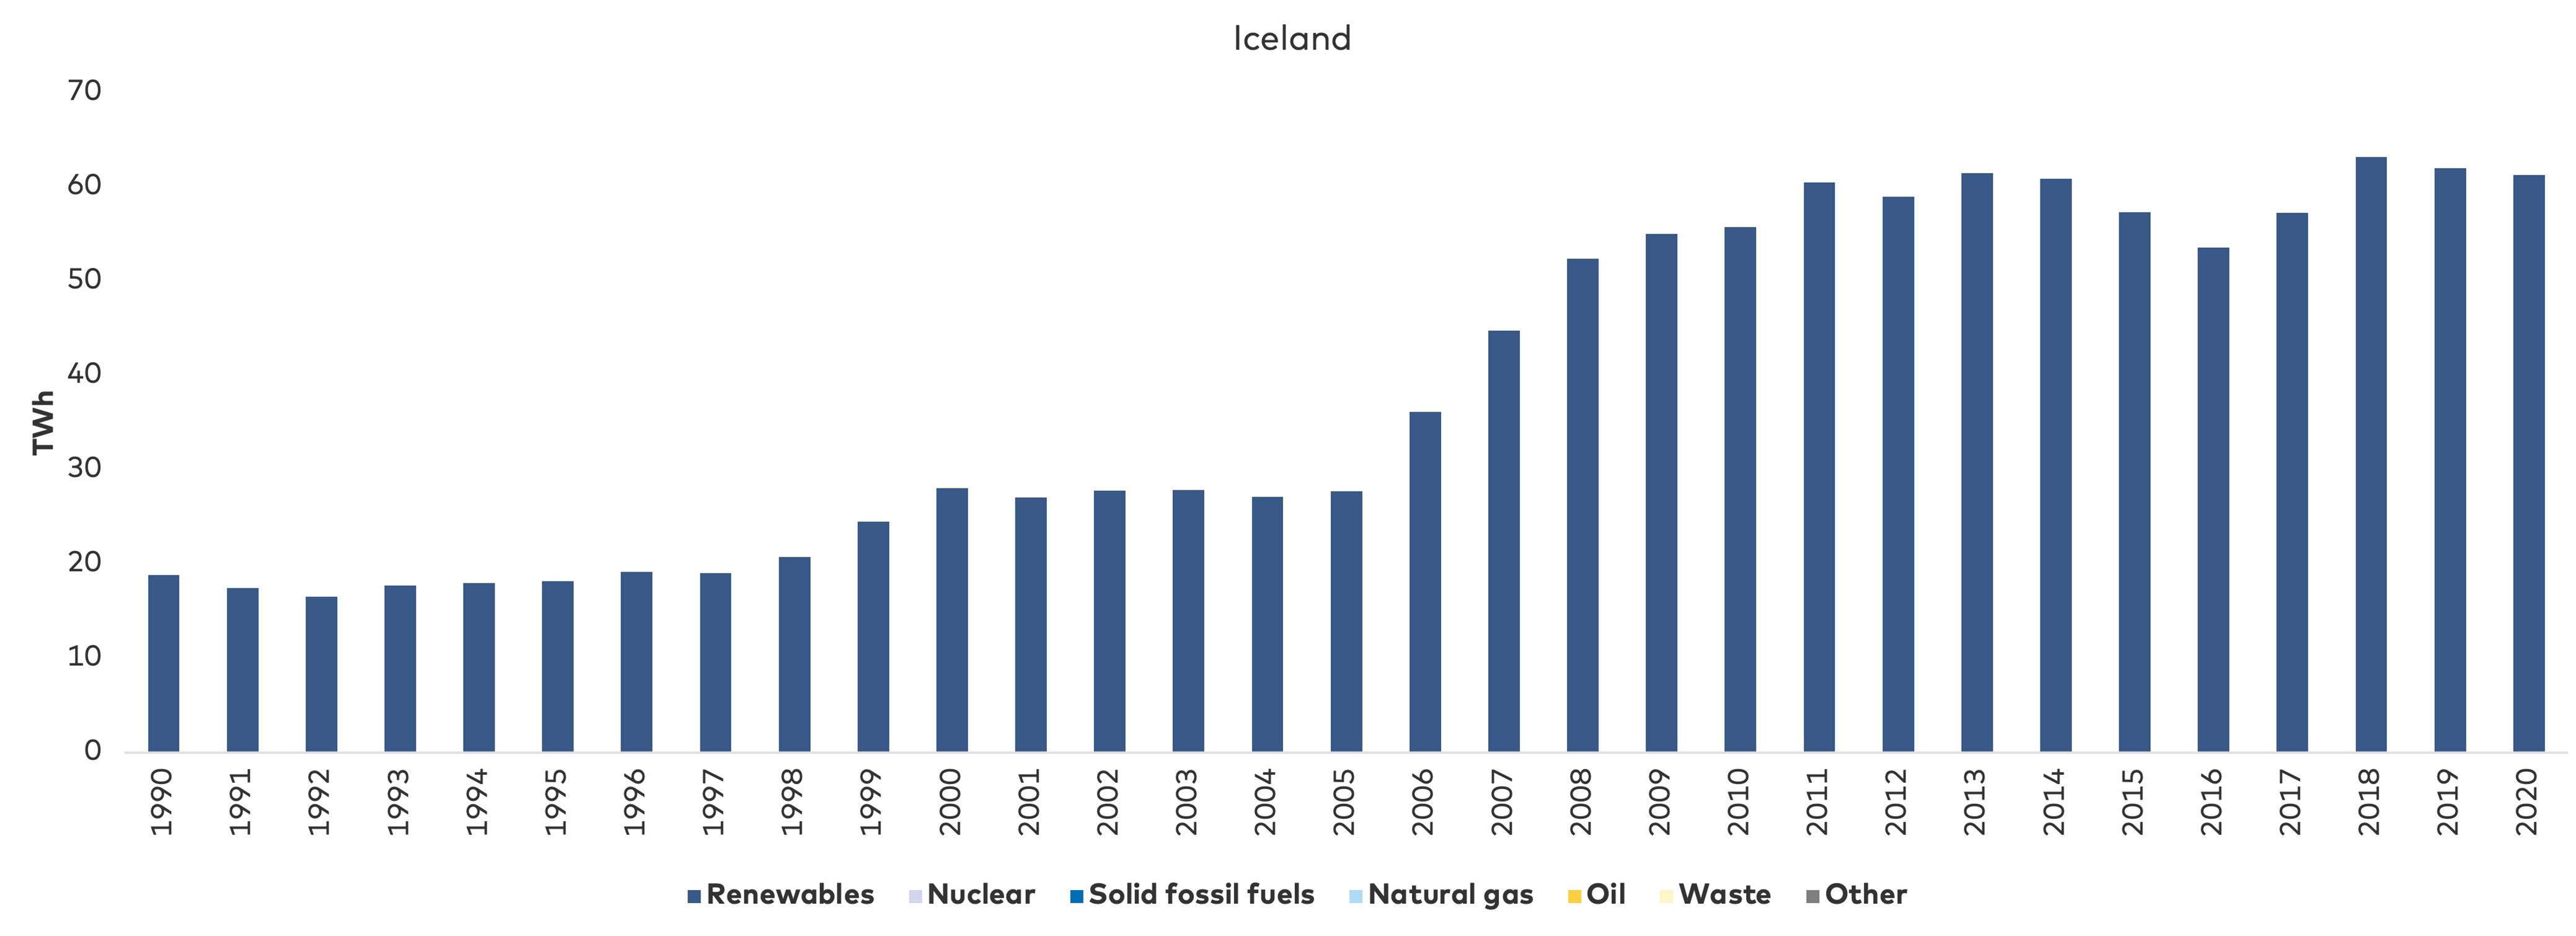
The Icelandic energy system is largely based on domestic energy production from renewables (hydro and geothermal) and the import of oil products. As shown in Figure 64, the country’s entire primary energy production is based on renewable energy.
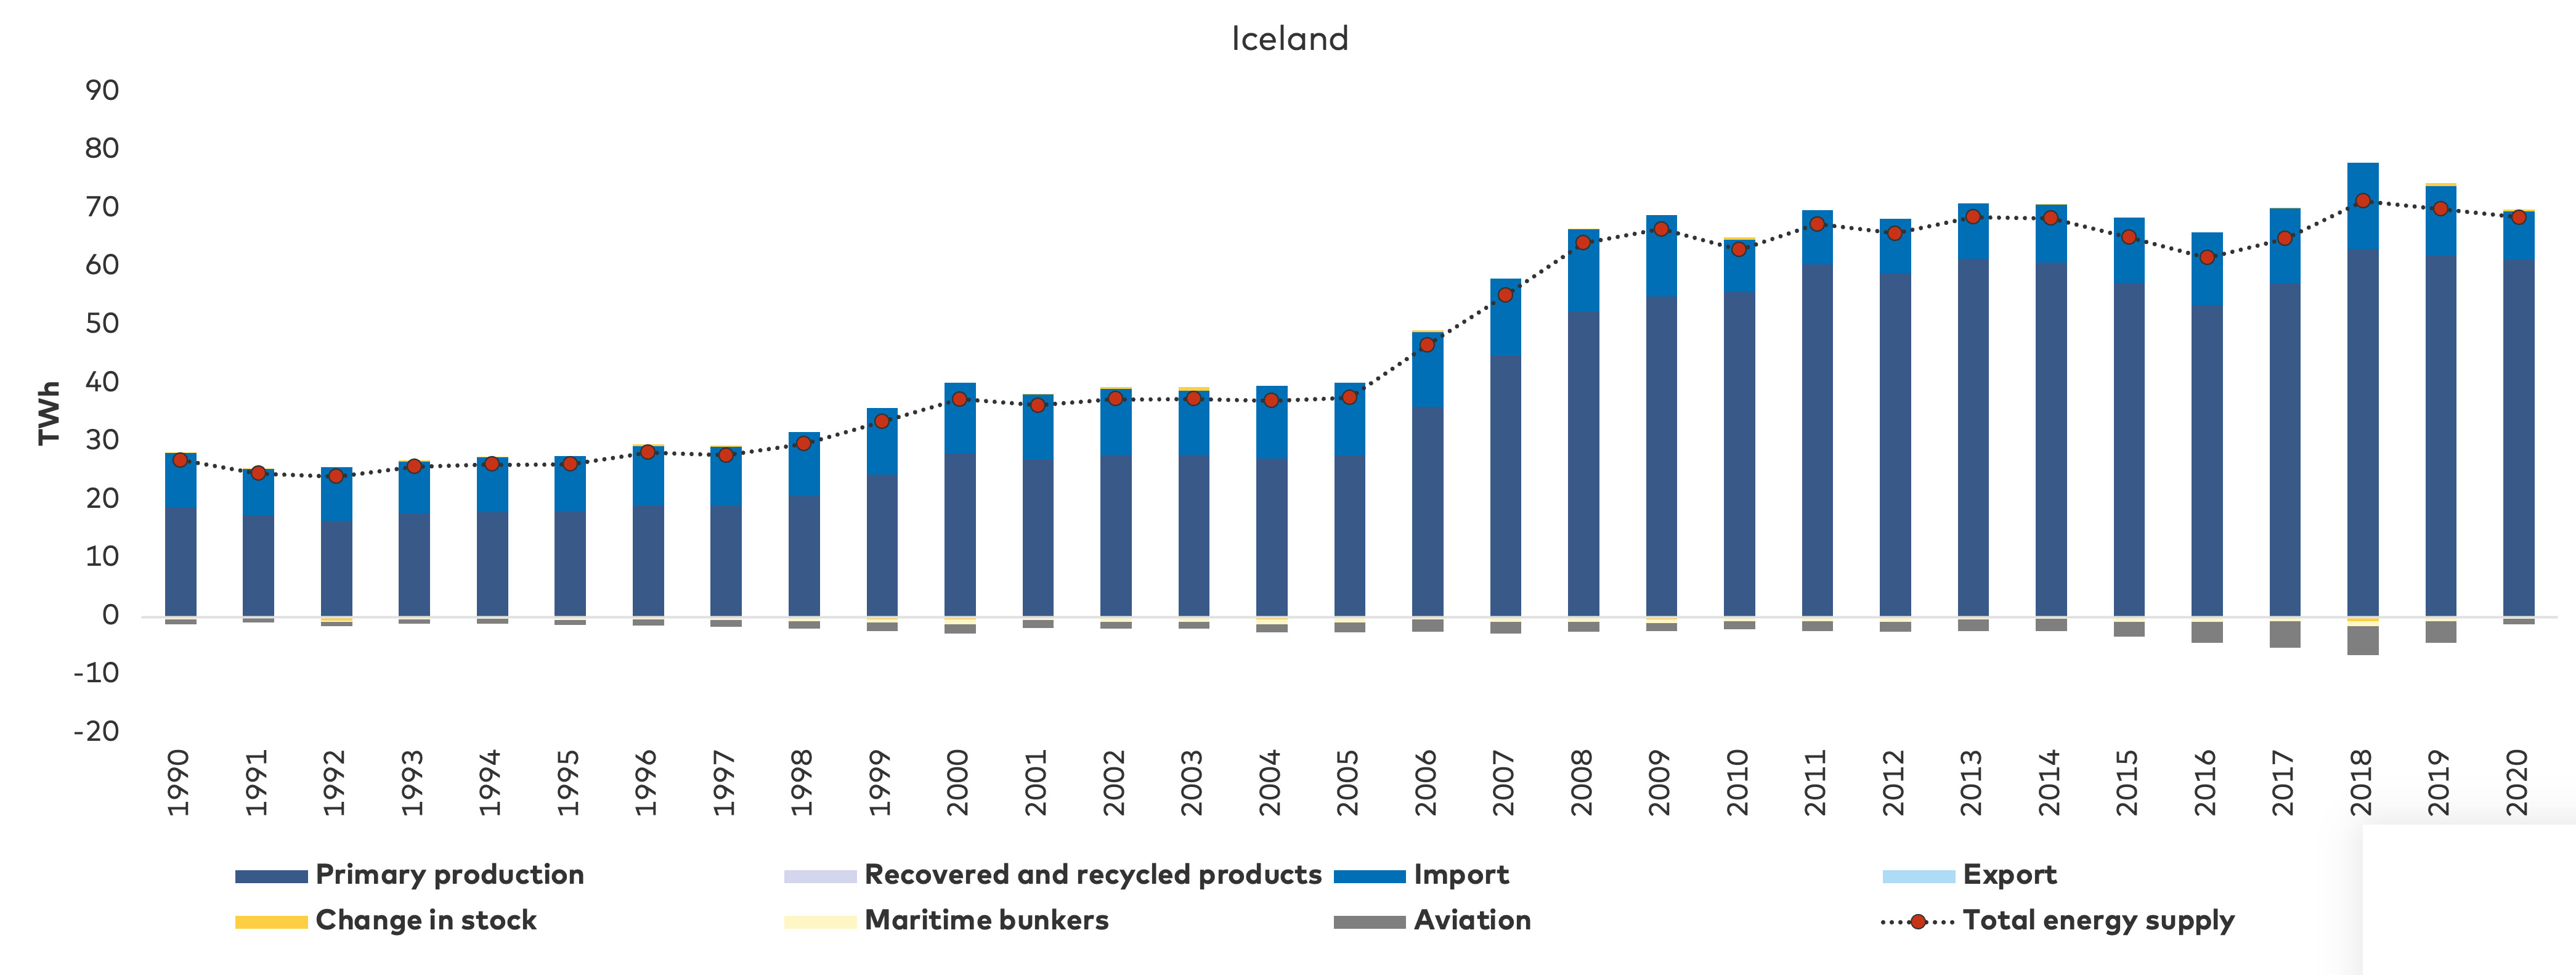
Figure 65, shows that a high percentage of Iceland’s total energy supply originates from domestic primary energy production.
11. APPENDIX 2: Brief descriptions of non-high risk factors
| NO. | RISK NAME | CATEGORY | OCCURENCE | IMPACT ON SECURITY OF SUPPLY | LIKELIHOOD | ||
| X = HIGH | X = LOW | ||||||
| 11 | GHG goals opposition | Social | Medium-term | | Some consumers believe that we are facing higher energy prices because the Nordic countries have tried to phase out fossil fuels too quickly and replaced them with insufficient renewable sources to reach the GHG reduction goals. Similar arguments have been made by some political parties who argue that we should either delay the phasing out of fossil fuels until the crisis has passed or the technology is sufficiently developed. These debates constitute a risk to security of supply if they lead to unbalanced decisions on which energy sources the Nordic societies should rely. | | According to the interviewed experts, debates on whether the green transition has been rolled out too quickly are already underway in the Nordic countries. The experts also indicated that resistance to the transition is being articulated by some political parties in the Nordic countries, who argue that the green transition should be postponed or stopped because the development of sustainable energy sources is not sufficiently developed. Consequently, political decisions could either postpone or block the implementation of more renewable energy. |
| 12 | Material intensity | Energy | Medium-term | | The material intensity of renewable energy technologies is significantly higher than for fossil-based technologies and requires increased extraction of raw materials. Given the competition for these materials on the global market and dependence on a small number of third countries for imports, there is a risk of not having access to necessary materials to increase security of supply through renewables. | | The likelihood of inadequate security of supply due to a lack of materials for build-out of renewable energy is noteworthy. This is because current investment plans in the metals and minerals supply chain are not geared to transforming the energy sector at an accelerated pace. |
| 13 | Decreased collaboration | Governance | Short-term | | Decreased collaboration on energy planning, build-out of transmission infrastructure, and energy trading across borders to favour short-term energy security gains impacts the system’s ability to balance supply and demand of increasing weather-dependent generation. This would reverse the positive welfare gains leveraged by the integration of the Nordic electricity markets over the past 20 years, including through interconnectors. | | The likelihood of reduced collaboration is assessed to be medium, primarily caused by the Norwegian government’s notification of potential decreased electricity exports through interconnectors. Given the status of Norway as the “battery” of the Nordics, the communication was worrying, in effect questioning future desire to collaborate in a similar situation. Although no specific political decisions have been implemented in the Nordic countries, the position shows that this is a possible future outcome. |
| 14 | Climate tunnel vision | Energy | Short-term | | Climate tunnel vision, making climate change mitigation the main or sole priority for governments and corporates, could influence the system’s ability to maintain security of supply and stable prices. This is because one likely outcome could be the closure of baseload fossil generation capacity before appropriate renewable solutions and transmission infrastructure are available. This in turn will impact the ability to deliver energy to consumers and alter the balance between the dimensions of the Energy Trilemma. | | The current energy crisis, by reemphasising security of supply and affordability concerns within the Energy Trilemma, has reduced the likelihood of climate tunnel vision, The distributional impact of higher prices (rather than higher carbon taxes) needs to be urgently addressed to support a just transition |
| 15 | Climate adaptation | Energy | Long-term | | Exposure to physical risks from climate change requires TSOs and energy generation owners to safeguard assets against a number of climate hazards. | | Due to the analysis of exposure to climate change hazards included in the EU Taxonomy DNSH criteria and the desire of energy companies to achieve a high Taxonomy-alignment score, the likelihood of assets not being operational due to climate change is assessed as medium. |
| 16 | Electrification | Energy | Long-term | | Electrification of multiple sectors of society requires significantly build-out of renewable energy. While plans have been made, there is a risk that we cannot build the necessary generation capacity to keep security of supply high, especially considering the volatility of wind and solar generation. | | There is a need for build-out of renewables to reach desired climate targets. However, given the current emphasis on exhausting wind resources in the North Sea and Baltic Sea, the likelihood of not having appropriate resources is assessed as medium |
| 17 | Delayed transition | Energy | Medium-term | | There is a general risk that the current energy crisis could delay the energy transition due to prolonged reliance on fossil fuels and longer lead times for infrastructure projects. Society would then not be able to increase independence and security. | | The likelihood of a delayed transition is indeed present, signalled by the extension of the operating lifetime of fossil-based capacity. |
| 18 | Corporate trading partners | Governance | Medium-term | | Acceleration of build-out of renewable energy to reach decarbonisation targets and increase energy independence could entail reliance on the same corporate trading partners in terms of manufacturing turbines or high-voltage cables. This could present an operational risk should the same technical fault occur in multiple assets simultaneously. | | While the risk is assessed to be low, the closure of 51% of France's nuclear facilities for maintenance simultaneously has shown that widespread technical faults can in effect be a systematic risk. |
| 19 | Inertia | Energy | Long-term | | Development of an electricity system based solely on renewable energy results in the challenge that there will be less spinning mass in the electricity system. Artificial inertia may be further developed together with synchronous generation. | | The issue of too little inertia in the electricity system is a real challenge that needs to be addressed when developing renewable energy. Technical solutions are available and will have to be developed, which is why the risk is only assessed as medium. |
| 20 | Energy company default | Governance | Short-term | | Energy companies that have entered into fixed-price electricity supply contracts face a risk of default when costs increase to higher levels than the supply contract, exposing the system to a risk that electricity cannot be delivered due to company defaults. | ") | The governments in Sweden, Denmark and Finland (where this has been a risk) have all made significant financial guarantees to avoid energy companies defaulting, in effect making the likelihood of default low. |
| 21 | Energy affordability (retail) | Social | Short-term | | The lack of economic access to affordable energy does not, as such, constitute a risk to security of supply. Rather, in situations where the supply is low, reducing general consumption of electricity could be an advantage. However, the lack of economic access to affordable energy has major consequences for the affordability of the Energy Trilemma. | | Economic access to affordable energy already constitutes a risk for retail consumers. This risk will potentially increase over time depending on how the market drivers develop during the winter and the coming months, and how politicians handle the situation. |
| 22 | Energy affordability (corporate) | Social | Short-term | | Companies dependent on energy for their production are significantly affected by the rising price of energy. As a result, some companies may be forced to shut down their production. The closure of businesses will essentially positively impact security of supply since, in theory, it will reduce energy consumption in general. However, some industries that develop equipment for the energy sector could potentially affect security of supply. | | According to the interviewed experts, the Nordic countries are already questioning whether the green transition has been rolled out too quickly. The experts also indicated that opposition to the green transition is being articulated by some political parties in the Nordic countries, who argue that the transition should be postponed or stopped because the sustainable energy sources have not been sufficiently developed. Consequently, decisions could either postpone or block the implementation of more renewable energy. |
12. APPENDIX 3: National responses to relieve pressure on household finances
| RESPONSE AND INTENDED EFFECT | DENMARK | FINLAND | NORWAY | SWEDEN |
| Subsidy/grant/cheque | 1. In the ‘Winter Package’ for 2022 the following initiatives were adopted to reduce costs: increase in the start-up aid pool, increase the subsidy for decoupling from the gas grid. 2. Compensation for rising energy prices targeted pensioners and other social security recipients (worth €218.7 mill.): - Recipients of supplementary pension payments will receive an additional tax-free €672 split into two payments at a total cost of €151 mill.. - State education grant (SU) recipients, who also already receive a supplementary grant for the disabled or being a carer will receive an additional tax-free €269, at a total cost of €3.1 mill. - People on early pension schemes will receive an additional tax-free €269 (to be received early 2023). At a total cost of €64.6 mill.. 3. One-time subsidy payment “heating cheque” of €807 for households with low incomes and certain heating types, at a total cost of €269 mil.. 4. Heating package 1 included 3 measures to address rising costs: - municipalities can apply for compensation directly for additional expenses - agreement with companies to equalise heating bills - strengthening public information on energy preservation. 5. Change from instalment payment to monthly payment allowing consumers to keep track of costs. 6. Accelerate the phasing-out of fossil fuels in district heating production. DKK25 million has been set aside in 2023 to support district heating companies that provide subsidies for large heat pumps and solar heating systems at district heating plants. | The government allocated direct grants to the agricultural sector worth €219 mill. in direct support. | 1. When the average market price (electricity spot price) for the month in a household exceeds 0.7 NOK/kWh, the state covers a certain percentage above the cap (household consumption of up to 5.000 kWh per month). 80% of the surplus price from January–September 2022, rising to 90% from October–December 2022. 2. Temporary subsidy scheme for voluntary organisations due to exceptional electricity prices. Operates in the same way as electricity subsidy schemes for households with an 80% subsidy when the average price is above 0.7 NOK/kWh". 3. Increased grant framework for municipalities of 300 mill. NOK (€29.46 million) in 2022 to cover increased social assistance payments due to high electricity prices. 4. Temporary subsidy scheme for agricultural and greenhouse enterprises. Modelled on the household scheme. For agriculture, the scheme is limited to a maximum consumption of 20,000 kWh/enterprise. There is no maximum limit for greenhouses. 5. Increase in housing benefit allocation totalling NOK 1.9 billion. (€0.19billion) in 2022 to alleviate the situation of high electricity prices. Limits vary between municipalities and depending on the number of residents in households. 6. One-time payment of NOK 3,000 (€294.6) to students who have paid for electricity in addition to their rent and who received a loan/grant from the Loan Fund between 16 January and 15 June 2022. | 1. From December 2021 through February 2022, all Swedish households were eligible for some form of electricity compensation. The measure is stepped: The higher the consumption, the higher the compensation. Households had to consume at least 700 kWh/month to be eligible for monthly compensation for the three months. The highest step is 2.000 kWh/month where households would receive SEK 2,000 a month for the three months. 2. Electricity price compensation scheme for the month of March 2022 covering households in electricity areas 3 and 4, i.e., southern and central Sweden. Also designed in steps. The lowest consumption threshold is 400 kWh (min support of SEK 100 = €9.19) in March and a maximum of 2,000 kWh (max support of SEK 1,000 = €91.9). 3. A support package for agricultural enterprises and the fishing industry as a one-time subsidy, consisting of four measures: - Extended support for the animal sector – SEK 1.6 bill. - Retroactive diesel tax refund – app. SEK 400 mill. - Extended support for northern Sweden farms - app. SEK 50 mill. - Support for professional fishing - app. SEK 40 mill. |
| Lower energy tariffs/taxes | 1. The electricity tax will be cut from 69.7 cents/kWh in 2023 to 0.8 cents, which is an EU minimum. The reduction will last for 6 months. 2. In the Winter Package the following initiatives were passed to reduce costs: - reduction in electricity tax for heat pumps - reduction in electricity tariffs via bottleneck revenues. | To mitigate the sharp rise in electricity prices, the government will lower the Value Added Tax rate from 24% to 10% between December 2022 and April 2023. | A national reduction in electricity tax of NOK 2.9 bill. (€0.28 bill.). .08 NOK/kWh reduction from January-March 2022, dropping to 0.015 NOK/kWh from April–December 2022. The measure will result in annual savings of NOK 750 (€73.2) for an average household. | No responses identified in this category. |
| Incentivize energy efficiency/technology change | In the Winter Package for 2022 the following initiatives were passed to reduce expenses: economic support for help replacing gas boilers and roll-out district heating and heat pumps. | The guarantee model allows funding to be allocated to investments that improve energy efficiency e.g. of buildings. In addition, funding may be used to renew buildings’ heating systems so that they can utilise renewable forms of energy, such as geothermal heat, wind or solar energy. | In 2022, the government increased support for the Enova Foundation, of which NOK 100 mill.(€9.76 million) is earmarked for energy measures to reduce electricity bills in municipal housing. | No responses identified in this category. |
| Postponements of bills | 1. Possibility of voluntary deferral of extra energy bills for Danish citizens and businesses. | No responses identified in this category. | No responses identified in this category. | No responses identified in this category. |
| Information campaigns | The Danish Energy Agency published information on how households can save energy at home. | The Finnish government launched “A degree lower”, a communication campaign aimed to motivate and inform the population about the need and ways to save energy during the upcoming winter. | Private companies launched information campaigns targeting Norwegian households with information on how to save energy. | The Swedish Energy Agency launched the campaign ‘Every kilowatt hour (kWh) counts’ informing consumers why energy needs to be saved to reduce the risk of shortages and electricity costs, and to show solidarity. |
| Public energy savings | With the realisation of a potential energy shortage, public buildings were targeted for the winter months. All public buildings and workplaces were recommended to lower the temperature to 19 degrees, unless special conditions require the temperature to be higher. The municipalities and regions were urged to implement the reduction by 1 October 2022, at the latest. The measure was mandatory for government buildings. | No responses identified in this category. | No responses identified in this category. | No responses identified in this category. |
| Tripartite negotiations | No responses identified in this category. | No responses identified in this category. | In September, 2022, the employer organization Samfunnsbedriftene reached an agreement with the employee organisations on a new Energy Agreement I and Energy Agreement II, which will apply for the period 2022–2024. The following actions areas are included in the agreement: wage adjustments and minimum wage rates, employee representative duties, skills enhancement measures, sustainability and climate, data and access technology and pension and senior citizen policy. | No responses identified in this category. |
| Investment in research | No responses identified in this category | The Finnish government has approved EUR 100 mill. in participation in a € 700 mill. program called InvestEU, which promotes investments in clean technology for SMEs, households and housing companies. | No responses identified in this category | No responses identified in this category |
| = Implemented initiative | = Decided not implemented yet | = Not adopted | ||
About this publication
The Nordic Energy Trilemma
Security of Supply, Prices and the Just Transition
Prepared by Ramboll Management Consulting and Ramboll Energy
© Nordic Energy Research 2023
http://doi.org/10.6027/NER2023-02
Cover photo: AdobeStock
Photos: Pexels and Unsplash
Layout: Mette Agger Tang
Published: March 2023
Nordic Energy Research
Nordic Energy Research is an institution under the Nordic Council of Ministers which manages and finances international research programs and projects that add value to national work in the Nordic countries. In addition, we perform certain secretariat and analytical functions in the energy policy cooperation under the Nordic Council of Ministers.