
- Front page
- Contents
- Foreword
- Acknowledgement
- Reader’s Guide and How to Use This Report
- Supplementary Data
- Conclusions
- Abbreviations
- Chapter 1 District Heating and Potential Heat Sources in the Baltic States
- 1.1 Key findings
- 1.2 District heating today
- 1.3 Heat pumps today
- 1.4 Characteristics of existing district heating areas
- 1.5 High-temperature heat sources
- 1.6 Low-temperature heat sources
- 1.7 Excess heat potential of heat sources used by large-scale heat pumps
- 1.8 Low-temperature heat source potential based on GIS proximity analysis
- 1.9 Example of three district heating areas with access to heat sources
- Chapter 2 Modelling the Future of Power and Heat Supply in the Baltic States with Heat Pumps
- 2.1 Key findings
- 2.2 Previous modelling results relevant for HPs in future energy scenarios in the Baltics
- 2.3 Current practice of heat pump representation in energy planning
- 2.4 Our modelling approaches
- 2.5 Energy system development
- 2.6 Scenario analysis of the future of district heating in the Baltics
- 2.7 Summary of results for each Baltic state
- 2.8 Sensitivity analysis
- Chapter 3 Drivers Behind Widespread Adoption of Heat Pumps and Cooling Technologies
- 3.1 Key findings
- 3.2 Power-to-heat technologies and their drivers
- 3.3 Danish experiences on large-scale heat pumps for district heating
- 3.4 Large-scale heat pumps for district cooling
- 3.5 A potential Baltic path for large-scale heat pumps
- Chapter 4 Socio-Economic Impact of Power-to-Heat Solutions on the Heating Sector
- 4.1 Key findings
- 4.2 Impact on individual consumers when switching to power-2-heat technologies
- 4.3 Development of the heating market considering the implementation of large-scale heat pumps
- 4.4 Potential for electrification of the industrial sector
- Annex 1 District heating demand and temperatures
- Annex 2 Modelling methodology
- Annex 3 Baltic energy systems in the Nordic and Baltic energy markets
- Annex 4 Assumptions for calculating the cost of individual HPs
- List of References
- About this publication
MENU
Foreword
For a long time, Nordic Energy Research and the Baltic countries have worked closely to develop a thriving exchange of knowledge that adds value to the Nordic-Baltic region. We share many of the same energy challenges on our path toward achieving carbon-neutrality in our respective countries. Therefore, it is in our common interest to cooperate and create opportunities together. An important area of common ground is district heating and cooling.
District heating and cooling networks are widespread in most Nordic and Baltic countries. The coupling of the common Nordic-Baltic electricity market to local district heating via power-to-heat, offers large comparative advantages with respect to flexibility of source, potential synergies, and economic considerations. It also facilitates the deployment of renewable energy, decarbonization of the electricity and heat sectors, as well as ensures a cost-effective energy supply.
This report illustrates the considerable potential and benefits of using heat pumps and electric boilers, which are promising options for curbing climate-warming emissions and developing the heating- and cooling markets in the Baltic countries.
I hope that this report sheds light on the possibilities associated with heat pumps and highlights their significance for the green transition in the Nordic-Baltic region. With growing interest, research must advance to reach our ambitious climate and energy goals by 2030.
During the last couple of years, Baltic researchers have been involved in several other projects that Nordic Energy Research has initiated and funded, among which are the comprehensive reports Baltic Energy Technology Scenarios (2018) and Transport Statistical Data and Projections in The Baltic States (2020). After these successful collaborations, we are once again pleased to publish a report carried out with Baltic management.
Klaus Skytte
CEO, Nordic Energy Research
Acknowledgements
The report on heat pump potential in the Baltic states is a collaborative project between Tallinn University of Technology (TalTech), School of Engineering, Department of Energy Technology and Nordic Energy Research (NER) – an intergovernmental organisation under the Nordic Council of Ministers, and jointly funded by Nordic Energy Research and the Baltic States’ ministries responsible for the energy sector.
Kevin Johnsen and Nicki Carnbrand Håkansson at Nordic Energy Research were the coordinators of the project.
Anna Volkova at Tallinn University of Technology was the analytical project manager and had overall responsibility for the design and implementation of the study.
Team at Nordic Energy Research
Kevin Johnsen
Senior Adviser
kevin.johnsen@nordicenergy.org
Nicki Carnbrand Håkansson
Adviser
nicki.hakansson@nordicenergy.org
Team at Tallinn University of Technology
The following researchers at Tallinn University of Technology carried out the report and the analysis:
Anna Volkova
Senior Researcher, PhD
Head of Research Group
Smart District Heating Systems and Integrated Assessment Analysis of GHG Emissions
Department of Energy Technology
anna.volkova@taltech.ee
Henrik Pieper
Postdoctoral Researcher, PhD
Department of Energy Technology
henrik.pieper@taltech.ee
Hardi Koduvere
Junior Researcher
Department of Electrical Power Engineering and Mechatronics
Kertu Lepiksaar
Junior Researcher
Department of Energy Technology
Andres Siirde
Director of Department, Professor
Department of Energy Technology
The report was proofread by Bella Joffe-Eisler.
Steering group and funding body
The work was funded by the Joint Baltic-Nordic Energy Research Programme and guided by its Board, composed of:
- One representative appointed by the Ministry of Economic Affairs and Communications, Estonia,
- One representative appointed by the Ministry of Economics, Latvia,
- One representative appointed by the Ministry of Energy, Lithuania,
- Two representatives appointed by Nordic Energy Research.
The individuals and organizations that contributed to this study are not responsible for any opinions or judgements contained in this study.
Contact
Comments and questions are welcome and should be addressed to:
Kevin Johnsen, Nordic Energy Research, e-mail: kevin.johnsen@nordicenergy.org
Anna Volkova, Tallinn University of Technology, e-mail: anna.volkova@taltech.ee
For enquiries regarding the presentation of results or distribution of the report, please contact Nordic Energy Research.
Additional materials, press coverage, presentations etc. can be found at www.nordicenergy.org.

Reader’s Guide and How to Use This Report
The report is split into four main chapters covering modelling results, assumptions and approaches. A description of the key findings can be found at the beginning of each chapter. Below is a brief explanation of what to expect in each chapter and how this information can be used.
Chapter 1: District Heating and Potential Heat Sources in the Baltic States
This chapter provides an overview of the current stage of development of district heating and heat pumps in each Baltic country. District heating areas and high- and low-temperature heat sources were identified, analysed and described in detail for each Baltic state. GIS software was used to perform spatial analyses. The theoretical and practical possibilities of large-scale heat pumps using heat sources to supply district heating were calculated. Examples of using a GIS map for further analysis by, for example, urban developers, public authorities and/or utility companies, are provided at the end of the chapter.
Chapter 2: Modelling the Future of Power and Heat Supply in the Baltic States with Heat Pumps
This chapter provides an overview of modelling results from previous projects related to the Baltic region. A brief description of the current approaches to modelling heat pump performance and investments is given, while the modelling approach for this project is detailed. The results of modelling the energy system of the Baltic region are described in detail. Based on the socio-economic analysis, various possible scenarios for the future development of the Baltic energy system until 2050 were explored. The focus of the results is on the implementation of large-scale heat pumps and heat sources used for this. The results can be used to give an idea of how many heat pumps can be installed in the future, as well as which heat sources will be most relevant to use and in which district heating areas.
Chapter 3: Drivers Behind Widespread Adoption of Heat Pumps and Cooling Technologies
This chapter describes the auxiliary instruments and conditions that are beneficial for the implementation of large-scale heat pumps. Power-to-heat technologies and their advantages are described in the chapter. The relevance of the power sector and the importance of the district heating sector are also highlighted. For each Baltic state, the existing power sector is described in detail, including the generation mix, the share of renewable energy sources, national energy and climate plans, and current support mechanisms. In addition, the successful integration of large-scale heat pumps in Denmark was analysed and described. Potential applications of large-scale heat pumps for district cooling are also described. Based on the current conditions in each Baltic state and the auxiliary instruments identified in Denmark, a potential way of creating an environment conducive to the implementation of large-scale heat pumps in the Baltic states was outlined.
Chapter 4: Socio-Economic Impact of Power-to-Heat Solutions on the Heating Sector
This chapter provides an overview of how individual heat pumps compete with conventional natural gas, oil and biomass-fired boilers in terms of cost and sustainability. Furthermore, the economic and environmental effects of operating large-scale heat pumps are comparable to those of conventional district heating production plants such as natural gas/biomass boilers and combined heat and power plants. Potential plant types that could be replaced by large-scale heat pumps were identified. Potential areas and sectors of application of heat pumps in the industry are described in general and for the Baltic states in particular. The most relevant industrial sectors for the Baltic states are described along with their typical processes and temperature ranges, as well as common barriers hindering the implementation of industrial heat pumps. The results can be used to determine how small and large-scale heat pumps compete with competing technologies at the building, industrial and district heating levels.
Supplementary Data
A publicly available database was created for Estonia, Latvia and Lithuania.
Each file contains the following information:
-
An overview and explanations for the database;
-
Measurements of low-temperature heat sources, such as the temperature of ambient air, seawater, lake and river water for various locations in 2019;
-
A list of all identified high-temperature heat sources from industries and heat production plants, as well as information about them and how they have been categorised;
-
An overview of all identified district heating areas and information about them, particularly about their access to heat sources;
-
Calculations and assumptions for heating degree days, hourly heat demand, district heating temperatures, heat pump performance, and investments.
The public databases are available here:
Database for Estonia
Database for Latvia
Database for Lithuania
Furthermore, an online GIS map was created that includes an overview of the geographic location of the identified district heating areas and high and low-temperature heat sources in Estonia, Latvia and Lithuania. In addition, each item contains information about its characteristics.
The online GIS map and datasets are available here:
Conclusions
The main conclusions from this report are the following:
Chapter 1: District Heating and Potential Heat Sources in the Baltic States
-
Most of the residents of the Baltic countries have their heat supplied via district heating (62% in Estonia, 65% in Latvia, and 58% in Lithuania), which is well above the EU average of 26%.
-
Information on 184 (EE), 111 (LV), and 56 (LT) district heating areas was collected and analysed.
-
Seawater, lakes, rivers, and sewage water were considered as low-temperature heat sources for large-scale heat pumps. Measurements were obtained from 12 (seawater), 17 (rivers), 7 (lakes), 1 (sewage water), and 18 (ambient air) locations.
-
Information on 174 (EE), 106 (LV), and 99 (LT) potential high-temperature heat sources for large-scale heat pumps was collected and analysed (industrial excess heat and flue gases from heat production plants).
-
The identified industrial sectors, sorted by primary energy consumption, include: chemicals (17350 GWh), cement (5622 GWh), wood (4513 GWh), other (2665 GWh), refineries (2289 GWh), food (1875 GWh), paper (1111 GWh), asphalt (715 GWh), brick (322 GWh), other minerals (271 GWh), pharmaceuticals (262 GWh), and metal production (39 GWh).
-
The theoretical industrial excess heat potential was determined to be 3370 GWh (EE), 1199 GWh (LV), and 2490 GWh (LT), of which 2/3 can be supplied directly, and 1/3 via large-scale heat pumps. The theoretical excess heat potential of flue gas from boilers and combined heat and power plants was 590 GWh, 949 GWh and 650 GWh in Estonia, Latvia and Lithuania, respectively.
-
High excess heat potential was calculated, in particular, for the chemical sector and the cement industry (there is 1 large cement factory in each country). Other sectors with high excess heat potential are refineries (EE), wood (EE, LV), asphalt (EE), and food (EE, LV, LT), as well as boilers (EE, LV, LT) and combined heat and power plants (EE, LV, LT) for flue gas utilisation.
-
Spatial analysis was used to identify heat sources located within existing district heating areas and within 1 km. The practical potential of industrial excess heat sources located in district heating areas was 2601 GWh, 394 GWh, and 436 GWh in EE, LV, and LT, respectively. For industrial excess heat sources located within 1 km from district heating areas, the additional potential was 322 GWh (EE), 110 GWh (LV), and 1730 GWh (LT). For boilers and combined heat and power plants, the potential in the district heating areas was 445 GWh (EE), 901 GWh (LV), and 413 GWh (LT).
Chapter 2: Modelling the Future of Power and Heat Supply in the Baltic States with Heat Pumps
-
The largest district heating areas in each Baltic country were modelled individually (8 in Estonia, 7 in Latvia and 13 in Lithuania). Smaller district heating areas were aggregated to provide a high level of detail, but also for quick calculations based on detailed information about each district heating area in order to identify similarities.
-
In the Base scenario, large-scale heat pumps account for up to 54% and biomass-based production plants account for 33% in 2050. Natural gas use is expected to decline steadily from 7.9 TWh in 2020 to 1.4 TWh in 2050.
-
In the Grid Tariffs scenario, the least amount of heat was generated by large-scale heat pumps. It can be concluded that current grid tariffs are hindering heat pump implementation. The share of large-scale heat pumps in heat generation in 2050 will be only about 24%.
-
In the Invest Support scenario, investments in large-scale heat pumps are subsidised by 50%, which has a big impact on heat pump implementation. In 2050, up to 68% of heat will be generated by heat pumps.
-
Storage facilities can play a significant role in the future of district heating systems regardless of the scenario. However, the synergy is greater with heat pumps than with other technologies. They can help balance the power grid by means of, for example, storing the heat generated by large-scale heat pumps, which is sometimes necessary for the power grid.
-
Large-scale heat pumps, together with heat storage facilities, are essential to effectively reduce greenhouse gas emissions.
-
Excess heat is the most competitive heat source, but its availability in the Baltic states is limited. Treated sewage water is the next most competitive heat source, characterised by comparably high temperature for a low-grade heat source, high capacity, and close proximity to district heating areas. Additionally, seawater and river water were proposed based on the availability of other heat sources.
-
In 2050, under the Base scenario, the proportions of heat supplied by large-scale heat pumps, biomass-based plants, and natural gas-fired plants in Estonia will be about 61%, 23%, and 7%, respectively. In Latvia, the proportions for the same technologies will be about 55%, 25%, and 13%, respectively. In Lithuania, the proportions of heat supplied via large-scale heat pumps, biomass-based plants, and natural gas-fired plants will be about 50%, 42%, and 5%, respectively.
-
Sensitivity analysis showed that large-scale heat pumps often compete directly with biomass, and the relationship with heat production from natural gas is insignificant. The results change dramatically compared to the Base scenario when the price of biomass changes, but not as drastically when the price of CO2 changes.
Chapter 3: Drivers Behind Widespread Adoption of Heat Pumps and Cooling Technologies
-
The benefits of power-to-heat technologies include avoiding the curtailment of renewable energy production, providing flexibility on the demand side, utilising existing thermal storage capacities, providing grid ancillary services, and increasing self-consumption via renewable local generation.
-
The current electricity production in each Baltic state is as follows: Estonia uses mainly oil shale for power generation, which leads to high specific CO2 emissions. Power generation in Latvia is mainly based on hydropower and natural gas. Electricity generation in Lithuania has undergone major changes since nuclear power was phased out in 2010. The share of generated electricity compared to final electricity consumption in Lithuania was only 32%, while in Estonia and Latvia it was 84% and 91%, respectively. The share of power generated using fluctuating renewable sources in 2019 was 9% in EE, 2% in LV, and 13% in LT.
-
Denmark has shown a potential way to integrate a high share of renewable energy sources into energy systems with large-scale heat pumps supplying district heating. Since 2010, 106 heat pumps, each with a thermal capacity of over 100 kW, have been installed in Denmark to supply heat to district heating networks.
-
Using large-scale heat pumps to simultaneously supply district heating and cooling is very economical. Although the district cooling potential in the Baltic states is limited, the heating and cooling synergy regions will benefit from district cooling supplied by large-scale heat pumps.
-
The following drivers for the implementation of large-scale heat pumps have been identified: district heating network ownership structure, low district heating operating temperatures, high proportion of residents supplied by district heating, experience with large-scale heat pumps, political targets for sustainable energy supply, suitable tax and tariff system, sustainable power generation, and high share of fluctuating renewable energy sources.
Chapter 4: Socio-Economic Impact of Power-to-Heat Solutions on the Heating Sector
-
A cost-analysis was performed for individual air-source and ground-source heat pumps in existing and new stand-alone houses and apartment buildings. Considering the levelised cost of heat, individual heat pumps are the most competitive in apartment buildings with the levelised cost of heat between €60 and €80/MWh. Annual heating costs will be around €1200 for air-source and €1400 for ground-source heat pumps in new homes. In existing homes, annual heating costs will be around €1700 for air-source and €2000 for ground-source heat pumps. Electricity taxes, levies, VAT and other refundable taxes account for 30% of total electricity costs in Estonia and Latvia, and 22% of total electricity costs in Lithuania.
-
Individual heat pumps are competitive with district heating in apartment buildings in Estonia and Latvia, but not in Lithuania due to low district heating prices. The levelised cost of heat for heat pumps supplying stand-alone houses is higher than for district heating.
-
In Latvia and Lithuania, the use of individual heat pumps is very sustainable, while in Estonia, CO2 emissions from heat pumps are higher than from natural gas boilers. However, by using individual heat pumps, other emissions such as SO2 (Sulphur dioxide), NOx (Nitrogen oxides) and particles can be avoided. Primary energy is lowest when using individual heat pumps compared to natural gas, biomass or oil boilers in each country.
-
District heating prices in Estonia are the highest among the Baltic countries (average price of €76 (EE), €64 (LV) and €56 (LT) per MWh, incl. VAT). The price range is quite large (mainly between €58 and €95/MWh in EE, €48 and €77/MWh in LV and €46 and €70/MWh in LT).
-
Large-scale heat pumps will mainly be used in district heating to replace natural gas boilers due to subsidised biomass combined heat and power plants operating as baseload units.
-
The availability of industrial excess heat and the processes in which it occurs have been extensively studied in Europe. 155 case studies of industrial heat pump integration were discovered. For the Baltic states, information on processes that require heat to be a certain temperature is especially interesting for the chemical, food, wood, and paper sectors.
-
High-temperature heat pumps that can supply large amounts of heat at up to 100°C already exist in the wood sector. The chemical sector has the greatest potential in terms of primary energy use. However, only a few processes require heat at a temperature existing industrial heat pumps can supply. Most of the processes within the food and paper sectors can already be supplied with heat via industrial heat pumps. Besides, industrial heat pumps can also be used to provide hot water, preheating, washing/cleaning, and space heating to any industrial sector.
-
The chemical industry is the dominant sector in Estonia (48%, 9 sites) in terms of total primary energy consumption. Other important sectors are the cement industry (16%, 1 site), refineries (11%, 8 sites) and the wood sector (11%, 15 sites). A smaller contribution comes from the food sector (4.1%, 10 sites) and the asphalt industry (3.6%, 63 sites). Several very large industries contribute the most to primary energy consumption. The asphalt industry consists of numerous small businesses.
-
The chemical industry is very dominant in Lithuania (77% of total primary energy consumption, 2 sites), Other sectors include the mineral sector (10%, 12 sites), paper (6%, 3 sites) and food (4%, 5 sites).
-
In Latvia, industrial energy consumption comes mainly from the wood sector (36%, 15 sites), the cement industry (25%, 1 site), and others (21%, 11 sites). The food sector (8%, 7 sites), pharmaceuticals (4%, 2 sites) and refineries (4%, 1 site) can also be important.
Abbreviations
| CDD | Cooling Degree Day |
| CHP | Combined heat and power |
| COP | Coefficient of performance |
| DC | District cooling |
| DH | District heating |
| EE | Estonia |
| ERDF | European Regional Development Fund |
| ETS | Emissions Trading System |
| EU | European Union |
| GHG | Greenhouse gas |
| HDD | Heating Degree Day |
| HP | Heat pump |
| HPP | Hydropower plant |
| IEA | International Energy Agency |
| LCOE | Levelised cost of energy |
| LCOH | Levelised cost of heat |
| LHDD | Linear heat demand density |
| LT | Lithuania |
| LV | Latvia |
| NECP | National Energy and Climate Plans |
| P2H | Power-to-heat |
| PE | Primary energy |
| PEC | Primary energy consumption |
| PV | Photovoltaic |
| RES | Renewable energy sources |
| WEO | World Energy Outlook |
Chapter 1
District Heating and Potential Heat Sources in the Baltic States
1.1 Key findings
-
Most of the residents of the Baltic countries have their heat supplied via district heating (62% in Estonia, 65% in Latvia, and 58% in Lithuania), which is well above the EU average of 26%. In 2018, the share of renewable energy sources in the heating and cooling sector in the Baltic countries (54% in EE, 56% in LV, and 46% in LT) was much higher than the EU average (29%). Information on 95% (EE), 86% (LV), and 99% (LT) of the total district heating production was obtained from 184 (EE), 111 (LV), and 56 (LT) district heating areas.
-
In 2017, large-scale electrically-powered heat pumps with a total capacity of 1580 MW were installed in Europe. By 2050, large-scale heat pumps are expected to provide 25% to 30% of the total district heating produced in the EU.
-
The Baltic states have little experience with existing centralised heat pump projects, and the installed heat pump capacity is very low (5x in EE, 3x in LV, and 5x in LT).
-
The number of individual heat pumps is very high in EE (29.3 HPs/1000 households, the 2nd largest share in Europe) and low in LT (9 HPs/1000 households). The share in LV is very small.
-
Seawater, lakes, rivers, and sewage water were considered as low-temperature heat sources for large-scale heat pumps. Measurements were obtained from 12 (seawater), 17 (rivers), 7 (lakes), 1 (sewage water), and 18 (ambient air) locations.
-
Information was collected on 174 (EE), 106 (LV), and 99 (LT) potential high-temperature heat sources for large-scale heat pumps (industrial excess heat and flue gases from heat production plants). The identified industrial sectors, sorted by primary energy consumption (PEC), include: chemicals, cement, wood, other, refineries, food, paper, asphalt, brick, other minerals, pharmaceuticals, and metal production.
-
The PEC of high-temperature excess heat sources was estimated to be 18.9 TWh (EE), 6.2 TWh (LV), and 15.6 TWh (LT) for industrial excess heat. For boiler and combined heat and power plants, the PEC was 14.0 TWh, 22.0 TWh, and 13.7 TWh in EE, LV, and LT, respectively. For power plants, the PEC was 52.1 TWh in EE.
-
The theoretical industrial excess heat potential was determined to be 3370 GWh (EE), 1199 GWh (LV), and 2490 GWh (LT), of which 2/3 can be supplied directly, and 1/3 via large-scale heat pumps. The theoretical excess heat potential of flue gas from boilers and combined heat and power plants was 590 GWh, 949 GWh and 650 GWh in Estonia, Latvia and Lithuania, respectively.
-
High excess heat potential was calculated, in particular, for the chemical sector and the cement industry (there is 1 large cement factory in each country). Other sectors with high excess heat potential are refineries (EE), wood (EE, LV), asphalt (EE), and food (EE, LV, LT), as well as boilers (EE, LV, LT) and combined heat and power plants (EE, LV, LT).
-
A GIS map was created for the Baltics showing the identified district heating areas and potential high- and low-temperature heat sources for large-scale heat pumps. The practical heat source potential was determined using proximity analysis to identify heat sources in district heating areas, within 1 km and more than 1 km from district heating areas.
-
The practical potential of industrial excess heat sources located inside district heating areas was 2601 GWh, 394 GWh, and 436 GWh in EE, LV, and LT, respectively. For industrial excess heat sources located within 1 km of district heating areas, additional potential of 322 GWh (EE), 110 GWh (LV), and 1730 GWh (LT) was identified. For boilers and combined heat and power plants, the potential in the district heating areas was 445 GWh (EE), 901 GWh (LV), and 413 GWh (LT).
SHORTCUTS
1.1 Key findings
1.2 District heating today
1.3 Heat pumps today
1.4 Characteristics of existing district heating areas
1.5 High-temperature heat sources
1.6 Low-temperature heat sources
1.7 Excess heat potential of heat sources used by large-scale heat pumps
1.8 Low-temperature heat source potential based on GIS proximity analysis
1.9 Example of three district heating areas with access to heat sources
1.2 District heating today
The EU Climate and Energy Framework[1]European Commission, ‘2030 Climate & Energy Framework’, 2020. has three key targets for 2030, namely:
-
Reducing greenhouse gas emissions by at least 40% over the period of 1990 to 2030;
-
Increasing the share of renewable energy sources in final consumption to at least 27% by 2030;
-
Improving energy efficiency by at least 27%.
In September 2020, the European Commission proposed to raise the 2030 greenhouse gas (GHG) emission reduction target from 40% to at least 55% compared to 1990 levels, as part of the European Green Deal.
Heat supplied by sustainable low-temperature district heating (DH) networks can be considered as one of the best heat supply options for urban buildings due to lower heat losses and the possibility of using renewable energy sources (RES). Supply temperature below 50-60°C is the most important feature of the 4th generation district heating. Energy supply and transition systems and end users will benefit from low temperature. Implementing power-to-heat solutions is a good way to increase the flexibility of the energy system, as power-to-heat options will help address both heat and electricity consumption fluctuations. Besides, when the electricity used for power-to-heat comes from RES, then the use of power-to-heat technologies, such as heat pumps (HPs), will help introduce RES into the energy system.
The largest sources of GHG emissions in the Baltic countries are public electricity and DH (32% in 2015)[2]Tomi J. Lindroos and others, ‘Baltic Energy Technology Scenarios 2018’, 2018, p. 165.. Emissions from public electricity and heating are the primary source of emissions in Estonia, accounting for 66% of the total national GHG emissions in Estonia. The share is much lower in Lithuania (34%) and Latvia (20%)[3]Tomi J. Lindroos and others, ‘Baltic Energy Technology Scenarios 2018’, 2018, p. 165..National energy and climate strategies of Estonia, Latvia, and Lithuania set similar climate and energy goals aimed at reducing GHG emissions, increasing the share of RES in heat and electricity production, improving energy efficiency, and ensuring energy independence. For Estonia and Latvia, the goal is to produce 50% of the total energy production using RES by 2030, and for Lithuania it is 45%.
In Latvia, low-temperature heating systems are rather uncommon. Recently, in Gulbene, the first local heating system was adjusted to operate with a lower heat carrier temperature (60-70°C supply temperature). In 2019, the first large-scale solar thermal collector field was launched in Salaspils to cover hot water preparation in the summer. The largest DH operator in Lithuania plans to reduce supply and return temperatures in Vilnius DH network and first tests have been started in summer 2020. It is planned, that new customers will be connected to low-temperature DH networks in 2021. There are no implemented low-temperature DH networks projects in Estonia and there are only plans to reduce temperature in some of the Estonian DH networks.
A common feature of all three Baltic countries is a very well-developed DH network that covers most towns. Over 50% of heat is supplied by DH in the Baltic countries (Figure 1)[4]Eduard Latõšov and others, ‘Primary Energy Factor for District Heating Networks in European Union Member States’, Energy Procedia, 116 (2017), 69–77.. Historically, fossil fuels (heavy oil, shale oil) have been the dominant fuel for DH in the Baltic countries, but high fuel prices and the political drive to reduce import dependency have prompted a switch to local biofuel over the past 20 years. Today, about 50% of heat consumption in the Baltic countries is covered by biomass, mainly wood chips and wood waste[5]Tomi J. Lindroos and others, ‘Baltic Energy Technology Scenarios 2018’, 2018, p. 165..
Footnotes
- ^ European Commission, ‘2030 Climate & Energy Framework’, 2020.
- ^ Tomi J. Lindroos and others, ‘Baltic Energy Technology Scenarios 2018’, 2018, p. 165.
- ^ Tomi J. Lindroos and others, ‘Baltic Energy Technology Scenarios 2018’, 2018, p. 165.
- ^ Eduard Latõšov and others, ‘Primary Energy Factor for District Heating Networks in European Union Member States’, Energy Procedia, 116 (2017), 69–77.
- ^ Tomi J. Lindroos and others, ‘Baltic Energy Technology Scenarios 2018’, 2018, p. 165.
SHORTCUTS
1.1 Key findings
1.2 District heating today
1.3 Heat pumps today
1.4 Characteristics of existing district heating areas
1.5 High-temperature heat sources
1.6 Low-temperature heat sources
1.7 Excess heat potential of heat sources used by large-scale heat pumps
1.8 Low-temperature heat source potential based on GIS proximity analysis
1.9 Example of three district heating areas with access to heat sources
Figure 1. Percentage of residential heat supplied by DH by country ([1]Euroheat and Power, ‘District Heating and Cooling. Country by Country 2015 Survey’, 2015. [2]M. A. Sayegh and others, ‘Heat Pump Placement, Connection and Operational Modes in European District Heating’, Energy and Buildings, 166.February (2018), 122–44.)
The share of RES has increased in recent years in all Baltic countries. In the heating and cooling sector, it has always been significantly higher than the EU average. Latvia has the highest share of RES in the heating and cooling sector in the Baltic states (Figure 2)[1]M. A. Sayegh and others, ‘Heat Pump Placement, Connection and Operational Modes in European District Heating’, Energy and Buildings, 166.February (2018), 122–44 .. The share of RES in the Baltic states in the heating and cooling sector has increased over the last decade[2]Eurostat, ‘Share of Energy from Renewable Sources’, 2020..
The heating season in Baltic states lasts about 6-7 months. Heating Degree-Day Index is a weather-based technical index designed to describe the heat demand of a building. The index for each of the three countries is shown in Figure 3.
It is evident that these numbers are higher than the EU average. The coldest climate among the Baltic states is in Estonia. The climate in the Baltics is, to a certain extent, maritime, same as in Central Scandinavia. In Latvia, only minor regional climate variations exist between the coastal and eastern regions of, approximately, 2-4°C. In Estonia, there are variations between island, coastal, and southern regions but no more than 3°C. The climate of the Lithuanian Baltic Sea coast is similar to that of Western Europe and can be attributed to the Southern Baltic climate subregion[1]Eurostat, ‘Cooling and Heating Degree Days by Country - Annual Data’, 2020..
1.2.1. District heating in Estonia
There are more than 200 DH networks in Estonia, and the share of DH in heat production is over 60%. Since 2014, many boiler houses in small DH networks have been renovated and new biomass boilers have been installed instead of old gas or oil boilers with the help of EU funding. This has led to an increase in the use of biomass in the DH sector (see Figure 4). More data on heat production by fuel type is available on the Statistics Estonia website[2]Statistics Estonia, ‘KE023: Energy Balance Sheet by Type of Fuel or Energy(1999-2018)’, 2020. .
As can be seen, the use of oil and natural gas in Estonia has been on the decline since 2010. The use of wood for heating has increased, which can be explained by significant government support. It should also be explained why the use of shale oil and shale oil gas has increased. This is due to the increased production of shale oil, where shale oil gas is a by-product and is then used for DH. DH systems are mostly operated by private companies and, in rare cases, municipalities.
20 years ago, the share of heavy oil-fired boilers in Estonia was quite high. However, it has been decreasing due to the high price of heavy oil and environmental regulations. The share reflects all available capacities, but oil-fired boilers are mainly used as backup boilers.
In 2009, grants were awarded to local governments, non-profit associations, businesses, and foundations under the Wider Use of RES for Energy Generation programme that was funded by the European Regional Development Fund (ERDF). From 2005 to 2009, the heating sector received €13.9 million from the ERDF and Estonian environmental taxes, as well as €0.9 million from the state budget and through the support scheme for investing in energy-saving solutions during the same period. The 2009 application round had a total funding of approximately 9.6 million EUR, and 17 projects received grants for the modernisation of boiler houses and DH networks, and construction of combined heat and power (CHP) plants in accordance with the support mechanism for the production of electricity in cogeneration and from renewable sources. In 2014-2020, a grant was allocated from the measure ‘Effective Production and Transmission of Thermal Energy for structural aid’. The total budget of the application round was €18 million. Of these, €12 million were used for boiler renovation. €6 million were allocated for the repair of DH pipelines, the construction of new connections and a new DH system.
Biomass is highly available in Estonia. In[1]Stephanie Y. Searle and Christopher J. Malins, ‘Waste and Residue Availability for Advanced Biofuel Production in EU Member States’, Biomass and Bioenergy, 89 (2016), 2–10., the available mass of this type of biofuel was estimated for various EU countries. As a result, it was determined that available agricultural residue in Estonia is about 1.1 million tons per year, forestry residue is about 0.99 million tons per year, and available biological waste is about 0.11 million tons per year. In[2]Pieter Johannes Verkerk and others, ‘Spatial Distribution of the Potential Forest Biomass Availability in Europe’, Forest Ecosystems, 6.1 (2019), 1–11., the potential of using woody biomass from forests, including stem wood, logging residue, and stumps in the EU countries was assessed. Estonia is one of the regions with the highest biomass availability, where the available biomass per hectare is 0.51–0.75 tons per year. According to Statistics Estonia, the share of forests in the total land area of Estonia is 51.4%, where 74% are profitable forests and 26% are nature reserves [3]Statistics Estonia, ‘Quarterly Bulletin of Statistics Estonia 2/18’, 2 (2018)..
Until 1998, municipalities performed mild price regulation. In 1998, the Energy Act introduced ex-ante prices for DH grids and heat-only boilers that are set by the new national regulatory authority (the Energy Market Inspectorate at the time) as the maximum price for end users (DH price cap) on a case-by-case basis. The price of heat for end users is determined by the national regulatory authority in order to cover the expenses of the DH company, and obtain a reasonable profit (regulatory WACC), which is calculated today using the methodology publicly available on the Estonian Competition Authority (ECA) website.
Estonia's DH market is regulated by the District Heating Act and the Competition Act; the maximum prices charged in network regions must be approved by the Competition Authority. The District Heating Act regulates activities related to the production, distribution, and sale of heat through DH networks and connection to these networks. It requires heating companies to maintain separate accounts for the production, distribution, and sale of heat, as well as other activities and costs incurred in operating CHP plants. The District Heating Act also stipulates that the price of heat produced during CHP processes is subject to approval by the Competition Authority for a period of up to three years[4]Ministry of Economic Affairs and Communications, ‘Estonian Heat Supply Sector Analysis (in Estonian)’, 2013..
Footnotes
- ^ Stephanie Y. Searle and Christopher J. Malins, ‘Waste and Residue Availability for Advanced Biofuel Production in EU Member States’, Biomass and Bioenergy, 89 (2016), 2–10.
- ^ Pieter Johannes Verkerk and others, ‘Spatial Distribution of the Potential Forest Biomass Availability in Europe’, Forest Ecosystems, 6.1 (2019), 1–11.
- ^ Statistics Estonia, ‘Quarterly Bulletin of Statistics Estonia 2/18’, 2 (2018).
- ^ Ministry of Economic Affairs and Communications, ‘Estonian Heat Supply Sector Analysis (in Estonian)’, 2013.
At the beginning of 2020, the weighted average of the maximum DH prices is €60/MWh; the lowest price is €35/MWh (excluding 20% VAT), and the highest price is €86/MWh. Typically, the actual selling price is very close to the specified maximum price. The procedure or methodology for coordinating the maximum price was developed by the Competition Authority, and since November 2010, all DH providers must request approval of their maximum prices from the Competition Authority. All approved prices can be found on the Competition Authority website[1]Estonian Competition Authority, ‘Limits of Heat Production Costs Agreed with the Estonian Competition Authority (in Estonian)’, 2020..
1.2.2. District heating in Latvia
The main fuel used for heat production are natural gas and wood. As it can be seen from Figure 5 share of natural gas has been increased during last years and share of wood has been increased. More data on heat production in Latvia by fuel type can be obtained upon request from the Latvian Statistics Databases[2]Central Statistical Bureau of Latvia, ‘ENG120. Fuel Consumption and Heat Produced in Heat Plants’, 2020..
Considering the rather cold climate in Latvia, heat supply is an important sector there. Heat is mainly supplied through DH. Based on the latest data from the Central Statistical Bureau of Latvia, in 2019, heat was produced at 643 boiler houses with a total installed capacity 2095 MW and 175 CHP plants with an installed electrical capacity of 1270 MW[1]Central Statistical Bureau of Latvia. Databases, 2020..
Wood is the main fuel for heat production in boilers, with 61.2% of heat produced using wood and 37.6% using natural gas. But due to the presence of large-scale gas-fired CHP plants, natural gas still dominates the DH sector. Over the past 15 years, the share of renewable energy in the Latvian DH market has increased[2]Euroheat and Power, ‘District Energy in Latvia’, 2020.. The reconstruction and renovation of DH networks in 2009-2020 was financed by almost €160 million from the EU funds. Despite significant investment support for DH reconstruction, a large number of DH pipelines are over 25 years old with high heat transmission losses. The largest consumer of heat energy is the residential sector. In 2017, 7034 GWh were consumed, including 4332 GWh by the residential sector, 1656 GWh by the commercial and public sectors, 914 GWh by industry and construction, and 132 GWh by agriculture (Figure 6)[3]Central Statistical Bureau of Latvia. Databases, 2020.. According to the information provided by Euroheat & Power, the number of DH systems decreased by 7% from 2011 to 2017 due to increased energy efficiency, warmer winters, and a population decline[4]Euroheat and Power, ‘District Energy in Latvia’, 2020..
There are no specific laws for the heating sector in Latvia. The main legal act covering DH is the Energy Law, adopted on March 9, 1998. There are regulations related to the Energy Law, such as the Regulations Regarding the Energy Efficiency Requirements for Centralised Heating Supply Systems in the Possession of a Licensed or Registered Energy Supply Merchant and the Procedures for Conformity Examination Thereof (2016) and Regulations Regarding the Supply and Use of Thermal Energy (2008). DH systems are mainly owned by local municipalities and, in some cases, private owners.
Heating tariffs depend on many factors, including the size of the system, the fuel used, technical conditions of the system, and even political aspects. Heat production, transmission and distribution are public services that are regulated by the Public Utilities Commission in Latvia. Small DH systems (up to 5000 MWh of annual production) are not regulated. There are about 240 heat producers with regulated heat production tariffs, which accounts for 93% of the total heat market and 58 urban areas with regulated heat supply tariffs[1]‘The Public Utilities Commission (PUC)’.. At the beginning of the 2019 heating season, the lowest price was €44.59/MWh (excluding 20% VAT), and the highest price was €60.92/MWh. Typically, the actual selling price is very close to the specified maximum price. All regulated prices can be found on the Public Utilities Commission website[2]The Public Utilities Commission (PUC)'..
1.2.3. District heating in Lithuania
The main fuel used for DH was natural gas in 2012, but during last years the share of wood has been increased and now wood is the dominating fuel used for heating (Figure 7).
Lithuania has started its industrial development of biofuel in 1994 when the first sawdust and wood chips-fired boiler houses were installed. Wood chips and sawdust are still the most popular biofuels in Lithuania. Environmental requirements have increased and fossil fuel prices became higher, that has led to biomass share rising in DH. Another important reason is the creation of the first biofuel market in Europe[3]Rolandas Jonynas and others, ‘Renewables for District Heating: The Case of Lithuania’, Energy, 211 (2020).. The share of biofuel and wastes consumption in DH has increased from 1% till 69% during last 20 years. More data on heat production in Lithuania by fuel type can be obtained upon request from the Energy, Lithuanian Energy Agency and the Lithuanian District Heating Association.
In 2020, heat supply services were provided by 55 licensed heat supply companies with annual sales of over 10 GWh. The activities of these entities are regulated by the Energy Regulatory Council. All DH companies belong to the municipalities. Licences for up to 10 GWh are issued by municipalities, for 10 GWh and more – by the National Energy Regulatory Council. Independent heat producers are private companies installing boiler house or CHP providing heat to DH, if the selling cost is lower than the generation expenses incurred by the producing company. There are 45 independent heat producers, 17 of them are not regulated[4]‘Lithuanian National Energy Regulatory Council’. . In Lithuania, the supply of thermal energy is regulated up to the property borders of the user. Usually, the border is at the point where the heating main enters the building. In 2017, about 90% of DH companies were owned by municipalities, and 10% by private companies.
The total allocated support for DH improvement projects amounted to €141 million, including €127 million from the EU Structural Funds. In 2007-2013, €67 million was used to modernise DH networks, €60 million to replace old boilers with biomass CHP and boilers, and €1 million was spent on increasing energy efficiency in DH[1]Euroheat and Power, ‘District Heating in Lithuania’, 2020..
The main institution managing the DH sector in Lithuania is the Energy Regulatory Council. The law regulating the energy sector is the Energy Law (adopted in October 2002). Under this law, there are six other laws that regulate the following energy sectors: power, heat, natural gas, oil, nuclear energy, and renewable resources. The DH sector is regulated by the Law on the Heat Sector adopted in May 2003 and amended in May 2014. This Law regulates the state management of the heat sector, the activities of the entities belonging to the heat sector, their relationship with heat consumers, their interrelationship, and responsibilities. The DH market system in Lithuania is similar to the electricity and gas markets. Usually, DH markets are a natural monopoly regulated by authorities, but in Lithuania the situation is different: the DH market is based on competition and is open to third parties[2]Diana Korsakaite, Darius Bieksa, and Egle Bieksiene, ‘Third-Party Access in District Heating: Lithuanian Case Analysis’, Competition and Regulation in Network Industries, 19 (2019), 218–41..
Until 2010, the DH market in Lithuania held an undoubted monopoly and was managed by the local municipality. The decision to make the DH market competition-based was made because it was assumed that private initiative would act more quickly and efficiently with investment decisions under the given circumstances than efforts to reduce administrative inefficiencies, since private newcomers were not required to enter the municipal procedures for long-term investment programs. The context of Lithuania’s decision to create a competitive market structure for DH generation included economic, social, and global aspects of market development. In Lithuania, monthly auctions were selected for the DH market by the National Regulatory Authority, and this was approved by the relevant resolution of the National Commission (Resolution, 2011)[3]Diana Korsakaite, Darius Bieksa, and Egle Bieksiene, ‘Third-Party Access in District Heating: Lithuanian Case Analysis’, Competition and Regulation in Network Industries, 19 (2019), 218–41..
The competitive heat generation submarket operates all year round. According to the market model, when DH demand does not exceed 70% of the maximum load, all heat demand is subject to a monthly auction. If the maximum load exceeds 70%, then the part that exceeds 70% is covered by the peak load capacities (monopoly service), and the rest of the load is put up for auction. Independent heat producers and incumbent DH generation units are eligible to participate in the auctions. Bidding for the projected monthly amount of heat is conducted by means of bids, which must cover all costs of the producer. Once the bids are submitted, the queue ranging from the lowest to the highest bidder is created and publicly presented to all auction participants and other interested parties by electronic means. The participant cannot recall their bid. However, if they are unable to provide the bided amount of heat, the mechanism for ensuring heat generation according to the requested demand is applied, and the participant will cover the difference in cost[4]Diana Korsakaite, Darius Bieksa, and Egle Bieksiene, ‘Third-Party Access in District Heating: Lithuanian Case Analysis’, Competition and Regulation in Network Industries, 19 (2019), 218–41..
Footnotes
- ^ Euroheat and Power, ‘District Heating in Lithuania’, 2020.
- ^ Diana Korsakaite, Darius Bieksa, and Egle Bieksiene, ‘Third-Party Access in District Heating: Lithuanian Case Analysis’, Competition and Regulation in Network Industries, 19 (2019), 218–41.
- ^ Diana Korsakaite, Darius Bieksa, and Egle Bieksiene, ‘Third-Party Access in District Heating: Lithuanian Case Analysis’, Competition and Regulation in Network Industries, 19 (2019), 218–41.
- ^ Diana Korsakaite, Darius Bieksa, and Egle Bieksiene, ‘Third-Party Access in District Heating: Lithuanian Case Analysis’, Competition and Regulation in Network Industries, 19 (2019), 218–41.
1.3 Heat pumps today
In the following a brief overview of large-scale HPs in Europe is presented, followed by examples, experiences and research about large-scale HPs in the Baltic states. An overview of individual HPs in the Baltic finalises this literature review.
1.3.1. Large-scale heat pumps
Large-scale centralised HPs can be considered as one of the best power-to-heat options for coupling electrical and thermal grids. A large-scale electrically driven HP is one of the most effective solutions for cross-sector integration in the low-temperature range[1]Schlosser and others, ‘Large-Scale Heat Pumps: Applications, Performance, Economic Feasibility and Industrial Integration’, Renewable and Sustainable Energy Reviews, 133.August (2020), 110219.. The significance of power-to-heat solutions as a key element of flexible smart energy systems has been discussed in various studies[2]Analysis’, Competition and Regulation in Network Industries, 19 (2019), 218–41. Hennrik Lund, Brian Vad; Mathiesen, and others, ‘Renewable Energy Systems - A Smart Energy Systems Approach to the Choice and Modelling of 100 % Renewable Solutions’, Chemical Engineering Transactions, 39 (2014), 1–6; [3]David Connolly, Henrik Lund, and others, ‘Smart Energy Systems: Holistic and Integrated Energy Systems for the Era of 100% Renewable Energy’, 2013.. Power-to-heat technologies, together with cheap thermal energy storage, allow DH systems to accommodate more intermittent renewable energy than alternatives[4]D. Connolly, H. Lund, and B. V. Mathiesen, ‘Smart Energy Europe: The Technical and Economic Impact of One Potential 100% Renewable Energy Scenario for the European Union’, Renewable and Sustainable Energy Reviews, 60 (2016), 1634–53. [5]Henrik Lund, Poul Alberg, and others, ‘Smart Energy and Smart Energy Systems’, Energy, 137 (2017), 556–65 .. On the one hand, large-scale HPs make it possible to integrate a larger proportion of renewable electricity, such as photovoltaic (PV), wind, and wave power, into the energy system. On the other hand, large-scale HPs allow the use of low-grade heat from ambient water, sewage water, and industrial waste heat for DH, thereby reducing the proportion of fossil fuel-based heat[6]Andrei David and others, ‘Heat Roadmap Europe: Large-Scale Electric Heat Pumps in District Heating Systems’, Energies, 2017, 1–18. [7]Benedikt Leitner and others, ‘A Method for Technical Assessment of Power-to-Heat Use Cases to Couple Local District Heating and Electrical Distribution Grids’, Energy, 182 (2019), 729–38..
David et al.[8]Andrei David and others, ‘Heat Roadmap Europe: Large-Scale Electric Heat Pumps in District Heating Systems’, Energies, 2017, 1–18. identified about 150 existing large-scale HPs with thermal capacity above 1MW supplying DH in Europe. This resulted in a total capacity of 1580 MW in 2017. These HPs differed in size, heat source, supply temperature, refrigerant, operating mode and COP. They identified seven different heat sources, among which sewage water, ambient water (seawater, lakes and rivers), industrial waste heat and geothermal water were the most commonly used. Many of the HPs were built until the year 2000 with an accumulated thermal capacity of 77%. Afterwards, large-scale HPs were built in Denmark, Finland, France, Norway, Italy, Switzerland and Sweden. Many of the newly built HPs used R134a as refrigerant, which has a comparable high global warming potential (GWP). Natural refrigerants, such as Ammonia and CO2, with very low GWP and no ozone depletion potential (ODP) were used for ten large-scale HPs built in Denmark, five in Switzerland, two in Norway and one in Sweden. The results of another Heat Roadmap Europe study have shown the importance of large-scale HPs for European DH systems. Large-scale HPs are projected to produce 520 TWh/year with the coefficient of performance (COP) of 3, thus providing 25% to 30% of the total DH production in the EU by 2050[9]David Connolly, Briad Vad Mathiesen, and others, Heat Roadmap Europe 2050 - Second Prestudy (Aalborg University, 2013)..
1.3.2. Large-scale heat pumps in the Baltic states
The potential of large-scale HPs has not been realised in the Baltic states. There are several researches is being conducted to describe the current situation and propose various solutions to realise the potential of using large-scale HPs.
Footnotes
- ^ Schlosser and others, ‘Large-Scale Heat Pumps: Applications, Performance, Economic Feasibility and Industrial Integration’, Renewable and Sustainable Energy Reviews, 133.August (2020), 110219.
- ^ Analysis’, Competition and Regulation in Network Industries, 19 (2019), 218–41. Hennrik Lund, Brian Vad; Mathiesen, and others, ‘Renewable Energy Systems - A Smart Energy Systems Approach to the Choice and Modelling of 100 % Renewable Solutions’, Chemical Engineering Transactions, 39 (2014), 1–6;
- ^ David Connolly, Henrik Lund, and others, ‘Smart Energy Systems: Holistic and Integrated Energy Systems for the Era of 100% Renewable Energy’, 2013.
- ^ D. Connolly, H. Lund, and B. V. Mathiesen, ‘Smart Energy Europe: The Technical and Economic Impact of One Potential 100% Renewable Energy Scenario for the European Union’, Renewable and Sustainable Energy Reviews, 60 (2016), 1634–53.
- ^ Henrik Lund, Poul Alberg, and others, ‘Smart Energy and Smart Energy Systems’, Energy, 137 (2017), 556–65 .
- ^ Andrei David and others, ‘Heat Roadmap Europe: Large-Scale Electric Heat Pumps in District Heating Systems’, Energies, 2017, 1–18.
- ^ Benedikt Leitner and others, ‘A Method for Technical Assessment of Power-to-Heat Use Cases to Couple Local District Heating and Electrical Distribution Grids’, Energy, 182 (2019), 729–38.
- ^ Andrei David and others, ‘Heat Roadmap Europe: Large-Scale Electric Heat Pumps in District Heating Systems’, Energies, 2017, 1–18.
- ^ David Connolly, Briad Vad Mathiesen, and others, Heat Roadmap Europe 2050 - Second Prestudy (Aalborg University, 2013).
SHORTCUTS
1.1 Key findings
1.2 District heating today
1.3 Heat pumps today
1.4 Characteristics of existing district heating areas
1.5 High-temperature heat sources
1.6 Low-temperature heat sources
1.7 Excess heat potential of heat sources used by large-scale heat pumps
1.8 Low-temperature heat source potential based on GIS proximity analysis
1.9 Example of three district heating areas with access to heat sources
Preliminary research, conducted in Estonia
In[1]Henrik Pieper, Vladislav Mašatin, and others, ‘Modelling Framework for Integration of Large-Scale Heat Pumps in District Heating Using Low-Temperature Heat Sources: A Case Study of Tallinn, Estonia’, International Journal of Sustainable Energy Planning and Management, 20 (2019), 67–86., a framework for the large-scale HP integration modelling was presented and applied to Tallinn’s DH. The framework’s model formulation takes into account cost optimisation and calculation of the COP using the heat source’s ambient temperature, HP design conditions, and various performance indicators. The Tallinn case study shows that Tallinn has 13 possible locations for large-scale HPs that could be used for DH. In the case of Tallinn, low-temperature heat sources such as ambient air, groundwater, seawater, river water, lake water, and sewage water can be used. The heat source and heat sink determine the HP design conditions, which, in turn, determine the operation and maintenance costs and necessary investments per MW. Investments also depend on the location of the HP. Operation and maintenance costs are also influenced by the price of electricity, which was also considered in the study. The results of the research show that in the case of Tallinn, the hourly Lorenz efficiency ranges from 0.5 to 0.6 depending on heat source and DH supply temperatures. The optimisation results show that for the Tallinn DH network it would be best to install HPs for a total capacity of 122 MW, including 46 MW sewage water HPs, 31 MW river water HPs, 24 MW ambient air HPs, 13 MW seawater HPs, and 8 MW groundwater HPs. In Tallinn, the share of heat produced via HPs could reach 16%, reducing the share of natural gas from 50% to 34%. The sensitivity analysis shows that if electricity prices increase, operation and maintenance costs and investments will increase significantly along with the levelised cost of heat and payback period, but the net present value will drastically decrease.
Tallinn's Action Plan for Energy Efficiency for the period 2010 to 2020 discussed the construction of a HP system near the sewage treatment plant in Paljassaare, which will use sewage water energy; the approximate capacity of such a system will be 20 MW, covering 6-7% of the city's heat consumption[2]Tallinn city council, Energy Efficiency Action Plan for Tallinn 2011-2021 (in Estonian), 2011..
In[3]Anna Volkova, Igor Krupenski, and others, ‘Small Low-Temperature District Heating Network Development Prospects’, Energy, 178 (2019), 714–22. , the creation of a low-temperature DH subnetwork was analysed and compared to the case of an identical high-temperature DH network. The network in question is located in Kopli, Tallinn. It is a new district with 21 multi-family residential buildings with floor heating and a total heat demand of 1.2 MW. To create a low-temperature DH network, it was assumed that the temperature would be 60°C/35° C for the supply and return lines, respectively. Heat demand will be covered by a seawater HP and a gas-fired boiler. The HP will be used for base load and gas-fired boiler for peak demand. The total capacity of gas boilers will be 2.6 MW and the total capacity of HPs will be 2.1 MW. The designed COP for the HP was assumed to be 3.82. According to this study, the extra investments required for the HP will amount to approximately €1.9 million. It was also determined that after installing a HP in the new Kopli district of Tallinn, the heat price for consumers will be €38.86/MWh, which is €17.79/MWh cheaper than the current price, due to reduced primary energy consumption, heat losses, CO2 emissions, as well as decreased dependence on natural gas and its price.
Preliminary research, conducted in Latvia
Two alternative scenarios were also analysed based on the data collected from an ‘average DH company’ in Latvia[4]Ilze Polikarpova and others, ‘Multi ‐ Criteria Analysis to Select Renewable Energy Solution for District Heating System’, 23.3 (2019), 101–9., including changes in summer load for a solar collector system with an accumulation tank in the planned version and an alternative with a HP and solar cells. As a result of the multi-criteria analysis, the scenario with the solar collector field and the accumulation tank was selected. The scenario with the HP and PV panels was not chosen due to the higher investments required and greater impact on the land.
In[5]Dace Lauka, Julija Gusca, and Dagnija Blumberga, ‘Heat Pumps Integration Trends in District Heating Networks of the Baltic States’, Procedia - Procedia Computer Science, 52.Seit (2015), 835–42. , the possibilities of integrating HPs into the DH systems of the Baltic countries were analysed, focusing on changes in heat demand and accumulation trends, and three system behaviour scenarios were proposed. The hypothesis of the study is that the integration of HPs into the DH system can increase the demand for electricity generated using RES. As part of testing the hypothesis, the potential of HPs in the Baltic states was determined by developing a simulation model. In the study, the simulation model was applied to the Latvian case. The choice of HP capacity depends on the heat load. The electrical capacity of the HPs is determined by the installed thermal capacity, COP, and the coefficient of the DH system load, which, in turn, is determined by the heat load. As a result, it was found that the optimal solution would ensure that 70-90% of the annual heat demand is covered by HPs.
Preliminary research, conducted in Lithuania
The possibility of installing a combined HP and water-power plant together with a thermal energy storage in Kaunas Lagoon (Lithuania) was analysed in[6]Vytautas Dagilis and Liutauras Vaitkus, ‘Combined Heat Pump and Water-Power Plant at Kaunas Lagoon’, 9th International Conference on Environmental Engineering, ICEE 2014, May, 2014.. For the lowest water temperature (+1°C), the designed COP is quite high at 3.65, which can be explained by the high temperature of the low-potential heat source, extremely efficient heat transfer of the evaporator, and the fact that 28% of the heat is obtained from superheated gas. The low price of electricity is ensured by using only off-peak electricity generated by the hydroelectric power station. It was estimated that the capacity of the installed HPs will be 270 MW and it will cover the heating needs of the city of Kaunas.
Footnotes
- ^ Henrik Pieper, Vladislav Mašatin, and others, ‘Modelling Framework for Integration of Large-Scale Heat Pumps in District Heating Using Low-Temperature Heat Sources: A Case Study of Tallinn, Estonia’, International Journal of Sustainable Energy Planning and Management, 20 (2019), 67–86.
- ^ Tallinn city council, Energy Efficiency Action Plan for Tallinn 2011-2021 (in Estonian), 2011.
- ^ Anna Volkova, Igor Krupenski, and others, ‘Small Low-Temperature District Heating Network Development Prospects’, Energy, 178 (2019), 714–22.
- ^ Ilze Polikarpova and others, ‘Multi ‐ Criteria Analysis to Select Renewable Energy Solution for District Heating System’, 23.3 (2019), 101–9.
- ^ Dace Lauka, Julija Gusca, and Dagnija Blumberga, ‘Heat Pumps Integration Trends in District Heating Networks of the Baltic States’, Procedia - Procedia Computer Science, 52.Seit (2015), 835–42.
- ^ Vytautas Dagilis and Liutauras Vaitkus, ‘Combined Heat Pump and Water-Power Plant at Kaunas Lagoon’, 9th International Conference on Environmental Engineering, ICEE 2014, May, 2014.
Completed projects in Estonia
In Estonia, there are three small DH networks that use HPs as heat production technology. These DH networks are Palamuse, Kaarepere, and Kiikla. In Palamuse, there are two small, separate DH networks, where the heat demand is covered by ground source HPs. The DH network consists of Palamuse School and its supplementary buildings. The other network supplies DH to residential buildings (7 buildings). The HPs were installed in 2013. The annual consumption of the Palamuse School DH network is 830 MWh, and the residential building’s network’s annual consumption is 750 MWh. The average annual COP of the HPs is 2.6[1]Leo Rummel, ‘Heat Supply Development Plan for Kaarepere Küla and Luua Küla 2017-2027 (in Estonian)’, 2017.. HPs are also used in the DH network of the Kaarepere village, near Palamuse. Like Palamuse, Kaarepere also uses ground source HP. The consumers of the network are 6 residential buildings and a kindergarten. The annual heat consumption of the network is 730 MWh. The annual average COP of the pumps is 2.3. The HPs were installed in 2013, same as in Palamuse[2]Leo Rummel, ‘Heat Supply Development Plan for Kaarepere Kula and Luua Kula 2017-2027 (in Estonian)’, 2017.. In the DH network of the Kiikla village, the heat demand is covered by a 400 kW HP, which uses water from a nearby mine as a heat source. The HP was installed in 2012, and according to HP manufacturer, the average COP should be 4.1. The annual heat consumption of the Kiikla DH network is 530 MWh[3]LeoRummel " Heat Supply Development Plan for Mäetaguse county Maetaguse Alevik and Kiila Kula 2017-2030, August 2017..
Three seawater HPs are used to provide heating and cooling to the Seaplane Harbour museum in Tallinn. The installed heating capacity of system is 395 kW, the cooling capacity is 250 kW and the power 180 kW.
In 2020, a HP was installed in Utilitas Mustamäe CHP in order to cool down condensate after flue gas condenser (FGC) and utilise it in DH. Due to FGC construction condensate in FGC is 60-65°C, according to Tallinn sewerage regulation, temperature must be not higher than 45°C, in order to fulfil that requirement condensate was needed to mix with cold water before utilisation that caused additional money loss. Installed HP decreasing condensate temperature to 25°C and providing up to 420 kW energy to DH network.
Completed projects in Latvia
In Latvia, the introduction of HPs has been supported by both the Latvian government and Norwegian Financial Mechanism. The following HP projects were implemented in Latvia with the help of the Norwegian Financial Mechanism in 2009-2014:
-
A 57 kW HP was installed at the Kastanitis kindergarten in Riga, replacing the coal-fired boiler (Project Nr. LV0097)[4]Baltic Environmental Forum Latvia, Heat Pump Use for Heat Supply of Buildings (in Latvian), 2011. [5]'The EEA and Norway Grants'.;
-
A geothermal heating system was installed at the Katvari Special Boarding School in Limbaži. The system consists of 6 HPs with a heat capacity of 270 kW (Project Nr. LV0062)[6]'The EEA and Norway Grants’.;
-
Ground source HPs for space heating and cooling and solar panels for water heating were installed at the Environmental Education and Information Centre of North Vidzeme Biosphere Reserve (NVBR) (HP capacity is 9 kW, Project Nr. LV0062)[7] ‘The EEA and Norway Grants’.;
-
Water-based HP system was installed in the Salacgriva Municipality to supply public institutions with the overall objective of protecting the environment by reducing emissions of pollutants into the atmosphere. HP capacity is 1.1 MW (Project Nr. LV0075)[8]'The EEA and Norway Grants’..
The only DH network in Latvia based on HPs operated in Salacgriva. The HP-based DH system provided heat to the Salacgriva secondary school, Salacgriva Vilnitis kindergarten, music school, art school, and technical premises of the stadium in 2010-2017. Due to the rise of electricity tariffs in 2016, heating costs have increased significantly, which lead to the HPs ceasing operation in 2017[9]Salacgriva Municipality, ‘About Washing out of Heat-Pump Circuits (in Latvian)’, 2019..
In addition, a 17 kW horizontal HP was installed at the Smarde kindergarten (with the support of the local authorities) and a 40 kW HP was installed at the municipality building in Engure (with the support of the municipality and the Latvian Environmental Protection Fund) in 2006[10]Baltic Environmental Forum Latvia, Heat Pump Use for Heat Supply of Buildings (in Latvian), 2011..
The climate financial instrument (CCFI; a state budgetary program of the Republic of Latvia) provided support (through tenders) for the following projects in 2010-2015 that include HP installation[11]Ministry of Economics of the Republic of Latvia., Long-Term Strategy for Building Renovation, 2014.:
As part of the ‘Technological transition from fossil fuels to RES’ measure:
-
Transition to RES at the warehouses of SIA Abava;
-
Technological transition from fossil fuels to RES at the Tiskādi Elementary Boarding School; Technological transition from fossil fuels to RES at the Tiskādi Secondary School;
-
Heat supply from RES at the Pabaži Elementary School.
As part of the ‘Utilisation of RES to reduce GHG emissions’ measure:
-
Reconstructing the boiler room and heating system at the Malta Special Elementary Boarding School;
-
Installing the solar energy collector system and construction of geothermal pumps in Saulkrasti;
-
Replacing fossil fuel-based thermal energy generation equipment with RES-based thermal energy equipment at the local government buildings of Burtnieku County;
-
Utilising RES at the State Agency for Social Integration;
-
Utilising thermal and cold energy from the HPs for microclimate adjustment at the printing house.
In 2010, a 2 MW absorption HP was installed at the cogeneration unit of the Imanta (Rīgas siltums) DH plant in Riga to recover heat from cooling the flow[12]Rigas Energetikas Agentura, Heat Recovery from Flue Gas and Cooling Flows in Energy Production Plants (in Latvian), 2012.. The driving force of the absorption HP is the steam generated by the steam boiler (3 MWhheat = 10 MMBTU/h) already installed at the boiler plant. The efficiency of the absorption HP is closely related to the operation of the cogeneration unit, outside temperature, and DH water temperature regimes[13]Agnese Lickrastina, Normunds Talcis, and Egils Dzelzitis, ‘Cogeneration Unit with an Absorption Heat Pump for the District Heating System’, HVAC and R Research, 20.4 (2014), 404–10..
Completed projects in Lithuania
In Lithuania, the largest HP system in the Baltic states was installed at the Grand SPA Lithuania in the city of Druskininkai. The system has a capacity of 1.3 MW and is used for space heating, DHW swimming pool water heating, and mineral water preparation. The system was launched in 2009 and consists of air/water HPs, which recover heat energy from the exhaust air of the ventilation systems, and ground/water HPs, which supply energy from the ground. Other examples for ground-source HPs are in the VU Botanical Garden green building, in the "Porsche" car showroom, in the administrative building "Green Hall 2" and in the "Gariūnai" business park in Vilnius.
It should be mentioned that from 2001 to 2017, the Klaipėda Geothermal Demonstration Heating Plant operated in Lithuania. It was the first geothermal heating plant in the Baltic Sea region. The plant used 38°C water from a well drilled in the Devonian aquifer about 1100 metres beneath the surface. The heat was extracted using an absorption HP and circulated in a closed loop, and then transferred to the existing DH system. Due to financial difficulties, the company that owned the plant went bankrupt in 2019.
Footnotes
- ^ Leo Rummel, ‘Heat Supply Development Plan for Kaarepere Küla and Luua Küla 2017-2027 (in Estonian)’, 2017.
- ^ Leo Rummel, ‘Heat Supply Development Plan for Kaarepere Kula and Luua Kula 2017-2027 (in Estonian)’, 2017.
- ^ LeoRummel " Heat Supply Development Plan for Mäetaguse county Maetaguse Alevik and Kiila Kula 2017-2030, August 2017.
- ^ Baltic Environmental Forum Latvia, Heat Pump Use for Heat Supply of Buildings (in Latvian), 2011.
- ^ 'The EEA and Norway Grants'.
- ^ 'The EEA and Norway Grants’.
- ^ ‘The EEA and Norway Grants’.
- ^ 'The EEA and Norway Grants’.
- ^ Salacgriva Municipality, ‘About Washing out of Heat-Pump Circuits (in Latvian)’, 2019.
- ^ Baltic Environmental Forum Latvia, Heat Pump Use for Heat Supply of Buildings (in Latvian), 2011.
- ^ Ministry of Economics of the Republic of Latvia., Long-Term Strategy for Building Renovation, 2014.
- ^ Rigas Energetikas Agentura, Heat Recovery from Flue Gas and Cooling Flows in Energy Production Plants (in Latvian), 2012.
- ^ Agnese Lickrastina, Normunds Talcis, and Egils Dzelzitis, ‘Cogeneration Unit with an Absorption Heat Pump for the District Heating System’, HVAC and R Research, 20.4 (2014), 404–10.
1.3.3 Individual heat pumps
A critical overview of various HP technologies used in the case study of Lithuania was presented in[1]Rokas Valancius and others, ‘A Review of Heat Pump Systems and Applications in Cold Climates: Evidence from Lithuania’, Energies, 12.22 (2019). . It also discussed cost-benefit predictions and environmental impact. The heat sources discussed are air, ground, and water. According to[2]Rokas Valancius and others, ‘A Review of Heat Pump Systems and Applications in Cold Climates: Evidence from Lithuania’, Energies, 12.22 (2019) ., individual HPs in Lithuania are mainly used for space heating and domestic hot water (DHW), using HPs for cooling is uncommon. The study mentioned several cases of installing ground source HPs at individual and multifamily houses and public buildings. The study also described air source HP installations as a good example of combining solar collectors with HPs, as well as systems installed at Lithuanian hospitals. The study indicates that in Lithuania the seasonal performance factor will be higher for HPs with ground and water sources and lower for HPs with air sources, at 2.5-5.6 and 1.8-3.4 respectively. The study’s findings note that further research should be conducted on the possibilities to reduce HP installation costs, time, and complexity, as no comprehensible design guides and standards are currently available. The main factor hindering the growth in HP usage in Lithuania is the high initial cost of HP implementation and the fact that the payback period of HP systems is too long to ensure stable growth of HP use without government grants.
In[3]Karolis Januševičius and Giedre Streckiene, ‘Solar Assisted Ground Source Heat Pump Performance in Nearly Zero Energy Building in Baltic Countries’, Environmental and Climate Technologies, 11.1 (2013), 48–56. , the results of the use of solar-assisted HP systems in the three Baltic countries were presented. This study has demonstrated that combined systems’ long-term performance is more stable due to passive natural and active ground regeneration. Due to similar weather and geological conditions in the capitals of all Baltic states, the solutions for nearly zero energy buildings (NZEB) can also be used to obtain higher seasonal performance factors for ground source-based HP systems by adding solar collectors and using the passive cooling option.
HP market data for Lithuania and Estonia is available in the European Heat Pump Market and Statistics Report 2018, as these countries are members of the European Heat Pump Association (EHPA)[4]European Heat Pump Association. European Heat Pump Market and Statistics Report 2018.. The report does not collect data on the Latvian market, and there are no reports or documents containing such information available for Latvia. It is known that in 2018 was the first time the Latvian CSP collected data on HPs from 120 respondents, and it is planned that the report will be repeated after some time. The results of the report are not publicly available. 2016-2017 data on the aerothermal HP market for Lithuania and Estonia is provided in Table 1. Data about geothermal HPs market in 2016-2017 in Estonia and Lithuania is presented in Table 2. The total number of HPs in operation is presented in Table 3.
Footnotes
- ^ Rokas Valancius and others, ‘A Review of Heat Pump Systems and Applications in Cold Climates: Evidence from Lithuania’, Energies, 12.22 (2019).
- ^ Rokas Valancius and others, ‘A Review of Heat Pump Systems and Applications in Cold Climates: Evidence from Lithuania’, Energies, 12.22 (2019) .
- ^ Karolis Januševičius and Giedre Streckiene, ‘Solar Assisted Ground Source Heat Pump Performance in Nearly Zero Energy Building in Baltic Countries’, Environmental and Climate Technologies, 11.1 (2013), 48–56.
- ^ European Heat Pump Association. European Heat Pump Market and Statistics Report 2018.
| Country | 2016 | 2017 | ||||||
| Total | Of which air-air HP | Of which air-water HP | Of which exhaust air HP | Total | Of which air-air HP | Of which air-water HP | Of which exhaust air HP | |
| Estonia | 15 010 | 13 700 | 1 280 | 30 | 15 010 | 13 700 | 1 280 | 30 |
| Lithuania | 890 | 0 | 890 | 0 | 1 498 | 0 | 1 474 | 24 |
| Total EU | 3 308 553 | 3 023 976 | 254 320 | 30 267 | 3 458 736 | 3 123 686 | 300 756 | 34 294 |
Table 1. Market of aerothermal HP in EU (number of units sold)
| Country | 2016 | 2017 |
| Estonia | 1 750 | 1 750 |
| Lithuania | 770 | 633 |
| Total EU | 82 898 | 82 401 |
Table 2. Market of geothermal HPs (number of units sold)
| Country | 2016 | 2017 | ||||
| Aerothermal HP | Geothermal HP | Total HPs | Aerothermal HP | Geothermal HP | Total HPs | |
| Estonia | 116 717 | 12 375 | 129 092 | 131 727 | 14 125 | 145 852 |
| Lithuania | 2 760 | 4 463 | 7 223 | 4 258 | 5 096 | 9 354 |
| Total EU | 30 422 864 | 1 480 165 | 31 903 029 | 32 880 160 | 1 544 560 | 34 424 720 |
Table 3. Total number of HPs in operation
By the number of units sold per 1000 households in 2018, Estonia is the second country after Norway with the highest share in Europe. In Estonia, 29.3 HP units are sold per 1000 households, and only 9 HPs units in Lithuania[1]Thomas Nowak, ‘Webinar: EHPA Market Report and Statistics Outlook 2019’, 2019.. According to Eurostat, since 2018 Lithuania has been reporting ambient heat: 24.5 Toe in 2018 and 25.7 Toe in 2019. Latvia and Estonia do not report such information. According to the information provided in the National Energy and Climate Plan of Latvia (2021-2030)[2]Latvian ministry of energy, ‘National Energy and Climate Plan of Latvia 2021-2030’, 2018., only 0.1% of heat is produced using electricity, and the share of HPs in Latvia is very small.
1.4 Characteristics of existing district heating areas
Information on DH areas and their characteristics was collected to best reflect the current heating infrastructure in the model and to create a common database with detailed information on each country and DH area. The information was collected from various reports and databases such as national and regional development plans and DH competition authorities, as shown in Table 4.
| Estonia | Latvia | Lithuania |
| Development plan for heating management of DH regions70 | Report on data collection and analysis required for heat supply planning. Long-term trends in district heating until 203073 | National Energy Regulatory Council75 |
| Database of the NutiSoojus mobile app71 | Public Utilities Commission (PUC)74 | District heating sector overview 201876 |
| Estonian Competition Authority72 | Energy development plans for municipalities. |
Table 4. Sources for information on DH areas
[1]Environmental Investment Center, ‘Data System KIKAS’. [2]Volkova, Anna, Eduard Latošov, Kertu Lepiksaar, and Andres Siirde, ‘Planning of District Heating Regions in
Estonia’, International Journal of Sustainable Energy Planning and Management, 27.Special Issue (2020), 5–16. [3]Estonian Competition Authority, ‘Limits of Heat Production Costs Agreed with the Estonian Competition Authority (in Estonian)’, 2020. [4]Ekodoma, Data Collection and Analysis Required for Heat Supply Planning. District Heating Long-Term
Tendencies till 2030. (in Latvian), 2015. [5]‘The Public Utilities Commission (PUC)’ . [6]‘Lithuanian National Energy Regulatory Council’ . [7]Lithuanian District Heating Association (LSTA), Lithuanian District Heating Sector Overview in 2018 (in Lithuanian), 2019.
Footnotes
- ^ Environmental Investment Center, ‘Data System KIKAS’.
- ^ Volkova, Anna, Eduard Latošov, Kertu Lepiksaar, and Andres Siirde, ‘Planning of District Heating Regions in
Estonia’, International Journal of Sustainable Energy Planning and Management, 27.Special Issue (2020), 5–16. - ^ Estonian Competition Authority, ‘Limits of Heat Production Costs Agreed with the Estonian Competition Authority (in Estonian)’, 2020.
- ^ Ekodoma, Data Collection and Analysis Required for Heat Supply Planning. District Heating Long-Term
Tendencies till 2030. (in Latvian), 2015. - ^ ‘The Public Utilities Commission (PUC)’ .
- ^ ‘Lithuanian National Energy Regulatory Council’ .
- ^ Lithuanian District Heating Association (LSTA), Lithuanian District Heating Sector Overview in 2018 (in Lithuanian), 2019.
| Parameter | Location | Production plant | Annual heat consumption | Heat loss | Fuel share |
| Unit | Coordinates | Type | MWh | % | MW, MWh |
Table 5. Characteristics of the data collected
In total, information was collected on 184 DH areas in Estonia, 111 DH areas in Latvia, and 56 DH areas in Lithuania. Annual heat production in the DH areas with collected data compared to the total DH production in Estonia[1]Ministry of Economic Affairs and Communications (in Estonian), ‘Heating Sector’, 2019. , Latvia[2]Central Statistical Bureau of Latvia, ‘ENG120. Fuel Consumption and Heat Produced in Heat Plants’, 2020. [3]Central Statistical Bureau of Latvia, ‘ENG150. Fuel Consumption, Heat and Electricity Produced in Combined Heat and Power Plants’, 2020., and Lithuania[4]Lithuanian District Heating Association, ‘Lithuanian DH Sector Recent Developments’, 2019. is shown in Figure 8. The amount of heat produced in the DH areas where the information was collected was 95%, 86%, and 99% of the total DH produced in Estonia, Latvia, and Lithuania, respectively. Thus, the DH sectors in each country are well represented.
Footnotes
- ^ Ministry of Economic Affairs and Communications (in Estonian), ‘Heating Sector’, 2019.
- ^ Central Statistical Bureau of Latvia, ‘ENG120. Fuel Consumption and Heat Produced in Heat Plants’, 2020.
- ^ Central Statistical Bureau of Latvia, ‘ENG150. Fuel Consumption, Heat and Electricity Produced in Combined Heat and Power Plants’, 2020.
- ^ Lithuanian District Heating Association, ‘Lithuanian DH Sector Recent Developments’, 2019.
Figure 8. Annual heat production of the DH areas with collected data and total DH production
The DH areas were visualised using Arc GIS Pro[1]ESRI, ‘ArcGIS Pro’.. The information was obtained from the data sources given in Table 6. For Estonia, geographic information system (GIS) data, which contained administrative and settlement divisions, was used to visualise DH areas by filtering it using the data collected on the DH areas and comparing the results to a similar online map of the DH areas. The distribution of datasets on territorial units and their boundaries is currently not permitted in Latvia[2]Central Statistical Bureau of Latvia, ‘Maps and Spatial Data’, 2019. . Therefore, a dataset containing densely populated areas was used[3]Central Statistical Bureau of Latvia, ‘Densely Populated Areas (Experimental Statistics)’, 2019. and filtered according to the data collected on the DH areas. For Lithuania, a dataset containing settlements and population was used and filtered to show only areas with over 4000 residents. The highlighted areas in Figure 9 show the municipalities and/or regions where DH is present. However, these areas do not represent the exact location or boundaries of the DH networks. As shown, the largest DH areas are located in the largest cities, while smaller networks are spread throughout each country.
| Estonia | Latvia | Lithuania |
| Estonian Land Board: Administrative and settlement divisions84 | Central Statistical Bureau of Latvia: Densely populated areas (experimental statistics)86 | UAB HNIT-Baltic: Settlements and population (with data from Statistics Lithuania and SE Centre of Registers)87 |
| Competition Authority: an online map of DH areas and heat prices85 |
Table 6. GIS data sources used to visualise DH areas
[1]Estonian Land Board, ‘Administrative and Settlement Units’, 2020. [2]Estonian Competition Authority, ‘Limits of Heat Production Costs Agreed with the Estonian Competition Authority (in Estonian)’, 2020. [3]Central Statistical Bureau of Latvia, ‘Densely Populated Areas (Experimental Statistics)’, 2019. [4]Statistics Lithuania, ‘Population (Settlements) 2011’, 2015.
Footnotes
- ^ Estonian Land Board, ‘Administrative and Settlement Units’, 2020.
- ^ Estonian Competition Authority, ‘Limits of Heat Production Costs Agreed with the Estonian Competition Authority (in Estonian)’, 2020.
- ^ Central Statistical Bureau of Latvia, ‘Densely Populated Areas (Experimental Statistics)’, 2019.
- ^ Statistics Lithuania, ‘Population (Settlements) 2011’, 2015.
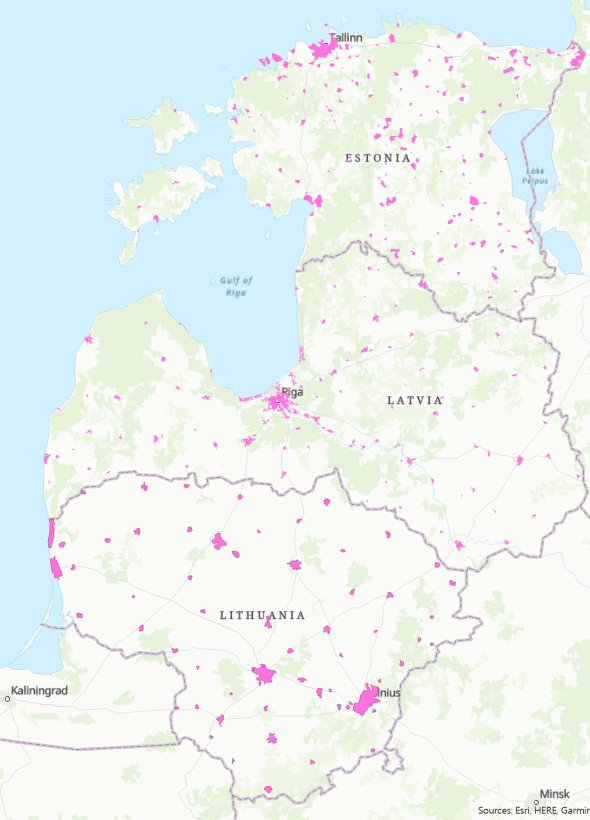
Figure 9. Identified DH areas in the Baltic states
1.5 High-temperature heat sources
The following definitions for high-temperature heat sources have been considered in the context of using HPs to supply DH:
-
High-temperature heat sources for HPs to supply DH can be based on industrial excess heat and flue gas from heat production plants.
-
Industrial excess heat is surplus heat that is released to the ambient air after an industrial process.
-
Flue gas is the exhaust gas released to the ambient air after a combustion process (for example, at a DH plant).
-
Excess heat above the DH supply temperature (e.g. 90°C) can be supplied directly into the DH network using a heat exchanger and additional piping.
-
Excess heat below the DH supply temperature (e.g. 90°C) requires a HP or an electric boiler to raise the temperature of the excess heat to the DH supply temperature.
High-temperature heat sources include power plants, boilers, CHP plants (flue gas), as well as industrial processes such as cement, dairy, wood or food processing (industrial excess heat).
1.5.1 Industrial excess heat
Industrial excess heat usually requires higher temperatures than other natural or unnatural heat sources. It was analysed and given a detailed description by Bühler et al.[1]Fabian Bühler, Stefan Petrovic, and others, ‘Industrial Excess Heat for District Heating in Denmark’, Applied Energy, 205 (2017), 991–1001. based on Denmark data. They determined the potential of using excess heat in various industrial sectors, calculated the potentially available excess heat, and the temperatures required for it to be generated. It turned out that 5% of the existing heat demand can be covered by industrial excess heat obtained from thermal processes. It is more likely to be used in industrial areas where it can be integrated into a local DH network, as opposed to other areas. It was estimated that industrial excess heat can provide a total of 1.36 TWh a year, for 36% of which HPs would be necessary to raise the temperature to the level needed. DH companies and industrial partners must enter into agreements to permit and allocate investments and ensure long-term stability[2]Danish Energy Agency, ‘Guide for Large-Scale Heat Pump Projects in District Heating Systems (in Danish)’, 2017. . A lot more information is available in Bühler et al.[3]Fabian Bühler, ‘Energy Efficiency in the Industry: A Study of the Methods, Potentials and Interactions with the Energy System’, 2018. .
1.5.2 Flue gas
Flue gas generated in the process of burning fuel by plants to generate heat or electricity can achieve temperatures anywhere from 50°C to 100°C. This means that flue gas can be condensed to preheat the DH return line before it gets to the plant. The temperature of the flue gas can be further condensed with the help of HPs until it decreases to about 20°C. Thus, the return temperature of the DH network increases even more, improving the efficiency of the plant. HPs that utilise flue gas as a heat source must compensate for the small temperature difference between the heat source and the supply. Designing HPs is relatively easy and inexpensive. HPs that utilise flue gas require another plant to burn fuel, which hinders their potential for savings[4]Danish Energy Agency, ‘Guide for Large-Scale Heat Pump Projects in District Heating Systems (in Danish)’, 2017.. Flue gas-based HPs are quite small in terms of capacity. The capacity of HP installations in Denmark ranges from 0.3 MW to 1.1 MW[5]PlanEnergi, ‘Overview of Large-Scale Electric (and Gas) Driven Heat Pumps, Which Produce Heat for Danish District Heating (in Danish)’, 2019., and the installations are often heat-driven.
1.5.3 Characteristics of high-temperature heat sources
The information on high-temperature heat sources was gathered using various environmental reports as shown in Table 7.
Footnotes
- ^ Fabian Bühler, Stefan Petrovic, and others, ‘Industrial Excess Heat for District Heating in Denmark’, Applied Energy, 205 (2017), 991–1001.
- ^ Danish Energy Agency, ‘Guide for Large-Scale Heat Pump Projects in District Heating Systems (in Danish)’, 2017.
- ^ Fabian Bühler, ‘Energy Efficiency in the Industry: A Study of the Methods, Potentials and Interactions with the Energy System’, 2018.
- ^ Danish Energy Agency, ‘Guide for Large-Scale Heat Pump Projects in District Heating Systems (in Danish)’, 2017.
- ^ PlanEnergi, ‘Overview of Large-Scale Electric (and Gas) Driven Heat Pumps, Which Produce Heat for Danish District Heating (in Danish)’, 2019.
SHORTCUTS
1.1 Key findings
1.2 District heating today
1.3 Heat pumps today
1.4 Characteristics of existing district heating areas
1.5 High-temperature heat sources
1.6 Low-temperature heat sources
1.7 Excess heat potential of heat sources used by large-scale heat pumps
1.8 Low-temperature heat source potential based on GIS proximity analysis
1.9 Example of three district heating areas with access to heat sources
| Estonia | Latvia | Lithuania |
| A and B air pollution permits (the list can be obtained upon request from the Environmental information system, permits are available online93 | A and B air pollution permits (the list can be obtained upon request from the Environment state Bureau, permits are available online95 | A and B air pollution permits (available online97 |
| Estonian Competition Authority94 | Public Utilities Commission96 | Annual GHG report (2019)98 |
| SEG permits (available online)99 |
Table 7. Sources for information on high-temperature heat sources
[1]‘Environmental Information System KOTKAS’. [2]Estonian Competition Authority, ‘Limits of Heat Production Costs Agreed with the Estonian Competition Authority (in Estonian)’, 2020. [3]‘The State Environmental Service of the Republic of Latvia’. [4]‘The Public Utilities Commission (PUC)’. [5]The Environmental Protection Agency (EPA)’. [6]The Environmental Protection Agency (EPA)’. [7]The Environmental Protection Agency (EPA)’.
Footnotes
- ^ ‘Environmental Information System KOTKAS’.
- ^ Estonian Competition Authority, ‘Limits of Heat Production Costs Agreed with the Estonian Competition Authority (in Estonian)’, 2020.
- ^ ‘The State Environmental Service of the Republic of Latvia’.
- ^ ‘The Public Utilities Commission (PUC)’.
- ^ The Environmental Protection Agency (EPA)’.
- ^ The Environmental Protection Agency (EPA)’.
- ^ The Environmental Protection Agency (EPA)’.
The information provided in Table 8 was collected for various high-temperature heat sources available in each Baltic country. The selection criterion was to consider all installations with an installed capacity above 10 MW, because the investments needed to utilise a smaller heat source would probably not be justified. Given that the available excess heat from various processes can account for 10-30% of the annual primary energy consumption (PEC), the amount that could be used in smaller sources would not be significant enough to justify investing into large-scale HPs.
| Parameter | Location | Type | Annual heat consumption | Installed capacity (>10 MW) | Fuel used |
| Unit | Coordinates | Boiler, CHP, industry | MWh | MW | Type, amount |
Table 8. Characteristics of the information collected on high-temperature heat sources
The amount and type of fuel were used to calculate the annual PEC for each heat source, considering the lower heating value (LHV) of each fuel, was gathered on 174 high-temperature heat sources in Estonia, 106 heat sources in Latvia, and 99 heat sources in Lithuania. An overview is provided in Figure 10 and Figure 11. PEC for each sector by country and the total number of heat sources by sector are given. 14 different sectors were identified, as shown in the picture. Plastic and rubber, as well as paint and soap, are not depicted separately due to their low potential. Heat consumption by the plastic and rubber sector (2 GWh, EE) was included in the chemical sector, while paint and soap consumption of heat (6 GWh, LV) was added to ‘Other’. All facilities not related to any of the sectors presented were grouped under the ‘Other’, including airports, agriculture, greenhouses, hospitals, construction, fuel storage, and lingerie production. ‘Other minerals’ include industrial facilities related to e.g. rockwool and lime stone.
Figure 10. Annual PEC by industrial sectors (excluding chemicals) and number of sources (#)
Figure 11. Annual PEC by heat production plants and the chemical sector and number of sources (#)
Chemical, cement, refinery, and wood industries are dominant in Estonia. They have an annual PEC of 16011 GWh. The asphalt and food industries are also represented at 1449 GWh with 63 and 10 heat sources, respectively. Besides, CHP plants and boilers provide additional potential for generating excess heat from flue gas, considering they have an annual PEC of 14029 GWh. The two power plants located in Narva have an annual PEC of about 52115 GWh. For better comparison and clarity, this amount was excluded from the analysis, although the plants were taken into account.
In Latvia, the dominant industrial sectors are cement and wood with an annual PEC of 3779 GWh. Refineries, food, and pharmaceuticals account for 993 GWh of PEC. Boiler and CHP PEC is rather high at 22002 GWh.
Lithuanian industry is dominated by the chemical, cement, and paper sectors with an annual PEC of 14064 GWh. The food sector has an energy consumption of 601 GWh per year. Lithuania has a large number of boilers resulting in 10385 GWh of primary energy (PE) consumed by them. The excess heat potential of the CHP plants is still quite low compared to other countries. This may change once new CHP plants are built.
A summary of the total PEC is given in Table 9. We can see that Estonia and Lithuania have a high level of consumption in the industrial sector. Latvia has a comparably high consumption of PE, considering boilers and CHP plants. Narva power plants are the two largest oil shale-fired power plants in the world with a very high PEC.
| Primary energy consumption, GWh | Estonia | Latvia | Lithuania |
| Industrial excess heat | 18867 | 6257 | 15598 |
| Boilers and CHP plants | 14029 | 22002 | 13654 |
Table 9. Primary energy consumption in each country
An overview of the locations of all identified high-temperature heat sources can be found in Figure 12 along with the DH areas in each country. Many high-temperature heat sources are concentrated in large cities, while others are spread throughout the country. Some of them are located in DH areas or nearby, others are located in remote areas. An analysis of the proximity of high-temperature heat sources to DH areas is provided in Section 1.7.2.
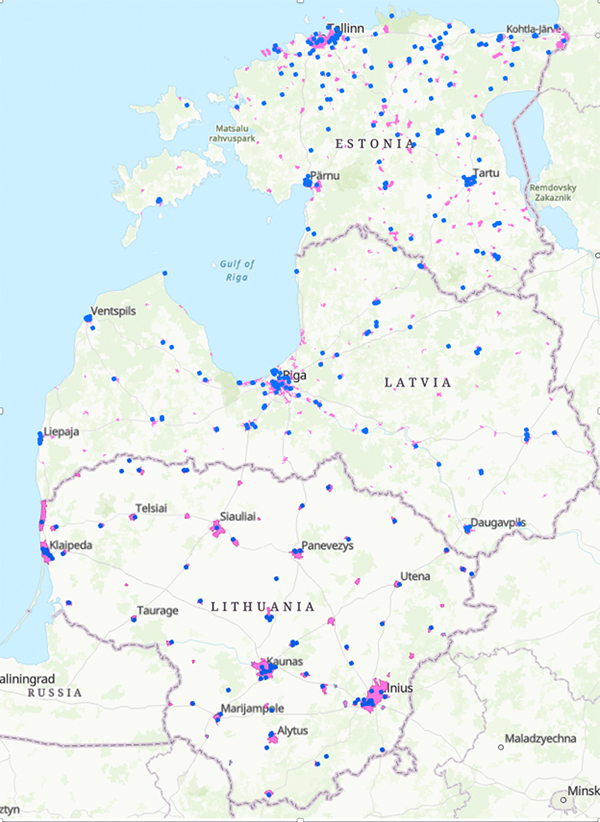
Figure 12. High-temperature heat sources (blue dots) and DH areas (in pink)
1.6 Low-temperature heat sources
The following definitions of low-temperature heat sources have been considered in the context of using HPs to supply DH:
-
Sources with temperatures close to the ambient temperature, i.e. below 30°C, can be referred to as low-temperature heat sources. They are mainly based on natural sources.
-
Examples of low-temperature heat sources include seawater, ambient air, groundwater, lake water, river water, and sewage water.
Low-temperature heat sources for HPs can have very different temperature levels throughout the year. In addition, they might be limited in capacity or availability. The main heat sources for a small HP system at an individual building include ambient air, exhaust air, lake or river water, and the ground (geothermal energy from soil). Large-scale HP systems mainly use large bodies of water as a source, for example, lakes, seas, rivers, as well as treated sewage water[1]Thore Berntsson, ‘Heat Sources - Technology, Economy and Environment’, International Journal of Refrigeration, 25.4 (2002), 428–38. . In the following several potential low-temperature heat sources suitable for large-scale HPs are described in detail. Information is added, if a heat source can also be used as a heat sink to provide cooling.
1.6.1 Low-temperature heat sources considered for analysis
Seawater
Seawater can be used as both the heat source and heat sink. It is affected by changes in ambient conditions, particularly surface water. The deeper the point of seawater extraction is located, the less it is affected by the ambient conditions. Winter is the most critical period in terms of heating, because the temperature of the seawater is at its lowest and the heat demand is often at its highest. Surface water can also be close to freezing point. Hence, it becomes increasingly difficult to extract heat from the seawater without coming across freezing issues. HPs can be designed to accommodate higher volume flow rates to ensure a lesser temperature difference between the seawater entering and leaving the evaporator. This requires a larger heat transfer area and is more expensive. It may be more profitable to take water from deeper spots. This is how large HPs in Oslo, Norway[2]Zahid Ayub, ‘World’s Largest Ammonia Heat Pump (14 MWh) for District Heating in Norway—A Case Study’, Heat Transfer Engineering, 2016. , and Stockholm, Sweden operate[3]Friotherm AG, ‘Värtan Ropsten – The Largest Sea Water Heat Pump Facility Worldwide , with 6 Unitop ® 50FY and 180 MW Total Capacity’, 2017. . In Oslo, the water is extracted from deep fjords 800 m offshore where the temperature of the water is constant all year round at 8°C-9°C and 4°C returned. In Stockholm, the water is extracted from a 15 m depth where the temperature of the water is 3°C (in winter). Another option is to design new HPs that can use latent energy when seawater freezes[4]Danish Energy Agency, ‘Guide for Large-Scale Heat Pump Projects in District Heating Systems (in Danish)’, 2017 100. PlanEnergi, ‘Report about Heat Storage Technologies and Large-Scale Heat Pumps Used in District Heating Systems (in Danish)’, 2013, p. 113.. In Denmark, it is generally prohibited to return water to the environment if it has been cooled by more than 5 K. Besides, the water must not be cooled to temperatures lower than 2°C[5]PlanEnergi, ‘Report about Heat Storage Technologies and Large-Scale Heat Pumps Used in District Heating
Systems (in Danish)’, 2013, p. 113.. Exceptions can, of course, be made. Moreover, saltwater, minerals, and algae affect the equipment, so it must be made using special materials or be covered with a special coating to come in contact with seawater. The equipment also requires regular cleaning.
Seawater is a suitable heat source for HPs with a large capacity due to the large volume of water. If the water is taken at a particular depth, freezing issues can be prevented because the temperature of the water is more or less constant. Seawater has also been utilised in cooling through free cooling and refrigeration plants. This can provide the information and experience necessary to establish access to seawater. Seawater must be accessible and located close enough. In this case, it could be better than ambient air due to the higher densities that require lower volume flow rates, making it possible to install larger capacities. Moreover, the temperature of the seawater is lower in the summer and more constant compared to ambient air.
Footnotes
- ^ Thore Berntsson, ‘Heat Sources - Technology, Economy and Environment’, International Journal of Refrigeration, 25.4 (2002), 428–38.
- ^ Zahid Ayub, ‘World’s Largest Ammonia Heat Pump (14 MWh) for District Heating in Norway—A Case Study’, Heat Transfer Engineering, 2016.
- ^ Friotherm AG, ‘Värtan Ropsten – The Largest Sea Water Heat Pump Facility Worldwide , with 6 Unitop ® 50FY and 180 MW Total Capacity’, 2017.
- ^ Danish Energy Agency, ‘Guide for Large-Scale Heat Pump Projects in District Heating Systems (in Danish)’, 2017 100. PlanEnergi, ‘Report about Heat Storage Technologies and Large-Scale Heat Pumps Used in District Heating Systems (in Danish)’, 2013, p. 113.
- ^ PlanEnergi, ‘Report about Heat Storage Technologies and Large-Scale Heat Pumps Used in District Heating
Systems (in Danish)’, 2013, p. 113.
SHORTCUTS
1.1 Key findings
1.2 District heating today
1.3 Heat pumps today
1.4 Characteristics of existing district heating areas
1.5 High-temperature heat sources
1.6 Low-temperature heat sources
1.7 Excess heat potential of heat sources used by large-scale heat pumps
1.8 Low-temperature heat source potential based on GIS proximity analysis
1.9 Example of three district heating areas with access to heat sources
Data on surface water across various regions can be easily collected daily or monthly. Obtaining water column temperatures can be challenging. The National Database of Denmark (ODA)[1]Danish Environmental Protection Agency, ‘Flooding Database’, 2019. , managed by the Danish Environmental Protection Agency provides measurement data for various depths and locations in Denmark[2]Ministry of Environment and Food of Denmark, ‘The Danish Environmental Protection Agency’. . Around the Baltic, it was found that the temperature of seawater near the seabed is measured in Latvia by the Latvian Environment, Geology and Meteorology Centre[3]Latvian Environment Geology and Meteorology Centre, ‘Data Search’, 2020. .
River and lake water
River and lake water can be used as both the heat source and heat sink. They possess the same temperature characteristics as seawater. In Denmark, the same rule of not cooling water not lower than by 5K and not below 2°C applies[4]PlanEnergi, ‘Report about Heat Storage Technologies and Large-Scale Heat Pumps Used in District Heating
Systems (in Danish)’, 2013, p. 113.. Lakes and rivers can also be found inland and cities with heating and cooling needs are often located in close proximity to large rivers or lakes. The capacity of river and lake water is usually lower than that of seawater. It is limited either by the volume of the water in the case of a lake or by the water flow of the river. Additionally, the water depth can be less than in the case of seawater. Dirt such as grass, algae, etc. may affect performance, which means the equipment will require regular cleaning. The source capacity can be estimated using the volume flow rate of the river and the water volume of the lake. This information together with current regulatory requirements for the return flow temperature can help identify capacity limitations. Large lake water-based HPs have been built in Lausanne, Switzerland and various locations around Sweden[5]Andrei David and others, ‘Heat Roadmap Europe: Large-Scale Electric Heat Pumps in District Heating Systems’, Energies, 2017, 1–18.. Just like seawater, lake and river water can be used for cooling. However, it should be noted that the capacity is limited and is based on size and volume flow rates. More information can be found in[6]Danish Centre for Environment and Energy, ‘Runoff in Danish Rivers Technical Report from NERI, No. 340’,
2000; [7]Danish Ministry of Environment and Food, ‘Water Area Planning (in Danish)’, 2019..
Sewage water
Sewage water temperature is often higher than the ambient temperature, and the volume flow rates are large. Hence, sewage water can be a suitable heat source. In Denmark, there are about 1300 sewage treatment plants, and it was estimated that their potential heat capacity was 350 MW in 2013; however, 25% of which may be located too far from the DH networks or may not be able to compete with nearby waste incineration plants[8]PlanEnergi, ‘Report about Heat Storage Technologies and Large-Scale Heat Pumps Used in District Heating Systems (in Danish)’, 2013, p. 113.. Treated sewage water is typically considered because biological sewage water treatment is sensitive to temperature changes and therefore should not be disturbed[9]AS Tallinna Vesi, ‘Personal Communication with Mattias Müür’, 2018. . Besides, using untreated water may require extra care when passing through the HP evaporator, as it requires cleaning equipment and heat exchanger design modification. Experience has shown, however, that even treated sewage water contains many nutrients that can promote the growth of bacteria[10]Danish Energy Agency, ‘Guide for Large-Scale Heat Pump Projects in District Heating Systems (in Danish)’, 2017.. Therefore, clean-in-place (CIP) equipment and filters may be required to guarantee smooth operation[11]Danish Energy Agency, Inspiration Catalogue for Large-Scale Heat Pump Projects in District Heating’, (in Danish), 2017..
A lot of large HPs that use sewage water have been installed in Sweden, for example, in Malmö with a heat capacity of 40 MW[12]Kenneth Hoffman, ‘Large Scale Heat Pumps for High Efficiency District Heating Projects’, IOR, 2018. . In Denmark, the largest HP that uses sewage water is located in Kalundborg and has a capacity of 10 MW[13]Danish Energy Agency, Inspiration Catalogue for Large-Scale Heat Pump Projects in District Heating’, (in Danish), 2017.. The information on sewage water temperatures and volume flow rates ca be obtained from sewage treatment plant operators. Further data processing and analysis may be needed.
Footnotes
- ^ Danish Environmental Protection Agency, ‘Flooding Database’, 2019.
- ^ Ministry of Environment and Food of Denmark, ‘The Danish Environmental Protection Agency’.
- ^ Latvian Environment Geology and Meteorology Centre, ‘Data Search’, 2020.
- ^ PlanEnergi, ‘Report about Heat Storage Technologies and Large-Scale Heat Pumps Used in District Heating
Systems (in Danish)’, 2013, p. 113. - ^ Andrei David and others, ‘Heat Roadmap Europe: Large-Scale Electric Heat Pumps in District Heating Systems’, Energies, 2017, 1–18.
- ^ Danish Centre for Environment and Energy, ‘Runoff in Danish Rivers Technical Report from NERI, No. 340’,
2000; - ^ Danish Ministry of Environment and Food, ‘Water Area Planning (in Danish)’, 2019.
- ^ PlanEnergi, ‘Report about Heat Storage Technologies and Large-Scale Heat Pumps Used in District Heating Systems (in Danish)’, 2013, p. 113.
- ^ AS Tallinna Vesi, ‘Personal Communication with Mattias Müür’, 2018.
- ^ Danish Energy Agency, ‘Guide for Large-Scale Heat Pump Projects in District Heating Systems (in Danish)’, 2017.
- ^ Danish Energy Agency, Inspiration Catalogue for Large-Scale Heat Pump Projects in District Heating’, (in Danish), 2017.
- ^ Kenneth Hoffman, ‘Large Scale Heat Pumps for High Efficiency District Heating Projects’, IOR, 2018.
- ^ Danish Energy Agency, Inspiration Catalogue for Large-Scale Heat Pump Projects in District Heating’, (in Danish), 2017.
1.6.2 Alternative low-temperature heat sources that were not considered
Additional heat sources can be used for large-scale HPs besides the ones described above. However, they may be exploited at a later point in time due to various reasons explained below (e.g. lower temperature, small capacity). Therefore, the following heat sources were not considered for the study.
Ambient air
Ambient air can be used as both the heat source and heat sink. It is greatly influenced by the ambient conditions. The ambient air temperature is very cold in winter and very warm in summer. This trend is the opposite of what would be best for heating and cooling needs. In particular, the Baltic climate is much colder than the one from regions at which large-scale air-source HPs have been installed. Due to its easy and cheap access, it is often used for individual buildings.
Humidity is an important parameter for heating, and it is usually quite high in winter. In this case, evaporator defrosting is necessary. Various defrosting methods are described in scientific literature, including electric heating, hot gas bypass, and passive defrosting. An overview of such methods is provided in Mengjie et al.[1]Song Mengjie and others, ‘Review on Improvement for Air Source Heat Pump Units during Frosting and Defrosting’, Applied Energy, 211 (2018), 1150–70. . Moreover, a surplus of the minimum required evaporator capacity can be installed to supply heat under specified conditions and simultaneously defrost part of the evaporator. This leads to an increase in investments needed for large HPs. This was done for large air-based HPs in Denmark[2]Solid Energy A/S, ‘Personal Communication with Jørn Windahl’, 2018. . Another disadvantage of ambient air is the fact that it needs large volume flow rates due to the low density of air compared to water-based sources. A large area is needed to accommodate the evaporators, about 102 m2/MW per an installed HP in Ringkøbing[3]Danish Energy Agency, ‘Guide for Large-Scale Heat Pump Projects in District Heating Systems (in Danish)’, 2017.. Moreover, fan operation is noisy, which can be an issue. One way to deal with it is to put up sound absorption walls around the evaporators. One manufacturer tested noise levels based on the number of fans, distance from the plant, and the type of environment. Noise levels below 60dB and 50dB already exist at the distance of 20 m and 40 m, respectively from a large plant[4]Solid Energy A/S, ‘Sound Levels of Air-Source Heat Pumps’, 2018. . Higher ambient temperatures increase HP performance and heating capacity.
The greatest advantage of ambient air over other heat sources is its accessibility. No additional investments are needed to access this source, except for the evaporator itself. In Denmark, there are five air-based HPs with a capacity of over 0.8 MW, with the largest and newest of them having a heat capacity of 7.3 MW[5]Stovring District heating, ‘Application for Municipality Guarantee for Loan (in Danish)’, 2018. [6]PlanEnergi, ‘Overview of Large-Scale Electric (and Gas) Driven Heat Pumps, Which Produce Heat for Danish District Heating (in Danish)’, 2019.. It is expected that more large HPs that use ambient air as a heat source will follow[7]Danish Energy Agency, ‘District Heating Companies Recieve 23 Mio. Danish Crowns for Large-Scale Heat Pumps (in Danish)’, 2017.. In terms of cooling, ambient air is usually used together with free cooling during winter, refrigeration plants during summer, and a combination of both in-between. Hourly data on temperature and relative humidity can be obtained online or from weather services and nearby weather stations, free of charge or for a small fee.
Groundwater
Groundwater can be used as both the heat source and heat sink. The water temperature is fairly constant throughout the year. In Denmark, groundwater temperatures range from 8°C to 11°C, based on the depth and location of the groundwater reservoir[8]Danish Energy Agency, Inspiration Catalogue for Large-Scale Heat Pump Projects in District Heating’, (in Danish), 2017.. The temperature of groundwater in Estonia at a depth between 25 m and 75 m is 6.5°C to 7°C[9]MAAKUTE.EE, ‘4 Different Types of Geothermal Heating: Shallow Geothermal, Bore Holes, Groundwater,Water Reservoir(in Estonian)’, 2018. [10]‘Borehole Information Portal (in Estonian)’, 2018. [11]Groundwater Comission (Estonia), ‘Use and Protection of Estonian Groundwaters’, 2004. which lowers its potential benefits compared to Danish conditions. Groundwater can be found at various depths, for example, 30 m, 100 m or 200 m, which depends on the underground formation and different layers. In Copenhagen, groundwater was extracted from the depths ranging from 90 m to 115 m to be used by HP[12]COWI A/S, ‘Initial Assessment of Hydrogeological Conditions - Outer Nordhavn (in Danish)’, 2015. . In Broager, groundwater was extracted from 250 m deep[13]Danish Energy Agency, Inspiration Catalogue for Large-Scale Heat Pump Projects in District Heating’, (in Danish), 2017.. To use groundwater as a heat source, detailed research and test drillings must be conducted, and it often requires several wells, which is extremely expensive.
Groundwater can be extracted and re-injected in a variety of ways, as detailed in[14]Danish Energy Agency, ‘Guide for Large-Scale Heat Pump Projects in District Heating Systems (in Danish)’, 2017.. One of the options is to distribute cooled groundwater through horizontal pipes located under the surface. This option can prove to be cheaper compared to other solutions. This option is possible when the groundwater is oxidised, that is, if it contains oxygen but does not manganese and iron. Thus, there is no need for the special coating of pipes, HP parts and drain pipes. The groundwater will slowly make its way back to the reservoir. Another way is to re-inject the cooled groundwater into another well. This solution is more expensive because of the extra costs associated with drilling another well. Still, this solution would also work for groundwater containing iron and manganese, since it does not come into contact with oxygen. A third option is used in Copenhagen, where the cooled groundwater is discharged into the sea. The distance between the intake and re-injection points must be large enough to ensure that cold water does not get mixed with warm water. In addition, the volume flow rate for an individual well in a specific area may be limited as the pumping temporarily affects the surrounding groundwater. Depending on the capacity and flow rate of the groundwater, the volume flow rate cannot exceed 70-100 m3/h during peak hours and 30-50 m3/h on average per year[15]Danish Energy Agency, Inspiration Catalogue for Large-Scale Heat Pump Projects in District Heating’, (in Danish), 2017. [16]COWI A/S. Initial assessment of hydrogeological conditions - Outer Nordhavn, (in Danish), 2015.. Therefore, when planning for HPs with a large capacity, it must be noted that wells must be placed within several hundred metres from each other to avoid interference.
Lund and Persson[17]Rasmus Lund and Urban Persson, ‘Mapping of Potential Heat Sources for Heat Pumps for District Heating in Denmark’, Energy, 46 (2015). consider groundwater to be a perfect heat source for HPs in Denmark because of its geographical distribution in Denmark, close proximity to the cities, as well as its potential heat capacity. Several large HPs that use groundwater are operating in Denmark. The capacity of the HPs ranges from 0.8 MW for the Copenhagen HP to 4.0 MW for the Broager HP[18]Danish Energy Agency, Inspiration Catalogue for Large-Scale Heat Pump Projects in District Heating’, (in Danish), 2017. [19]PlanEnergi, ‘Overview of Large-Scale Electric (and Gas) Driven Heat Pumps, Which Produce Heat for Danish District Heating (in Danish)’, 2019.. Such capacities need large amounts of groundwater, which is difficult to extract and re-inject without compromising long-term stability. For that reason, the practical limit is somewhere around 5 MW[20]PlanEnergi, ‘Personal Communication with Bjarke Lava Paaske’, 2018..
Groundwater can also be used as an aquifer thermal energy storage (ATES) to provide heating in winter and cooling in summer and keep heat balance throughout the year. This can be done using groundwater from one reservoir during, for example, the heating season, which is then cooled and stored in a second groundwater reservoir. The second reservoir can then be used to provide cooling in summer. For this solution, the distance between the two wells should not be as great as in the case of using groundwater for heating only. Pumping and re-injection counterbalance each other to some extent, so that the groundwater level is barely affected[21]Danish Energy Agency, ‘Guide for Large-Scale Heat Pump Projects in District Heating Systems (in Danish)’, 2017.. ATES systems are widely used in the Netherlands.
Drinking water
Drinking water can be used as both the heat source and heat sink. Groundwater is the actual heat source, but the drinking water network infrastructure is already in place. In Denmark, the potential was estimated at about 2320 GWh/a. When extracted from the ground, the temperature of the water is 8-9°C[22]PlanEnergi, ‘Report about Heat Storage Technologies and Large-Scale Heat Pumps Used in District Heating Systems (in Danish)’, 2013, p. 113.. In summer, the groundwater supply temperature can exceed the upper limit of 12°C for Denmark[23]Bjarne Bach, ‘Integration of Heat Pumps in Greater Copenhagen’, 2014. . Therefore, cooling it by means of heat pumping can be beneficial. Lowering the water temperature for other purposes may not produce a significant effect. A portion of the temperature loss can be recovered during transmission through water pipes. Individual HPs, electric heaters, boilers, etc. can be used to heat water for domestic use in a building. We need a better understanding of the entire system, including centralised and decentralised production plants and the pipeline network. Such studies were conducted by Pasquale et al.[24]A.M. De Pasquale and others, ‘District Heating by Drinking Water Heat Pump: Modelling and Energy Analysis of a Case Study in the City of Milan’, Energy, 118 (2017), 246–63. for Milan, Italy and Hubeck-Graudal[25]Helga Hubeck-Graudal, ‘Feasibility of Using the Copenhagen Drinking Water Supply as a Heat Source in the District Heating Network’, February, 2015. for Copenhagen, Denmark. Both concluded that drinking water can be considered as a heat source for large HPs. The thermal energy of the drinking water recovered en route to the consumer was about 10% for Milan and 35% for Copenhagen.
Depending on the temperature of the drinking water, it can also be used for cooling. However, due to the drinking water supply temperature limitations, it cannot be used in summer when the cooling demand is highest. An example of an existing installation is Enwave’s Deep Lake Water Cooling System located in Ontario, Canada[26]Acciona, ‘Deep Lake Water Cooling System’, 2004. . Water is extracted from the bottom of Lake Ontario at a constant temperature of 4°C through 5 km long pipes. It is then pumped into a plant in Toronto, where it exchanges energy with another stream that supplies cooling to city buildings. The heated water is then transported and integrated into the city’s drinking water supply system.
District cooling
The return water from the district cooling (DC) network can be used as a heat source for HPs. DC water is usually supplied at a constant temperatures of 6-10°C and returned from the end user at a temperature of 10-16°C[27]S. K. Ernstsen, A. Dyrelund, and T. K. E. Barky, ‘District Cooling - a Natural Part of Future Cities’, 2013; Henrik Lorentsen Bøgeskov, ‘Eco-City’, 2011. . This means that this source of heat maintains relatively high and constant temperatures. The capacity available depends on the cooling needs. It usually does not match the heating demand. Synergy can occur when a base load for cooling, such as server cooling, exists during the cold season. A solution like this can also be used when there is a sufficiently high demand for DHW in the summer, and cooling of office buildings, shopping malls, etc. is also necessary. Heating and cooling could then be provided by a single plant, making it economically feasible. Combining heating and cooling demands can be alleviated by using hot and cold storages or seasonal storages. The HP project in Tårnby, Denmark, with a cooling capacity of 4.3 MW and a heating capacity of 6.1 MW is an example of such a solution[28]Ramboll, ‘Project Proposal for a Heat Pump and District Cooling in Tårnby (in Danish)’, 2018. . The potential of DC in the Baltic states is still quite limited and needs to be explored further.
1.6.3 Measurement data
In this study, seawater, river and lake water, and cleaned sewage water were considered as potential heat sources. Other heat sources include ambient air, groundwater and low-temperature excess heat from cooling processes occurring in server rooms, supermarkets, underground stations, or the DC network. A list of sources of information on low-temperature heat sources is given in Table 10, and an overview of the measurement parameters collected in 2019 is provided Table 11. In the case of daily measurements, the same temperature or average volume flow rate was used for each hour of the day. Hourly ambient air temperature measurements were used to calculate heating degree days for selected regions. For treated sewage water, the volume flow rate and temperature of the sewage water were obtained from a single sewage water treatment plant and further processed, as described in[29]Henrik Pieper, Vladislav Mašatin, and others, ‘Modelling Framework for Integration of Large-Scale Heat Pumps in District Heating Using Low-Temperature Heat Sources: A Case Study of Tallinn, Estonia’, International Journal of Sustainable Energy Planning and Management, 20 (2019), 67–86.. The same temperature profile was used for all other plants, and the volume flow rate was adjusted according to the plants’ capacities.
Footnotes
- ^ Song Mengjie and others, ‘Review on Improvement for Air Source Heat Pump Units during Frosting and Defrosting’, Applied Energy, 211 (2018), 1150–70.
- ^ Solid Energy A/S, ‘Personal Communication with Jørn Windahl’, 2018.
- ^ Danish Energy Agency, ‘Guide for Large-Scale Heat Pump Projects in District Heating Systems (in Danish)’, 2017.
- ^ Solid Energy A/S, ‘Sound Levels of Air-Source Heat Pumps’, 2018.
- ^ Stovring District heating, ‘Application for Municipality Guarantee for Loan (in Danish)’, 2018.
- ^ PlanEnergi, ‘Overview of Large-Scale Electric (and Gas) Driven Heat Pumps, Which Produce Heat for Danish District Heating (in Danish)’, 2019.
- ^ Danish Energy Agency, ‘District Heating Companies Recieve 23 Mio. Danish Crowns for Large-Scale Heat Pumps (in Danish)’, 2017.
- ^ Danish Energy Agency, Inspiration Catalogue for Large-Scale Heat Pump Projects in District Heating’, (in Danish), 2017.
- ^ MAAKUTE.EE, ‘4 Different Types of Geothermal Heating: Shallow Geothermal, Bore Holes, Groundwater,Water Reservoir(in Estonian)’, 2018.
- ^ ‘Borehole Information Portal (in Estonian)’, 2018.
- ^ Groundwater Comission (Estonia), ‘Use and Protection of Estonian Groundwaters’, 2004.
- ^ COWI A/S, ‘Initial Assessment of Hydrogeological Conditions - Outer Nordhavn (in Danish)’, 2015.
- ^ Danish Energy Agency, Inspiration Catalogue for Large-Scale Heat Pump Projects in District Heating’, (in Danish), 2017.
- ^ Danish Energy Agency, ‘Guide for Large-Scale Heat Pump Projects in District Heating Systems (in Danish)’, 2017.
- ^ Danish Energy Agency, Inspiration Catalogue for Large-Scale Heat Pump Projects in District Heating’, (in Danish), 2017.
- ^ COWI A/S. Initial assessment of hydrogeological conditions - Outer Nordhavn, (in Danish), 2015.
- ^ Rasmus Lund and Urban Persson, ‘Mapping of Potential Heat Sources for Heat Pumps for District Heating in Denmark’, Energy, 46 (2015).
- ^ Danish Energy Agency, Inspiration Catalogue for Large-Scale Heat Pump Projects in District Heating’, (in Danish), 2017.
- ^ PlanEnergi, ‘Overview of Large-Scale Electric (and Gas) Driven Heat Pumps, Which Produce Heat for Danish District Heating (in Danish)’, 2019.
- ^ PlanEnergi, ‘Personal Communication with Bjarke Lava Paaske’, 2018.
- ^ Danish Energy Agency, ‘Guide for Large-Scale Heat Pump Projects in District Heating Systems (in Danish)’, 2017.
- ^ PlanEnergi, ‘Report about Heat Storage Technologies and Large-Scale Heat Pumps Used in District Heating Systems (in Danish)’, 2013, p. 113.
- ^ Bjarne Bach, ‘Integration of Heat Pumps in Greater Copenhagen’, 2014.
- ^ A.M. De Pasquale and others, ‘District Heating by Drinking Water Heat Pump: Modelling and Energy Analysis of a Case Study in the City of Milan’, Energy, 118 (2017), 246–63.
- ^ Helga Hubeck-Graudal, ‘Feasibility of Using the Copenhagen Drinking Water Supply as a Heat Source in the District Heating Network’, February, 2015.
- ^ Acciona, ‘Deep Lake Water Cooling System’, 2004.
- ^ S. K. Ernstsen, A. Dyrelund, and T. K. E. Barky, ‘District Cooling - a Natural Part of Future Cities’, 2013; Henrik Lorentsen Bøgeskov, ‘Eco-City’, 2011.
- ^ Ramboll, ‘Project Proposal for a Heat Pump and District Cooling in Tårnby (in Danish)’, 2018.
- ^ Henrik Pieper, Vladislav Mašatin, and others, ‘Modelling Framework for Integration of Large-Scale Heat Pumps in District Heating Using Low-Temperature Heat Sources: A Case Study of Tallinn, Estonia’, International Journal of Sustainable Energy Planning and Management, 20 (2019), 67–86.
| Estonia | Latvia | Lithuania |
| Estonian Weather Service (upon request)147 | Latvian Environment, Geology and Meteorology Centre (available online)148 | Lithuanian Hydrometeorological Service, Hydrological Observations Division (upon request)149 |
Table 10. Data sources for river, lake, seawater, and ambient air measurements
| Heat source | Seawater | Rivers | Lakes | Ambient air | ||
| Parameter (hourly or daily) | Temperature at sea bed or surface | Salinity at sea bed and surface | Temperature at surface | Volume flow rate | Temperature at bottom and/or surface | Temperature |
| Unit | °C | ‰ | °C | m3/h | °C | °C |
| Locations | 12 | 1 | 17 | 13 | 7 | 18 |
Table 11. River, lake, seawater, and ambient air measurements
An overview of water temperatures for different heat sources can be found in Figure 13. This indicates which heat source has the highest temperatures throughout the year.
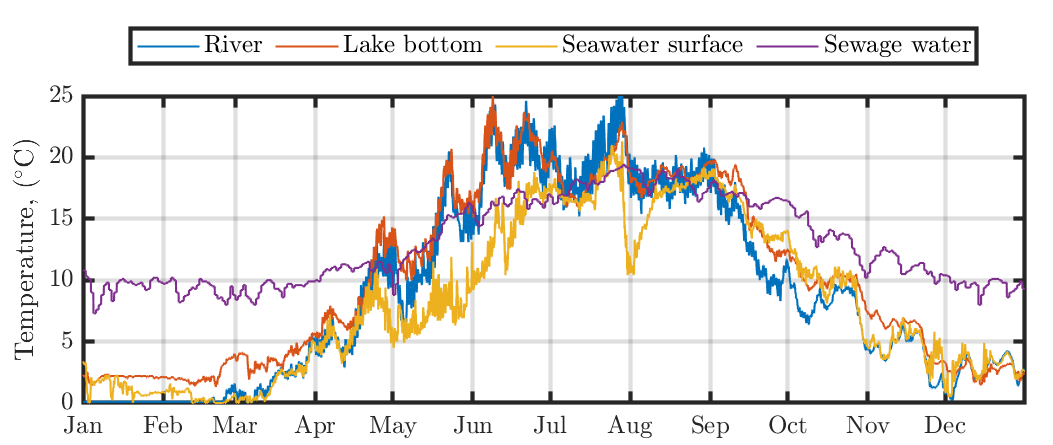
Figure 13. Heat source temperatures
As can be seen, sewage water maintains relatively high temperatures during the colder period when the heat demand is usually higher. In January and February, the temperature of lake, river, and seawater is close to freezing. Consequently, it can become very difficult to extract additional heat from these sources during these periods of high heat demand. A heat exchanger would have to be designed to accommodate for a small temperature difference, which would result in large water volume flow rates. This affects investment and equipment size. To avoid very low water temperatures and freezing, water from lakes, rivers, and the sea can be taken from several metres (≈10 m) below the surface of the water. At this depth, water is less affected by ambient conditions compared to the surface water. Thereby, a constant temperature of 2-4°C can be achieved. This is evident from the lake water temperature in Figure 13, which was measured at the bottom of the lake (at the depth of 4 m). The data has shown that rivers in the Baltic states are often very shallow. Therefore, surface water temperatures were considered. For seawater, both the surface water and seabed water temperature were measured in the same year only in Latvia for very few locations (Liepaja, Ventspils and Kolka). Hourly data from the measurement station in Liepaja was used from 2016, 2017 and 2018. The difference between surface and seabed water temperature was calculated for every hour for every year. Then, the mean value of these three temperature differences was calculated for every hour. Then, a moving average for each hour was calculated based on the temperature differences in the previous 24 h. Then, these temperature differences were added to surface water temperatures at other locations in order to estimate the water temperature at 10 m depth.
The temperature of the heat source is not the only selection criterion. Other important parameters include available capacity, distance to DH, special equipment or investments, which may vary depending on the heat source.
1.6.4 Geographic information system data
An overview of the sources used to obtain the GIS data on lake, river, seawater, and sewage treatment plants is presented in Table 12.
For Estonia, this information includes the type of the water body type, the area it covers, a unique identification code and location. In addition, information was obtained on the average depth of the lakes, as well as the basin area of rivers. This allowed us to calculate the volume of the lakes and, consequently, the available heat capacity. The depth of lakes was taken into account, when a water temperature profile was chosen for each lake (e.g. surface, 2 m, 4 m, 6 m or 8 m). The basin area of rivers was used as an indicator of the size or capacity of the river compared to others. This parameter was used to adjust the volume flow rates of rivers. Data was obtained for rivers with no available measurements. Only lakes with a surface area of more than 1 km2 were considered as potential heat sources, with 50 lakes meeting this criterion. Only the dataset for watercourses wider than 8 m were considered as potential river water-based heat sources, resulting in 5493 elements that were used. However, a single river may be composed of many elements of this dataset, so the exact number of rivers is unknown. Thus, the largest sources were used for further analysis, while the smaller ones could not provide enough heat to supply DH using large-scale HPs. For Latvia, only lakes with a perimeter of more than 5000 m were considered for further analysis, which amounted to 175 waterbodies. The rivers were grouped by size. All rivers above the value of 40 were considered, resulting in 132 rivers. For Lithuania, GIS information was found for 187 rivers and 357 lakes. The same calculations, as for Estonia, were performed to determine the heat capacity according to the volume and volume flow rate for the rivers and lakes in Latvia and Lithuania.
| Estonia | Latvia | Lithuania |
| Estonian Land Board: Waterbodies150 | SIA Envirotech: Waterbodies, Watercourses, and Shoreline152, 153,154 | SE ‘GIS-Centras’: Annex I. Hydrography (INSPIRE dataset)155 |
| Environmental Register151 | MapCruzin.com: Waterways, based on the data from OpenStreetMap.org156 | |
| Seawater depth and distance to shore157, 158 | ||
| EU’s Urban Waste Water Treatment Directive159 | ||
Table 12. Sources for GIS data on lake, river, seawater, and sewage treatment plants
[1]Estonian Land Board, ‘Waterbodies’, 2020. [2]Public Sercvice of the Environmental Register, ‘Environmental Register’, 2020. [3]SIA Envirotech, ‘Envirotech Data: Shoreline’, 2016. [4]SIA Envirotech, ‘Envirotech Data: Water Bodies’, 2016. [5]SIA Envirotech, ‘Envirotech Data: Watercourses’, 2016. [6]SE ‘GIS-Centras’, ‘Annex I. Hydrography (INSPIRE Dataset)’, 2014. [7]MapCruzin.com and OpenStreetMap.org, ‘Lithuania Waterways’, 2020. [8]Siim Ots, ‘Nautic Map’, 2018. [9]Ministry of Environmental Protection and Regional Development of the Republic of Latvia, ‘Marine Spatial Planning (MSP): A Map of the Depth of the Sea’, 2013. [10]European Environment Agency, ‘Urban Waste Water Treatment Map’, 2019.
Footnotes
- ^ Estonian Land Board, ‘Waterbodies’, 2020.
- ^ Public Sercvice of the Environmental Register, ‘Environmental Register’, 2020.
- ^ SIA Envirotech, ‘Envirotech Data: Shoreline’, 2016.
- ^ SIA Envirotech, ‘Envirotech Data: Water Bodies’, 2016.
- ^ SIA Envirotech, ‘Envirotech Data: Watercourses’, 2016.
- ^ SE ‘GIS-Centras’, ‘Annex I. Hydrography (INSPIRE Dataset)’, 2014.
- ^ MapCruzin.com and OpenStreetMap.org, ‘Lithuania Waterways’, 2020.
- ^ Siim Ots, ‘Nautic Map’, 2018.
- ^ Ministry of Environmental Protection and Regional Development of the Republic of Latvia, ‘Marine Spatial Planning (MSP): A Map of the Depth of the Sea’, 2013.
- ^ European Environment Agency, ‘Urban Waste Water Treatment Map’, 2019.
For seawater, the coastline can be used to determine which DH areas are located nearby. In addition, seawater must be accessed at a depth of about 10 m to avoid heat source temperatures that are too low in winter. A depth of 10 m was found about 1 km off the coast of the Baltic states. This will require additional investment in pipelines, which must be considered further. In total, information was available on 219 sewage treatment facilities, including 57 in Estonia, 97 in Latvia, and 65 in Lithuania. Information on the capacity of sewage treatment plants and their location was also obtained. The capacity of sewage water treatment plants was measured in population equivalent (p.e.), which is the ratio of the pollution load from industrial facilities and services compared to the individual pollution load from households produced by one person during a 24 h period.
An overview of all identified heat sources is provided in Figure 14 with lakes (in blue), rivers (in black), sewage treatment plants (in red), DH areas (in pink) and the Baltic Sea (in light blue) depicted on the map.
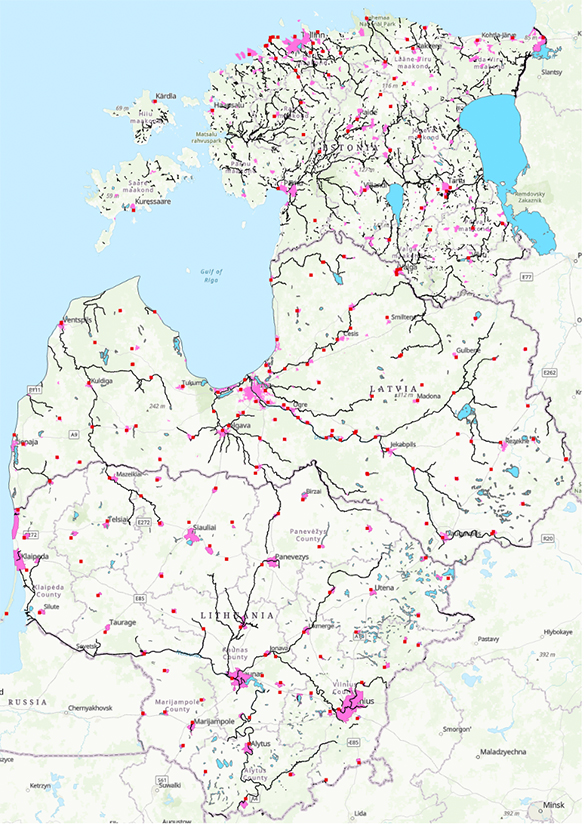
Figure 14. Low-temperature heat sources and DH areas (in pink)
1.7 Excess heat potential of heat sources used by large-scale heat pumps
Section 1.5 provided the data on annual PEC of 174, 106, and 99 high-temperature heat sources in Estonia, Latvia, and Lithuania, respectively. Industrial excess heat accounted for 18867 GWh, 6257 GWh, and 15598 GWh of PE, respectively. For boilers and CHP plants, it was 14029 GWh, 22002 GWh and 13654 GWh. Estonia consumed an additional 52115 GWh of PE for the two power plants in Narva.
1.7.1 Theoretical high-temperature excess heat potential
Based on the PEC and common processes involved in the identified industrial sectors, the excess heat factors can be defined as the ratio of the excess heat available divided by its PE use[1]Fabian Buhler, ‘Energy Efficiency in the Industry: A Study of the Methods, Potentials and Interactions with the
Energy System’, 2018.. Knowing the excess heat factors from an industrial sector allows us to estimate the excess heat available from another facility within the same sector. In other studies, the excess heat factor is also referred to as the default recovery efficiency[2]U. Persson, B. Möller, and S. Werner, ‘Heat Roadmap Europe: Identifying Strategic Heat Synergy Regions’, Energy Policy, 74.C (2014), 663–81. . An overview of typical values of the excess heat factor for different industries based on different studies and countries is shown in Table 13.
SHORTCUTS
1.1 Key findings
1.2 District heating today
1.3 Heat pumps today
1.4 Characteristics of existing district heating areas
1.5 High-temperature heat sources
1.6 Low-temperature heat sources
1.7 Excess heat potential of heat sources used by large-scale heat pumps
1.8 Low-temperature heat source potential based on GIS proximity analysis
1.9 Example of three district heating areas with access to heat sources
| Industrial sector | Denmark - Process163 | Norway164 | Germany165 | EU166 |
| Food | 0.18 | 0.15 | 0.1 | 0.1 |
| Wood, Pulp and paper | 0.17 | 0.44 | 0.09-0.1 | 0.25 |
| Chemical | 0.19 | 1.571 | 0.09 | 0.25 |
| Plastic & Rubber | 0.24 | - | 0.17 | - |
| Non-metal minerals | 0.25 | 0.46 | 0.15 | 0.25 |
Table 13. Example of excess heat factors for six different industrial sectors (based on[1]Fabian Buhler, ‘Energy Efficiency in the Industry: A Study of the Methods, Potentials and Interactions with the
Energy System’, 2018.)
Footnotes
- ^ Fabian Buhler, ‘Energy Efficiency in the Industry: A Study of the Methods, Potentials and Interactions with the
Energy System’, 2018.
[1]Fabian Buhler, ‘Energy Efficiency in the Industry: A Study of the Methods, Potentials and Interactions with the
Energy System’, 2018. [2]Enova, ‘Study of the Potentials for the Utilisation of Excess Heat from the Norwegian Industry (In Norwegian: Potensial for Energieffektivisering i Norsk Landbasert Industri)’, 2009. [3]Sarah Brückner, ‘Industrial Excess Heat in Germany (German)’ (Technical University of Munich, 2016). [4]U. Persson, B. Moller, and S. Werner, ‘Heat Roadmap Europe: Identifying Strategic Heat Synergy Regions’, Energy Policy, 74.C (2014), 663–81.
1 Including exothermic reactions
Footnotes
- ^ Fabian Buhler, ‘Energy Efficiency in the Industry: A Study of the Methods, Potentials and Interactions with the
Energy System’, 2018. - ^ Enova, ‘Study of the Potentials for the Utilisation of Excess Heat from the Norwegian Industry (In Norwegian: Potensial for Energieffektivisering i Norsk Landbasert Industri)’, 2009.
- ^ Sarah Brückner, ‘Industrial Excess Heat in Germany (German)’ (Technical University of Munich, 2016).
- ^ U. Persson, B. Moller, and S. Werner, ‘Heat Roadmap Europe: Identifying Strategic Heat Synergy Regions’, Energy Policy, 74.C (2014), 663–81.
Eleven different industrial sectors have been identified in the Baltic countries. An additional group was created that contains all other industries that did not fit into the identified sectors, and its excess heat factor was assumed as 0.15. Furthermore, boilers, CHP plants and power plants were also considered as potential sources of excess heat for HPs, e.g. for using the low-temperature flue gas as potential heat source. The excess heat factors for the industrial sectors were based on the identified excess heat potential of various industries in Denmark, as described by Bühler[1]Fabian Buhler, ‘Energy Efficiency in the Industry: A Study of the Methods, Potentials and Interactions with the
Energy System’, 2018.and presented in Table 14.
Footnotes
- ^ Fabian Buhler, ‘Energy Efficiency in the Industry: A Study of the Methods, Potentials and Interactions with the
Energy System’, 2018.
| Industrial sector | Excess heat factor | Industrial sector | Excess heat factor |
| Asphalt | 0.27 | Pharmaceuticals | 0.19 |
| Bricks | 0.21 | Plastic and Rubber | 0.18 |
| Cement | 0.26 | Refineries | 0.19 |
| Chemicals | 0.15 | Wood | 0.17 |
| Food | 0.18 | Other | 0.15 |
| Metal production | 0.37 | Energy production plant | Excess heat/flue gas factor |
| Other minerals | 0.25 | Boilers | 0.05 |
| Paint and Soap | 0.1 | CHP plants | 0.04 |
| Paper | 0.08 | Power plants | 0.5 |
Table 14. Excess heat factors for the Baltic countries (based on the excess heat potential data from[1]Fabian Buhler, ‘Energy Efficiency in the Industry: A Study of the Methods, Potentials and Interactions with the
Energy System’, 2018.)
Footnotes
- ^ Fabian Buhler, ‘Energy Efficiency in the Industry: A Study of the Methods, Potentials and Interactions with the
Energy System’, 2018.
For industrial excess heat, the temperature of the heat available was not examined in detail. It can be different for different sectors and also within a sector. Depending on the process, the heat may be available at different temperatures. For example, in the wood industry, the largest amount of excess heat comes from the drying processes (over 50%). The drying temperature may vary based on the type of wood (soft or hard). In addition, excess heat can come from other heating and space heating processes, as well as conversion and transmission losses[1]Fabian Bühler, ‘Personal Communication’, 2020. . For this study, it was assumed that excess heat from industries is available at an average of 150°C. At this temperature, a heat exchanger and additional piping between the DH network and the industrial excess heat source can be used to supply DH from that industrial excess heat source, as shown in Figure 15.
Footnotes
- ^ Fabian Bühler, ‘Personal Communication’, 2020.
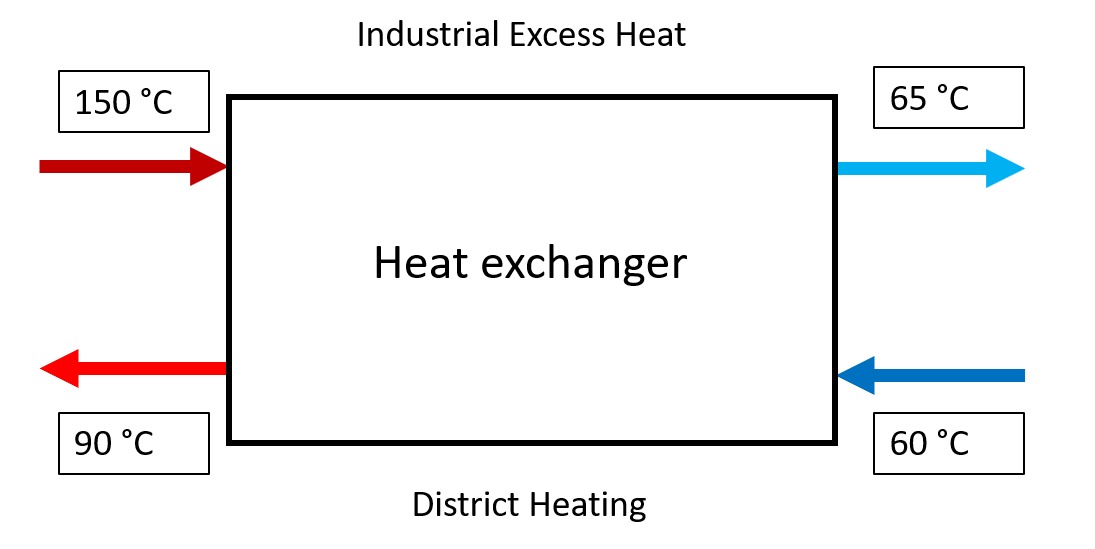
Figure 15. Industrial excess heat used by direct heat exchange to supply DH
The remaining heat at 50°C to 65°C can then be used by HPs to supply DH. Thus, the excess heat source is cooled further, and the HP and heat exchanger can share the pipeline between the heat source and the DH network. The amount of energy that can be used by the heat exchanger and the HP along with the temperature levels are shown in the Temperature-Heat (T-Q) diagram in Figure 16.
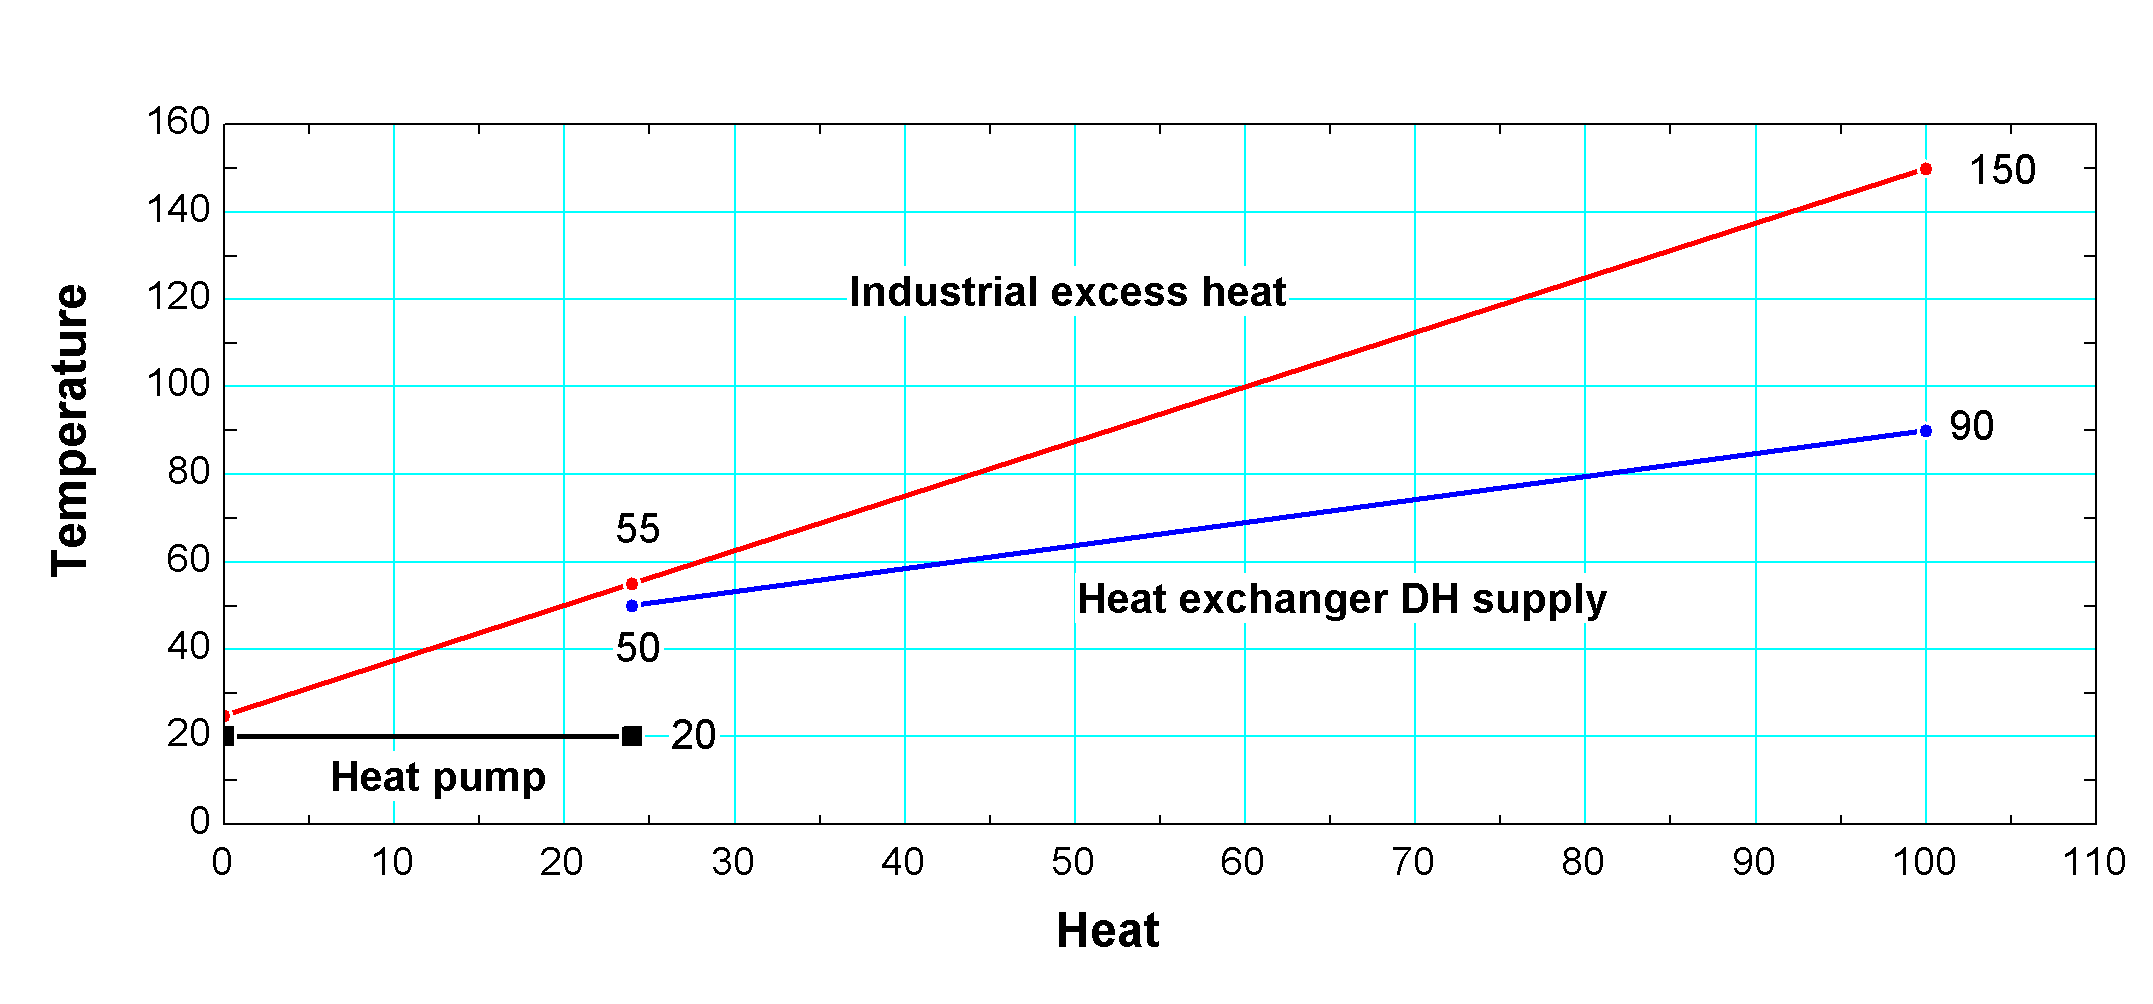
Figure 16. T-Q diagram of the utilisation of industrial excess heat by direct heat exchange and HP
Depending on the available excess heat temperature, the ratio between the excess heat that can be used by direct heat exchange and by HP changes, as shown in Figure 17, for excess heat temperatures between 150°C and 250°C. As shown, the proportion of heat used by the HP ranges from 35% to 20%. For the current study, it was assumed that the excess heat that can be used by HPs accounts for 33% of the total excess heat potential of an industrial heat source. This amount represents the capacity of the heat source. The resulting heat depends on the HP COP and, therefore, it is higher by the factor COP/(COP-1).
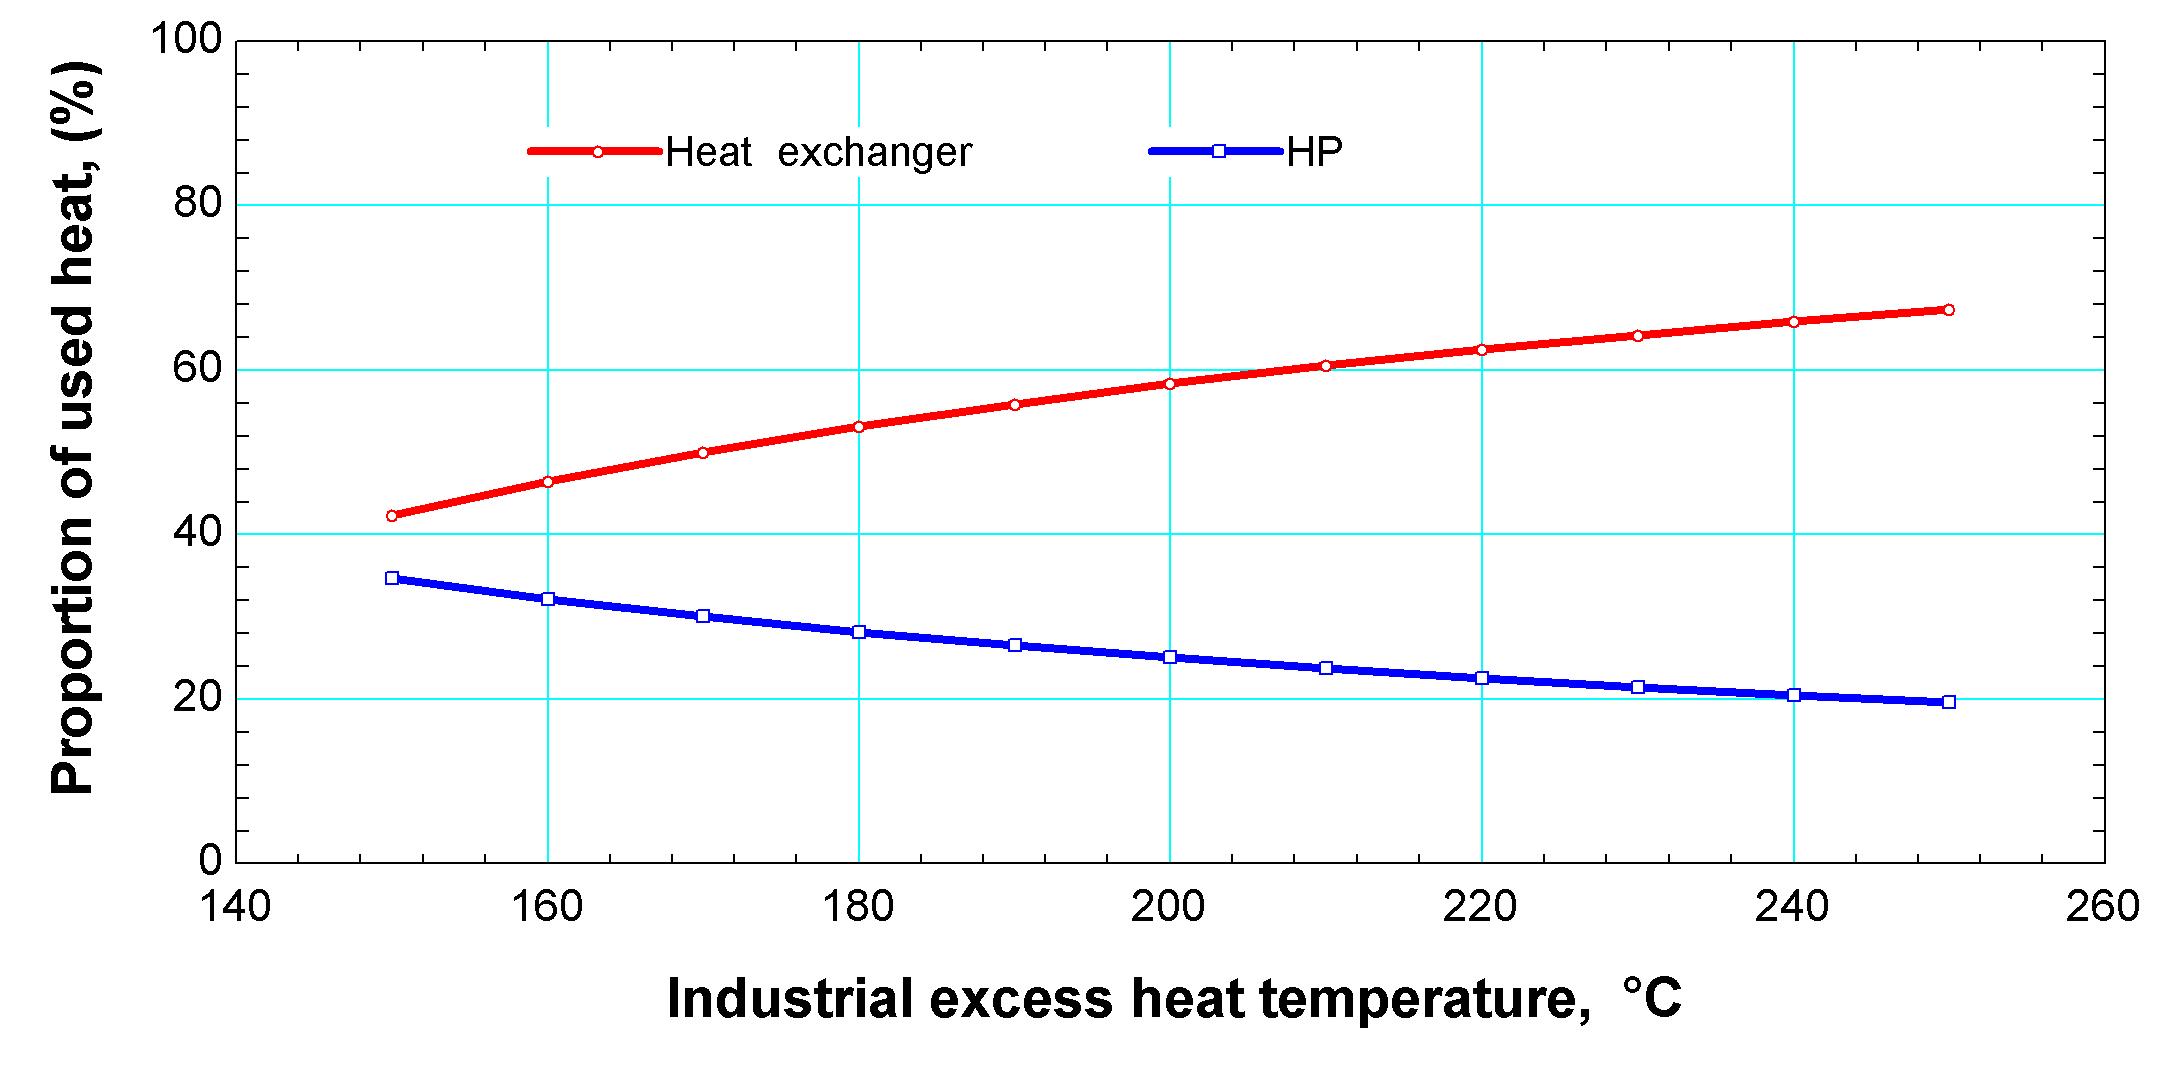
Figure 17. Proportion of heat used for the heat exchanger and HP depending on the industrial excess heat temperature
The excess heat factor from Persson et al.[1]U. Persson, B. Moller, and S. Werner, ‘Heat Roadmap Europe: Identifying Strategic Heat Synergy Regions’,
Energy Policy, 74.C (2014), 663–81. was used for power plants. For boilers, a boiler efficiency of 0.85 was adopted for biomass plants. Then, it was decided that boilers should first be equipped with a flue gas condenser, before investing in HP. The flue gas condenser cleans and cools the flue gases from approx. 150°C to approx. 50°C, while preheating the DH return water. The HP can then additionally cool the flue gases to about 20°C, while further preheating the DH return water. This will increase plant efficiency and result in higher COPs, as opposed to supplying DH directly through the HP. As a result, the share of flue gas cooled by the HP is about 20%, while the share of flue gas cooled by the condenser is about 80%. Therefore, an excess heat factor of 0.05 was assumed for the boilers. For CHP plants, we used the same flue gas calculation as for boilers. The excess heat factor has been further reduced since not all excess heat is released as flue gas to the ambient atmosphere. Up to 2/5 of excess heat is released into the environment as water from the condenser[2]Baijia Huang, Fabian Bühler, and Fridolin Müller Holm, ‘Industrial Energy Mapping: THERMCYC WP6’, Technical University of Denmark, 2015. . An excess heat factor of 0.04 was assumed. The utilisation of flue gases from boilers and CHP plants is shown in Figure 18.
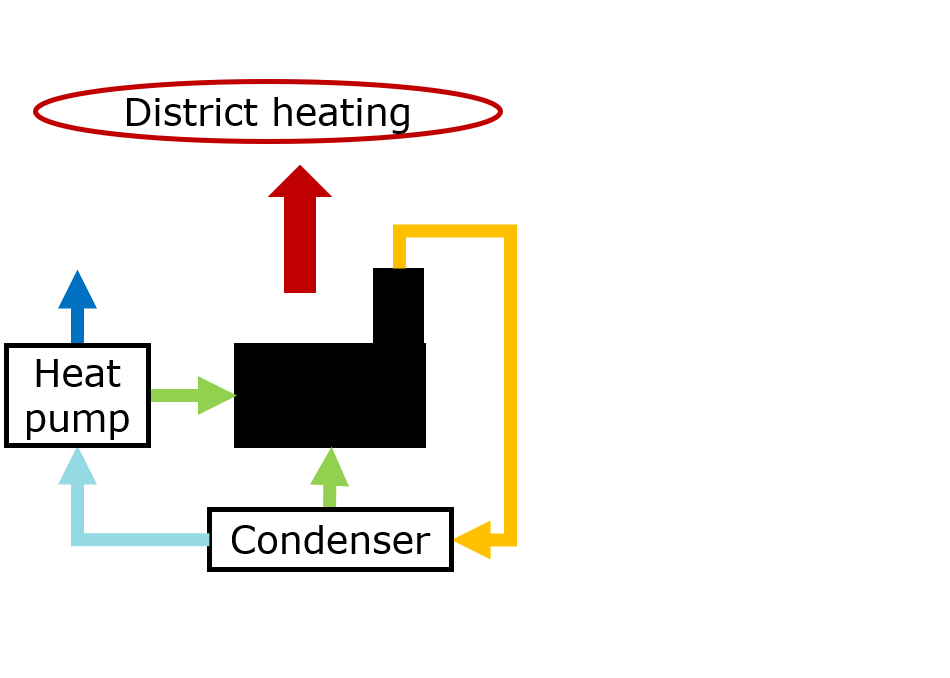
Figure 18. Utilisation of flue gas from boilers and CHP plants
The theoretical potential of high-temperature excess heat sources to supply DH can be determined by taking into account PEC, excess heat factors, and heat that can be supplied directly or via HP, as shown in Figure 19. It was not considered whether the high-temperature excess heat source is already supplying excess heat to the DH network or not. This is the case for the Kiviõli Keemiatööstuse OÜ chemical plant, which cogenerates power and heat used by the company and the city[1]Estonian Chemical Industry Association, ‘Kiviõli Keemiatööstuse OÜ’, 2019. . This should be analysed separately for each source when the need arises.
Footnotes
- ^ Estonian Chemical Industry Association, ‘Kiviõli Keemiatööstuse OÜ’, 2019.
Figure 19. Theoretical excess heat potential of high-temperature heat sources
The potential of the chemical sector and that of one of the power plants are not shown in Figure 19. It is much higher than in other sectors. The chemical sector has an excess heat potential of 1351 GWh in Estonia and of 1804 GWh in Lithuania. In Estonia, the high excess heat potential comes mainly from three facilities: Kiviõli Keemiatööstuse OÜ (427 GWh), Kohtla-Järve Põlevkiviõlitehas Petroter (300 GWh), and Kohtla-Järve Mineraalväetisehas Nitrofert (553 GWh). In Lithuania, 1730 GWh comes from Achema, a very large fertilizer production plant near Jonava. The two power plants near Narva have an excess heat potential of 26057 GWh, and one of the plants is already supplying heat to the city. As shown in Figure 19, other sectors with a high excess heat potential are cement (EE, LV, LT), refineries (EE), wood (EE, LV), asphalt (EE), and food (EE, LV, LT), as well as boilers (EE, LV, LT) and CHP plants (EE, LV, LT). An overview of the total theoretical excess heat potential for each country is given in Table 15 . The excess heat potential was divided into direct supply via heat exchanger (2/3) and supply via HP (1/3). For boilers and CHP plants, the excess heat potential refers to flue gases after the condenser, which can be used by the HP to preheat the DH return water.
| Theoretical excess heat potential, GWh | Estonia | Latvia | Lithuania |
| Industrial excess heat (total) | 3370 | 1199 | 2490 |
| Industrial excess heat (direct supply) | 2247 | 799 | 1660 |
| Industrial excess heat (supplied via HP) | 1123 | 400 | 830 |
| Boilers and CHP plants (flue gas HP) | 590 | 949 | 650 |
| Power plants | 26057 |
Table 15. Theoretical excess heat potential of each country
1.7.2 Practical potential of heat sources based on GIS proximity analysis
In the previous section, we determined the theoretical excess heat potential. However, the location of the heat source, as well as the distance to the existing DH areas were not taken into account. Therefore, ArcGis Pro[1]ESRI, ‘ArcGIS Pro’. was used to determine which heat sources are located within the specified DH areas, at a distance of 1 km or further away. The cut-off criterion of 1 km was chosen because otherwise the investments needed for pipelines would be too large. This may not be justified depending on the heat source capacity. Bühler[2]Fabian Buhler, ‘Energy Efficiency in the Industry: A Study of the Methods, Potentials and Interactions with the
Energy System’, 2018. used a cut-off criterion based on the maximum connection cost depending on the heat source and heat capacity. He found that connection costs increase rapidly over distances of more than 200m, but distances of 1 km or more are still feasible for the largest of the heat sources. An overview of the high-temperature heat sources and their availability in DH areas can be found in Table 16.
| Practical excess heat potential | Distance | Estonia | Latvia | Lithuania | |||
| km | # | GWh | # | GWh | # | GWh | |
| Industrial excess heat (direct supply and HP) | 0 | 44 | 2601 | 21 | 394 | 21 | 436 |
| <1 | 18 | 322 | 4 | 110 | 1 | 1730 | |
| >1 | 58 | 447 | 17 | 695 | 8 | 324 | |
| Boilers and CHP plants (flue gas HP) | 0 | 46 | 445 | 54 | 901 | 63 | 413 |
| <1 | 1 | 66 | 1 | 5 | 1 | 0 | |
| >1 | 9 | 79 | 9 | 43 | 5 | 237 | |
| Power plants | 0 | 1 | 6521 | ||||
| <1 | 0 | 0 | |||||
| >1 | 1 | 19536 |
Table 16. Practical excess heat potential of each country
As shown a lot of industrial excess heat sources are located within the DH areas. However, a significant share of them is located in rural areas, particularly in Latvia. This may be related to the way the DH areas were specified in the study, as described in Section 1.4. The DH areas in Latvia were based on densely populated areas, while the DH areas in Estonia and Lithuania were determined based on municipality boundaries. Thus, the regions considered as DH areas of the two countries in ArcGIS may appear larger than they actually are. Therefore, the focus of heat sources to consider should be based on the ones within these regions. It may not be economically feasible to consider the ones outside. Most of the boilers and CHP plants are located within the DH areas, which makes sense since they provide DH. As mentioned earlier, a large excess heat potential may be available at the Achema chemical fertilizer facility in Lithuania, which is within the 1 km distance of the DH area of Jonava. The two power plants in Estonia have a large potential of excess heat. One of the plants already supplies heat to the DH network, while the other is located about 20 km away. If necessary, a separate assessment should be performed.
The practical potential of the heat source can be used as a basis and input for the analysis in Chapter 2 in order to determine the technical potential, taking into account investments, capacities, and demands. A seasonal distribution of excess heat availability was assumed, according to Table 17. The annual available excess heat was distributed accordingly throughout the year by these factors and evenly for every hour of each season. For boilers and CHP plants, the availability of flue gas depends on the operation of these plants and was therefore limited for every hour by the generated heat times the flue gas factor, stated in Table 14.
| Industrial sector | Seasonal Industrial Excess Heat Distribution | |||
| Winter | Spring | Summer | Autumn | |
| Asphalt | 0 | 0.25 | 0.5 | 0.25 |
| Chemical & Pharmaceutical | 0.33 | 0.22 | 0.22 | 0.22 |
| All other sectors | 0.25 | 0.25 | 0.25 | 0.25 |
Table 17. Seasonal industrial excess heat distribution
1.8 Low-temperature heat source potential based on GIS proximity analysis
Also for the low-temperature heat sources, ArcGIS Pro[1]ESRI, ‘ArcGIS Pro’. was used to perform a proximity analysis to determine which DH areas contain the heat sources or are located within 1 km. An overview is provided in Table 18. As shown, DH areas with seawater access are mainly located in Estonia, followed by 9 in Latvia, and then Lithuania with the city of Klaipėda, Klaipėda county, and Palanga. Sewage treatment plants are usually located in every major city, but sometimes beyond city limits. Therefore, many DH areas have a sewage water treatment plant either within the DH area or within 1 km distance. Many DH areas with access to rivers are located in Estonia, as well as in Latvia and a few are in Lithuania. DH areas with access to large lakes are mainly located in Lithuania and to some extent in Estonia and Latvia.
Footnotes
- ^ ESRI, ‘ArcGIS Pro’.
| Low-temperature heat source potential | Distance | Estonia | Latvia | Lithuania |
| km | # | # | # | |
| DH areas with access to seawater | 0 | 18 | 9 | 3 |
| <1 | 4 | 0 | 0 | |
| DH areas with access to sewage water treatment plants | 0 | 33 | 41 | 23 |
| <1 | 11 | 28 | 10 | |
| DH areas with access to large rivers | 0 | 79 | 40 | 18 |
| <1 | 25 | 17 | 3 | |
| DH areas with access to large lakes | 0 | 11 | 11 | 16 |
| <1 | 8 | 10 | 7 |
Table 18. Low-temperature heat source potential of each country
1.8.1 Low-temperature heat source potential for large-scale heat pumps near district heating areas
The heat potential for low-temperature heat sources is provided below. No heat source capacity limitations were taken into account for seawater. The heat capacity of the seawater is probably greater than the heat demand HPs could supply from that source. However, a minimum allowable seawater inlet temperature of -0.5°C has been considered to avoid freezing issues. Due to the salt content, the freezing point can be below zero. This minimum allowable temperature at the HP evaporator inlet could result in the sea being too cold to extract a sufficient amount of heat during certain periods of the year. The evaporator of the seawater-based HP can be designed to accommodate a temperature difference of 3 K. Therefore, whenever seawater temperatures are below 2.5°C, the HP cannot provide the design heat load. This should be taken into account, as additional heat supply options or a larger HP capacity (greater investments) may be required. For sewage treatment plants, the capacity of each plant was provided in the dataset[1]European Environment Agency, ‘Urban Waste Water Treatment Map’, 2019., and the plant data on hourly temperatures and volume flow rates of the sewage water was available for reference. The hourly volume flow rates for each treatment plant were adjusted according to the plant’s capacity. For lakes, the volume was determined based on the surface area and average depth. The maximum available annual heat capacity was calculated considering the maximum temperature change of the entire body of water by 2 K to reduce an impact on the environment. This capacity was then used to calculate the hourly volume flow rate, considering a temperature difference of 3K and a minimum heat source temperature of 0.5°C. For rivers, the basin area was used as an indicator of the lake size. Hourly volume flow rates were measured for some rivers. The hourly volume flow rates of other rivers have been adjusted to reflect the change in basin area. This way, we can calculate the hourly heat source capacity of the entire river. The river can be used in different DH areas, but the total heat source capacity cannot be exceeded.
Footnotes
- ^ European Environment Agency, ‘Urban Waste Water Treatment Map’, 2019.
1.9 Example of three district heating areas with access to heat sources
In this section, examples of DH areas (one per country) and available high- and low-temperature heat sources within or near the DH area are discussed. This show what GIS data was used, how the GIS map can be used, and how the data can be used further.
For Estonia, Viljandi and the surrounding area was chosen as an example, as shown in Figure 20. The DH areas are depicted in pink, the sewage treatment plant in red, high-temperature heat sources in blue, lakes in light-blue, and rivers in black. Apart from Viljandi, Jämejala, Vana-Võidu, Viiratsi and Päri districts are also shown.
It can be seen that Vana-Võidu covers a large area similar to Viljandi, while the annual DH consumption is only about 1500 MWh, compared to 85000 MWh in Viljandi. When using and analysing the visualised data, it should be noted that the DH areas were visualised using GIS data of administrative and settlement divisions. Therefore, the actual DH area may be smaller. Nevertheless, it gives a good idea of the available DH areas and heat sources in the country and how far apart they are. One sewage treatment plant (Viljandi reoveepuhasti, Kösti) is located in East Viljandi with a capacity of 25000 p.e. One high-temperature heat source is located in Viljandi, which is a DH boiler house. Approximately 8 GWh of excess heat can be generated by this plant and subsequently used by a flue gas HP to preheat the DH return water. Two other high-temperature heat sources are located in Jämejala, which are also DH boiler houses with 5.6 GWh and 4.3 GWh of potential excess heat available. In addition, Lake Viljandi is located within the Viljandi district. It has an average depth of 5.6 m and a heat source capacity of 21 GWh. The Raudna River with a basin area of 1122 km2 begins at that lake and flows through Päri. To the east of Vana-Võidu are the rivers Tänassilma and Ärma, which can be considered as potential low-temperature heat sources for that DH area.
SHORTCUTS
1.1 Key findings
1.2 District heating today
1.3 Heat pumps today
1.4 Characteristics of existing district heating areas
1.5 High-temperature heat sources
1.6 Low-temperature heat sources
1.7 Excess heat potential of heat sources used by large-scale heat pumps
1.8 Low-temperature heat source potential based on GIS proximity analysis
1.9 Example of three district heating areas with access to heat sources
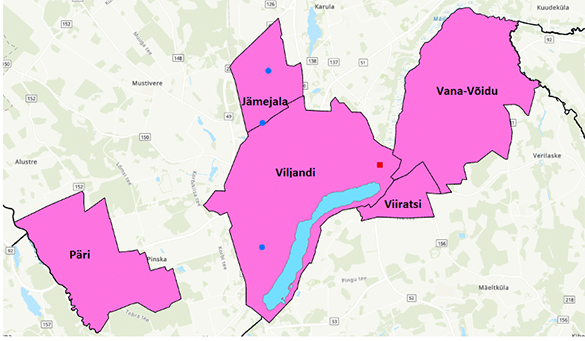
Figure 20. DH area and available heat sources around Viljandi, Estonia
For Latvia, Liepāja and the surrounding area was chosen, as shown in Figure 21. The DH areas are depicted in pink, sewage treatment plants in red, lakes in blue, and the sea is in the west. Apart from Liepāja, Grobiņa, Durbe and Priekule are also shown on the map. Two additional datasets are shown, municipalities (in green)[1]SIA Envirotech, ‘Envirotech Data: Parishes’, 2016. and cities (orange circles)[2]SIA Envirotech, ‘Envirotech Data: Cities’, 2016. , compared to the densely populated area dataset[3]Central Statistical Bureau of Latvia, ‘Densely Populated Areas (Experimental Statistics)’, 2019. used to represent the DH areas.
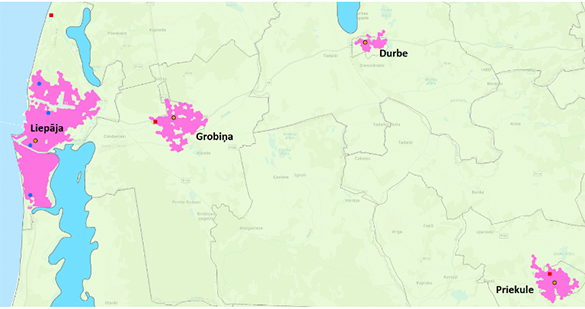
Figure 21. DH area and available heat sources around Liepāja, Latvia
As can be seen, the data on municipalities covers more area than the data on densely populated areas. Depending on the municipality, the difference can be rather significant. As a consequence, the sewage treatment plant north of Liepāja was considered to be too far for the analysis. Datasets of territorial units and their boundaries are not permitted at the moment[1]Central Statistical Bureau of Latvia, ‘Maps and Spatial Data’, 2019., as previously mentioned. Furthermore, the dataset of municipalities could not be altered by, for example, removing the regions that do not have DH. Therefore, further processing was difficult considering there are 576 elements. The dataset of cities could not be changed either, but there are only 76 elements. Additional datasets of smaller towns are necessary to represent all DH areas. However, this dataset only consists of points, not areas, so it is impossible to accurately determine the distance to the heat sources. Liepāja has four high-temperature heat sources: a boiler house with 10.7 GWh of potential flue gas in the north, a lingerie factory with 17.7 GWh of potential excess heat, and another smaller boiler house further south with 0.9 GWh of flue gas, and a large boiler house in the south with 28.8 GWh of potential flue gas for HP use. In addition, the sea is nearby with an access to a 10 m within 1 km. In addition, Liepāja is surrounded by two lakes, Lake Tosmāres in the north and the larger Lake Liepāja in the southeast. The other three DH areas have no high-temperature heat sources in the vicinity. Lake Durbe and the other two have one sewage treatment plant each.
For Lithuania, Alytus and the surrounding area was chosen, as shown in Figure 22. The DH areas are depicted in pink, sewage water treatment plants in red, lakes in blue, and rivers in black. Apart from Alytus, Varėna is also shown.
Footnotes
- ^ Central Statistical Bureau of Latvia, ‘Maps and Spatial Data’, 2019.
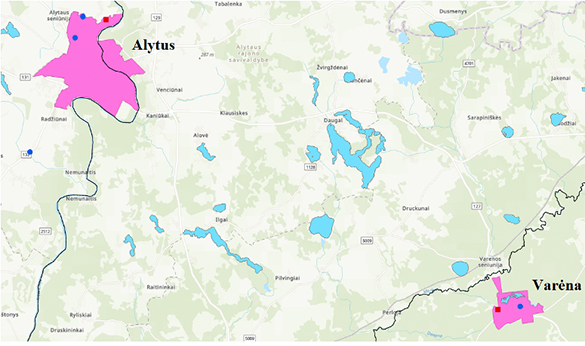
Figure 22. DH area and available heat sources around Alytus, Lithuania
As can be seen, Alytus has two high-temperature heat sources within the DH area. The one further north is a metal production with an excess heat potential of 3.5 GWh. The other high-temperature heat source consists of three boilers with a total HP flue gas potential of 17.9 GWh per year. The sewage treatment plant has a capacity of 220000 p.e. The Nemunas River flows through the city and can be used as a potential low-temperature heat source. To the south of Alytus, there is another high-temperature heat source producing mineral products (ceramics). It has an excess heat potential of 1 GWh, which is rather small and therefore not relevant for Alytus. The investments would simply not pay-off. Varėna has one boiler with a HP flue gas potential of 3.3 GWh. The sewage treatment plant has a capacity of 12000 p.e. The Merkys River can also be considered as a potential low-temperature heat source. However, the distance to the main region of Varėna is about 2 km. The distance to the DH network must be determined on site. Lake Varenos is probably not large enough to provide sufficient capacity.
These examples show how a GIS map depicting DH areas and high- and low-temperature heat sources can be used.
Chapter 2
Modelling the Future of Power and Heat Supply in the Baltic States with Heat Pumps
2.1 Key findings
-
Current heat pump representations in energy scenario analyses are often based on simple COP representations and identical investments regardless of the heat source.
-
In recent studies, heat pumps have been considered a relevant power-to-heat technology, expected to play an important role in the future of energy systems in the Baltics to counterbalance the high share of renewable energy sources.
For this study, the following approaches were used:
-
The largest district heating areas in each Baltic country were modelled individually (8 in Estonia, 7 in Latvia and 13 in Lithuania). Smaller district heating areas were aggregated to provide a high level of detail, but also for quick calculations based on detailed information about each district heating area in order to identify similarities.
-
Large-scale heat pumps are represented by hourly COPs for typical off-design operation based on variations in the temperature of the heat source and the district heating network. Heat pump investments are based on the heat source selected and differentiated for the use of seawater, industrial excess heat, and flue gas, as well as sewage water, rivers and lakes. In addition, detailed calculations of the capacity of heat sources were taken into account to determine the availability of each heat source during the year.
The main conclusions of the scenario analysis include:
-
In the Base scenario, large-scale heat pumps account for up to 54% and biomass-based production plants account for 33% in 2050. The use of natural gas is expected to decline steadily from 7.9 TWh in 2020 to 1.4 TWh in 2050.
-
In the Grid Tariffs scenario, the least amount of heat was generated by large-scale heat pumps. It can be concluded that current grid tariffs are hindering heat pump implementation. The share of large-scale heat pumps in heat generation in 2050 will be only about 24%.
-
In the Invest Support scenario, investments in large-scale heat pumps are subsidised by 50%, which has a big impact on heat pump implementation. In 2050, up to 68% of heat will be generated by heat pumps.
-
Storage facilities can play a significant role in the future of district heating systems regardless of the scenario. However, the synergy is greater with heat pumps than with other technologies. They can help balance the power grid by, for example, storing the heat generated by large-scale heat pumps, which is sometimes necessary for the power grid.
-
Large-scale heat pumps, together with heat storage, are essential to effectively reduce greenhouse gas emissions.
-
Excess heat is the most competitive heat source, but its availability in the Baltic states is limited. Treated sewage water is the next most competitive heat source, characterised by comparably high temperature for a low-grade heat source, high capacity, and close proximity to district heating areas. Additionally, seawater and river water were proposed based on the availability of other heat sources. Lake water does not play a significant role.
-
In 2050, under the Base scenario, the proportions of heat supplied by large-scale heat pumps, biomass-based plants, and natural gas-fired plants in Estonia will be about 61%, 23%, and 7%, respectively. In Latvia, the proportions for the same technologies will be about 55%, 25%, and 13%, respectively. In Lithuania, the proportions of heat supplied via large-scale heat pumps, biomass-based plants, and natural gas-fired plants will be about 50%, 42%, and 5%, respectively.
-
Sensitivity analysis showed that large-scale heat pumps often compete directly with biomass, and the relationship with heat production from natural gas is insignificant. This may be very relevant in future energy systems due to widespread discussions about the sustainability of high biomass use in the energy sector. It can be seen that the results change significantly compared to the Base scenario when the price of biomass changes, but not as drastically when the price of CO2 changes. The results demonstrate very well the three-way balance between the three main sources of heat in future district heating systems: large-scale heat pumps, biomass and natural gas.
SHORTCUTS
2.1 Key findings
2.2 Previous modelling results relevant for HPs in future energy scenarios in the Baltics
2.3 Current practice of heat pump representation in energy planning
2.4 Our modelling approaches
2.5 Energy system development
2.6 Scenario analysis of the future of district heating in the Baltics
2.7 Summary of results for each Baltic state
2.8 Sensitivity analysis
2.2 Previous modelling
HP-related results from various reports analysing the future of the energy system in the Baltics and possible scenarios are summarised below.
2.2.1 Nordic Energy Technology Perspectives (NETP), 2016
The Nordic Energy Technology Perspectives (NEPT) report[1]Nordic Energy Research, & IEA Nordic energy technology perspectives 2016. was conducted to identify potential ways to achieve a carbon-neutral energy system in the Nordic countries by 2050. For the analysis, the global energy scenarios from the 2013 NETP report[2]Nordic Energy Research, & IEA. Nordic energy technology perspectives. 2013. were applied to the five Nordic countries (Denmark, Finland, Iceland, Norway, and Sweden). Other countries considered to account for interdependencies include Germany, the rest of the countries of the Baltic Sea Region (Estonia, Latvia, Lithuania, and Poland), as well as neighbouring countries (Netherlands, Belgium, Luxembourg, France, Italy, Switzerland, Austria, Czech Republic, and United Kingdom).
Footnotes
Although the results may not be directly related to the Baltic states, an overview of the expected electricity and DH production in the Nordic countries is provided in Figure 23. The results indicate that there is a large potential for increasing fluctuating renewable energy from wind power, as well as the share of hydropower for electricity generation (mainly in Norway). Consequently, in 2050, DH will mainly be produced from biomass and electricity (large-scale HPs and electric boilers).

Figure 23. Nordic electricity generation and heat production, 2013 – 2050 (copied from[1]International Energy Agency and Nordic Energy Research, ‘Nordic Energy Technology Perspectives 2016’, 2016.)
Footnotes
- ^ International Energy Agency and Nordic Energy Research, ‘Nordic Energy Technology Perspectives 2016’, 2016.
As a result of the large amount of fluctuating RES and interconnectors between countries, by 2050, a significant amount of electricity will be traded between the Nordic and neighbouring countries, as can be seen in the right column in Figure 24. It shows that large volumes of electricity can be exported to Estonia given the size of the country compared to the other countries shown. For example, comparably cheap surplus electricity from wind power or hydropower sources in Norway. A small share will be imported from Latvia, and electricity trade with Lithuania will be based on imports and exports. This could play an important role in the future electrification of the heating sector in the Baltic states.
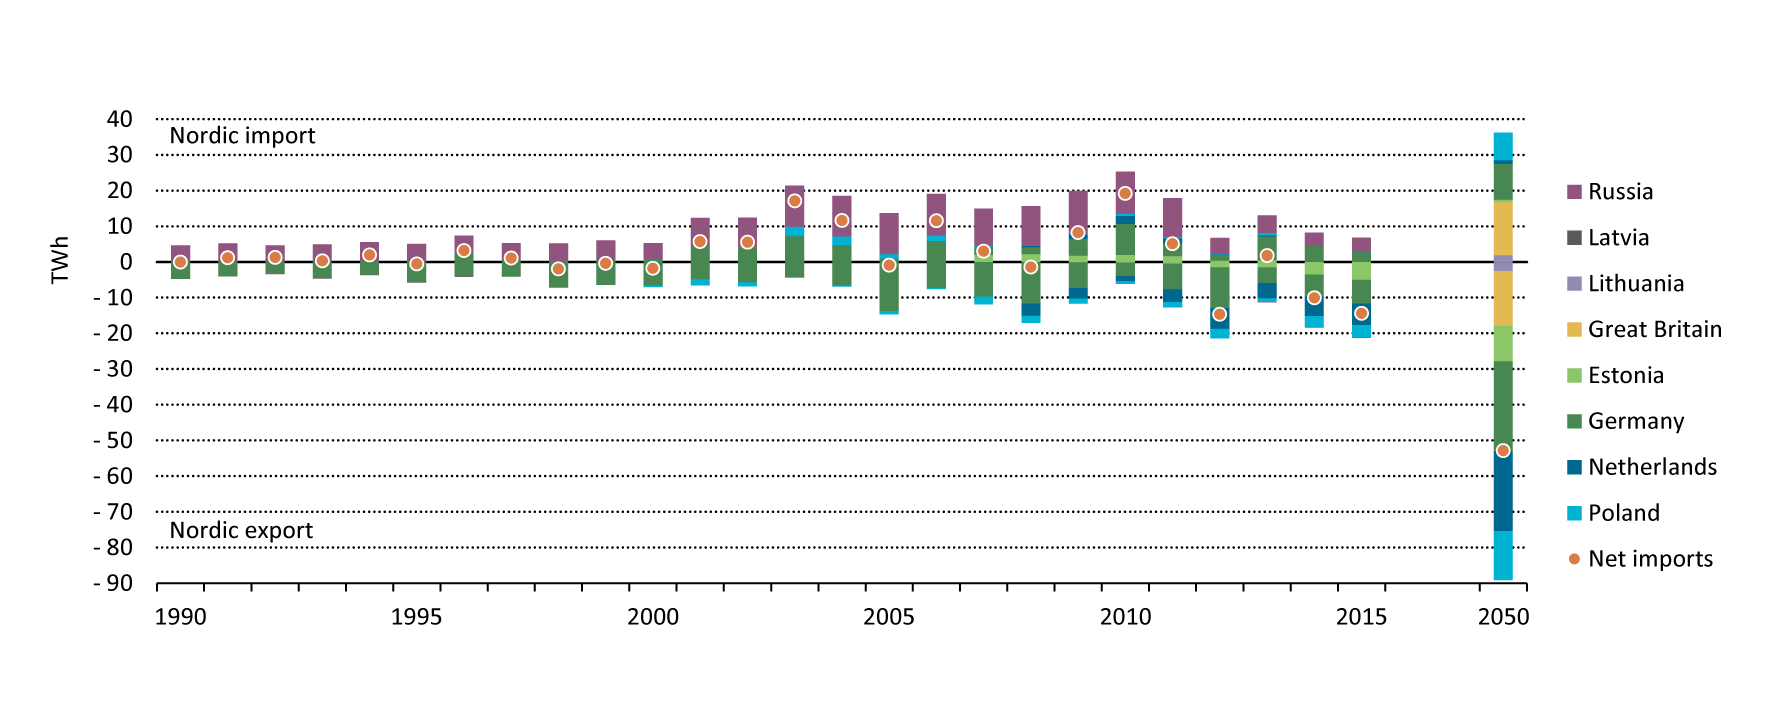
2.2.2 Baltic Energy Technology Scenarios (BENTE), 2018
In this study, two energy system models were used[1]Tomi J. Lindroos and others, ‘Baltic Energy Technology Scenarios 2018’, 2018, p. 165.: Balmorel, which provides a detailed analysis of electricity and DH, and TIMES-VTT, which provides general data on energy demand, energy supply, renewable energy, and integrated results. One of the main conclusions of BENTE was that electrification of heating provides an opportunity to reduce emissions and increase the share of renewable energy sources. It was mentioned that HPs could provide a cost-competitive option for DH and increasing the share of renewable energy. Three scenarios have been created, providing the analytical framework for the project. 4 Degrees Scenario (4DS), a world with moderate ambitions for climate change mitigation, Baltic Policies Scenario (BPO), assumed that the Baltic countries comply with proposed 2030 ESS (Effort Sharing Sector) targets and national targets to increase their Renewable Energy shares, 2 Degrees Scenario (2DS), with cost-optimal pathway to achieving the global two degree target, where the EU complies with its ambition of 80% reduction by 2050. According to this study, electricity consumption will increase due to growing demand and electrification. The key drivers behind it are electric vehicles, industry growth, and electrification of heating. Figure 25 presents a comparison of three scenarios for the electricity sector in the Baltics: a 4DS scenario with low renewable energy ambitions, a BPO scenario with additional requirements for the share of renewable energy, and a 2DS scenario with more ambitious GHG emissions reduction targets. The share of energy conversion is mainly related to the generation of heat from electricity by HPs. The study reports that HPs could potentially meet about 50% of the DH demand in the Baltics by 2050, but no further information is provided.
Footnotes
- ^ Tomi J. Lindroos and others, ‘Baltic Energy Technology Scenarios 2018’, 2018, p. 165.
Data on annual heat production by fuel type in the Baltic countries is presented in Figure 26. The highest share of heat production from electricity is proposed for the BPO scenario.
Figure 26. Annual heat production by fuel type in the Baltic countries for the 4DS, BPO, and 2DS scenarios (copied from[1]Tomi J. Lindroos and others, ‘Baltic Energy Technology Scenarios 2018’, 2018, p. 165.)
Footnotes
- ^ Tomi J. Lindroos and others, ‘Baltic Energy Technology Scenarios 2018’, 2018, p. 165.
The share of heat produced using HPs varies from country to country (Figure 27) and depends on competition with existing technologies such as biomass boilers and biomass CHP. It is mentioned in the report that the share of biomass boilers will be reduced in Lithuania and will remain the same in Estonia and Latvia.
Figure 27. Annual heat production in each Baltic country in 2030 for the 4DS, BPO, and 2DS scenarios (copied from[1]Tomi J. Lindroos and others, ‘Baltic Energy Technology Scenarios 2018’, 2018, p. 165.)
Footnotes
- ^ Tomi J. Lindroos and others, ‘Baltic Energy Technology Scenarios 2018’, 2018, p. 165.
2.2.3 Flexible Nordic Energy Systems (Flex4RES), 2019
Various types of reports and papers have been published as part of the Flex4RES project related to the implementation of power-to-heat (P2H) options in the Baltic and Nordic countries. The main methodology used in the research project was based on the Balmorel model. The Balmorel model identifies an operational strategy that can satisfy the demand at the lowest power and heat costs, taking into account predetermined power and heat generation capacities and transmission bottlenecks. The modelled solution ensures market-clearing production, transmission levels, and prices for each geographical unit and time step, assuming competitive markets.
The key results for the aggregated Nordic-Baltic electricity and heating sectors show that the share of heat production using electricity is significant and will continue to grow until 2050 for the following scenarios (Figure 28):
-
BAU: business as usual (BAU) in accordance with the existing regulatory framework in the Nordic and Baltic regions;
-
Connect: increasing the capacity of cross-border power transmission to better interconnect the Nordic countries with mainland Europe by removing technical barriers to expanding transmission capacity; however, regulatory barriers remain;
-
Policy: eliminating regulatory barriers that impede the flexibility of the power sector and sector coupling;
-
Combi: combining the Connect and Policy scenarios.
The largest proportion of P2H options is available for the Combi scenario.
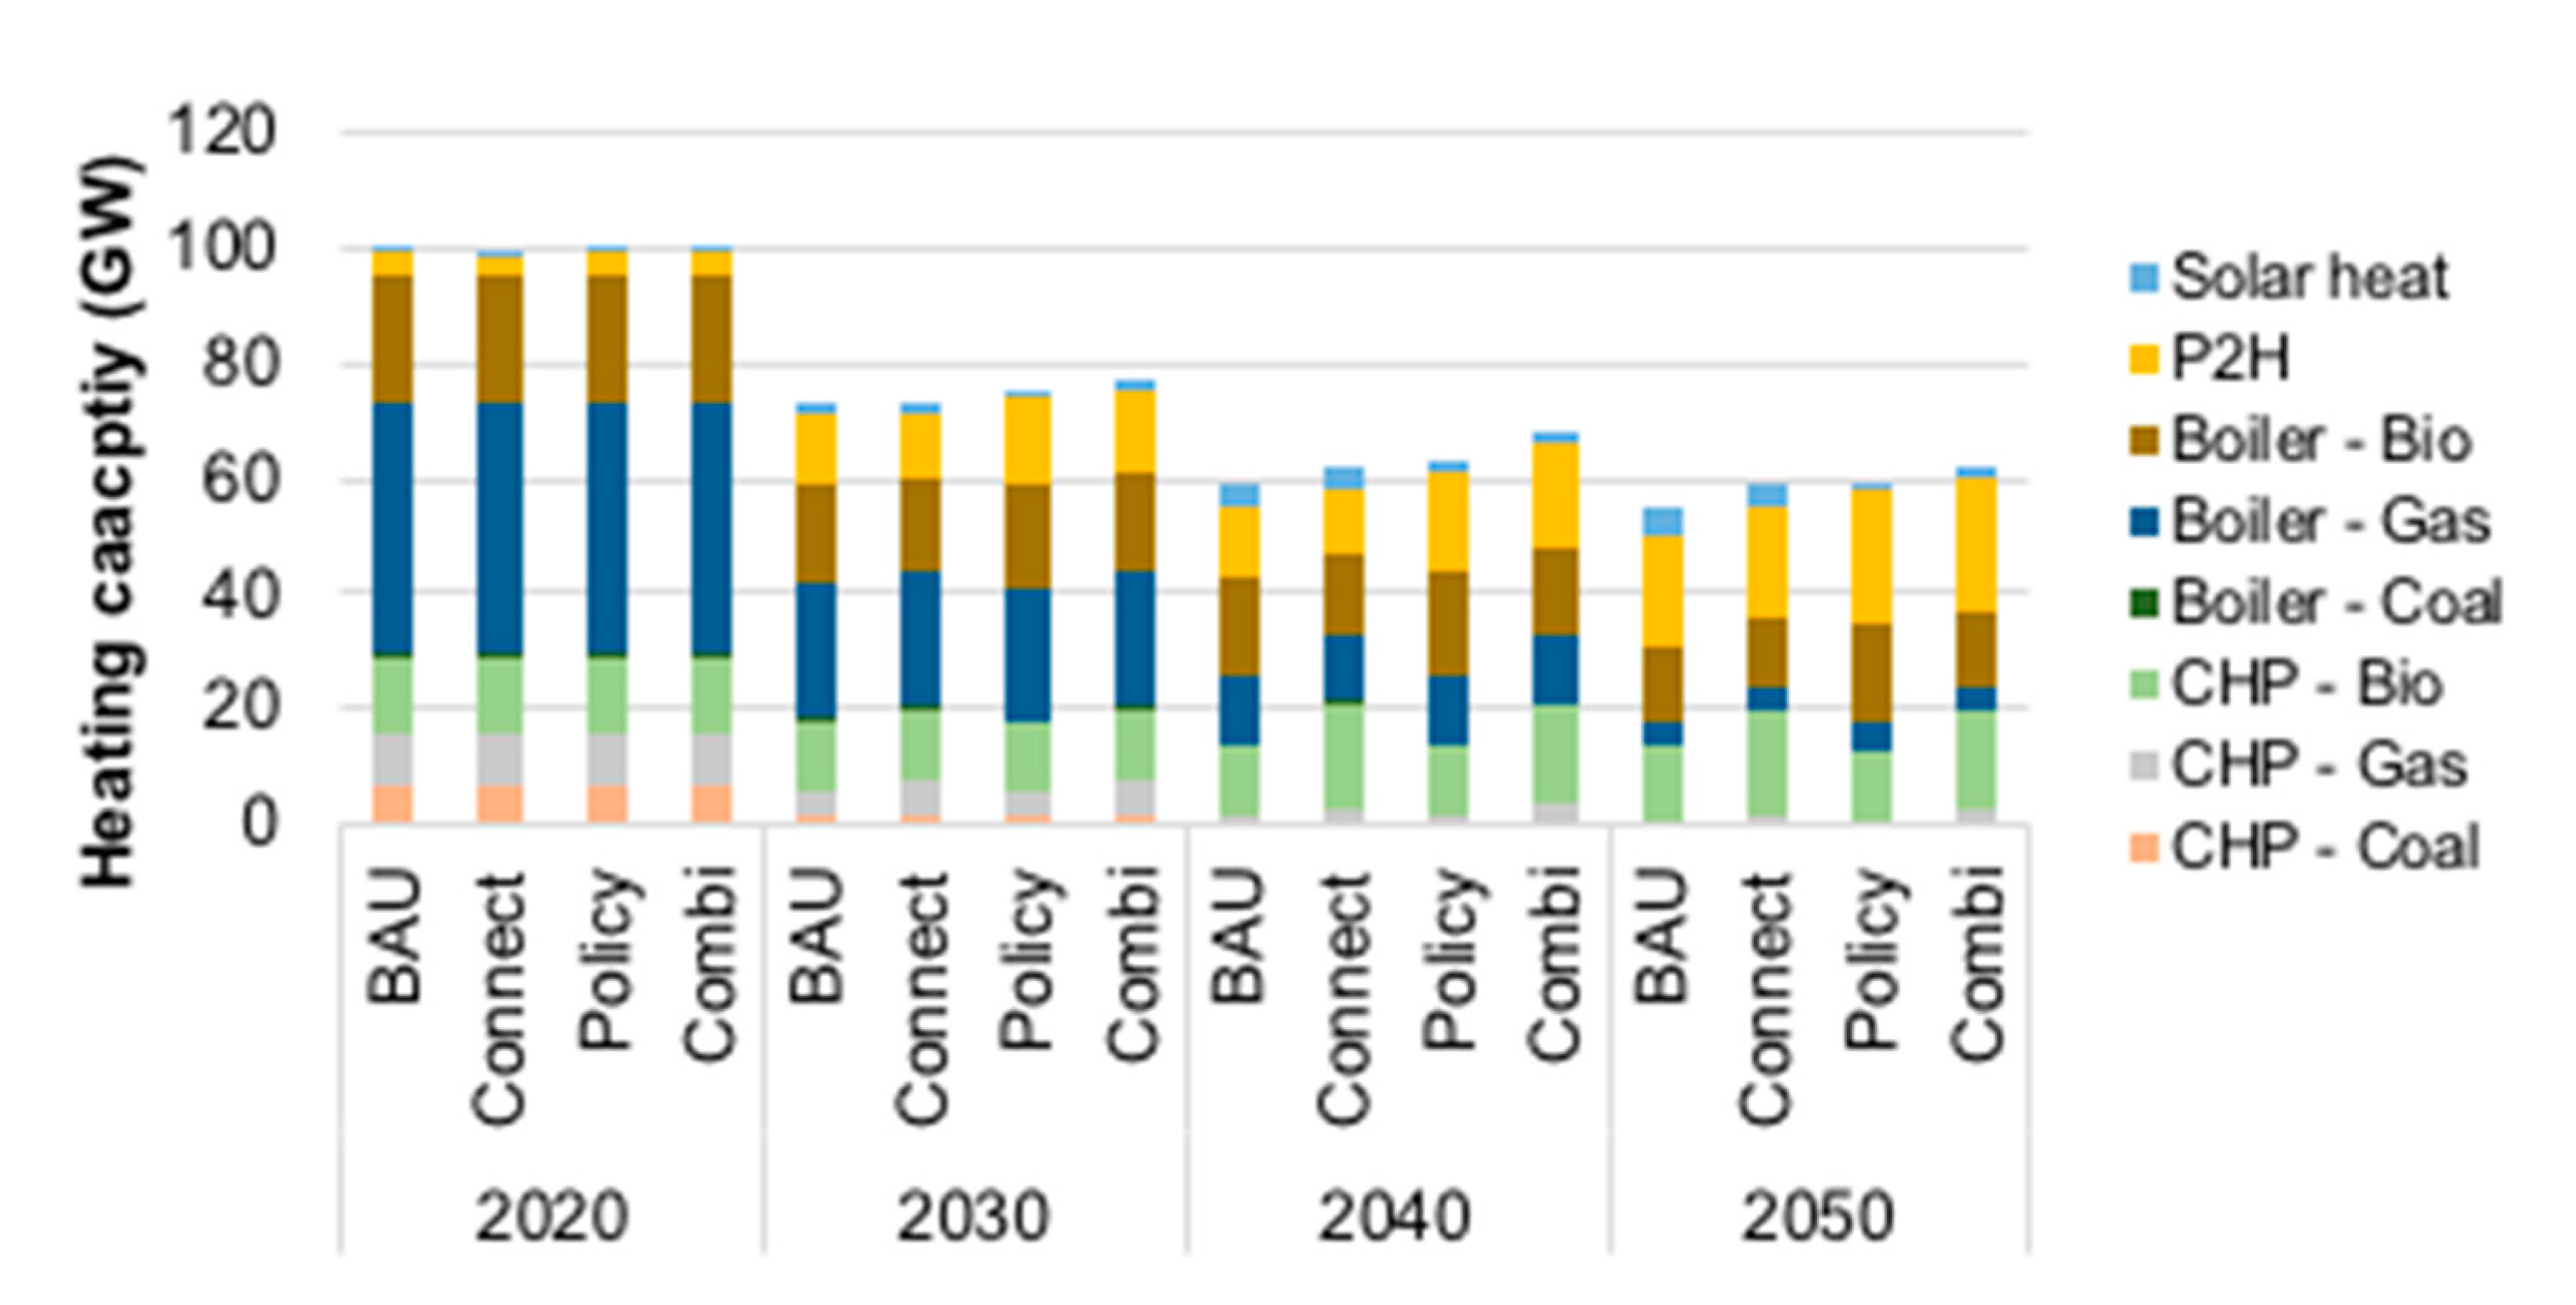
Figure 28. Changes in the energy system at the aggregate level of the Nordic and Baltic countries for the scenarios in 2020-2050. Changes in the heating system (copied from note mangler)
2.2.4 National Energy and Climate Plans (NECP)
According to the Estonian National Energy and Climate Plans (NECP), based on estimated trajectories of the sectoral share of renewable energy in final energy consumption in 2021-2030, HPs have the greatest growth potential in heating and cooling (see Figure 29).
According to the Latvian NECP, support for individual HPs is also planned, but there is no specific forecast for the implementation of HP or P2H technologies. In terms of renewable energy supply in DH, only biomass boilers and solar collectors are included in the forecast.
The Lithuanian NECP states that the distribution of heat produced by solar collectors and HPs combined with DH in buildings is a promising option. The following RES policy measures have been adopted for the heat sector until 2030:
- AEI27. Promoting the use of RES in DH (solar technologies, heat pumps and/or heat storage). As a result, the nominal thermal capacity of new installations will reach 200 MW by 2030. This capacity includes both solar energy and HPs with no technology-specific focus. Support will be provided to the most feasible solutions. In this NECP scenario, the share of HPs is negligible.
- Measure EE7. Replacing boilers with more efficient technologies by 2030. It is planned that 50000 domestic boilers will be replaced in households, in some cases with heat pumps, resulting in savings of at least 200 GWh per year.
2.2.5 Results from other studies
Using a model-based scenario analysis of the effects of sector coupling on the market value of renewable energy, the annual demand for heat generated by HPs in residential buildings and DH, as well as electricity generated by electric vehicles and hydrogen, was calculated for EU27 for 2050. The annual heat demand from individual HPs is estimated at 0.1 TWh for Estonia, 0.2 TWh for Latvia, and 1 TWh for Lithuania[1]Christiane Bernath, Gerda Deac, and Frank Sensfuß, ‘Impact of Sector Coupling on the Market Value of Renewable Energies – A Model-Based Scenario Analysis’, Applied Energy, 281 (2021). .
The “Analysis of the potential for Power-to-Heat/Cool applications to increase flexibility in the European electricity system until 2030” policy report includes an assessment of the average growth potential of P2H applications in the EU. It has been calculated that the increase in electrical load for heat production will be 236 MWel in Estonia, 345 MWel in Latvia, and 468 MWel in Lithuania[2]H.U. Yilmaz and others, Analysis of the Potential for Power-to-Heat/Cool Applications to Increase Flexibility in the European Electricity System until 2030, 2017. .
Another study presented a scenario based on the assumption that all new single-household residential buildings in Latvia that actually planned to use a natural gas heating system would instead option for a HP heating system. The results show that the annual heat production using these HPs will reach 10887 MWh with an annual electricity consumption of 3629 MWh. This change will result in annual CO2 emission savings of 1713 tonnes[3]Dmitrijs Guzs, ‘Effects of Potential EU-Wide Heating Sector CO2 Emission Trading Scheme on Heating Energy Prices and CO2 Emissions of Latvian Households’, in 2019 IEEE 7th IEEE Workshop on Advances in Information, Electronic and Electrical Engineering (AIEEE) (IEEE, 2019). .
Footnotes
- ^ Christiane Bernath, Gerda Deac, and Frank Sensfuß, ‘Impact of Sector Coupling on the Market Value of Renewable Energies – A Model-Based Scenario Analysis’, Applied Energy, 281 (2021).
- ^ H.U. Yilmaz and others, Analysis of the Potential for Power-to-Heat/Cool Applications to Increase Flexibility in the European Electricity System until 2030, 2017.
- ^ Dmitrijs Guzs, ‘Effects of Potential EU-Wide Heating Sector CO2 Emission Trading Scheme on Heating Energy Prices and CO2 Emissions of Latvian Households’, in 2019 IEEE 7th IEEE Workshop on Advances in Information, Electronic and Electrical Engineering (AIEEE) (IEEE, 2019).
2.3 Current practice of heat pump representation in energy planning
The COP of a HP largely depends on the inlet and outlet temperatures of the heat source, DH supply and return temperatures, as well as on the heat load[1]Torben Ommen and others, ‘Generalized COP Estimation of Heat Pump Processes for Operation off the Design Point of Equipment’, Proceedings of the 25th IIR International Congress of Refrigeration, 2019.. The supply and return temperatures of the DH network, as well as the heat load, usually change throughout the year. The heat source’s inlet temperature may vary depending on the choice of the heat source. The inlet temperature of the heat source is often fairly constant for industrial excess heat and flue gases due to the type of process, while the temperature of natural or low-temperature heat sources usually changes throughout the year depending on ambient conditions. This is true for ambient air, seawater, river and lake water, as well as sewage water. The outlet temperature of the heat source often depends on the design criteria of the HP and the desired equipment dimensions, in accordance with the flow rates.
As HP becomes compatible with more and more different types of heat sources, the investment in HPs can vary based on the type of heat source used and the costs associated with accessing it. Consequently, a constant value for HP investments that does not take these considerations into account may over- or underestimate the costs of implementing large-scale HP projects.
2.3.1 Heat pump performance
Large HPs are often simplified in energy planning for the purpose of calculations that are easier to solve expressed as linear equations. In addition, at the dawn of HP simulation in energy planning, there was a lack of detailed knowledge on the matter, which resulted in the fact that an industrial heat source with a constant source temperature was often considered. However, as we move forward in the use of heat sources, we additionally consider other heat sources whose temperatures can vary throughout the year. Besides, DH temperatures are adjusted according to ambient conditions to be more energy efficient. As a result, HP COPs are usually not constant throughout the year. Various attempts to better approximate HP COPs can be found in literature. In energy planning, HPs are typically simulated using COP. Different studies use basic COP estimates to calculate future and current energy scenarios. We have identified a variety of methods to simplify COP for the purpose of annual calculations, including constant COP, basic COP representations on the basis of the Carnot or Lorenz cycle, considering the change in COP, as a result of variations in the heat sink/heat source temperatures, as well as changes in COP based on the heat demand[2]Henrik Pieper, Torben Ommen, Jonas Kjær Jensen, and others, ‘Comparison of COP Estimation Methods for Large-Scale Heat Pumps Used in Energy Planning’, Energy, 205 (2020), 117994. .
Constant COPs for HPs have been used in a variety of studies on optimum energy planning. Constant COPs for energy planning in Denmark were assumed in[3]Rasmus Lund, Danica Djuric Ilic, and Louise Trygg, ‘Socioeconomic Potential for Introducing Large-Scale Heat
Pumps in District Heating in Denmark’, Journal of Cleaner Production, 139 (2016), 219–29. [4]Karsten Hedegaard and Olexandr Balyk, ‘Energy System Investment Model Incorporating Heat Pumps with Thermal Storage in Buildings and Buffer Tanks’, Energy, 63 (2013), 356–65.. Studies on HP implementation in the energy sector of Finland have also used constant COPs[5]S. Rinne and S. Syri, ‘Heat Pumps versus Combined Heat and Power Production as CO2 Reduction Measures
in Finland’, Energy, 57 (2013), 308–18. [6]K. Kontu, S. Rinne, and S. Junnila, ‘Introducing Modern Heat Pumps to Existing District Heating Systems – Global Lessons from Viable Decarbonizing of District Heating in Finland’, Energy, 166 (2019), 862–70.. Constant COPs for the potential HP utilisation in the Baltic countries were assumed in[7]Dace Lauka, Julija Gusca, and Dagnija Blumberga, ‘Heat Pumps Integration Trends in District Heating
Networks of the Baltic States’, Procedia - Procedia Computer Science, 52.Seit (2015), 835–42 10.1016/j.procs.2015.05.140>.. A different way to simplify COP for optimisation modelling is to use a variable COP based on heat demand. Arabzadeh et al.[8]Vahid Arabzadeh, Sannamari Pilpola, and Peter D. Lund, ‘Coupling Variable Renewable Electricity Production to the Heating Sector through Curtailment and Power-to-Heat Strategies for Accelerated Emission Reduction’, Future Cities and Environment, 5.1 (2019), 1–10. examined the feasibility of coupling variable renewable power generation with heating by means of P2H strategies in Finland. The COP used in the article decreased when entering the period of peak heat demand, that is COP=3 when the heat demand is less than 50% and COP=2 when the demand is 50-70%. It was assumed that a peak heat demand of over 70% was provided by means of an electric boiler with a COP of 1. Lund et al.[9]Henrik Lund, Jakob Zinck Thellufsen, and others, ‘Heat Saving Strategies in Sustainable Smart Energy Systems’, International Journal of Sustainable Energy Planning and Management, 04 (2014), 3–16. explored heat-saving options in future smart energy systems. They examined to what degree DH should be utilised compared to individual HP-based heating. They assumed that the COP for individual HPs is between 2.8 and 3.2, based on the heat demand. They did not indicate further the dependence of heat demand on COP. Another way to simplify the calculation of COP is to relate COP to the Lorenz cycle times constant Lorenz efficiency. In this case, seasonal variations in inlet and outlet temperatures of the heat sources and sinks are taken into consideration. This approach to approximating COP was used in energy planning in[10]Rasmus Lund, Dorte Skaarup Ostergaard, and others, ‘Comparison of Low-Temperature District Heating Concepts in a Long-Term Energy System Perspective’, International Journal of Sustainable Energy Planning and Management, 12 (2017), 5–18. [11]Poul Alberg Ostergaard and Anders N. Andersen, ‘Booster Heat Pumps and Central Heat Pumps in District Heating’, Applied Energy, 184 (2016), 1374–88.. Lund et al.[12]Rasmus Lund, Dorte Skaarup Ostergaard, and others, ‘Comparison of Low-Temperature District Heating
Concepts in a Long-Term Energy System Perspective’, International Journal of Sustainable Energy Planning
and Management, 12 (2017), 5–18.conducted a comparison of various low-temperature DH concepts operating at various DH network temperatures. Østergaard and Andersen[13]Poul Alberg Ostergaard and Anders N. Andersen, ‘Booster Heat Pumps and Central Heat Pumps in District Heating’, Applied Energy, 184 (2016), 1374–88. examined the optimum utilization of large centralised HPs and decentralised booster HPs in an electrified low-temperature DH system on the basis of RES.
A number of studies explain how COP can be determined by means of more advanced approaches. Oluleye et al. in[14]Gbemi Oluleye, Robin Smith, and Megan Jobson, ‘Modelling and Screening Heat Pump Options for the Exploitation of Low Grade Waste Heat in Process Sites’, Applied Energy, 169 (2016), 267–86. and[15]Gbemi Oluleye and others, ‘A Novel Screening Framework for Waste Heat Utilization Technologies’, Energy, 125 (2017), 367–81. presented a linear correlation for determining COP using the Carnot COP and two coefficients. Liu et al.[16]Liu Yang, Liu Jinxiang, and Ding Gao, ‘Mathematical Model of Water-Source Heat Pump Units under Variant Working Conditions’, Heating Ventilating & Air Conditioning, 03 (2007). created a mathematical model to calculate the COP of water source HPs using five coefficients, an exponential term, and inlet and outlet temperatures of the heat source and sink. Shenghua and Xiaokai[17]Shenghua Zou and Xiaokai Xie, ‘Simplified Model for Coefficient of Performance Calculation of Surface Water Source Heat Pump’, Applied Thermal Engineering, 112 (2017), 201–7. simplified this even further by establishing COP dependency on the outdoor temperature instead of heat source/sink inlet and outlet temperatures. Jensen et al.[18]Jonas K. Jensen and others, ‘Design of Serially Connected Ammonia-Water Hybrid Absorption-Compression Heat Pumps for District Heating with the Utilisation of a Geothermal Heat Source’, Energy, 137 (2017), 865–77. derived an equation for calculating COP using exergy efficiency. In a more recent article, Jensen et al.[19]Jonas K Jensen and others, ‘Heat Pump COP , Part 2 : Generalized COP Estimation of Heat Pump Processes’, In Proceedings of The13th IIR-Gustav Lorentzen Conference on Natural Refrigerants International Institute of Refrigeration, 2018, 1–8. derived another equation for determining HP COPs. This equation is based on a one-stage cycle under design conditions, depending on the heat source/sink temperatures, the characteristics of the compressor, the basic design of the heat exchanger, and the integration of the refrigerant with the heat source/sink. This was further explored by Ommen et al.[20]Torben Ommen and others, ‘Generalized COP Estimation of Heat Pump Processes for Operation off the Design Point of Equipment’, Proceedings of the 25th IIR International Congress of Refrigeration, 2019.in order to estimate one-stage HP COPs for off-design conditions. Their COP estimates were compared to the COPs of two thermodynamic HP models that were validated using actual HP installations, with one being a two-stage HP. The COP estimates are in accord with the COPs determined via thermodynamic modelling. The authors of the article showed that the COP estimation method for one-stage cycles is suitable for COPs of two-stage HP configurations.
Footnotes
- ^ Torben Ommen and others, ‘Generalized COP Estimation of Heat Pump Processes for Operation off the Design Point of Equipment’, Proceedings of the 25th IIR International Congress of Refrigeration, 2019.
- ^ Henrik Pieper, Torben Ommen, Jonas Kjær Jensen, and others, ‘Comparison of COP Estimation Methods for Large-Scale Heat Pumps Used in Energy Planning’, Energy, 205 (2020), 117994.
- ^ Rasmus Lund, Danica Djuric Ilic, and Louise Trygg, ‘Socioeconomic Potential for Introducing Large-Scale Heat
Pumps in District Heating in Denmark’, Journal of Cleaner Production, 139 (2016), 219–29. - ^ Karsten Hedegaard and Olexandr Balyk, ‘Energy System Investment Model Incorporating Heat Pumps with Thermal Storage in Buildings and Buffer Tanks’, Energy, 63 (2013), 356–65.
- ^ S. Rinne and S. Syri, ‘Heat Pumps versus Combined Heat and Power Production as CO2 Reduction Measures
in Finland’, Energy, 57 (2013), 308–18. - ^ K. Kontu, S. Rinne, and S. Junnila, ‘Introducing Modern Heat Pumps to Existing District Heating Systems – Global Lessons from Viable Decarbonizing of District Heating in Finland’, Energy, 166 (2019), 862–70.
- ^ Dace Lauka, Julija Gusca, and Dagnija Blumberga, ‘Heat Pumps Integration Trends in District Heating
Networks of the Baltic States’, Procedia - Procedia Computer Science, 52.Seit (2015), 835–42 10.1016/j.procs.2015.05.140>. - ^ Vahid Arabzadeh, Sannamari Pilpola, and Peter D. Lund, ‘Coupling Variable Renewable Electricity Production to the Heating Sector through Curtailment and Power-to-Heat Strategies for Accelerated Emission Reduction’, Future Cities and Environment, 5.1 (2019), 1–10.
- ^ Henrik Lund, Jakob Zinck Thellufsen, and others, ‘Heat Saving Strategies in Sustainable Smart Energy Systems’, International Journal of Sustainable Energy Planning and Management, 04 (2014), 3–16.
- ^ Rasmus Lund, Dorte Skaarup Ostergaard, and others, ‘Comparison of Low-Temperature District Heating Concepts in a Long-Term Energy System Perspective’, International Journal of Sustainable Energy Planning and Management, 12 (2017), 5–18.
- ^ Poul Alberg Ostergaard and Anders N. Andersen, ‘Booster Heat Pumps and Central Heat Pumps in District Heating’, Applied Energy, 184 (2016), 1374–88.
- ^ Rasmus Lund, Dorte Skaarup Ostergaard, and others, ‘Comparison of Low-Temperature District Heating
Concepts in a Long-Term Energy System Perspective’, International Journal of Sustainable Energy Planning
and Management, 12 (2017), 5–18. - ^ Poul Alberg Ostergaard and Anders N. Andersen, ‘Booster Heat Pumps and Central Heat Pumps in District Heating’, Applied Energy, 184 (2016), 1374–88.
- ^ Gbemi Oluleye, Robin Smith, and Megan Jobson, ‘Modelling and Screening Heat Pump Options for the Exploitation of Low Grade Waste Heat in Process Sites’, Applied Energy, 169 (2016), 267–86.
- ^ Gbemi Oluleye and others, ‘A Novel Screening Framework for Waste Heat Utilization Technologies’, Energy, 125 (2017), 367–81.
- ^ Liu Yang, Liu Jinxiang, and Ding Gao, ‘Mathematical Model of Water-Source Heat Pump Units under Variant Working Conditions’, Heating Ventilating & Air Conditioning, 03 (2007).
- ^ Shenghua Zou and Xiaokai Xie, ‘Simplified Model for Coefficient of Performance Calculation of Surface Water Source Heat Pump’, Applied Thermal Engineering, 112 (2017), 201–7.
- ^ Jonas K. Jensen and others, ‘Design of Serially Connected Ammonia-Water Hybrid Absorption-Compression Heat Pumps for District Heating with the Utilisation of a Geothermal Heat Source’, Energy, 137 (2017), 865–77.
- ^ Jonas K Jensen and others, ‘Heat Pump COP , Part 2 : Generalized COP Estimation of Heat Pump Processes’, In Proceedings of The13th IIR-Gustav Lorentzen Conference on Natural Refrigerants International Institute of Refrigeration, 2018, 1–8.
- ^ Torben Ommen and others, ‘Generalized COP Estimation of Heat Pump Processes for Operation off the Design Point of Equipment’, Proceedings of the 25th IIR International Congress of Refrigeration, 2019.
SHORTCUTS
2.1 Key findings
2.2 Previous modelling results relevant for HPs in future energy scenarios in the Baltics
2.3 Current practice of heat pump representation in energy planning
2.4 Our modelling approaches
2.5 Energy system development
2.6 Scenario analysis of the future of district heating in the Baltics
2.7 Summary of results for each Baltic state
2.8 Sensitivity analysis
Boesten et al.[1]Stef Boesten and others, ‘Water to Water Heat Pump for District Heating : Modeling for MILP’, in 6th International Conference on Smart Energy Systems (Aalborg: Aalborg University, 2020).provided COP estimates obtained using actual performance data from 114 HP model types and 262 operating points from 2 different manufacturers. They proposed a correlation on the basis of two fitted coefficients and the heat source/sink temperatures. Schlosser et al.[2]Schlosser and others, ‘Large-Scale Heat Pumps: Applications, Performance, Economic Feasibility and Industrial Integration’, Renewable and Sustainable Energy Reviews, 133.August (2020), 110219. investigated the use, performance, industrial integration, and financial viability of real-life large HPs produced by different manufacturers. They used a database of 433 different operating points for 33 different industrial HPs. They created an empirical correlation on the basis of the least square method to calculate HP COP using four coefficients, temperature lift, and the outlet temperature of the heat sink.
Pieper et al.[3]Henrik Pieper, Torben Ommen, Jonas Kjar Jensen, and others, ‘Comparison of COP Estimation Methods for Large-Scale Heat Pumps Used in Energy Planning’, Energy, 205 (2020), 117994. compared the results of using four of the COP estimation methods described above on a mixed-integer linear optimisation problem in order to calculate the optimum HP capacities that would result in the most cost-efficient DH supplied via HPs to a new area of development. They determined that using constant COP or constant Lorenz/exergy efficiency can result in significant deviations in COP for annual calculations, particularly when the heat source and/or sink temperatures change greatly throughout the year. This can lead to a suboptimal solution and a wrong choice of heat sources.
To determine the suitable HP performance and capacity for new projects and future energy system scenarios, an accurate COP representation is necessary to perform calculations throughout the year. Therefore, COP estimation methods may require to fulfil the following criteria:
-
Can be applied to (mixed-integer) linear programming scenario and optimisation models;
-
Can be applied to off-design operation, taking into account changes in the temperature of the heat source/sink;
-
Represents common equipment used to supply DH from central points in the DH network;
-
Provides sufficient accuracy compared to actual HPs or thermodynamic models;
-
Easy to use, even for non-experts.
2.3.2 Investment in heat pumps
Investments in large-scale HP projects account for about 29-34% of the total heating costs of these plants, depending on COP and under Danish conditions[4]Danish Energy Agency, ‘Guide for Large-Scale Heat Pump Projects in District Heating Systems (in Danish)’, 2017.. Ommen et al.[5]Torben Schmidt Ommen, Brian Elmegaard, and Wiebke Brix Markussen, ‘Heat Pumps in CHP Systems: High-Efficiency Energy System Utilising Combined Heat and Power and Heat Pumps’ (DTU Mechanical Engineering (DCAMM Special Report; No. S187), 2015). found similar investments accounting for 20% to 37% of the total heating costs for eight different types of HPs used in DH. Therefore, they contribute significantly to the overall heating costs. Different parts of a large-scale HP project contribute to the overall investments, as shown in Figure 30.
Footnotes
- ^ Stef Boesten and others, ‘Water to Water Heat Pump for District Heating : Modeling for MILP’, in 6th International Conference on Smart Energy Systems (Aalborg: Aalborg University, 2020).
- ^ Schlosser and others, ‘Large-Scale Heat Pumps: Applications, Performance, Economic Feasibility and Industrial Integration’, Renewable and Sustainable Energy Reviews, 133.August (2020), 110219.
- ^ Henrik Pieper, Torben Ommen, Jonas Kjar Jensen, and others, ‘Comparison of COP Estimation Methods for Large-Scale Heat Pumps Used in Energy Planning’, Energy, 205 (2020), 117994.
- ^ Danish Energy Agency, ‘Guide for Large-Scale Heat Pump Projects in District Heating Systems (in Danish)’, 2017.
- ^ Torben Schmidt Ommen, Brian Elmegaard, and Wiebke Brix Markussen, ‘Heat Pumps in CHP Systems: High-Efficiency Energy System Utilising Combined Heat and Power and Heat Pumps’ (DTU Mechanical Engineering (DCAMM Special Report; No. S187), 2015).
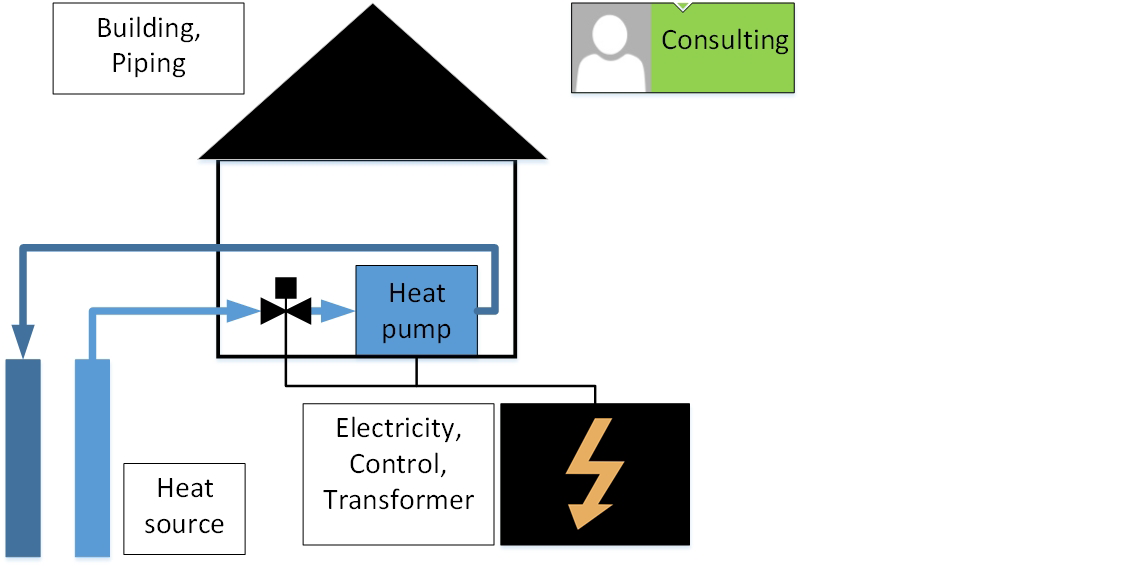
Figure 30. Contribution to the cost of large-scale HP projects (copied from[1]Henrik Pieper, Torben Ommen, Fabian Buhler, and others, ‘Allocation of Investment Costs for Large-Scale Heat Pumps Supplying District Heating’, Energy Procedia, 147 (2018), 358–67.)
Footnotes
- ^ Henrik Pieper, Torben Ommen, Fabian Buhler, and others, ‘Allocation of Investment Costs for Large-Scale Heat Pumps Supplying District Heating’, Energy Procedia, 147 (2018), 358–67.
Heat pump: investments related only to the HP unit itself as the main component.
Heat source: investments related only to the heat source, which may vary depending on the heat source. For groundwater, preliminary studies, test drilling, and drilling may be required to gain access to this type of heat source. For industrial excess heat, it is necessary to incorporate a heat exchanger into the industrial process. The installation can also interrupt the process for a limited time. Sewage water may also require a heat exchanger and additional treatment equipment.
Building, pipelines: investments related only to the building and pipelines within the building. Depending on HP capacity, a completely new building may be required. Smaller HP units can sometimes be installed in existing boiler rooms. This makes sense, especially when they use flue gas as heat source.
Electricity, control system, and transformer: all electricity-related investments can be grouped together because it can be difficult to distinguish between these costs. Some of these costs are fixed, while others depend on the installed capacity. Costs associated with electrical work, cabling, HP control system, and connection to the power grid are included.
Consulting: costs related to consulting services. This is very common because consulting companies specialise in the implementation of large-scale HP projects and may have years of experience. These costs vary based on the complexity of the project.
Cost correlations for HPs with thermal capacity under 0.2 MW have been published by Wolf et al.[1]Wolf, S., U. Fahl, M. Blesl, A. Voss, and R. Jakobs, ‘Analysis of the Potential of Industrial Heat Pumps in Germany’, (in German) 2014. for ground-source, water-source, and air-source HPs. For this purpose, 254 HPs from eight different manufacturers were considered. The correlations are only valid for the HP component itself, but do not account for other costs associated with such projects. Another cost correlation for large-scale HP units was described by Grosse et al.[2]R. Grosse and others, ‘Long Term (2050) Projections of Techno-Economic Performance of Large-Scale Heating and Cooling in the EU’, Publications Office of the European Union, 2017. and based on reference project information and manufacturer’s estimates.
In 2014, the Danish Energy Agency proposed a total investment in large-scale HP projects ranging from €0.5 million/MW to €0.8 million/MW[3]Danish Energy Agency, ‘Guide for Large-Scale Heat Pump Projects in District Heating Systems (in Danish)’, 2017. In 2017, an updated version was released, indicating the investment of €0.8 million/MW to €1.1 million/MW[4]Danish Energy Agency, ‘Guide for Large-Scale Heat Pump Projects in District Heating Systems (in Danish)’, 2017.. In their latest 2020 report[5]Danish Energy Agency and Energinet, ‘Technology Data - Generation of Electricity and District Heating’, 2020, 414., they have estimated the investments required for 1 MW, 3 MW, and 10 MW air-source HP projects to be €1.40 million, €0.95 million, and €0.86 million per MW, respectively. For large-scale HP projects based on industrial excess heat, investments of €1.24 million, €0.86 million, and €0.67 million per MW were proposed. For a 20 MW seawater HP, investments will amount to €0.48 million/MW. The uncertainty for seawater HPs was very high as there was very little experience with this heat source. These included cost savings expected over the coming decades due to technology improvements. This was the first attempt to define investments based on the heat source. However, a constant investment value based on capacity is typically used in energy planning.
Footnotes
- ^ Wolf, S., U. Fahl, M. Blesl, A. Voss, and R. Jakobs, ‘Analysis of the Potential of Industrial Heat Pumps in Germany’, (in German) 2014.
- ^ R. Grosse and others, ‘Long Term (2050) Projections of Techno-Economic Performance of Large-Scale Heating and Cooling in the EU’, Publications Office of the European Union, 2017.
- ^ Danish Energy Agency, ‘Guide for Large-Scale Heat Pump Projects in District Heating Systems (in Danish)’, 2017.
- ^ Danish Energy Agency, ‘Guide for Large-Scale Heat Pump Projects in District Heating Systems (in Danish)’, 2017.
- ^ Danish Energy Agency and Energinet, ‘Technology Data - Generation of Electricity and District Heating’, 2020, 414.
2.4 Our modelling approaches
The Balmorel model[1]The Balmorel Open Source Project, ‘Balmorel’.was used to assess the economic potential of HP solutions in the Baltic countries. The model has undergone major improvements to its DH modelling functionality in order to reflect competitiveness in great detail. The improvements and modifications are detailed in Annex 2.
The add-on runs on top of Balmorel’s native DH modelling and fills in gaps when no accurate data is available. The add-on will be flexible in terms of including heat sources and, if possible, will include data from a low-level data source (temperatures, etc.). Some input data is already covered by the default Balmorel DH modelling and will not be duplicated unless additional details are required. Other data can also be used in the Baltic states based on the heat sources available within a given (aggregate) DH area.
The competition between traditional heat sources and the various heat sources available through HPs was simulated until 2050. The geographical aggregation approach implemented in this project to capture heat source competition in sufficient detail is presented below. Further information about the current energy system technologies in the Baltic can be found in Annex 3.
Scenario analysis led to the creation of the base scenario, which explores the most cost-effective development of the power system until 2050. In the base scenario, a moderate expectation is given to macroeconomic assumptions, such as fuel price and EU Emissions Trading System (ETS) price development. Furthermore, socio-economic cost optimisation has been selected, which means that no grid tariff costs are assumed for HP technologies in the base scenario. The EU ETS price assumption for the base scenario is based on the IEA World Energy Outlook (WEO) 2020 Stated Policies Scenario and will be around €30/t in 2025 and will reach €45/t in 2040. Global commodity prices (coal and natural gas) are also based on the IEA WEO 2020 Stated Policies Scenario.
Two more scenarios were developed based on the base scenario to investigate the change in economic potential of P2H technologies in the Baltic countries depending on major variables. The scenarios are as follows:
-
Base scenario: The base scenario inspected is based on a socioeconomic approach to the HP implementation, where HPs compete with other technologies, without any taxes, subsidies and fees (as described above).
-
Grid Tariffs: The grid tariff scenario, where HPs would be subject to electricity grid tariffs, according to the current grid tariff structure.
-
Invest Support: The investment support scenario, where large-scale HP technologies are subsidised for up to 50% of their initial overnight construction cost.
The heat generation mix is a tight competition between various fuels, the main fuels currently used in the Baltics are biomass and natural gas. The competitiveness on HPs significantly depends on the price of the main fuels, as well as on the power price. Thus, various sensitivity scenarios were also investigated by testing lower and higher biomass and CO2 prices, as shown in the following:
-
Baseline
-
High CO2 – The EU ETS price grows with an increased pace (+33%)
-
Low CO2 – The EU ETS price develops at a slow pace (-33%)
-
High Biomass – The biomass price in the Baltic countries is 33% higher than in the baseline scenarios
-
Low Biomass – The biomass price in the Baltic countries is 33% lower than in the baseline scenarios
-
High Combo – Both the EU ETS price and the biomass price will be 33% higher than in the baseline scenario
During the study of the various scenarios, the following parameters will be compared:
-
Market shares of various P2H solutions
-
Realized P2H potential from maximum
-
Competition of P2H sources among themselves
-
Use of alternative fuels (biomass, natural gas) and the role of CHP plants
-
Need and use of heat storage, interaction with the electrical system
Footnotes
- ^ The Balmorel Open Source Project, ‘Balmorel’.
SHORTCUTS
2.1 Key findings
2.2 Previous modelling results relevant for HPs in future energy scenarios in the Baltics
2.3 Current practice of heat pump representation in energy planning
2.4 Our modelling approaches
2.5 Energy system development
2.6 Scenario analysis of the future of district heating in the Baltics
2.7 Summary of results for each Baltic state
2.8 Sensitivity analysis
2.4.1 Modelling of district heating areas
This study gathered data for over 300 DH networks in the Baltic countries. Due to the large amount of data, the DH network data has been simplified (aggregated) for modelling purposes. As a result of aggregation, not all DH areas are modelled individually. Some of the larger areas are displayed individually, while the smaller areas are aggregated together based on specific aggregation criteria. The aggregation criteria were chosen so that smaller DH networks with similar characteristics are pooled together and modelled as a larger aggregated network.
Larger areas are presented separately due to their large impact and market share. These areas depict the competition between technologies and take into account local conditions. They can also serve as case studies as many heat sources compete in the same area (for example, different heat sources are available in Tallinn such as excess heat and seawater). Smaller DH networks are grouped together mainly by their access to heat sources. For example, a distinction is made between areas that have access to high-quality heat sources, such as excess heat, and areas that do not have significant heat sources in the area. All simulated areas will have access to traditional heat generation capacities such as heat-only boilers and cogeneration power plants. Furthermore, some of the standard technologies covered in this study will also be available: air and ground-source HPs, heat storages, and electric boilers.
For each individual modelled DH area and for each aggregated DH area, the access to available heat sources was investigated. An overview of the abbreviations used in Table 19, Table 20 and Table 21 can be found here:
-
EH0 Industrial excess heat within 0 km distance to DH area
-
EH1 Industrial excess heat within 1 km distance to DH area
-
SW0 Seawater within 0 km distance to DH area
-
SW1 Seawater within 1 km distance to DH area
-
R0 Rivers within 0km distance to DH area
-
R1 Rivers within 1km distance to DH area
-
L0 Lakes over 5000 m perimeter within 0 km distance to DH area
-
L1 Lakes over 5000 m perimeter within 1 km distance to DH area
-
S0 Sewage water treatment plant within 0 km distance to DH area
-
S1 Sewage water treatment plant within 1 km distance to DH area
If the DH area or all aggregated DH areas within one group have access to one of these heat sources, it is highlighted in green colour. If not all of the aggregated DH areas have access to one of these heat sources, it is highlighted in a beige colour.
Aggregation of district heating areas in Estonia
For Estonia, the study included data from 184 DH networks. According to the collected data, the total annual heat consumption in the areas is about 3.7 TWh. There are several fairly large DH networks in Estonia, but there are also many networks with very low annual heat demand. In Estonia, all areas with an annual heat consumption above 50 GWh were modelled individually. There are 8 such networks: Tallinn, Tartu, Narva, Pärnu, Sillamäe, Viljandi, Võru, and Maardu. These networks account for about 2.7 TWh or 75% of the total annual heat demand mapped in Estonia. All DH networks with consumption below 50 GWh in Estonia were grouped together in aggregate areas. The aggregate categories for Estonia are:
-
Areas with access to excess heat in the network
-
Areas without significant heat sources in the network
-
Areas with access to rivers in the network and no other sources
-
Remaining areas: various sources are available.
Represented DH areas in Estonia along with total annual demand are shown in Table 19.
| EH0 | EH1 | SW0 | SW1 | R0 | R1 | L0 | L1 | S0 | S1 | Demand, TWh | No. of areas | |
| EE Maardu | 0.06 | 1 | ||||||||||
| EE Narva | 0.39 | 1 | ||||||||||
| EE Pärnu | 0.23 | 1 | ||||||||||
| EE Sillamäe | 0.24 | 1 | ||||||||||
| EE Tallinn | 1.5 | 1 | ||||||||||
| EE Tartu | 0.2 | 1 | ||||||||||
| EE Viljandi | 0.09 | 1 | ||||||||||
| EE Võru | 0.05 | 1 | ||||||||||
| EE ExcessH | 0.53 | 37 | ||||||||||
| EE NoSource | 0.24 | 85 | ||||||||||
| EE Rivers | 0.09 | 42 | ||||||||||
| EE Rest | 0.07 | 20 |
Table 19. Represented DH areas in Estonia
Aggregation of district heating areas in Latvia
The represented areas in Latvia alongside with their total annual demands are presented in Table 20. For Latvia, the modelling process included data from 111 DH networks with a total annual heat demand of about 6.4 TWh. The average size of mapped DH networks in Latvia is larger than in Estonia. In Latvia, all DH networks with an annual consumption above 100 GWh were grouped together. According to the collected data, there are 7 such areas: Riga, Daugavpils, Liepaja, Jelgava, Ventspils, Rezekne, and Jurmala. Their total annual heat demand is roughly 4.5 TWh or 69% of the total mapped DH demand in Latvia. All areas with an annual consumption of less than 100 GWh, for which data was collected, were aggregated according to the following categories:
-
Areas with access to excess heat in the network
-
Areas without significant heat sources in the network
-
Areas with access to water treatment facilities in the network
-
Remaining areas: various sources available.
Represented areas in Latvia along with total annual demand are shown in Table 20.
| EH0 | EH1 | SW0 | SW1 | R0 | R1 | L0 | L1 | S0 | S1 | Demand, TWh | No. of areas | |
| LV Rīga | 3.35 | 1 | ||||||||||
| LV Daugavpils | 0.43 | 1 | ||||||||||
| LV Jelgava | 0.21 | 1 | ||||||||||
| LV Liepāja | 0.23 | 1 | ||||||||||
| LV Ventspils | 0.16 | 1 | ||||||||||
| LV Jūrmala | 0.15 | 1 | ||||||||||
| LV Rēzekne | 0.15 | 1 | ||||||||||
| LV ExcessH | 0.82 | 21 | ||||||||||
| LV NoSource | 0.47 | 38 | ||||||||||
| LV WaterTreat | 0.28 | 29 | ||||||||||
| LV Rest | 0.12 | 17 |
Table 20. Represented DH areas in Latvia
Aggregation of district heating areas in Lithuania
In Lithuania, data was gathered from 56 DH networks with a total estimated annual heat demand of 9.0 TWh. DH networks in Lithuania are larger than in Estonia and Latvia. There is a total of 13 networks with an annual DH production of over 100 GWh, and all of them were modelled individually. The total annual heat demand of such networks is 7.2 TWh, which is about 80% of the total demand of all mapped DH areas in Lithuania. These areas are Vilnius, Kaunas, Klaipėda, Siaulia, Panevežys, Visaginas, Alytus, Marijampole, Mažeikiai, Utena, Jonava, Druskininkai, and Kedainiai. Just like in Latvia, networks with an annual production of less than 100 GWh were grouped together. The aggregate groups in Lithuania are as follows:
-
Areas with access to excess heat in the network
-
Areas without significant heat sources in the network
-
Remaining areas: various sources available.
Represented areas in Lithuania along with total annual demand are shown in Table 21.
| EH0 | EH1 | SW0 | SW1 | R0 | R1 | L0 | L1 | S0 | S1 | Demand, TWh | No. of areas | |
| LT Vilnius City | 2.85 | 1 | ||||||||||
| LT Kaunas city | 1.32 | 1 | ||||||||||
| LT Klaipėda city | 0.89 | 1 | ||||||||||
| LT Šiauliai city | 0.43 | 1 | ||||||||||
| LT Panevėžys city | 0.4 | 1 | ||||||||||
| LT Visaginas | 0.26 | 1 | ||||||||||
| LT Alytus city | 0.23 | 1 | ||||||||||
| LT Marijampolė | 0.16 | 1 | ||||||||||
| LT Mažeikiai | 0.16 | 1 | ||||||||||
| LT Utena | 0.15 | 1 | ||||||||||
| LT Jonava | 0.13 | 1 | ||||||||||
| LT Druskininkai | 0.13 | 1 | ||||||||||
| LT Kėdainiai | 0.12 | 1 | ||||||||||
| LT ExcessH | 1.09 | 25 | ||||||||||
| LT NoSource | 0.19 | 6 | ||||||||||
| LT Rest | 0.46 | 12 |
Table 21. Represented DH areas in Lithuania
2.4.2 Heat pump performance modelling
HP COPs were modelled by means of an approach used in Pieper et al.[1]Henrik Pieper, Torben Ommen, Brian Elmegaard, and others, ‘Optimal Design and Dispatch of Electrically Driven Heat Pumps and Chillers for a New Development Area’, Environmental and Climate Technologies, 24.3 (2020), 470–82. . Thus, more realistic COPs were determined for HPs operating throughout the year compared to the commonly used simple COP estimates. The approach is based on linear regression to determine COPs for other heat sources and DH operating temperatures as compared to the design ones. This method requires a thermodynamic model for design and off-design conditions. The COP for off-design operation can be calculated as follows (Eq. (1)):
(1)
Where
is the COP for off-design operation,
is the COP for design conditions,
is the heat source inlet temperature for off-design operation of heat source i,
is the heat source inlet temperature for design conditions of heat source i,
is the DH supply temperature for off-design operation,
is the DH supply temperature for design conditions,
is the DH return temperature for off-design operation,
is the DH return temperature for design conditions,
a, b and c are coefficients based on linear regression.
The parameters required to determine the COP for off-design operation can be found in Table 22 and Table 23. Various parameters were determined for each heat source considered and design conditions, representing the Baltic climate and specific DH operating temperatures.
Footnotes
- ^ Henrik Pieper, Torben Ommen, Brian Elmegaard, and others, ‘Optimal Design and Dispatch of Electrically Driven Heat Pumps and Chillers for a New Development Area’, Environmental and Climate Technologies, 24.3 (2020), 470–82.
| Parameter | Sewage water | River, lake & seawater | High-temperature excess heat | Low-temperature excess heat | Flue gas |
| Tsource,i,d | 7 | 4 | 60 | 40 | 50 |
| COPd | 2.91 | 2.91 | 3.43 | 3.43 | 3.43 |
| a | 0.0286 | 0.0287 | 0.041 | 0.0354 | 0.0365 |
| b | -0.013 | -0.0131 | -0.0202 | -0.0202 | -0.0209 |
| c | -0.013 | -0.012 | -0.0168 | -0.0169 | -0.017 |
Table 22. Coefficients for COP estimation for off-design operation for DH temperatures of 90/60°C
| Parameter | Sewage water | River, lake & seawater | High-temperature excess heat | Low-temperature excess heat | Flue gas |
| Tsource,i,d | 7 | 4 | 60 | 40 | 50 |
| COPd | 3.13 | 3.13 | 3.76 | 3.76 | 3.76 |
| a | 0.0315 | 0.028 | 0.0473 | 0.0477 | 0.0402 |
| b | -0.0153 | -0.0153 | -0.0245 | -0.0245 | -0.0245 |
| c | -0.0145 | -0.0135 | -0.0193 | -0.0194 | -0.0194 |
Table 23. Coefficients for COP estimation for off-design operation for DH temperatures of 80/55°C
2.4.3 Heat pump investment modelling
The variation in investment amounts for large-scale HP projects can be significant, but it can be estimated using linear correlations depending on HP thermal capacity. This allows for an easy integration into energy planning software. Thus, optimisations can be calculated using linear or mixed-integer linear programming. This has several advantages over nonlinear modelling.
Pieper et al.[1]Henrik Pieper, Torben Ommen, Fabian Buhler, and others, ‘Allocation of Investment Costs for Large-Scale
Heat Pumps Supplying District Heating’, Energy Procedia, 147 (2018), 358–67 j.egypro.2018.07.104>.determined HP investment amounts for a variety of heat sources. They divided costs into five categories, as shown in Figure 31. They used information from 26 existing HP projects and three planned projects from[2]Danish Energy Agency, ‘Large Heat Pumps in District Heating Systems (in Danish:)’, 2016. [3]Danish Energy Agency, Inspiration Catalogue for Large-Scale Heat Pump Projects in District Heating’, (in Danish), 2017., from a consulting company[4]PlanEnergi, ‘Overview of Large-Scale Electric (and Gas) Driven Heat Pumps, Which Produce Heat for Danish District Heating (in Danish)’, 2019., and via direct communication with representatives of DH companies with large-scale HP units. Additional information was provided by Bühler et al.[5]Fabian Bühler, Stefan Petrović, and others, ‘Spatiotemporal and Economic Analysis of Industrial Excess Heat as a Resource for District Heating’, Energy, 2018. for twelve offers of industrial HP units. Investments considered included the purchase and installation of equipment and consulting services. The study resulted in an overview of specific investments for large-scale HPs based on heat source, as shown in Figure 31 and Table 24.
Footnotes
- ^ Henrik Pieper, Torben Ommen, Fabian Buhler, and others, ‘Allocation of Investment Costs for Large-Scale
Heat Pumps Supplying District Heating’, Energy Procedia, 147 (2018), 358–67 j.egypro.2018.07.104>. - ^ Danish Energy Agency, ‘Large Heat Pumps in District Heating Systems (in Danish:)’, 2016.
- ^ Danish Energy Agency, Inspiration Catalogue for Large-Scale Heat Pump Projects in District Heating’, (in Danish), 2017.
- ^ PlanEnergi, ‘Overview of Large-Scale Electric (and Gas) Driven Heat Pumps, Which Produce Heat for Danish District Heating (in Danish)’, 2019.
- ^ Fabian Bühler, Stefan Petrović, and others, ‘Spatiotemporal and Economic Analysis of Industrial Excess Heat as a Resource for District Heating’, Energy, 2018.
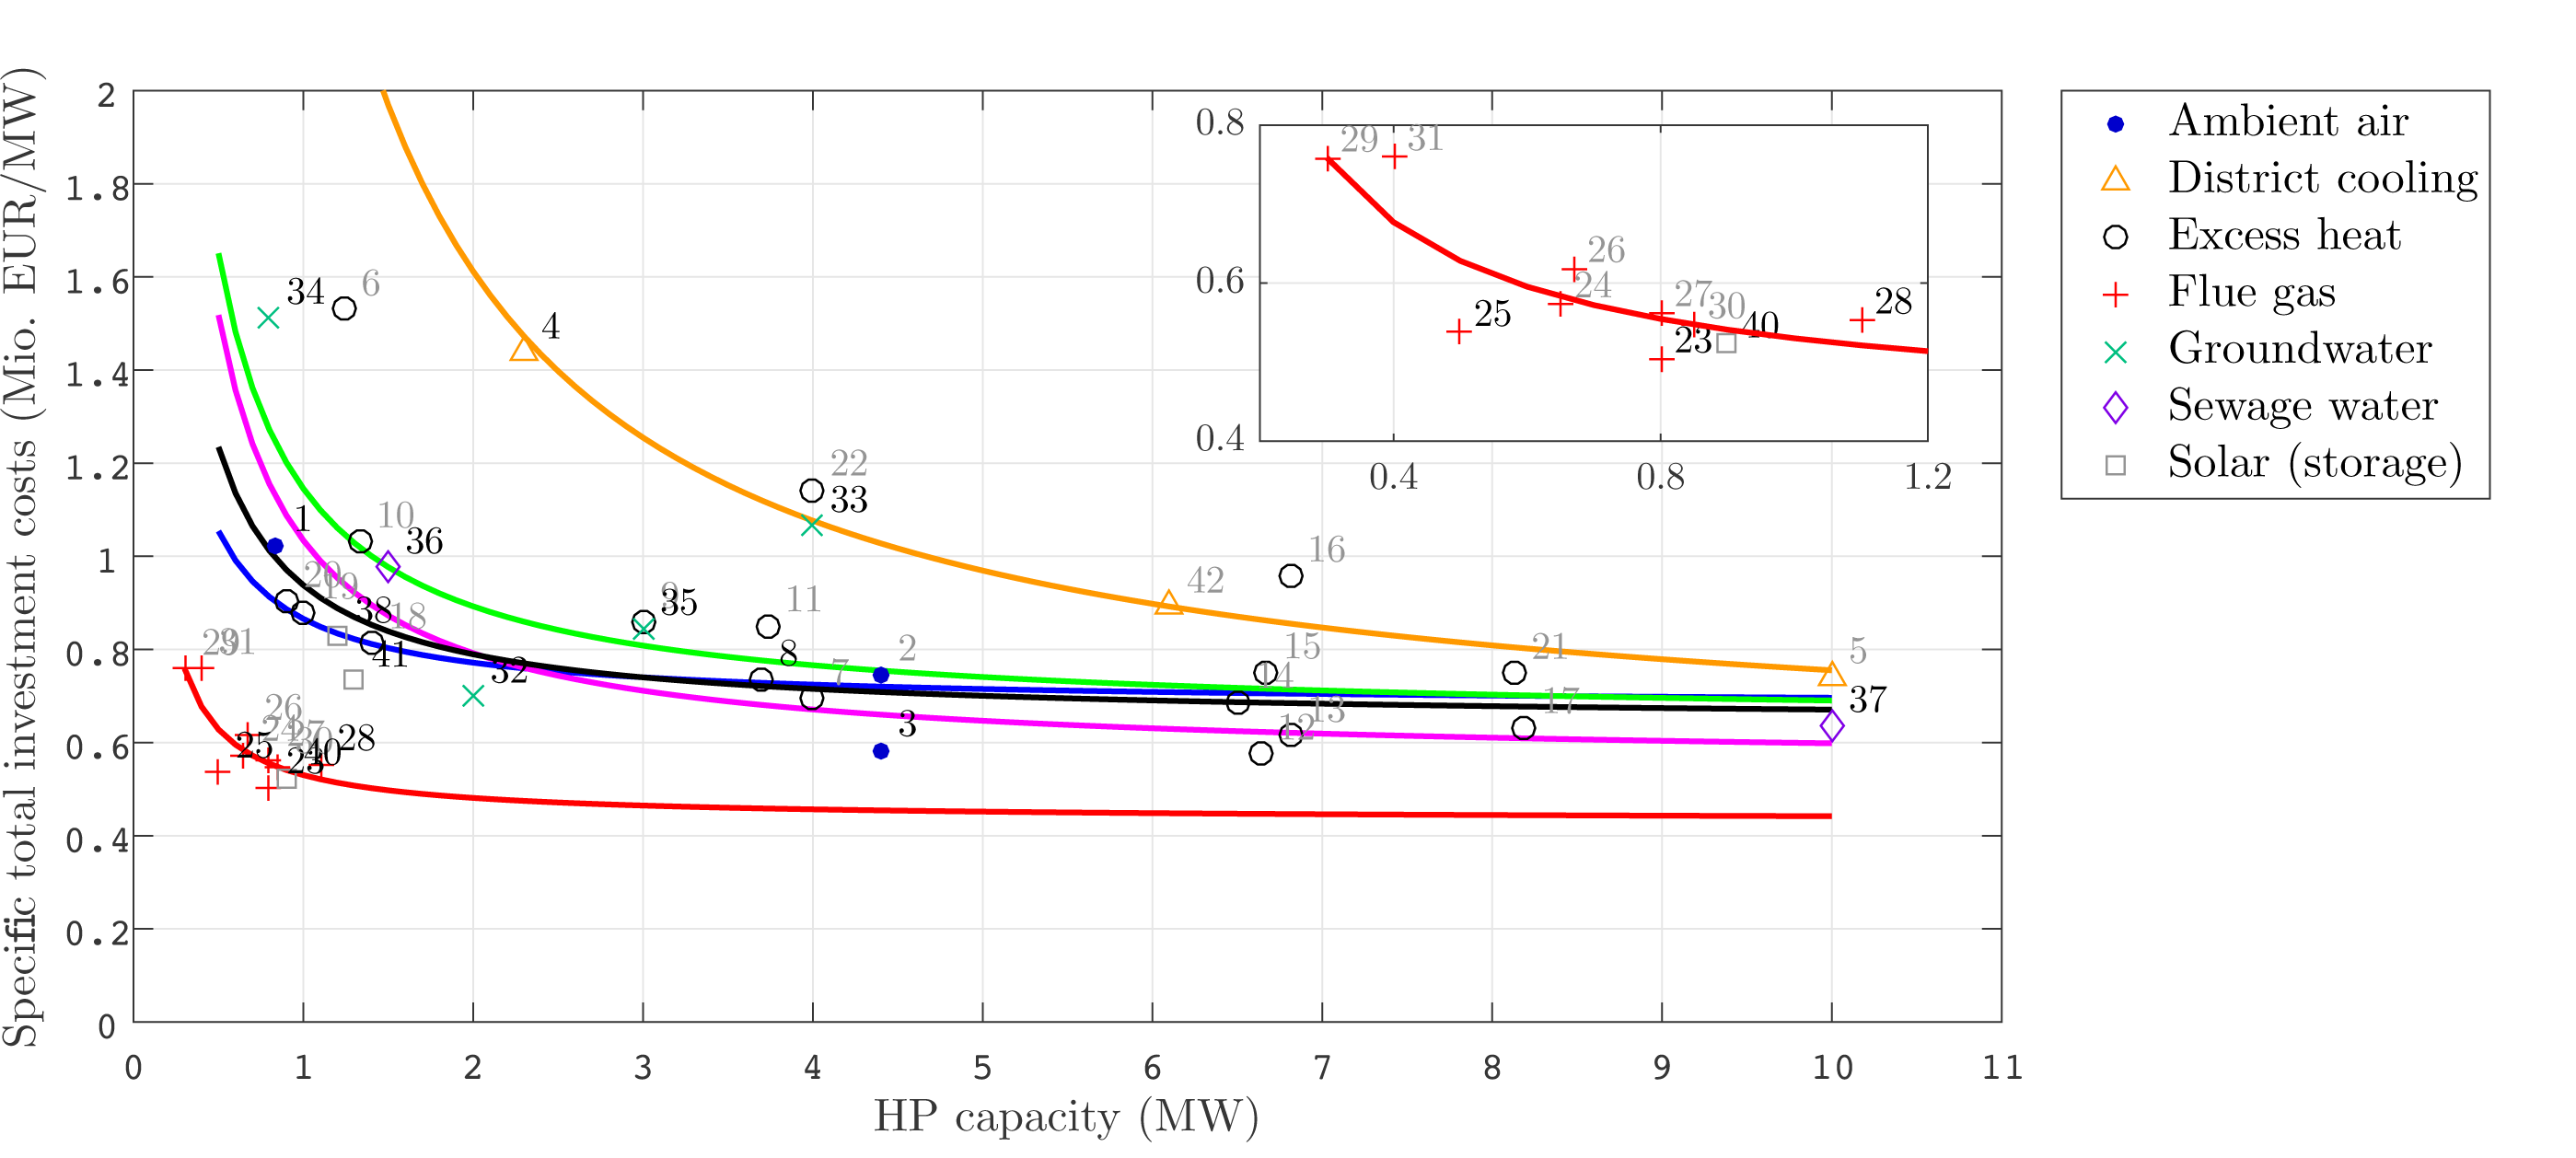
Figure 31. Specific investments for HP projects based on the heat source (copied from[1]Henrik Pieper, ‘Optimal Integration of District Heating, District Cooling, Heat Sources and Heat Sinks’ (Technical University of Denmark, 2019).)
Footnotes
- ^ Henrik Pieper, ‘Optimal Integration of District Heating, District Cooling, Heat Sources and Heat Sinks’ (Technical University of Denmark, 2019).
As shown in Figure 31, HP investments can vary significantly. The investment is usually reduced for larger HP capacities until a certain size is reached. As can be seen, flue gas HPs are generally cheaper and have a lower capacity. They are typically used to preheat DH return water and therefore represent a simpler single-stage cycle design. HPs based on ambient air, industrial excess heat, and groundwater have different investments for smaller capacities, while investments for larger capacities are very similar. HPs based on sewage water have higher initial investment, but it is significantly reduced for large HP capacities. HPs that use the DC network as a heat source are much more expensive. However, they are also able to supply both heating and cooling at the same time. Additional equipment costs may be required for a storage tank, heat exchangers, connecting pipes to the DH network, and extra pumps for the DH network[1]Henrik Pieper, Torben Ommen, Fabian Buhler, and others, ‘Allocation of Investment Costs for Large-Scale Heat Pumps Supplying District Heating’, Energy Procedia, 147 (2018), 358–67 <https://doi.org/10.1016/
j.egypro.2018.07.104>.. An overview of specific investments for various HP capacities is provided in Table 24.
Footnotes
- ^ Henrik Pieper, Torben Ommen, Fabian Buhler, and others, ‘Allocation of Investment Costs for Large-Scale Heat Pumps Supplying District Heating’, Energy Procedia, 147 (2018), 358–67 j.egypro.2018.07.104>.
| Specific costs (million €/MW) | Flue gas | Sewage water | Excess heat | Groundwater | Air |
| 0.5 MW ≤ HPCapacity < 1 MW | 0.63 to 0.53 | 1.91 to 1.23 | 1.30 to 0.97 | 1.72 to 1.18 | 1.12 to 0.90 |
| 1 MW ≤ HPCapacity < 4 MW | 0.53 to 0.46 | 1.23 to 0.72 | 0.97 to 0.72 | 1.18 to 0.77 | 0.90 to 0.73 |
| 4 MW ≤ HPCapacity ≤ 10 MW | 0.46 to 0.44 | 0.72 to 0.62 | 0.72 to 0.67 | 0.77 to 0.69 | 0.73 to 0.70 |
Table 24. Specific total investments for HP projects depending on the heat source and HP capacity[1]Henrik Pieper, Torben Ommen, Fabian Buhler, and others, ‘Allocation of Investment Costs for Large-Scale Heat Pumps Supplying District Heating’, Energy Procedia, 147 (2018), 358–67 <https://doi.org/10.1016/
j.egypro.2018.07.104>.
Footnotes
- ^ Henrik Pieper, Torben Ommen, Fabian Buhler, and others, ‘Allocation of Investment Costs for Large-Scale Heat Pumps Supplying District Heating’, Energy Procedia, 147 (2018), 358–67 j.egypro.2018.07.104>.
Furthermore, the investment can be broken down into the different cost contributors identified in Figure 31, as shown in Figure 32. HP contributed the most to the total investment amount.
When modelling large-scale HPs in the Baltic states, industrial excess heat, flue gas, seawater, rivers and lakes were considered as potential heat sources. Linear correlations were required for investment modelling. The calculations were carried out on the basis of linear programming, and not based on mixed-integer linear programming. Thus, the HP investments identified by Pieper et al.[1]Henrik Pieper, Torben Ommen, Fabian Buhler, and others, ‘Allocation of Investment Costs for Large-Scale Heat Pumps Supplying District Heating’, Energy Procedia, 147 (2018), 358–67 j.egypro.2018.07.104>.have been adjusted to meet the needs of the current analysis based on the average expected HP capacity for the respective heat source. For the investments of seawater HPs, information were obtained from[2]Danish Energy Agency and Energinet, ‘Technology Data - Generation of Electricity and District Heating’, 2020,
414.. Furthermore, some of the heat sources were located within the DH area, while others were located within 1 km. These costs can be included based on cost estimates for additional piping in rural and urban areas. An overview of the estimated HP investment values can be found in Table 25.
Footnotes
- ^ Henrik Pieper, Torben Ommen, Fabian Buhler, and others, ‘Allocation of Investment Costs for Large-Scale Heat Pumps Supplying District Heating’, Energy Procedia, 147 (2018), 358–67 j.egypro.2018.07.104>.
- ^ Danish Energy Agency and Energinet, ‘Technology Data - Generation of Electricity and District Heating’, 2020,
414.
Figure 32. Investment breakdown for HPs for five different heat sources[1]Henrik Pieper, Torben Ommen, Fabian Buhler, and others, ‘Allocation of Investment Costs for Large-Scale
Heat Pumps Supplying District Heating’, Energy Procedia, 147 (2018), 358–67 j.egypro.2018.07.104>.
Footnotes
- ^ Henrik Pieper, Torben Ommen, Fabian Buhler, and others, ‘Allocation of Investment Costs for Large-Scale
Heat Pumps Supplying District Heating’, Energy Procedia, 147 (2018), 358–67 j.egypro.2018.07.104>.
| HP Investments (€/MW) | Seawater | Industrial excess heat | Flue gas | Sewage water, rivers & lakes |
| 0 m to DH rural/urban | 755,893 | 701,550 | 473,140 | 594,794 |
| 1000 m to DH rural | 886,822 | 771,311 | - | 632,303 |
| 1000 m to DH urban | - | 816,056 | - | 654,824 |
Table 25. HP investments based on location (rural/urban) and distance to DH
2.5 Energy system development
Several scenarios have been modelled in this study to investigate the competitiveness of large-scale HPs and excess heat utilization in the future. The base scenario has been established as rough average of various future outlooks for the future of the energy system. The scenarios illustrate major changes to the average trajectory, which might have the most impact on the realization of the HP potential. As electricity is the required input for nearly all HP developments (apart from absorption HPs), the evolution of the electricity system is also observed in this study. Figure 33 illustrates the electricity generation mix in the base scenario in the modelled area. A smooth transition of the energy system into a more renewable one is shown, where solid fossil fuels are almost completely phased out, with significant natural gas usage present until 2050. Both wind and solar power greatly increase their market shares.
SHORTCUTS
2.1 Key findings
2.2 Previous modelling results relevant for HPs in future energy scenarios in the Baltics
2.3 Current practice of heat pump representation in energy planning
2.4 Our modelling approaches
2.5 Energy system development
2.6 Scenario analysis of the future of district heating in the Baltics
2.7 Summary of results for each Baltic state
2.8 Sensitivity analysis
Figure 33. Electricity generation mix in the modelled countries
Similarly, the power system development can be observed for the three Baltic countries, summarised in Figure 34. It can be observed, that extensive utilization of wind resource is taking place in the Baltic countries, turning from net importers to net exporters over the modelled period. The change is mainly due to onshore wind resources.
Figure 34. Electricity generation mix over the modelled period in the Baltic countries
The power price development is marked on Figure 35. Since the Baltic electricity systems are very strongly interconnected and no drastic difference between the prices in the three countries are expected, only Latvia is added as an indicator of prices for each Baltic state. Norwegian and Polish power prices indicate the two major influencer for the Baltic countries’ electricity markets. The Baltic countries have been greatly influenced by the hydropower from the Nordic countries, because of the Estonian interconnection to Finland and the interconnection construction from Lithuania to Sweden. On the other hand, the fossil-heavy country Poland will be stronger connected to the Baltic countries from 2026.
Figure 35. Average annual spot price development in key countries
2.6 Scenario analysis of the future of district heating in the Baltics
The heat generation mix in the Baltic countries for the three main scenarios is shown in Figure 36. It can be seen that in all scenarios, the introduction of HPs will begin by 2040, for the Invest Support scenario even by 2030. As expected, additional fees in the form of grid tariffs reduce the number of HPs used, while investment support increases it. According to the Investment Support scenario, large-scale HPs will account for up to 68% of the total heat supplied in 2050.
Figure 36. Heat generation mix in the Baltics for the modelled scenarios
According to the Base scenario, large-scale HPs will account for up to 54% and biomass-based production plants for 33% in 2050. The use of natural gas will steadily decline from 7.9 TWh in 2020 to 1.4 TWh in 2050.
In the Grid Tariffs scenario, the amount of implemented HP technologies was limited. In this scenario, the least amount of heat was generated by HPs. It can be concluded that current grid tariffs are hindering HP implementation. The share of large-scale HPs in heat generation in 2050 will be only about 24%. Instead, most of the heat will be produced using large amounts of biomass, which reflects the current situation fairly well.
In the Invest Support scenario, investments in large-scale HPs are subsidised by 50%, which has a big impact on HP implementation. In 2050, up to 68% of heat will be generated by HPs. If the extent of investment support varies and is, for example, 20% or 30%, the expected heat generated by HPs will be somewhere between the Base scenario and the Invest Support scenario.
Figure 37 shows heat generation capacities in the Baltic countries. In all scenarios, heat storages are also used along with other technologies. Notably, the scenario with the highest HP implementation also involves the most heat storage facilities. This is due to the limited potential for using heat sources and a decrease in the available low-grade heat in winter due to the lower water temperature in the heat sources. This shows that heat storage will play a major role in the future supply of DH, which will help balance the power grid by, for example, storing heat generated by large-scale HPs, which is sometimes necessary for the power grid, but not needed for the DH sector. Heat storage can be further used to reduce the required installed capacity of heating plants during peak hours.
Figure 37. Heat generation capacity in the Baltic countries for the modelled scenarios
Figure 37 further shows that higher total installed capacity is required in scenarios with higher HP penetration, as HPs often cannot operate at full capacity during peak heat load. Therefore, they are combined with storage facilities and alternative generators to ensure heat supply at all times. It can also be noted that large natural gas and biomass-based plants will be phased out by 2040 due to the fact that the existing plants are leaving the market. The lifetime of many of these plants will be exceeded by 2040 and, therefore, they will be replaced with the most competitive technology available at the time.
According to the Base scenario, HPs will account for about 16% of the total heat generation capacity and 29% of storage capacity in 2050, while in the Invest Support scenario it will account for 28% and 35%, respectively. This indicates that storage can play a significant role in the future of DH systems regardless of the scenario. However, the synergy with HPs is greater than with other technologies.
The heat sources used to generate heat via large-scale HPs are shown in Figure 38 for each scenario. Excess heat has limited potential, but it is the most reliable heat source. This is due to the high COP value and an easily accessible heat source. Another widely used heat source is the output of sewage water treatment facilities, which are also characterised by high availability throughout the year, close proximity to DH areas, and reasonably high COP values. As for natural heat sources, seawater and river water are widely used, while lake water is only used in some cases.
Figure 38. Heat generated by large-scale HPs based on the heat source
The results in Figure 38 show that excess heat source HPs are utilized regardless of the scenario. To a certain extent, this indicates that industrial excess heat is the most competitive heat source and it does not require financial incentives for implementation in the long term. The same applies to sewage water HPs, but to a limited extent. By 2050, all scenarios will use the same number of treated sewage water HPs.
HPs running on sea and river water are very sensitive to economic input parameters. Seawater has the highest potential in terms of capacity, making it an appealing choice if other heat sources are limited or too expensive (e.g. biomass). However, it can only be utilized in DH areas by the shore. A strong advantage of seawater HPs is that they are subject to much less technical heat source limitation than, for example, excess heat or lake water HPs, making them an excellent target for financial incentives. The potential of lake water as a heat source is very limited; however, even within this limit, it is used on a very small scale, which hints at the fact that sea and river water HPs are still more competitive wherever the resource is available.
The expected GHG emissions from DH generation in the three Baltic countries are shown in Figure 39. GHG emissions are lower in the Invest Support scenario, which features the least fuel-based DH generation. GHG emissions calculated for the Invest Support scenario are less than half of the emissions under the Grid Tariffs scenario with low HP implementation. This is because HPs are losing some of their competitive advantage due to increased electricity costs. They are partially replaced by natural gas. This shows that large-scale HPs, together with heat storage, are critical to effectively reducing GHG emissions.
Figure 39. CO2 emissions in the Baltics for each scenario in 2030, 2040, and 2050
2.7 Summary of results for each Baltic state
Figure 40 depicts the evolution of the heat generation portfolio for DH systems in Estonia, Latvia, and Lithuania. For each scenario, we can see an increase in the amount of heat generated using large-scale HPs and a decrease in heat generated by biomass and natural gas-based plants. The change is most prominent in the Invest Support scenario and least prominent in the Grid Tariffs scenario. In Estonia, large-scale HPs will be able to supply nearly the entire demand for DH by 2050, according to the Invest Support scenario. In Latvia, about 67% of the total heat produced will come from HPs, while 17% will be produced by biomass-based production plants, and 9% by natural gas-based plants. In Lithuania, HPs will generate 63% and biomass plants 32% of heat in 2050, according to the same scenario. Natural gas will be almost completely phased out. An overview of each country is available in the sections below.
SHORTCUTS
2.1 Key findings
2.2 Previous modelling results relevant for HPs in future energy scenarios in the Baltics
2.3 Current practice of heat pump representation in energy planning
2.4 Our modelling approaches
2.5 Energy system development
2.6 Scenario analysis of the future of district heating in the Baltics
2.7 Summary of results for each Baltic state
2.8 Sensitivity analysis
Figure 40. Heat generated based on scenario and Baltic country
In order to better understand which heat sources are used in each Baltic country and modelled DH area, the actual use for each heat source was investigated. Results are shown for the Base scenario for 2050 only. The use of heat sources in the modelled DH areas and the highest use of heat sources in each Baltic state can be found in Figure 41. This indicates how much low-grade heat from each heat source will be used. It does not show how much heat is generated by large-scale HPs using these heat sources, as it depends on the COP. The use of heat sources for each modelled DH area is provided in the sections below.
As shown, seawater and sewage water are the most used heat sources in the Baltics. Consequently, these heat sources will provide the greatest potential for large-scale HPs to supply DH. In addition, a large amount of river water can be used in Vilnius and Kaunas. The other heat sources are irrelevant. The excess heat available is limited, which is the reason it cannot be used more. Flue gas is limited to 4-5% of the heat generated by boilers and CHP plants. It is used in each represented DH area, but in a small amount, also due to the fact that the heat generated by boilers and CHP plants will make up a smaller share of the total heat supply compared to today.
Figure 41. Use of heat sources in major DH areas in 2050 according to the Base scenario
2.7.1 Outlook for heat generation and heat source use in Estonia
The proportions of heat generated by Estonian DH plants can be seen in Figure 42. As illustrated in Figure 40, nearly the entire demand for DH (82%) can be supplied by large-scale HPs by 2050, according to the Invest Support scenario. While HPs will already be implemented, to a large extent, by 2030, according to the Invest Support scenario, in the Base scenario, the implementation will begin only after 2030. In the Grid Tariffs scenario, the implementation will be started by 2040, with the greatest growth to be seen until 2050 for this scenario. In the Base scenario, the shares of heat supplied by large-scale HPs, biomass-based plants, natural gas-fired plants and others (mainly waste or oil shale) are about 61%, 23%, 7%, and 9%, respectively.
Figure 42. Proportions of heat generated in Estonia for each scenario
An overview of the use of heat sources for each modelled DH area can be found in Figure 43 (for Tallinn see Figure 41). This shows how much low-grade heat from each heat source is being used. It does not show how much heat is generated by large-scale HPs using these heat sources. It can be seen that a large amount of excess heat can be utilised in Narva and in aggregated DH areas with access to excess heat. This aggregate excess heat group had a combined heat production of 0.53 TWh, which was higher than Narva (0.39 TWh), and consisted of 37 individual DH areas (compare with Table 19). All of these DH areas have excess heat, which results in an overall high utilisation rate, even though it may consist of many small industrial sites. Narva represents a special case due to the existing Balti power plant. It was assumed that 50% of the energy consumed by the power plant could be used to provide additional excess heat. However, the Balti power plant already provides DH to Narva. Therefore, additional use of excess heat is not required in this case.
Sewage water, seawater, and rivers are suitable heat sources for the rest of the DH areas. Seawater can only be used in Pärnu and Sillamäe. Larger sewage water treatment facilities are located in Tartu and Pärnu, while smaller ones are found in Viljandi, Sillamäe, Vöru and other small DH areas.
Figure 43. Use of heat sources in Estonia (without Tallinn) in 2050 according to the Base scenario
2.7.2 Outlook for heat generation and heat source use in Latvia
The heat generation mix in Latvia is shown in Figure 44. As illustrated in Figure 40, about 67% of the entire demand for DH can be supplied by large-scale HPs by 2050, according to the Invest Support scenario. 17% will be produced by biomass-based production plants and 9% by natural gas-based plants. Only a small number of HPs will be implemented by 2030 under the Invest Support scenario. HP implementation will begin after 2030 in the Base scenario and after 2040 in the Grid Tariffs scenario. In the Grid Tariffs Scenario, only about 12% of the heat will be generated by HPs. Biomass-based heating will be widely used instead. In the Base scenario, the proportions of heat supplied by large-scale HPs, biomass-based plants, natural gas-fired plants and others (mainly waste) are about 55%, 25%, 13%, and 7%, respectively.
Figure 44. Proportions of heat generated in Latvia for each scenario
The use of heat sources for each modelled DH area can be found in Figure 45 (for Riga see Figure 41). This shows how much low-grade heat from each heat source is being used. It does not show how much heat is generated by large-scale HPs using these heat sources. It can be seen that the potential use is not concentrated in several DH areas, as was the case in Estonia, but distributed among different DH areas.
Sewage water can be used in Daugavpils, Jelgava and from aggregate groups of excess heat and sewage water treatment plants, each with a heat production of 0.82 TWh and 0.28 TWh for 21 and 29 individual DH areas, respectively. Rivers can be additionally used in Daugavpils, Jelgava, and Ventspils, and in Jūrmala it is the main source of heat. Liepāja is located by the sea and can only use seawater to supply DH via large-scale HPs. A small amount of flue gas will be used in each area based on its potential and the expected operation of boilers and CHP plants.
Figure 45. Use of heat sources in Latvia (without Riga) in 2050 according to the Base scenario
2.7.3 Outlook for heat generation and heat source use in Lithuania
Heat generation in the case of Lithuania is shown in Figure 46. As illustrated in Figure 40, large-scale HPs will generate 63% of the total demand for DH and biomass plants will produce 32% in 2050 under the Invest Support scenario. Natural gas will be almost completely phased out.
While HPs will be implemented to some extent as early as 2030 under the Invest Support scenario, the share will be much higher from 2040 and on. In the Base scenario, a large number of HPs will already be implemented, while in the Grid Tariffs scenario, the implementation will not be underway until 2040. In the Grid Tariffs Scenario, about 25% of the heat will be generated by HPs. Biomass-based heating will be largely used as the main source. In the Base scenario, the proportions of heat supplied by large-scale HPs, biomass-based plants, natural gas-fired plants, and others (mainly waste) are about 50%, 42%, 5%, and 3%, respectively.
Figure 46. Proportions of heat generated in Lithuania for each scenario
The use of heat sources for each modelled DH area can be found in Figure 47 (for Kaunas, Klaipėda, and aggregate excess heat areas, see Figure 41). This shows how much low-grade heat from each heat source is being used. It does not show how much heat is generated by large-scale HPs using these heat sources. It can be seen that lakes are used as heat sources in Šiauliai and Visaginas, mainly because there are no other heat sources in these areas. The use of flue gas is limited to the use of boilers and CHP plants.
The use of sewage water and rivers is proposed for the rest of the DH areas, as was the case in Estonia and Latvia. Seawater is not present here, because no other large cities in Lithuania are located by the sea, except for Klaipėda and Palanga (see Figure 41). There are two larger potential sources of excess heat in Panevėžys, namely AB Panevėžio stiklas (glass factory) and AB Roquette Amilina, formerly UAB Lignoterma (grain factory). In Mažeikiai, UAB Lietuvos cukrus (food processing) could potentially provide excess heat. In Kėdainiai, AB Nordic Sugar Kėdainiai could potentially provide excess heat to large-scale HPs to supply DH.
Figure 47. Use of heat sources in Lithuania (without Vilnius, Kaunas, Klaipėda, and aggregate excess heat areas) in 2050 according to the Base scenario
2.8 Sensitivity analysis
As described in Section 2.4, a sensitivity analysis was conducted to examine the effects of variations in fuel and electricity prices on the total heat production shares of different technologies. Figure 48 shows the results for biomass prices that are 33% higher and lower than in the Base scenario, and CO2 prices that are 33% higher and lower than in the Base scenario. In addition, a combination of scenarios is displayed where both biomass and CO2 costs for producers are 33% higher than in the Base scenario.
Figure 48. Heat generation in the Baltic countries under the modelled sensitivity scenarios
It can be seen that the results change significantly compared to the Base scenario when the price of biomass changes, but not as drastically when the price of CO2 changes. High biomass prices result in low heat generation by large-scale HPs and vice versa. If the price of biomass is very low and biomass is highly available, this could almost completely displace HPs from the market. HPs do not gain significant additional traction if the price of CO2 is high; instead, fossil natural gas is replaced by biomass. However, in the Low CO2 scenario, natural gas becomes cheaper than biomass, which means that less biomass is used, but the effect on large-scale HPs remains insignificant. The highest HP penetration is achieved in the High Combo scenario. However, HP implementation in this case is not much higher than in the high biomass scenario.
Sensitivity analysis shows that large-scale HPs often compete directly with biomass, and the relationship with heat production from natural gas is insignificant. This may be very relevant in future energy systems due to widespread discussions about the sustainability of high biomass use in the energy sector and the possible need to use biomass to produce synthetic fuels for other sectors such as aviation.
In addition to the fierce competition between biomass and HPs in the heat generation landscape, previous scenarios also show that when HP utilisation decreases (i.e. in the Grid Tariffs scenario), HPs can be partially replaced by natural gas. This illustrates very well the three-way balance between the three main sources of heat in future DH systems described in this study.
Chapter 3
Drivers Behind Widespread Adoption of Heat Pumps and Cooling Technologies
3.1. Key findings
-
The benefits of power-to-heat technologies include avoiding the curtailment of renewable energy production, providing flexibility on the demand side, utilising existing thermal storage capacities, providing grid ancillary services, and increasing self-consumption via renewable local generation.
-
The current electricity production in each Baltic state has been described and analysed in terms of sustainability, fluctuating renewable energy source integration, and prices. Estonia uses mainly oil shale for power generation, which leads to high specific CO2 emissions. Power generation in Latvia is mainly based on hydropower and natural gas. Electricity generation in Lithuania has undergone major changes since nuclear power was phased out in 2010. The share of generated electricity compared to final electricity consumption in Lithuania was only 32%, while in Estonia and Latvia it was 84% and 91%, respectively.
-
The drivers behind the implementation of large-scale heat pumps have been identified and described for each Baltic state, including their current status. The following drivers have been identified: district heating network ownership structure, low district heating operating temperatures, high proportion of residents supplied by district heating, experience with large-scale heat pumps, political targets for sustainable energy supply, suitable tax and tariff system, sustainable power generation, and high share of fluctuating renewable energy sources.
-
Denmark has shown a potential way to integrate a high share of renewable energy sources into energy systems with large-scale heat pumps supplying district heating. Since 2010, 106 heat pumps, each with a thermal capacity of over 100 kW, have been installed in Denmark to supply heat to district heating networks.
-
Using large-scale heat pumps to simultaneously supply district heating and district cooling is very economical. Although the district cooling potential in the Baltic states is limited, the heating and cooling synergy regions will benefit from district cooling supplied by large-scale heat pumps.
3.2 Power-to-heat technologies and their drivers
HPs are a special case of P2H technologies. P2H refers to technologies that utilise power to produce useful heat for various industrial processes and/or buildings. P2H technologies include HPs and electric boilers. Electric boilers utilise power in order to heat water, while HPs use it to transfer heat from nearby low-temperature heat sources. Heat can be utilised for space heating, domestic hot water, and various industry needs. It can also be kept in thermal energy storage tanks to be used later. HPs can satisfy both heating and cooling needs.
The key focus is placed on renewable power used to produce heat. Using the current infrastructure, power from renewable sources can be supplied to end users (individual HPs and electric boilers) or centralised heat production stations (large HPs and electric boilers). However, in the event of a significant increase in electricity demand due to power-based heat production, additional investments are likely to be required to increase the capacity of the transmission and distribution network. Figure 49 illustrates centralised and decentralised (individual) P2H options.
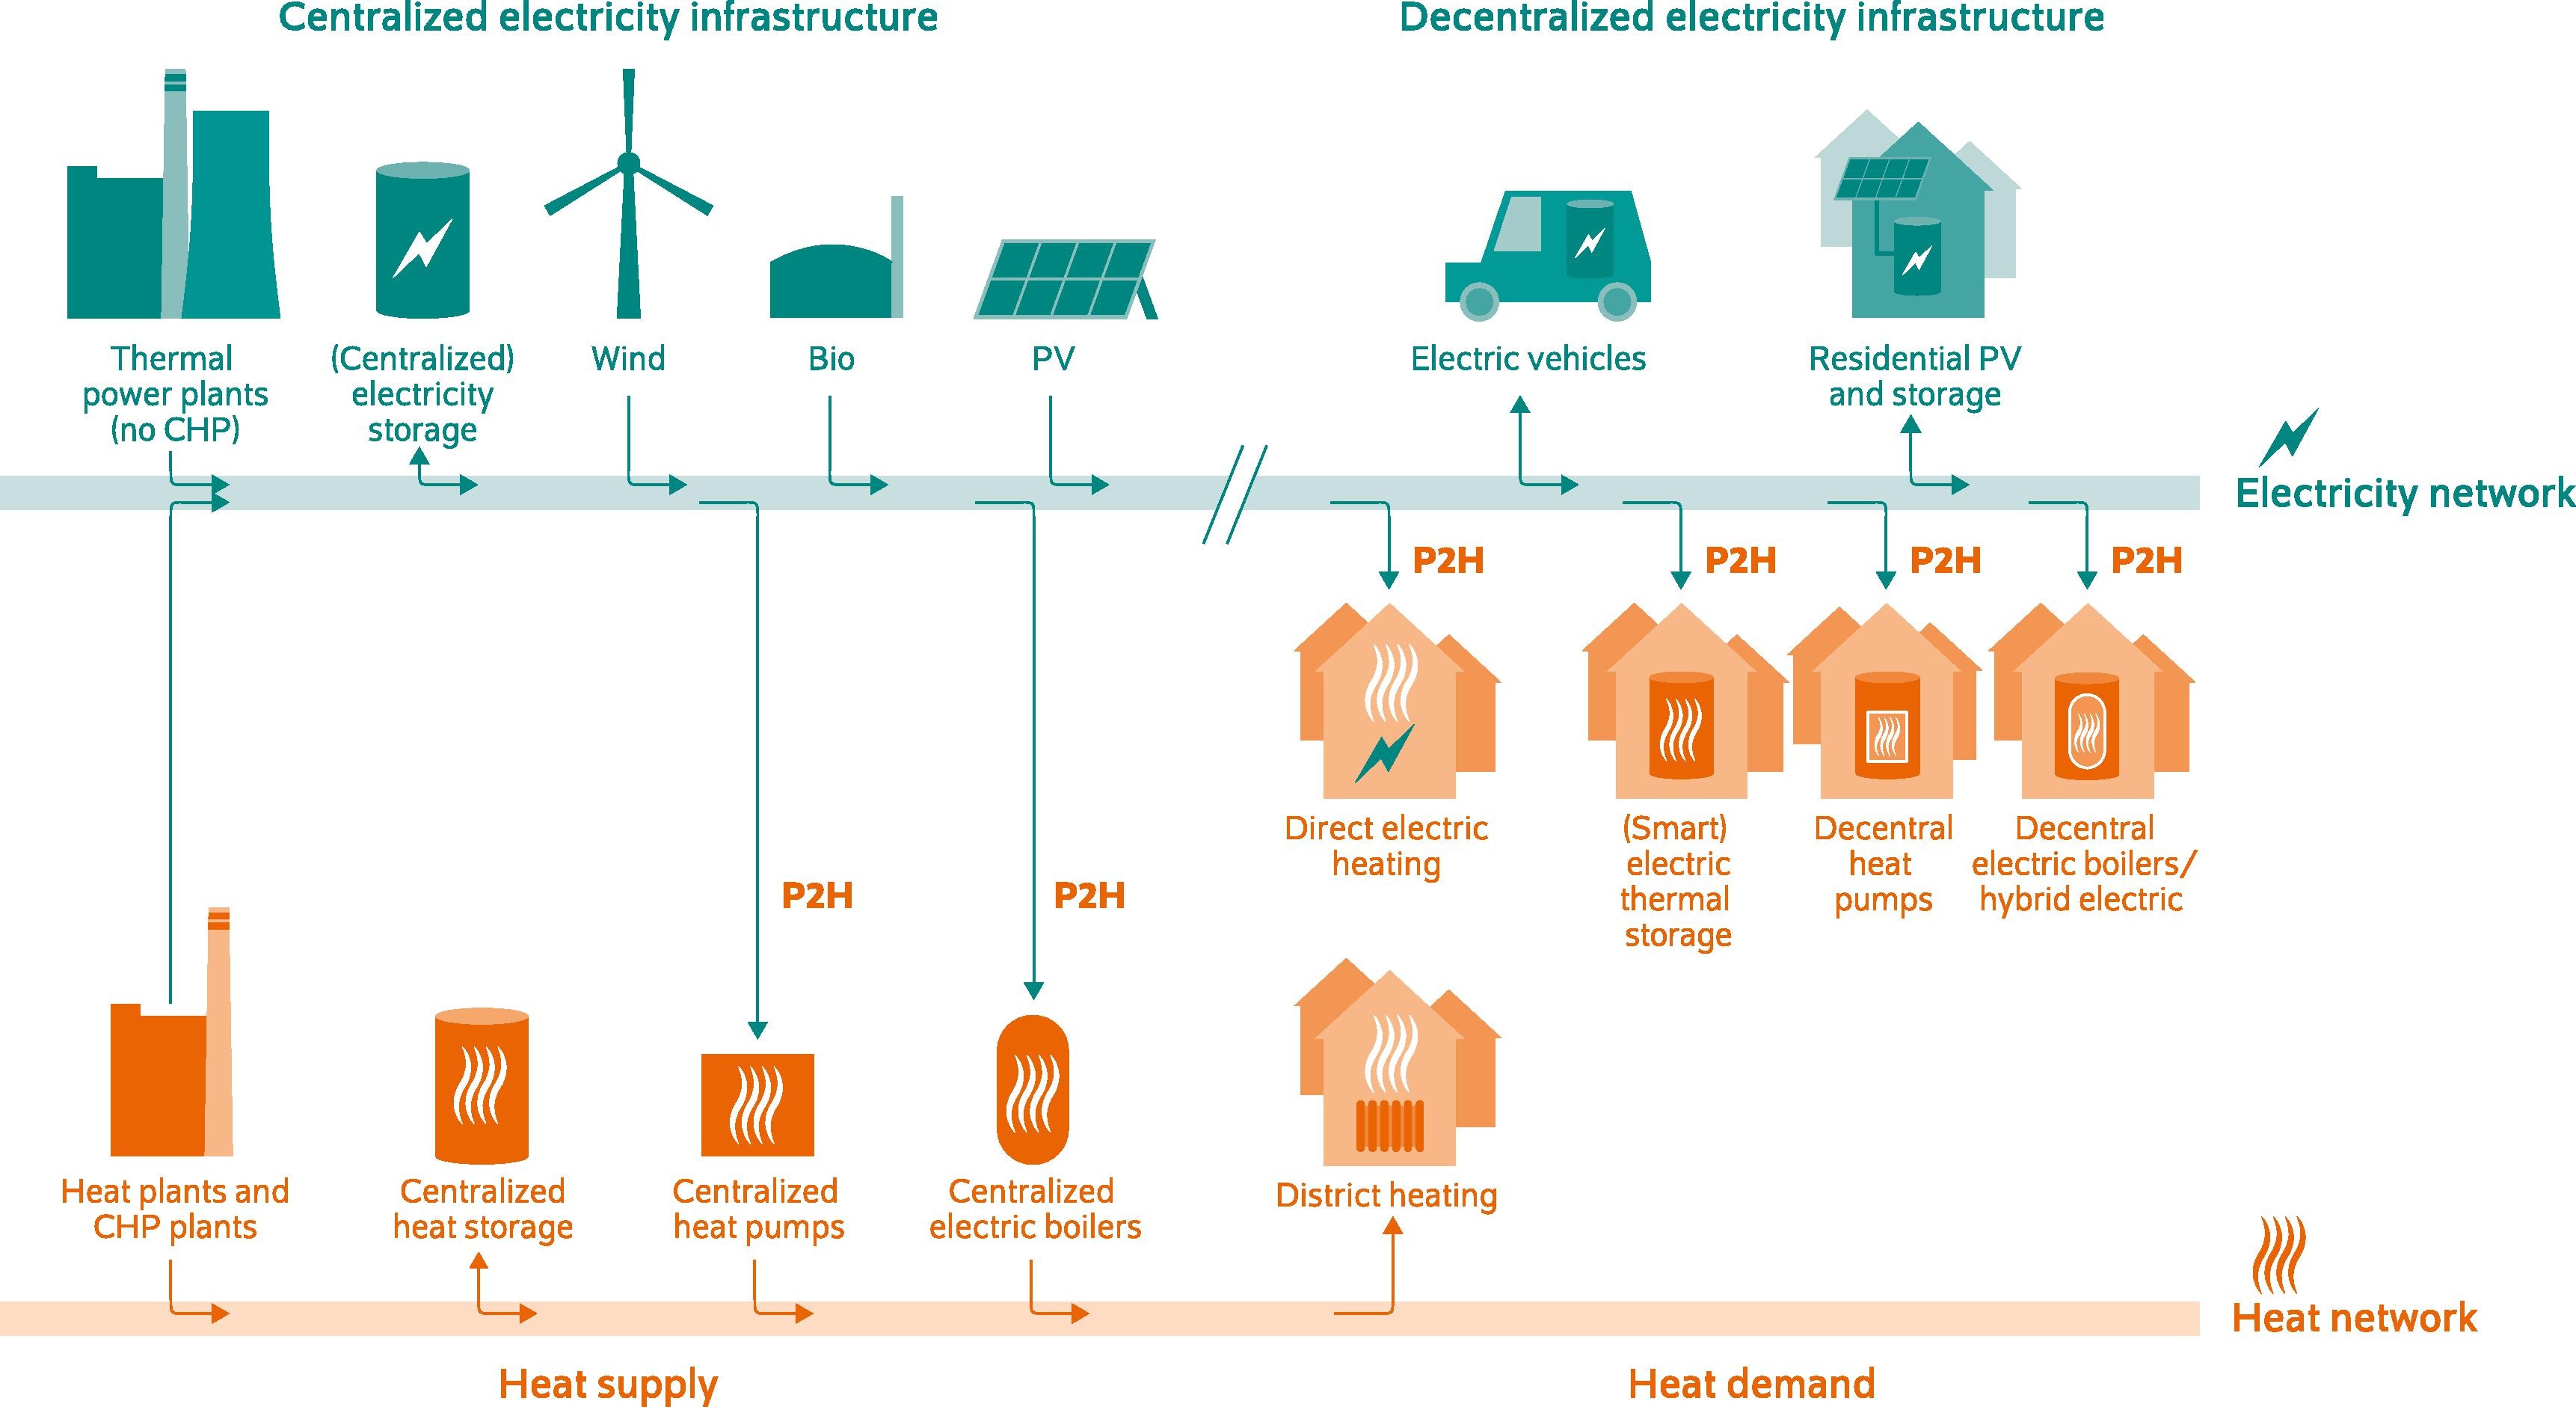
Figure 49. Centralised and decentralised (individual) P2H technologies[1]Andreas Bloess, Wolf-Peter Schill, and Alexander Zerrahn, ‘Power-to-Heat for Renewable Energy Integration: A Review of Technologies, Modeling Approaches, and Flexibility Potentials’, Applied Energy, 212 (2018).
Footnotes
- ^ Andreas Bloess, Wolf-Peter Schill, and Alexander Zerrahn, ‘Power-to-Heat for Renewable Energy Integration: A Review of Technologies, Modeling Approaches, and Flexibility Potentials’, Applied Energy, 212 (2018).
Centralised heating systems that utilise power include large electric boilers and HPs that draw power directly from the main grid. In this case, the power provided depends on the national electricity mix of the particular system and may include fossil fuel-based generation. An increase in the share of RES in the national electricity mix will lead to a decrease in carbon emissions from the use of HPs. In DH systems, electricity can be used to power large electric boilers and HPs, whose heating and cooling output is then supplied to multiple buildings via a DH network.
Benefits
According to[1]IRENA, Innovation Landscape Brief: Renewable Power-to-Heat, 2019. , the main advantages of heating electrification (P2H technology implementation) include renewable generation curtailment reduction, increased energy system flexibility, ability to store large amounts of energy when coupled with thermal energy storage, ability to provide grid services, and increasing self-consumption via renewable local generation.
Increasing power production from renewable energy resources such as solar and wind can result in reduced production when supply exceeds demand, and the system is not sufficiently flexible. P2H systems can utilise the excess power from these sources to meet heating needs, thereby avoiding the curtailment of renewable energy production.
In decentralised heating systems, HPs provide flexibility on the demand side by switching their power consumption from high-demand time intervals to low-demand intervals, which results in peak shaving or valley filling. Centralised P2H technologies are considered essential for the flexibility of an electric power system. The potential for electricity-based heat production to increase the flexibility of energy systems has been investigated in Denmark[2]Sara Ben Amer and others, ‘Modelling the Future Low-Carbon Energy Systems-Case Study of Greater Copenhagen, Denmark’, International Journal of Sustainable Energy Planning and Management, 24 (2019), 21–32. , Germany[3]Andreas Bloess, ‘Impacts of Heat Sector Transformation on Germany’s Power System through Increased Use of Power-to-Heat’, Applied Energy, 239.June 2018 (2019), 560–80. , and Sweden[4]Gerald Schweiger and others, ‘The Potential of Power-to-Heat in Swedish District Heating Systems’, Energy, 137 (2017), 661–69. . Electric boilers in DH networks must resolve the system conflict of baseload power plants in the “must run” operation mode in order to provide system services at low residual loads[5]Andreas Bloess, ‘Impacts of Heat Sector Transformation on Germany’s Power System through Increased Use
of Power-to-Heat’, Applied Energy, 239.June 2018 (2019), 560–80..
Power storage is the best way to integrate solar PV and wind energy into the grid, but these solutions can often be expensive[6]Paul Albertus, Joseph S. Manser, and Scott Litzelman, ‘Long-Duration Electricity Storage Applications, Economics, and Technologies’, Joule, 4.1 (2020), 21–32. [7]Oliver Schmidt and others, ‘Projecting the Future Levelized Cost of Electricity Storage Technologies’, Joule, 3.1 (2019), 81–100. . Currently, large-scale power storage facilities are limited and also very expensive[8]Turgut M. Gür, ‘Review of Electrical Energy Storage Technologies, Materials and Systems: Challenges and Prospects for Large-Scale Grid Storage’, Energy & Environmental Science, 2018, 2696–2767. [9]P. Eser, N. Chokani, and R. Abhari, ‘Trade-Offs between Integration and Isolation in Switzerland’s Energy Policy’, Energy, 150 (2018), 19–27. [10]Linfeng Zheng and others, ‘Incremental Capacity Analysis and Differential Voltage Analysis Based State of Charge and Capacity Estimation for Lithium-Ion Batteries’, Energy, 150 (2018), 759–69. . Other energy storage options, such as pumped-storage hydropower, are location-constrained and not widely available. Thermal energy storage is considered the cheapest and easiest way to store energy and can store heat for short or long-term periods.
P2H technologies can support grid ancillary services. Large HPs and electric boilers can provide grid ancillary services. The power capacity of individual HPs is limited. Therefore, a single HP is unable to provide these services for the period of time required by the system. However, when HPs are aggregated together, they can complement each another, creating a virtual power plant that is able to provide the services the system needs. Individual HPs can play a key role in ensuring resource efficiency and electrification in areas where DH is not feasible.
Implementation of P2H technologies can increase self-consumption via renewable local generation. An example is power generated via rooftop PV that is used to power HPs. The same approach can be used for small DH systems with large-scale HPs. P2H use increase will rise competition in heat supply sector and may lead to heat price decrease. As additional benefit development of HP related companies can be mention: equipment manufacturers, resellers, service providers.
Footnotes
- ^ IRENA, Innovation Landscape Brief: Renewable Power-to-Heat, 2019.
- ^ Sara Ben Amer and others, ‘Modelling the Future Low-Carbon Energy Systems-Case Study of Greater Copenhagen, Denmark’, International Journal of Sustainable Energy Planning and Management, 24 (2019), 21–32.
- ^ Andreas Bloess, ‘Impacts of Heat Sector Transformation on Germany’s Power System through Increased Use of Power-to-Heat’, Applied Energy, 239.June 2018 (2019), 560–80.
- ^ Gerald Schweiger and others, ‘The Potential of Power-to-Heat in Swedish District Heating Systems’, Energy, 137 (2017), 661–69.
- ^ Andreas Bloess, ‘Impacts of Heat Sector Transformation on Germany’s Power System through Increased Use
of Power-to-Heat’, Applied Energy, 239.June 2018 (2019), 560–80. - ^ Paul Albertus, Joseph S. Manser, and Scott Litzelman, ‘Long-Duration Electricity Storage Applications, Economics, and Technologies’, Joule, 4.1 (2020), 21–32.
- ^ Oliver Schmidt and others, ‘Projecting the Future Levelized Cost of Electricity Storage Technologies’, Joule, 3.1 (2019), 81–100.
- ^ Turgut M. Gür, ‘Review of Electrical Energy Storage Technologies, Materials and Systems: Challenges and Prospects for Large-Scale Grid Storage’, Energy & Environmental Science, 2018, 2696–2767.
- ^ P. Eser, N. Chokani, and R. Abhari, ‘Trade-Offs between Integration and Isolation in Switzerland’s Energy Policy’, Energy, 150 (2018), 19–27.
- ^ Linfeng Zheng and others, ‘Incremental Capacity Analysis and Differential Voltage Analysis Based State of Charge and Capacity Estimation for Lithium-Ion Batteries’, Energy, 150 (2018), 759–69.
3.2.1 Current electricity prices, tariffs and taxes
The final electricity prices for individual households and large consumers differ, mainly due to the tariff and tax structure, which depends on the annual consumption, as well as on the capacity of the consumer, and the electrical grid it is connected to (low/high voltage). An overview of the final electricity prices for households with an annual electricity consumption between 5000 kWh and 15000 kWh (considered amount, when HPs are installed) is shown in Figure 50.
Figure 50. Final electricity prices for individual households in the Baltic states and EU average (5000 kWh to 15000 kWh)[1]Eurostat, ‘Electricity Prices for Household Consumers - Bi-Annual Data (from 2007 Onwards)’, 2020.
Footnotes
- ^ Eurostat, ‘Electricity Prices for Household Consumers - Bi-Annual Data (from 2007 Onwards)’, 2020.
In 2019, residents of Germany and Denmark paid the highest price for electricity for an average household in the EU at about 30 ct/kWh (€300/MWh), while residents of Estonia, Latvia, and Lithuania paid 13.6 ct/kWh, 16.3 ct/kWh, and 12.6 ct/kWh, respectively, which is below the EU’s average of 20.5 ct/kWh. Latvia was among the countries with the highest increase in the price of electricity in the last 10 years (+55%), as also shown in Figure 50. Estonia experienced a 35% increase, while Lithuania’s electricity price increased by only 3% over the same period. However, between 2018 and 2019, the price of electricity in Lithuania increased by 14.4%. The share of taxes and tariffs was comparably low for the Baltic states (22.5% in EE, 33.9% in LV, and 30.1% in LT) compared to Germany (53.6%) and Denmark (67.8%)[1]Strom report, ‘Electricity Prices in Europe / Who Pays the Most?’, 2020. . This means that current electricity prices in the Baltic states are rather low and favourable for large consumers such as HPs.
Electricity prices for non-residential units with annual electricity consumption between 500 MWh and 2000 MWh for the Baltic states and the EU28 average are shown in Figure 51.
Footnotes
- ^ Strom report, ‘Electricity Prices in Europe / Who Pays the Most?’, 2020.
It can be seen that the electricity prices for the 3 countries have been lower than the EU27 average over the last few years. This trend of decreasing prices for large electricity consumers could also attract more investors/industries from abroad. This is supported by the Lithuanian government, which announced in 2019 that they plan to reduce tariffs for very large electricity consumers if they have an electro-intensity of 20% or more[1]Linas, Jegelevicius, ‘Overview - Baltics Clear 2020 Renewable Energy Targets,
Upbeat on 2030 Green Commitments’, Renewables Now, 2019.. In addition, Estonia decided to apply to the European Commission to reduce renewable energy costs for large electricity consumers to attract larger industrial investments from abroad[2]Estonian Ministry of Economic Affairs and Communications, ‘Estonia Is Starting to Apply for a State Aid Permit to Differentiate the Renewable Energy Fee for Large Consumers’, 2020. .
It should be noted that the methodology for calculating the final household and non-household prices is different for each of the three countries. This becomes apparent when comparing Figure 50 and Figure 51. The differences can be found in Table 26. As shown, the difference between large consumers and individual consumers is less than the EU27 average. This is mainly due to generally lower prices in the Baltic states, compared to the rest of the EU. However, it also shows that large electricity consumers in the Baltics have a limited advantage over individual low-consumption households.
Footnotes
- ^ Linas, Jegelevicius, ‘Overview - Baltics Clear 2020 Renewable Energy Targets,
Upbeat on 2030 Green Commitments’, Renewables Now, 2019. - ^ Estonian Ministry of Economic Affairs and Communications, ‘Estonia Is Starting to Apply for a State Aid Permit to Differentiate the Renewable Energy Fee for Large Consumers’, 2020.
| Final electricity price in 2020 (ct/KWh) | EU27 | Estonia | Latvia | Lithuania |
| Private household | 19.51 | 11.59 | 14.73 | 13.67 |
| Large consumer | 15.32 | 9.88 | 12.46 | 11.42 |
| Absolute difference | -4.19 | -1.71 | -2.27 | -2.25 |
| Difference, % | -21% | -15% | -15% | -16% |
Table 26. Differences in final electricity prices for individual households and large consumers
The price of electricity should also be related to the cost of living in each country and how much of the average income is spent on utilities such as electricity and heating. The ratio between electricity and DH prices is also important for the profitability of the project when using large-scale HPs.
The final electricity price consists of several components. An overview of the different taxes and tariffs for all three Baltic countries is shown in Table 27. For P2H technologies, final electricity prices are important as these prices affect heating costs. Both household and non-household electricity purchase prices in the Baltic states include the market price of electricity, charges for network services, and state-regulated components. State-regulated components include taxes and costs associated with national subsidies for renewable energy and energy efficiency increase. For individual HPs, the pricing structure is identical to the one for individual households. For large-scale HPs, electricity consumption and installed capacity are much larger. They also operate at a different voltage level. Thus, the tariff depends on the size of the HP and its annual electricity consumption.
| Electricity purchase price component | Estonia | Latvia | Lithuania | |
| Market price (Nord Pool) | Fully open since 2013 | Fully open since 2013 | Open for commercials since 2013; will be open to households from 2023 | |
| Charges for network services | Only one Transmission System Operator: Elering | Sadales tikli | ESO | |
| 110 kV voltage (peak time) €14.04/MWh | Tariffs S6 and S8 apply to objects with 3-phase power connections. Each plan is calculated based on the average electricity consumption, the permitted load or the current value of the input circuit breaker (ICB). | Power network utilisation price: | ||
| 110 kV voltage (off-peak) €7.02/MWh | Tariffs | Medium voltage: €15.57/MWh | ||
| 110 kV low-voltage side of a transformer (peak time) €15.26/MWh | Tariff calculator | Low voltage: €32.22 /MWh | ||
| 110 kV low-voltage side of a transformer (off-peak) €7.63/MWh | Electricity transmission price: | |||
| 330 kV voltage €4.81/MWh | Medium voltage: | |||
| Reactive energy fee €1.54/MVArh | (<30 kW)- €0,42/KW/month | |||
| (>30 kW)- €0,21/KW/month | ||||
| Low voltage: | ||||
| (<30 kW)- €0,86/KW/month | ||||
| (>30 kW)- €0,43/KW/month | ||||
| State regulated | Taxes | Excise duty: | Electricity tax: €1.01/MWh | Excise duty: |
| before 05.2020: €4.47/MWh | €1.01/MWh | |||
| since then and until 30.04.2022: €1.00 /MWh | €0.52/MWh for electricity used for commercial purposes | |||
| for electricity-intensive industries: €0.5/MWh | ||||
| VAT: 20% | VAT: 21% | VAT: 21% | ||
| RES and energy efficiency | Renewable energy fee | Mandatory procurement component (variable): €0.00932/ | Public service obligation price: 1.35 ct/kWh | |
| 1.13 ct/kWh (2021) | Capacity component (fixed): | |||
| 0.4 kV lines, single-phase connection (<40A): €8.69/year | ||||
| 0.4 kV lines, three-phase connection, €6.28/A/year | ||||
| 0.4 kV busbars, three-phase connection (<200A), €4.38/A/ year | ||||
| 0.4 kV busbars, three-phase connection (201A-800A) €6.12/A/ year | ||||
| 0.4 kV busbars, three-phase connection (>801A) €7.20/A/year | ||||
| 6-20 kV lines, all allowed loads €12.32/kW/year | ||||
| 6-20 kV busbars, all allowed loads €16.10/kW/year | ||||
| 110 kV lines, €3.94/kW/ year | ||||
| 110 kV busbars €4.70/kW/ year | ||||
Table 27. Overview of the tariff and tax structure for electricity consumption in the Baltic states
It should be noted that VAT applies to the entire purchase price of electricity, including the mandatory procurement component, which makes the electricity price quite high, resulting in national subsidies for individual HPs not being successful in all cases. Some believe that the electricity tariff system only supports the reduction of electricity consumption and does not consider the possible PE reduction using energy efficient P2H technologies[1]Latvenergo, "Europe is for heat pumps (in Latvian) 2018, 24–30..
The Salacgriva municipality (Latvia) named the high mandatory procurement component and changes in network service fees (in 2016) as the main reason for the shutdown in 2017 of a large-scale HP that had been in operation since 2010, generating heat from seawater and supplying it to the municipal DH system[2]Salacgriva Municipality, ‘About Washing out of Heat-Pump Circuits (in Latvian)’, 2019..
3.2.2 National climate goals and policies
Estonia, Latvia, and Lithuania have all met their 2020 renewable energy targets, namely, generating 30% of final energy consumption from RES. They are well on their way to achieving the 2030 goals[3]Linas, Jegelevicius, ‘Overview - Baltics Clear 2020 Renewable Energy Targets, Upbeat on 2030 Green Commitments’, Renewables Now, 2019.. In the heating sector, biomass is already used to a very large extent, today. As it was shown in Figure 4, 46% of the heat production in Estonia came from biomass. Heat produced in Latvia originated by 70% from biomass, as it was shown in Figure 5. In Lithuania, biomass was used to produce 80% of its heat, as it was shown in Figure 7. Transforming the heating sector solely to biomass, may impose some risks, such as the use of sustainable and local biomass and the dependency on only one type of fuel. Therefore, large-scale HPs can be seen as an additional option in order to supply the heating sector fully by RES. However, the sustainability of using large-scale HPs depends on the generated electricity used. At present, all Baltic countries are planning to further increase the production of electricity from RES. An overview of selected political targets can be found in Table 28.
Footnotes
| National energy and climate plan | Estonia | Latvia | Lithuania |
| Until 2020 | fulfilled | fulfilled | fulfilled |
| Until 2030 | Reduction of GHG emissions by 70%* | Reduction of GHG emissions by 55%* | Reduction of GHG emissions by at least 40%* (EU level target) |
| RES share in final energy consumption (FEC) ≥ 42% | RES share in FEC ≥ 45% | RES share in FEC ≥ 45% (of which 45% in electricity and 90% in DH) | |
| FEC must remain at 32-33TWh/a | Specific heat consumption in buildings ≤ 100kWh/m2/a | 30% self-generation of electricity for consumers | |
| Reduction of PEC by 14% | Domestic electricity consumption increased from 35% to 70% | ||
| Ensuring security of supply | RES share in transport sector ≥ 15% |
Table 28. Selection of energy targets from national energy and climate plans[1]Latvian ministry of energy, ‘National Energy and Climate Plan of Latvia 2021-2030’, 2018. [2]National Energy and Climate Action Plan of the Republic of Lithuania for 2021-2030’, 2020. [3]‘Estonia’s 2030 National Energy and Climate Plan’, 2019.
*Compared to 1990
A brief overview of plans for the future development of renewable power generation is given in[1]Biznesalert, ‘Offshore Wind May Connect the Baltic States and Benefit Poland’, 2020; [2]Linas, Jegelevicius, ‘Overview - Baltics Clear 2020 Renewable Energy Targets, Upbeat on 2030 Green Commitments’, Renewables Now, 2019.. Latvia is heavily dependent on hydropower, as shown in Figure 56. They plan to further increase the share of wind power and the social acceptance of RES. In September 2020, Estonia and Latvia signed an agreement on the pre-development of a joint offshore wind farm with a capacity of up to 1000 MW, which is 20% of the final electricity consumption in both countries[3]Estonian Ministry of Economic Affairs and Communications, ‘Estonia and Latvia Signed an Agreement on the Pre-Development of a Joint Offshore Wind Farm (in Estonian)’, 2020. . They are hoping for greater efficiency and lower costs. Estonia is planning three additional offshore wind farms. It is argued that the potential for wind power in Estonia is high, but wind turbines can often interfere with military radars and therefore run counter to the interests of the defence sector. Estonia started with several small auctions for renewable electricity generation of 5 GWh each, and in 2021 it will announce another auction for 450 GWh. This will likely increase the share of wind power as well as PV power in final electricity consumption[4]Estonian Ministry of Economic Affairs and Communications, ‘The Government Approved Lower Bids for Green Electricity’, 2020. . Lithuania plans to cover about 45% of final electricity consumption from RES in 2030, 53% of which will come from wind power, 22% from PV, 16% from biomass power plants, and 8% from hydropower[5]Linas, Jegelevicius, ‘Overview - Baltics Clear 2020 Renewable Energy Targets, Upbeat on 2030 Green Commitments’, Renewables Now, 2019..
Footnotes
- ^ Biznesalert, ‘Offshore Wind May Connect the Baltic States and Benefit Poland’, 2020;
- ^ Linas, Jegelevicius, ‘Overview - Baltics Clear 2020 Renewable Energy Targets, Upbeat on 2030 Green Commitments’, Renewables Now, 2019.
- ^ Estonian Ministry of Economic Affairs and Communications, ‘Estonia and Latvia Signed an Agreement on the Pre-Development of a Joint Offshore Wind Farm (in Estonian)’, 2020.
- ^ Estonian Ministry of Economic Affairs and Communications, ‘The Government Approved Lower Bids for Green Electricity’, 2020.
- ^ Linas, Jegelevicius, ‘Overview - Baltics Clear 2020 Renewable Energy Targets, Upbeat on 2030 Green Commitments’, Renewables Now, 2019.
3.2.3 Share of renewable electricity
An overview of the electricity generation mix by source is shown for each Baltic country in Figure 52, Figure 53, and Figure 54.
As shown in Figure 52, oil shale still predominates in the electricity generation mix in Estonia (70% in 2019). However, we can see that the share of biofuels and wind power has been growing since 2005. In total, around 84% of the electricity consumption was generated in Estonia in 2019 ensuring a high security of supply and self-consumption, according to statistics from the IEA. The remaining part of electricity was imported. Estonia imported around 1.8 times more electricity than it exported[1]IEA (International Energy Agency), ‘Countries and Regions’, 2020..
Footnotes
- ^ IEA (International Energy Agency), ‘Countries and Regions’, 2020.
As shown in Figure 53, hydropower and natural gas predominate the electricity generation mix in Latvia. Although hydropower was mainly used until 2005, the use of natural gas has increased since then (50% natural gas and 33% hydropower in 2019). The share of biofuels has increased significantly since 2010. In 2019, the proportion of own-generated electricity was 91% compared to the final electricity consumption resulting in a high level of security of supply and self-sufficiency[1]IEA (International Energy Agency), ‘Countries and Regions’, 2020.. The imports of electricity were 1.3 times higher than the exports.
Footnotes
- ^ IEA (International Energy Agency), ‘Countries and Regions’, 2020.
As shown in Figure 54, nuclear power predominated the electricity generation mix in Lithuania until it was phased out in 2010. During the transition period, natural gas was used as a substitute for nuclear power. Subsequently, the shares of hydropower, biofuels and wind power have been significantly increased (24% hydropower, 12% biofuels, and 38% wind power in 2019). However, it should be noted that the electricity imports have increased in Lithuania since 2015 by 67%. In 2019, the electricity imports were 3.4 times larger than the exports. The proportion of generated electricity compared to the final electricity consumption was only 32%. This is a very low value compared to the ones from Estonia and Latvia.
Both types of RES are necessary to reduce GHG emissions. In terms of electrically driven HPs, the share of fluctuating RES may indicate the need to balance the power grid. This can be done, for example, through the controlled use of non-fluctuating RES as well as the use of HPs. The proportions of wind and PV power, as well as of hydropower, biofuels, and waste vary greatly from country to country, as shown in Figure 55 and Figure 56, respectively.
As shown in Figure 55, wind power generation development continues to grow in Lithuania, followed by Estonia, while wind power generation in Latvia is stagnant. By the end of 2019, the share of fluctuating RES was 9%, 2% and 13% in Estonia, Latvia and Lithuania, respectively.
As shown in Figure 56, Lithuania and especially Latvia had a considerable share of hydropower of 8% and 30% in 2019, respectively, compared to final electricity consumption. This is not the case in Estonia. While hydropower can provide cheap electricity, which is an advantage for large-scale HPs, hydropower stations can also be used flexibly in the short term to help balance the power grid. Thus, the power grid operator’s need for large-scale HPs may be less in Latvia and somewhat less in Lithuania, compared to Estonia. Instead, Estonia has a larger share of biofuels in electricity generation.
The different energy sources for electricity generation are reflected in the specific CO2 emissions for each country, as shown in Figure 57. This is a relevant indicator for HPs, since they will use large amounts of electricity. It is especially significant in Estonia, which has the highest specific CO2 emissions from electricity generation in the EU due to the high use of oil shale. The EU27 average is 275 gCO2/kWhel. However, it can also be seen that the CO2 emissions in Estonia and Lithuania have declined over the last decade, while a clear trend cannot be found for Latvia, where emissions are already very low due to the high share of hydropower.
3.2.4 Information and Communication, Visibility
Accurate and complete information on P2H supply options should be made available to politicians, authorities, DH companies, consumers, and other decision-makers. Case studies, best practice examples, research reports, and current reports can help increase the share of P2H generation. HP associations can provide relevant information through various media, including social media, as well as through organising workshops and panel discussions for stakeholders. This is important both for the development of the HP market and for the preparatory work for regulations, laws, roadmaps, and guidelines in ministries.
HP support associations exist in Estonia, Latvia and Lithuania. These organisations are focused on promoting individual HPs. Most of the members of these associations are manufacturers and resellers of individual HPs. The Latvian Heat Pump Association was established in 2009, but is not active at the moment. The Estonian Heat Pump Association is a member of the European Heat Pump Association (EHPA). The most recent HP promotional campaign in Estonia aimed at encouraging consumers to buy from only certified HP manufacturers was launched in 2019.
The Association of Heat Pumps and Ventilation Systems was established in Lithuania in 2017. This organisation is also a member of the European Heat Pump Association. Its goal is to promote the economic and technical progress of the HP and ventilation sector in Lithuania, increase its competitiveness, and create favourable conditions for business development. The association’s website is updated with news and information on a regular basis.
Information on heat generation by HPs should be presented in the country’s energy balance. Only Lithuania provides this information to Eurostat. There is also data for Estonia and Lithuania that is provided by the national HP associations to the European Heat Pump Association[1]European Heat Pump Association. European Heat Pump Market and Statistics Report 2018.. Latvia has no representatives in the European Heat Pump Association and no data on heat generation by HPs is available. Until now, there has been no significant data collection on this topic in Latvia.
Large-scale HP projects can be promoted by presenting success stories and best practices. For many years the Salacgriva project was presented in Latvia as an example of best practice. It has since stopped operating for economic reasons. Palamuse and Kaarepere DH systems, equipped with large HPs, were launched in 2013. Several articles were published in Estonian newspapers describing the idea of the project. But at the moment this information is not being actively promoted. Usually, HP resellers and manufacturers in Lithuania indicate the following systems as reference cases: Grand SPA, VU Botanic garden, and others. There are no reference cases in Lithuania related to HP-based DH systems.
Footnotes
- ^ European Heat Pump Association. European Heat Pump Market and Statistics Report 2018.
3.2.5 Technical support and current infrastructure
A well-developed electricity infrastructure is an important driver for successful P2H implementation. According to modelling results, electricity consumption can be increased in the case of partial electrification of heating. Other reasons for the increase in electricity consumption can be found in the transport sector due to electric vehicles (EVs) and in the industry sector due to the expected growth in production according to the BENTE scenarios[1]Tomi J. Lindroos and others, ‘Baltic Energy Technology Scenarios 2018’, 2018, p. 165..
The energy systems of the Baltic Integrated Power System (incl. Kaliningrad, Russia) work as a synchronous alternating current grid with the Integrated Power System/Unified Power System of Russia and Belarus at 50 Hz. This is done by means of the “Baltic Ring”, formed by Kola, Karelia, Leningrad, Novgorod, and Pskov in Russia, as well as Estonia, Latvia, Lithuania, and Belarus. The ring was created in the early 1960s by interconnecting the energy systems of western Soviet Union that included the current Baltic states, Northwest Russia, Central Russia, and Belarus. High-voltage transmission lines of 330 kV are the basis of the BIPS. The BIPS regional transmission network is mainly comprised of 110 kV power lines, except for the energy system in Estonia, which also has 220 kV power lines[2]E. Bompard and others, ‘Electricity Independence of the Baltic States: Present and Future Perspectives’, Sustainable Energy, Grids and Networks, 10 (2017). (see Figure 58).
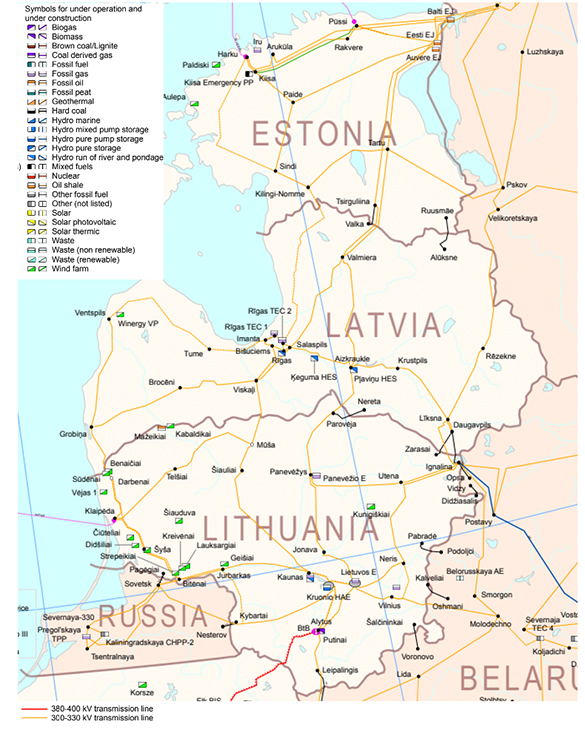
In June 2018, the Baltic countries, Poland and the European Commission signed the Political Roadmap for Synchronisation. After that, the operators of the transmission systems of the Baltic countries (Estonia’s Elering, Latvia’s Augstprieguma Tīkli, and Lithuania’s Litgrid) applied for connection to the frequency zone of the Continental Europe. In May 2019, the TSOs of the Baltic countries and Continental Europe signed an interconnection agreement, which includes the definition of the technical requirements necessary for stable and secure synchronisation. In October 2020, the EU Infrastructure Network’s Connecting Europe Facility (CEF) coordinating committee decided to provide the greatest possible financing for the key projects dedicated to the Baltic countries’ synchronisation with the energy system of Continental Europe. This will allow the Baltic states to start operating on the same frequency as Poland and other countries located in the Continental Europe by 2025. The synchronisation project is essential for the creation of a common European electricity market, which will ensure secure electricity transmission. Constant modernisation and renovation of power grids in the Baltic countries allows increasing the share of heating electrification without risks associated with the stability of electricity supply.
As described in the previous section, the DH infrastructure is well-developed in the Baltics. On the other hand, low-temperature DH networks, which are better suited for heat supply with large-scale HPs, have not been introduced in the Baltic countries. The implementation of large HPs requires improvements in the DH infrastructure.
3.2.6 Specific power-to-heat technology support
Individual HPs are supported in the Baltic states. In Estonia, the grant is intended for natural persons who own small residential buildings to improve the technical condition of the building and reduce its energy consumption. Other supported activities include replacing old oil boilers with geothermal HPs and air-to-water HPs. Since November 2016, 166 geothermal HPs and 96 air-to-water HPs have been installed with the support of Kredex. The conditions are as follows: 30% (€30,000) of the grant is allocated for the thorough reconstruction in Tallinn and Tartu, 40% (€40,000) for selected areas, and 50% (€50,000) for the rest of Estonia. Figure 59 shows the installation of HPs compared to other work performed.
Another measure to support individual HPs is to allow heat consumers to use any heat that is used in the building and that leaves the building (via ventilation, sewerage, etc.), as well as any thermal energy converted from such heat through the use of electricity generated from RES in accordance with the Estonian District Heating Act. This effectively means that it is the only allowed heat source that can partially or completely replace DH if the building is located in a DH region.
There is no specific support for large HPs in Estonia, but two large HP projects aimed at providing heat to DH networks in municipalities were supported by ‘The atmosphere air protection programme’, focused on reducing the negative environmental impact of the energy sector[1]Environmental Investment Center, ‘Data System KIKAS’..
In Latvia, the installation of individual HPs for households is not supported as part of energy efficiency improvement measures for multi-apartment buildings. In 2010-2015, energy efficiency measures for public buildings were co-financed by the National Green Investment Scheme (emissions trading revenue under the UNFCCC Kyoto Protocol) in Latvia. During the 2014-2020 planning period, energy efficiency measures for municipal and state-owned public buildings were co-financed by the ERDF under the National Operational Programme “Growth and Employment”. HP installation is supported as per these measures. In 2014–2020, energy efficiency projects for municipal buildings and industries were co-financed with the help of the EU funds. HP installation was among the eligible options supported by these measures.
Lithuania has a national support programme for the use of RES in renovated (modernised) apartment buildings, which provides grants (30%) for the installation of RES (including HPs) in apartment buildings not connected to DH networks. Since 2020, the Environmental Projects Management Agency under the Ministry of Environment of the Republic of Lithuania has started financing the ‘Replacement of Boilers in Households’ programme, as part of the European Union Funds Investment Operational Program for 2014–2020. Old boilers can be replaced with biomass boilers and HPs.
Footnotes
- ^ Environmental Investment Center, ‘Data System KIKAS’.
3.2.7 Identified benefits, challenges and drivers for large-scale heat pumps
As shown in the Balmorel model results from Sections 2.6 - 2.8, drivers and barriers to implementing large-scale HPs have been identified for the Baltic region. Additional barriers and drivers are also mentioned.
Barriers to implementing large-scale HPs:
-
Low biomass prices;
-
Low CO2 prices;
-
Electricity grid tariffs and taxes;
-
Lack of experience and knowledge on the use of large-scale HPs and suitable heat sources;
-
Communication between different players, e.g. urban developers, industries with excess heat, sewage water treatment plant operators;
-
Long-term planning and business models for the use of heat sources owned by others;
-
Sufficient number of other non-fluctuating RES available;
-
Incentives/subsidies for other RES such as biomass;
-
High DH supply temperatures.
Drivers for implementing large-scale HPs:
-
High biomass prices;
-
Investment incentives/support for large-scale HPs;
-
Heat sources with comparably high temperatures even during colder periods, such as excess heat or sewage water;
-
Heat sources accessible in DH areas, such as excess heat and sewage water treatment plants;
-
Heat sources available in sufficiently large amounts, such as treated sewage water, seawater, and rivers;
-
National climate targets for decarbonisation of the power and heating sector;
-
Low electricity prices;
-
Increasing number of fluctuating RES in the power sector.
3.3 Danish experiences on large-scale heat pumps for district heating
The Danish way of implementing large-scale HPs to supply DH can be characterised by several conditions, which are listed and explained in detail below:
-
Non-profit ownership of DH networks;
-
Low DH operating temperatures;
-
High proportion of residents using DH;
-
Large share of wind energy, resulting in green, but at the same time fluctuating power generation;
-
Financial incentives for gaining experience in the implementation and operation of large-scale HPs;
-
Changing the tax system and tariff structure in favour of electric heating to ensure low electricity prices;
-
Reasonably high DH prices.
Denmark can be seen as a leader in reducing GHGs and promoting smart energy systems. The country’s goal is to become independent from fossil fuels by 2050[1]The Danish Ministry of Climate and Energy, ‘Energy Strategy 2050 - from Coal, Oil and Gas to Green Energy (in Danish)’, 2011.. In 2019, 49% of final electricity consumption came from renewable wind and solar power[2]State of Green, ‘2019: The Greenest Year Ever in Denmark’, 2019. . In 2019, the average CO2 emissions from generating electricity in Denmark amounted to 126 gCO2/kWhel[3]European Environment Agency, ‘Greenhouse Gas Emission Intensity of Electricity Generation’, 2020.. Denmark is mainly focused on wind power and biofuels for electricity generation. Figure 60 shows the increase in the share of wind power in final electricity consumption over the past two decades.
Footnotes
Figure 60. Share of wind power in final electricity consumption in Denmark
Denmark recognises great potential in using large natural refrigerant-based HPs to counterbalance the growing share of fluctuating renewable energy. The implementation of large-scale HPs in Denmark received both scientific and financial support. In addition, DH network temperatures and ownership are favourable for large-scale HPs as described below.
Since 2010, 106 HPs with a thermal capacity of over 100 kW have been introduced to supply heat to DH networks in Denmark. The total installed thermal capacity of these HPs is 368 MW and this trend is growing, as shown in Figure 61[1]PlanEnergi, ‘Overview of Large-Scale Electric (and Gas) Driven Heat Pumps, Which Produce Heat for Danish District Heating (in Danish)’, 2019.. Comparing Figure 60 and Figure 61, it can be noted that the installation of large-scale HPs began after the share of wind power in final energy consumption exceeded 20% in 2010. Moreover, the installation of large-scale HPs has experienced tremendous growth in 2020.
Footnotes
- ^ PlanEnergi, ‘Overview of Large-Scale Electric (and Gas) Driven Heat Pumps, Which Produce Heat for Danish District Heating (in Danish)’, 2019.
Figure 61. Installed thermal capacity of large-scale HPs supplying DH in Denmark[1]PlanEnergi, ‘Overview of Large-Scale Electric (and Gas) Driven Heat Pumps, Which Produce Heat for Danish District Heating (in Danish)’, 2019.
Footnotes
- ^ PlanEnergi, ‘Overview of Large-Scale Electric (and Gas) Driven Heat Pumps, Which Produce Heat for Danish District Heating (in Danish)’, 2019.
The HP capacity range and type of heat sources used are specified in Figure 62. As shown, most of the HPs have a thermal capacity between 1 MW and 5 MW (60). Others have a capacity of less than 1 MW (25), between 5.1 MW and 10 MW (16), and between 10 MW and 20 MW (5). This shows the technical limit and the typical range of HPs that use natural refrigerants. Larger installations usually consist of several smaller HP units. The main heat sources are ambient air (35), flue gas (14), and industrial excess heat (14). The heat source was not specified for a large number of projects (23). Three HPs can use industrial excess heat and/or air as a heat source, two can use air and solar energy, and one can use seawater or sewage water.
Figure 62. Installed large-scale HPs in Denmark based on the heat source used[1]PlanEnergi, ‘Overview of Large-Scale Electric (and Gas) Driven Heat Pumps, Which Produce Heat for Danish
District Heating (in Danish)’, 2019.
Footnotes
- ^ PlanEnergi, ‘Overview of Large-Scale Electric (and Gas) Driven Heat Pumps, Which Produce Heat for Danish
District Heating (in Danish)’, 2019.
There is little experience dealing with seawater HPs. A 5.2 MW HP that uses seawater or sewage water as a heat source was built in Copenhagen in 2019. It was designed to supply heat to 1100 households at temperatures up to 90°C. The refrigerant used is ammonia. The project received €2.95 million in funding from the EU[1]Ammonia21, ‘5 MW Ammonia Heat Pump to Warm Copenhagen’, 2019.. Another example can be found in Aarhus. The city expanded the capacity of an existing CHP plant by adding an 80 MW electric boiler in 2015 and a 2 MW electric HP in 2020 to provide DH to the neighbourhood. Local authorities plan to invest in an additional 12 MW of HPs after further examining daily operation and the potential for flexibility[2]Danish Technological Institute, ‘Affaldsvarme Aarhus’, 2020. , (IRENA, 2017). The electric boiler and HP were designed to utilise excess wind generation in western Denmark, which usually peaks during the winter months, coinciding with increased heat demand.
Flue gas HPs are smaller and their capacity is generally less than 1 MW. These HPs are typically used to preheat DH return water before it is fed to the boiler or CHP plant instead of directly supplying DH. This improves the COP, and the HP’s heat source requires additional production units to be in operation anyway for flue gas to be available. This results in a simpler HP design and lower specific investments[3]Danish Energy Agency, Inspiration Catalogue for Large-Scale Heat Pump Projects in District Heating’, (in Danish), 2017..
There are 13 large-scale HPs in Denmark that use industrial excess heat to provide DH. The HP capacity range is wide and varies between 0.5 MW and 24 MW. The capacity largely depends on the industrial process and the sector. The largest HPs (20 MW and 24 MW) are used to cool Facebook data centres, while providing heat to 6900 households with heat using 100 GWh of available excess heat annually[4]District heating Fyn, ‘Green Transition of District Heating’, 2019. .
It is worth noting that 35 air-source HPs have also been installed. The capacity of the largest HPs with this heat source is up to 16 MW. Ambient air is easily accessible, but considerations regarding defrosting, space requirements, and noise protection must be taken into account. In addition, the climate in Denmark is milder compared to the Baltic region.
The possibility of providing ancillary services via large-scale HPs to balance the power grid has been investigated by Meesenburg et al.[5]Wiebke Meesenburg and others, ‘Optimizing Control of Two-Stage Ammonia Heat Pump for Fast Regulation of Power Uptake’, Applied Energy, 271.April (2020), 115126.. They used a dynamic model of a two-stage ammonia HP located in Copenhagen with a thermal capacity of 800 kW. They showed that HPs in this capacity range can be adjusted for ancillary services from 250 kW to 175 kW in 54 seconds or 250 kW to 100 kW in 99 seconds. It was further determined that a proper control strategy must be adopted for these services.
Footnotes
- ^ Ammonia21, ‘5 MW Ammonia Heat Pump to Warm Copenhagen’, 2019.
- ^ Danish Technological Institute, ‘Affaldsvarme Aarhus’, 2020.
- ^ Danish Energy Agency, Inspiration Catalogue for Large-Scale Heat Pump Projects in District Heating’, (in Danish), 2017.
- ^ District heating Fyn, ‘Green Transition of District Heating’, 2019.
- ^ Wiebke Meesenburg and others, ‘Optimizing Control of Two-Stage Ammonia Heat Pump for Fast Regulation of Power Uptake’, Applied Energy, 271.April (2020), 115126.
3.3.1 Scientific support of large-scale heat pumps in Denmark
Several studies have been conducted to explore the potential for introducing HPs into energy systems to effectively integrate large amounts of RES. It is emphasised in[1]Rasmus Lund, Danica Djuric Ilic, and Louise Trygg, ‘Socioeconomic Potential for Introducing Large-Scale Heat
Pumps in District Heating in Denmark’, Journal of Cleaner Production, 139 (2016), 219–29. that the socio-economic potential for the integration of large-scale HPs in Denmark will reach €100 million per year in 2025, when the optimal HP capacity is installed, considering the reduced costs in the system. The optimal total thermal capacity ranges from 2 to 4 GW. In[2]Karsten Hedegaard and Olexandr Balyk, ‘Energy System Investment Model Incorporating Heat Pumps with Thermal Storage in Buildings and Buffer Tanks’, Energy, 63 (2013), 356–65., an energy system investment modelling tool was created for combining HPs with thermal energy storage (TES) in buildings. Applying the model to the case of Denmark in 2030 (a future scenario from the report of the Danish Commission on Climate Change Policy[3]Danish Commission on Climate Change Policy, Documentation for the Report of the Danish Commission on Climate Change Policy (Copenhagen, Denmark, 2010). ) shows that the flexible use of HPs with thermal energy storage has a good impact on energy peak shaving.
In 2014, the Danish Energy Agency[4]Danish Energy Agency, ‘Energy Scenarios for 2020, 2035 and 2050 (in Danish)’, 2014. estimated that in 2050 Denmark would need 1050 MW of large-scale HPs for the high wind scenario. A study by the Danish Society of Engineers (IDA)[5]Brian Vad; Mathiesen and others, ‘IDA’ s Energy Vision 2050: A Smart Energy System Strategy for 100% Renewable Denmark’, 2015. recommends introducing 2450 MW of large-scale HPs into the Danish energy system in 2050 to provide DH, with 1400 MW installed in centralised areas with CHP plants and 1050 MW in decentralised areas. They also highlight the importance of suitable heat sources, which are generally available in Denmark, according to other studies. They further state that high-temperature heat sources may be limited in terms of availability in cities with high DH demand. Thus, low-temperature heat sources such as seawater, ambient air or others should be used. Local evaluations are needed to identify heat sources of the highest quality and availability[6]Mathiesen, Brian Vad;, Henrik; Lund, Kenneth; Hansen, Iva; Ridjan, Soren Roth; Djorup, Steffen; Nielsen, and others, ‘IDA’ s Energy Vision 2050: A Smart Energy System Strategy for 100% Renewable Denmark’, 2015..
Copenhagen aspires to become the world’s first CO2-neutral capital by 2025, as agreed by the city council in 2012[7]CPH City and Port Development, ‘CPH 2025 Climate Plan’, 2012. . In Copenhagen, 98% of heat demand is supplied by DH[8]HOFOR, ‘District Heating in Copenhagen: Energy-Efficient, Low-Carbon, and Cost-Effective’, 2016. . In 2015, 53% of the heat supplied was CO2 neutral[9]Danish board of district heating, Copenhagen’s District Heating Is Now 53percent CO2 Neutral, 2015. . This demonstrated the need for further transformation of the DH network. In 2014, Copenhagen’s three major utility companies reported in the Heating Plan of Greater Copenhagen that 300 MW of installed HP capacity would be required by 2035 to provide sustainable and feasible low-cost DH that does not depend on biomass alone[10]CTR, HOFOR, and VEKS, ‘Heat Planning for the Greater Copenhagen Area (in Danish)’, 2014.. A study on integration opportunities in the Greater Copenhagen area[11]Bjarne Bach and others, ‘Integration of Large-Scale Heat Pumps in the District Heating Systems of Greater Copenhagen’, Energy, 107 (2016), 321–34. states that when HPs are connected to the distribution grid, the annual full load hours will be around 3500 - 4000, which is about 1000 hours more than when connected to the transmission grid.
Footnotes
- ^ Rasmus Lund, Danica Djuric Ilic, and Louise Trygg, ‘Socioeconomic Potential for Introducing Large-Scale Heat
Pumps in District Heating in Denmark’, Journal of Cleaner Production, 139 (2016), 219–29. - ^ Karsten Hedegaard and Olexandr Balyk, ‘Energy System Investment Model Incorporating Heat Pumps with Thermal Storage in Buildings and Buffer Tanks’, Energy, 63 (2013), 356–65.
- ^ Danish Commission on Climate Change Policy, Documentation for the Report of the Danish Commission on Climate Change Policy (Copenhagen, Denmark, 2010).
- ^ Danish Energy Agency, ‘Energy Scenarios for 2020, 2035 and 2050 (in Danish)’, 2014.
- ^ Brian Vad; Mathiesen and others, ‘IDA’ s Energy Vision 2050: A Smart Energy System Strategy for 100% Renewable Denmark’, 2015.
- ^ Mathiesen, Brian Vad;, Henrik; Lund, Kenneth; Hansen, Iva; Ridjan, Soren Roth; Djorup, Steffen; Nielsen, and others, ‘IDA’ s Energy Vision 2050: A Smart Energy System Strategy for 100% Renewable Denmark’, 2015.
- ^ CPH City and Port Development, ‘CPH 2025 Climate Plan’, 2012.
- ^ HOFOR, ‘District Heating in Copenhagen: Energy-Efficient, Low-Carbon, and Cost-Effective’, 2016.
- ^ Danish board of district heating, Copenhagen’s District Heating Is Now 53percent CO2 Neutral, 2015.
- ^ CTR, HOFOR, and VEKS, ‘Heat Planning for the Greater Copenhagen Area (in Danish)’, 2014.
- ^ Bjarne Bach and others, ‘Integration of Large-Scale Heat Pumps in the District Heating Systems of Greater Copenhagen’, Energy, 107 (2016), 321–34.
3.3.2 Financial support and Danish taxation system for electric heating
At the beginning of the introduction of large-scale HPs in Denmark, much was unknown. Large-scale HPs were custom-made for projects, since there were no ready-made products for this purpose and capacity that were based on natural refrigerants. The advantages and disadvantages of heat sources were not studied in detail, and there was no practical experience. The development of large-scale HPs was slow, but the share of wind energy in final electricity consumption continued to grow, so new large-scale HP projects were allocated financial support in 2015[1]Danish Energy Agency, ‘Large Heat Pumps in District Heating Systems (in Danish:)’, 2016. and 2018[2]Danish Energy Agency, ‘District Heating Companies Recieve 23 Mio. Danish Crowns for Large-Scale Heat Pumps (in Danish)’, 2017. to promote large-scale HPs for DH. In 2015, the Danish Energy Agency provided €3.6 million in support to 10 projects that had a total investment volume of €19 million and a total HP capacity of 19 MW. The projects selected were diverse in terms of heat source in order to explore alternatives and gain wider experience. In 2018, €3.1 million were allocated to 13 projects with a total HP capacity of 30 MW and an investment volume of €26 million. The HPs will supply heat to 29 000 households and increase the use of RES.
Electricity price structure consists of tariffs and taxes, which proved to be a major obstacle to the implementation of large-scale HPs. In[3]Danish Energy Agency, ‘Guide for Large-Scale Heat Pump Projects in District Heating Systems (in Danish)’, 2017., it was shown what costs contribute to the cost of heat production by large-scale HPs for three different cases with the COP of 3.5, 4.0, and 5.0, an interest rate of 3%, a lifetime of 20 years, and estimated 6000 full load hours. The PSO (Public Service Obligation) tariff has already been neglected as it will be completely cancelled in 2022. Taxes and tariffs have been representing values since 2017. An overview of the allocation of heating costs is provided in Table 29. Investments contributed 29-34%, electricity costs 18-22%, electricity tariffs 15-19%, electricity taxes 25-30%, operation and maintenance costs amounted to 6%, and energy savings resulted in -4-6%. This cost breakdown is supported by Ommen et al.[4]Torben Schmidt Ommen, Brian Elmegaard, and Wiebke Brix Markussen, ‘Heat Pumps in CHP Systems: High-
Efficiency Energy System Utilising Combined Heat and Power and Heat Pumps’ (DTU Mechanical Engineering
(DCAMM Special Report; No. S187), 2015)., who indicated similar shares for investments (20% to 37%), electricity costs (21% to 27%), and tariffs and taxes (41% to 53%) for eight different HP types used in DH.
Footnotes
- ^ Danish Energy Agency, ‘Large Heat Pumps in District Heating Systems (in Danish:)’, 2016.
- ^ Danish Energy Agency, ‘District Heating Companies Recieve 23 Mio. Danish Crowns for Large-Scale Heat Pumps (in Danish)’, 2017.
- ^ Danish Energy Agency, ‘Guide for Large-Scale Heat Pump Projects in District Heating Systems (in Danish)’, 2017.
- ^ Torben Schmidt Ommen, Brian Elmegaard, and Wiebke Brix Markussen, ‘Heat Pumps in CHP Systems: High-
Efficiency Energy System Utilising Combined Heat and Power and Heat Pumps’ (DTU Mechanical Engineering
(DCAMM Special Report; No. S187), 2015).
| Heat production costs in Denmark, (€/MWhheat) | COP=3.5 | COP=4.0 | COP=5.0 |
| Investments (€1 million/MW) | 11.3 | 11.3 | 11.3 |
| Operation & Maintenance (€2/MWhheat) | 2 | 2 | 2 |
| Electricity costs (€30/MWhel) | 8.5 | 7.4 | 5.9 |
| Network and system tariff (€11/MWhel) | 3.2 | 2.8 | 2.3 |
| Distribution tariff (€14/MWhel) | 4.2 | 3.6 | 2.8 |
| Electricity tax (€41/MWhel) | 11.7 | 10.2 | 8.2 |
| Energy savings (€47/MWhheat) | -1.7 | -1.7 | -1.9 |
| Purchase of excess heat (€2.7/MWhheat) | 2.7 | ||
| TOTAL | 39.1 | 35.6 | 33.3 |
Table 29. Heat production costs for large-scale HPs in Denmark
Danish residents paid the highest proportion of electricity taxes and tariffs in the EU in 2014 at 66%[1]The Local, ‘Pull the Plug! Danes Pay EU’s Highest Electricity Prices’, 2016. . In 2018, the Danish government signed a new energy agreement to achieve the ambitious climate and energy goals by 2030[2]Ministry of Foreign Affairs of Denmark, ‘New Ambitious Danish Energy Agreement Secured’, 2018. . It is planned, among other things, to invest in an additional 2400 MW of wind power by 2030, to reduce electricity and electric heating taxes by €268 million by 2025, to modernise the heating sector, and phase out coal in Denmark’s electricity generation by 2030[3]Ministry of Foreign Affairs of Denmark, ‘New Ambitious Danish Energy Agreement Secured’, 2018..
As a result, taxes on electricity for heating purposes will be reduced to €20/MWh by 2022 and the Public Service Obligation tariff will be gradually removed by 2022. This will greatly impact electricity prices for heat producers compared to previous years, as shown in Figure 63. While the price of electricity for a large-scale HP in 2014 was over €140/MWh, in 2017 it was €120/MWh, and in 2022 it will be only about €80/MWh[4]Energinet.dk, ‘Current Tariffs (In Danish). [5]Danish Energy Agency Guide for Large-Scale Heat Pump Projects in District Heating Systems (in Danish)’, 2017.. Changes in electricity taxes have a major effect on future investments in large-scale HPs. This can also explain the sharp increase in the number of new HP projects in 2019 and 2020, shown in Figure 61.
Footnotes
- ^ The Local, ‘Pull the Plug! Danes Pay EU’s Highest Electricity Prices’, 2016.
- ^ Ministry of Foreign Affairs of Denmark, ‘New Ambitious Danish Energy Agreement Secured’, 2018.
- ^ Ministry of Foreign Affairs of Denmark, ‘New Ambitious Danish Energy Agreement Secured’, 2018.
- ^ Energinet.dk, ‘Current Tariffs (In Danish).
- ^ Danish Energy Agency Guide for Large-Scale Heat Pump Projects in District Heating Systems (in Danish)’, 2017.
3.3.3 Technical support and Danish district heating network characteristics
DH dominates heat supply in Denmark. 64% of residential buildings are supplied by DH. 51% of the DH supply is based on RES[1]Dansk Fjernvarme, ‘Danish District Heating Association’, 2017. . DH in Denmark is regulated on a non-profit basis. Most DH companies are municipally owned, providing 2/3 of the total DH. The rest of the DH companies are mainly consumers’ co-operatives[2]Danish District Heating Association, ‘Danish District Heating Association’, 2020. . The Danish DH Association has over 400 members and collects information on Danish DH systems. One of the most recent publicly available statistics reports for Danish DH network covers the 2013/2014 heating season[3]Danish District Heating Association, ‘Statistik 2013/2014 Benchmarking 2014’, 2014.. Information was provided on 265 DH companies. An overview of heat supplied to the DH network, DH supply temperatures in winter, and heat losses in the DH network are shown in Figure 64, Figure 65, and Figure 66, respectively. DH companies were classified based on their annual heat supply.
Figure 64 shows that the annual heat supply in many Danish DH networks is below 100 GWh (183). They provide 14% of the annual heat supply. There are 22 DH networks that provide between 100 GWh/a and 200 GWh/a, which is 8% of the annual DH supply. There are 19 DH networks that provide between 200 GWh/a and 400 GWh/a, accounting for 14% of the annual DH supply. There are 12 very large DH networks that provide 64% of the annual DH supply (not shown in the figure).
The DH supply temperatures for different DH companies in winter are shown in Figure 65. It can be seen that the supply temperature is above 90°C only in ten cases. Moreover, the supply temperature is often below 80°C. Such low supply temperatures are an advantage for large-scale HPs because the achievable COP can be higher and the HP equipment is less subject to its technical limits compared to HPs that would have to supply heat at temperatures above 90°C. It also shows that even very large DH networks can achieve low supply temperatures in winter.
The DH network heat loss compared to the heat supplied to the DH network is shown in Figure 66. It is evident that the heat loss is lower for large DH networks. It can be comparably high for smaller DH networks.
Average DH prices in Denmark in 2020 are provided in Figure 67. The additional costs for DH supply were calculated for a standard household of 130 m2 and a heat consumption of 18.1 MWh/a, including VAT[1]Danish Utility Regulator, ‘Heat Prices’, 2018. . It is shown that the total DH price can be as high as €192/MWh or as low as €46/MWh. The average total DH price is €107/MWh. Without additional costs, the average price for DH is €71/MWh, while it can vary between €29/MWh and €133/MWh.
Footnotes
- ^ Danish Utility Regulator, ‘Heat Prices’, 2018.
3.4 Large-scale heat pumps for district cooling
Cooling in cold climates is mainly needed in high traffic areas such as shopping malls and offices to provide a certain comfort and working environment, especially in summer. In addition, other places require cooling throughout the entire year, such as data centres to cool servers or hospitals to ensure a sterile and clean working environment. Cooling is often performed using individual electric-driven cooling systems. This is common practice and easy to set up for individual businesses. However, district cooling (DC) is often proposed as an alternative[1]Andrew Lake, Behanz Rezaie, and Steven Beyerlein, ‘Review of District Heating and Cooling Systems for a Sustainable Future’, Renewable and Sustainable Energy Reviews, 67 (2017), 417–25. [2]Wenjie Gang and others, ‘District Cooling Systems: Technology Integration, System Optimization, Challenges and Opportunities for Applications’, Renewable and Sustainable Energy Reviews, 53
(2016), 253–64. [3]S. Tredinnick and G. Phetteplace, District Cooling,Current Status and Future Trends, Advanced District Heating and Cooling (DHC) Systems (Elsevier Ltd.,2016). [4]Danish District Heating Association, Cooling Plan of Denmark of the Danish District Heating Association’, (in Danish) 2016. [5]Euroheat & Power, ‘Possibilities with More District Cooling in Europe’, 2006., as it can be five to ten times more efficient than individual cooling units that use electricity[6]Euroheat & Power, ‘Possibilities with More District Cooling in Europe’, 2006.. DC systems can be installed once cooling clusters are identified, where several businesses with cooling needs are located in close proximity to each other. Many DC networks exist in countries with cold climate, and the number of new installations is on the rise[7]RESCUE Project, ‘District Cooling Showcases in Europe’, 2015. . They are constructed in a similar fashion as DH networks, with central production units and a pipeline network transporting water as energy carrier between plants and customers.
Footnotes
- ^ Andrew Lake, Behanz Rezaie, and Steven Beyerlein, ‘Review of District Heating and Cooling Systems for a Sustainable Future’, Renewable and Sustainable Energy Reviews, 67 (2017), 417–25.
- ^ Wenjie Gang and others, ‘District Cooling Systems: Technology Integration, System Optimization, Challenges and Opportunities for Applications’, Renewable and Sustainable Energy Reviews, 53
(2016), 253–64. - ^ S. Tredinnick and G. Phetteplace, District Cooling,Current Status and Future Trends, Advanced District Heating and Cooling (DHC) Systems (Elsevier Ltd.,2016).
- ^ Danish District Heating Association, Cooling Plan of Denmark of the Danish District Heating Association’, (in Danish) 2016.
- ^ Euroheat & Power, ‘Possibilities with More District Cooling in Europe’, 2006.
- ^ Euroheat & Power, ‘Possibilities with More District Cooling in Europe’, 2006.
- ^ RESCUE Project, ‘District Cooling Showcases in Europe’, 2015.
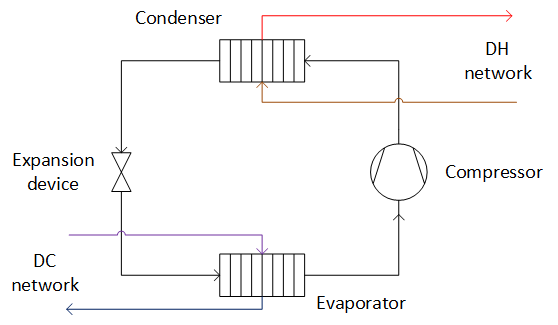
Figure 68. Main components of HP supplying DH and DC (copied from[1]Henrik Pieper, ‘Optimal Integration of District Heating, District Cooling, Heat Sources and Heat Sinks’
(Technical University of Denmark, 2019).)
Footnotes
- ^ Henrik Pieper, ‘Optimal Integration of District Heating, District Cooling, Heat Sources and Heat Sinks’
(Technical University of Denmark, 2019).
DC HP typically requires greater investments (≈ €0.8-1.0 million/MW) than other large-scale HPs (≈ €0.6-0.8 million/MW), but heating and cooling consumers are supplied simultaneously[1]Henrik Pieper, ‘Optimal Integration of District Heating, District Cooling, Heat Sources and Heat Sinks’
(Technical University of Denmark, 2019).. Therefore, the costs can be split between heating and cooling consumers. There are three HP units of this type in Denmark. A 3.2 MW and 6.1 MW DC HP near Copenhagen and a 7.2 MW DC HP near Aarhus[2]Ramboll, ‘Project Proposal for a Heat Pump and District Cooling in Tarnby (in Danish)’, 2018. [3]PlanEnergi, ‘Overview of Large-Scale Electric (and Gas) Driven Heat Pumps, Which Produce Heat for Danish District Heating (in Danish)’, 2019.. All of these projects have proven to be very cost-effective. Consequently, when a synergy area has been identified where the demand for both heating and cooling exists, it is reasonable to invest in large-scale HPs that use the DC network as a heat source to supply DH and DC at the same time to cover as much cooling demand as possible. Additional cooling capacity could be provided by electric or absorption chillers, free cooling, etc.
Areas of synergy between heating and cooling needs have been identified in the Hotmaps project[4]Hotmaps, ‘Hotmaps: D2.3 WP2 Report – Open Data Set for the EU28’, 2019.. They provided an online GIS tool for Europe[5]Hotmaps, ‘Hotmaps Online GIS-Tool’. . However, must be noted which assumptions were used when estimating cooling demands: “The cooling demand was calculated based on the average cooling needs for buildings at the NUTS0 level per floor area and the ratio between national cooling degree days and calculated local cooling degree days. It is important to keep in mind that the cooling needs deviate significantly from the observed electricity consumption for air conditioning. In addition to the considered uncertainties caused by the approach, the deviation exists due to the efficiency of AC systems (with a typical COP of 2-4) and the fact that for most regions the proportion of building floor area that is fully air-conditioned is well below 1”[6]Hotmaps, ‘Space Cooling Needs Density Map of Buildings in EU28 + Switzerland, Norway and Iceland for the Year 2015’, 2019. .
If local information is available, it would probably be best to use it. A comparison of the cooling demand results in Tartu based on the Hotmaps project and the first DC network in the Baltic states (Tartu, Estonia) is shown in Figure 69. It can be seen that the DC network was actually installed in an area that was also identified by the Hotmaps project as having cooling needs.
Footnotes
- ^ Henrik Pieper, ‘Optimal Integration of District Heating, District Cooling, Heat Sources and Heat Sinks’
(Technical University of Denmark, 2019). - ^ Ramboll, ‘Project Proposal for a Heat Pump and District Cooling in Tarnby (in Danish)’, 2018.
- ^ PlanEnergi, ‘Overview of Large-Scale Electric (and Gas) Driven Heat Pumps, Which Produce Heat for Danish District Heating (in Danish)’, 2019.
- ^ Hotmaps, ‘Hotmaps: D2.3 WP2 Report – Open Data Set for the EU28’, 2019.
- ^ Hotmaps, ‘Hotmaps Online GIS-Tool’.
- ^ Hotmaps, ‘Space Cooling Needs Density Map of Buildings in EU28 + Switzerland, Norway and Iceland for the Year 2015’, 2019.
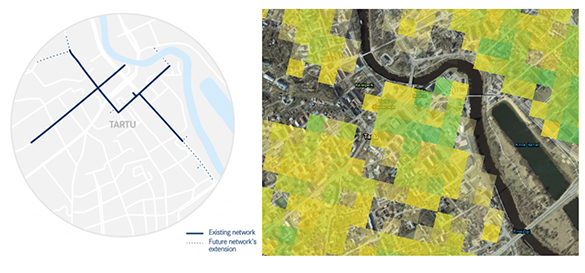
A second example of comparing the results of the Hotmaps project and the cooling demand in Tallinn is shown in Figure 70. In Tallinn, three DC regions have been identified with potential cooling needs of 60 MW, 10 MW and 30 MW . The latter considers a new area of development with limited cooling demand as of today[1]Igor Krupenski, ‘District Cooling System Operation in Cold Climates with Existing District Heating Networks’ (Smart Energy Systems Confernce 2020, 2020).. The 30 MW DC region could not be identified because future cooling needs are not represented in the Hotmaps project. The 60 MW cooling demand region is only partially identified, and the 10 MW region is located in the adjacent area to the one shown. Instead, the project identified other regions that could potentially have a greater cooling demand.
Footnotes
- ^ Igor Krupenski, ‘District Cooling System Operation in Cold Climates with Existing District Heating Networks’ (Smart Energy Systems Confernce 2020, 2020).
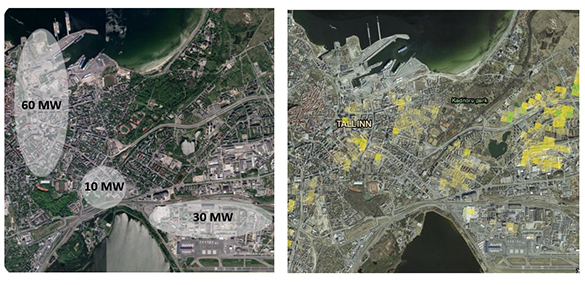
There are few examples of existing DC networks in the Baltics. The DC network in Tartu was the first of its kind in the Baltic countries with €5.7 million in investments, a 13 MW cooling capacity, and a 1.3 km DC network. It was built by Fortum in 2016 and expanded in 2017 with an additional 1.3 km of pipelines and 5.4 MW cooling capacity. The two DC plants consist of chillers, DC HPs, free coolers that use cold water from the river, and a cooling tower[1]Fortum Tartu, ‘Anne Soojus Production Plants’, 2018. . The consumers are mainly large shopping centres, office buildings, and public buildings. In 2019, Fortum built another DC network in Pärnu, which consists of a 1 km network and a 7 MW cooling capacity, and is based on chillers and free cooling. This should reduce resource use by 67%, electricity consumption by 70%, and CO2 emissions by 72% compared to local cooling solutions[2]Fortum, ‘Fortum Starts Construction of the First Cooling Plant in Pärnu’, 2018; Fortum, ‘Fortum in Estonia’, 2020. . In 2016, Fortum identified other potential locations for DC networks in Jelgava and Klaipėda, where they are already operating DH networks[3]Euroheat & Power, ‘Fortum to Build Second District Cooling Plant in Tartu’. . However, in 2019, Fortum announced that it is considering possible strategic options for its DH and DC facilities in Tartu and Pärnu as they entered a more stable operating phase[4]Fortum, ‘Fortum Considers Possible Strategic Options for Its District Heating Businesses in Joensuu, Finland and in Pärnu and Tartu, Estonia’, 2019. . As it turned out in 2020, Fortum is allocating capital to invest in new and more sustainable energy facilities by divesting its DH and DC businesses in Poland and the Baltic states[5]Reuters, ‘UPDATE 1-Fortum Puts Polish, Baltic District Heating Assets on the Block - Sources’, 2020. .
In Tallinn, master plans exist for each of the three identified DC regions[6]Igor Krupenski, ‘District Cooling System Operation in Cold Climates with Existing District Heating Networks’ (Smart Energy Systems Confernce 2020, 2020).. The first DC network is under construction in the 30 MW DC demand region shown in Figure 70. Existing buildings in the area have a cooling demand of 7.3 MW and a heating demand of 8.1 MW. It is expected that an additional 23.6 MW and 26.2 MW of cooling and heating will be required in the future. First, a HP providing 3.9 MW of cooling and absorption units providing 11.1 MW of cooling will be installed. In summer, the absorption units will utilise surplus heat from the DH network generated by biomass CHP plants. For the 60 MW DC demand area, it is planned to install 10 MW chillers and 65 MW absorption units that could also supply the 30 MW region via an interconnection pipeline. €30 million is expected in investments, and the payback period is estimated at 10 years, assuming DC consumers pay €35/MWh in addition to electricity and connection fees[7]Igor Krupenski, ‘District Cooling System Operation in Cold Climates with Existing District Heating Networks’ (Smart Energy Systems Confernce 2020, 2020)..
As it can be seen from the few existing examples of DC networks in Estonia, they have recently been installed and started their operation. It is further planned to build several other DC networks in each Baltic state. Therefore, the development of DC is still at the beginning. Due to its higher efficiency than individual cooling units, more and more DC networks may be installed in the future. At the same time, it is expected that cooling demands will have a strong growth in the future, because of changing consumer needs, e.g. increased comfort. This may be seen on the increased number of shopping centres, office buildings and low-energy buildings as well as an increased comfort level of society. In addition, climate change and an increase in the global average temperature will increase cooling needs in the future. This may be derived based on the annual Cooling Degree Day (CDD) Index shown in Figure 71. This index works for cooling needs similar like the annual Heating Degree-Day Index for heating shown in Figure 3. The annual CDD Index is shown for the last 50 years starting from 1979. As shown, none of the Baltic states had a considerable CDD Index until the 1990s. Since then, it was increasing and an CDD Index between 5 and 20 is often present. 2010 was a year with particular high numbers in each Baltic state. When looking at the EU’s average, a continuous raise is observed indicating a high need of cooling in the future.
Footnotes
- ^ Fortum Tartu, ‘Anne Soojus Production Plants’, 2018.
- ^ Fortum, ‘Fortum Starts Construction of the First Cooling Plant in Pärnu’, 2018; Fortum, ‘Fortum in Estonia’, 2020.
- ^ Euroheat & Power, ‘Fortum to Build Second District Cooling Plant in Tartu’.
- ^ Fortum, ‘Fortum Considers Possible Strategic Options for Its District Heating Businesses in Joensuu, Finland and in Pärnu and Tartu, Estonia’, 2019.
- ^ Reuters, ‘UPDATE 1-Fortum Puts Polish, Baltic District Heating Assets on the Block - Sources’, 2020.
- ^ Igor Krupenski, ‘District Cooling System Operation in Cold Climates with Existing District Heating Networks’ (Smart Energy Systems Confernce 2020, 2020).
- ^ Igor Krupenski, ‘District Cooling System Operation in Cold Climates with Existing District Heating Networks’ (Smart Energy Systems Confernce 2020, 2020).
Figure 71. Annual Cooling Degree-Day Index for the Baltic states and the EU’s average
3.5 A potential Baltic path for large-scale heat pumps
The potential way to successfully implement large-scale HPs can be identified based on the current conditions in the Baltic states, the experience gained in Denmark, and the results obtained from the Balmorel analysis of the future energy systems in the Baltics. An overview of the identified drivers behind the implementation of large-scale HPs and the current conditions for each country are shown in Table 30.
| Sector | Drivers benefiting large-scale HP implementation | Denmark | Estonia | Latvia | Lithuania | |||||
| Heat | Ownership structure of DH networks enabling long-term investments | |||||||||
| Heat | Low operating DH temperatures | |||||||||
| Heat | High proportion of citizens supplied by DH | |||||||||
| Heat | Experiences in the implementation and operation of large-scale HPs | |||||||||
| Heat, Power | Political targets for a sustainable supply of power and heat in the near future | |||||||||
| Heat, Power | Tax system and tariff structure to ensure reasonable low electricity costs to produce DH | |||||||||
| Power | Sustainable generation of power | |||||||||
| Power | Security of power supply | |||||||||
| Power | High proportion of fluctuating, renewable power generation | |||||||||
| Fully applies | Applies to a large extent | Applies to a small extent | Does not apply |
Table 30. Overview and status of drivers enabling large-scale HP implementation
Denmark has successfully demonstrated how large-scale HPs can be incorporated into the energy system. This is also confirmed by various drivers behind the implementation of large-scale HPs. For HPs, operating temperatures are critical because they have a direct effect on the COP of the HP. A high COP leads to lower electricity consumption, thus reducing costs. Therefore, in order to increase the profitability of large-scale HP projects, it is necessary to reduce the DH temperatures in the Baltic countries. Secondly, there is very little experience in terms of installing and/or operating large-scale HPs in the Baltics. Developers are afraid to make the first move and face unforeseen costs or problems. Financial incentives for new projects can eliminate this obstacle. Third, the tax and tariff system for electricity should be modified to favour large-scale electric heating. In addition, all three Baltic states have accomplished their Climate Plans for 2020 and have set ambitious goals to be achieved by 2030. Thus, several of the drivers mentioned may remain relevant.
It should be noted that power generation in Estonia must become more sustainable. The security of supply must be improved in Lithuania to maintain control over electricity prices in the long term. Latvia has a high proportion of hydropower that is sustainable and controllable. Therefore, large-scale HPs are not as necessary in Latvia as in the other two countries to balance the power grid.
It was shown in Sections 2.6 to 2.8 that electricity grid tariffs are a barrier for the implementation of large-scale HPs. Furthermore, it was identified how the biomass price influence the potential of large-scale HPs to supply DH. Supporting the initial investment of large-scale HPs can have a very strong and positive impact on the implementation of large-scale HPs. The support does not have to be as high as 50%, but a reasonable value can be chosen. Thereby, also the experience with and use of large-scale HPs in the Baltic countries increases, which can lead to a reduction of further barriers.
Chapter 4
Socio-Economic Impact of Power-to-Heat Solutions on the Heating Sector
4.1 Key findings
-
District heating prices in Estonia are the highest among the Baltic countries. The average price of district heating is €76/MWh in Estonia, €64/MWh in Latvia, and €56/MWh in Lithuania. The price range varies greatly (mainly from €58 to €95 per MWh in EE, €48 to €77 per MWh in LV, and €46 to €70 per MWh in LT).
-
A cost analysis was conducted for individual air-source and ground-source heat pumps in existing and new stand-alone houses and apartment buildings. Considering the levelised cost of heat, individual heat pumps are the most competitive in apartment buildings with the levelised cost of heat of €60 to €80 per MWh. Annual heating costs in new homes will be around €1200 for air-source HPs and €1400 for ground-source heat pumps. In existing homes, the annual costs will be around €1700 for air-source and €2000 for ground-source heat pumps.
-
Individual heat pumps are competitive with district heating in apartment buildings in Estonia and Latvia, but not in Lithuania due to low district heating prices. The levelised cost of heat for stand-alone houses is higher than for district heating. However, expanding district heating to newly built or existing stand-alone houses may also increase the district heating price for the area.
-
CO2 emissions have been calculated for various individual heating technologies. In Latvia and Lithuania, the use of individual heat pumps is very sustainable, while in Estonia, emissions from the national electricity generation mix lead to higher CO2 emissions than when using natural gas boilers. When individual heat pumps are used, other emissions such as SO2 (Sulphur dioxide), NOx (Nitrogen oxides) and particles can be avoided locally. Primary energy is lowest when using individual heat pumps compared to natural gas, biomass or oil boilers in each country.
-
Large-scale heat pumps will mainly be used in district heating to replace natural gas boilers due to subsidised biomass combined heat and power plants operating as baseload units. The competitiveness of large-scale heat pumps depends on current electricity and gas prices.
-
The availability of industrial excess heat and the processes in which it occurs has been thoroughly studied in Europe. 155 case studies of industrial heat pump integration were discovered. For the Baltic states, information on processes that require heat to be a certain temperature is particularly interesting for the chemical, food, wood, and paper sector. High-temperature heat pumps that can supply large amounts of heat at up to 100°C already exist in the wood sector for processes like drying, steaming, staining, cocking and pickling. Heat pump technologies for gluing and pressing are not yet ready to enter the market. The chemical sector has the greatest potential in terms of primary energy use. However, it is mainly boiling and bioreactions that require heat at a temperature that can be provided by modern industrial heat pumps. Most processes in the food and paper sectors can already be supplied with heat via industrial heat pumps, for example, for drying, boiling, bleaching and de-inking in the paper sector and almost all processes in the food sector. Besides, industrial heat pumps can also be used to provide hot water, preheating, washing/cleaning, and space heating.
-
The chemical industry is the dominant sector in Estonia (48%, 9 sites) in terms of total primary energy consumption. Other important sectors are the cement industry (16%, 1 site), refineries (11%, 8 sites) and the wood sector (11%, 15 sites). Smaller contributions come from the food sector (4.1%, 10 sites) and the asphalt industry (3.6%, 63 sites). It can be seen that several very large industries contribute the most to primary energy consumption. The asphalt industry consists of numerous small businesses.
-
The chemical industry is very dominant in Lithuania (77% of total primary energy consumption, 2 sites), Other sectors include the mineral sector (10%, 12 sites), paper (6%, 3 sites) and food (4%, 5 sites).
-
In Latvia, industrial energy consumption comes mainly from the wood sector (36%, 15 sites), the cement industry (25%, 1 site), and others (21%, 11 sites). The food sector (8%, 7 sites), pharmaceuticals (4%, 2 sites) and refineries (4%, 1 site) can also be important.
4.2 Impact on individual consumers when switching to power-2-heat technologies
The socioeconomic costs and benefits for individual households and industries in the Baltic countries from the transition to electric heating are described below. This includes potential emissions and PE changes.
4.2.1 District heating end-user prices
Current heat prices for DH networks in Estonia, Latvia, and Lithuania can be found in Figure 72, Figure 73 and Figure 74 and the average price of DH based on the number of networks is €76/MWh, €64/MWh, and €56/MWh, respectively. The price includes VAT: 20% in Estonia, 21% in Latvia, and only 9% in Lithuania. This shows that Estonia has the highest DH prices, followed by Latvia and Lithuania. However, the price differences between the DH networks of one country vary considerably. DH prices range from €58/MWh to €95/MWh for most DH networks in Estonia. In Latvia, DH prices typically range from €48/MWh to €77/MWh. In Lithuania, DH prices usually range from €46/MWh to €70/MWh. DH is generally cheaper in Lithuania than in the other two countries. In addition, lower VAT results in much lower DH prices for consumers in Lithuania, as opposed to Estonia and Latvia.
Figure 72. Heat prices in Estonian DH networks, including 20% VAT[1]Estonian Competition Authority, ‘Limits of Heat Production Costs Agreed with the Estonian Competition Authority (in Estonian)’, 2020.
Footnotes
- ^ Estonian Competition Authority, ‘Limits of Heat Production Costs Agreed with the Estonian Competition Authority (in Estonian)’, 2020.
4.2.2 Heat costs for individual heat pumps
Consumers may be able to choose their heating supply if it is not regulated by the state or local municipalities. For example, in Tallinn, consumers are required to connect to DH if they are located nearby. If individual consumers can choose between DH and individual HPs, the most important indicator is probably the price. Other indicators influencing the decision could be sustainability, maintenance, paying a fixed price instead of getting a loan, etc. Apart from individual HPs, consumers can also invest in alternatives such as biomass-based heating. In the Flex4RES project[1]Nordic Energy Research, ‘Flex4RES’, 2019. , the levelised cost of heat (LCOH) and annual heating costs were calculated for each Baltic country. The costs were calculated for a variety of individual heat production technologies for an existing standard house based on Danish conditions with an annual heat demand of 16.8 MWh and a peak heat demand of 7 kW. The investment period was 15 years with a 5% interest rate. No discounting was made. Prices, taxes, and tariffs from 2016 were used. In addition, fossil fuel and biomass-based technologies, air-source (air-water) and ground-source (liquid-water) HPs were considered. An overview of heating costs is presented in Figure 75.
Footnotes
- ^ Nordic Energy Research, ‘Flex4RES’, 2019.
Figure 75 shows that the lowest heating costs were associated with a wood pellet boiler or a combination of wood-burning stove and electric water heating, resulting in costs of almost €1200 per year or €70/MWh for all countries. The third cheapest option was a natural gas boiler, which was cheaper to install in Estonia than in Latvia and Lithuania. The next most expensive option is an oil boiler in Latvia and Lithuania, and an air-source HP in Estonia. This is followed by ground-source HPs and electric heating. In Estonia, using an oil boiler was the most expensive option.
The LCOH and annual heating costs for an individual consumer are presented below based on calculations that follow the principle calculations of the Flex4RES project. However, certain assumptions have been changed and more details have been added. Calculation assumptions can be found in Annex 4. Individual air-source and ground-source HPs for new and existing homes (7.5 MWh and 15 MWh) and new and existing apartment buildings (300 MWh and 600 MWh) were considered. HP performance values were assumed to be lower than those used in the FLEX4RES project, reflecting seasonal performance factors for Baltic conditions. The following seasonal performance factors were adopted as shown in Table 31.
| Seasonal performance factors, - | Estonia | Latvia | Lithuania |
| Air-source HP new building | 2.8 | 3 | 3.2 |
| Air-source HP existing building | 2.6 | 2.8 | 3 |
| Ground-source HP new building | 3.4 | 3.5 | 3.6 |
| Ground-source HP existing building | 3.4 | 3.5 | 3.6 |
Table 31. Assumed seasonal performance factors of individual HPs for Baltic countries (considering[1]Janis Kazjonovs and others, ‘Performance Analysis of Air-to-Water Heat Pump in Latvian Climate Conditions’,
Environmental and Climate Technologies, 14.1 (2014), 18–22. [2]Suvi Hakamies and others, ‘Heat Pumps in Energy and Cost Efficient Nearly Zero Energy Buildings in Finland’, 2015. [3]Rokas Valancius and others, ‘A Review of Heat Pump Systems and Applications in Cold Climates: Evidence from Lithuania’, Energies, 12.22 (2019).)
Footnotes
- ^ Janis Kazjonovs and others, ‘Performance Analysis of Air-to-Water Heat Pump in Latvian Climate Conditions’,
Environmental and Climate Technologies, 14.1 (2014), 18–22. - ^ Suvi Hakamies and others, ‘Heat Pumps in Energy and Cost Efficient Nearly Zero Energy Buildings in Finland’, 2015.
- ^ Rokas Valancius and others, ‘A Review of Heat Pump Systems and Applications in Cold Climates: Evidence from Lithuania’, Energies, 12.22 (2019).
LCOH calculation results for various scenarios and each country are presented in Figure 76. Electricity prices are shown in three categories. Electricity costs for private households with an annual electricity consumption of 5000 kWh to 15000 kWh, excluding any taxes and levies, are shown in grey. Electricity taxes and levies are shown in yellow, excluding VAT or other refundable taxes. VAT and refundable taxes are shown in light blue[1]Eurostat, ‘Electricity Prices for Household Consumers - Bi-Annual Data (from 2007 Onwards)’, 2020.. HP costs for an existing house represent the closest possible conditions compared to the results of the Flex4RES project.
Footnotes
- ^ Eurostat, ‘Electricity Prices for Household Consumers - Bi-Annual Data (from 2007 Onwards)’, 2020.
Figure 76. LCOH for individual HPs in the Baltic states
As shown in Figure 76, the LCOH is lowest for new and existing apartment buildings with air-source and ground-source HPs, followed by existing homes. The LCOH is highest for new homes in each country. The reason for this trend is the high heat demand of existing stand-alone houses and apartment buildings compared to the investment in HPs. While HP investment in new homes is approximately 49% for air-source and 62% for ground-source HPs, the share averages only 28% and 42% in apartment buildings, respectively. In addition, maintenance costs are only 4% of the LCOH for apartment buildings, while the share averages 21% for new homes and 14% for existing homes. This is consistent with the findings of Valancius et al.[1]Rokas Valancius and others, ‘A Review of Heat Pump Systems and Applications in Cold Climates: Evidence from Lithuania’, Energies, 12.22 (2019)., as mentioned earlier, who concluded that the necessity of major investments is the main deterrent for individual HPs in Lithuania. If the investment into individual HPs is financially supported by the government, as described in Section 3.2.6, the LCOH of HPs could be significantly reduced.
Instead of estimating heating costs based on heat consumption, we can use the annual heating costs. Thus, we can determine how much money a resident of an energy-efficient building can save compared to existing buildings with a higher heat demand. The calculated annual heating costs for various stand-alone house scenarios for each country can be found in Figure 77 and Figure 78 for various apartment building scenarios.
Footnotes
- ^ Rokas Valancius and others, ‘A Review of Heat Pump Systems and Applications in Cold Climates: Evidence from Lithuania’, Energies, 12.22 (2019).
Figure 77. Annual heating costs for individual HPs in stand-alone houses in the Baltic states
Figure 78. Annual heating costs for individual HPs in apartment buildings in the Baltic states
As shown in Figure 77, annual heating costs are lowest for new homes that use air-source HPs, followed by new homes with ground-source HPs, followed by air-source HPs and ground-source HPs in existing homes. The difference in annual heating costs for new homes compared to existing ones can range from €550 to €640. Air-source HPs result in lower annual costs than ground-source HPs due to higher investment in ground-source HPs.
In Figure 78, it can be seen that the annual costs for ground-source HPs are slightly lower than for air-source HPs. Considering the size of apartment buildings, large investments in ground-source HPs pay off due to better performance. This leads to a decrease in electricity consumption and, as a result, to lower costs. Annual heating costs can be significantly reduced (>50%) for new apartment buildings compared to existing ones.
4.2.3 Emissions from individual heat production technologies
2019 data on specific CO2 emissions from electricity generation was used for each country as shown in Figure 57. The values for natural gas, oil, and biomass were obtained from[1]Danish Energy Agency and Energinet, ‘Technology Data for Individual Heating Installations’, 2016, p. 166. , taking into account information from[2]Jaanus Uiga, ‘CO2 Emissions Resulting from Final Energy Consumption – A Case Study of Tartu City’, Tartu: EMÜ, 2014. . The specific CO2 emissions that will be released per MWh of heat produced are shown for various individual heating technologies for existing buildings in Figure 79. Specific emissions (per unit of heat) for other types of buildings do not differ significantly. Therefore, they are not shown. It can be seen that HPs are an environmentally friendly solution compared to other technologies in Latvia and Lithuania. Specific CO2 emissions from HPs are below 0.05 kgCO2/kWhheat, 0.2 for natural gas, 0.3 for oil, and 0.42 for wood pellets. Burning wood pellets is considered CO2 neutral as it is a sustainable biofuel that can regrow. In Estonia, specific CO2 emissions from electricity are very high due to the large share of power generated from oil shale. Thus, the use of electric HPs will (currently) lead to high CO2 emissions.
Figure 79. Specific CO2 emissions for individual heating technologies for existing buildings in the Baltic states (*CO2 emissions from biofuel combustion can be considered zero)
In addition to CO2 emissions, other emissions can occur locally when fossil fuels or biomass are burned. Emissions detected include SO2 (Sulphur dioxide), NOx (Nitrogen oxides), CH4 (Methane), N2O (Nitrous oxide), and particles from individual heating solutions[1]Danish Energy Agency and Energinet, ‘Technology Data for Individual Heating Installations’, 2016, p. 166.. An overview can be found in Figure 80. It can be seen that natural gas boilers and oil-fired boilers emit 37 and 98 mgNOx/kWhheat, respectively. In addition, natural gas boilers emit 3.7 mgCH4/kWhheat, while oil-fired boilers emit 2 mgSO2/kWhheat and 0.1 mgParticles/kWhheat. Biomass boilers emit 110 mgSO2/kWhheat, 307 mgNOx/kWhheat, 8.8 mgCH4/kWhheat, 18 mgN2O/kWhheat, and 66 mgParticles/kWhheat.
These emissions could be reduced locally if individual HPs were used instead, as HPs only need electricity and a heat source to produce heat. For stand-alone buildings, the heat source is typically based on the environment (air, ground, water), so there is no need to calculate potential emissions from an industrial excess heat source. Emissions from the electricity generation depend on the power generation mix, as shown for CO2 emissions. However, emissions from central power plants and CHP plants are released at plant locations, which are usually located outside densely populated areas. Moreover, higher efficiencies can often be obtained at large plants and the cleaning process of the exhaust gases is more advanced, which leads to lower specific emissions.
Footnotes
- ^ Danish Energy Agency and Energinet, ‘Technology Data for Individual Heating Installations’, 2016, p. 166.
Figure 80. Specific emissions for individual heating technologies for existing buildings in the Baltic states
Below is the specific PE per MWh of heat produced, calculated based on the primary energy factors shown in Table 32.
| Primary energy factors | Estonia357 | Latvia358 | Lithuania359 |
| Electricity mix | 2 | 1.75 | 2.5 |
| Natural gas | 1 | 1.1 | 1.1 |
| Oil | 1 | 1.1 | 1.1 |
| Biomass | 0.65 | 1.2 | 1.2 |
Table 32. Primary energy factors for different fuels and electricity
[1]Riigi Teataja, ‘Minimum Energy Performance Requirements for Buildings’, 2018. [2]Legal Acts of the Republic of Latvia, ‘Methodology for Calculating the Energy Performance of a Building Annex I’, 2013. [3]Ministry of Environment of the Republic of Lithuania, ‘Regarding the Approval of the Construction Technical Regulation STR 2.01.02: 2016 “Design and Certification of Energy Performance of Buildings” (In Lithuanian)’, 2016.
Footnotes
- ^ Riigi Teataja, ‘Minimum Energy Performance Requirements for Buildings’, 2018.
- ^ Legal Acts of the Republic of Latvia, ‘Methodology for Calculating the Energy Performance of a Building Annex I’, 2013.
- ^ Ministry of Environment of the Republic of Lithuania, ‘Regarding the Approval of the Construction Technical Regulation STR 2.01.02: 2016 “Design and Certification of Energy Performance of Buildings” (In Lithuanian)’, 2016.
An overview of the PE for individual heating is presented in Figure 81. Since the specific PE per MWh is fairly similar for each building type, only the results for an existing stand-alone house are shown.
Figure 81. Specific PEC per unit of heat generated for existing buildings in the Baltic states
It can be seen that the PE is lowest for individual HPs compared to natural gas, oil or biomass boilers. Despite the high primary energy factor for electricity use in each country, the PE is lower compared to the use of conventional boilers due to the low energy consumption, as a result of the COP higher than 3 compared to boilers with an efficiency lower than 1. It can be noted that due to the low primary energy factor for biomass in Estonia, its use is competitive in comparison with air-source HPs in terms of PE.
4.2.4 District heating vs. individual heat pumps
DH is often seen as a chance to integrate more renewable energy sources into the power sector due to the possibility of using existing infrastructure and storage capacity for fluctuating RES. For new development areas, there is no existing DH infrastructure. Therefore, the question often rises whether the new DH infrastructure, ideally LTDH, is more competitive and worth the investment than individual heating solutions such as individual HPs or biomass boilers. Moreover, heat demands of newly built areas are often lower than those of the existing building stock. This affects the linear heat density (MWh/m) covered by DH.
As for individual HP support policy instruments (see Section 3.2.6), these instruments are aimed at reducing the environmental impact of energy systems and improving energy efficiency, as well as supporting buildings to reduce energy consumption. On the other hand, end-users must achieve a low energy performance score that only takes into account purchased energy in order to receive the maximum level of support. Installation of HPs or other heat recovery systems is required. This means that in some cases, some of the heat normally supplied via renewable DH will be replaced by heat generated by HPs using non-renewable electricity. To avoid this adverse effect, energy and efficiency policies must be synchronised at the system or even at the country level to achieve minimum environmental impact[1]Arbo Reino, Mihkel Harm, and Arvi Hamburg, ‘The Impact of Building Renovation with Heat Pumps to Competitiveness of District Heating: Estonian District Heating Pricing System Needs More Flexibility’, in 2017 IEEE 58th International Scientific Conference on Power and Electrical Engineering of Riga Technical University (RTUCON) (IEEE, 2017). . Another aspect is the one-component tariff system in the Baltic countries, when the costs of DH do not depend on the consumption volume and the load profile of consumers. This creates a weird situation for customers that use only DH. They will have to be responsible for the costs of maintaining the system not just for themselves, but also partially for consumers with alternative supply. At the same time, customers who mainly rely on HPs but still request full DH availability at all times will pay only a fraction of the associated costs to maintain DH, thereby delegating some of the responsibility for the costs to consumers who use only DH. This does not send the right signal to both customer groups and does not reflect the actual costs associated with the two groups of consumers. In addition, the competitiveness of DH will be jeopardised as a decrease in volumes will cause an increase in tariffs. In this case, the variable cost of local heating alternatives seems to be even more competitive, although they can often only cover the base load[2]Arbo Reino, Mihkel Harm, and Arvi Hamburg, ‘The Impact of Building Renovation with Heat Pumps to Competitiveness of District Heating: Estonian District Heating Pricing System Needs More Flexibility’, in 2017 IEEE 58th International Scientific Conference on Power and Electrical Engineering of Riga Technical University (RTUCON) (IEEE, 2017)..
When the LCOH of the individual HP solutions presented in Figure 76 is compared with the DH prices described in Section 4.2.1, it can be seen that the individual HPs are competitive with DH in apartment buildings in Estonia and Latvia, but not in Lithuania due to low DH prices. The LCOH for stand-alone houses is higher than for DH. However, expanding DH to newly built or existing stand-alone houses may also increase the DH price for the area. The investment into the new DH infrastructure will account for a higher share of the total costs when heat density is lower.
A socio-economic analysis was conducted for a new development area in Denmark’s capital, comparing the LCOH (referred to as LCOE in the analysis) for DH at different operating temperatures and for individual air-source HPs, ground-source HPs, and electric boilers[3]Energylab Nordhavn, ‘Delivery No.: D5.2a Criteria for Selecting between Large Heat Pumps for District and Small Heat Pumps for Individual Buildings’, 2019.. The analysis was carried out for various linear heat demand densities (LHDD) represented by different plot ratios (the ratio between the built-up area and the land area). For DH, four central HP solutions (ambient air, groundwater, seawater, and waste heat) were considered, along with wood chip and wood pellet boilers for supply/return temperatures of 80/50°C, 70/40°C, and 60/30°C.
An overview of the results is provided in Figure 82 and Figure 83. The LCOE for different LTDH and individual supply options are presented in Figure 82 for various plot ratios. The LCOE for individual HPs was €56.2/MWh for air-source and €56.8/MWh for ground-source (brine to water) HPs. The LCOE for individual electric boilers was much higher (≈ €90/MWh). All DH supply options with 70/40°C supply/return temperatures that were based on different technologies followed a similar trend and resulted in lower LCOE than individual heat supply options for plot ratios between 0.5 and 0.8. The LCOE for DH options will decrease even further if lower operating temperatures are used or when the share of space heating in the total heat demand is higher.
Footnotes
- ^ Arbo Reino, Mihkel Harm, and Arvi Hamburg, ‘The Impact of Building Renovation with Heat Pumps to Competitiveness of District Heating: Estonian District Heating Pricing System Needs More Flexibility’, in 2017 IEEE 58th International Scientific Conference on Power and Electrical Engineering of Riga Technical University (RTUCON) (IEEE, 2017).
- ^ Arbo Reino, Mihkel Harm, and Arvi Hamburg, ‘The Impact of Building Renovation with Heat Pumps to Competitiveness of District Heating: Estonian District Heating Pricing System Needs More Flexibility’, in 2017 IEEE 58th International Scientific Conference on Power and Electrical Engineering of Riga Technical University (RTUCON) (IEEE, 2017).
- ^ Energylab Nordhavn, ‘Delivery No.: D5.2a Criteria for Selecting between Large Heat Pumps for District and Small Heat Pumps for Individual Buildings’, 2019.
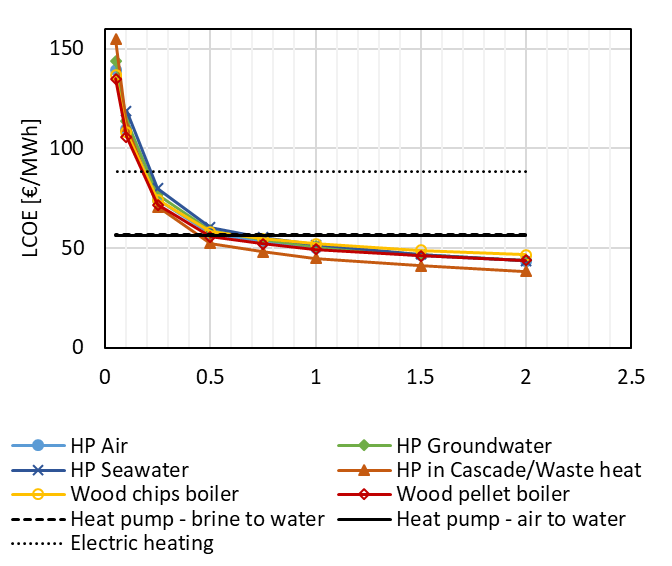
Figure 82. LCOE as a function of the plot ratio for different heat supply options (DH as low-temperature DH (70/40°C), space heating share of 0.13) (copied from[1]Energylab Nordhavn, ‘Delivery No.: D5.2a Criteria for Selecting between Large Heat Pumps for District and Small Heat Pumps for Individual Buildings’, 2019.)
Footnotes
- ^ Energylab Nordhavn, ‘Delivery No.: D5.2a Criteria for Selecting between Large Heat Pumps for District and Small Heat Pumps for Individual Buildings’, 2019.
The minimum LHDD required for DH to become more feasible than individual air-source HPs for a given case study for three different operating temperatures is shown in Figure 83. The minimum LHDD required corresponds to the lowest plot ratios needed for DH. It can be seen that the minimum LHDD required decreases at lower DH operating temperatures when large-scale HPs are used to provide DH. Lower operating temperatures result in higher COPs and lower heat losses, which has a positive effect on the LCOE. HPs running on sewage water require the lowest LHDD, followed by HPs using ambient air, groundwater, and seawater. Sewage water HPs had the lowest LCOE (e.g., Cascade/Waste heat in Figure 82) and therefore the lowest minimum required LHDD. This was mainly because of the high COP due to the comparable high temperature of the heat source. It was followed by air-source HPs despite its low COP due to low investment. Investments in groundwater and seawater HPs were too high to be competitive with sewage water and ambient air.
Biomass-based boilers followed the opposite trend than HPs in terms of the minimum LHDD required based on DH operating temperatures. The minimum LHDD decreased at higher operating temperatures. Therefore, biomass-based DH may be more suitable than HPs for higher operating temperatures and vice versa.
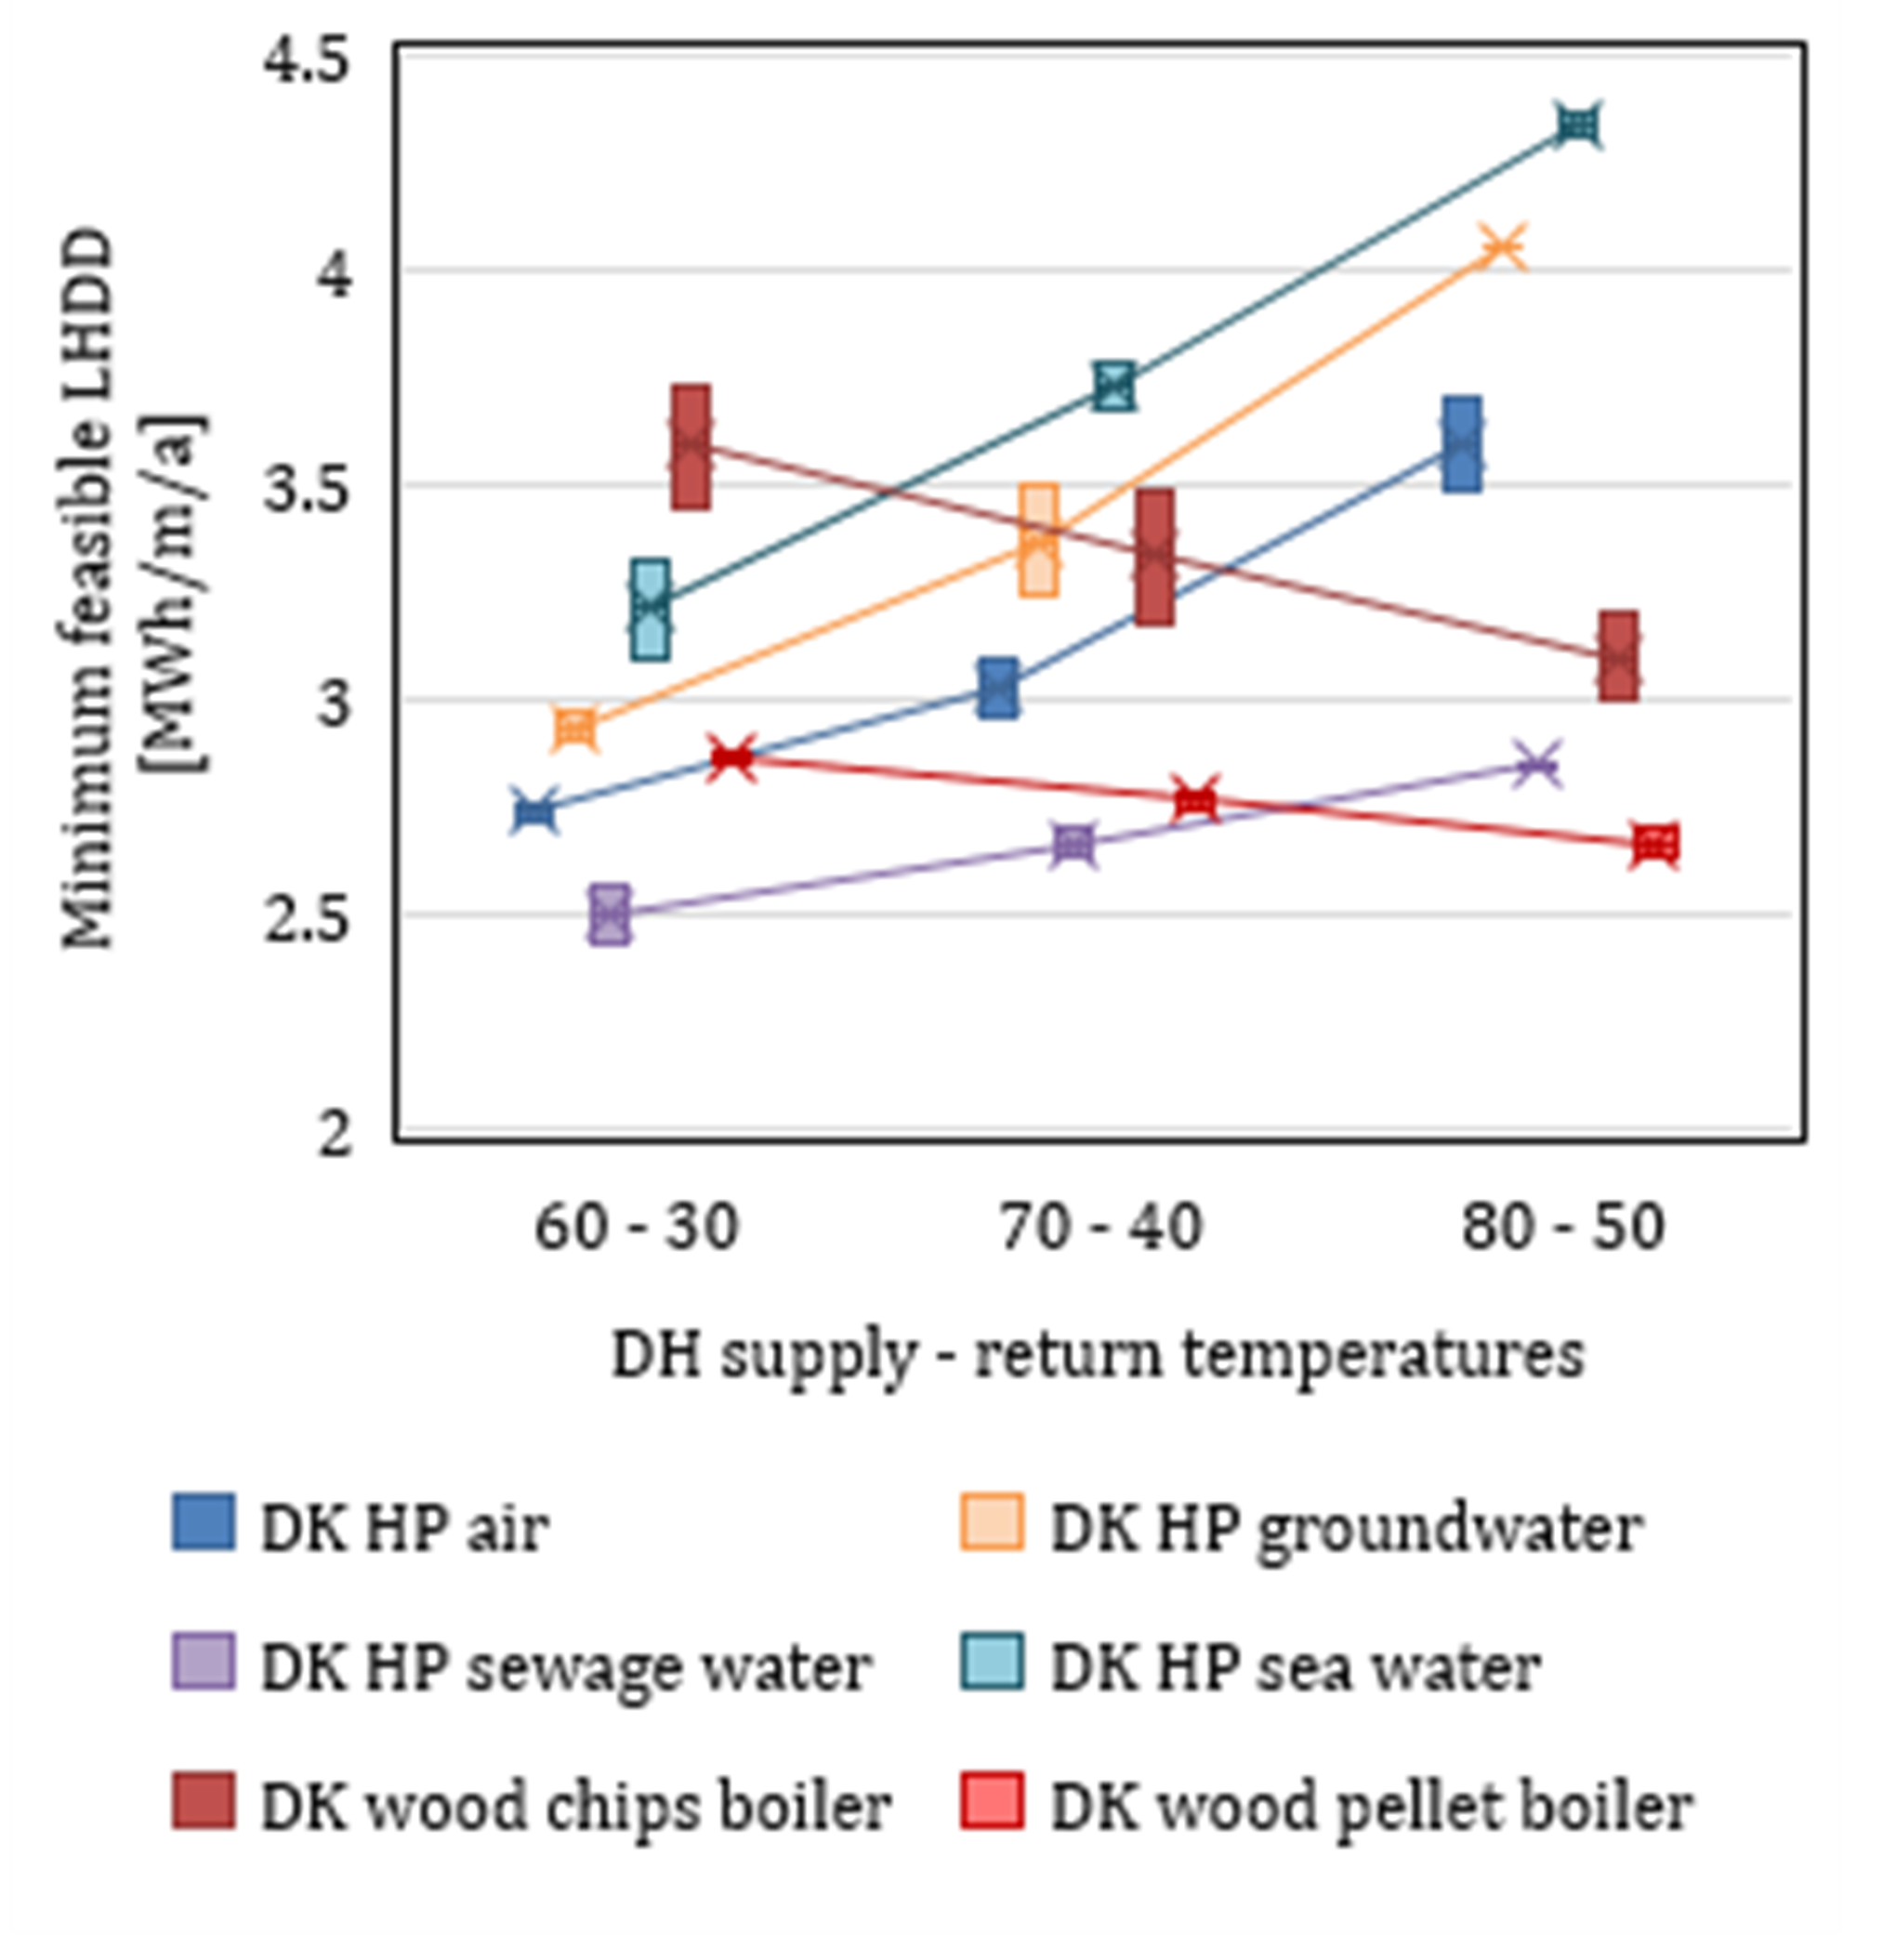
Figure 83. Minimum feasible LHDD for DH compared to individual air-source HPs (copied from[1]Energylab Nordhavn, ‘Delivery No.: D5.2a Criteria for Selecting between Large Heat Pumps for District and
Small Heat Pumps for Individual Buildings’, 2019.)
Footnotes
- ^ Energylab Nordhavn, ‘Delivery No.: D5.2a Criteria for Selecting between Large Heat Pumps for District and
Small Heat Pumps for Individual Buildings’, 2019.
4.3 Development of the heating market considering the implementation of large-scale heat pumps
The impact of the widespread introduction of large-scale HPs on the development of the heating market in each Baltic country was assessed and heat generation costs were compared with conventional technologies. Furthermore, CO2 emissions based on fuel consumption were compared for central heating plants.
4.3.1 Costs of heat production in district heating plants
As shown in Section 3.3.2, the cost of heat production by large-scale HPs under the Danish conditions currently ranges from €33/MWh to €39/MWh. The considered electricity costs, taxes, and tariffs were approximately €19/MWhheat, €24/MWhheat and €28/MWhheat at an electricity price of €30/MWhel without future tax cuts and for COPs of 5, 4, and 3.5, respectively. This is quite similar to the Estonian conditions, taking into account the electricity prices for large consumers presented in Table 26. In Latvia and Lithuania, heat production costs are higher. An overview of the estimated heat production costs for large-scale HPs, natural gas boilers, and CHP plants in the Baltic states is provided in Table 33. Representative prices were used for heat produced by natural gas boilers and CHP plants in Estonia[1]Estonian Competition Authority, ‘Limits of Heat Production Costs Agreed with the Estonian Competition
Authority(in Estonian)’, 2020., Latvia[2]Latvian Public Utilities Commission, ‘Tariffs for Heat Supply Services in Latvia’, 2020., and Lithuania[3]Lithuanian National Energy Regulatory Council, ‘The District Heating Prices’, 2020.. Prices may vary within the country depending on the DH network, region, and type of plant. The final heating price in Lithuania is determined monthly and depends on the region. Among the five major cities, the final heating price in January 2021 was lowest in Kaunas and highest in Klaipėda.
Footnotes
- ^ Estonian Competition Authority, ‘Limits of Heat Production Costs Agreed with the Estonian Competition
Authority(in Estonian)’, 2020. - ^ Latvian Public Utilities Commission, ‘Tariffs for Heat Supply Services in Latvia’, 2020.
- ^ Lithuanian National Energy Regulatory Council, ‘The District Heating Prices’, 2020.
| Heat generation price (€/MWhheat) | Estonia | Latvia | Lithuania | ||||||
| Large-scale HP* | 33 | 36 | 39 | 38 | 42 | 47 | 36 | 40 | 44 |
| Natural gas boiler | 30 – 35 | 41 – 46 | 45 – 47 | ||||||
| Biomass/natural gas CHP plant | 30 – 35 | 24 – 26 | 28 – 36** | ||||||
Table 33. Heat generation costs for large-scale HPs, boilers, and CHP plants
+ COP=5.0/4.0/3.5, ** Example for UAB Fortum Klaipėda in 2020
As shown, large-scale HPs can be competitive with natural gas boilers in each country given current conditions. Heat production costs for large-scale HPs are similar to those for natural gas boilers in each country. They are lowest in Estonia, and heat production costs for natural gas boilers are also lowest in Estonia. Large-scale HPs currently cannot compete with CHP plants, which are heavily subsidised, such as biomass CHP plants in Estonia. The subsidies are generated from all electricity consumers. Therefore, if HPs were in operation, they would subsidise biomass and efficient fossil fuel-based CHP plants, while at the same time competing with these plants.
CHP plants generate electricity, while HPs consume electricity. Therefore, large-scale HPs can be operated when electricity prices are low, resulting in low operating costs. At the same time, it would be unprofitable to produce heat via CHP plants. If electricity prices are high, CHP plants should be in operation, selling electricity and producing heat, while large-scale HPs should not be operated during these hours. Therefore, ideally, the decision to operate either CHP plants or large-scale HPs should be based on a threshold electricity price. This control strategy should take into account ramp-up, downtime, and efficiency during these periods. An overview of sorted hourly day-head electricity prices in 2020 can be found in Figure 84. The average price was €34/MWh. 47% of electricity prices were above average and 53% were below. The assumed electricity price for calculating the costs of heat distribution costs at large-scale HPs was €30/MWhel. As can be seen, prices can be much higher.
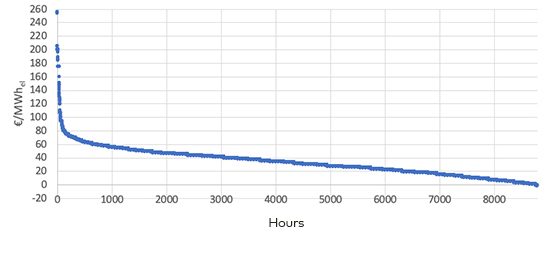
In addition to the importance of the electricity price for large-scale HPs and CHP plants, the price of natural gas also affects heat distribution costs for natural gas boilers and CHP plants. The dependence of the heat generation tariff on the price of electricity is shown using the example of a natural gas boiler and CHP plant located in Latvia, as depicted in Figure 85. As shown, the heat generation tariff increases linearly for both natural gas boilers and CHP plants.
Figure 85. Heat generation tariff based on the price of natural gas for a natural gas boiler and CHP plant in Latvia[1]Latvian Public Utilities Commission, ‘Tariffs for Heat Supply Services in Latvia’, 2020.
Footnotes
- ^ Latvian Public Utilities Commission, ‘Tariffs for Heat Supply Services in Latvia’, 2020.
4.3.2 Emissions from district heating production plants
Another important aspect to consider is the CO2 emission factors from the national electricity mix in the countries compared to the emissions from burning fossil fuels. An overview is available in Table 34.
| CO2 emission factors | Estonia | Latvia | Lithuania | |
| Tonnes/MWh input fuel | ||||
| National electricity mix | 2019 | 0.891 | 0.117 | 0.022 |
| 2040 | 0.220370 | 0.08371 | 0.06372 | |
| Natural gas | 0.198 | |||
| Biomass | 0* |
Table 34. CO2 emission factors for electricity, natural gas and biomass
[1]Elering, ‘Estonian Long-Term Power Scenarios’, 2014. [2]European Commission, ‘EU Reference Scenario 2016 Energy, Transport and GHG Emissions Trends to 2050’, 2016. [3]European Commission, ‘EU Reference Scenario 2016 Energy, Transport and GHG Emissions Trends to 2050’,
2016.*Biomass is considered sustainable and CO2 neutral.
Footnotes
Specific CO2 emissions per MWh of heat produced by large-scale HPs (COP=4) and gas boilers, based on the factors presented in Table 34, are shown in Figure 86.
Figure 86. Specific CO2 emissions for large-scale HPs and gas boilers for different scenarios
As shown, under current conditions, the carbon intensity of heat generation by large-scale HPs is similar to that of central gas boilers in Estonia, due to the high carbon intensity of electricity generation. In Latvia and Lithuania, heat production by large-scale HPs will result in reduced CO2 emissions compared to natural gas boilers. In all cases, the operation of HPs will lead to an increase in electricity consumption, which is not carbon neutral in any of the all Baltic states, although it is very low in Latvia and Lithuania. This means that from this point of view, the use of biomass boilers is currently preferable. If we take a look at future projections of the carbon intensity of electricity generation in 2040, CO2 emissions will be significantly reduced, especially in Estonia. As a result, heat production by large-scale HPs in Estonia will become more sustainable than using natural gas boilers. CO2 emissions from electricity generation in Latvia will decrease even more, while in Lithuania they will increase based on the projections made in 2016. Specific CO2 emissions can be reduced if HPs with a higher COP are used.
4.3.3 Competitiveness of large-scale heat pumps in district heating
Biomass boilers and CHP plants are mainly used as baseload plants for DH networks in the Baltics, while natural gas boilers are used to generate heat mainly during heat load peaks in winter. For example, in Tallinn, biomass and waste incineration CHP plants operate all year round, while natural gas boilers are switched on during colder periods. On the other hand, operating large-scale HPs is most efficient and feasible during periods of lower heat demand, e.g. in terms of low DH supply temperatures and higher natural heat source temperatures. Currently, it is neither envisaged nor possible for large-scale HPs to compete with biomass boilers and CHP plants, because biomass is heavily subsidised, considered to be carbon neutral, and widely available in the Baltics.
However, in some DH areas, natural gas-fired plants are still used as baseload heat generation units, such as gas-fired CHP plants in Riga and natural gas boilers in Daugavpils. Other examples include DH areas in Laagri, Estonia, and Nemencinė, Lithuania. For these cases, further options concerning partial or full replacement of natural gas-fired heat production plants with large-scale HPs should be explored.
4.4 Potential for electrification of the industrial sector
The following information was mainly taken from Arpagaus et al.[1]Cordin Arpagaus and others, ‘High Temperature Heat Pumps: Market Overview, State of the Art, Research Status, Refrigerants, and Application Potentials’, Energy, 152 (2018). and Schlosser et al.[2]Schlosser and others, ‘Large-Scale Heat Pumps: Applications, Performance, Economic Feasibility and Industrial Integration’, Renewable and Sustainable Energy Reviews, 133.August (2020), 110219.. More information can be found in these scientific articles, in the Annexes to the IEA reports on the application of industrial HPs, Part I and II[3]IEA HPT TCP, Annex 35: Application of Industrial Heat Pumps, Final Report, 2014., or in the BENTE report[4]Tomi J. Lindroos and others, ‘Baltic Energy Technology Scenarios 2018’, 2018, p. 165..
4.4.1 Heat demand in the industry in Europe and the Baltic states
According to the study by the IEA[5]International Energy Agency, Heating without Global Warming-Market Developments and Policy Considerations for Renewable Heat, 2014. , industry is the largest heat-consuming sector with 79 EJ in 2011, which accounts for almost 46% of the total energy used for heat production in the world that year. This was an increase from 61 EJ in 2000, with an average growth of 1.7 EJ/year. In addition to space heating and hot water, there is a significant demand for process heat in the industry sector, which can be used in production, processing, or finishing of products. Typically, process heat is supplied at a temperature above 80°C[6]IEA HPT TCP, Annex 35: Application of Industrial Heat Pumps, Final Report, 2014.. The theoretical potential for utilising HPs in industrial processes can be estimated by assessing the heat demand of the industry sector and the temperatures of the processes in question.
In 2012, Rehfeldt et al.[7]Matthias Rehfeldt, Tobias Fleiter, and Felipe Toro, ‘A Bottom-up Estimation of the Heating and Cooling Demand in European Industry’, Energy Efficiency, 2017, 1–26. estimated the final heat demand in the EU28 & three additional countries (28 member states, along with Norway, Switzerland, and Iceland) for industrial processes to be 30726 PJ, 20542 PJ, and 821 PJ at over 500°C (for example, iron and steel production), 100 to 500°C (for example, steam consumption in paper, food, and chemical industries), and under 100°C (for example, food industry). These values were obtained by means of a bottom-up approach to disaggregate Eurostat's energy balance by temperature and end use.
Other estimates of industrial heat demand in Europe have shown similar temperature distribution patterns for most industrial subsectors. Naegler et al.[8]Tobias Naegler and others, ‘Quantification of the European Industrial Heat Demand by Branch and Temperature Level’, International Journal of Energy Research, 39.2019 (2015), 30. estimated the total final energy demand for process heat in the EU28 industry sector at about 80500 PJ in 2012, as well as the process heat demand at 20077 PJ (<100°C), 20214 PJ (100 to 400°C), and 30859 PJ (>400°C). The breakdown by heat quality was consistent with the three temperature ranges defined in[9]Euroheat & Power, The European Heat Market, Final Report, Work Package 1 Deliverable of Ecoheatcool EU Project, 2006. . In 2009, Pardo et al.[10]Pardo Nicolas and others, ‘Methodology to Estimate the Energy Flows of the European Union Heating and Cooling Market’, Energy, 52 (2013), 339–52. estimated the useful heat demand in the EU27 industry at 40434 PJ, considering losses from energy conversion during transformation and distribution. About 58% of the heat demand was consumed in the high temperature range (>400°C), 20% in the medium range (100 to 400°C), and 22% in the low-temperature range (<100°C). Most of the useful heat was generated via direct combustion of fuels, with natural gas being the main source of heat, followed by petroleum and coal products. In fact, these three types of fuel accounted for about 83% of PEC[11]Pardo Nicolas and others, ‘Methodology to Estimate the Energy Flows of the European Union Heating and Cooling Market’, Energy, 52 (2013), 339–52..
For each country of the Baltic states, the PEC was determined for individual industries in Section 1.5. As it was shown in Table 9, the annual PEC in the industry sector was around 18.9, 6.3 and 15.6 GWh or 68, 23 and 56 TJ in Estonia, Latvia and Lithuania, respectively (1 PJ=1000 TJ). How the PEC was distributed between the sectors is shown in Figure 87.
Footnotes
- ^ Cordin Arpagaus and others, ‘High Temperature Heat Pumps: Market Overview, State of the Art, Research Status, Refrigerants, and Application Potentials’, Energy, 152 (2018).
- ^ Schlosser and others, ‘Large-Scale Heat Pumps: Applications, Performance, Economic Feasibility and Industrial Integration’, Renewable and Sustainable Energy Reviews, 133.August (2020), 110219.
- ^ IEA HPT TCP, Annex 35: Application of Industrial Heat Pumps, Final Report, 2014.
- ^ Tomi J. Lindroos and others, ‘Baltic Energy Technology Scenarios 2018’, 2018, p. 165.
- ^ International Energy Agency, Heating without Global Warming-Market Developments and Policy Considerations for Renewable Heat, 2014.
- ^ IEA HPT TCP, Annex 35: Application of Industrial Heat Pumps, Final Report, 2014.
- ^ Matthias Rehfeldt, Tobias Fleiter, and Felipe Toro, ‘A Bottom-up Estimation of the Heating and Cooling Demand in European Industry’, Energy Efficiency, 2017, 1–26.
- ^ Tobias Naegler and others, ‘Quantification of the European Industrial Heat Demand by Branch and Temperature Level’, International Journal of Energy Research, 39.2019 (2015), 30.
- ^ Euroheat & Power, The European Heat Market, Final Report, Work Package 1 Deliverable of Ecoheatcool EU Project, 2006.
- ^ Pardo Nicolas and others, ‘Methodology to Estimate the Energy Flows of the European Union Heating and Cooling Market’, Energy, 52 (2013), 339–52.
- ^ Pardo Nicolas and others, ‘Methodology to Estimate the Energy Flows of the European Union Heating and Cooling Market’, Energy, 52 (2013), 339–52.
Figure 87. Proportion of industrial sectors on the PEC of 18.9, 6.3 and 15.6 GWh in Estonia, Latvia and Lithuania
As shown, the chemical industry is the dominant one in Estonia (48%, 9 sites) and particularly in Lithuania (77%, 2 sites) in terms of total PEC. Apart from that, the Estonian industrial energy consumption mainly results from the cement industry (16%, 1 site), refineries (11%, 8 sites) and the wood sector (11%, 15 sites). Smaller contributions come from the food sector (4.1%, 10 sites) and the asphalt industry (3.6%, 63 sites). It can be seen that a few very large industries contribute the most to the PEC, while the asphalt industry consists of very many small businesses. In Lithuania, besides the large chemical sector, the energy consumption from the cement industry (7%, 1 site), paper (6%, 3 sites) and food (4%, 5 sites) are worth mentioning. For Latvia, the energy consumption in industry originates mainly from the wood sector (36%, 15 sites), the cement industry (25%, 1 site) and others (21%, 11 sites). Important sectors can also be the food sector (8%, 7 sites), pharmaceuticals (4%, 2 sites) and refineries (4%, 1 site).
The potential use of excess heat for DH was determined in Section 1.7 based on excess heat factors according to the industries, as shown in Table 14. These excess heat factors were used to estimate the share of heat that is let to the ambient and is not used any further, e.g. heat losses. The actual plant to generate the required heat of the industrial process is often a boiler based on natural gas, biomass or oil. In addition, space heating and hot water can be needed at the industrial sites. Parts of this required heat can be provided by the use of industrial HPs when they are installed to replace fossil fuel-based boilers. This can be an economical solution and also help to decarbonize the industry.
As shown in Figure 88, the industry sector in the Baltic accounted for 14% of the total GHG emissions in 2015. Larger contributors were the power and heating sector (31%), the transport sector (22%) and agriculture (19%). Thus, decarbonizing the industry sector can help achieving climate goals.
It was further considered in the BENTE report[1]Tomi J. Lindroos and others, ‘Baltic Energy Technology Scenarios 2018’, 2018, p. 165. that the industrial final energy consumption will increase despite considerations of energy efficiency improvements. They expect that the total final energy demand will increase by 17% from 2015 to 2030 and by 22% by 2050.
4.4.2 Potential of industrial heat pumps in the EU and the Baltic states
For the European HP market, Nellissen and Wolf[2]Philippe Nellissen and Stefan Wolf, ‘Heat Pumps in Non-Domestic Applications in Europe: Potential for an Energy Revolution’ (n: 8th EHPA European Heat Pump Forum, Brussels, Belgium, 2015), pp. 1–17. explored a technical potential of about 626 PJ (174 TWh) at up to 150°C that would be available via HPs.
Approximately 116 PJ or 19% of the potential heat demand is in the 100-150°C range and is said to be easily accessible by industrial high-temperature HPs. Temperature ranges above 150°C are still out of reach for HP technology. The assessment determined the actual potential of using high-temperature HPs in the food and tobacco, chemical, and paper industries. These industries are also present in the Baltic states, in particular the chemical sector in Estonia and Lithuania, the food sector in all countries and the paper sector in Lithuania and to a smaller extent in Estonia, as presented in Section 1.5.
Around 140 PJ or 22% of the process heat demand is needed in the temperature range of 80-100°C concentrated mostly in the aforementioned sectors and also the wood sector. The wood sector is very strong in Estonia and Latvia. In the paper sector, the share of the total heat demand at this temperature range is especially high. The largest proportion of required heat for space heating and hot water is at a temperature below 80°C. The share is around 59% or 370 PJ and required in all industrial fields. Therefore, if industrial sites are not located within or near DH areas, they can install HPs to cover their own needs for hot water, space heating and/or process heat.
A more detailed overview of industrial processes occurring within various sectors, the approximate temperature range of the process as well as the stage of the HP development to reach certain temperatures is given by Arpagaus et al.[3]Cordin Arpagaus and others, ‘High Temperature Heat Pumps: Market Overview, State of the Art, Research Status, Refrigerants, and Application Potentials’, Energy, 152 (2018).and shown in Figure 89. Process temperatures of 20-200°C were compiled and verified using various literature data. Moreover, temperature band widths are marked in accordance with the available HP technology readiness level according to the current development status of industrial HPs for different supply temperatures.
Footnotes
- ^ Tomi J. Lindroos and others, ‘Baltic Energy Technology Scenarios 2018’, 2018, p. 165.
- ^ Philippe Nellissen and Stefan Wolf, ‘Heat Pumps in Non-Domestic Applications in Europe: Potential for an Energy Revolution’ (n: 8th EHPA European Heat Pump Forum, Brussels, Belgium, 2015), pp. 1–17.
- ^ Cordin Arpagaus and others, ‘High Temperature Heat Pumps: Market Overview, State of the Art, Research Status, Refrigerants, and Application Potentials’, Energy, 152 (2018).
| Sector | Process | 20 | 40 | 60 | 80 | 100 | 120 | 140 | 160 | 180 | 200 | °C | ||||||||||
| Paper | Drying | 90 to 240 | ||||||||||||||||||||
| Boiling | 110 to 180 | |||||||||||||||||||||
| Bleaching | 40 to 150 | |||||||||||||||||||||
| De-inking | 50 to 70 | |||||||||||||||||||||
| Food and beverages | Drying | 40 to 250 | ||||||||||||||||||||
| Evaporation | 40 to 170 | |||||||||||||||||||||
| Pasteurization | 60 to 150 | |||||||||||||||||||||
| Sterilization | 100 to 140 | |||||||||||||||||||||
| Boiling | 70 to 120 | |||||||||||||||||||||
| Distillation | 40 to 100 | |||||||||||||||||||||
| Blanching | 60 to 90 | |||||||||||||||||||||
| Scalding | 50 to 90 | |||||||||||||||||||||
| Concentration | 60 to 80 | |||||||||||||||||||||
| Tempering | 40 to 80 | |||||||||||||||||||||
| Smoking | 20 to 80 | |||||||||||||||||||||
| Chemicals | Distillation | 100 to 300 | ||||||||||||||||||||
| Compression | 110 to 170 | |||||||||||||||||||||
| Thermoforming | 130 to 160 | |||||||||||||||||||||
| Concentration | 120 to 140 | |||||||||||||||||||||
| Boiling | 80 to 110 | |||||||||||||||||||||
| Bioreactions | 20 to 60 | |||||||||||||||||||||
| Plastic | Injection modling | 90 to 300 | ||||||||||||||||||||
| Pellets drying | 40 to 150 | |||||||||||||||||||||
| Preheating | 50 to 70 | |||||||||||||||||||||
| Wood | Glueing | 120 to 180 | ||||||||||||||||||||
| Pressing | 120 to 170 | |||||||||||||||||||||
| Drying | 40 to 150 | |||||||||||||||||||||
| Steaming | 70 to 100 | |||||||||||||||||||||
| Cocking | 80 to 90 | |||||||||||||||||||||
| Staining | 50 to 80 | |||||||||||||||||||||
| Pickling | 40 to 70 | |||||||||||||||||||||
| Several sectors | Hot water | 20 to 110 | ||||||||||||||||||||
| Preheating | 20 to 100 | |||||||||||||||||||||
| Washing/cleaning | 30 to 90 | |||||||||||||||||||||
| Space heating | 20 to 80 | |||||||||||||||||||||
| Technology readiness level (TRL) of HPs: | ||||||||||||||||||||||
| Conventional HP < 80 °C | Commercial available high-temperature HP 80 to 100 °C, key technology | Prototype status, technology development, high-temperature HP 100 to 140 °C | Laboratory scale research, functional models, proof of concept, high-temperature HP > 140 °C |
Figure 89. Overview of processes and their typical temperature range in different industrial as well as the Technology Readiness Level of industrial HPs, based on[1]Cordin Arpagaus and others, ‘High Temperature Heat Pumps: Market Overview, State of the Art, Research Status, Refrigerants, and Application Potentials’, Energy, 152 (2018).
Footnotes
- ^ Cordin Arpagaus and others, ‘High Temperature Heat Pumps: Market Overview, State of the Art, Research Status, Refrigerants, and Application Potentials’, Energy, 152 (2018).
Arpagaus et al.[1]Cordin Arpagaus and others, ‘High Temperature Heat Pumps: Market Overview, State of the Art, Research Status, Refrigerants, and Application Potentials’, Energy, 152 (2018). found that, generally, a significant potential for high-temperature HP use has been identified in the food, paper, and chemical industries, particularly, in drying processes, as well as in pasteurisation, sterilisation, evaporation, and distillation. In the temperature range of up to 100°C, there are many possible applications like drying, pre-heating, boiling, pasteurisation, or even laundering or colouring. Today’s HP technology is already able to supply these production processes with heat. High-temperature HP prototypes for temperatures starting at 100°C and up are currently under development; prototypes for temperatures of 140°C and above are still being researched. There is a particular industrial interest in expanding the heat sink temperature range of compression HPs to more than 120°C in order to generate low-pressure process steam[2]T Fleckl and others, ‘Integration Einer Hochtemperaturwarmepumpe Mit Direktverdampfung Zur Warmeruckgewinnung in Einer Rauchgaskondensationsanlage Einer Biomasseverbrennungsanlage’, Deutsche
Kalte- Und Klimatagung, 2014, 19–21; [3]Frederic Bless and others, ‘Theoretical Analysis of Steam Generation Methods - Energy, CO2 Emission, and Cost Analysis’, Energy, 129 (2017), 114–21.. There have been more studies on this topic in recent years.
For the Baltic states, the information of processes with heat demands at certain temperatures is particular interesting for the chemical, food, wood and paper sector. As it can be seen from Figure 89, high-temperature HPs exist that can supply large amounts of heat up to 100°C in the wood sector for processes like drying, steaming, staining, cocking and pickling. For gluing and pressing, current HP technology is not ready for the market yet. The chemical sector has the largest potential in terms of PE usage. However, it can be seen that it is mainly boiling and bioreactions that need heat at a temperature current industrial HPs can supply.
It can further be noted that most of the processes within the food and paper sector can already today be supplied with heat by industrial HPs, such as for drying, boiling, bleaching and de-inking for the paper sector and for almost all processes within the food sector.
Currently, high-temperature HPs are still in the prototype and laboratory stage for achieving temperatures required to supply heat for distillation, compression, thermoforming and concentration processes. However, it can be seen that latest research focuses on high-temperature industrial HPs with supply temperatures above 150°C, as in Zühlsdorf et al.[4]B. Zühlsdorf and others, ‘Analysis of Technologies and Potentials for Heat Pump-Based Process Heat Supply above 150 °C’, Energy Conversion and Management: X, 2 (2019). .
Apart from that, industrial HPs could be used to provide hot water, preheating, washing/cleaning and space heating.
Therefore, industrial HPs can already be implemented today in various important sectors in the Baltic states and thereby electrify the industrial sector to help decarbonizing the energy supply in the long run. Considering the distribution of the energy needs in Figure 89, the most relevant sectors to start with might be the chemical sector, the wood sector and the food sector, for which market-ready HP technology and sufficient high heat demands exist.
4.4.3 Integration of industrial heat pumps into processes and existing examples
Methods for integrating industrial HPs into processes, ranging from manual rules to highly advanced mathematical optimisation, have been discussed in various articles. The Task 2 Report from the Annex 35[5]IEA HPT TCP, Annex 35: Application of Industrial Heat Pumps, Final Report, 2014. specifically states how the integration of industrial HPs into various processes is aided by computer software, namely, by modelling.
To ‘update’ the Annex 21 screening program in terms of modern development, while maintaining the original objectives, it was proposed in the Annex 35[6]IEA HPT TCP, Annex 35: Application of Industrial Heat Pumps, Final Report, 2014. that consistent HP integration into a process must be done using pinch analysis. The main elements of this concept include:
-
Replacing the problem table algorithm in the analysis with an extended transhipment model that is able to optimise HPs and utilities at the same time;
-
Approximating the heat exchanger network in accordance with the standard pinch analysis;
-
Developing an algorithm for choosing a hot and cold stream (can be chosen from several hot and cold streams) to connect the HP to;
-
Developing a HP database for the use with simultaneous optimisation. Since this optimisation is non-linear, it is necessary to develop a special algorithm to ensure convergence.
As stated in Schlosser et al.[7]Schlosser and others, ‘Large-Scale Heat Pumps: Applications, Performance, Economic Feasibility and Industrial Integration’, Renewable and Sustainable Energy Reviews, 133.August (2020), 110219., Annex 48[8]Schlosser and others, ‘Large-Scale Heat Pumps: Applications, Performance, Economic Feasibility and Industrial Integration’, Renewable and Sustainable Energy Reviews, 133.August (2020), 110219. contains a summary of 155 documented case studies of implemented industrial HPs in one online map. The bulk of the case studies are installed in Denmark (n = 26), France (n = 25), Germany (n = 23), Switzerland (n = 19), Austria (n = 19), Japan (n = 17) and the Netherlands (n = 9). The heat capacity of these industrial HPs ranges from 14 kW for a small HP, to 5 MW for a DH HP, to the total capacity of combined plants of over 13.5 MW.
Footnotes
- ^ Cordin Arpagaus and others, ‘High Temperature Heat Pumps: Market Overview, State of the Art, Research Status, Refrigerants, and Application Potentials’, Energy, 152 (2018).
- ^ T Fleckl and others, ‘Integration Einer Hochtemperaturwarmepumpe Mit Direktverdampfung Zur Warmeruckgewinnung in Einer Rauchgaskondensationsanlage Einer Biomasseverbrennungsanlage’, Deutsche
Kalte- Und Klimatagung, 2014, 19–21; - ^ Frederic Bless and others, ‘Theoretical Analysis of Steam Generation Methods - Energy, CO2 Emission, and Cost Analysis’, Energy, 129 (2017), 114–21.
- ^ B. Zühlsdorf and others, ‘Analysis of Technologies and Potentials for Heat Pump-Based Process Heat Supply above 150 °C’, Energy Conversion and Management: X, 2 (2019).
- ^ IEA HPT TCP, Annex 35: Application of Industrial Heat Pumps, Final Report, 2014.
- ^ IEA HPT TCP, Annex 35: Application of Industrial Heat Pumps, Final Report, 2014.
- ^ Schlosser and others, ‘Large-Scale Heat Pumps: Applications, Performance, Economic Feasibility and Industrial Integration’, Renewable and Sustainable Energy Reviews, 133.August (2020), 110219.
- ^ Schlosser and others, ‘Large-Scale Heat Pumps: Applications, Performance, Economic Feasibility and Industrial Integration’, Renewable and Sustainable Energy Reviews, 133.August (2020), 110219.
Low-temperature processes (<100°C) in the food industry can be used as heat sources and heat sinks for the integration of HPs. In addition, the potential for HP integration has been realised in the metal and automotive industries, where cooling, washing, and drying are key thermal processes in manufacturing. Chemical processing, represented by the chemical and pharmaceutical industries, is also a potential target sector. Drying wood or paper using HPs also has potential applications.
Schlosser et al.[1]Schlosser and others, ‘Large-Scale Heat Pumps: Applications, Performance, Economic Feasibility and Industrial Integration’, Renewable and Sustainable Energy Reviews, 133.August (2020), 110219. found that utility water heating, drying, washing, and coating are frequently represented along with cross-sectional space heating and DH because of their positive usability characteristics. Supporting factors for HP integration include feasible temperature, constant heating and cooling demand, and a moderate temperature difference (for example, 20–50 K), as well as spatial proximity and timing of heat sources and sinks.
Utility water is heated using warm water (up to 60°C) or hot water (up to 90°C). This category may include additional washing/cleaning processes that are not further defined by their database.
Washing/cleaning includes washing, rinsing, cleaning, and degreasing. Utility-consuming processes, such as cleaning parts of the production line or washing meat in the food industry, are rather common processes with significant water consumption and high-temperature lift between the low-temperature groundwater and the target temperature of warm or hot water.
Several implementation examples are available for the high-temperature range and steam use. The process of drying is extremely energy-intensive with a wide range of use and temperature requirements[2]Mikkel E. Larsen, Refrigeration: Theory, Technology, and Applications. (Hauppauge N.Y.: Nova Science Publishers, 2011). . Minea[3]Vasile Minea, ‘Overview of Heat-Pump–Assisted Drying Systems, Part II: Data Provided vs. Results Reported’, Drying Technology, 33.5 (2015), 527–40. declared that the process of drying wood, solid agri-food, and bio materials can be typical custom HP-assisted systems providing the latent evaporation enthalpy of water in humid air to preheat drying air to dry industrial starch, paper and brick.
Other applications include thermal preservation processes such as tempering, pasteurisation, cooking, and sterilisation. These applications are limited due to high target temperatures of the heat sink (60°C - 130°C) and using steam as the energy supply medium[4]Matthias Philipp and others, ‘Increasing Energy Efficiency of Milk Product Batch Sterilisation’, Energy, 164 (2018), 995–1010. . The suitability of process bath heating as a heat sink for HPs has been successfully demonstrated for surface treatment such as coating[5]M-M Zimmer, ‘Process- and Plant-Optimised Design, Construction, Planning and Installation Preparation of a Galvanic Hard Chrome Plant: Final Report on a Development Project under Reference Number: 25418-21/2 [German]’, German Federal Environmental Foundation, 2009. .
4.4.4 Barriers to implementing industrial heat pumps
Often, barriers exist that hinder the transition from fossil fuel-based heating to electric heating by means of industrial HPs, which are explained below. Despite the significant environmental potential, there are a number of obstacles that hinder the wider use of industrial high-temperature HPs. The following obstacles have been identified by Arpagaus et al.[6]Cordin Arpagaus and others, ‘High Temperature Heat Pumps: Market Overview, State of the Art, Research Status, Refrigerants, and Application Potentials’, Energy, 152 (2018).or reported in the IEA Annex 35[7]IEA HPT TCP, Annex 35: Application of Industrial Heat Pumps, Final Report, 2014.:
-
Low awareness. Most companies are not aware of the heating and cooling needs of their processes, requiring costly and time-consuming measurements to determine integration feasibility for industrial HPs. Thus, the technical capabilities and economically feasible potential of high-temperature HPs are unknown to end-users;
-
Lack of knowledge. Integrating HPs into industrial processes requires knowing the capabilities of industrial HPs, the process itself, and how to integrate both. Very few installers and decision-makers in the industry possess the knowledge to integrate the HP in the best way possible;
-
Long payback periods. Compared to oil and gas burners, industrial HPs require a relatively large investment. At the same time, companies expect very short payback periods of under 2-3 years. Some companies are willing to accept payback periods of up to 5 years when it comes to investing in their energy infrastructure. To meet these expectations, industrial HPs must have long run times and high COPs to become economically viable. Custom HP designs are especially costly;
-
High temperature applications. Lack of available high-temperature refrigerants with low global warming potential. Many available industrial HPs are limited to a heat sink temperature of 65°C. The theoretical potential of industrial HPs can be significantly increased by developing energy-efficient HPs and environmentally friendly refrigerants for heat sink temperatures of up to and above 100°C;
-
Low energy prices. Competing heating technologies that generate high temperatures using fossil fuels often have low energy prices compared to electricity (depending on the electricity to gas price ratio);
-
Lack of pilot and demo systems;
-
Lack of training and events to further promote the dissemination of high-temperature HP information.
To overcome these obstacles, the IEA has already run a number of programmes aimed at industrial HPs. These programmes include the completed 1990 Annex 9 programme dedicated to High-Temperature Industrial Heat Pumps, the 1992-1996 Annex 21 on the Global Environmental Benefits of Industrial Heat Pumps, and the 2010-2014 Annex 35 on the Application of Industrial Heat Pumps. The 2016-2019 Annex 48 programme on Industrial Heat Pumps (Second Phase) aimed to overcome the existing challenges and obstacles preventing HPs from entering a wider market.
Some of the obstacles can already be overcome, as described in Annex 35, for example, short payback periods (under 2 years), a significant decrease in CO2 emissions (over 50% in some cases), HP supply temperatures above 100°C, while supply temperatures below 100°C are standard.
Footnotes
- ^ Schlosser and others, ‘Large-Scale Heat Pumps: Applications, Performance, Economic Feasibility and Industrial Integration’, Renewable and Sustainable Energy Reviews, 133.August (2020), 110219.
- ^ Mikkel E. Larsen, Refrigeration: Theory, Technology, and Applications. (Hauppauge N.Y.: Nova Science Publishers, 2011).
- ^ Vasile Minea, ‘Overview of Heat-Pump–Assisted Drying Systems, Part II: Data Provided vs. Results Reported’, Drying Technology, 33.5 (2015), 527–40.
- ^ Matthias Philipp and others, ‘Increasing Energy Efficiency of Milk Product Batch Sterilisation’, Energy, 164 (2018), 995–1010.
- ^ M-M Zimmer, ‘Process- and Plant-Optimised Design, Construction, Planning and Installation Preparation of a Galvanic Hard Chrome Plant: Final Report on a Development Project under Reference Number: 25418-21/2 [German]’, German Federal Environmental Foundation, 2009.
- ^ Cordin Arpagaus and others, ‘High Temperature Heat Pumps: Market Overview, State of the Art, Research Status, Refrigerants, and Application Potentials’, Energy, 152 (2018).
- ^ IEA HPT TCP, Annex 35: Application of Industrial Heat Pumps, Final Report, 2014.
Annex 1.
District heating demand and temperatures
Hourly DH supply and return temperatures typically vary throughout the year depending on the ambient temperature. They are higher during colder periods to supply the required heat and lower during warmer periods to reduce heat losses and adapt to decreasing heat demand. An example of DH temperatures measured for an area in Estonia is shown in Figure 90.
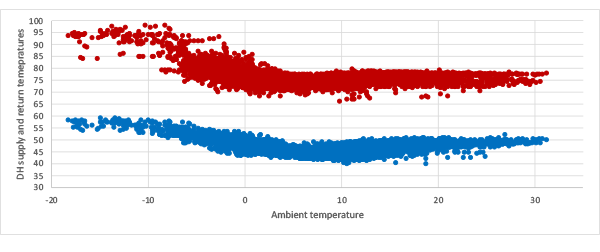
Figure 90. Measured DH supply and return temperatures of a network in Estonia in 2019
The dependency of network temperatures on the ambient temperature can be linearised, as shown, by taking into account the maximum temperature, which is the design temperature, and the minimum temperature that is required to prevent the risk of Legionella contamination in the domestic hot water system. The DH return temperature is a consequence of the required minimum supply temperature and the heat demand. This approach of using a linear dependency of the DH network temperatures on ambient temperatures was used for two sets of design temperatures, as shown in Table 35 and Figure 91. These simplified temperatures were used for modelling based on the classification of the DH area as rural or urban.
| Temperatures, (°C) | Design supply | Design return | Linear supply | Linear return | Minimum supply | Minimum return |
| Urban | 90 | 60 | -1 Tamb + 68 | -0.5 Tamb + 49 | 70 | 50 |
| Rural | 80 | 55 | -1 Tamb + 58 | -0.8 Tamb + 38 | 60 | 40 |
Table 35. DH supply and return temperatures
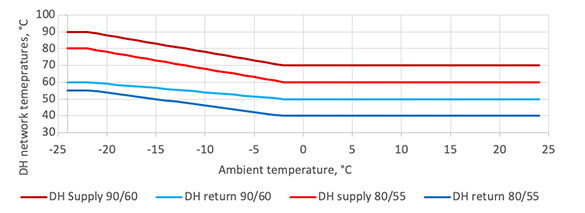
Figure 91. DH supply and return temperatures for two sets of design temperatures
Hourly heat demand profiles were created using the Heating Degree Day (HDD) method[1]Volkova, Anna, Eduard Latošov, Kertu Lepiksaar, and Andres Siirde, ‘Planning of District Heating Regions in Estonia’, International Journal of Sustainable Energy Planning and Management, 27.Special Issue (2020), 5–16., which estimated the required heat demand of the buildings based on the ambient temperature. The following formula was used to calculate the hourly space heating demand, which depends on the ambient temperature[2]Eurostat, ‘Statistics | Eurostat’.:
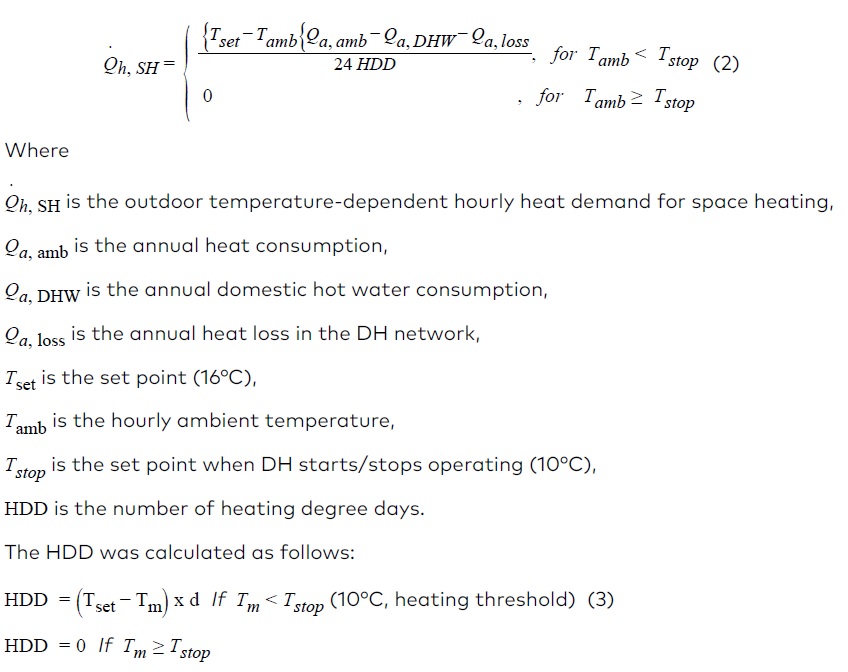
Tm is the mean ambient temperature over a given period of a single day. Hourly ambient temperatures for 2019 for various locations were obtained from the Meteorology Institutes of each Baltic country. An ambient temperature profile of the closest measurement point was used for each DH area.
It was assumed that the annual heat loss in the DH network was evenly distributed throughout the year, which was sufficient for the purposes of the study. Domestic hot water demand was calculated using the tapping profile of a European family with a hot water consumption of 100 L at 60°C[1]Danish Standards Foundation, Heating Systems in Buildings – Method for Calculation of System Energy Requirements and System Efficiencies – Part 3-1: Domestic Hot Water Systems, Characterisation of Needs (Tapping Requirements), 2007.. A normal distribution with a standard deviation of 120 min was applied to account for the different behaviour of residents when considering a large number of houses, as shown in Figure 92.
Footnotes
- ^ Danish Standards Foundation, Heating Systems in Buildings – Method for Calculation of System Energy Requirements and System Efficiencies – Part 3-1: Domestic Hot Water Systems, Characterisation of Needs (Tapping Requirements), 2007.
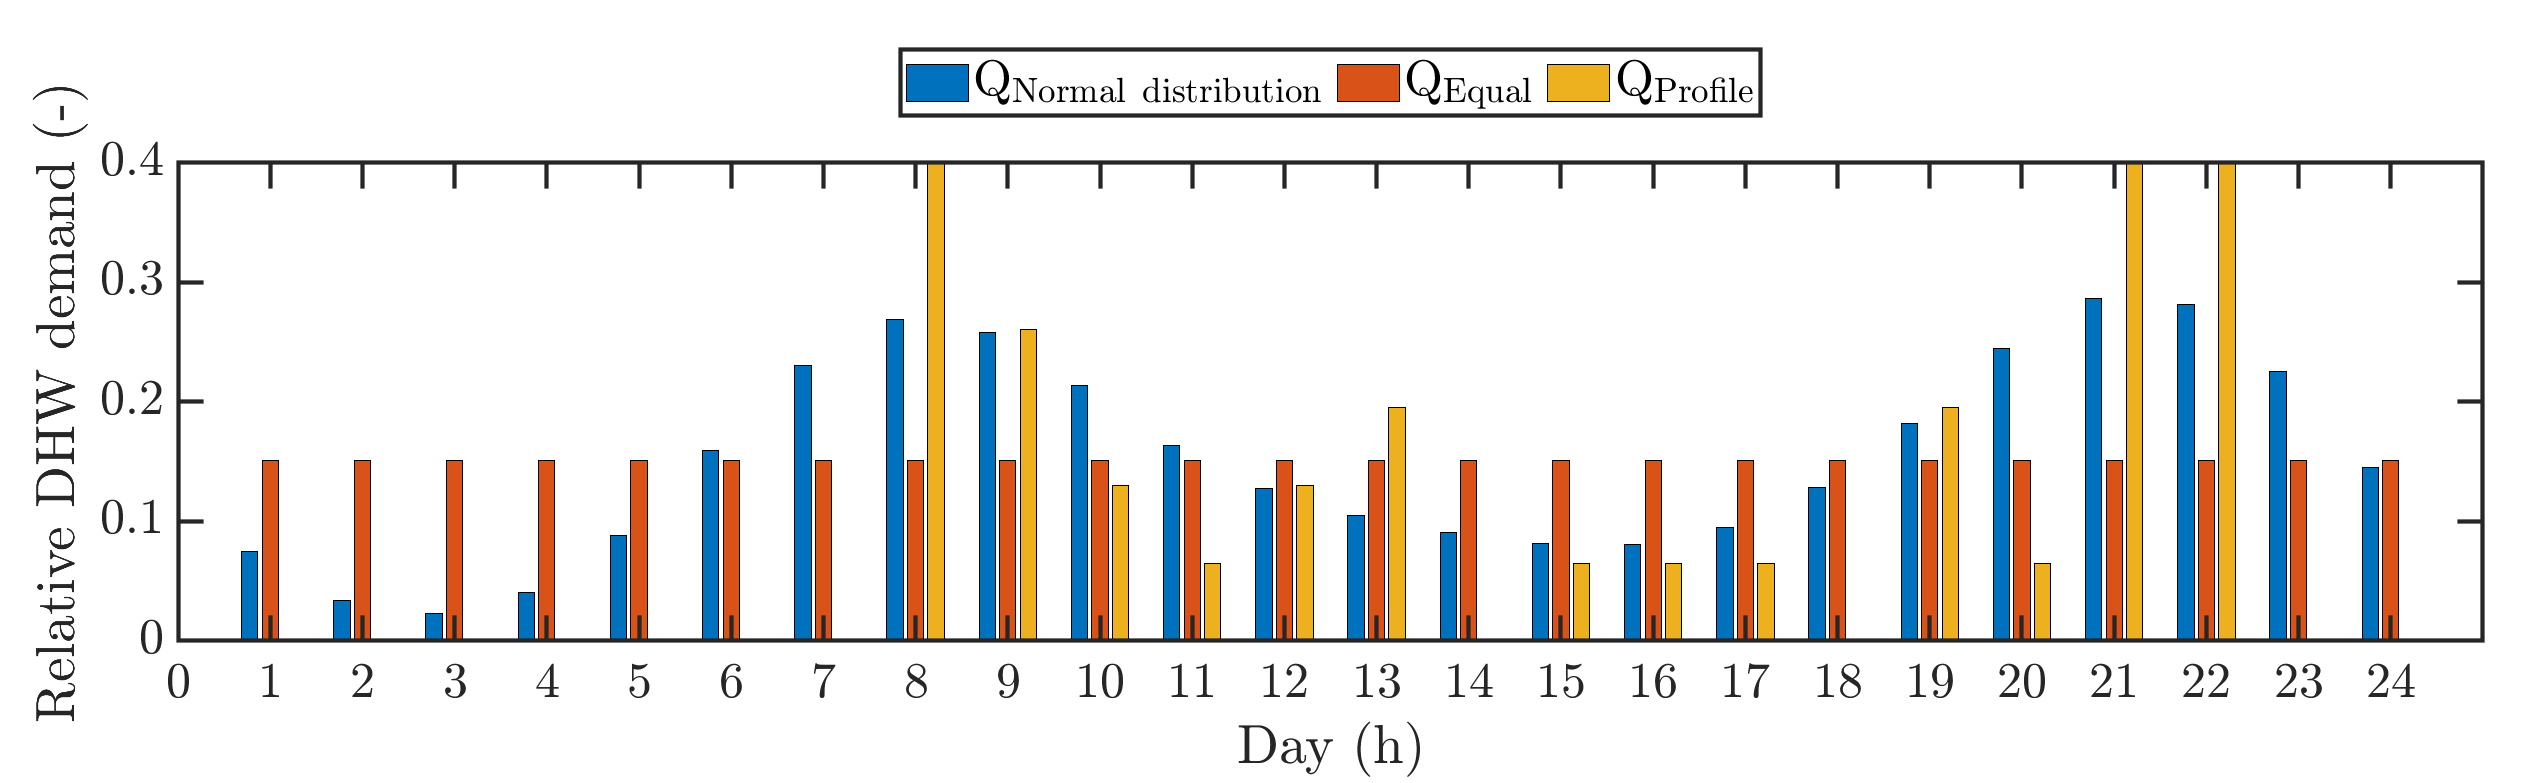
Figure 92. Domestic hot water demand for a single day
This resulted in two moderate consumption peaks in the morning and evening and low demand during the day and at night, which may be more representative than the assumption of continuous distribution throughout the day. In addition, seasonal fluctuations in domestic hot water consumption were taken into account as per Frederiksen and Werner[1]Svend. Frederiksen and Sven. Werner, District Heating and Cooling (Studentlitteratur AB, 2013). . Their findings are based on measurements taken in apartment buildings in Sweden. The relative hot water flow demand for each month that was used for the calculations performed in this study is given in Table 36.
Footnotes
- ^ Svend. Frederiksen and Sven. Werner, District Heating and Cooling (Studentlitteratur AB, 2013).
| Month | Jan | Feb | Mar | Apr | May | Jun | Jul | Aug | Sep | Oct | Nov | Dec |
| Factor | 1.1 | 1.1 | 1.1 | 1.1 | 0.9 | 0.85 | 0.7 | 0.75 | 1 | 1 | 1.1 | 1.1 |
Table 36. Relative hot water flow demand
Consequently, hourly heat demand profiles were created by taking into account the space heating demand, domestic hot water demand, and the DH heat loss. Examples of the profiles created are given in Figure 93 and Figure 94.
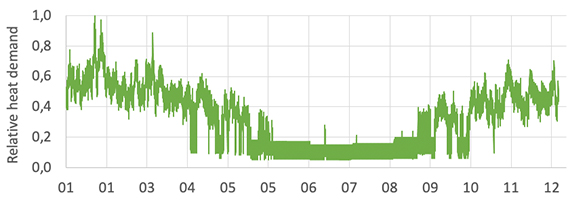
Figure 93. Relative hourly heat demand profiles
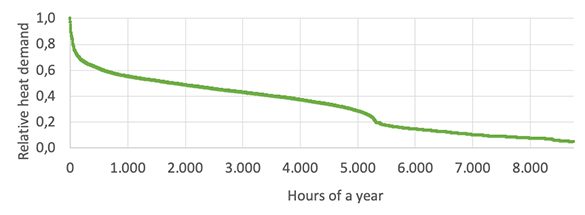
Figure 94. Load duration curve of relative hourly heat demand profiles
Annex 2.
Modelling methodology
This section provides an overview of the details of modelling. A brief overview of the mechanics of the Balmorel model is also given. The core Balmorel model has been expanded to include additional details regarding DH supply. Relevant model additions have also been described in the section below.
The Balmorel Model
Balmorel[1]The Balmorel Open Source Project. is an electricity market model written in GAMS. It was developed as part of the Balmorel project in 2001 to depict the energy systems of the Baltic Sea region. Due to the geographic nature of the Baltic Sea region, the model also shows the supply and demand for heat in DH networks in significant detail. Since the creation of the model, various add-ons have been developed to keep up with changing energy systems, such as an option to model electricity demand based on electric vehicles, demand response, and hydrogen generation.
Model inputs cover the electricity and DH infrastructure: available generation capacities and their technical characteristics, transmission capacities, fuel prices, fuel availability, policy measures concerning power and heat generation, as well as power and DH needs.
The outputs of the model cover the utilisation of energy generation possibilities, dispatch, fuel use, marginal prices, transmission flows, and new generation capacities. With basic output, many parameters can be calculated and monitored, such as various system costs, energy balances, and emissions.
The model solution and corresponding output are found by optimising and identifying the least-cost solution according to user-defined limits and input parameters. Thus, the model will always use the most competitive options to meet demand.
Detailed modelling of district heating
To achieve a detailed display of the collected data on DH networks in the Baltic countries, the functionality of the model has been expanded to include new details. New details were included only for the three Baltic countries, the rest of the modelled countries use standard inputs for their DH models.
The previous modelling methodology allowed to model DH in sufficient detail to capture the competition between cogeneration power plants, boiler houses, etc. However, when the use of HPs in a DH network reaches a significant proportion, an accurate display of COP becomes much more relevant. In addition, some of the available heat sources that were investigated in this study do not have a stable heat source output throughout the year. For example, the availability of some heat sources may depend on actual industrial activities. Therefore, it was necessary to add more details to the model.
Footnotes
- ^ The Balmorel Open Source Project.
The goal was to improve cost assumptions and HP COP assumptions, as well as set variable limits throughout the year.
Input data
Various parameters associated with the production of DH generation are already included in the core Balmorel model. The main parameters are as follows:
-
Annual heat demand per area
-
Hourly demand profile for one chosen year
-
Existing generation capacity of conventional generation and their technical characteristics
-
Technology type
-
Fuel type
-
Efficiency
-
Expected lifetime
-
-
Available technologies for new investments in energy generation
As a result of the development of the model in this study, additional details can be added to the model input. For a DH network, the supply and return temperatures for the network can be specified and calculated on an hourly basis for the purposes of the study.
For each heat source available for a specific DH network, several new data points are included:
-
Heat source temperature
-
Hourly COP values calculated based on heat source temperature, HP design characteristics, and DH network temperature
-
Hourly maximum available energy of the heat source
In addition to the new details added to the model, the costs for new HP solutions to utilise the described heat sources are calculated as input to the model based on detailed analysis. Various cost components were included in the overall installation cost analysis, such as costs associated with HPs and piping to access the heat source, and more.
As a result, the model has a detailed overview of some the most critical HP operating parameters: COP variation due to temperature changes in the heat source and DH network, and change in heat source availability due to process activity.
Annex 3.
Baltic energy systems in the Nordic and Baltic energy markets
Estonia is the only country in the world where oil shale is the primary energy source and the dominant fuel in the energy mix. On the one hand, such a high consumption of oil shale as a local fuel ensures a high level of energy security. On the other hand, it is a highly carbon-intensive fuel, which is why oil shale-based energy production processes emit large quantities of GHG that have a negative impact on the environment. This makes Estonia’s economy more than twice as carbon dioxide (CO2) intensive as the EU average. In order to significantly reduce CO2 emissions and the negative impact on the environment, the Estonian government is phasing out old power plants and developing new technologies. Electricity generation in Estonia is slightly higher than consumption, so it exports electricity. In 2019, the total electricity production in Estonia was 7615 TWh, whereas the total demand for electricity was 8.257 TWh. More than half of electricity was generated using oil shale (56%), followed by biomass (17%), wind (9%), and renewable waste (1%) power plants. 2704 TWh of electricity was exported to Latvia (76%) and Finland (24%)[1]Juozas Augutis and others, ‘Analysis of Energy Security Level in the Baltic States Based on Indicator Approach’, Energy, 199 (2020). .
In Latvia, RES have the dominant share in total electricity production, mainly from hydropower (33%), biomass (9%), biogas (5%), and wind (2%). The rest of the 6438 TWh of electricity generated in 2019 came from fossil fuels. Since the total demand for electricity in 2019 was 7297 TWh, the rest of the electricity (12%) was imported, mainly from Estonia (58%) and Russia (24%). Heat production is also mainly dependent on natural gas. Since Latvia does not have its own resources, all natural gas consumed is imported from a single source - Russia. Unlike the other Baltic states, Latvia operates the Inčukalns Underground Gas Storage Facility, which ensures the stability of regional natural gas supply. Natural gas is injected into the storage facility in summer when consumption is low, and gas is supplied during the heating season. Due to its powerful hydropower production, Latvia is one of the leading countries in the EU in terms of the share of RES.[2]uozas Augutis and others, ‘Analysis of Energy Security Level in the Baltic States Based on Indicator Approach’, Energy, 199 (2020).
Significant changes in the Lithuanian energy system occurred at the end of 2009 after the closure of the Ignalina Nuclear Power Plant. This radically changed the energy resource structure, and all of a sudden the country went from exporting electricity to importing electricity. This event increased its energy dependence on Russia not only in terms of electricity imports, but also in terms of its dependence on natural gas imports, as the production of electricity from gas-fired power plants also increased. In 2019, the total production of electricity in Lithuania was 3971 TWh. The largest part of electricity was generated using wind (48%), hydropower (31%), and natural gas (17%). However, the total demand for electricity in Lithuania in 2016 was 11409 TWh. This means that 73% of the electricity consumed was imported, in particular, from Latvia (25%), Russia (21%), Sweden (27%), Poland (3%), and Belarus (24%). At the end of 2015, two new transmission lines were put into operation, a 500 MW LitPol Link with Poland and a 700 MW NordBalt with Sweden. Until 2015, Lithuania relied on a single source of natural gas supplies from Russia. However, the diversification of gas supplies was achieved by introducing a liquefied natural gas (LNG) terminal in Klaipėda at the end of 2014. This made it possible to create a natural gas market in Lithuania and reduce natural gas prices in the country and, most importantly, strengthen national energy security[3]uozas Augutis and others, ‘Analysis of Energy Security Level in the Baltic States Based on Indicator Approach’, Energy, 199 (2020)..
All three Baltic states are making efforts to desynchronise from the Russian electricity grid and synchronise with the electricity grid of Western Europe. This should be completed by 2025. Another discussed goal is to become climate neutral by 2050, and to achieve this, all three Baltic states must increase their RES capacities.
Although all three Baltic countries have fairly similar climatic conditions and natural resources for electricity production using RES, there are significant differences in the volume of RES in these countries.
Comparing RES capacities in the three Baltic countries, it can be noted that most of the hydropower is located in Latvia, solar energy develops the fastest in Lithuania, and wind power is more appealing in Estonia and Lithuania, while biofuel is more common in Estonia and Latvia[4]Litgrid, AST, and Elering, ‘Review of RES Perspective in Baltic Countries till 2030’, 2015. .
The largest RES capacity in Estonia is the 48 MW Aulepa wind power plant, which is actually the largest wind power plant in the Baltics. The wind power plants (303 MW in total) are located onshore on the north-east and north-west and west of Estonia. There are no offshore wind parks in Estonia yet. The largest CHP plants are Tartu CHP and Tallinn CHP with a capacity of 25 MW each. Biofuel capacities are mainly CHP plants and are therefore more likely to be scattered across Estonia near cities that facilitate heat consumption. There are 102 MW of biomass fuelled, 17 MW of waste fuelled and 11 MW of biogas fuelled capacities connected to the grid[5]Litgrid, AST, and Elering, ‘Review of RES Perspective in Baltic Countries till 2030’, 2015.
380. Litgrid, AST, and Elering, ‘Review of RES Perspective in Baltic Countries till 2030’, 2015..
The highest type of RES in Latvia is run-of-the-river hydropower plants. It is a hydro-cascade located on the Daugava River and it includes three power plants: Plavinas hydropower plant (HPP) (installed capacity of 894 MW), Kegums HPP (266 MW), and Riga HPP (402 MW). Wind parks are mainly located in the western part of Latvia, close to the shore. The possible development of wind parks can be observed close to the shore throughout Latvia. Currently, the installed capacity of wind power is about 67 MW. The future development of wind parks depends on RES legislation and subsidy schemes in Latvia. A high potential for RES development is observed in the field of Biomass and Biogas. Currently, the installed capacity for Biomass and Biogas is 97 MW[6]Litgrid, AST, and Elering, ‘Review of RES Perspective in Baltic Countries till 2030’, 2015..
Footnotes
- ^ Juozas Augutis and others, ‘Analysis of Energy Security Level in the Baltic States Based on Indicator Approach’, Energy, 199 (2020).
- ^ uozas Augutis and others, ‘Analysis of Energy Security Level in the Baltic States Based on Indicator Approach’, Energy, 199 (2020).
- ^ uozas Augutis and others, ‘Analysis of Energy Security Level in the Baltic States Based on Indicator Approach’, Energy, 199 (2020).
- ^ Litgrid, AST, and Elering, ‘Review of RES Perspective in Baltic Countries till 2030’, 2015.
- ^ Litgrid, AST, and Elering, ‘Review of RES Perspective in Baltic Countries till 2030’, 2015.
380. Litgrid, AST, and Elering, ‘Review of RES Perspective in Baltic Countries till 2030’, 2015. - ^ Litgrid, AST, and Elering, ‘Review of RES Perspective in Baltic Countries till 2030’, 2015.
The largest biofuel power plants in Lithuania are Fortum Klaipėda with a capacity of 20 MW and 11 MW Siauliai CHP. In addition, waste-to-energy CHP plants operate in Vilnius (100 MWel) and Kaunas (24 MWel). As for the HPP, the largest and only one connected to the transmission network is Kaunas HPP. All wind generation facilities in Lithuania are located onshore. The vast majority of existing wind parks connected to the transmission network are located in the western part of Lithuania, in the Baltic coastal region. The capacity of the largest wind park is 50 MW[1]Litgrid, AST, and Elering..
Footnotes
- ^ Litgrid, AST, and Elering.
Annex 4.
Assumptions for calculating the cost of individual HPs
Investments and installation costs for individual air-source and ground-source HPs were based on[1]Danish Energy Agency and Energinet, ‘Technology Data for Individual Heating Installations’, 2016, p. 166.. The investment period was 20 years at 5% interest. No discounting has been made. The annual heat demand was 7.5 MWh, 15 MWh, 300 MWh, and 600 MWh for new homes, existing homes, old apartment buildings, and new apartment buildings, respectively.
Electricity costs were based on yearly prices for 2020 and annual electricity consumption between 5000 kWh and 15000 kWh.
The investments were as follows:
-
Air-source HP, new building: €7000/unit
-
Air-source HP, existing building: €9400/unit
-
Air-source HP, new apartment building: €71000/unit
-
Air-source HP, existing apartment building: €141000/unit
-
Ground-source HP, new building: €11000/unit
-
Ground -source HP, existing building: €15000/unit
-
Ground -source HP, new apartment building: €89000/unit
-
Ground -source HP, existing apartment building: €249000/unit
The peak heat demand was as follows:
-
New/existing building: 4/10 kW
-
New/existing apartment building: 160/400 kW
The following values were used to calculate emissions from individual boilers:
Footnotes
- ^ Danish Energy Agency and Energinet, ‘Technology Data for Individual Heating Installations’, 2016, p. 166.
| Parameter | Unit | Natural gas boiler | Oil burner | Biomass boiler |
| Efficiency | - | 0.97 | 0.92 | 0.82 |
| CO2 | gCO2/kWh of the energy carrier | 198 | 280 | 387 |
| SO2 | g/GJ of the energy carrier | 0 | 0,5 | 25 |
| NOx | g/GJ of the energy carrier | 10 | 25 | 70 |
| CH4 | g/GJ of the energy carrier | 1 | 0 | 2 |
| N2O | g/GJ of the energy carrier | 0 | 0 | 4 |
Table 37. Emissions for various individual fuel-based boilers
List of reference
Acciona, ‘Deep Lake Water Cooling System’, 2004
Albertus, Paul, Joseph S. Manser, and Scott Litzelman, ‘Long-Duration Electricity Storage Applications, Economics, and Technologies’, Joule, 4.1, 2020, 21–32
Ben Amer, Sara, Rasmus Bramstoft, Olexandr Balyk, and Per Sieverts Nielsen, ‘Modelling the Future Low-Carbon Energy Systems-Case Study of Greater Copenhagen, Denmark’, International Journal of Sustainable Energy Planning and Management, 24 2019, 21–32
Ammonia21, ‘5 MW Ammonia Heat Pump to Warm Copenhagen’, 2019
Arabzadeh, Vahid, Sannamari Pilpola, and Peter D. Lund, ‘Coupling Variable Renewable Electricity Production to the Heating Sector through Curtailment and Power-to-Heat Strategies for Accelerated Emission Reduction’, Future Cities and Environment, 5.1 2019, 1–10
Arpagaus, Cordin, Frédéric Bless, Michael Uhlmann, Jürg Schiffmann, and Stefan S. Bertsch, ‘High Temperature Heat Pumps: Market Overview, State of the Art, Research Status, Refrigerants, and Application Potentials’, Energy, 152 , 2018
AS Tallinna Vesi, ‘Personal Communication with Mattias Müür’, 2018
Augutis, Juozas, Ričardas Krikštolaitis, Linas Martišauskas, Sigita Urbonienė, Rolandas Urbonas, and Aistė Barbora Ušpurienė, ‘Analysis of Energy Security Level in the Baltic States Based on Indicator Approach’, Energy, 199, 2020
Ayub, Zahid, ‘World’s Largest Ammonia Heat Pump (14 MWh) for District Heating in Norway—A Case Study’, Heat Transfer Engineering, 2016
Bach, Bjarne, ‘Integration of Heat Pumps in Greater Copenhagen’, 2014
Bach, Bjarne, Jesper Werling, Torben Ommen, Marie Münster, Juan Miguel Morales, and Brian Elmegaard, ‘Integration of Large-Scale Heat Pumps in the District Heating Systems of Greater Copenhagen’, Energy, 107, 2016, 321–34
Baltic Environmental Forum Latvia, Heat Pump Use for Heat Supply of Buildings (in Latvian), 2011
Bernath, Christiane, Gerda Deac, and Frank Sensfuß, ‘Impact of Sector Coupling on the Market Value of Renewable Energies – A Model-Based Scenario Analysis’, Applied Energy, 281, 2021
Berntsson, Thore, ‘Heat Sources - Technology, Economy and Environment’, International Journal of Refrigeration, 25.4 , 2002, 428–38
Biznesalert, ‘Offshore Wind May Connect the Baltic States and Benefit Poland’, 2020
Bless, Frédéric, Cordin Arpagaus, Stefan S. Bertsch, and Jürg Schiffmann, ‘Theoretical Analysis of Steam Generation Methods - Energy, CO2 Emission, and Cost Analysis’, Energy, 129, 2017, 114–21
Bloess, Andreas, ‘Impacts of Heat Sector Transformation on Germany’s Power System through Increased Use of Power-to-Heat’, Applied Energy, 239., 2018, 560–80
Bloess, Andreas, Wolf-Peter Schill, and Alexander Zerrahn, ‘Power-to-Heat for Renewable Energy Integration: A Review of Technologies, Modeling Approaches, and Flexibility Potentials’, Applied Energy, 212, 2018
Boesten, Stef, Lukas Weimann, Stefan Dekker, and Matteo Gazzani, ‘Water to Water Heat Pump for District Heating : Modeling for MILP’, in 6th International Conference on Smart Energy Systems, 2020
Bompard, E., E. Carpaneto, T. Huang, R.J. Pi, G. Fulli, A. Purvins, and others, ‘Electricity Independence of the Baltic States: Present and Future Perspectives’, Sustainable Energy, Grids and Networks, 10, 2017
‘Borehole Information Portal (in Estonian)’, 2018
Brückner, Sarah, ‘Industrial Excess Heat in Germany (German)’, Technical University of Munich, 2016
Bühler, Fabian, ‘Energy Efficiency in the Industry: A Study of the Methods, Potentials and Interactions with the Energy System’, 2018
Bühler, Fabian,, ‘Personal Communication’, 2020
Bühler, Fabian, Stefan Petrović, Fridolin Müller Holm, Kenneth Karlsson, and Brian Elmegaard, ‘Spatiotemporal and Economic Analysis of Industrial Excess Heat as a Resource for District Heating’, Energy, 2018
Bühler, Fabian, Stefan Petrovic, Kenneth Bernard Karlsson, and Brian Elmegaard, ‘Industrial Excess Heat for District Heating in Denmark’, Applied Energy, 205, 2017, 991–1001
Central Statistical Bureau of Latvia, ‘Densely Populated Areas (Experimental Statistics)’, 2019
Central Statistical Bureau of Latvia,, ‘ENG120. Fuel Consumption and Heat Produced in Heat Plants’, 2020
Central Statistical Bureau of Latvia,, ‘ENG150. Fuel Consumption, Heat and Electricity Produced in Combined Heat and Power Plants’, 2020
Central Statistical Bureau of Latvia, ‘Maps and Spatial Data’, 2019
Centralas statistikas parvaldes datubazes, ‘Centralas Statistikas Parvaldes Datubazes’, 2020
Connolly, D., H. Lund, and B. V. Mathiesen, ‘Smart Energy Europe: The Technical and Economic Impact of One Potential 100% Renewable Energy Scenario for the European Union’, Renewable and Sustainable Energy Reviews, 60, 2016, 1634–53
Connolly, David, Henrik Lund, Bernd Mathiesen, Brian Vad Østergaard, Poul Alberg Møller, Steffen Nielsen, Iva Ridjan Skov, Frede Kloster Hvelplund, and others, ‘Smart Energy Systems: Holistic and Integrated Energy Systems for the Era of 100% Renewable Energy’, 2013
Connolly, David, Briad Vad Mathiesen, Poul Alberg Østergaard, Bernd Møller, Steffen Nielsen, Henrik Lund, and others, Heat Roadmap Europe 2050 - Second Prestudy, Aalborg University, 2013
COWI A/S, ‘Initial Assessment of Hydrogeological Conditions - Outer Nordhavn (in Danish)’, 2015
CPH City and Port Development, ‘CPH 2025 Climate Plan’, 2012
CTR, HOFOR, and VEKS, ‘Heat Planning for the Greater Copenhagen Area (in Danish)’, 2014
Dagilis, Vytautas, and Liutauras Vaitkus, ‘Combined Heat Pump and Water-Power Plant at Kaunas Lagoon’, 9th International Conference on Environmental Engineering, ICEE 2014, May, 2014
Danish board of district heating, Copenhagen’s District Heating Is Now 53percent CO2 Neutral, 2015
Danish Centre for Environment and Energy, ‘Runoff in Danish Rivers Technical Report from NERI, No. 340’, 2000
Danish Commission on Climate Change Policy, Documentation for the Report of the Danish Commission on Climate Change Policy, Copenhagen, Denmark, 2010
Danish District Heating Association, ‘Danish District Heating Association’, 2020
Danish District Heating Association,Cooling Plan of Denmark of the Danish District Heating Association (in Danish), 2016
Danish District Heating Association,, ‘Statistik 2013/2014 Benchmarking 2014’, 2014
Danish Energy Agency, ‘District Heating Companies Recieve 23 Mio. Danish Crowns for Large-Scale Heat Pumps (in Danish)’, 2017
Danish Energy Agency, ‘Energy Scenarios for 2020, 2035 and 2050 (Danish)’, 2014
Danish Energy Agency, ‘Guide for Large-Scale Heat Pump Projects in District Heating Systems (in Danish)’, 2017
Danish Energy Agency, ‘Inspiration Catalogue for Large-Scale Heat Pump Projects in District Heating’, (in Danish) 2017
Danish Energy Agency, ‘Large Heat Pumps in District Heating Systems (in Danish)’, 2016
Danish Energy Agency, and Energinet, ‘Technology Data - Generation of Electricity and District Heating’, 2020, 414
Danish Energy Agency, ‘Technology Data for Individual Heating Installations’, 2016, p. 166
Danish Environmental Protection Agency, ‘Flooding Database’, 2019
Danish Ministry of Environment and Food, ‘Water Area Planning (in Danish)’, 2019
Danish Standards Foundation, Heating Systems in Buildings – Method for Calculation of System Energy Requirements and System Efficiencies – Part 3-1: Domestic Hot Water Systems, Characterisation of Needs (Tapping Requirements), 2007
Danish Technological Institute, ‘Affaldsvarme Aarhus’, 2020
Danish Utility Regulator, ‘Heat Prices’, 2018
Dansk Fjernvarme, ‘Danish District Heating Association’, 2017
David, Andrei, Brian Vad Mathiesen, Helge Averfalk, Sven Werner, and Henrik Lund, ‘Heat Roadmap Europe : Large-Scale Electric Heat Pumps in District Heating Systems’, Energies, 2017, 1–18
District heating Fyn, ‘Green Transition of District Heating’, 2019
Ekodoma, Data Collection and Analysis Required for Heat Supply Planning. District Heating Long-Term Tendencies till 2030. (in Latvian), 2015
Elering, ‘Estonian Long-Term Power Scenarios’, 2014
Energinet.dk, ‘Current Tariffs (In Danish)’
Energylab Nordhavn, ‘Delivery No.: D5.2a Criteria for Selecting between Large Heat Pumps for District and Small Heat Pumps for Individual Buildings’, 2019
Enova, ‘Study of the Potentials for the Utilisation of Excess Heat from the Norwegian Industry (In Norwegian: Potensial for Energieffektivisering i Norsk Landbasert Industri)’, 2009
‘Environmental Information System KOTKAS’
Environmental Investment Center, ‘Data System KIKAS’
Ernstsen, S. K., A. Dyrelund, and T. K. E. Barky, ‘District Cooling - a Natural Part of Future Cities’, 2013
Eser, P., N. Chokani, and R. Abhari, ‘Trade-Offs between Integration and Isolation in Switzerland’s Energy Policy’, Energy, 150, 2018, 19–27
ESRI, ‘ArcGIS Pro’
‘Estonia’s 2030 National Energy and Climate Plan’, 2019
Estonian Chemical Industry Association, ‘Kiviõli Keemiatööstuse OÜ’, 2019
‘Estonian Competition Authority’, 2020
‘Estonian Competition Authority’, ‘Limits of Heat Production Costs Agreed with the Estonian Competition Authority(in Estonian)’, 2020
Estonian Land Board, ‘Administrative and Settlement Units’, 2020
Estonian Land Board, ‘Waterbodies’, 2020
Estonian Ministry of Economic Affairs and Communications, ‘Estonia and Latvia Signed an Agreement on the Pre-Development of a Joint Offshore Wind Farm (in Estonian)’, 2020
Estonian Ministry of Economic Affairs and Communications, ‘Estonia Is Starting to Apply for a State Aid Permit to Differentiate the Renewable Energy Fee for Large Consumers’, 2020
Estonian Ministry of Economic Affairs and Communications, ‘The Government Approved Lower Bids for Green Electricity’, 2020
Estonian Weather Service, ‘Our Services’, 2020
Euroheat & Power, ‘Fortum to Build Second District Cooling Plant in Tartu’
Euroheat & Power, ‘Possibilities with More District Cooling in Europe’, 2006
Euroheat & Power, ‘Tartu: The First District Cooling Solution in the Baltics’
Euroheat & Power, The European Heat Market, Final Report, Work Package 1 Deliverable of Ecoheatcool EU Project, 2006
Euroheat and Power, ‘District Energy in Latvia’, 2020
Euroheat & Power, ‘District Heating and Cooling. Country by Country 2015 Survey’, 2015
Euroheat & Power, ‘District Heating in Lithuania’, 2020
European Commission, ‘2030 Climate & Energy Framework’, 2020
European Commission, ‘EU Reference Scenario 2016 Energy, Transport and GHG Emissions Trends to 2050’, 2016
European Environment Agency, ‘Greenhouse Gas Emission Intensity of Electricity Generation’, 2020
European Environment Agency, ‘Urban Waste Water Treatment Map’, 2019
European Heat Pump Association. European Heat Pump Market and Statistics Report 2018. s.l. : European Heat Pump Association, 2018
Eurostat, ‘Cooling and Heating Degree Days by Country - Annual Data’, 2020
Eurostat, ‘Electricity Prices for Household Consumers - Bi-Annual Data (from 2007 Onwards)’, 2020
Eurostat, ‘Share of Energy from Renewable Sources’, 2020
Eurostat, ‘Statistics Eurostat’, 2020
Fleckl, T, C Ramerstorfer, A Hammerschmid, T Ciepiela, K Ochsner, T Lachmair, and others, ‘Integration Einer Hochtemperaturwärmepumpe Mit Direktverdampfung Zur Wärmerückgewinnung in Einer Rauchgaskondensationsanlage Einer Biomasseverbrennungsanlage’, Deutsche Kälte- Und Klimatagung, 2014, 19–21
Fortum, ‘Fortum Considers Possible Strategic Options for Its District Heating Businesses in Joensuu, Finland and in Pärnu and Tartu, Estonia’, 2019
Fortum, ‘Fortum in Estonia’, 2020
Fortum, ‘Fortum Starts Construction of the First Cooling Plant in Pärnu’, 2018
Fortum Tartu, ‘Anne Soojus Production Plants’, 2018
Frederiksen, Svend., and Sven. Werner, District Heating and Cooling (Studentlitteratur AB, 2013)
Friotherm AG, ‘Värtan Ropsten – The Largest Sea Water Heat Pump Facility Worldwide , with 6 Unitop ® 50FY and 180 MW Total Capacity’, 2017
Gang, Wenjie, Shengwei Wang, Fu Xiao, and Dian Ce Gao, ‘District Cooling Systems: Technology Integration, System Optimization, Challenges and Opportunities for Applications’, Renewable and Sustainable Energy Reviews, 53, 2016, 253–64
Grosse, R., B. Christopher, W. Stefan, R. Geyer, and S. Robbi, ‘Long Term (2050) Projections of Techno-Economic Performance of Large-Scale Heating and Cooling in the EU’, Publications Office of the European Union, 2017
Groundwater Comission (Estonia), ‘Use and Protection of Estonian Groundwaters’, 2004
Gür, Turgut M., ‘Review of Electrical Energy Storage Technologies, Materials and Systems: Challenges and Prospects for Large-Scale Grid Storage’, Energy & Environmental Science, 2018, 2696–2767
Guzs, Dmitrijs, ‘Effects of Potential EU-Wide Heating Sector CO2 Emission Trading Scheme on Heating Energy Prices and CO2 Emissions of Latvian Households’, in 2019 IEEE 7th IEEE Workshop on Advances in Information, Electronic and Electrical Engineering (AIEEE) , IEEE, 2019
Häkämies, Suvi, Jussi Hirvonen, Juha Jokisalo, Antti Knuuti, Risto Kosonen, Tuomo Niemelä, and others, ‘Heat Pumps in Energy and Cost Efficient Nearly Zero Energy Buildings in Finland’, 2015
Hedegaard, Karsten, and Olexandr Balyk, ‘Energy System Investment Model Incorporating Heat Pumps with Thermal Storage in Buildings and Buffer Tanks’, Energy, 63, 2013, 356–65
Hoffman, Kenneth, ‘Large Scale Heat Pumps for High Efficiency District Heating Projects’, IOR, 2018
HOFOR, ‘District Heating in Copenhagen: Energy-Efficient, Low-Carbon, and Cost-Effective’, 2016
Hotmaps, ‘Hotmaps: D2.3 WP2 Report – Open Data Set for the EU28’, 2019
Hotmaps, ‘Hotmaps Online GIS-Tool’
Hotmaps, ‘Space Cooling Needs Density Map of Buildings in EU28 + Switzerland, Norway and Iceland for the Year 2015’, 2019
Huang, Baijia, Fabian Bühler, and Fridolin Müller Holm, ‘Industrial Energy Mapping: THERMCYC WP6’, Technical University of Denmark, 2015
Hubeck-Graudal, Helga, ‘Feasibility of Using the Copenhagen Drinking Water Supply as a Heat Source in the District Heating Network’, February, 2015
IEA (International Energy Agency), ‘Countries and Regions’, 2020
IEA HPT TCP, Annex 35: Application of Industrial Heat Pumps, Final Report, 2014
IEA HPT TCP, ‘ANNEX 48: Industrial Heat Pumps. Map of Case Studies’, 2020
International Energy Agency, Heating without Global Warming-Market Developments and Policy Considerations for Renewable Heat, 2014
International Energy Agency, and Nordic Energy Research, ‘Nordic Energy Technology Perspectives 2016’, 2016
IRENA, Innovation Landscape Brief: Renewable Power-to-Heat, 2019
Januševičius, Karolis, and Giedre Streckiene, ‘Solar Assisted Ground Source Heat Pump Performance in Nearly Zero Energy Building in Baltic Countries’, Environmental and Climate Technologies, 11.1, 2013, 48–56
Jensen, Jonas K., Torben Ommen, Wiebke Brix Markussen, and Brian Elmegaard, ‘Design of Serially Connected Ammonia-Water Hybrid Absorption-Compression Heat Pumps for District Heating with the Utilisation of a Geothermal Heat Source’, Energy, 137, 2017, 865–77
Jensen, Jonas K, Torben Ommen, Pernille H Jørgensen, Lars Reinholdt, Wiebke B Markussen, and Brian Elmegaard, ‘Heat Pump COP , Part 2 : Generalized COP Estimation of Heat Pump Processes’, In Proceedings of The13th IIR-Gustav Lorentzen Conference on Natural Refrigerants International Institute of Refrigeration, 2018, 1–8
Jonynas, Rolandas, Egidijus Puida, Robertas Poškas, Linas Paukštaitis, Hussam Jouhara, Juozas Gudzinskas, and others, ‘Renewables for District Heating: The Case of Lithuania’, Energy, 211, 2020
Kazjonovs, Janis, Andrejs Sipkevics, Andris Jakovics, Andris Dancigs, Diana Bajare, and Leonards Dancigs, ‘Performance Analysis of Air-to-Water Heat Pump in Latvian Climate Conditions’, Environmental and Climate Technologies, 14.1, 2014, 18–22
Kontu, K., S. Rinne, and S. Junnila, ‘Introducing Modern Heat Pumps to Existing District Heating Systems – Global Lessons from Viable Decarbonizing of District Heating in Finland’, Energy, 166 2019, 862–70
Korsakaite, Diana, Darius Bieksa, and Egle Bieksiene, ‘Third-Party Access in District Heating: Lithuanian Case Analysis’, Competition and Regulation in Network Industries, 19, 2019, 218–41
Kredex, ‘Foundation KredEx Annual Report 2019’, 2019
Krupenski, Igor, ‘District Cooling System Operation in Cold Climates with Existing District Heating Networks’, Smart Energy Systems Confernce, 2020
Lake, Andrew, Behanz Rezaie, and Steven Beyerlein, ‘Review of District Heating and Cooling Systems for a Sustainable Future’, Renewable and Sustainable Energy Reviews, 67 2017, 417–25
Larsen, Mikkel E., Refrigeration: Theory, Technology, and Applications. (Hauppauge N.Y.: Nova Science Publishers, 2011
Latõšov, Eduard, Anna Volkova, Andres Siirde, Jarek Kurnitski, and Martin Thalfeldt, ‘Primary Energy Factor for District Heating Networks in European Union Member States’, Energy Procedia, 116, 2017, 69–77
Latvenergo, "Europe is for heat pumps (in Latvian) 2018, 24–30.
Latvian Environment Geology and Meteorology Centre, ‘Data Search’, 2020
Latvian ministry of Energy, ‘National Energy and Climate Plan of Latvia 2021-2030’, 2018
Latvian Public Utilities Commission, ‘Tariffs for Heat Supply Services in Latvia’, 2020
Lauka, Dace, Julija Gusca, and Dagnija Blumberga, ‘Heat Pumps Integration Trends in District Heating Networks of the Baltic States’, Procedia - Procedia Computer Science, 52.Seit, 2015, 835–42
Legal Acts of the Republic of Latvia, ‘Methodology for Calculating the Energy Performance of a Building Annex I’, 2013
Leitner, Benedikt, Edmund Widl, Wolfgang Gawlik, and René Hofmann, ‘A Method for Technical Assessment of Power-to-Heat Use Cases to Couple Local District Heating and Electrical Distribution Grids’, Energy, 182, 2019, 729–38
Lickrastina, Agnese, Normunds Talcis, and Egils Dzelzitis, ‘Cogeneration Unit with an Absorption Heat Pump for the District Heating System’, HVAC and R Research, 20.4, 2014, 404–10
Linas, Jegelevicius, ‘Overview - Baltics Clear 2020 Renewable Energy Targets, Upbeat on 2030 Green Commitments’, Renewables Now, 2019
Lindroos, Tomi J., Antti Lehtilä, Tiina Koljonen, Anders Kofoed-Wiuff, János Hethey, Nina Dupont, and others, ‘Baltic Energy Technology Scenarios 2018’, 2018, p. 165
Litgrid, AST, and Elering, ‘Review of RES Perspective in Baltic Countries till 2030’, 2015
Lithuanian District Heating Association, ‘Lithuanian DH Sector Recent Developments’, 2019
Lithuanian District Heating Association (LSTA), Lithuanian District Heating Sector Overview in 2018 (in Lithuanian), 2019
Lithuanian Hydrometeorological Service, ‘Hydrological Information’, 2020
‘Lithuanian National Energy Regulatory Council’
Lithuanian National Energy Regulatory Council, ‘The District Heating Prices’, 2020
Lorentsen Bøgeskov, Henrik, ‘Eco-City’, 2011
Lund, Henrik, Poul Alberg, David Connolly, and Brian Vad, ‘Smart Energy and Smart Energy Systems’, Energy, 137, 2017, 556–65
Lund, Henrik, Brian Vad; Mathiesen, David Connolly, and Poul Alberg Østergaard, ‘Renewable Energy Systems - A Smart Energy Systems Approach to the Choice and Modelling of 100 % Renewable Solutions’, Chemical Engineering Transactions, 39, 2014, 1–6
Lund, Henrik, Jakob Zinck Thellufsen, Soren Aggerholm, Kim Bjarne Wittchen, Steffen Nielsen, Brian Vad Mathiesen, and others, ‘Heat Saving Strategies in Sustainable Smart Energy Systems’, International Journal of Sustainable Energy Planning and Management, 04, 2014, 3–16
Lund, Rasmus, Danica Djuric Ilic, and Louise Trygg, ‘Socioeconomic Potential for Introducing Large-Scale Heat Pumps in District Heating in Denmark’, Journal of Cleaner Production, 139, 2016, 219–29
Lund, Rasmus, Dorte Skaarup Østergaard, Xiaochen Yang, and Brian Vad Mathiesen, ‘Comparison of Low-Temperature District Heating Concepts in a Long-Term Energy System Perspective’, International Journal of Sustainable Energy Planning and Management, 12, 2017, 5–18
Lund, Rasmus, and Urban Persson, ‘Mapping of Potential Heat Sources for Heat Pumps for District Heating in Denmark’, Energy, 46, 2015
MAAKÜTE.EE, ‘4 Different Types of Geothermal Heating: Shallow Geothermal, Bore Holes, Groundwater, Water Reservoir(in Estonian)’, 2018
MapCruzin.com, and OpenStreetMap.org, ‘Lithuania Waterways’, 2020
Mathiesen, Brian Vad;, Henrik; Lund, Kenneth; Hansen, Iva; Ridjan, Søren Roth; Djørup, Steffen; Nielsen, and others, ‘IDA’ s Energy Vision 2050: A Smart Energy System Strategy for 100% Renewable Denmark’, 2015
Meesenburg, Wiebke, Wiebke Brix Markussen, Torben Ommen, and Brian Elmegaard, ‘Optimizing Control of Two-Stage Ammonia Heat Pump for Fast Regulation of Power Uptake’, Applied Energy, 271.April, 2020, 115126
Mengjie, Song, Deng Shiming, Dang Chaobin, Mao Ning, and Wang Zhihua, ‘Review on Improvement for Air Source Heat Pump Units during Frosting and Defrosting’, Applied Energy, 211, 2018, 1150–70
Minea, Vasile, ‘Overview of Heat-Pump–Assisted Drying Systems, Part II: Data Provided vs. Results Reported’, Drying Technology, 33.5, 2015, 527–40
Ministry of Economic Affairs and Communications, ‘Estonian Heat Supply Sector Analysis (in Estonian)’, 2013
Ministry of Economic Affairs and Communications (in Estonian), ‘Heating Sector’, 2019
Ministry of Economics of the Republic of Latvia., Long-Term Strategy for Building Renovation, 2014
Ministry of Environment and Food of Denmark, ‘The Danish Environmental Protection Agency’
Ministry of Environment of the Republic of Lithuania, ‘Regarding the Approval of the Construction Technical Regulation STR 2.01.02: 2016 “Design and Certification of Energy Performance of Buildings” (In Lithuanian)’, 2016
Ministry of Environmental Protection and Regional Development of the Republic of Latvia, ‘Marine Spatial Planning (MSP): A Map of the Depth of the Sea’, 2013
Ministry of Foreign Affairs of Denmark, ‘New Ambitious Danish Energy Agreement Secured’, 2018
Naegler, Tobias, Sonja Simon, Martin Klein, and Hans Christian Gils, ‘Quantification of the European Industrial Heat Demand by Branch and Temperature Level’, International Journal of Energy Research, 39.2019, 2015, 30
‘National Energy and Climate Action Plan of the Republic of Lithuania for 2021-2030’, 2020
Nellissen, Philippe, and Stefan Wolf, ‘Heat Pumps in Non-Domestic Applications in Europe: Potential for an Energy Revolution’ (n: 8th EHPA European Heat Pump Forum, Brussels, Belgium, 2015), pp. 1–17
Nord Pool, ‘Historical Market Data’
Nordic Energy Research, ‘Flex4RES’, 2019
Nowak, Thomas, ‘Webinar: EHPA Market Report and Statistics Outlook 2019’, 2019
Oluleye, Gbemi, Ning Jiang, Robin Smith, and Megan Jobson, ‘A Novel Screening Framework for Waste Heat Utilization Technologies’, Energy, 125, 2017, 367–81
Oluleye, Gbemi, Robin Smith, and Megan Jobson, ‘Modelling and Screening Heat Pump Options for the Exploitation of Low Grade Waste Heat in Process Sites’, Applied Energy, 169 (2016), 267–86
Ommen, Torben, Jonas Kjær Jensen, Wiebke Meesenburg, Pernille Hartmund Jørgensen, Henrik Pieper, Wiebke Brix Markussen, and others, ‘Generalized COP Estimation of Heat Pump Processes for Operation off the Design Point of Equipment’, Proceedings of the 25th IIR International Congress of Refrigeration, 2019
Ommen, Torben Schmidt, Brian Elmegaard, and Wiebke Brix Markussen, ‘Heat Pumps in CHP Systems: High-Efficiency Energy System Utilising Combined Heat and Power and Heat Pumps’ (DTU Mechanical Engineering (DCAMM Special Report; No. S187), 2015
Østergaard, Poul Alberg, and Anders N. Andersen, ‘Booster Heat Pumps and Central Heat Pumps in District Heating’, Applied Energy, 184, 2016, 1374–88
Ots, Siim, ‘Nautic Map’, 2018
Pardo Nicolas, Konstantinos Vatopoulos, Anna Krook Riekkola, and Alicia Perez, ‘Methodology to Estimate the Energy Flows of the European Union Heating and Cooling Market’, Energy, 52, 2013, 339–52
De Pasquale, A.M., A. Giostri, M.C. Romano, P. Chiesa, T. Demeco, and S. Tani, ‘District Heating by Drinking Water Heat Pump: Modelling and Energy Analysis of a Case Study in the City of Milan’, Energy, 118, 2017, 246–63
Persson, U., B. Möller, and S. Werner, ‘Heat Roadmap Europe: Identifying Strategic Heat Synergy Regions’, Energy Policy, 74.C, 2014, 663–81
Philipp, Matthias, Gregor Schumm, Patrick Heck, Florian Schlosser, Ron Hendrik Peesel, Timothy G. Walmsley, and others, ‘Increasing Energy Efficiency of Milk Product Batch Sterilisation’, Energy, 164, 2018, 995–1010
Pieper, Henrik, ‘Optimal Integration of District Heating, District Cooling, Heat Sources and Heat Sinks’, Technical University of Denmark, 2019
Pieper, Henrik, Vladislav Mašatin, Anna Volkova, Torben Ommen, Brian Elmegaard, and Wiebke Brix Markussen, ‘Modelling Framework for Integration of Large-Scale Heat Pumps in District Heating Using Low-Temperature Heat Sources: A Case Study of Tallinn, Estonia’, International Journal of Sustainable Energy Planning and Management, 20, 2019, 67–86
Pieper, Henrik, Torben Ommen, Fabian Buhler, Bjarke Lava Paaske, Brian Elmegaard, and Wiebke Brix Markussen, ‘Allocation of Investment Costs for Large-Scale Heat Pumps Supplying District Heating’, Energy Procedia, 147, 2018, 358–67
Pieper, Henrik, Torben Ommen, Brian Elmegaard, Anna Volkova, and Wiebke Brix Markussen, ‘Optimal Design and Dispatch of Electrically Driven Heat Pumps and Chillers for a New Development Area’, Environmental and Climate Technologies, 24.3, 2020, 470–82
Pieper, Henrik, Torben Ommen, Jonas Kjær Jensen, Brian Elmegaard, and Wiebke Brix Markussen, ‘Comparison of COP Estimation Methods for Large-Scale Heat Pumps Used in Energy Planning’, Energy, 205, 2020, 117994
PlanEnergi, ‘Overview of Large-Scale Electric (and Gas) Driven Heat Pumps, Which Produce Heat for Danish District Heating (in Danish)’, 2019
PlanEnergi, ‘Personal Communication with Bjarke Lava Paaske’, 2018
PlanEnergi, ‘Report about Heat Storage Technologies and Large-Scale Heat Pumps Used in District Heating Systems (in Danish)’, 2013, p. 113
Polikarpova, Ilze, Dace Lauka, Dagnija Blumberga, and Edgars Vigants, ‘Multi ‐ Criteria Analysis to Select Renewable Energy Solution for District Heating System’, 23.3, 2019, 101–9
Public Sercvice of the Environmental Register, ‘Environmental Register’, 2020
Ramboll, ‘Project Proposal for a Heat Pump and District Cooling in Tårnby (in Danish)’, 2018
Rehfeldt, Matthias, Tobias Fleiter, and Felipe Toro, ‘A Bottom-up Estimation of the Heating and Cooling Demand in European Industry’, Energy Efficiency, 2017, 1–26
Reino, Arbo, Mihkel Harm, and Arvi Hamburg, ‘The Impact of Building Renovation with Heat Pumps to Competitiveness of District Heating: Estonian District Heating Pricing System Needs More Flexibility’, in 2017 IEEE 58th International Scientific Conference on Power and Electrical Engineering of Riga Technical University (RTUCON), IEEE, 2017
RESCUE Project, ‘District Cooling Showcases in Europe’, 2015
Reuters, ‘UPDATE 1-Fortum Puts Polish, Baltic District Heating Assets on the Block - Sources’, 2020
Rigas Energetikas Agentura, Heat Recovery from Flue Gas and Cooling Flows in Energy Production Plants (in Latvian), 2012
Riigi Teataja, ‘Minimum Energy Performance Requirements for Buildings’, 2018
Rinne, S., and S. Syri, ‘Heat Pumps versus Combined Heat and Power Production as CO2 Reduction Measures in Finland’, Energy, 57, 2013, 308–18
Rummel, Leo, ‘Heat Supply Development Plan for Kaarepere Küla and Luua Küla 2017-2027 (in Estonian)’, 2017
Rummel, Leo, ‘Mäetaguse Valla Mäetaguse Aleviku Ja Kiikla Küla Soojusmajanduse Arengukava Aastateks 2017-2030’, August, 2017
Salacgriva Municipality, ‘About Washing out of Heat-Pump Circuits (in Latvian)’, 2019
Sayegh, M. A., P. Jadwiszczak, B. P. Axcell, E. Niemierka, K. Bryś, and H. Jouhara, ‘Heat Pump Placement, Connection and Operational Modes in European District Heating’, Energy and Buildings, 166.February, 2018, 122–44
Schlosser, F., M. Jesper, J. Vogelsang, T. G. Walmsley, C. Arpagaus, and J. Hesselbach, ‘Large-Scale Heat Pumps: Applications, Performance, Economic Feasibility and Industrial Integration’, Renewable and Sustainable Energy Reviews, 133. 2020, 110219
Schmidt, Oliver, Sylvain Melchior, Adam Hawkes, and Iain Staffell, ‘Projecting the Future Levelized Cost of Electricity Storage Technologies’, Joule, 3.1, 2019, 81–100
Schweiger, Gerald, Jonatan Rantzer, Karin Ericsson, and Patrick Lauenburg, ‘The Potential of Power-to-Heat in Swedish District Heating Systems’, Energy, 137, 2017, 661–69
SE ‘GIS-Centras’, ‘Annex I. Hydrography (INSPIRE Dataset)’, 2014
Searle, Stephanie Y., and Christopher J. Malins, ‘Waste and Residue Availability for Advanced Biofuel Production in EU Member States’, Biomass and Bioenergy, 89 2016, 2–10
SIA Envirotech, ‘Envirotech Data: Cities’, 2016
SIA Envirotech, ‘Envirotech Data: Parishes’, 2016
SIA Envirotech, ‘Envirotech Data: Shoreline’, 2016
SIA Envirotech, ‘Envirotech Data: Water Bodies’, 2016
———, ‘Envirotech Data: Watercourses’, 2016
Solid Energy A/S, ‘Personal Communication with Jørn Windahl’, 2018
Solid Energy A/S, ‘Sound Levels of Air-Source Heat Pumps’, 2018
State of Green, ‘2019: The Greenest Year Ever in Denmark’, 2019
Statistics Estonia, ‘KE023: Energy Balance Sheet by Type of Fuel or Energy(1999-2018)’, 2020
Statistics Estonia, ‘Quarterly Bulletin of Statistics Estonia 2/18’, 2 2018
Statistics Lithuania, ‘Population (Settlements) 2011’, 2015
Støvring District heating, ‘Application for Municipality Guarantee for Loan (in Danish)’, 2018
Strom report, ‘Electricity Prices in Europe / Who Pays the Most?’, 2020
Tallinn city council, Energy Efficiency Action Plan for Tallinn 2011-2021 (in Estonian), 2011
The Balmorel Open Source Project, ‘Balmorel’
The Danish Ministry of Climate and Energy, ‘Energy Strategy 2050 - from Coal, Oil and Gas to Green Energy (in Danish)’, 2011
‘The EEA and Norway Grants’
‘The Environmental Protection Agency (EPA)’
The Local, ‘Pull the Plug! Danes Pay EU’s Highest Electricity Prices’, 2016
‘The Public Utilities Commission (PUC)’
‘The State Environmental Service of the Republic of Latvia’
Tredinnick, S., and G. Phetteplace, District Cooling, Current Status and Future Trends, Advanced District Heating and Cooling (DHC) Systems, Elsevier Ltd., 2016
Uiga, Jaanus, ‘CO2 Emissions Resulting from Final Energy Consumption – A Case Study of Tartu City’, Tartu: EMÜ, 2014
Valancius, Rokas, Rao Martand Singh, Andrius Jurelionis, and Juozas Vaiciunas, ‘A Review of Heat Pump Systems and Applications in Cold Climates: Evidence from Lithuania’, Energies, 12.22, 2019
Verkerk, Pieter Johannes, Joanne Brighid Fitzgerald, Pawan Datta, Matthias Dees, Geerten Martijn Hengeveld, Marcus Lindner, and others, ‘Spatial Distribution of the Potential Forest Biomass Availability in Europe’, Forest Ecosystems, 6.1 , 2019, 1–11
Volkova, Anna, Igor Krupenski, Henrik Pieper, Aleksandr Ledvanov, Eduard Latõšov, and Andres Siirde, ‘Small Low-Temperature District Heating Network Development Prospects’, Energy, 178 , 2019, 714–22
Volkova, Anna, Eduard Latõšov, Kertu Lepiksaar, and Andres Siirde, ‘Planning of District Heating Regions in Estonia’, International Journal of Sustainable Energy Planning and Management, 27.Special Issue , 2020, 5–16
Wolf, S., U. Fahl, M. Blesl, A. Voss, and R. Jakobs, ‘Analysis of the Potential of Industrial Heat Pumps in Germany’, (in German) 2014
Yang, Liu, Liu Jinxiang, and Ding Gao, ‘Mathematical Model of Water-Source Heat Pump Units under Variant Working Conditions’, Heating Ventilating & Air Conditioning, 03, 2007
Yilmaz, H.U., R. Hartel, D. Keles, R. McKenna, and W. Fichtner, Analysis of the Potential for Power-to-Heat/Cool Applications to Increase Flexibility in the European Electricity System until 2030, 2017
Zheng, Linfeng, Jianguo Zhu, Dylan Dah Chuan Lu, Guoxiu Wang, and Tingting He, ‘Incremental Capacity Analysis and Differential Voltage Analysis Based State of Charge and Capacity Estimation for Lithium-Ion Batteries’, Energy, 150, 2018, 759–69
Zimmer, M-M, ‘Process- and Plant-Optimised Design, Construction, Planning and Installation Preparation of a Galvanic Hard Chrome Plant: Final Report on a Development Project under Reference Number: 25418-21/2 [German]’, German Federal Environmental Foundation, 2009
Zou, Shenghua, and Xiaokai Xie, ‘Simplified Model for Coefficient of Performance Calculation of Surface Water Source Heat Pump’, Applied Thermal Engineering, 112 2017, 201–7
Zühlsdorf, B., F. Bühler, M. Bantle, and B. Elmegaard, ‘Analysis of Technologies and Potentials for Heat Pump-Based Process Heat Supply above 150 °C’, Energy Conversion and Management: X, 2, 2019
About this publication
Heat pump potential in the Baltic states
Anna Volkova, Henrik Pieper, Hardi Koduvere, Kertu Lepiksaar and Andres Siirde
https://doi.org/10.6027/NER2021-02
© Nordic Energy Research 2021
Layout: Gitte Wejnold
Front page photo: "Seaplane Harbour museum (Tallinn, Estonia) with heating and cooling from seawater heat pumps". Seaplane Harbour Museum by MXM Aerofoto (https://aerofoto.mxm.ee/)
Nordic Energy Research
Nordic Energy Research is an institution under the Nordic Council of Ministers which manages and finances international research programs and projects that add value to national work in the Nordic countries. In addition, we perform certain secretariat and analytical functions in the energy policy cooperation under the Nordic Council of Ministers.