
- Frontpage
- Contents
- Foreword
- Acknowledgements
- Executive Summary
- Chapter 1. Nordic Countries are Committed to Carbon Neutrality
- Chapter 2. Five Solution Tracks to Carbon Neutrality
- Chapter 3. Direct Electrification, the Central Pillar of Decarbonisation
- Chapter 4. Power-to-X: A Potential Game Changer for the Power Sector
- Chapter 5. The Important but Shifting Role of Bioenergy
- Chapter 6. Carbon Capture and Storage, and Negative Emissions are Essential
- Chapter 7. How Behaviour and Acceptance can Influence Future Energy Systems
- Chapter 8. A Case for Nordic Collaboration and the Nordic's Role in the European Transition
- Chapter 9. Not Everything is Uncertain: Robust Results Across all NCES Scenarios
- Annex A. Flexibility Needs and Solutions in the NCES Scenarios
- Annex B. Nuclear Electricity Could Play a Long-Term Role, But is Unlikely to be a Dealbreaker
- Abbreviations
- References
- About this publication
MENU
Foreword
The Nordic countries have a unique and long-standing cooperation on energy, which has created a solid foundation for a sustainable and secure energy supply in the region. Now, it is time to further Nordic energy cooperation with the green transition as a new framework.
When the Nordic Prime ministers signed the joint Declaration on Nordic Carbon Neutrality in January 2019 – committing themselves to work towards carbon neutrality – Nordic Energy Research recognised the need for a publicly available research-based analysis, to gather Nordic perspectives on national and regional energy systems, and complement the ongoing work in each country.
Nordic Clean Energy Scenarios aim to identify and help prioritise – through scenario modelling – the necessary actions up to 2030 and map potential long-term pathways to carbon neutrality, and thereby support the joint Declaration on Carbon Neutrality. This work is both timely and important, considering that energy-related emissions make up almost four-fifths of Nordic emissions today.
This project guides you through the Nordic energy system and illustrates how the Nordic countries can achieve the Nordic Vision 2030, to become the most sustainable and integrated region in the world, and make the green transition towards carbon neutrality a reality.
The project builds on earlier Nordic Energy Research efforts. The Nordic Energy Technology Perspectives reports were published in 2013 and 2016 and drew on the best available knowledge at the time. However, the rapidly changing landscape of the energy sector has seen cost declines for energy technologies that were unimaginable a few years ago, while ambitions to curb climate change have risen around the world. These developments have changed the prospects for certain technologies and the energy system, highlighting the need for an updated analysis.
While previous reports analysed added costs and changes incurred from increased climate ambitions, the three Nordic Clean Energy Scenarios presented here reach carbon neutrality through different technological and societal pathways, illustrating how political choices can shape the future of the Nordic energy system.
However, important questions remain:
Will the necessary changes to achieve the current national plans, strategies, and targets, as described in the Carbon Neutral Nordic scenario be realised?
Will the Nordic countries have a greater role in the European energy transition, by providing carbon storage, and clean electricity and fuels, as envisioned in the Nordic Powerhouse scenario?
Will Nordic countries pursue additional energy and material efficiency across all sectors, and lower demand for energy services, as outlined in the Climate Neutral Behaviour scenario?
Klaus Skytte, CEO, Nordic Energy Research
It is likely we will see neither of the extremes, but rather a combination of all scenarios. This project shows the possibilities and potential barriers that lie ahead on the road to Nordic carbon neutrality.
Klaus Skytte
Acknowledgements
Nordic Clean Energy Scenarios –Solutions for Carbon Neutrality is a collaborative project between Nordic Energy Research who funded the project and is carried out by a Nordic team of researchers and consultants lead by Energiforsk.
Kevin Johnsen and Christian Kjaer at Nordic Energy Research were the coordinators of the project.
Markus Wråke (Energiforsk) was the overall project manager, Kenneth Karlsson (IVL) scientific manager, and Madelene Danielzon Larsson (Energiforsk) coordinated the design and drafting of the report.
Team at Nordic Energy Research
Kevin Johnsen
Senior Adviser
kevin.johnsen@nordicenergy.org
Christian Kjaer
Senior Adviser
Research and consultant team
Energiforsk
Markus Wråke, Project Manager
Madelene Danielzon Larsson, Project Coordinator
EA Energy Analyses
Anders Kofoed-Wiuff, Work Package Leader, Technology Catalogue & Balmorel
Andrea Pasquali, Modeller Balmorel, Technology Catalogue
Victor Duus Svensson, Modeller Balmorel
János Hethey, Modeller Balmorel
Energy Modelling Lab
Kenneth Karlsson, Scientific Manager
Mikkel Bosack Simonsen, Modeller ON-TIMES
Till Ben Brahim, Modeller ON-TIMES
IVL Swedish Environmental Research Institute
Kenneth Karlsson, Scientific Manager
Burcu Unluturk, Modeller ON-TIMES
Christin Liptow, Energy Technology Expert
Sofia Klugman, Energy Technology Expert
Norwegian University of Life Sciences
Torjus Folsland Bolkesjø, Work Package Leader, Project Scoping
Yi-kuang Chen, Literature Reviewer
Eirik Ogner Jåstad, Co-author & Model Results Reviewer
Jon Gustav Kirkerud, Model Results Reviewer
Profu
Martin Hagberg, Co-author Model Results Reviewer
Thomas Unger, Model Results Reviewer
Thema
Berit Tennback, Co-author & Model Results Reviewer
Anders Lund Eriksrud, Model Results Reviewer
Tøkni
Olavur Ellefsen, Webtool Developer
Bo Lærke, Webtool Developer
VTT Technical Research Centre of Finland
Tomi J. Lindroos, Co-author & Modeller ON-TIMES
Antti Lehtilä, Modeller ON-TIMES
Erkka Rinne, Work Package Leader, NCES Database
Tiina Koljonen, Work Package Leader, Framework Conditions
Nelli Putkonen, Literature Reviewer
Jiangyi Huang, Data collection NCES database
Steering group and funding body
The work was guided by a steering group, composed of:
-
Klaus Skytte, Nordic Energy Research
-
Jón Ásgeir Haukdal Þorvaldsson, Orkustofnun, Iceland
-
Jarmo Heinonen, Business Finland, Finland
-
Benjamin Donald Smith, The Research Council of Norway, Norway
-
Hanne Thomassen, Energistyrelsen, Denmark
-
Lars Guldbrand, Infrastrukturdepartementet, Sweden
The individuals and organizations that contributed to this study are not responsible for any opinions or judgements contained in this study.
Contact
Comments and questions are welcome and should be addressed to:
Kevin Johnsen, Nordic Energy Research, e-mail: kevin.johnsen@nordicenergy.org
For enquiries regarding the presentation of results or distribution of the report, please contact Nordic Energy Research.
Additional materials, press coverage, presentations etc. can be found at nordicenergy.org.
Nordic Clean Energy Scenarios in ten Messages
In 2019, the Nordic countries signed a joint Declaration on Carbon Neutrality, committing to make the Nordic countries carbon neutral, in line with the COP21 Paris Climate Agreement. To support this commitment, Nordic Energy Research commissioned the Nordic Clean Energy Scenarios project (NCES). The aim of this project is to identify and help prioritise, through scenario modelling, which actions will be necessary by 2030 and to map potential long-term pathways to carbon neutrality.
Current approaches, including underlying policy measures, have not delivered the required rate of change. Compared with the previous decade, the rate of emission reductions must increase fivefold. The transformation challenge is immense and a great deal of uncertainty remains, including how to strike a balance between what may be cost-effective and what will be politically, socially, and environmentally acceptable.
Across ten areas, the NCES analysis reveals robust results that identify no-regret actions that can be implemented in the near-term to set a strong foundation for achieving carbon neutrality.
Three scenarios show different pathways to carbon neutrality
The NCES project developed three scenarios, all designed to meet the carbon neutrality target by balancing carbon emissions and sinks. While acknowledging the importance of cost-effectiveness, the analytical approach recognised that considering only this criterion is too narrow in scope for policy planning and decision-making. As such, the NCES analysis seeks to balance multiple factors that will influence outcomes. Each of the three scenarios reflects a different core element:
- Carbon Neutral Nordic (CNN) seeks the least-cost pathway, taking into account current national plans, strategies, and targets.
- Nordic Powerhouse (NPH) explores the opportunity for the Nordics to play a larger role in the broader European energy transition by providing clean electricity, clean fuels, and carbon storage.
- Climate Neutral Behaviour (CNB) reflects Nordic societies adopting additional energy and material efficiency measures in all sectors, ultimately leading to lower demand for both.
Message
one
Nordic industry and transport are transformed, supported by clean electricity and decarbonised fuels
Driven by changes in industry and transport, the supply of energy to the Nordic countries is radically transformed in all NCES scenarios (Figure ES.1); as a result, carbon dioxide (CO2) emissions decline by 95% (Figure ES.2). Decisive action that facilitates clean electricity supply, supports sector coupling, and accelerates energy technology research and innovation can deliver this outcome. Wind power is central to the transition, enabled by large Nordic wind resources and supported by flexibility in hydropower reservoirs as well as successful efforts to enhance additional flexibility of the Nordic energy system (Figure ES.3). Clean electricity is a critical enabler of decarbonisation of industry and transport.
Message
two
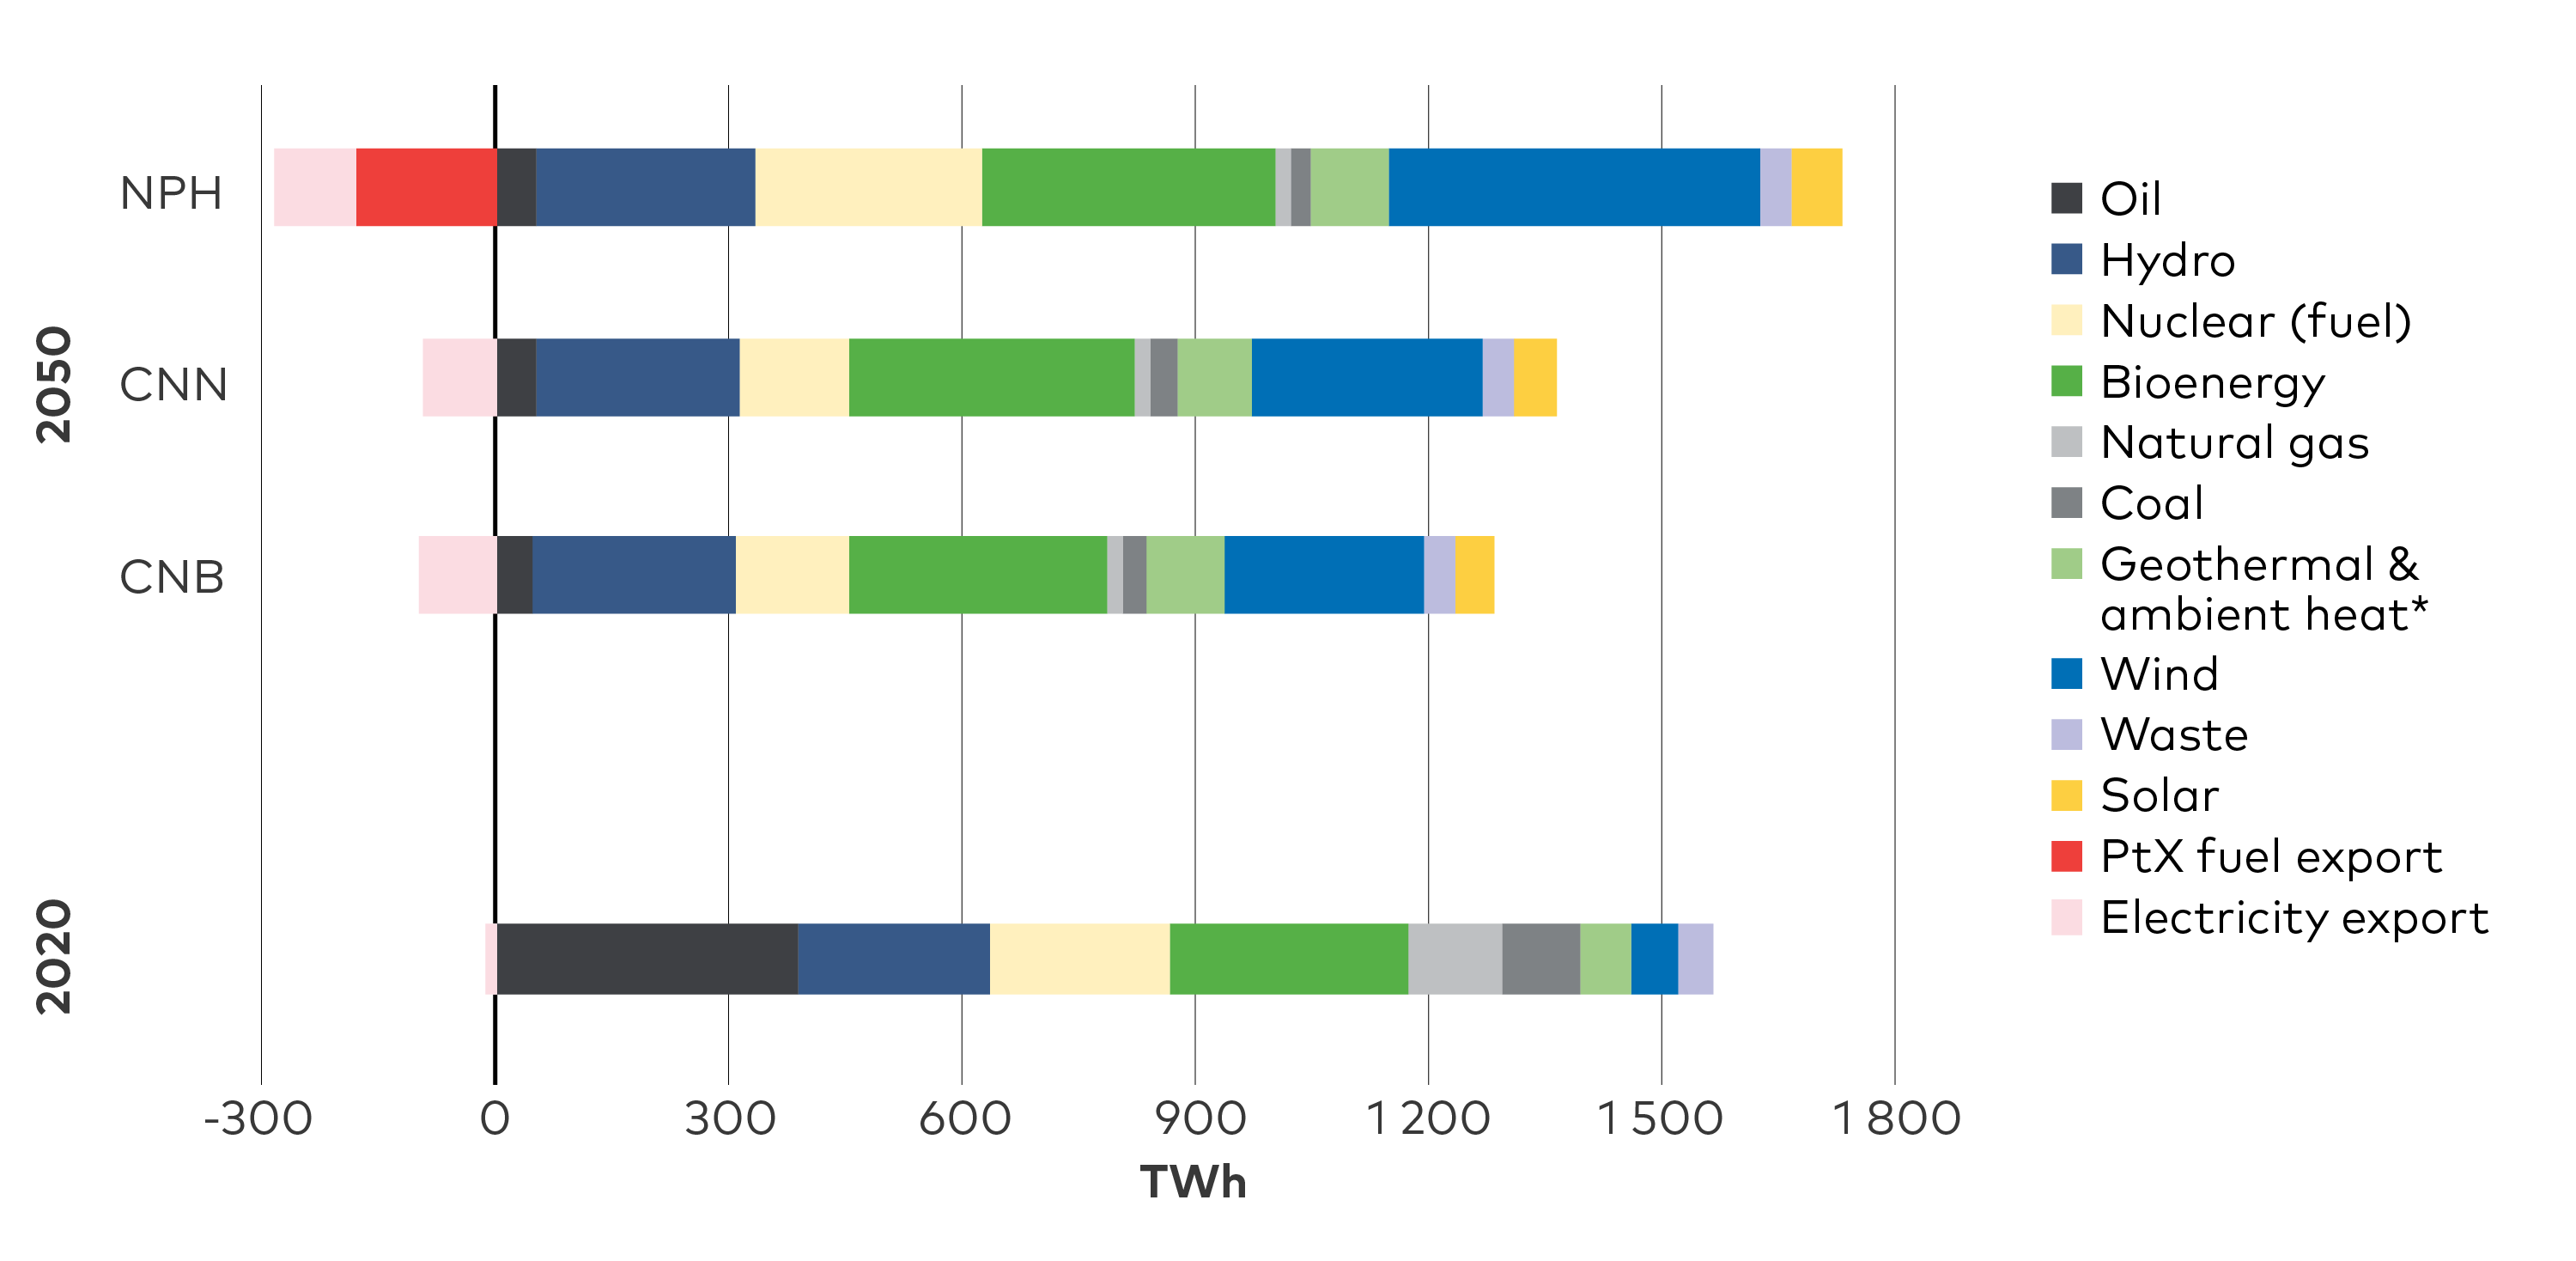
Figure ES.1. Nordic total primary energy supply in the NCES scenarios. In the NCES scenarios, the share of fossil fuels in Nordic total primary energy supply falls from 42% in 2020 to 6-9% in 2050. In parallel, export rises of electricity and power-to-X fuels, such as hydrogen or ammonia. Exports to non-Nordic countries are displayed as negative values. *Includes minor contribution from other sources.

Figure ES.2. Nordic energy-related CO2 emissions - CNN scenario. Action is needed to rapidly reduce CO2 emissions. In the CNN scenario, compared to the past decade, the rate of emissions reduction must increase fivefold.

Figure ES.3. Nordic electricity generation in 2020 and the NCES scenarios. Wind power dominates new electricity investments in the NCES scenarios while the share of fossil fuels falls to below 5% by 2050 in all scenarios. This pattern is constant even as generation increases substantially from 455 TWh in 2020 to 650 TWh (CNB), 690 TWh (CNN) and 950 TWh (NPH) in 2050.
Five solution tracks towards carbon neutrality emerge in the NCES scenarios
Five solution tracks capturing a majority of available mitigation options emerge from the analysis: direct electrification; power-to-X (PtX fuels); bioenergy; carbon capture technologies (CCS) including in combination with bioenergy (BECCS); and behavioural change (Figure ES.4). While direct electrification is at the core of all scenarios, a decarbonisation pathway that balances elements of all five solution tracks to accommodate national contexts will likely be easier to realise than a route completely dominated by any one set of solutions.
Message
three
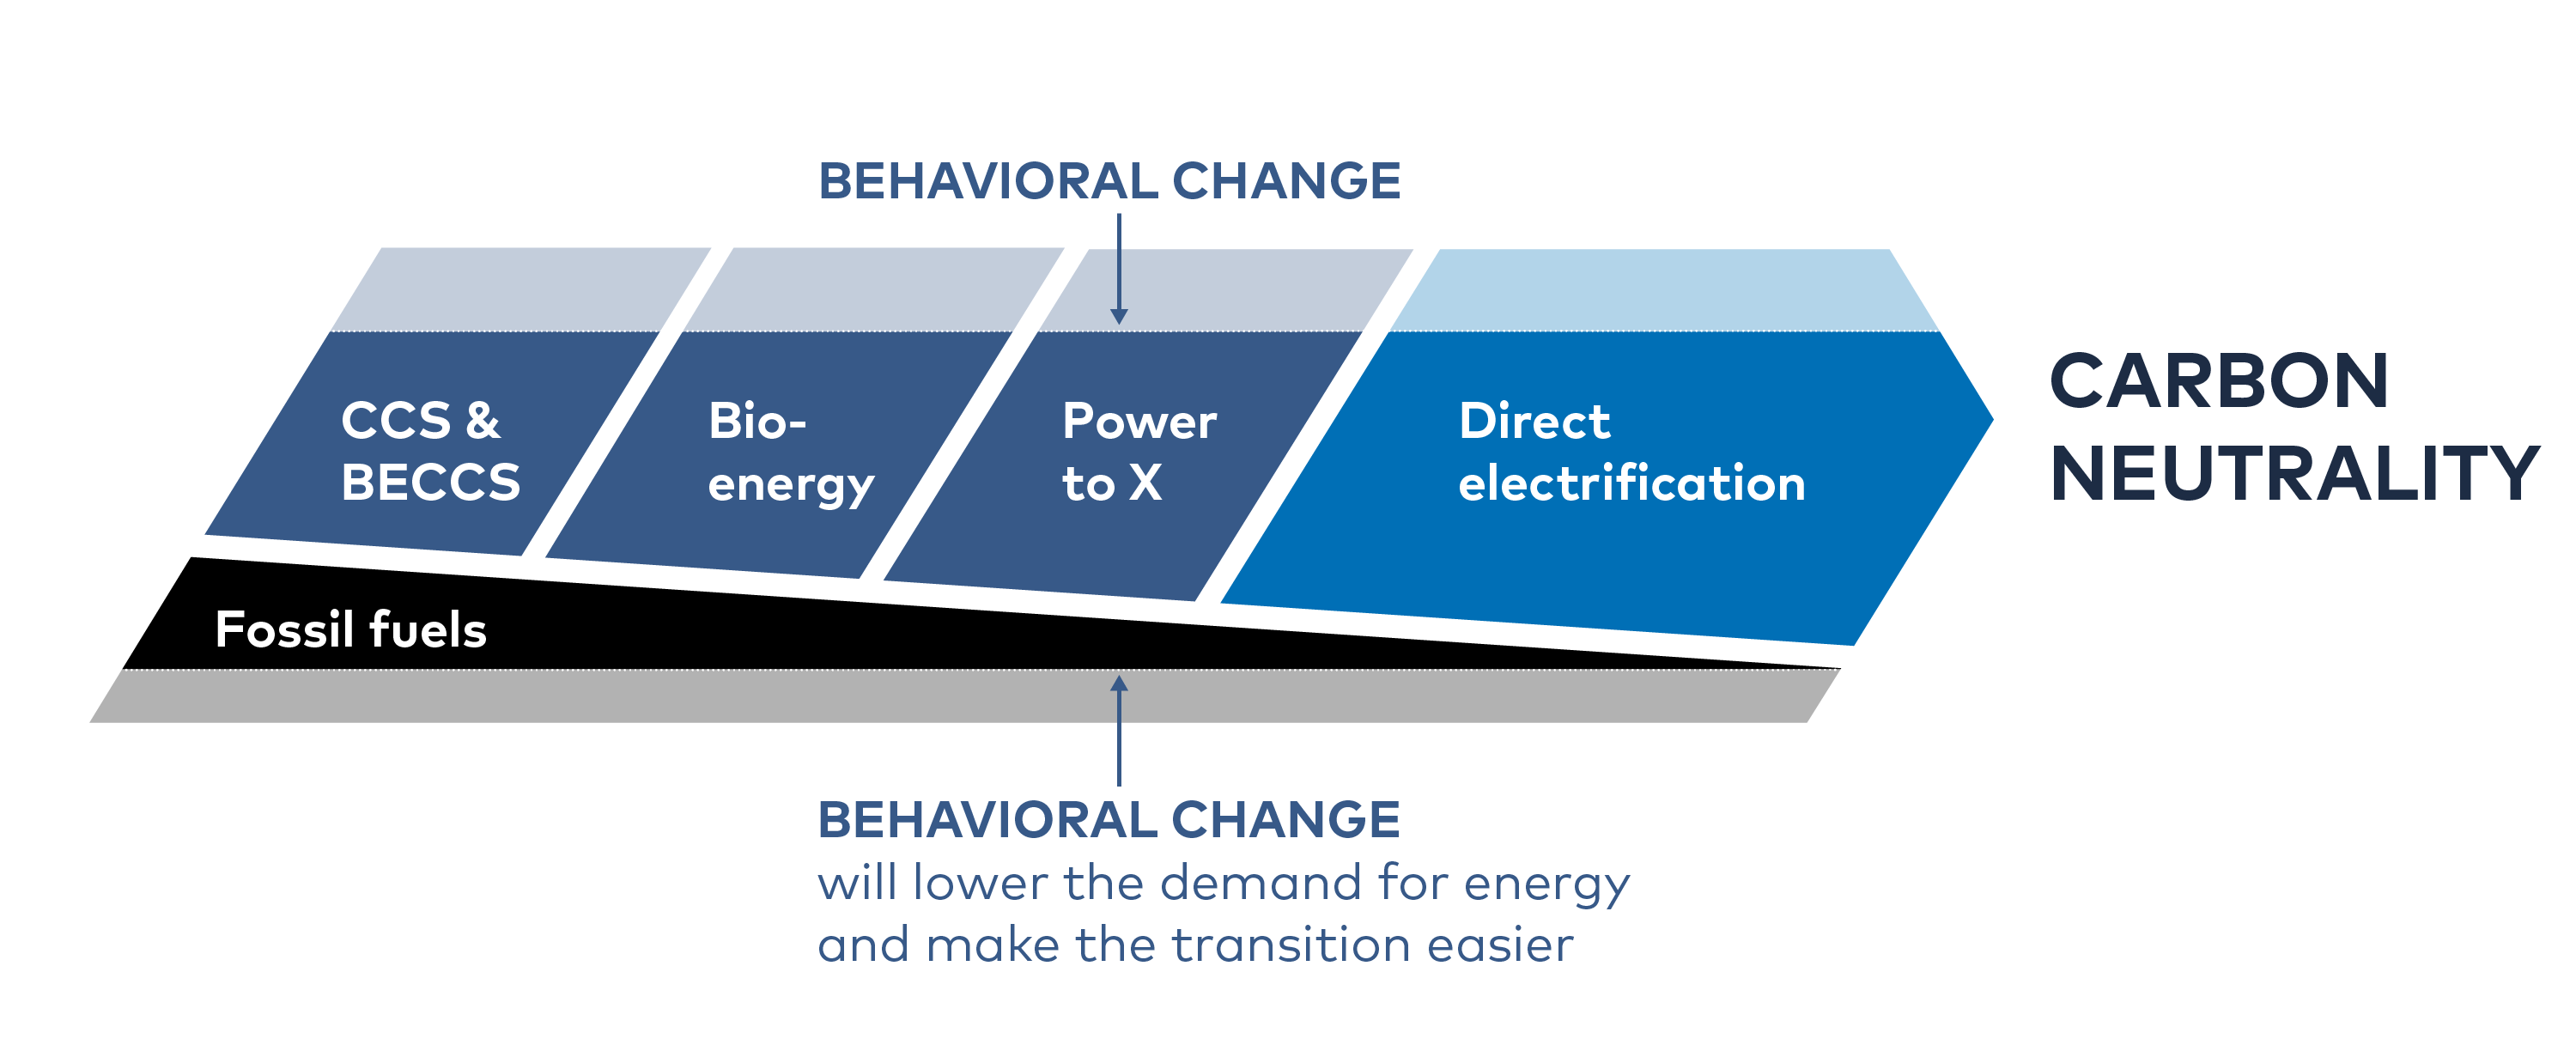
Figure ES.4. Five solution tracks contribute to Nordic clean energy scenarios. Five solution tracks emerge from the analysis. Direct electrification forms the core of all scenarios, complemented by three other technology tracks: PtX, bioenergy and CCS technologies. Behavioural change will influence any pathway chosen.
Direct electrification is central to all decarbonisation strategies
Direct electrification of end-use sectors is central to all NCES scenarios. It implies clean electricity directly substituting fuel combustion, for instance in transportation, heating, or industrial processes. In addition to reducing emissions, direct electrification can dramatically improve energy efficiency. With strong electricity grids and large hydropower reservoirs, the Nordic region is well-positioned to leverage the falling costs of renewable electricity generation to accelerate deployment of electric end-use technologies.
Electricity’s share of final energy consumption rises from around 30% in 2020 to 50% by 2050, and Nordic electricity demand increase by 40-100% across the scenarios (Figure ES.5). NCES analysis shows direct electrification gaining traction in applications that seemed out of reach only five years ago, including heavy-duty road transport and even some aviation, which would reduce pressure on bioresources.
Direct electrification is no panacea, however. In applications that require high temperatures, high energy density in storage, or high energy flow rates electrification has limitations and other solution tracks play crucial roles to fill the gaps.
Message
four
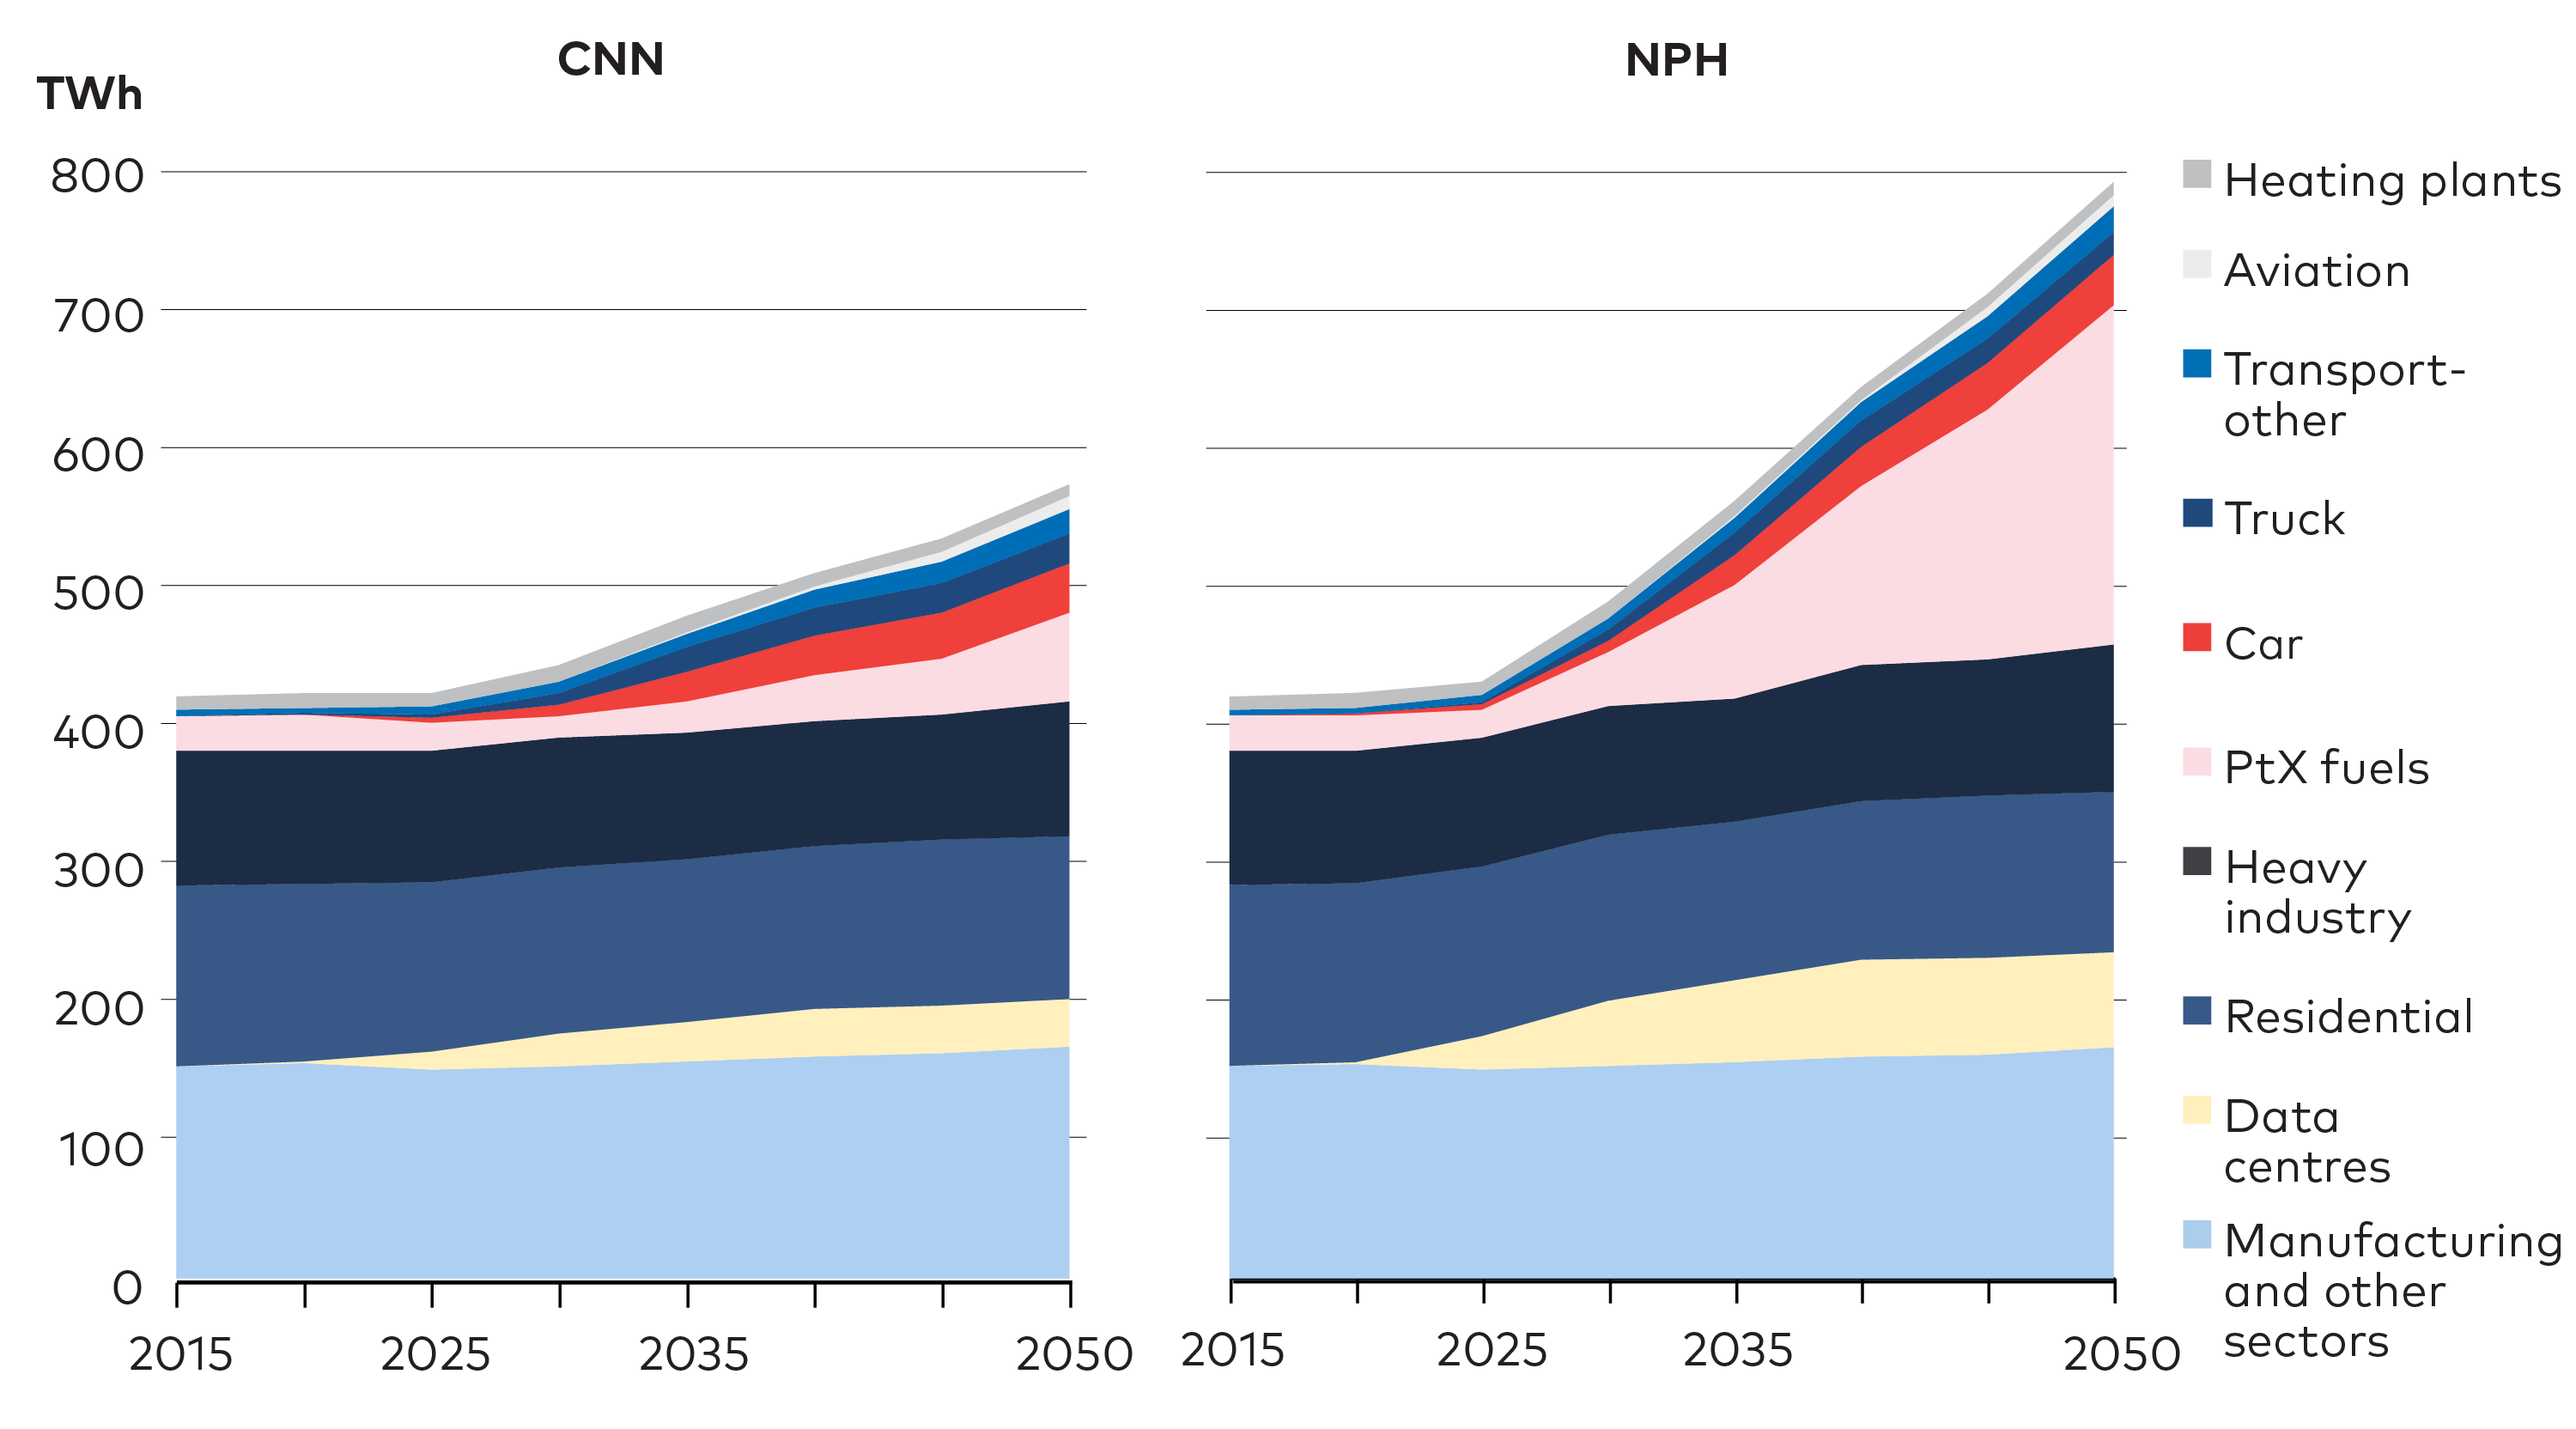
Figure ES.5. Projected growth in Nordic electricity demand. Nordic electricity demand grows in all NCES scenarios, with transport and PtX fuels being the main drivers. From 390 TWh in 2020 to about 535 TWh (CNN) and 760 TWh (NPH) in 2050.
Three no-regret actions for direct electrification:
-
Roll out vehicle charging infrastructure and continue incentivising electric vehicles (EVs); over time, shift the focus from personal EVs towards heavier vehicles.
-
Replace fossil boilers and direct electric household heating with heat pumps.
-
Ensure that regulation supports use of waste heat from industry, data centres, and other sources.
Power-to-X: A potential game-changer with profound impact on the Nordic power sector
Using hydrogen or synthetic methane produced through electric processes (PtX) offers some specific advantages over direct electrification. PtX fuels can deliver higher energy flow rates, lower-weight storage, and often higher temperatures, making them strong contenders to replace fossil fuels in industry and transport. PtX can also provide flexibility to the energy system, for example by adjusting production to fluctuations in electricity generation and prices. Finally, transporting PtX fuels can be less costly per kWh than transporting electricity, especially over long distances.
Nevertheless, the least-cost scenario (CNN) foresees only a modest Nordic demand for PPtX fuels, below 50 TWh in 2050, mainly because they are significantly more energy intensive than direct electrification as a decarbonisation option.
Message
five
However, strong arguments support pathways that emphasise the PtX solution track. Competition with direct electrification is close in some cases; should bioenergy become scarcer and more expensive than assumed in the scenarios, PtX would become more competitive. In addition, the EU is pursuing an aggressive hydrogen strategy and industry projects are already underway that could dramatically increase demand for hydrogen.
The NPH scenario shows Nordic hydrogen production reaching 135 TWh in 2050, requiring more than 20% of total Nordic electricity generation. Cases assuming higher European demand results in Nordic hydrogen production levels around 300-500 TWh/year (Figure ES.6).
NCES analysis shows that the potential development of PtX production will have major implications for the Nordic energy transition. For instance, fulfilling the Nordic PtX fuel export potential could require a tripling of Nordic power generation compared to current levels (Figure ES.6). Finally, producing hydrogen from fossil fuels combined with CCS, so-called blue hydrogen, should not be dismissed.

Figure ES.6. Nordic power generation in No, High, and Very High PtX cases, except Iceland. Hydrogen production is a major driver of Nordic power demand. The left panel shows total Nordic electricity generation, the right panel shows hydrogen production in 2050 and associated power demand. Increasing demand for PtX fuels in Europe creates incentives for Nordic countries to scale up power generation, potentially by more than a factor of three by 2050. Wind power, both onshore and offshore, and solar power supply this increase.
Three no-regret actions for PtX:
-
Demonstrate PtX technologies in real operating environments.
-
Strategically locate PtX production and RE refineries in proximity to strong power grids and district heating networks to minimise infrastructure cost and maximise energy efficiency.
-
Develop a roadmap for a Nordic hydrogen infrastructure that considers both green and blue hydrogen.
Bioenergy remains important, but with a shifting role
Bioenergy already plays an important role in Nordic energy systems, used extensively in district heating or as ‘drop-in’ fuels in transport and continues to do so in all NCES scenarios. Capable of being used directly or converted into other solid or liquid fuels, it shares advantages with PtX in versatility and potential to directly substitute fossil fuels. Towards 2050, in parallel with electrification, the use of biomass should, however, shift to increasingly be utilised in hard-to-abate sectors such as heavy transport, steel, and cement (Figure ES.7).
Message
six
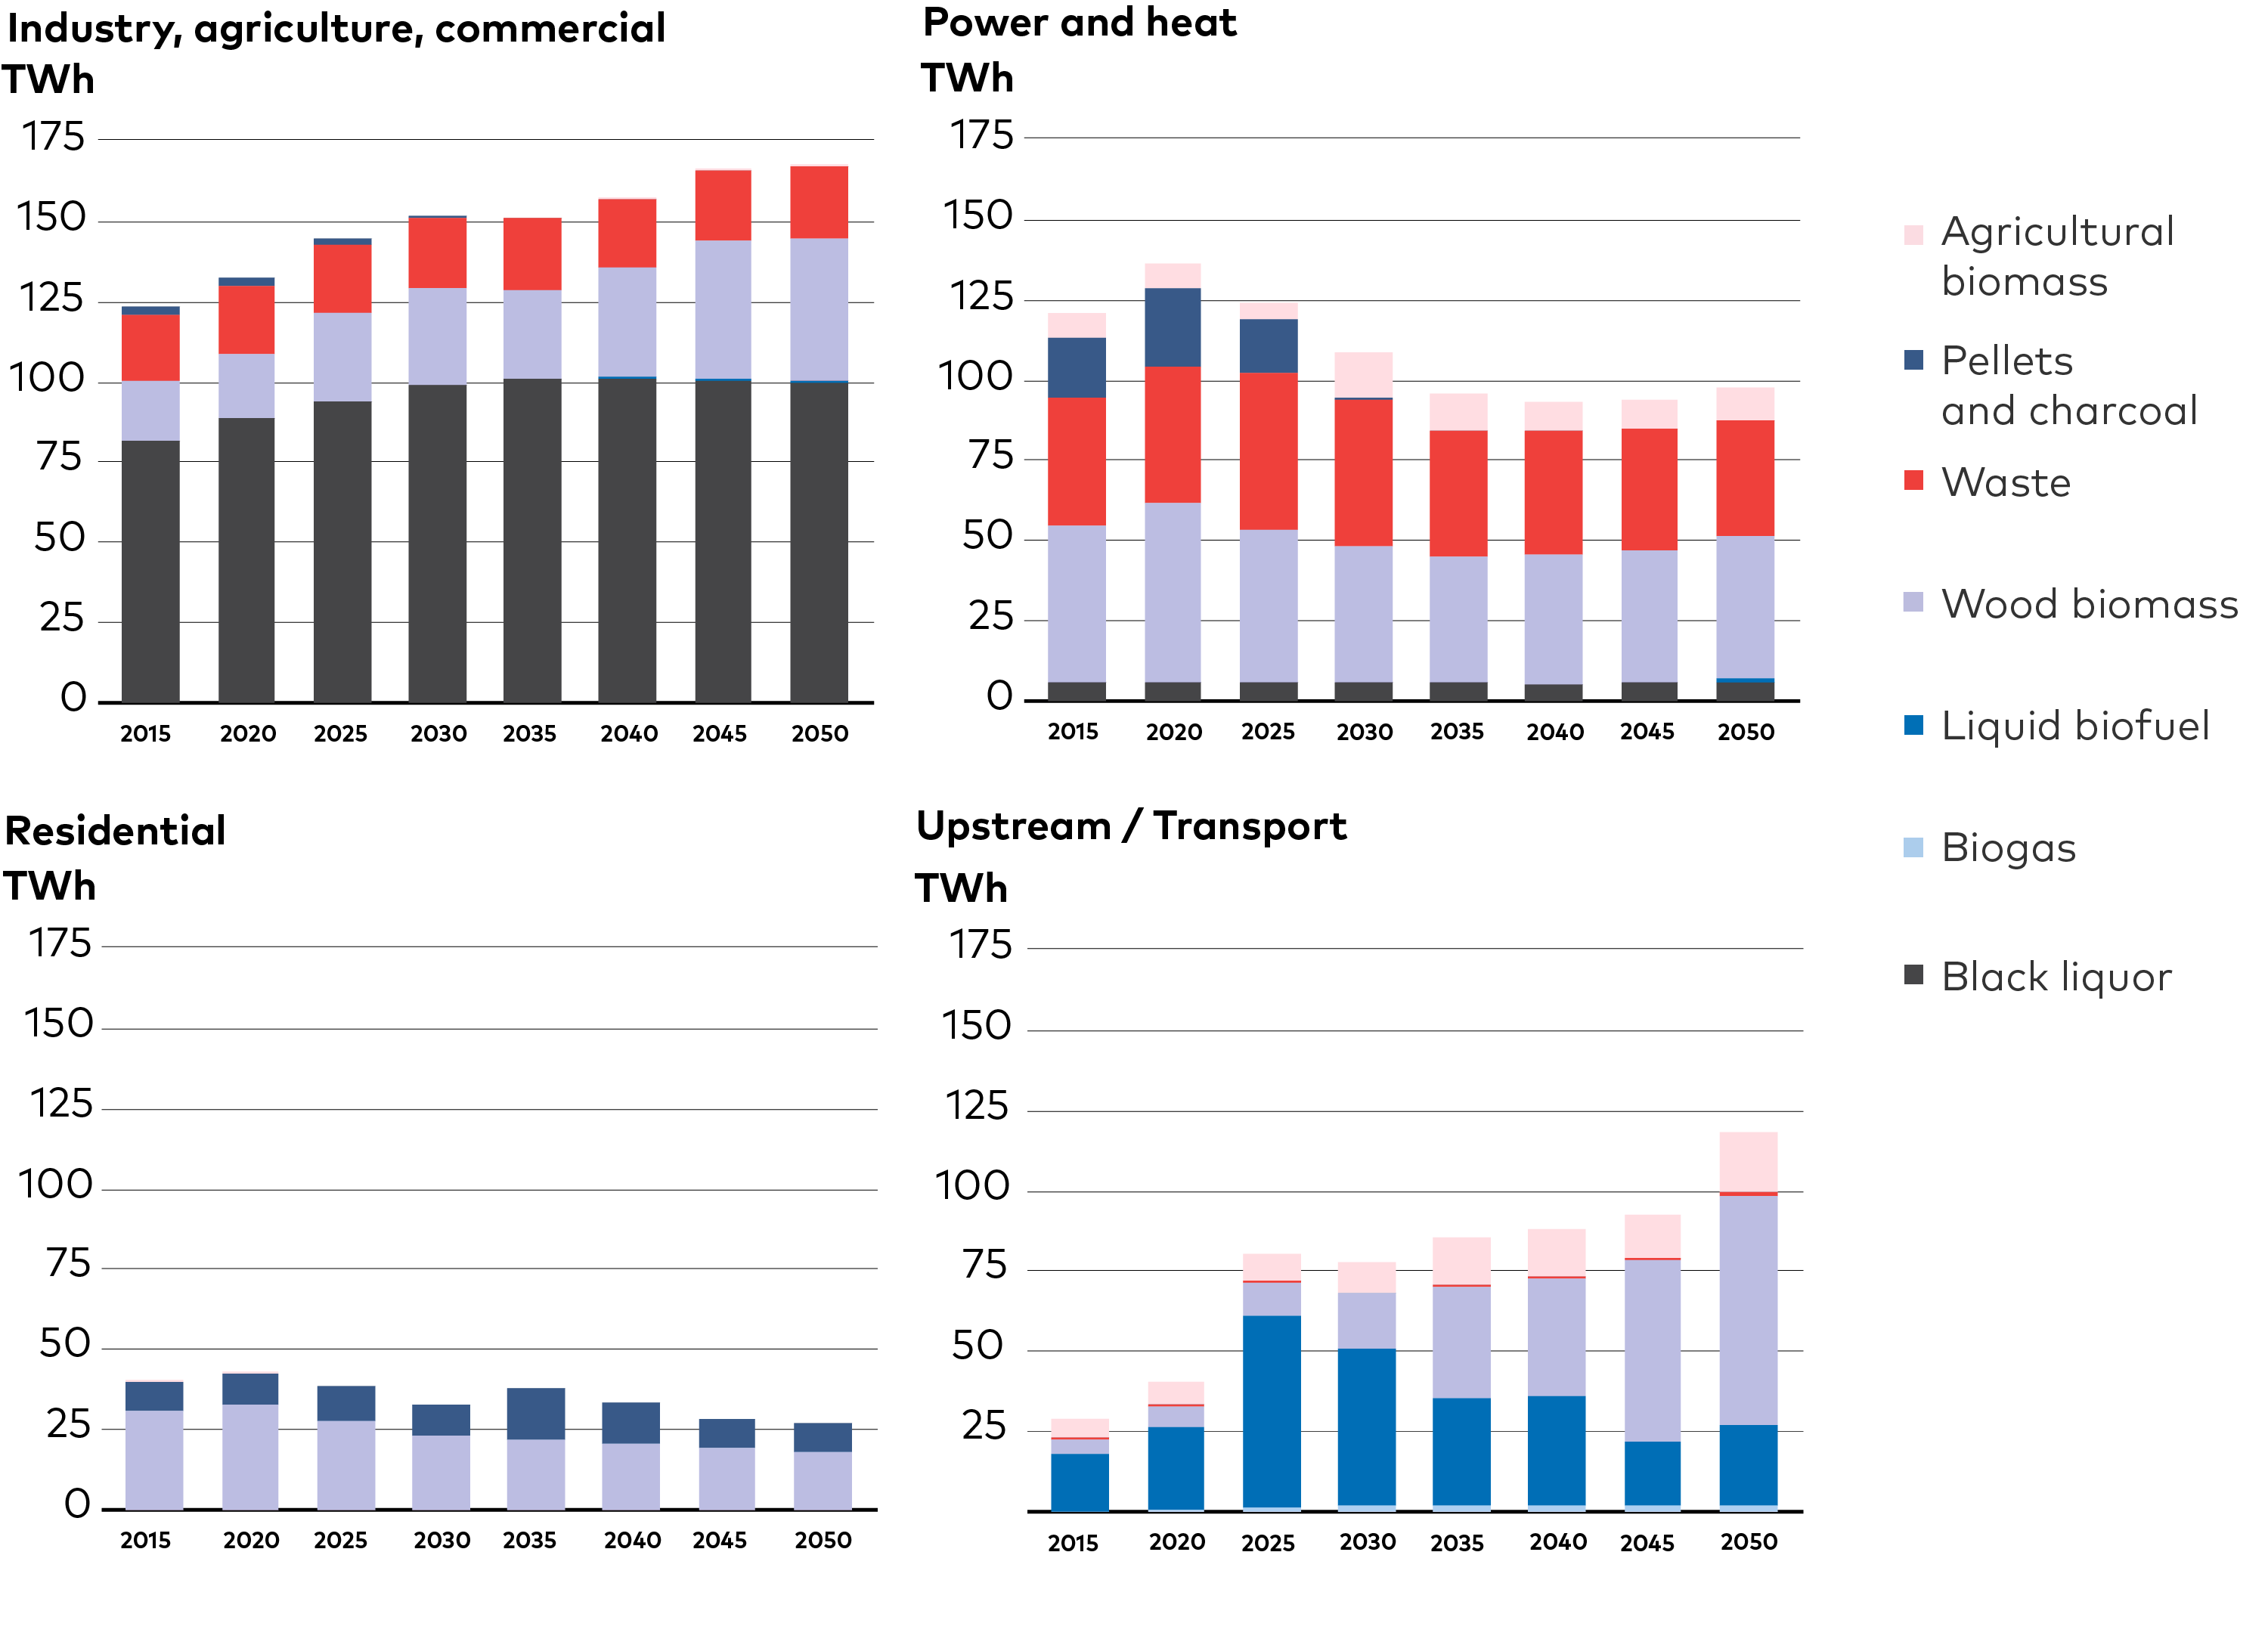
Figure ES.7. Nordic bioenergy demand - CNN scenario. Nordic bioenergy use remains high towards 2050, with transportation and industry driving the increase in demand.
Producing synthetic fuels through the bioenergy route is currently less costly than through PtX; but fossil fuels and first-generation biofuels are cheaper still. Considering expected advances in electrification and other technologies for sustainable fuel production, progress in biorefinery technologies must accelerate to remain competitive even as fossil fuel and first-generation biofuels are phased out. In particular, production processes for advanced biofuels, such as gasification or pyrolysis, will require further development.
In the NCES scenarios, growth in demand for bioenergy is lower than in several previous Nordic scenario studies. As the sustainability of bioenergy is already a topic of concern and land-use pressure is increasing in most parts of the world, the NCES scenarios might thus be less challenging to realise than previous scenarios.
Three no-regret actions for bioenergy:
-
Ensure that mainly waste, wood waste, and forest industry residues are used for bioenergy applications.
-
Ensure adequate biofuel blending requirements in the Nordic countries, including increased mandates for advanced biofuels.
-
Increase and prioritise efforts to produce fossil free aviation fuels.
Carbon capture and storage, and negative emissions are essential
All NCES scenarios assert that achieving net zero emissions will be difficult without technologies for CCS, including technologies that would enable negative emissions. In sectors where no viable alternatives for reducing emissions yet exist, CCS or compensation with negative emissions becomes critical. The Nordic countries are well suited to develop and apply these technologies.
Long experience with the technology, coupled with offshore energy industries and large storage potentials, make Norway an emerging frontrunner. Additionally, the large presence of bio-based sectors, such as pulp and paper, and bioenergy in district heating, offers opportunities to achieve negative emissions through BECCS. Captured CO2 can be used as a raw material of certain PtX fuels, such as synthesised methane. Such use of captured CO2 would not eliminate emissions but could support the transition to decarbonised fuels.
In the CNN scenario, the Nordic region captures and stores ~25 Mt of CO2 in 2050, about 12% of needed reductions from 2020 levels. Some 90% of captured CO2 in 2050 is from biogenic sources and municipal waste; less than 10% is from fossil sources. Large-scale roll-out of CCS is is required from 2030, underscoring the need to develop needed infrastructure and accelerate deployment through policy support.
Message
seven
Three no-regret actions for CCS and negative emissions:
-
Establish clear national positions in support of CCS technologies to build long-term market confidence.
-
Launch initiatives to create economic incentives for negative emissions.
-
Coordinate infrastructure development to reduce investor risk and entry barriers for individual actors.
Behavioural change and social acceptance for infrastructure must be considered
Changes in behaviour will directly impact the Nordic energy transition by affecting energy demand and the associated need for infrastructure. Such changes need to be significant to have a profound impact on scenario results.
For instance, in the CNB passenger transport demand is reduced by 20%, industrial energy demand by 10%, and freight transport volumes by 5%, compared with the CNN. As a result, final energy demand falls by 17% and power demand by only 5% in the Nordic region by 2050, compared to CNN.
Message
eight
Since carbon neutrality is achieved in all NCES scenarios, these changes would lead to only minor differences in CO2 emissions (Figure ES.8). The power of behavioural change lies in its ability to buy time for the transition, reduce pressure on biomass resources, or reduce costs of infrastructure build-outs. Total system costs in the CNB scenario over the period 2020-2050 are about 10% lower than in the CNN scenario. Moreover, reducing transport demand can deliver additional benefits such as decreased congestion, less need for road and parking infrastructure, and improved air quality.
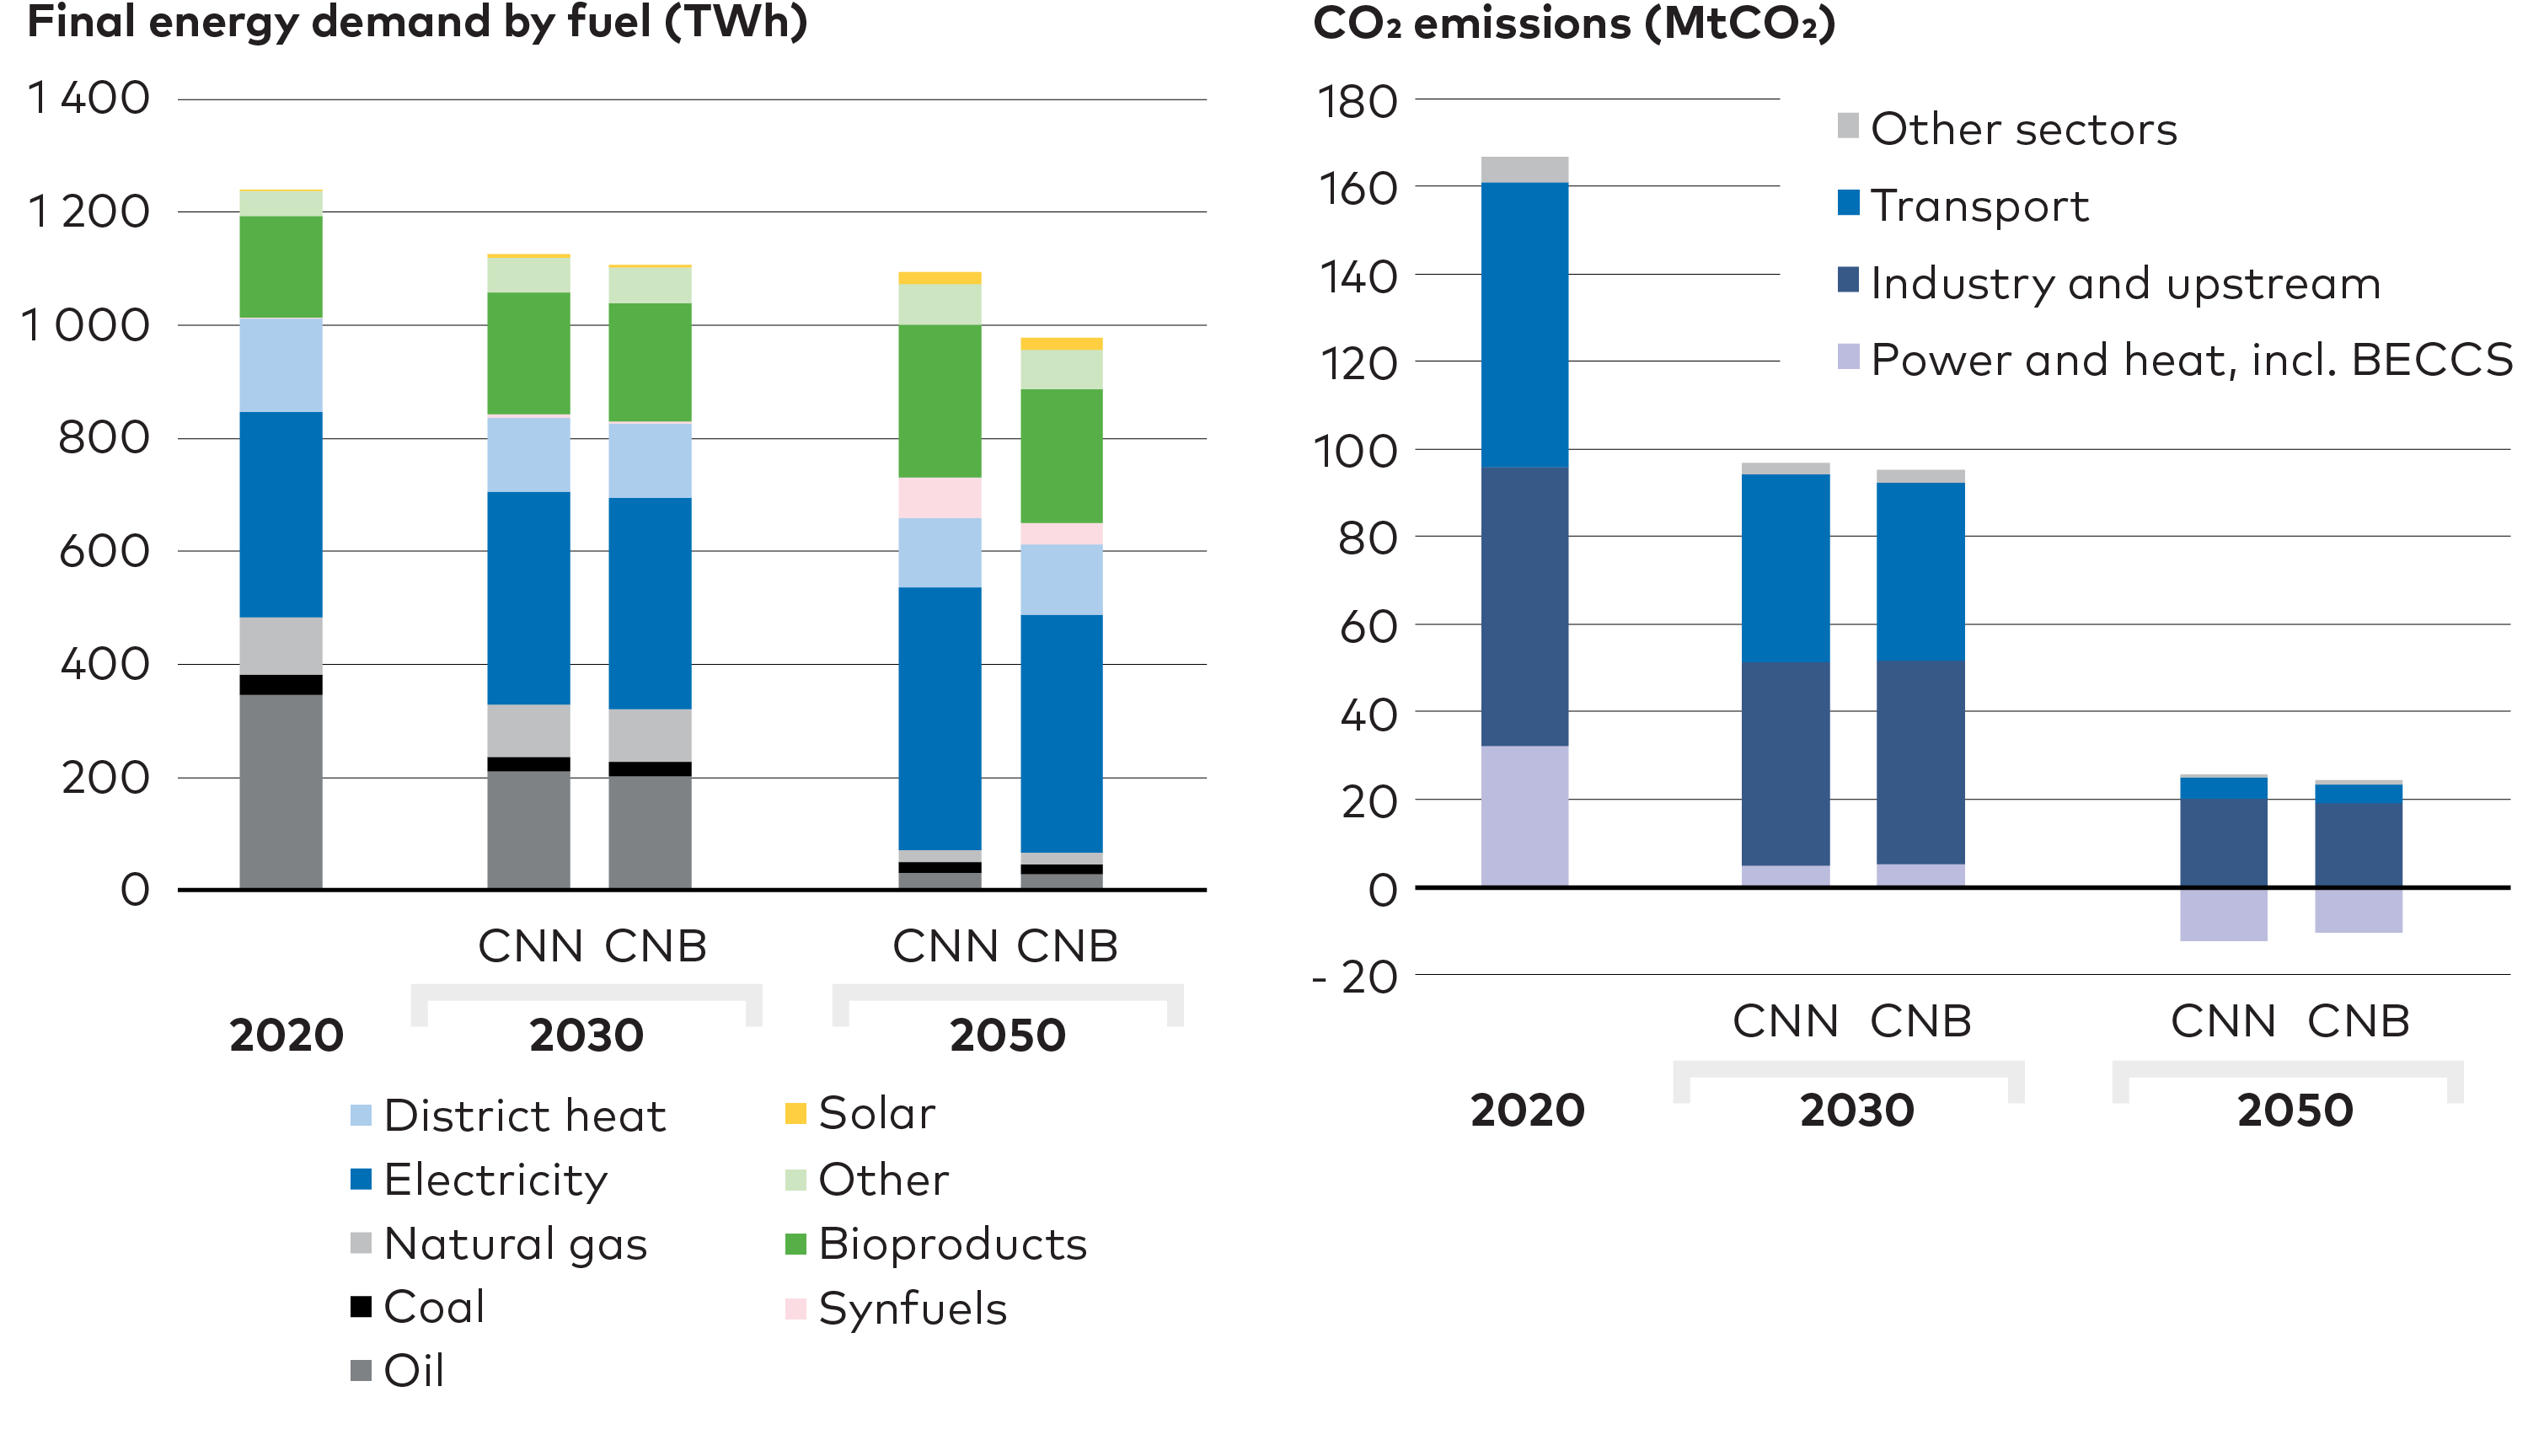
Figure ES.8. Final energy demand (left) and CO2 emissions (right) in CNN and CNB scenarios. Behavioural change must be significant to impact energy system development.
Aspects of behaviour and social acceptance will be very important: even CNB, the scenario with the lowest demand growth, requires a massive scale-up of electricity generation capacity. Already today, public resistance to infrastructure development for renewables and transmission pose a significant challenge. Policy action to promote behaviour changes that reduce energy demand could thus make the NCES scenarios easier to realise.
Three no-regret actions for behavioural change:
-
Improve and plan infrastructure development to promote cycling and public transport.
-
Strengthen policies to encourage lower consumption and preference for products with lower CO2 footprints, through price signals, labelling and information campaigns.
-
Implement measures to support social acceptance of onshore wind by highlighting social justice aspects while also ensuring transparent and inclusive decision-making.
Nordic collaboration is instrumental and would strengthen the Nordics’ Role in the European transition
The potential of Nordic collaboration becomes more apparent as the generation mix in the Nordic electricity sector is transformed, electricity demand rises, and wind generation takes centre stage. The differences between the individual countries’ energy systems are a strength, while the development of necessary infrastructure emerges as a major coordination challenge in all NCES scenarios.
For example, changes in Nordic power flows occur in two dimensions: total trade volumes increase and the importance of Norwegian export grows stronger (Figure ES.9). Together, these shifts require a 60-70% increase in exchange capacity among Nordic bidding zones. In addition, considerable investments in both direct and hybrid interconnectors to neighbouring markets are envisaged.
Message
nine
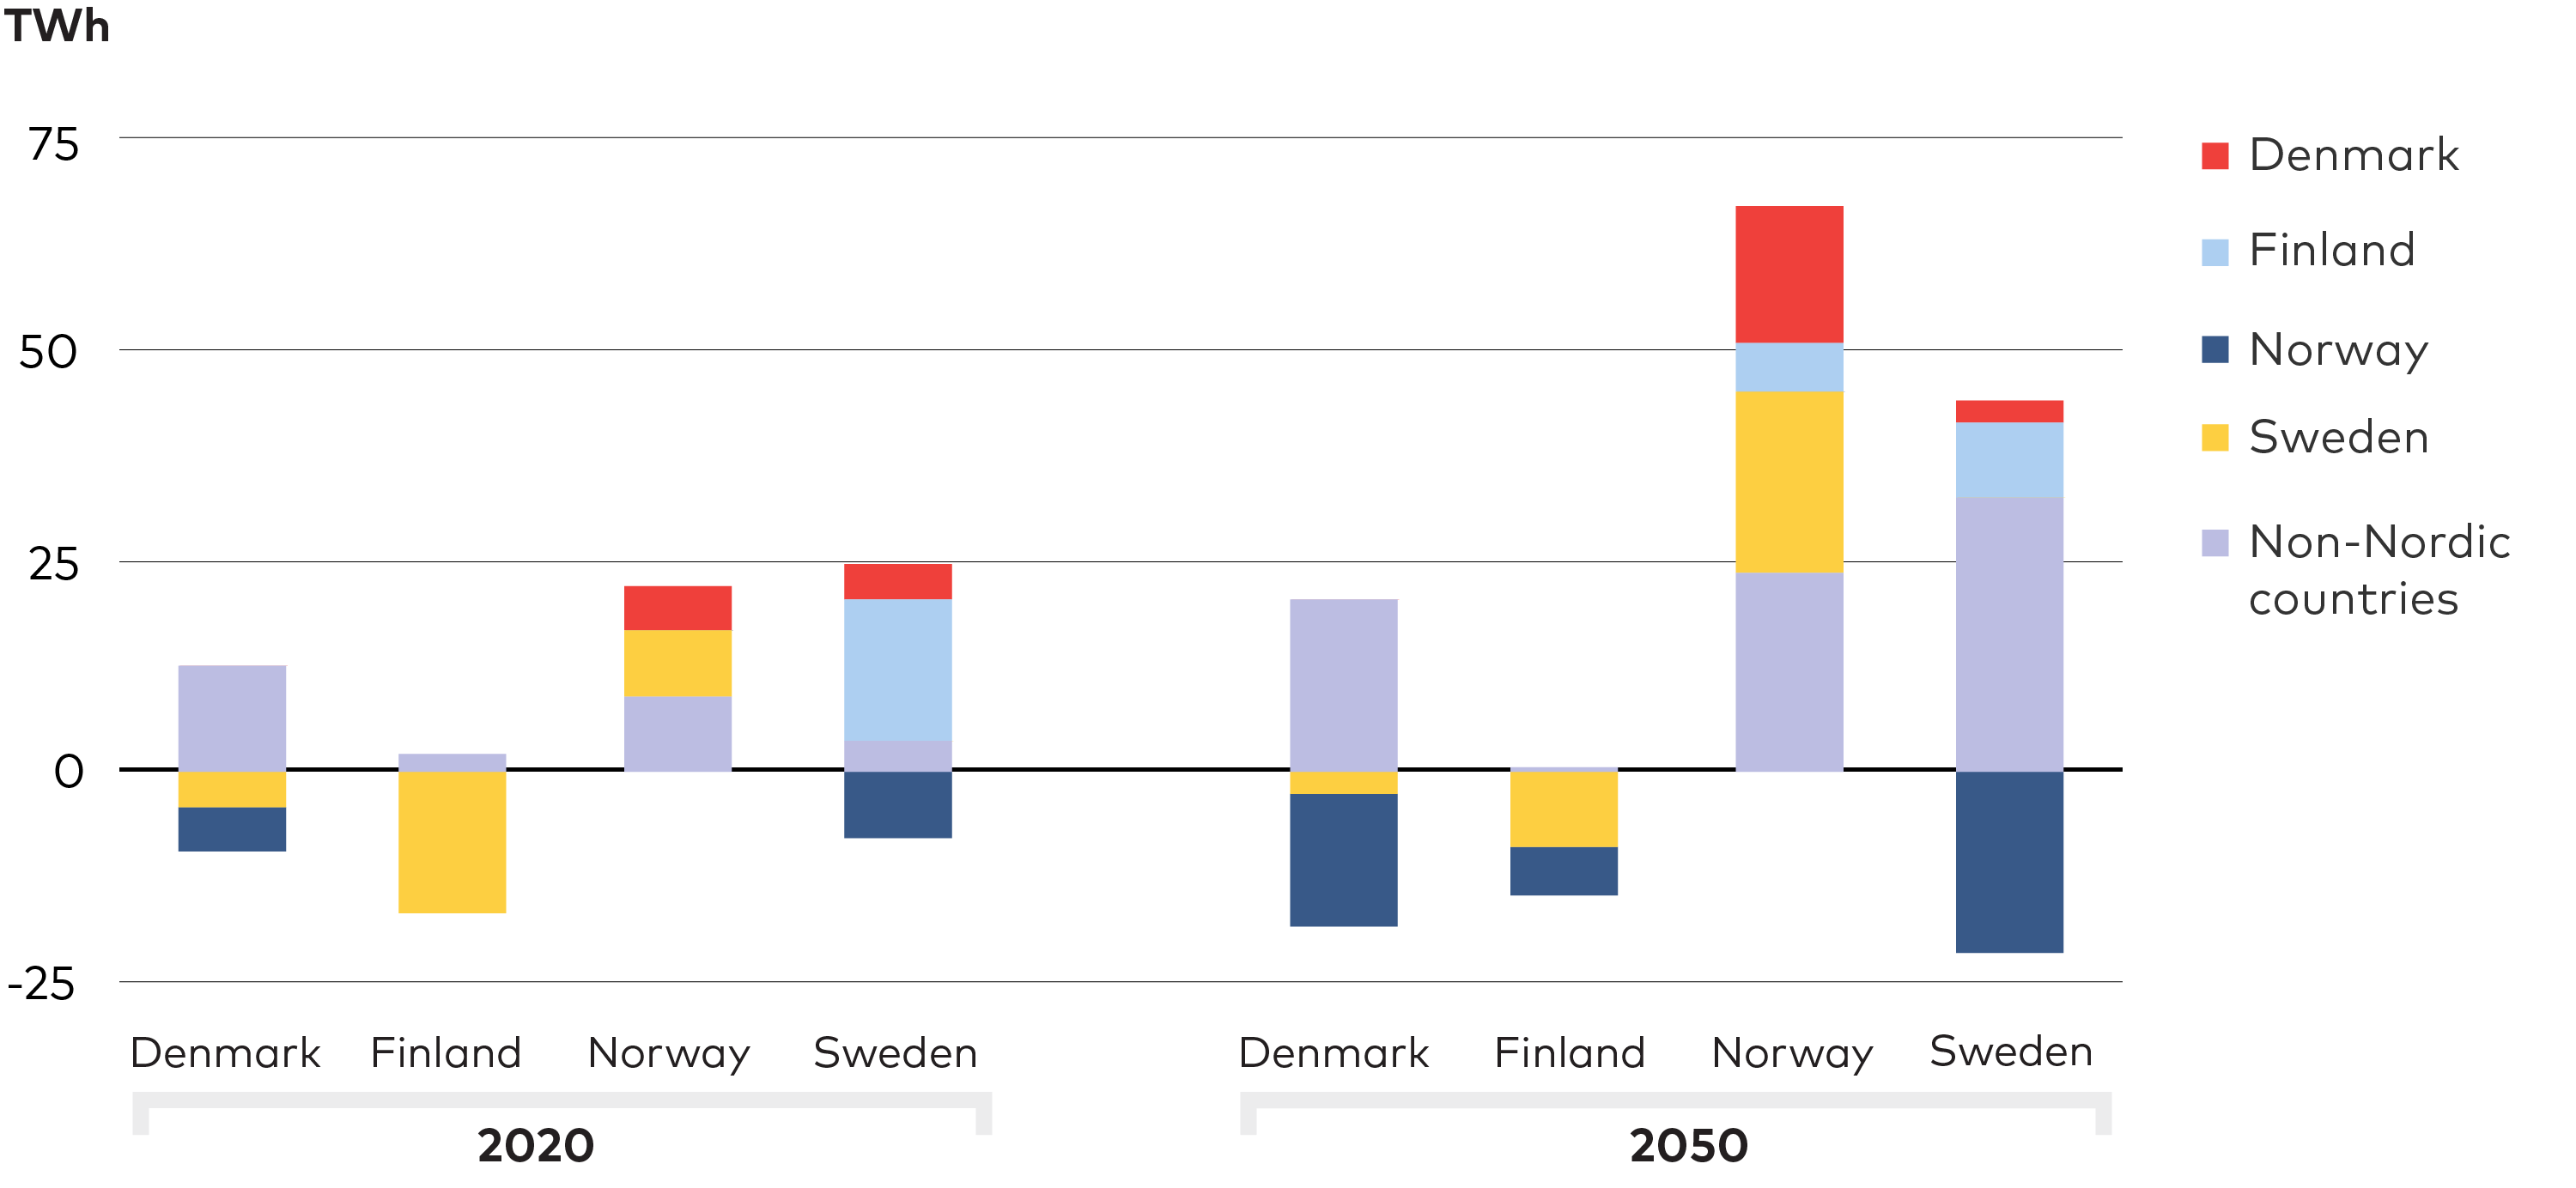
Figure ES.9. Trade flows among Nordic countries - NoPtX case. Comparison of net trade flows among the Nordic countries in the NoPtX case in 2020 and 2050. Negative numbers indicate a net import while positive numbers indicate a net export.
The balancing offered by Norwegian hydropower may be instrumental in a future Nordic power system dominated by wind generation, while Swedish and Danish transmission grids and interconnectors facilitate the transit of large net electricity exports from Norway to continental Europe.
PtX offers flexibility to the power system and an alternative way of exporting Nordic power surplus, representing substantial potential export value for all the Nordic countries. In turn, PtX fuel export would relieve the electricity grid, deliver large revenues for Nordic energy companies, and have the potential to significantly reduce European greenhouse gas (GHG) emissions. But it would require infrastructure development that involves several Nordic countries.
With CCS emerging as an important element of Nordic decarbonisation, collaboration in infrastructure development would be beneficial. Synergetic effects exist here as well, for both the Nordic region and from a larger perspective within the overall European energy transition.
If, however, infrastructure investments are perceived as being made only for the sake of energy exports or for the benefit of other countries, they are likely to meet strong public resistance. That makes concerted planning, citizen involvement, and new cost distribution mechanisms instrumental for a cost-effective and socially acceptable transition of the Nordic energy sector and its contribution to Europe as a whole.
Three no-regret actions for Nordic collaboration:
-
Strengthen joint Nordic action plans for infrastructure needs and development.
-
Develop a joint Nordic roadmap for the role of PtX, including identification of the most promising sites for production in the Nordics.
-
Develop a joint Nordic CCS strategy to increase the potential to realise economies of scale in transportation and storage of captured carbon.
Robust results provide confidence for critical near-term actions
While the NCES scenarios identify uncertainties, their inevitable presence should not be used as a pretext for taking no action. Regardless of which decarbonisation pathway is pursued, certain near-term actions and investments clearly deliver substantial benefits.
Stronger grids, increased flexibility, wind and solar electricity deployment, electrification of transport, and CCS technologies are vital to all NCES scenarios. Existing solutions, such as bioenergy and district heating, continue to be important while innovative market developments can unlock the potential of both emerging and existing technologies. Importantly, NCES modelling finds that decarbonisation is unlikely to push wholesale electricity prices higher.
Energy demand reduction through efficiency improvements and behavioural change will make policy targets easier and less costly to reach. Decisive actions are required to realise the potential in all these areas; not acting undermines the achievement of stated goals and risks driving up the associated costs.
Message
ten
Three no-regret actions for near-term Nordic collaboration:
-
Reform grid planning to enable shorter lead times and more proactive expansion, while looking for system-smart local solutions that can reduce grid capacity needs.
-
Ensure that electricity markets are designed to incentivise investments aligned with decarbonisation targets as well as other policy objectives such as energy security.
-
Accelerate public investments in research, development, demonstration, and deployment (RDD&D), including in CCS technologies, biorefining and PtX.
 PHOTO: JOHANNES JANSSON/NORDEN.ORG
Chapter 1
Nordic Countries are Committed to Carbon Neutrality
In 2019, the Nordic countries - Denmark, Finland, Iceland, Norway, and Sweden – signed a joint Declaration on Carbon Neutrality, committing to make the Nordic countries carbon neutral, in line with the COP21 Paris Climate Agreement. The declaration commits the Nordic countries to assess scenarios for how to achieve carbon neutrality, including the implications such scenarios would entail for various sectors. Individually and collectively, these countries already have among the most ambitious energy and climate policy agendas in the world. The declaration emphasised the necessity and benefit of collaborative action and invited the Nordic Council of Ministers to prepare a proposal on how to achieve this aim.
To support this commitment Nordic Energy Research (NER) commissioned the Nordic Clean Energy Scenarios project (NCES). The aim of this project is to identify and help prioritise, through scenario modelling, what actions will be necessary by 2030 and to map potential long-term pathways to carbon neutrality. Several shifts over the past decade have had significant influence on Nordic energy policy, making the region well positioned to pursue carbon neutrality:
Raised political ambitions for carbon neutrality – including through energy policy – is gaining momentum. NCES builds on work done in previous NER projects, such as the Nordic Energy Technology Perspectives projects (NETP), Flex4RES, and SHIFT, all assessing ways to reach carbon neutrality. The very first scenario analysis was published in 2013. At that time, Denmark, Norway, and Sweden were the only Nordic countries with national targets to become fossil free or carbon neutral, and the European Union (EU) had a target to reduce greenhouse gas (GHG) emissions by 40% from 1990 levels by 2030.
Less than a decade later, in April 2021, the EU strengthened its target to a 55% reduction by 2030 and to reach carbon neutrality by 2050. At the regional level, all five Nordic countries have now set carbon neutrality aims in their domestic policies and more specifically targeted the energy sector for ambitious climate mitigation targets. Being a corner stone of any society, the energy sector will be a main driver for deep decarbonisation of the Nordic economy as a whole, unlocking the ability for other sectors to follow.
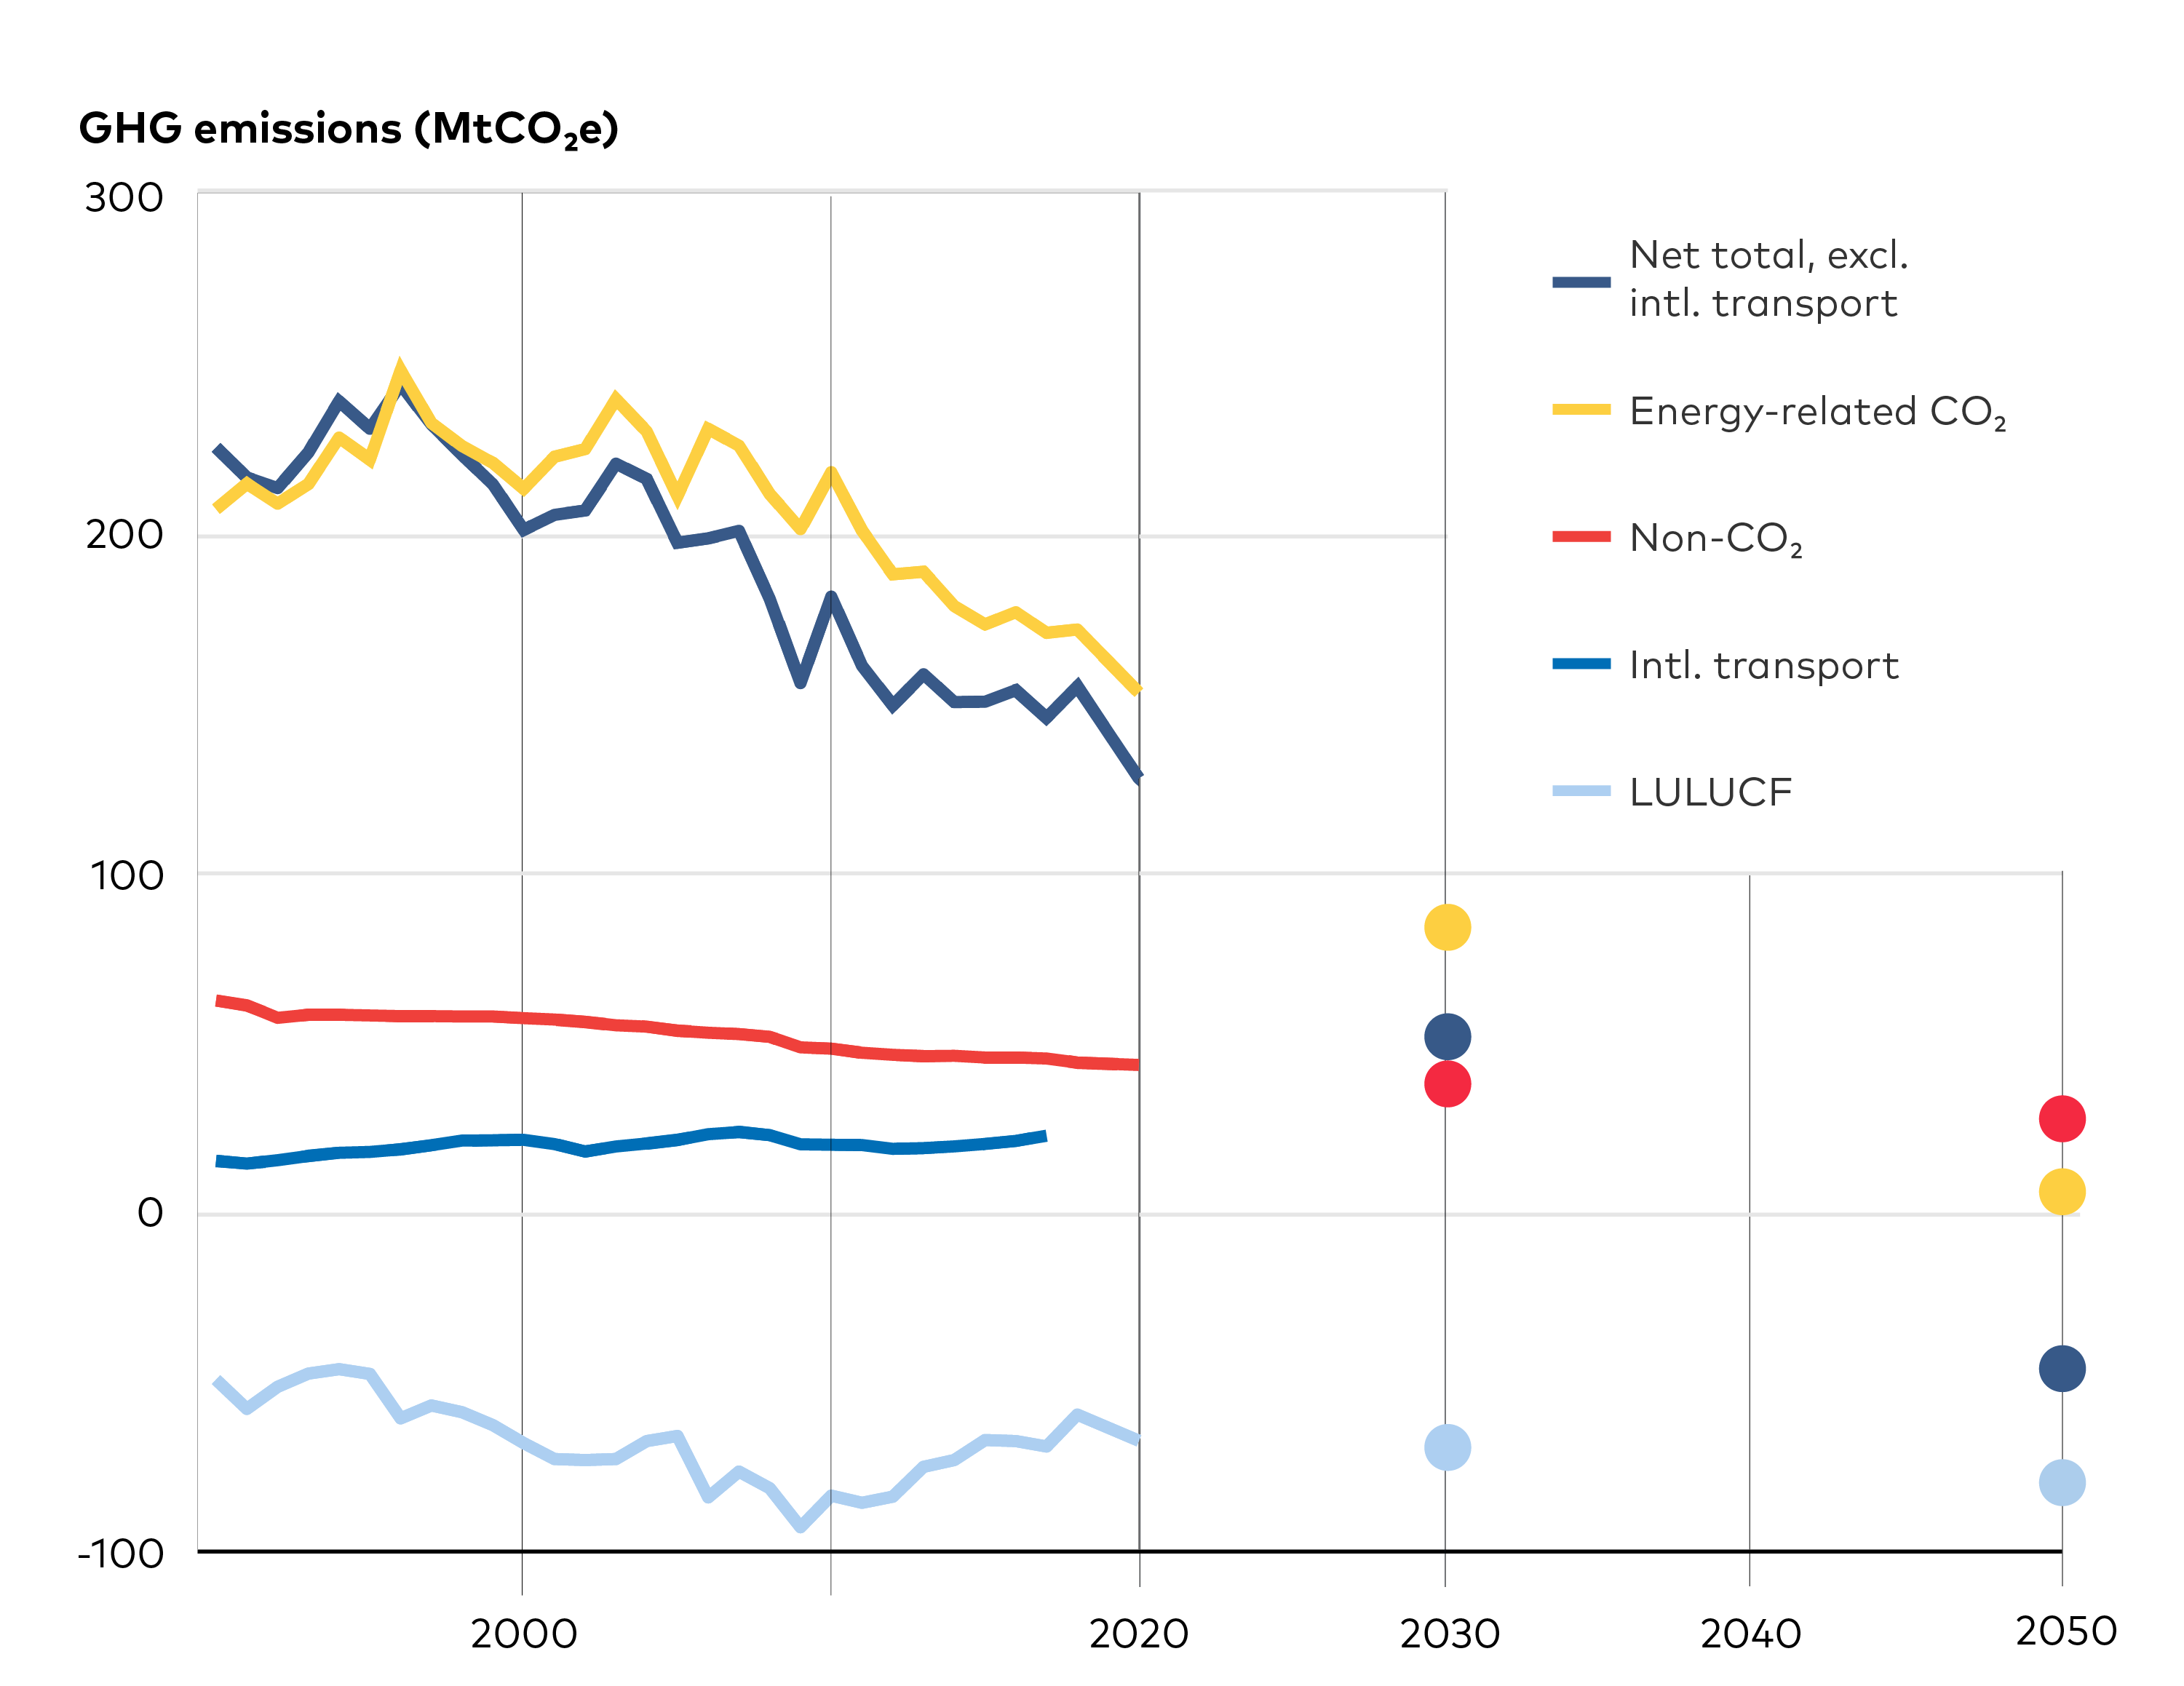
Figure 1.1. Sum of Nordic historic GHG emissions and plotted sum of Nordic national targets. Sum of Nordic GHG emissions, with plotted emission trajectories for fulfilment of national targets. Note: The emissions of international transportation are not included in national targets.
Source: European Environment Agency (EEA), 2019a; European Commission (EC), 2020; EEA, 2019b; EEA, 2019c. Additional national documentations were used for Finland, Iceland, and Norway when more recent than common reports or additional details were needed for non-CO2 or Land Use, Land-Use Change and Forestry (LULUCF): Koljonen et al., 2020; Ministry for the Environment and Natural Resources, 2018; Government of Iceland, 2020; Miljødirektoratet, 2020.
Acknowledgement that current approaches are not delivering the rate of change required to achieve carbon neutrality. Nordic energy regulation has, broadly speaking, been focused on cost-effectiveness and liberalisation for the last 25 years, and in many respects this has worked well. However, over the period 2009-2018, energy related CO2 emissions in the Nordic fell by an average of 2% annually. This is well short of the pace needed to reach carbon neutrality. In the coming decade (2021-2030), it will be necessary to achieve annual emission reduction rates of around 10%.
As doubts arise, about the ability of technology neutrality and increased competition to make up the sole tools to stimulate the transition required, calls are emerging to make the pace of the transition a primary driver of decision-making and action.
Greater recognition of the need to incorporate decision-making criteria beyond cost-effectiveness to also include long-term technical potential, environmental protection, and social considerations. While achieving carbon neutrality will require large investments, several studies suggest that absolute costs are unlikely to be the main barrier to reaching the objective.[1]OECD/IEA & NER, 2016; NEPP, 2020. Thus, although cost-effectiveness remains important, using it as the only parameter against which to benchmark actions is too narrow in scope. Interlinked factors, such as political feasibility, public acceptance, and distributional impacts also need to be considered.
Footnotes
- ^ OECD/IEA & NER, 2016; NEPP, 2020.
Electrification, both direct and indirect, has emerged as a central strategy in reaching climate policy objectives. This is to some extent driven by continued cost reductions in key technologies, such as wind power and batteries, and partly by the realisation that electrification is one of few viable routes to reduce emissions in hard-to-abate sectors, such as steel and chemicals.
Moreover, the role of indirect electrification – through ‘power-to-X’ (PtX) and green hydrogen solutions – is receiving unprecedented public attention, and these technologies will be able to play an important role in the Nordic energy system. Consequently, the NCES shows electrification taking a much larger role in terms of importance to the clean energy transition compared with scenarios developed in the early 2000’s.
PROJECT SCOPE
The NCES project focuses on activities that cause energy-related CO2 emissions, which represent ~80% of total Nordic GHG emissions. The adopted definition of carbon neutrality by this project sets the limit for total energy-related CO2 emissions in each modelled scenario without defining or prioritising specific measures in certain sectors. The project analyses all combustion of fossil fuels in the economy, including process-related CO2 emissions from industry. International transport, while not part of national targets, is included in the modelling. International aviation is allowed emissions at 2019 levels until 2030, then reduces linearly to zero by 2050, while emissions from international shipping are reduced by 90% from 2019 levels by 2050. The analysis excludes non-CO2 gases, which stem primarily from agriculture and waste management, and emissions related to land use, land-use change and forestry (LULUCF). The NCES scenarios do, however, include assumptions on non-CO2 gases and LULUCF, based on previous studies that assess how emission rates from these activities are likely to develop, in order to estimate total GHG emissions.
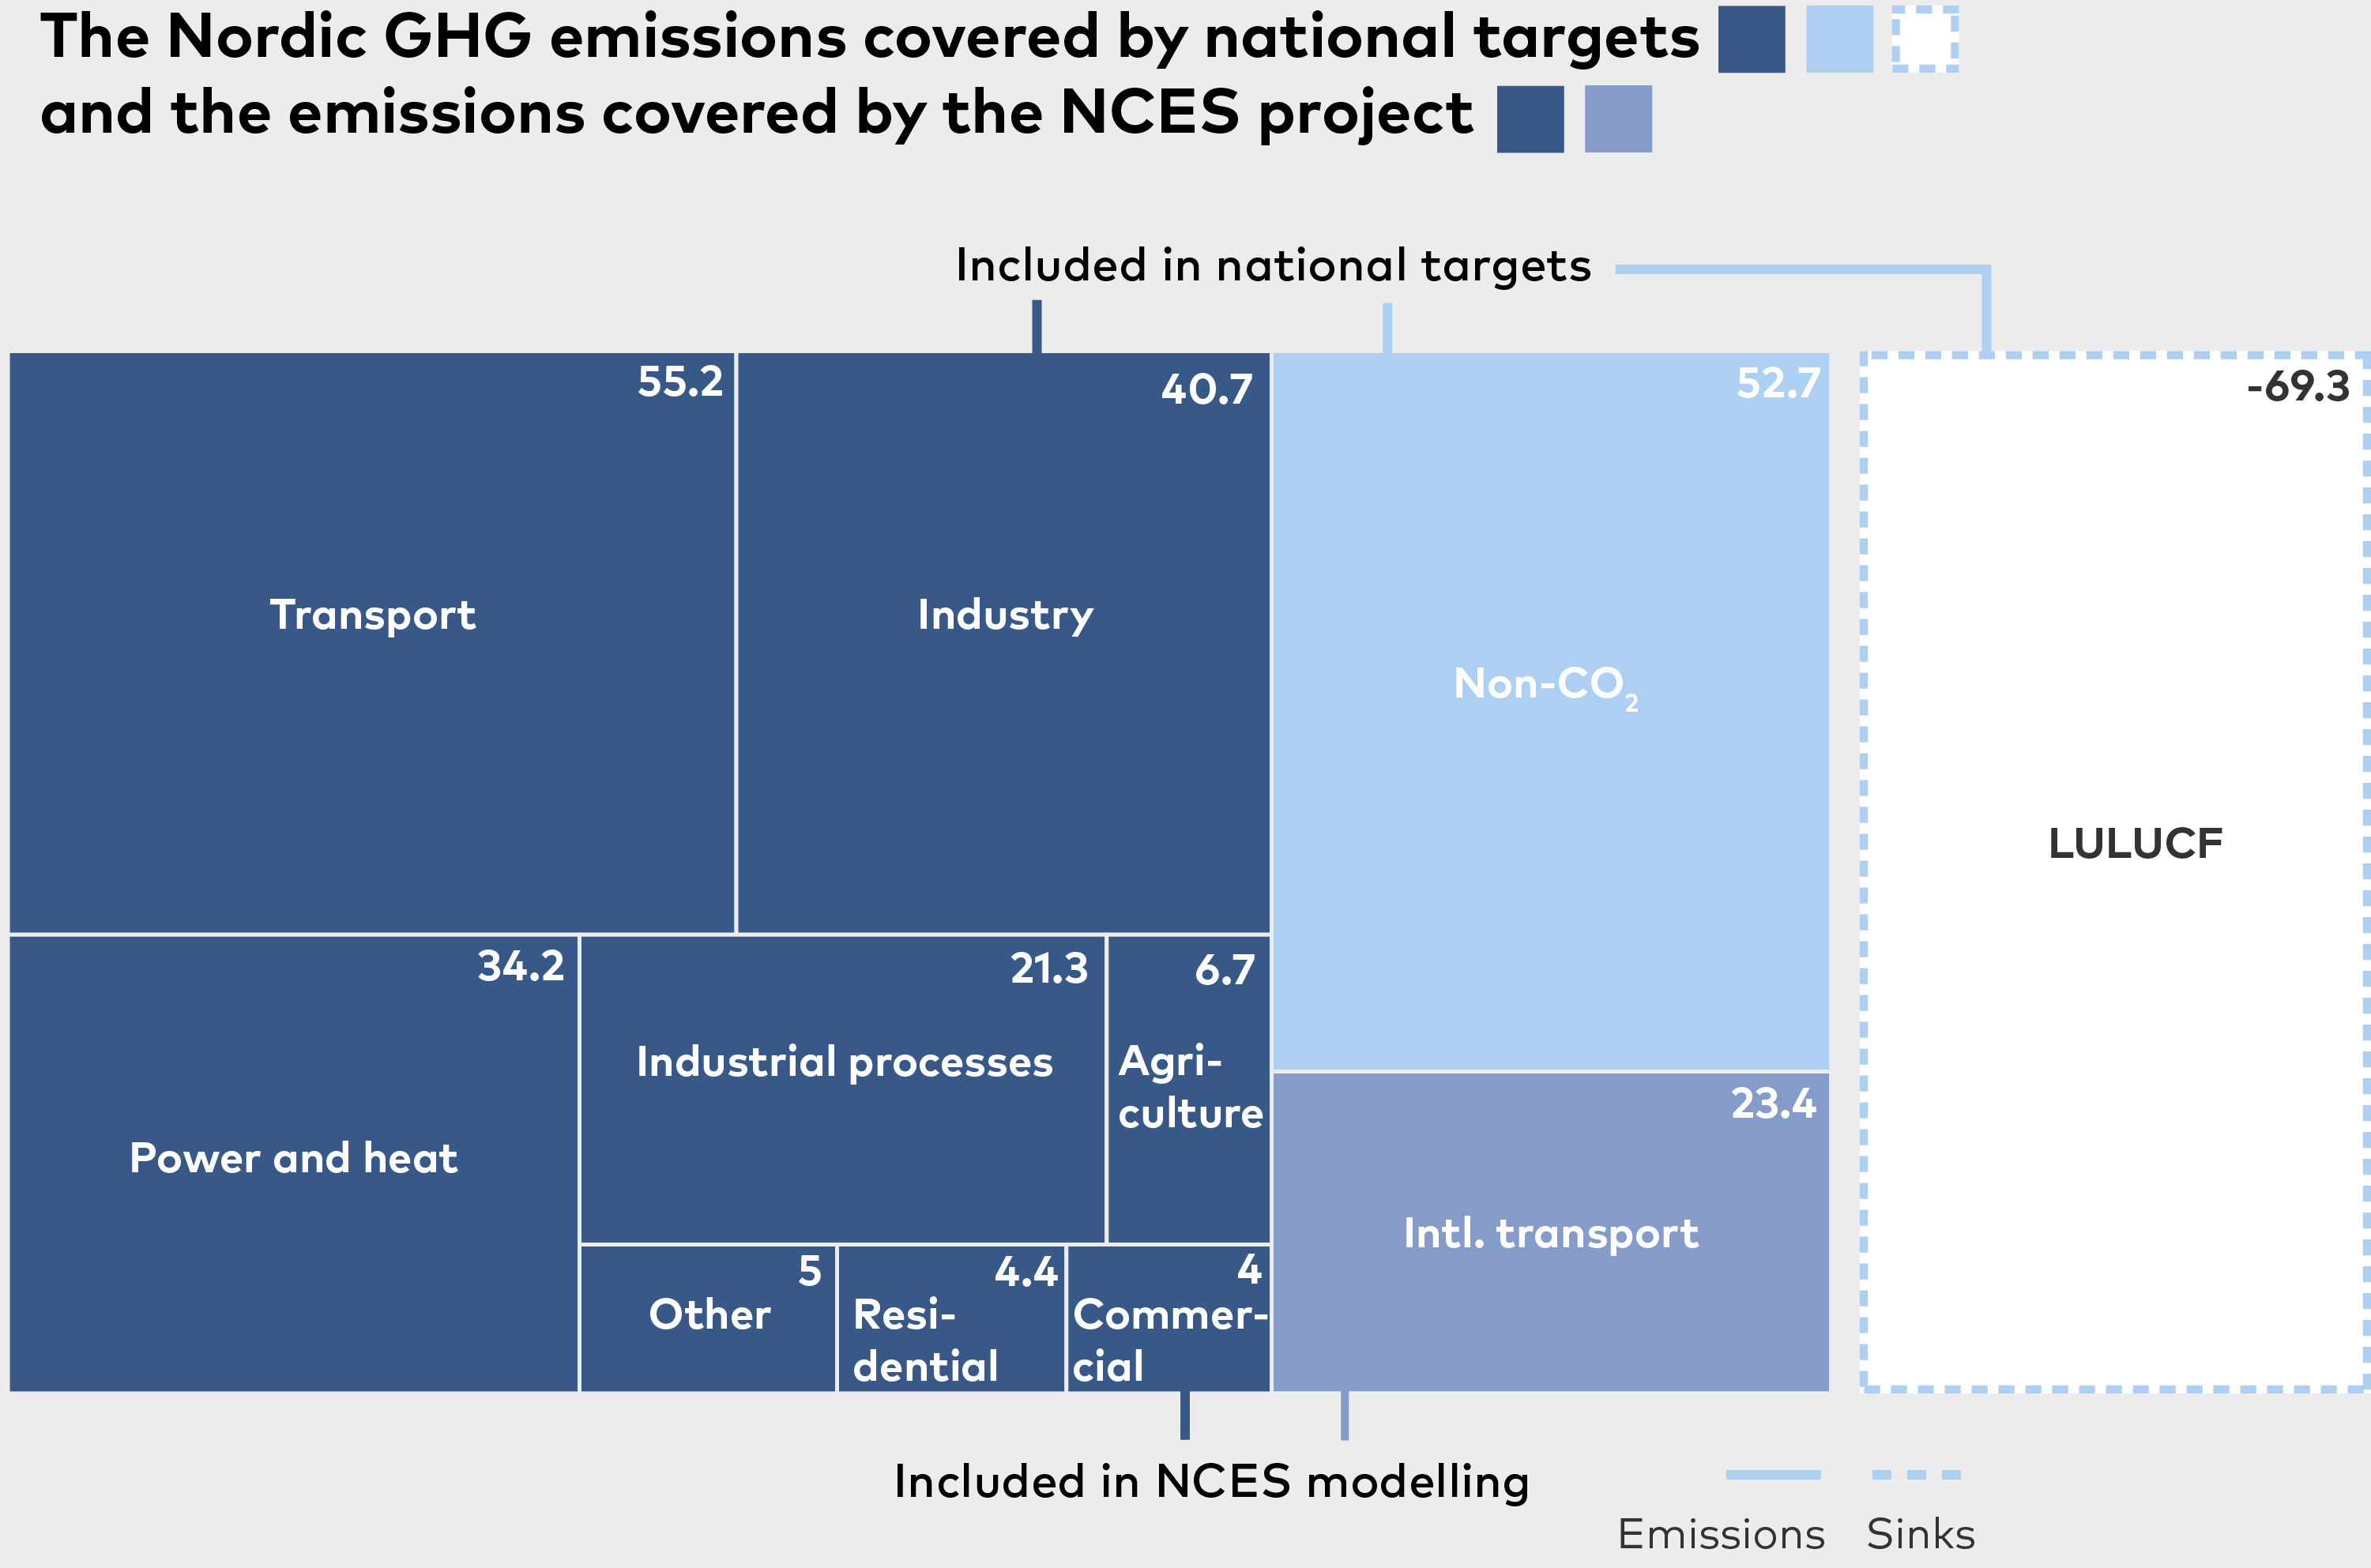
Figure 1.2. Scope of the NCES project. Note that NCES scenarios include international transport.
Why a carbon budget does not define the limits of the NCES
The concept of remaining carbon budgets – the representation of future cumulative CO2 emissions consistent with keeping global warming to a specified level – has gained broad acceptance among both policy makers and the public. Setting an absolute limit on global carbon emissions – as is done by the United Nations Intergovernmental Panel on Climate Change (IPCC) – provides a clear indication for limiting global warming to 1.5°C above pre-industrial levels. Meaning that carbon budgets and carbon neutrality targets, as investigated in this project, do not necessarily align: a target set for 2050 becomes irrelevant if the carbon budget is used up by 2030. Due to its ability to more definitively represent when the climate system will reach a tipping point application of a remaining carbon budget was requested in the commission of this project.
However, to apply a carbon budget in NCES would entail taking into account uncertainties at the global level along with the vast span of potential national budgets, where the methods used for allocation would aggregate economic, political, and ethical views. Depending on the allocation method used, the remaining carbon budget for the Nordic region ranges from a low of 100 MtCO2 to 2,000 MtCO2.
As the project aim is to illustrate pathways to achieve national targets, formulated to reach carbon neutrality, it therefore becomes difficult to use a carbon budget as the framework for providing the requested analysis. Therefore, the NCES scenarios aim to reach carbon neutrality in a given year, see table 1.1 below for the applied national targets and the resulting application in NCES modelling. However, the NCES project provides an opportunity to explore the potential span of remaining carbon budgets for the Nordic countries via an interactive web tool, developed by Energy Modelling Lab and Tøkni, that can be accessed at www.nordicenergy.org along with other resources from the NCES project.[1]Apart from this report and the mentioned carbon budget tool, the NCES project has produced a technology catalogue that details the costs and performance of a large suite of energy technologies and a database of Nordic energy indicators. These resources can all be accessed through the Nordic Energy Research website www.nordicenergy.org.
Footnotes
- ^ Apart from this report and the mentioned carbon budget tool, the NCES project has produced a technology catalogue that details the costs and performance of a large suite of energy technologies and a database of Nordic energy indicators. These resources can all be accessed through the Nordic Energy Research website www.nordicenergy.org.
Table 1.1. The main differences between the Nordic countries use of carbon neutrality targets arise in target years for reaching the goal, their mid-term targets, and in the use of carbon credits. The difference in target years cannot be directly compared as some countries allow the use of carbon credits and some will benefit from considerable forest carbon sinks. In this table a summary of the application of national carbon neutrality targets are presented.
| DENMARK | FINLAND | ICELAND | NORWAY | SWEDEN | NORDICS | |
| Target year for carbon neutrality | 2050 | 2035 | 2040 | 2030 | 2045 | No common Nordic target |
| Additional targets included in modelling | Domestic GHG -70% by 2030 from 1990. | Domestic GHG excl. LULUCF -80% by 2050 from 1990. | None | Domestic GHG excl. LULUCF -80% by 2050 from 1990. | None | N/A |
| Included domestic GHG emissions | All GHGs incl. LULUCF, but excl. international transport | All GHGs incl. LULUCF, but excl. international transport | All GHGs incl. LULUCF, but excl. international transport | All GHGs incl. LULUCF, but excl. international transport | All GHGs, partially included LULUCF | |
| Assumption for use of carbon credits | None. International credits might become an option in Denmark, but those are not assumed here. | None | Yes. Norway would reach the 2030 target with credits. Domestic measures would reduce net GHG by 67% by 2030 compared to 1990. | Yes. Sweden aims for 85% reduction from domestic GHG excl. LULUCF by 2045. The remaining 15% (10.7 MtCO2e) can be from additional LULUCF measures, BECCS, or international credits | N/A | |
| Modelled energy-related CO2 by 2050, excl. intl. transport | -5 MtCO2 | +8 MtCO2e | -5 MtCO2e | +5 MtCO2e | +1 MtCO2e | +4 MtCO2e |
| Net total GHG at 2050 (energy-related CO2 excl. intl. transport, LULUCF, and non-CO2) | 0 MtCO2e | -8 MtCO2e | -1 MtCO2e | -9 MtCO2e | -29 MtCO2e | -46 MtCO2e |
1.1 The Nordic region is well positioned to be a front-runner for carbon neutrality
With a history of energy and climate policy that taps into extensive natural resources, the Nordic countries are in a good position, relative to both EU28 and global averages, to aggressively pursue a clean energy transition. In relation to the global CO2 intensity of electricity, Nordic generation is performing very well (Figure 1.3). This creates a strong starting point and will be a great asset in the years to come as clean electricity plays a central role in decarbonising sectors that account for a large CO2 footprint in relation to their gross value added contributions to the Nordic economy (Figure 1.4). Nordic heat supply, particularly for buildings, also has a low CO2 footprint.
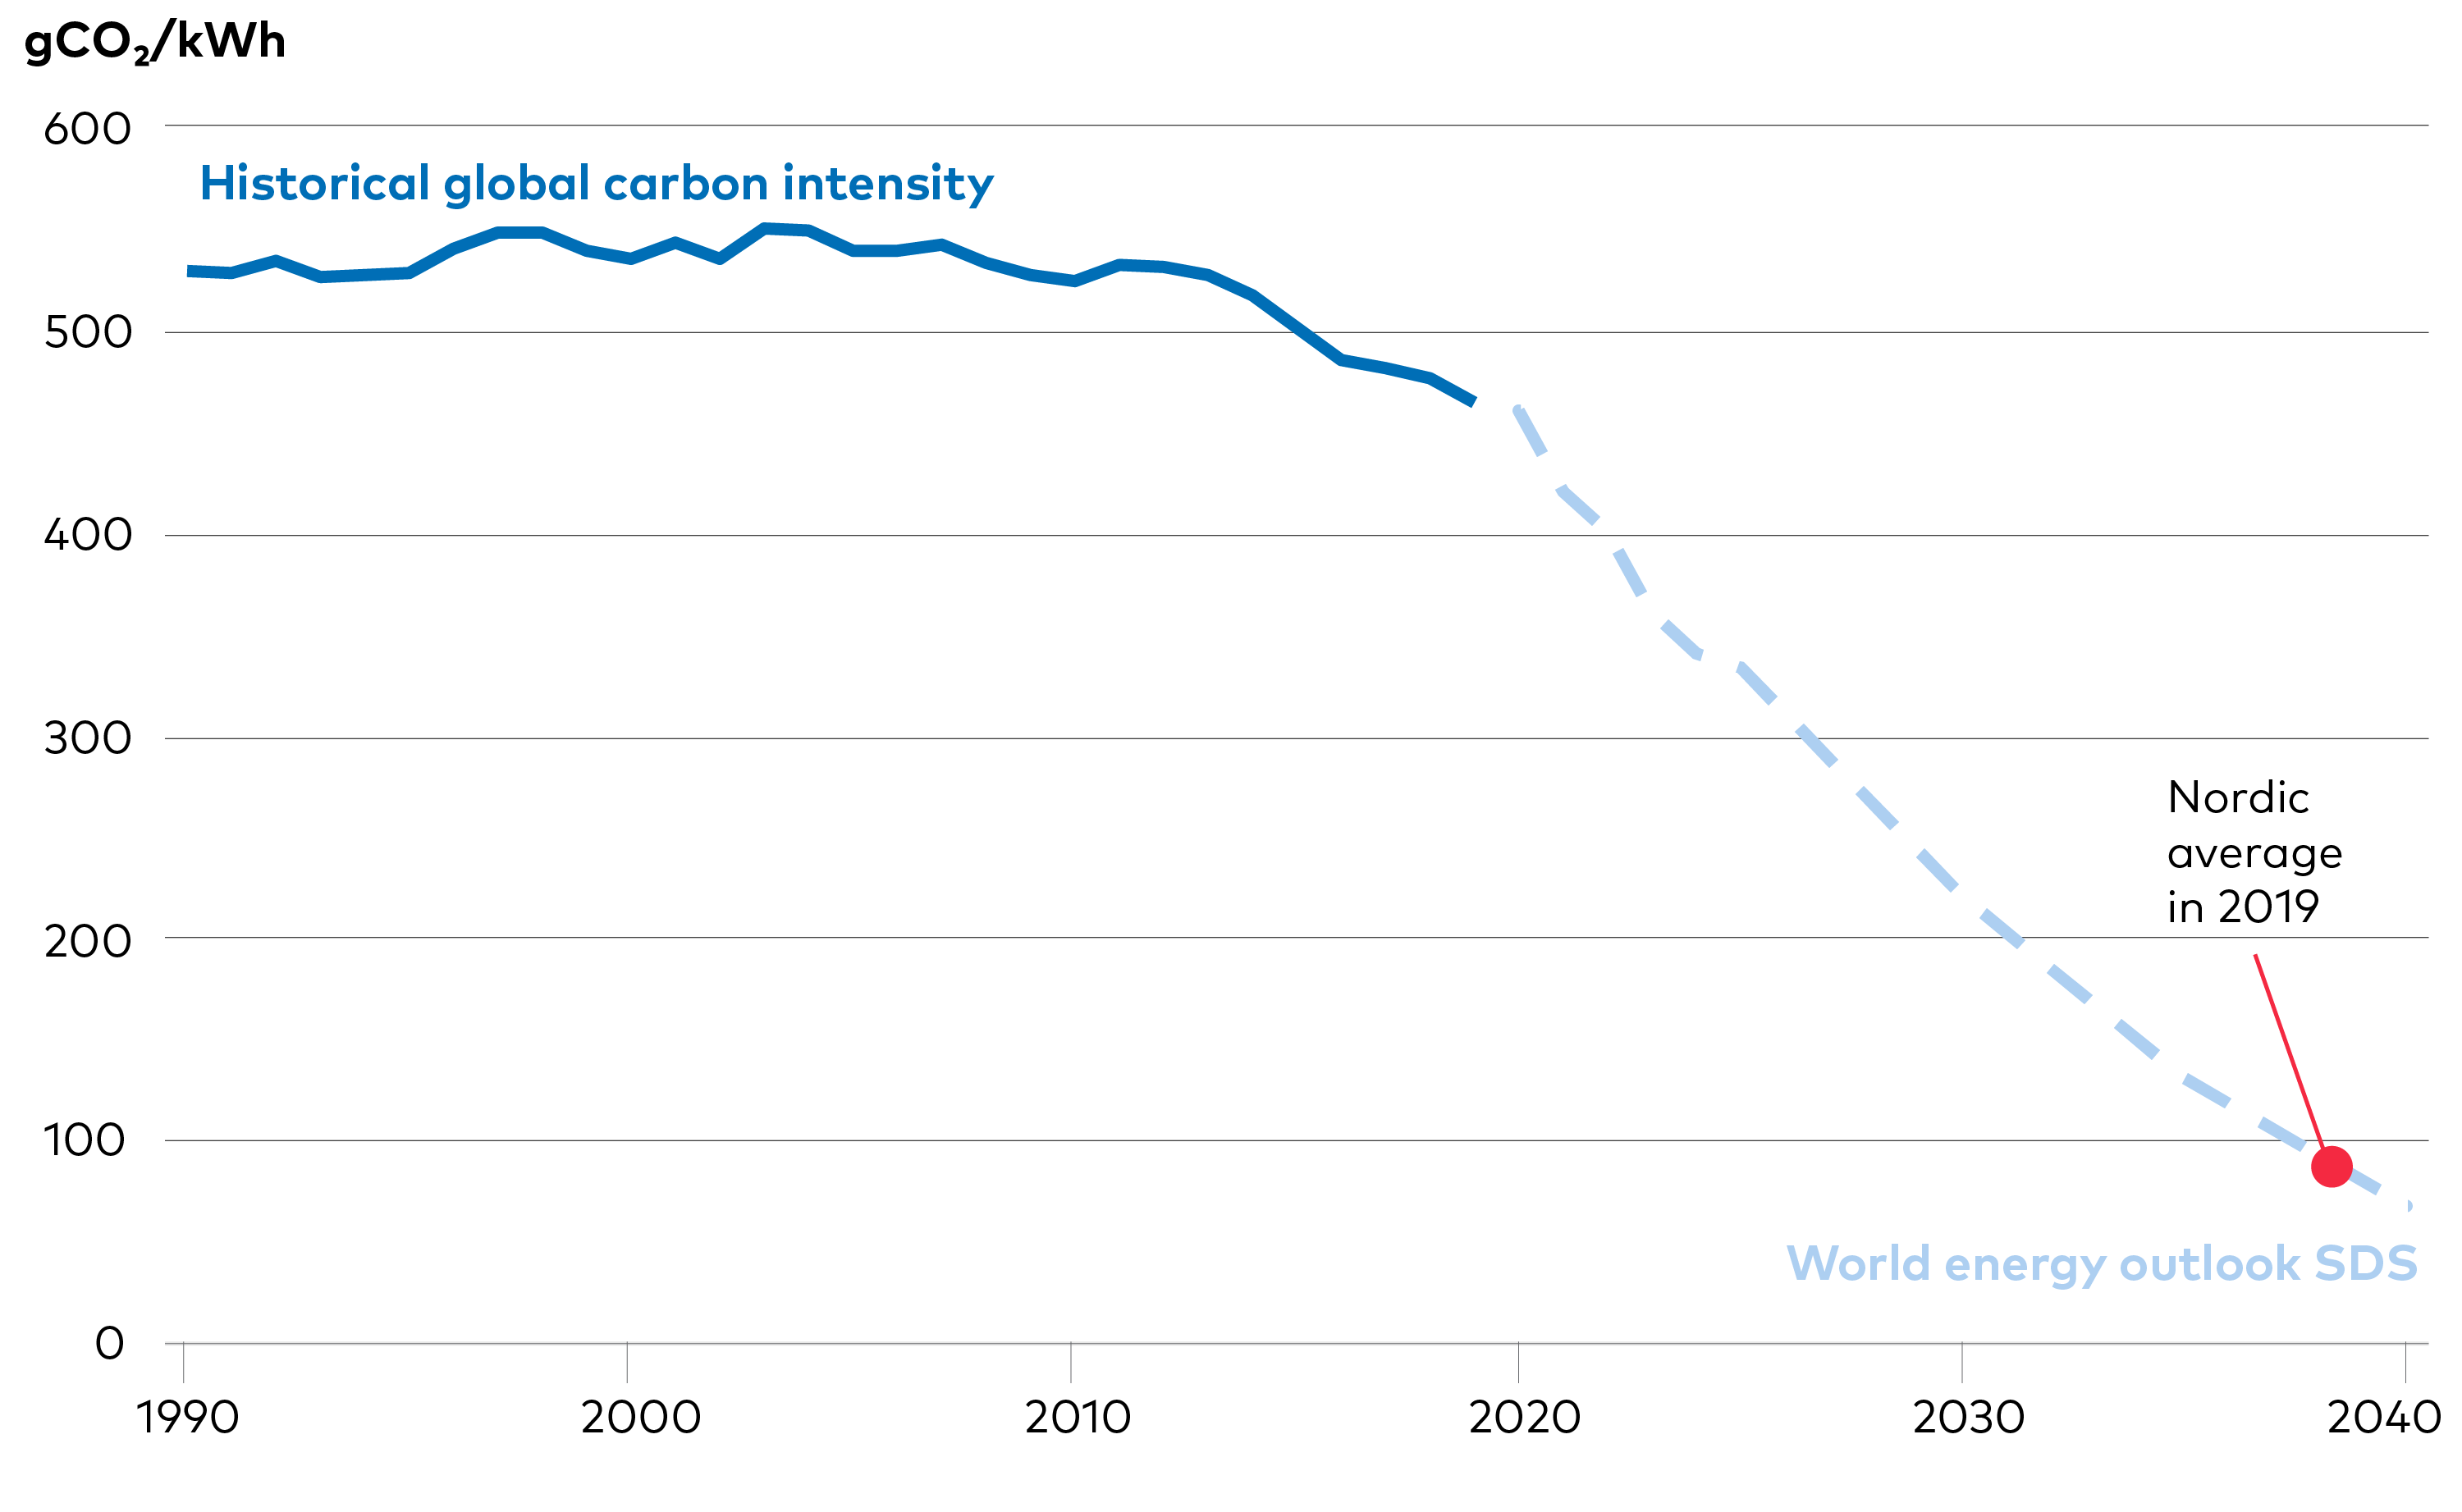
Figure 1.3. Global CO2 intensity of electricity generation and Nordic Average. Current Nordic CO2 intensity in electricity generation, compared with global development in the International Energy Agency's (IEA) Sustainable Development Scenario. Source: IEA, 2020; Eurostat, 2020.
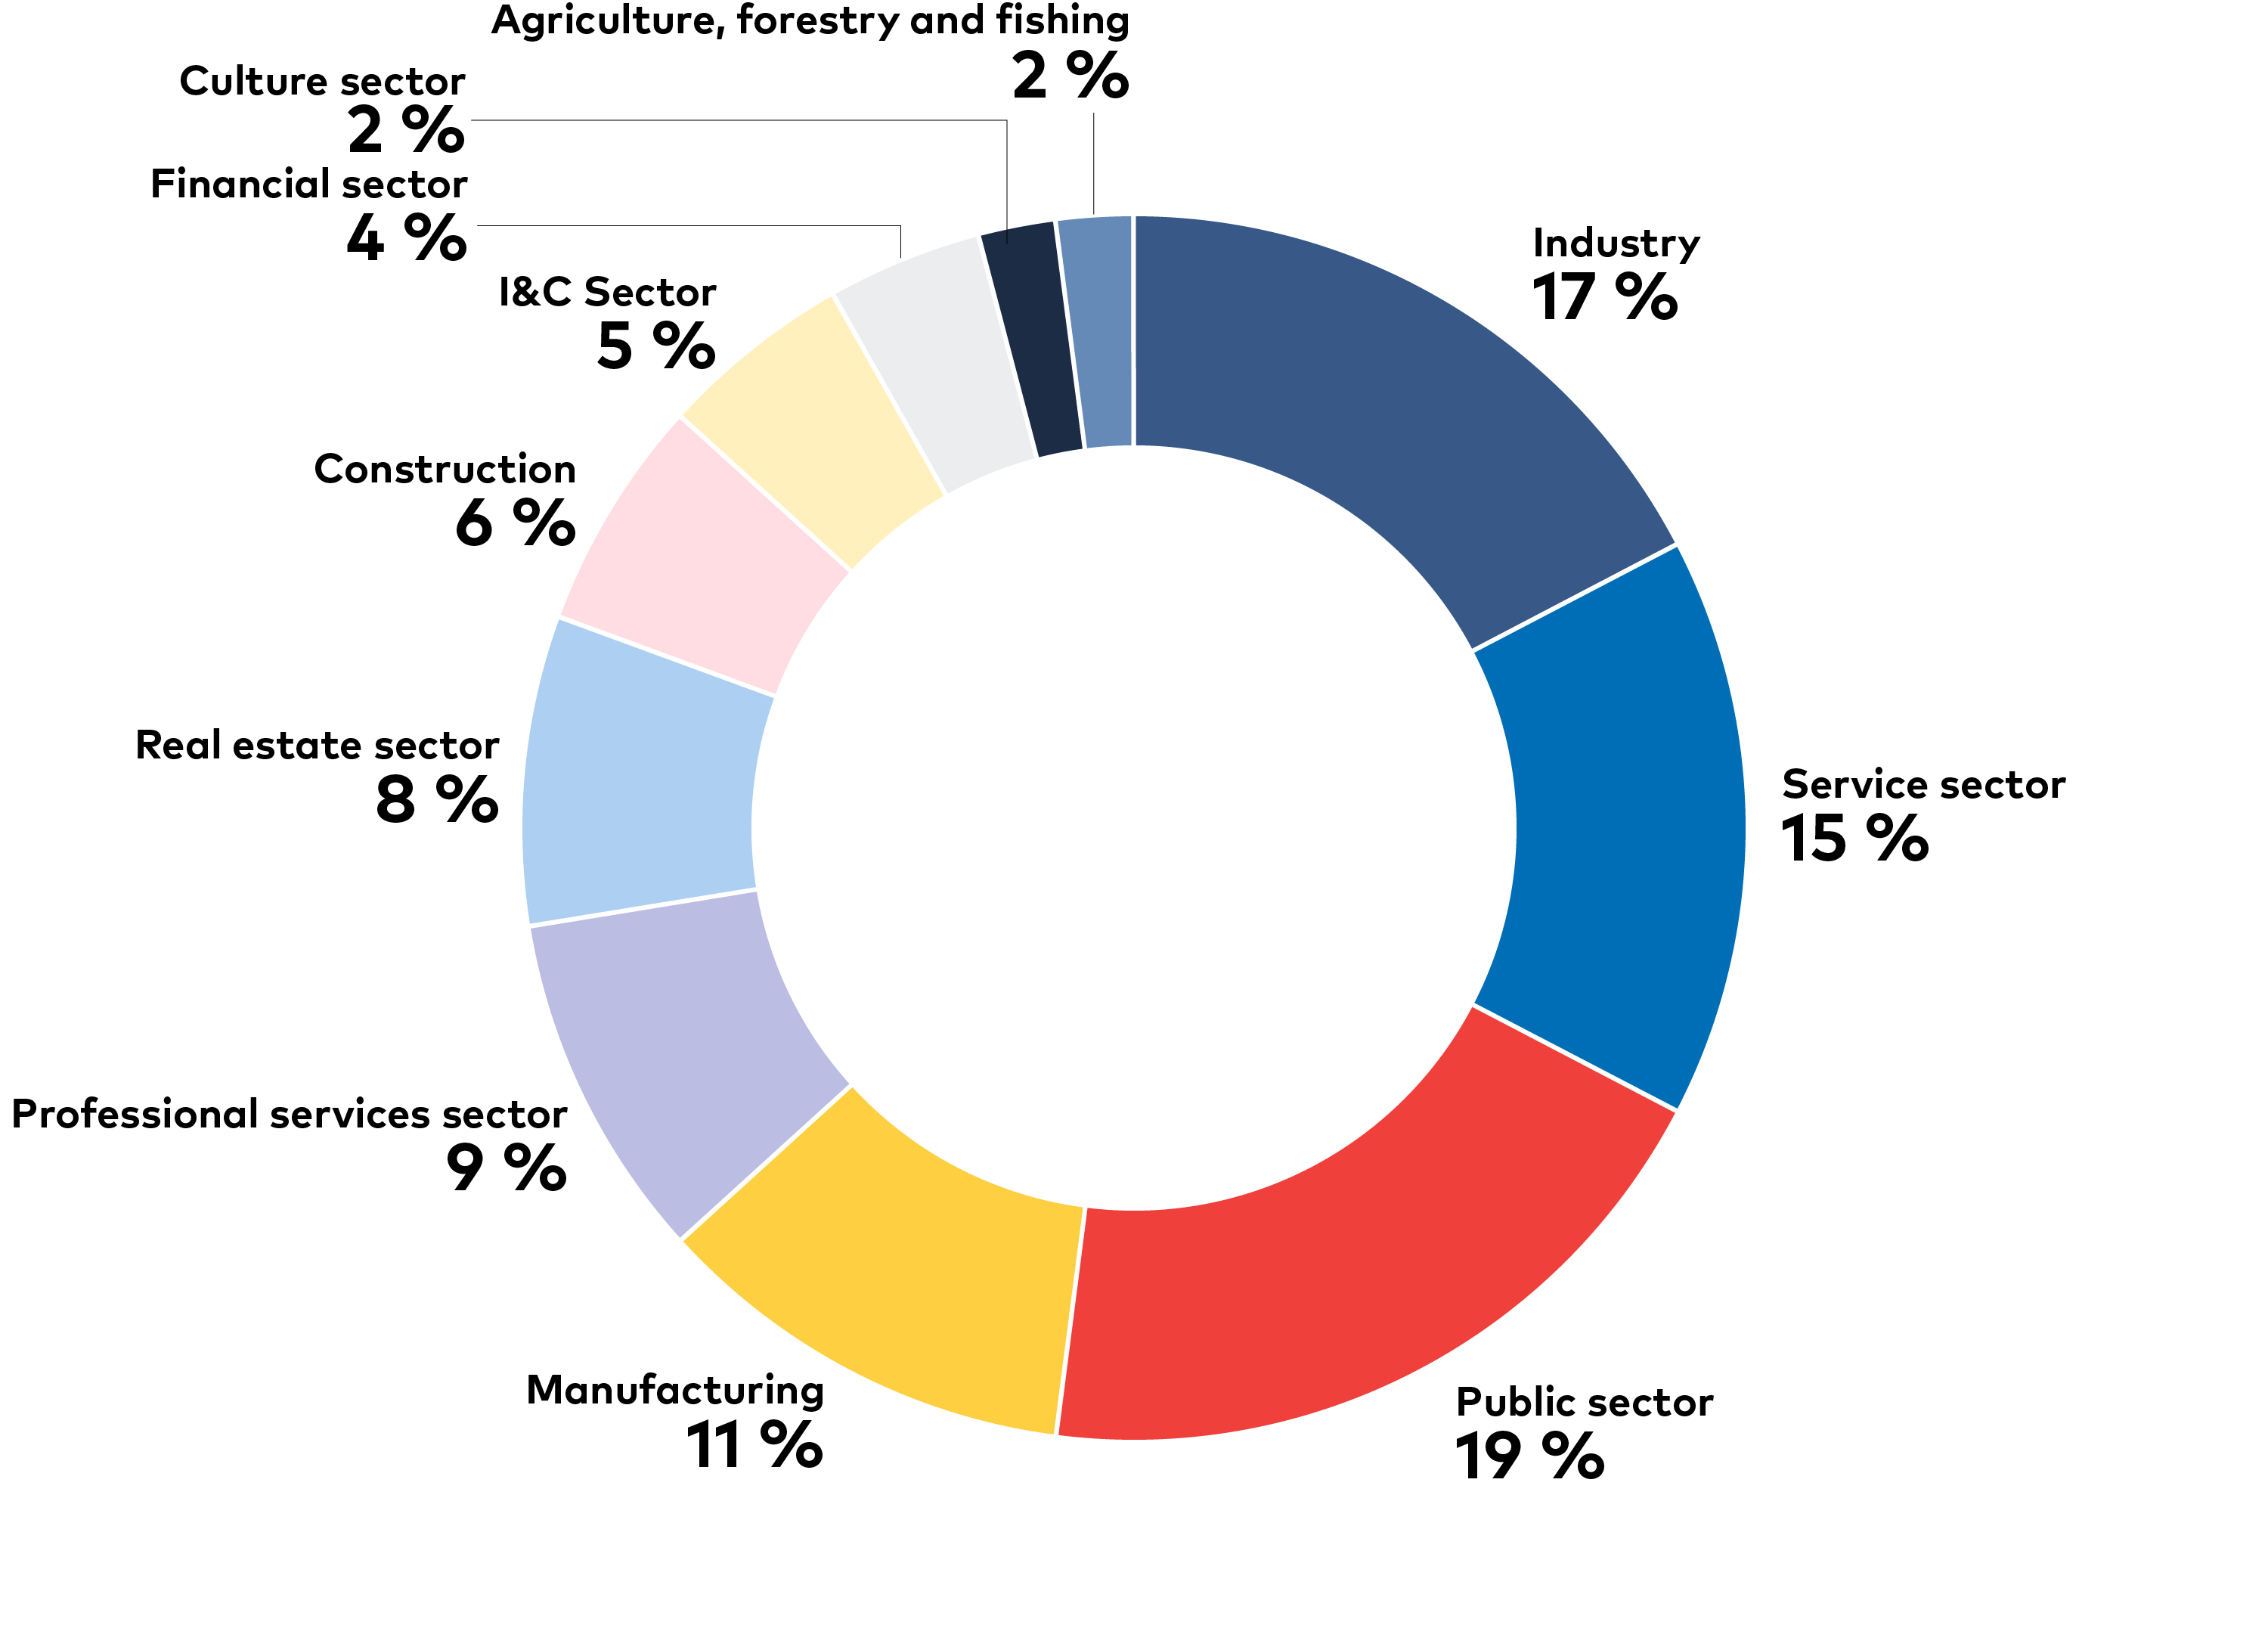
Figure 1.4. Gross value added by sector for the Nordics. Gross value added by sector in the Nordic countries in 2019. Source: Eurostat, 2020.
The region is also endowed with plentiful geothermal, hydro, wind, and bioenergy resources and over the last decades the Nordic countries have significantly increased the rate of renewables deployment. In parallel, governments have over the last 40 years implemented a suite of policies to drive energy efficiency and initiate a fuel shift – away from coal, oil, and gas towards increased use of biomass, waste incineration, renewable electricity, and geothermal. More recently, governments have taken steps to build a mature market for electric vehicles (EVs). Collectively, such efforts have resulted in a steady rate of decoupling economic growth from energy-related CO2 emissions.
As is becoming more evident, cost-effectiveness is not the only parameter for successfully reaching our carbon neutrality targets but it is important to not downplay its role neither. The relatively stable Nordic policy environment has also lowered the perceived risk for investors, driving down the cost of capital, which in turn has accelerated investments in, for example, wind power. This is true both in absolute terms and relative to other countries. Continuing the acceleration of investment in renewable energy (RE) technologies is key for reaching our targets and the NCES project provides detailed analysis of investment needs in different technologies across the energy system.
On a per-capita basis, however, Nordic emissions still significantly exceed the world average, and end-use sectors in all Nordic countries have high electricity demand relative to EU28 and global averages. These latter trends clearly illustrate that despite being well position for an energy transition, we still have ways to go and reinforces the need to accelerate decarbonisation to reach carbon neutrality by 2050. It is also worth noting that territorial emissions, which are used in this project, do not account for emissions embedded in imported goods.
THE NORDICS TODAY
A snapshot of how the Nordic countries perform today in key indicators for tracking developments towards carbon neutrality. These indicators are supported by the energy statistics database set up within the NCES project. For more information and access to data for all indicators, please visit www.nordicenergy.org.
Despite progress, Nordic countries use more energy and emit more greenhouse gases per capita than the EU average.
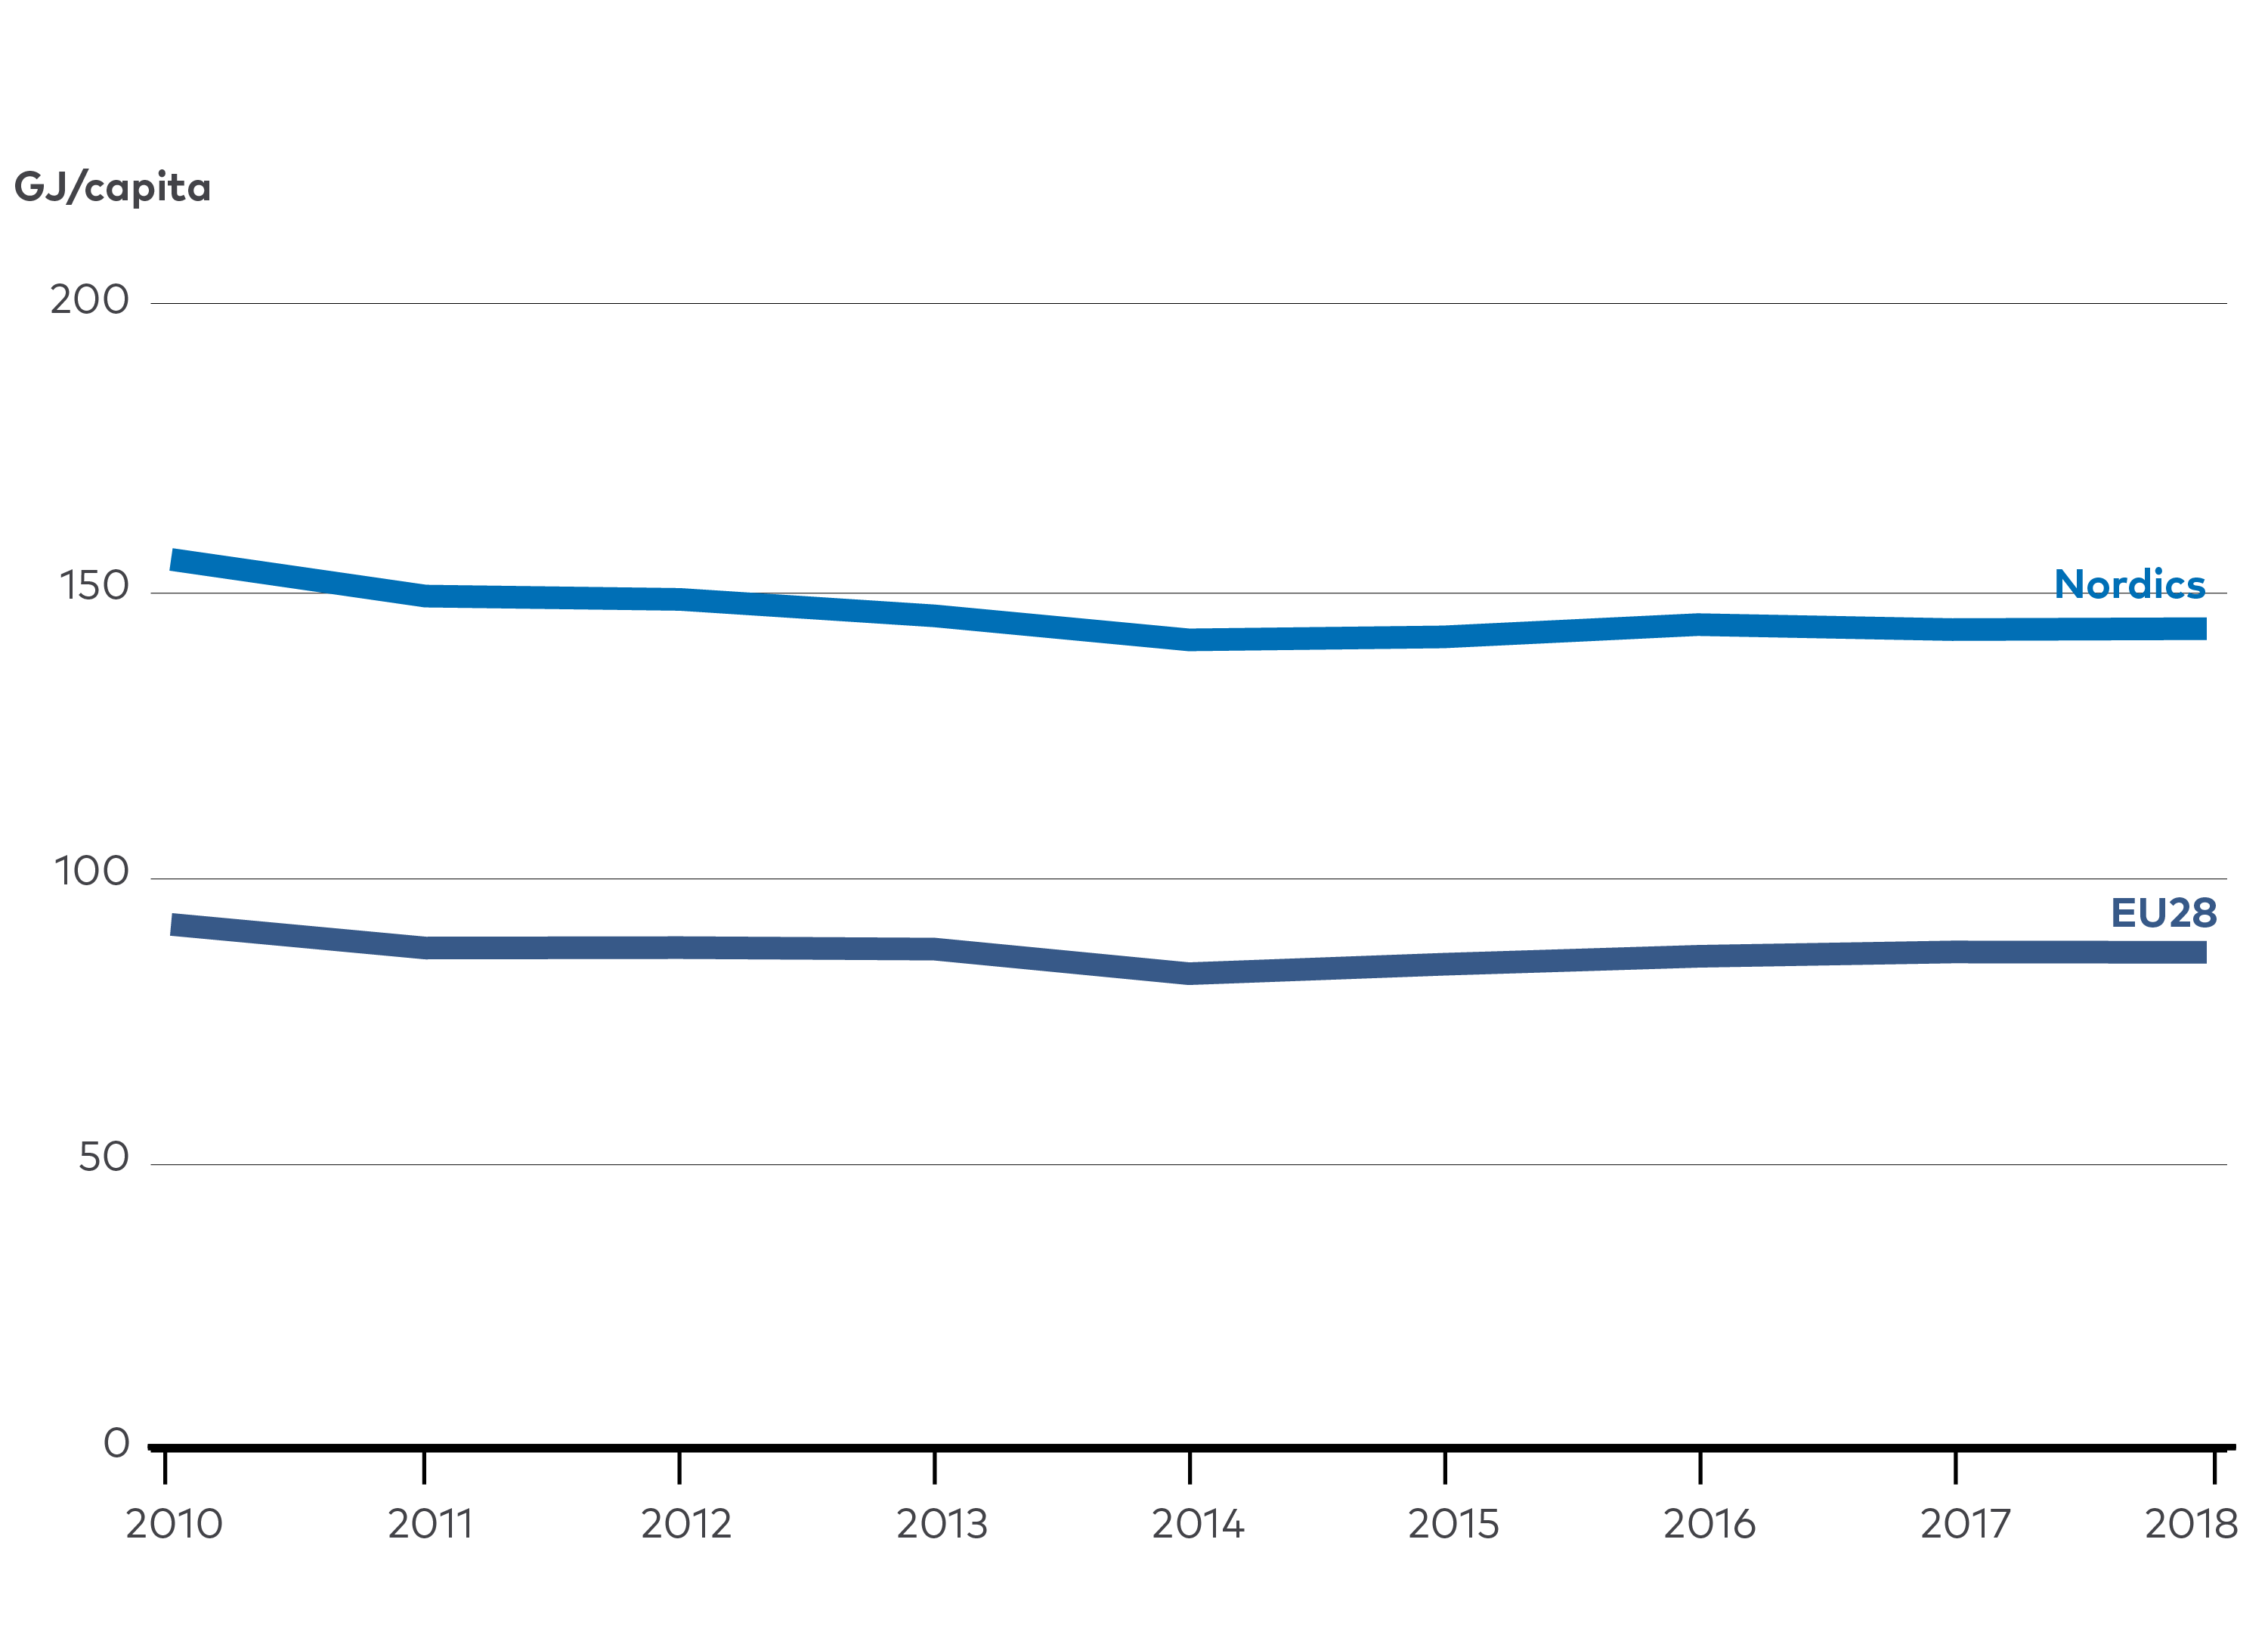
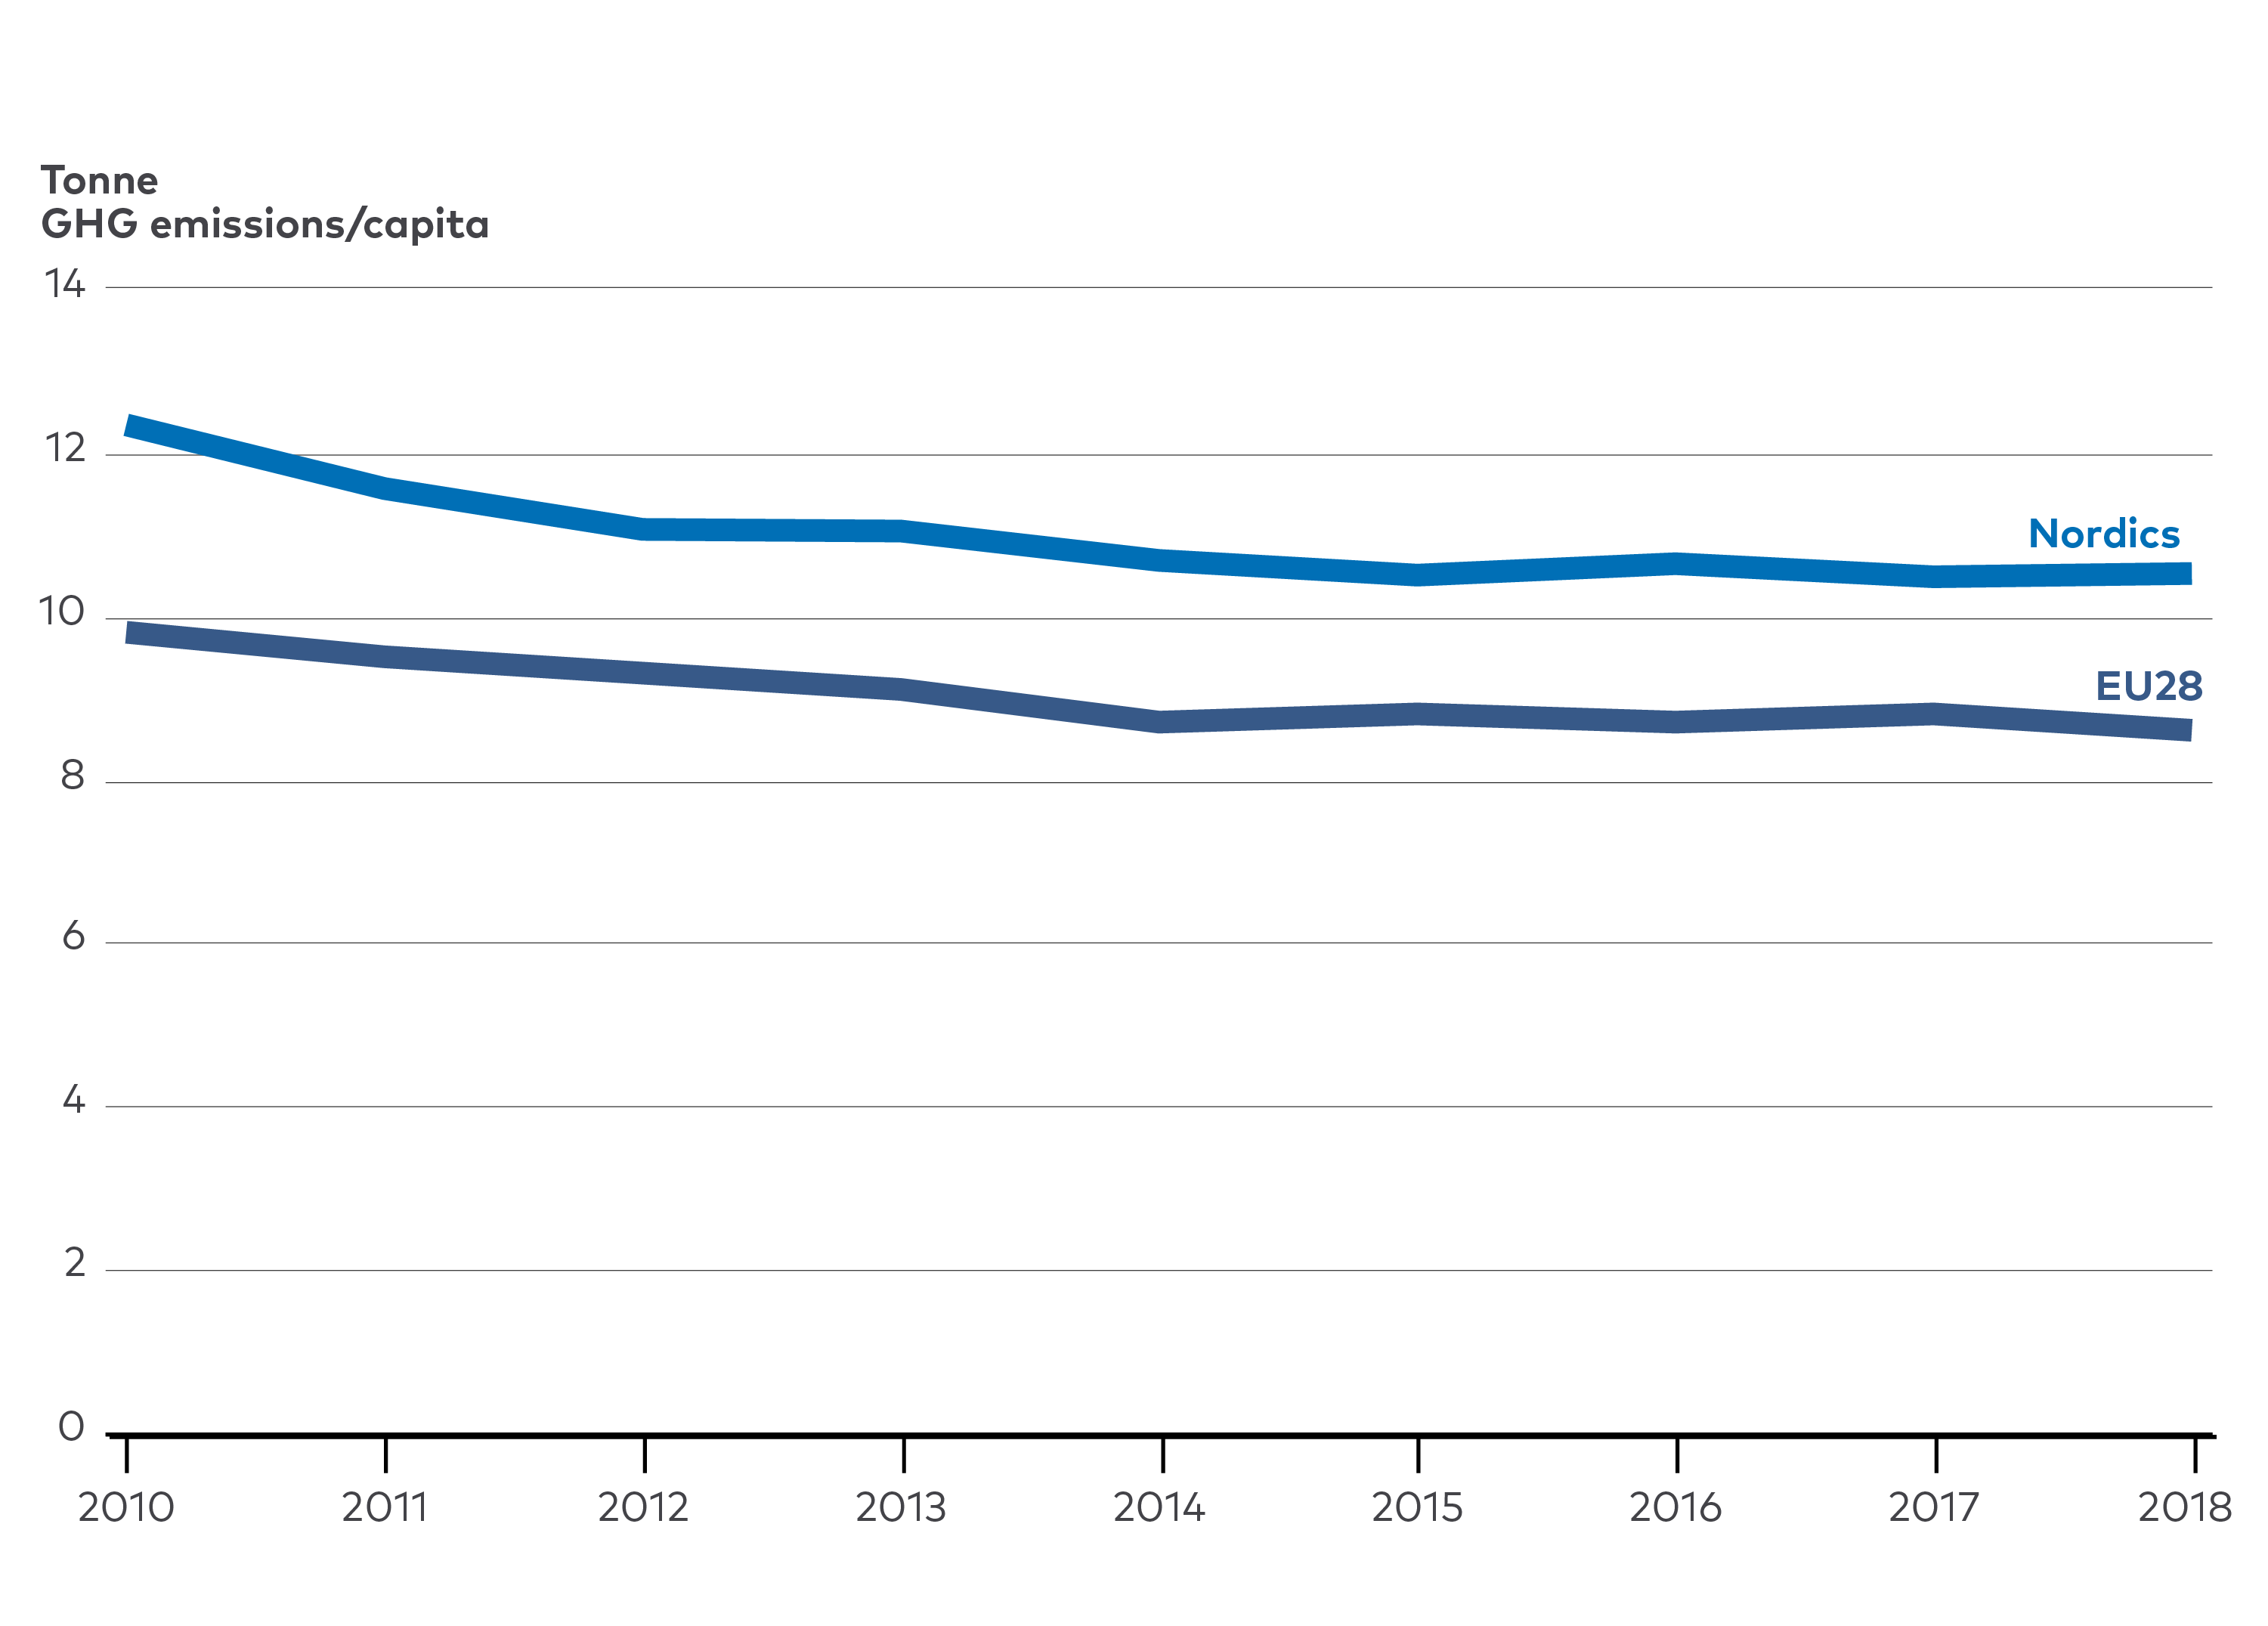
Figure 1.5a and b. Energy consumption per capita and emission intensity of energy used. The left panel illustrates the difference in final energy consumption per capita between the Nordics and EU28. The right panel shows the difference in emission intensity per capita between the Nordics and EU28. Source: Eurostat, 2020.
The Nordic region is endowed with plentiful geothermal, hydro-, wind-, and bioenergy resources, which together accounted for 44% of primary energy supply in 2018, compared with 16% for EU28.

Figure 1.6. Total primary Nordic and EU28 energy supply by energy source in 2018. The Nordic percentage of renewable energy and biofuels are significantly higher than in EU28 making the Nordics well positioned for extending its production of clean electricity, a central pillar for decarbonisation. Source: Eurostat, 2020
*Other RE; tide, wave, and ocean energy; heat pumps.

Figure 1.7a & b. This figure shows non-hydro renewable electricity generation in the Nordics, top, and EU28, bottom. What becomes clear is that the large share of the Nordic renewable energy supply comes from hydropower. Source, Eurostat, 2020.
Non-hydro renewable electricity represents about 12% of Nordic electricity generation, similar to the EU average.
Figure 1.8. Non-hydro renewable electricity generations share of total generation in the Nordics and EU28 follow a similar development. The Nordics are however falling behind. Source: Eurostat, 2020.
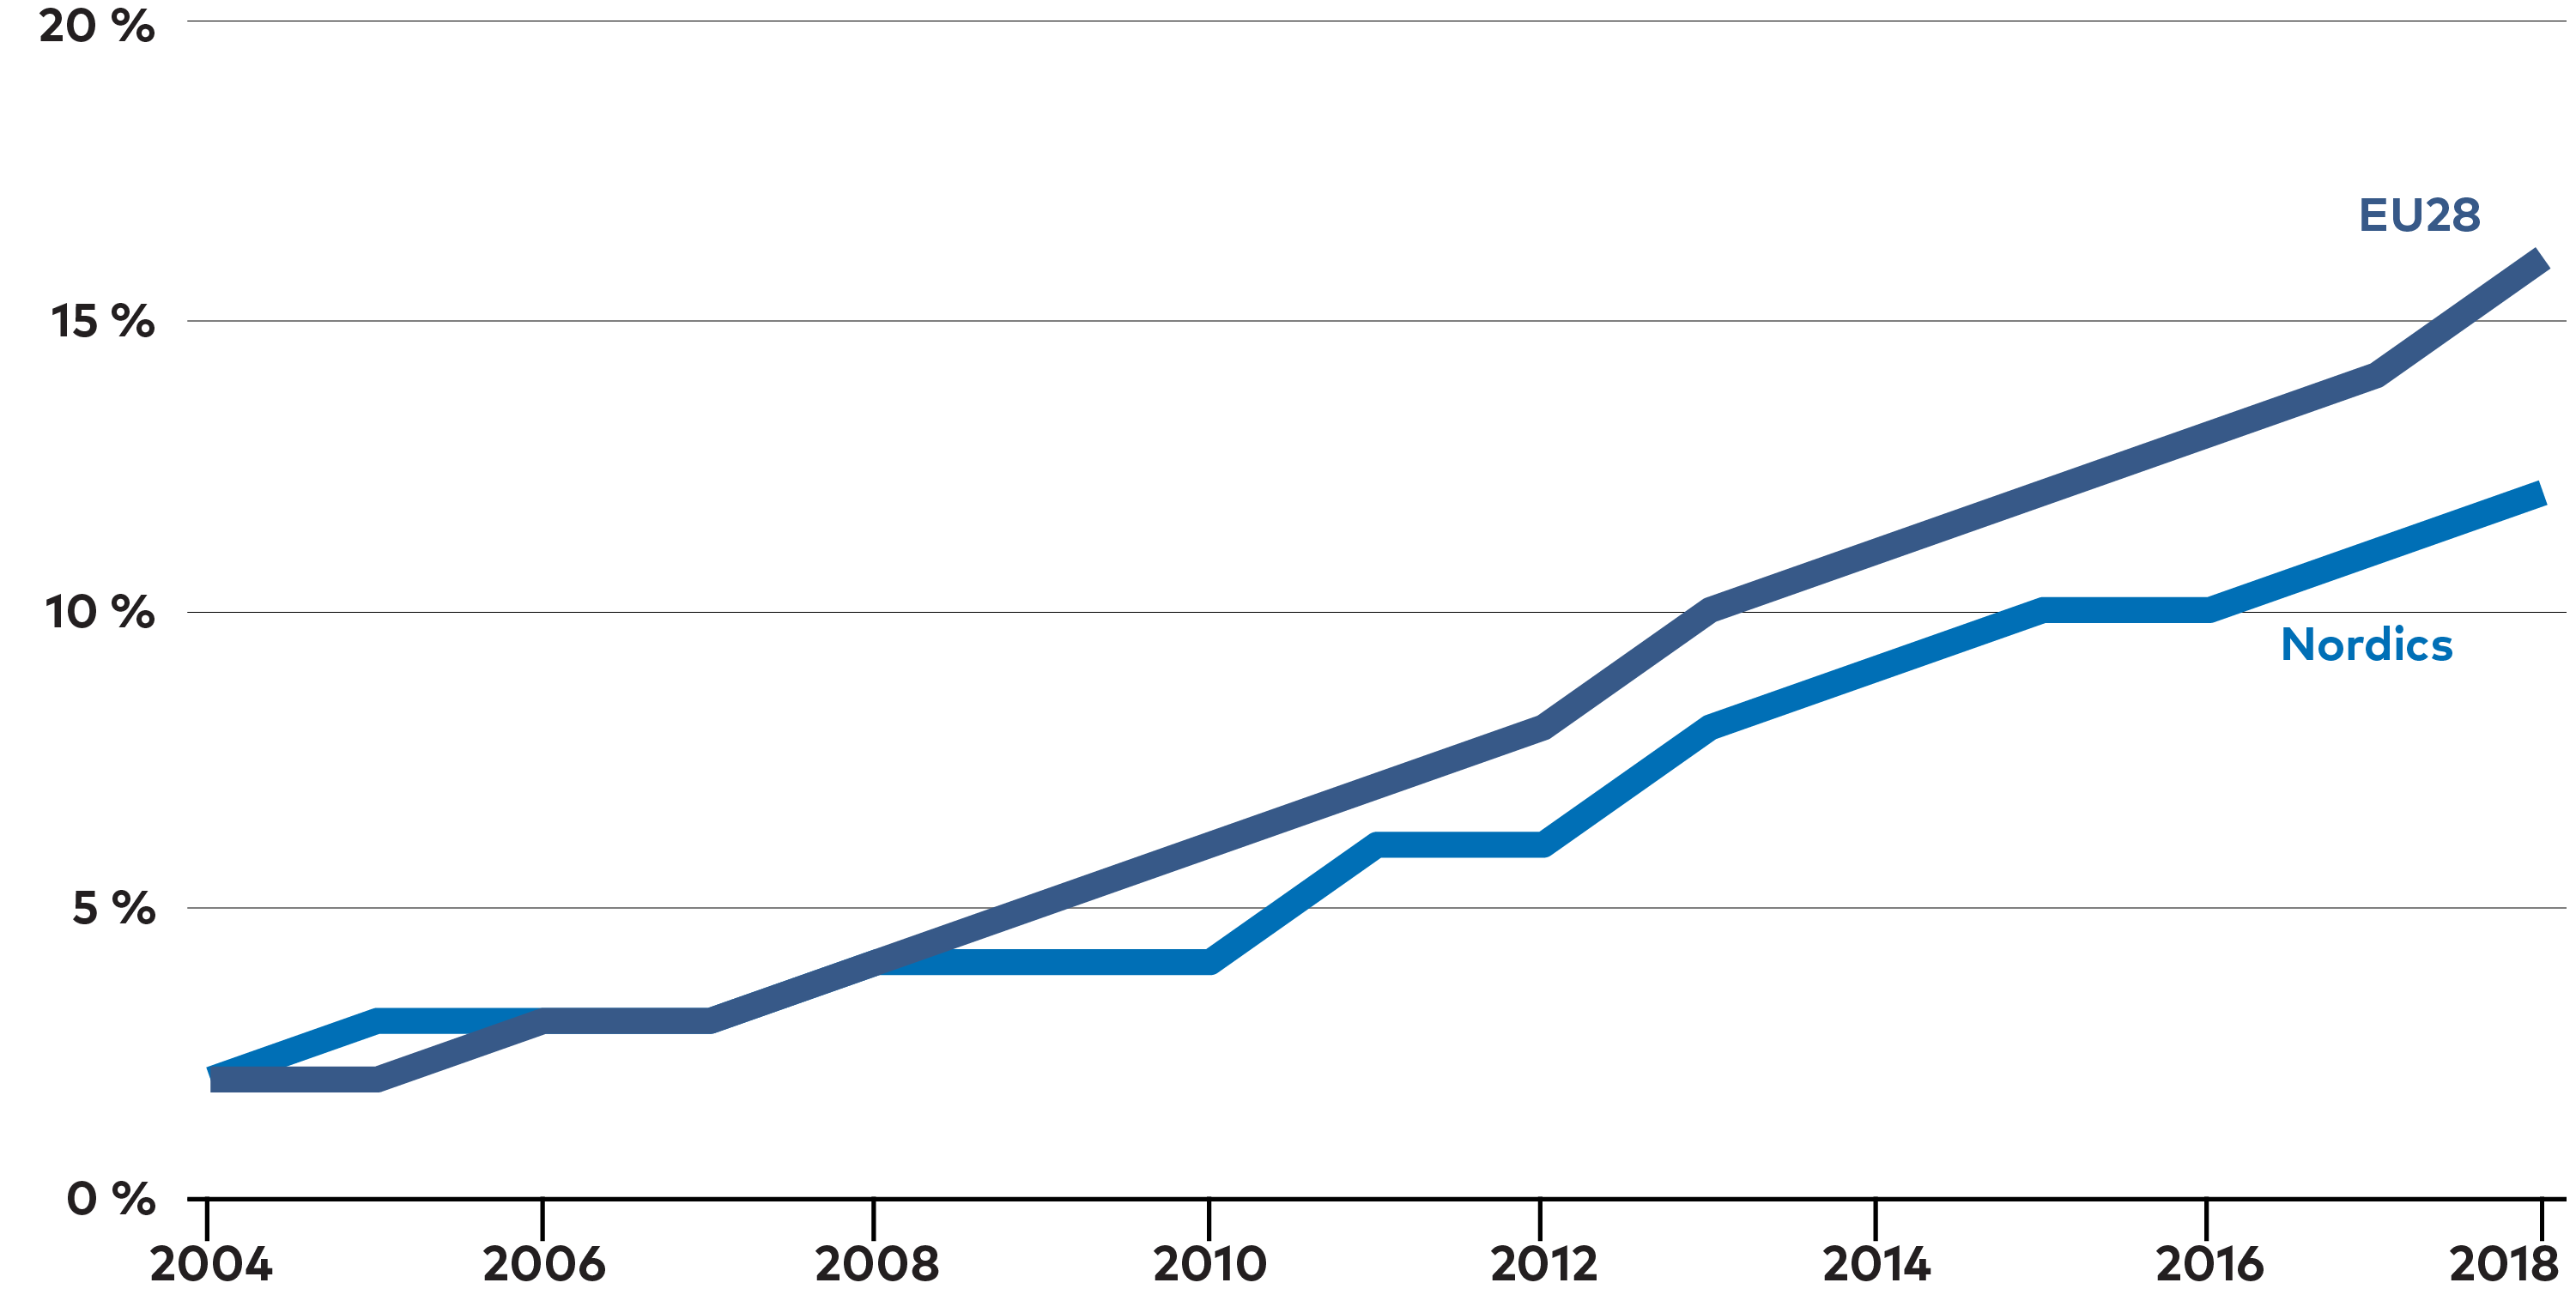
Electrification in passenger transport has started but need continued acceleration over the next decade.
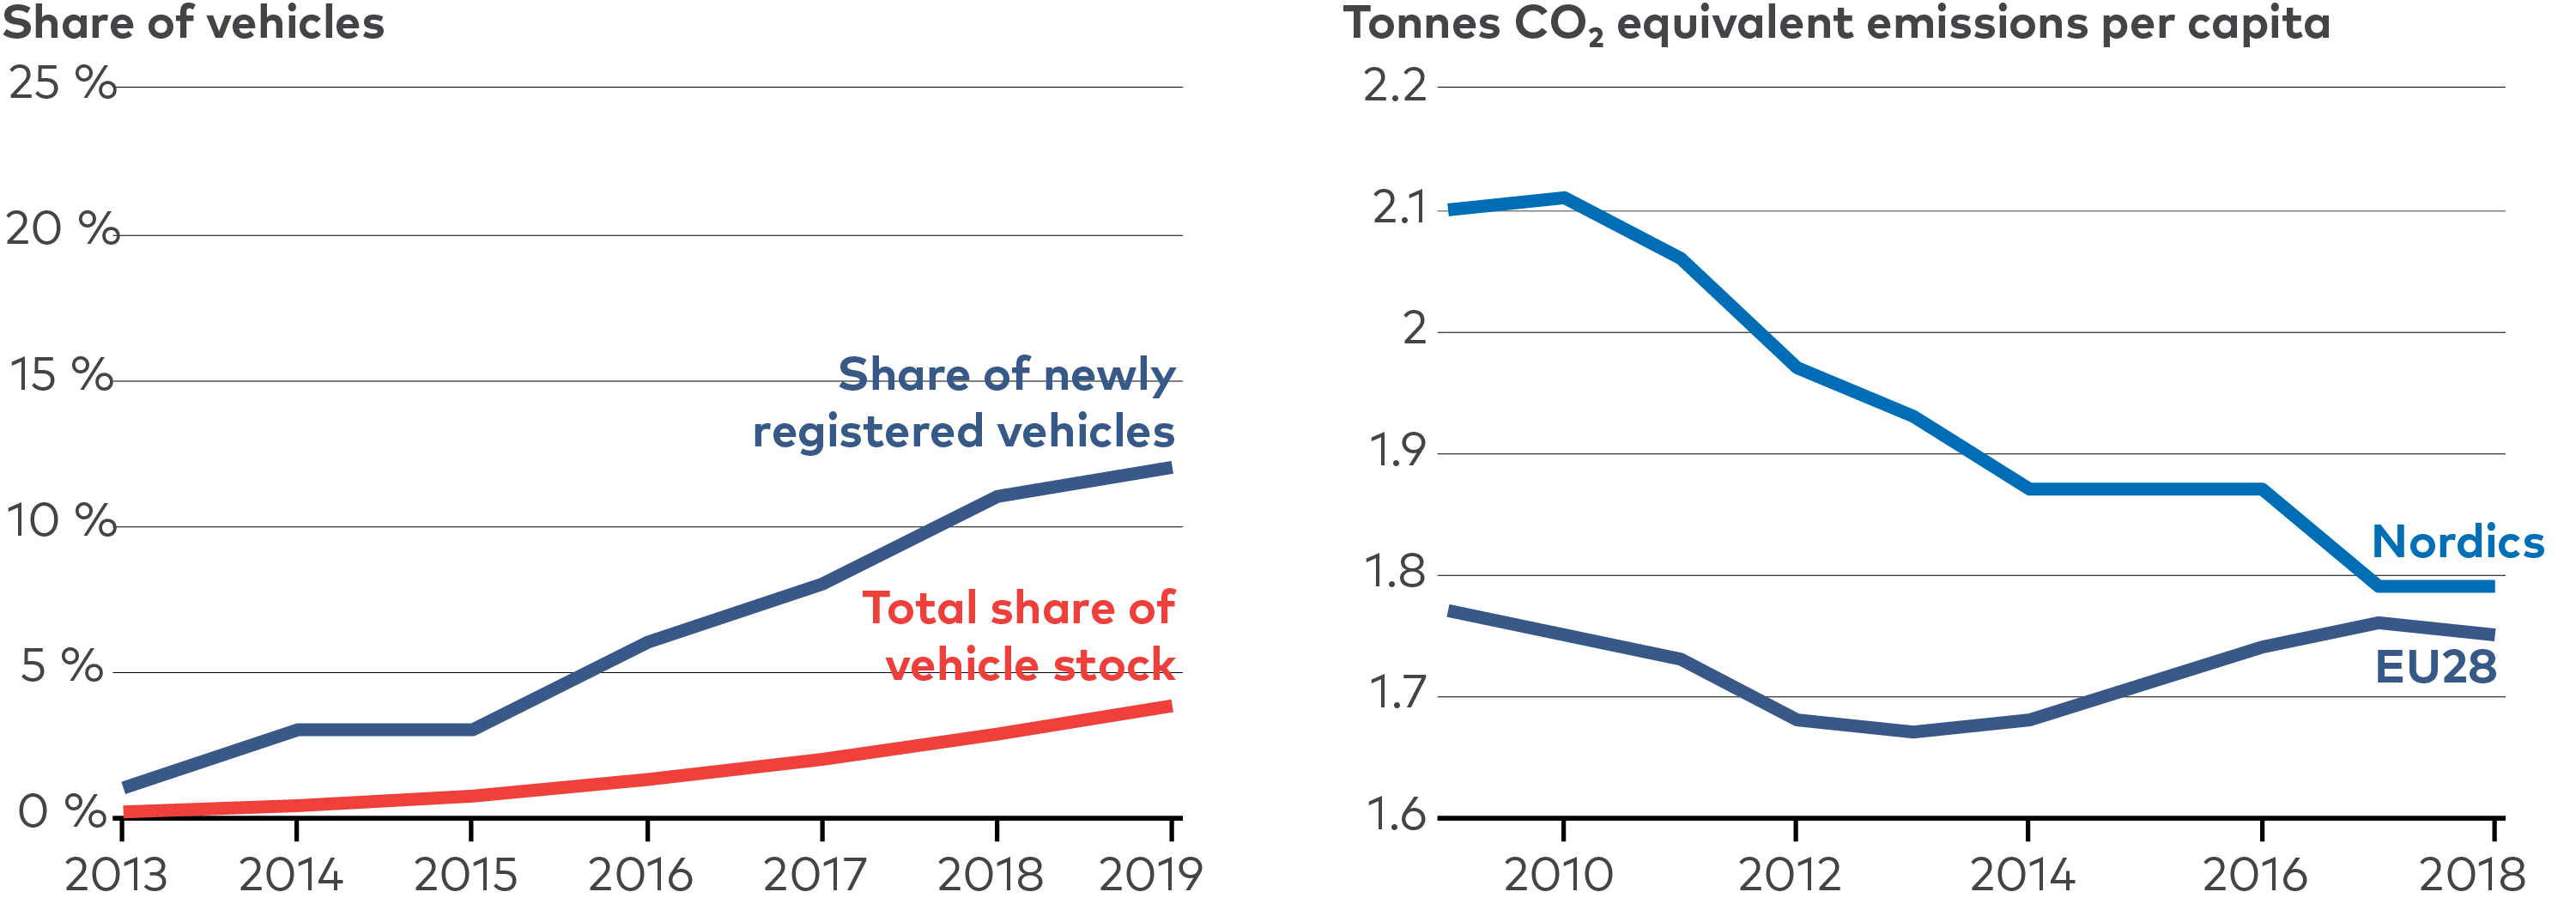
Figure 1.9a & c. Percapita emissions in road transport. The left panel shows the growing share of newly registered BEV and PHEVs in the Nordics and the overall share of the total passenger vehicle stock. The right panel shows the resulting emission reduction in the Nordics generated from road transport in comparison to EU28 from 1990 to 2018. Source: EEA, 2020; Nordic Statistics database, n.d.
1.2 Choices ahead
The idea that any individual decision will affect the entire development of the energy system is false. Rather, a multitude of choices, drivers, and events will shape the future of the Nordic energy system.
However, to fulfill their role in achieving a clean energy system, decision makers must be prepared to act decisively on factors within their control while being fully aware of the implications of those that are not. The balance and prioritisation of such efforts will influence the performance of the Nordic energy system and determine its role in Europe as a whole. Several key aspects can – and will – be affected by policy, strategic decisions in industry, and research and development efforts.
1.2.1 Choice and coupling of energy carriers
Expanding electrification as a path to carbon neutrality holds great potential but is by no means a panacea for the Nordic region or the rest of the world. Local conditions, including resources, technology options, and policy decisions, will greatly affect the degree of electrification possible. Indirect electrification through the use of electricity to produce fuels - ‘power-to-X’, including hydrogen – will likely play an important role for decarbonising some hard-to-abate sectors, but will have a dramatic impact on electricity demand. Bioenergy has distinct advantages but is not an unlimited resource. Thus, a wise use of all energy carriers in the Nordic region will be vitally important.
1.2.2 The role of the Nordic energy system in Europe
Nordic hydro and wind resources can facilitate the energy transition in other countries, and substantial potential exists to export large quantities of clean electricity and PtX fuels. Most central European countries face bigger challenges as they do not have the same endowments of renewable resources as the Nordics, although progress in new technologies and shifting policy strategies in other European countries may improve their position. Even within the Nordic region, it may be necessary to balance various - and sometimes conflicting – policy objectives. Even when it is attractive from a climate and financial perspective, large expansions of energy infrastructure are challenging for other reasons, including public acceptance, perceived and real business risks, and conflicts with other social objectives and policy targets.
1.2.3 The importance of behavioural change and energy efficiency
Energy efficiency will ease the pressure on any future energy system and the investment needed to support it. Altered behaviour perhaps could do even more. Thus, quantifying and understanding how the potential of such aspects can be realised adds value. This is particularly true given that full decarbonisation will require significant citizen engagement and support for bold policy action.
 PHOTO: MAMMUT MEDIA/NORDEN.ORG
Chapter 2
Five Solution Tracks to Carbon Neutrality
Based on the NCES results, the multitude of solutions available to decarbonise the energy system can be grouped into five solution tracks: direct electrification; PtX; bioenergy; carbon capture and storage (CCS) technologies; and behavioural change. While direct electrification emerges as the core strategy, the reality is that no individual decision or technology choice will drive the transformation of the entire energy system. Rather, achieving carbon neutrality will require balancing these tracks in relation to what is technologically possible, economically viable, and socially acceptable. The role Nordic countries choose to play in the European energy transition will affect this balancing act and have significant impact on how the regional Nordic energy system develops.
Key messages
-
Five solution tracks capture most options needed to reach carbon neutrality: direct electrification; PtX; bioenergy; CCS technologies; and behavioural change.
-
Direct electrification forms the core of all NCES decarbonisation pathways, while the other solution tracks have varying importance in the different scenarios.
-
A pathway based on a balanced mix of the five tracks will likely be easier to realise than one heavily dominated by any one set of solutions.
-
Domestic Nordic energy demand decreases in all scenarios, largely because of efficiency gains linked to direct electrification.
-
The share of fossil fuels in Nordic total primary energy supply falls, from ~40% in 2020 to less than 10% in 2050, across the NCES scenarios.
-
Nordic electricity demand rises by 40-100% from 2020 to 2050 in the NCES scenarios, showing the increasing importance of electricity as an energy carrier.
-
Direct electrification requires much less electricity generation than the PtX solution track, as production of PtX fuels is electricity intensive.
-
Behavioural change, including efficient energy use, can ease the transition regardless of technological mix.
2.1 The Nordic system through three carbon neutral scenarios
Nordic decision makers will play a lead role in shaping the future energy system, including the role Nordic countries could play in Europe as a whole. Policy action will underpin key areas of research and development (R&D), strategic decisions in industry, and levels of public acceptance. The NCES analyses are conducted through the lens of three main scenarios: The Carbon Neutral Nordic (CNN) scenario reflects current national plans, strategies, and targets to reach carbon neutrality, and seeks to identify the least-cost pathway. The Nordic Powerhouse (NPH) scenario reflects aggressive action to build out clean energy assets and infrastructure to support activities with high demand for electricity and PtX fuels. The Climate Neutral Behaviour (CNB) scenario sees politicians and citizens adopting additional energy and material efficiency measures in all sectors, ultimately leading to lower demand for both. It also assumes higher public acceptance for energy infrastructure development. For more information about the supporting assumptions in the NCES scenarios please see the section on NCES's analytical approach at the end of this chapter.
The main conclusions and results from these three scenarios are presented in this report. The NCES project contains much more to explore and all modelling results, including sensitivity analyses, can be fully reviewed via the NCES webtool. For full access to the entire suite of NCES products please visit the NER webpage.
2.1.1 Clean electricity and improved energy efficiency in end-use sectors underpin all pathways
All scenarios contain deep decarbonisation of energy supply (Figure 2.1), resulting in rapid decline in energy-related CO2 emissions (Figure 2.2). Clean electricity (Figure 2.3) underpins fossil fuel substitution through direct electrification and is also critical for PtX and energy efficiency.
Figure 2.1. Total primary energy supply. The share of fossil fuels in Nordic primary energy supply falls from 42% in 2020 to 6-9% by 2050 in the NCES scenarios, while export of electricity and PtX fuels rises (negative values indicate exports to non-Nordic countries). *Includes minor contribution from other sources.
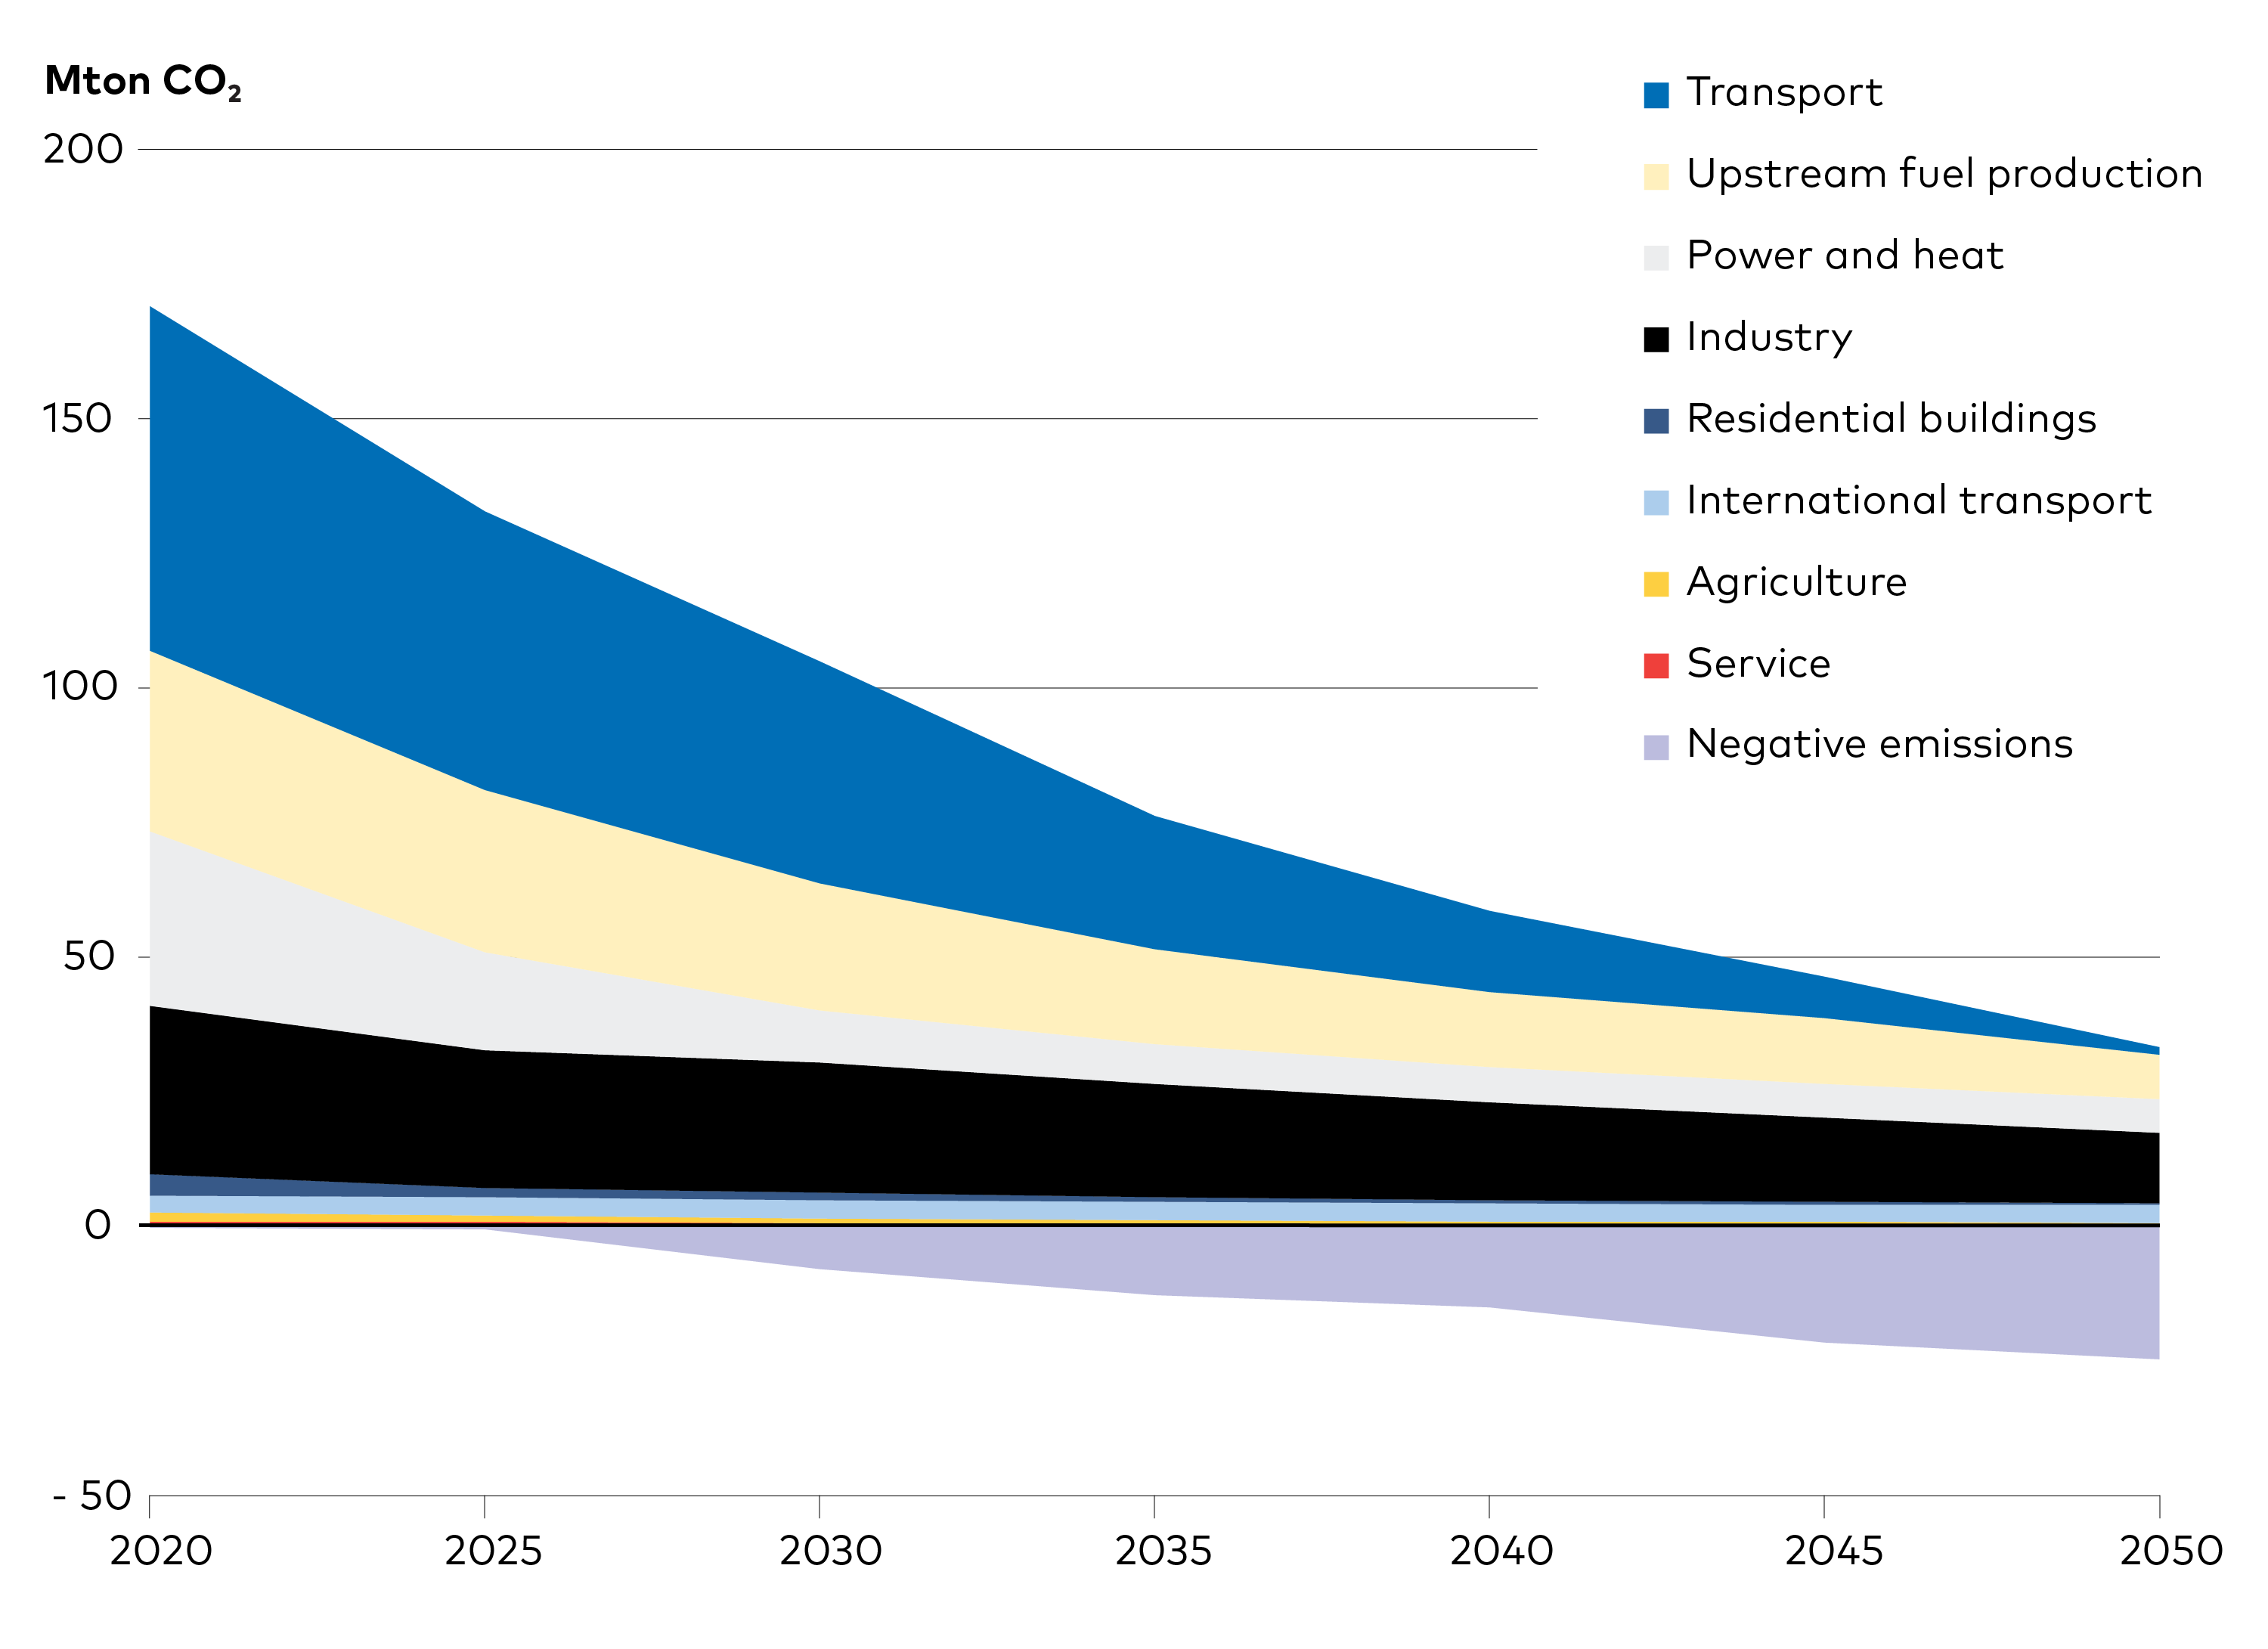
Figure 2.2. Nordic energy-related CO2 emissions - CNN scenario. Net energy-related CO2 emissions fall from approximately 167 Mt in 2020 to 13 Mt in 2050.

Figure 2.3. Nordic electricity generation. The fossil share of electricity generation in 2050 is below 5% in all NCES scenarios, even as generation increases from 455 TWh in 2020 to 615 TWh (CNN), 710 TWh (CNB) and 980 TWh (NPH) in 2050.
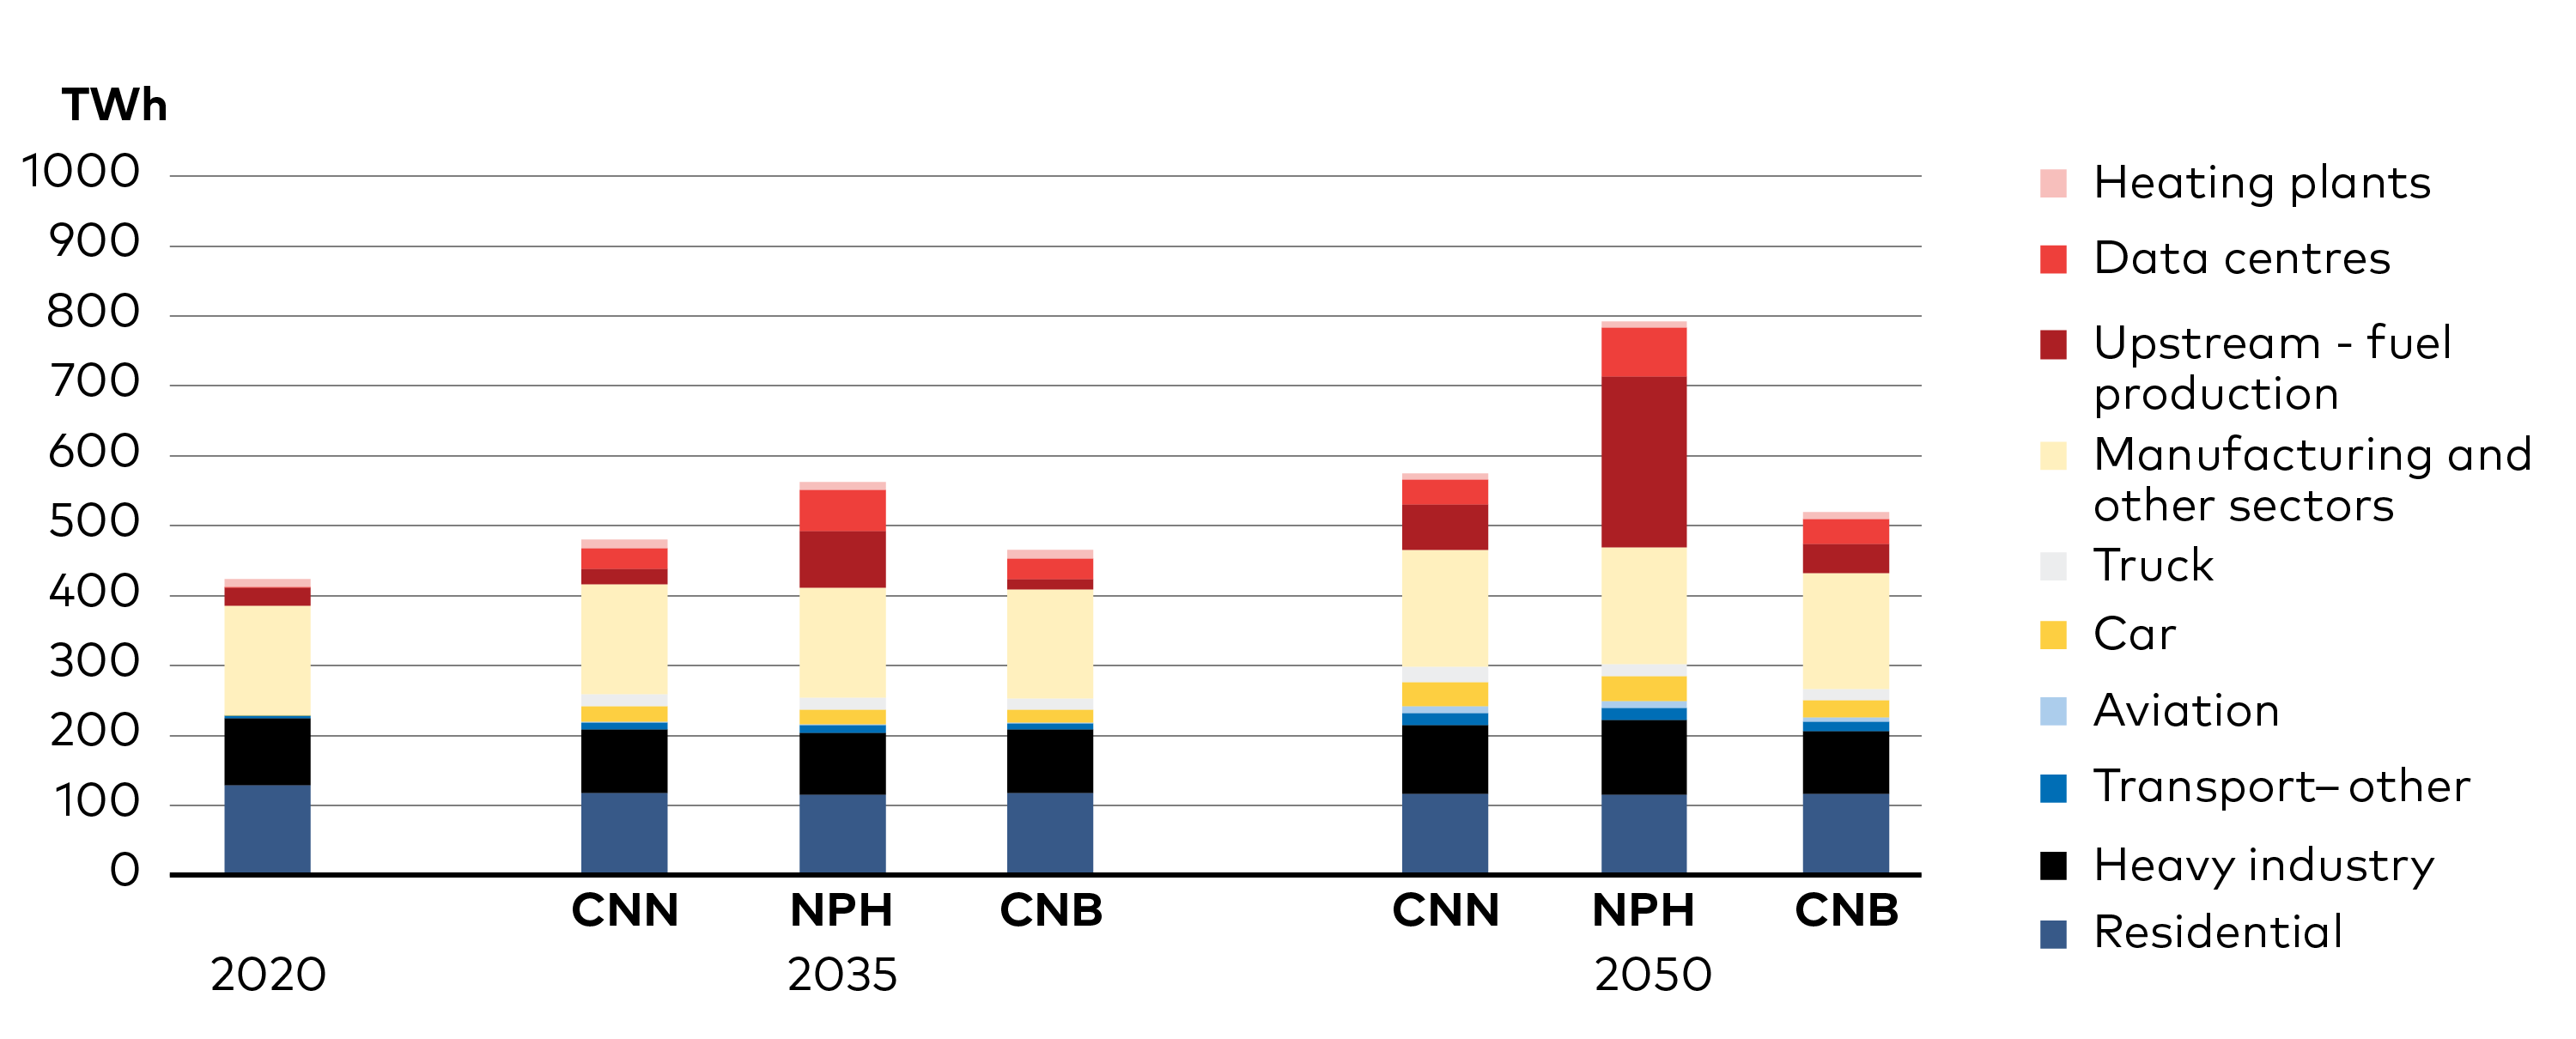
Figure 2.4. Domestic Nordic electricity demand. Domestic Nordic electricity demand increases from 370 TWh in 2020 to 450-680 TWh in 2050 in the three scenarios. Production of PtX fuels, 'upstream fuel production', is the single largest growth driver.
Nordic electricity demand increases by approximately 40% in the CNN scenario and up to 100% increase in the NPH scenario by 2050 compared with 2020 levels (Figure 2.4). Production of hydrogen and other PtX fuels is the biggest demand growth driver, as reflected in the NPH scenario.
Prospects for direct electrification of end-use sectors seem more attractive now than in previous studies such as the NETP-projects (IEA/NER, 2013 & 2016). For example, in those studies biofuels, synthetic fuels, and fuel cells seemed like the cheapest option to decarbonise heavy trucks, while the NCES analysis shows direct electrification becoming competitive also for that application (Figure 2.5). This does require continued cost decreases for battery technologies and pro-active infrastructure development to alleviate charging and grid capacity challenges. Hydrogen fuel cell trucks can be an alternative route, but that looks more costly and has its own infrastructure challenges.
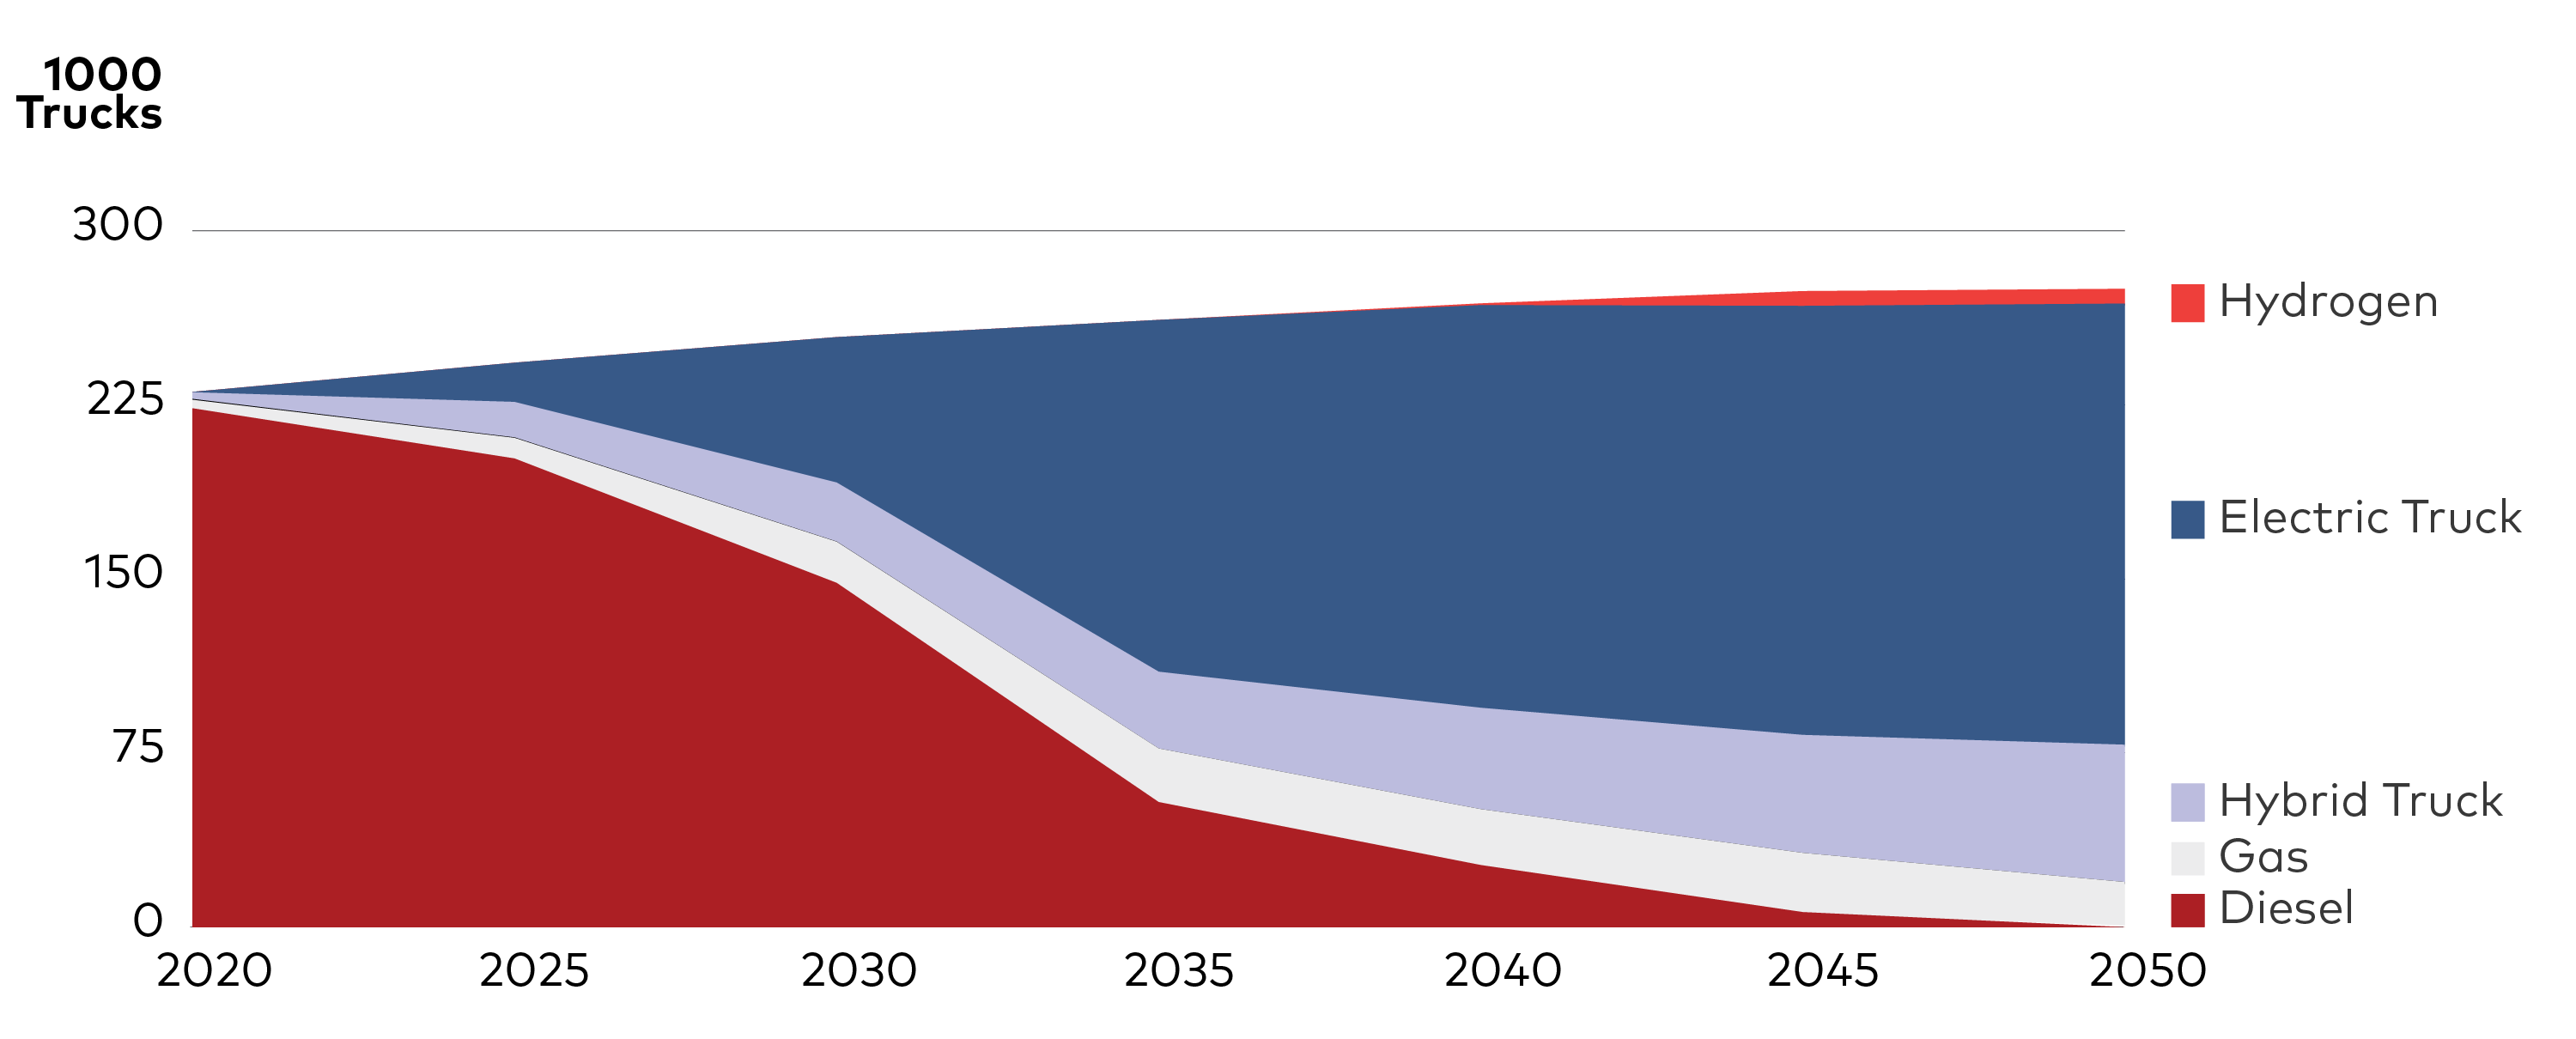
Figure 2.5. Stock development of heavy trucks in the Nordics - CNN scenario. Direct electrification, in the form of battery vehicles and/or electric roads, is seen to become competitive for heavy trucks in the CNN scenario. Both ‘diesel’ and ‘gas’ categories include increased blending of non-fossil fuels.
2.2 Five solution tracks capture most options
The Nordic region can become carbon neutral in several ways, using a mix of technological solutions, supported by behavioural changes. These can be categorised into five solution tracks (Figure 2.6).
Direct electrification is, among the five solution tracks, the most incontrovertible and remains a staple to all NCES scenarios. PtX, bioenergy, and CCS technologies – play decisive but varying roles depending on how the full range of parameters evolves. Efforts to reduce energy demand – i.e. the behavioural change track – will facilitate the transition regardless of which technology mix is used, particularly as lower demand significantly influence the need for infrastructure build out. Thus, behavioural changes constitute the fifth and last, cross cutting, track towards decarbonisation.
Figure 2.6. The five solution tracks of the Nordic Clean Energy Scenarios. The five solution tracks can be complementary. Direct electrification is the main pathway to decarbonisation, forming the core in all scenarios. The other three alternative technology tracks complement direct electrification. Behavioural change will be impactful in all pathways.
Diverse motivations drive technology development and deployment. The NCES project aims to provide a nuanced analysis of decisive factors that tip the scales towards or away from certain pathways. Ultimately, it shows that the Nordic energy transition will require a balance across all scenarios studied. All five solution tracks play different roles depending on what technological developments, political priorities, and social changes take place, and they each have advantages and barriers (Table 2.1). The sections below introduce and explain these five solutions tracks; the following chapters explore in fuller details their roles in the three scenarios.
Table 2.1. Overview of advantages and barriers of the five solution tracks.
| The five tracks towards carbon neutrality | Advantages | Barriers |
| Direct electrification | Very low emissions when sourced from clean electricity. | Batteries still have relatively low energy density. |
| Distribution system already in place. Often results in improved energy efficiency. | Less attractive for very high heat applications. Large infrastructure investments needed for e.g. heavy trucks. | |
| Power-to-X | PtX fuels typically have high energy/weight ratios. | Large infrastructure investments needed. |
| Can provide high energy flow rates Can provide flexibility to the energy system. | Energy penalty is significant. A typical commercial electrolyser for hydrogen production, for example, has an efficiency of 60-80%. | |
| Bioenergy | Readily available. | Risks of environmental damage and biodiversity loss. |
| Can directly substitute fossil fuels in many applications. | Lifecycle may span 60-100 years until carbon neutrality is achieved. | |
| Nordic countries have international expertise and technology leadership. | Increased competition for biomass from non-energy applications. | |
| Can be blended in with fossil fuels in a transition period. | ||
| Carbon Capture and Storage technologies | Would not require significant changes to production processes in industrial applications. | Few benefits beyond emissions reductions making costs harder to bear. |
| Could eliminate hard-to-abate emissions while providing feedstock for e-fuels. | Large infrastructure needs. | |
| Can provide negative emissions when CCS is combined with bioenergy (BECCS) | New value chain needs to be developed, network effects. | |
| Concern over lock-in effects, effectively supporting a continued demand for fossil fuels. | ||
| Behavioural change | Behavioural changes that lower demand for energy often have important synergetic effects influencing several sustainable development goals beyond climate change. | To have pronounced effects on the energy system, behavioural changes need to be significant. Without systemic level support for altered behaviour it will have low effect. |
2.2.1 Direct electrification, the central pillar of decarbonisation
The combination of fossil free, clean, electricity and direct electrification is key to reducing emissions in all end-use sectors in all three NCES scenarios.
Falling costs for renewable electricity generation, a distribution grid that already reaches most end-users, and accelerating development of electric end-use technologies make direct electrification central to a decarbonised Nordic region.
Additionally, clear paths exist for electrification of several emission-intensive sectors and applications, such as light-duty transport, and many applications that require heat. In fact, electrical processes are often more efficient than thermal ones. An EV, for example, can convert 80-90% of energy stored in its battery into mobility; an internal combustion engine in a car rarely reaches 25% efficiency.
These factors together result in electricity’s share of final energy consumption rising from approximately 30% in 2020 up to 50% by 2050 in the NCES scenarios.
In short, the NCES project finds that direct electrification built on clean electricity, is likely to play a larger role than suggested by many previous studies, including the NETP projects. This underlines the need to accelerate implementation of direct electrification technologies and infrastructure even though other more immature technologies will play crucial roles in the long-term. It also aligns with trends over the last 10 years, with most developments pointing toward increased rates of electrification. Still, the way forward depends on developments in competing technologies and the conditions created to support generation and distribution of electricity. Direct electrification is no panacea. In applications that require high temperatures, high energy density in storage, or high energy flow rates electrification has limitations. It is clear, however, that direct electrification is quickly becoming competitive in many applications in all sectors of the economy (Table 2.2).
Table 2.2. Long-term competing technology tracks for direct electrification in the NCES.
| Direct electrification competes with | Heavy-duty transport | Industry | Heating |
| PtX | X | X | X |
| Bioenergy | X | X | X |
| CCS/BECCS | X | X |
2.2.2 PtX fuels offer high density, high energy flow rates, and impressive versatility
PtX refers to electricity conversion and reconversion processes used to produce and store fuels, with the ‘X’ denoting the resulting fuel. Options include ‘power-to-’ ammonia, chemicals, fuel, gas, hydrogen, liquid, methane, food, power, and syngas. This report uses ‘PtX fuels’ to refer to all these fuels.
PtX fuels, such as hydrogen, is rapidly gaining attention in discussions for global energy planning, including in the Nordic countries, as it offers some of the advantages lacking with direct electrification.
PtX fuels can, for instance, deliver higher energy flow rates and higher temperatures compared to direct electrification in most applications, making such fuels a strong contender to replace fossil fuels in industry. Several high-profile projects are in the demonstration phase, such as hydrogen-based steel production to replace coal and blast furnaces. Decarbonisation of steel, and the choice of technology to do so, will significantly impact the entire Nordic energy system and associated infrastructure needs.
PtX fuels such as liquid hydrogen or ammonia can also offer three or four times the energy/weight ratio (gravimetrical density) compared with a lithium-ion battery. Beyond industry applications, in the NCES scenarios hydrogen and other PtX fuels come into use in heavy-duty road transport, fishing and other maritime applications, and aviation, where weight is a critical parameter.
PtX can also provide flexibility to the energy system, for example by using electrolysis to balance hydrogen production to align with fluctuations in electricity generation. The excess heat of electrolysers can be used in district heating, and the Nordic countries are well positioned in that regard. As PtX fuels can be a feedstock in chemical processes, in this application they offer both a source of flexibility and additional potential revenue stream. Electrolysers are capital-intensive, however; at present, their economics depend on high utilisation rates, which limits this flexibility potential. In addition, significant increase in demand for PtX fuels would also require a lot of dedicated generation.
Finally, the distribution factor needs to be considered. At least over long distances, transporting hydrogen can be less costly per kilowatt hour than transporting electricity.
In the NCES scenarios, PtX mainly competes with direct electrification and biofuels in transport, with fossil fuels combined with CCS in industry, and BECCS in power generation and district heating (Table 2.3)
Table 2.3. Long-term competing technology tracks for PtX in the NCES.
| PtX primarily competes with | Transport | Industry | Power and heat generation |
| Direct electrification | X | X | |
| Bioenergy | X | X | X |
| CCS/BECCS | X | X |
The primary drawback of PtX is that it is electricity-intensive and, compared with direct electrification or biofuels, carries a substantial energy penalty. A typical commercial electrolyser for hydrogen production, for example, has an efficiency of 55-80% (power to hydrogen). If hydrogen is used to produce electricity in a fuel cell to power a heavy-duty truck, the total round-trip efficiency from power-hydrogen-mobility is currently typically well below 50%. Other weaknesses of the PtX solution track include lack of infrastructure for production and distribution of fuels (in particular for hydrogen), and immature end-use technologies.
2.2.3 Bioenergy is important but limited, as increased use raises sustainability concerns
Bioenergy can be used directly, for example for heat in industry, or converted into other solid or liquid fuels. As such, it shares many of the advantages of PtX in terms of versatility and potential to directly substitute fossil fuels. Biofuels can be processed to have chemical properties almost identical to fossil counterparts, making them attractive as ‘drop-in’ fuels and easy to use in transport and industry applications. Some biofuel production processes are already mature, such as conversion of food crops or some forestry products, while technologies such as gasification or pyrolysis require further commercialisation. Although future cost projections are uncertain, currently it is cheaper to produce synthetic fuels through the bioenergy route than through PtX.
Bioenergy already plays an important role in the Nordic energy system and continues to do so in all NCES scenarios where it is used extensively for district heating. In the short- to medium-term, biofuels will continue to play an important role as a market ready alternative to PtX fuels and electrification for heavy-duty transport. Across the long-term NCES scenarios, bioenergy will primarily compete with direct electrification for heating, with PtX fuels in transport and industry, and with fossil fuels combined with CCS in industry. Considering expected advances in electrification and other technologies for sustainable fuel production, progress in biorefinery technologies must accelerate to remain competitive – particularly as demand for biomass for applications other than energy is expected to increase, for instance from the chemical industry.
Table 2.4. Long-term competing technology tracks for bioenergy in the NCES.
| Bioenergy primarily competes with | Heavy-duty transport | Industry processes | Heat |
| Direct electrification | X | X | |
| PtX | X | X | |
| CCS/BECCS | X |
Ensuring a sustainable supply of bioenergy, particularly as demand rises, will be very important. While there is a large and growing stock of wood biomass available in the Nordics, provision of other ecosystem services from forests, and retained biodiversity, needs to be ensured.
The NCES analysis uses the same carbon accounting principles as the United Nations framework convention on climate change (UNFCC), where bioenergy is regarded as carbon neutral. Use of forest biomass for energy will increase atmospheric GHG concentrations in the short-term, whereas sustainably managed bioenergy has lower emissions than fossil energy over the long-term. Here, contextual parameters such as timing and production qualities make a difference. For this reason, it is critical that wood used for energy to the largest possible extent is based on waste and residues from forest products that stores carbon long-term, such as sawn wood used in buildings and furniture.
Sourcing is also of concern as, already today, the Nordic countries import a significant portion of the bioenergy used. Given increasing pressure on land use in most parts of the world, scaling up bioenergy production will be challenging.
2.2.4 CCS technologies work in hard-to-abate applications and enable negative emissions
Cement, and iron and steel manufacturing are notoriously energy and emission intensive sectors, with carbon emissions emanating from the processes themselves rather than from fuel combustion only. Rather than changing fuels or altering processes, it may be more cost-effective to capture and permanently store the resulting CO2. Since CCS basically allows the current processes to go on unchanged, albeit with some energy penalty, it offers a relatively straight forward solution with the potential to unlock room within the carbon budget across all sectors to ease the decarbonisation transition of the Nordic economy. Adding capture technology to a cement plant, for example, and transporting it to an underground facility for permanent storage could ensure that ~90% of potential CO2 emissions are never released to the atmosphere. This without fundamentally altering the basic production process or its feedstock.
While the technology may be effective, cost is a significant weakness of CCS: it drives up production costs while adding no extra value to existing products or outputs. This differs from EVs, for example, which in comparison to internal combustion engine vehicles (ICEVs) deliver additional value through reduced air pollution, less noise, and lower maintenance costs. Thus, even if the cost of CCS falls, the technology will continue to rely on carbon policies to make it competitive.
The combination of bioenergy and CCS (BECCS) can result in negative emissions. Once markets for negative emissions are developed, this could create an additional revenue stream for the operators of such plants. Additionally, some PtX fuels, such as e-methane, require CO2 that could be supplied through CCS. Combining biorefineries with CCS could be an interesting route for producing PtX fuels, which is an example of carbon capture and utilisation (CCU). As Nordic countries possess leading international expertise in the bioenergy and chemical sectors, this could be a particularly interesting avenue to pursue. The carbon benefit of CCU applications depends on the CO2 being captured and stored at the end of the lifecycle however, otherwise emissions are merely being delayed.
Direct air capture (DAC) is another emerging CCS technology. Rather than constraining emissions at point sources, DAC actively pulls existing CO2 from the ambient air. For DAC to become competitive, capture rates must be increased significantly while costs reduced dramatically. Current DAC technologies are much more energy intensive than, say, capturing CO2 from the flue gas at a power plant, mainly because of the much lower CO2 concentration in the air.
All NCES storylines include CCS in hard-to-abate industry sectors and some level of BECCS in refineries and district heating. The sensitivity analyses carried out in the project suggest that, should Nordic countries further tighten their climate targets, using more CCS and BECCS would likely be cheaper than eliminating fossil fuels completely.
CCS and BECCS mainly compete with PtX in industry, with hydrogen-based steel as a prime example of an alternative route to CCS (Table 2.5). They are also competitive with electrification of district heating. Combining CCS with conventional hydrogen production from natural gas, so-called blue hydrogen, could offer an alternative route to electrolysis for production of CO2-free hydrogen (see Chapter 4 for additional insights on PtX and blue hydrogen).
Table 2.5. Long-term competing technology tracks for CCS & BECCS in the NCES.
| CCS/BECCS competes with | Heavy-duty transport | Industry processes | Heating |
| Electrification | X | ||
| PtX | X | X | |
| Bioenergy | X | X |
2.2.5 Behavioural change could accelerate the most beneficial and cost-efficient transition
Behavioural changes that lower demand for energy could have important knock-on effects in the transition to carbon neutrality, including reduced investment in associated infrastructure regardless of which technology mix is pursued.
Behavioural change that lowers demand for energy can take many forms, with varying drivers and time perspectives. Short-term changes can be prompted through altered prices; higher fuel prices, for example, tend to reduce overall demand for transport services. Technology development can make it easier and less costly for consumers to choose more carbon-efficient options, such as an EV instead of a diesel vehicle. Shifting to new ways of meeting demand could deliver even larger impacts. In transport, modal shifts or transitioning to mobility as a service supported by autonomous vehicles are such examples. More radically, long-term changes in personal preferences may produce even larger shifts that further reduce energy demand.
Behavioural changes thus need to be understood at the individual level as well as at the systemic level. System level facilitation and technological development is needed to support day to day decisions that are more sustainable. The acceleration of short- and long-term developments is therefore dependent on shifts in policy, industry, as well as among citizens. Such shifts and actions need to recognise complex and non-technical aspects such as economic distribution, perceived fairness, and justice. This highlights the benefits of action in all dimensions related to behaviour: prices must incentivise efficient use of resources within the current regime, consumers must be encouraged to choose the best technologies available, and technologies and services that enable citizens to meet their preferences in radically more efficient ways need to be developed. Political ambition and leadership provide the foundation for such systemic shifts, ranging from the short- to the long-term.
The NCES explores the potential impact of some of these aspects, focusing on changes in transportation habits, attitudes toward onshore wind and CCS, as well as a shift in diets. Within the scope of energy system modelling, the scenarios include assumptions for reduced industry production and freight, higher acceptance of onshore wind, more efficient passenger transportation, and reduced agricultural emissions.
Under such assumptions, the need for new infrastructure decreases, and with it the overall cost of reaching carbon neutrality. Additionally, reduced Nordic demand could enable higher electricity export, generating additional revenue while facilitating the European clean energy transition.
THE NCES ANALYTICAL APPROACH AND BASIC ASSUMPTIONS
Quantitative energy system modelling provides the backbone of the NCES analyses. Two modelling approaches are combined; optimisation analyses of investments in all sectors using the ON-TIMES model, and dispatch and operation analysis focused on the electricity system using the BALMOREL model (Figure 2.7). The sectors covered and their definitions are given in Table 2.6. ON-TIMES covers the five Nordic countries. BALMOREL covers Austria, Belgium, Czech Republic, Denmark, Estonia, Finland, France, Germany, Italy, Latvia, Lithuania, Luxembourg, Netherlands, Norway, Poland, Sweden, Switzerland, and the United Kingdom. Note that Balmorel does not cover Iceland. Therefore, the PtX cases described in Chapter 4 does not include Iceland. Additionally, all numbers for 2020 in the report are modelled results and may differ from official statistics.
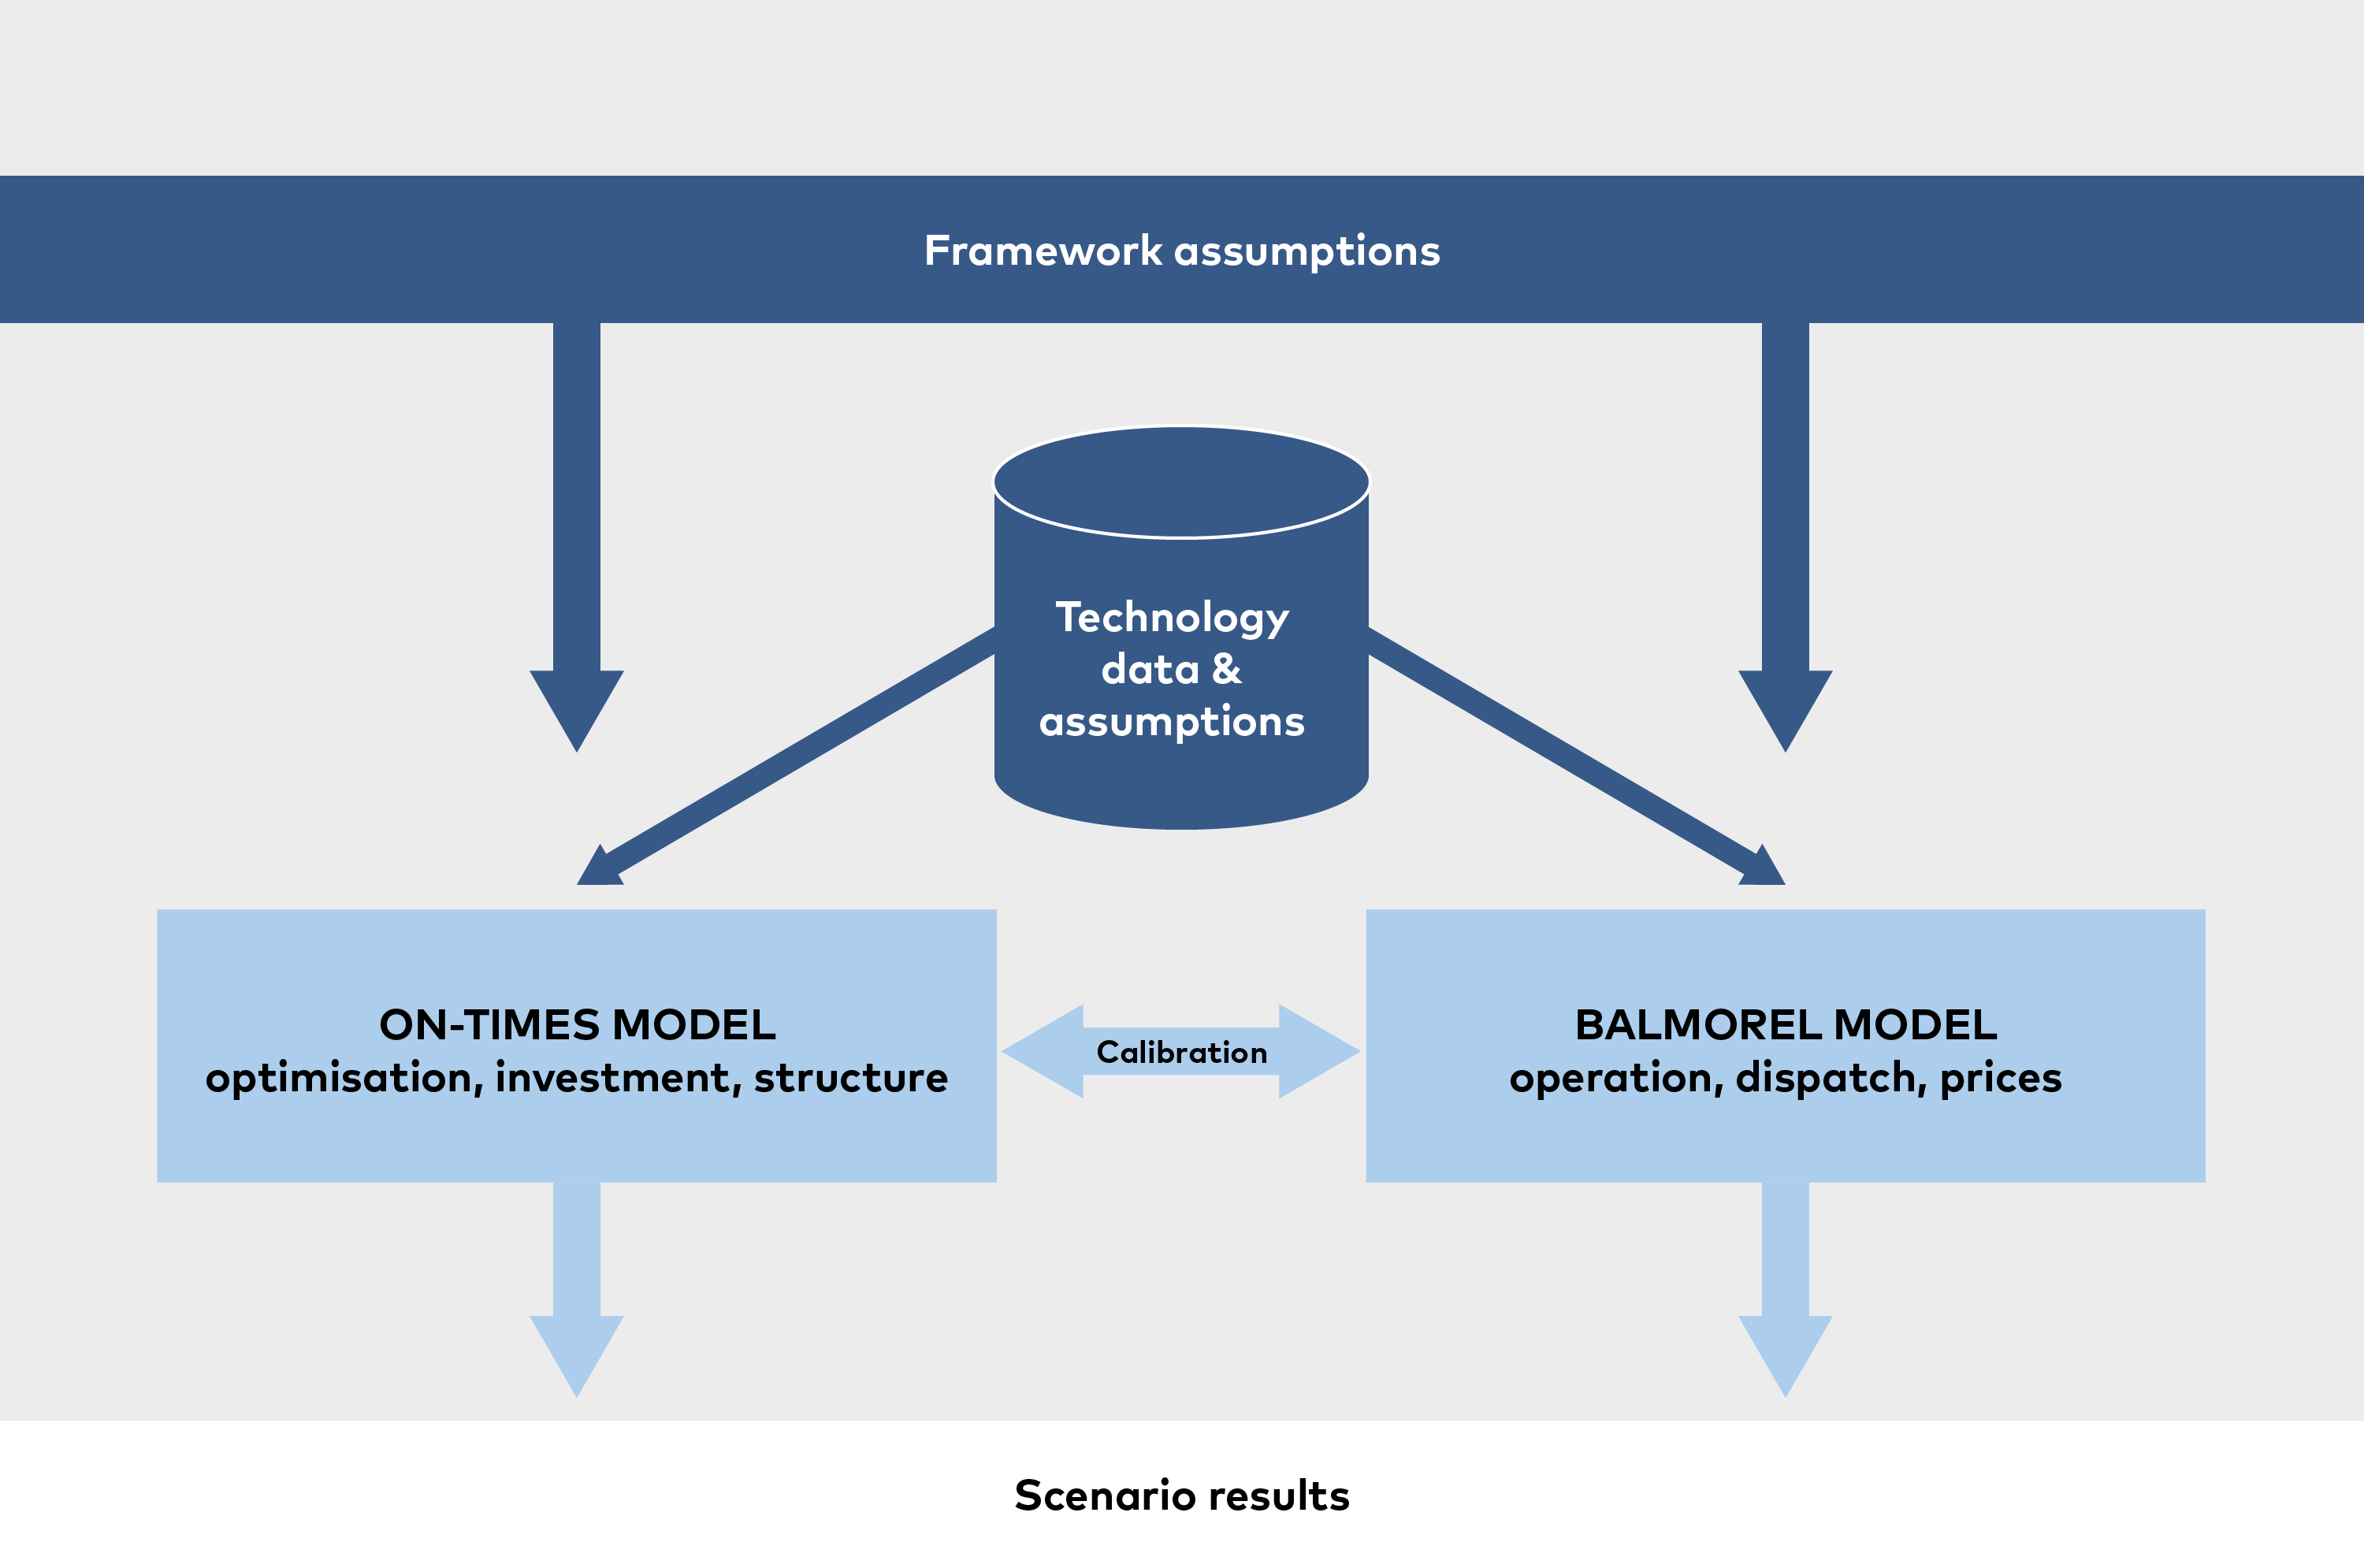
Figure 2.7. The analytical toolbox of the NCES includes both qualitative and quantitative methods. Two energy system models, ON-TIMES and BALMOREL, were soft-linked to provide the quantitative backbone of the project. ON-TIMES is a linear optimisation model that covers all Nordic countries and all sectors shown in Table 2.6. BALMOREL is focused on the operation of the power and heat sector, including distribution and trade. BALMOREL covers 18 countries in northern and central Europe. Framework assumptions were informed by literature reviews and extensive stakeholder input.
Table 2.6. Overview of sector definitions used in the NCES analyses.
| Upstream/fuel production | Power and heat | Heavy industry | Other sectors | Residential | Transport |
| - Exploration/-mining of oil, gas and coal - Fossil refineries - Renewable refineries and biogas - PtX plants - CCS plants and storage | - Thermal power plants (fossil, bioenergy, and waste) - Nuclear - Variable renewables (wind, solar) - District heat production (incl. excess heat) - Geothermal energy | -Pulp and paper -Mining - Iron and steel - Aluminium -Cement | Manufacturing industries - Food - Chemical - Machinery - Wood products Services - Heating of commercial buildings - Use of appliances - Data centres - Other services Agriculture - Energy consumption in buildings and work machines | Appliances - Computers - Cooking - Lighting - Refrigeration - Machines - Other Heating - Buildings – before/after 1970 + new buildings (urban, suburban, rural) - Heat savings - Heat supply (individual boiler, district heat | Passenger - Car - Bus - Train - Bike - Walking - Ferries - Aviation Freight - Van - Truck - Train - Ship - Aviation International transport - Modelled separate from national transport |
The NCES scenarios are designed to reflect that cost is but one parameter to consider when assessing the many pathways by which Nordic countries – and the region as a whole – can achieve carbon neutrality. Moreover, technological progress depends on other societal developments, research and development priorities, industrial policies, level of Nordic collaboration, and which role the Nordic region wishes to play in Europe.
To capture this complexity of social, economic, and technological drivers, constraints and technology assumptions vary between the three main scenarios. Detailed descriptions and projections of technology costs and performance underpin the analysis. These assumptions are documented in the NCES technology catalogue, which can be downloaded at the Nordic Energy Research website. In addition, sensitivity analyses and scenario variants were set up to shed light on key issues. The scenario definitions were informed by literature reviews and a series of expert workshops conducted in 2020 and the main defining assumptions are summarised in Table 2.7.
Table 2.7. Table on the three main scenarios and primary assumptions.
| Key assumptions | Carbon Neutral Nordics, CNN | Nordic Power House, NPH | Climate Neutral Behaviour, CNB |
| Low bioenergy sensitivity variant | Biomass imports are linearly reduced from today’s levels to 0 in 2050 for all Nordic countries. 25% lower domestic bioenergy potentials. | ||
| High cost of CCS sensitivity variant | The total carbon abatement cost is increased by approximately 30 €/ton CO2, equivalent of 20-60% depending on technology. | ||
| GHG targets | National targets | ||
| Heavy industry | Sectoral production volumes from national projections. | Same as CNN except for in aluminium, and iron and steel where production is assumed to increase by 10% in 2050 compared to CNN. | Same as CNN up until 2030, thereafter reduces by 10% compared to CNN until 2050. |
| Production industry | Sectoral production volumes from national projections. | Same as CNN except in chemical applications where there is an increase in activity. | Same as CNN. |
| Trade and commerce | Sectoral Gross Domestic Product (GDP) from official economic projections. | Same as CNN except for an increase in number and size of data centres driving up electricity demand. | Same as CNN. |
| Households | Private consumption projections from official economic projections. | ||
| National transport | National projections of passenger km and ton km development. | Same as CNN. | For passenger transport national passenger km no growth is assumed from 2030 onwards with an assumed increase in shared mobility. Freight transport sees 10% lower growth in tkm projections from 2025 onwards due to more efficient logistics and lower consumption. |
| International transport | National projections of passenger km and ton km development. | Same as CNN. | 10% lower freight in aviation and navigation from 2030 onwards compared to CNN. |
| Technological development Investment, operation and maintenance costs, efficiency, input, and output | Follows the NCES Technology Catalogue. | Same as CNN except for: - increased power transmission capacity, between the Nordic countries and from the Nordics to mainland Europe. - increased H2 and fuel production. | Same as CNN except for: - a breakthrough in autonomous vehicles and shared mobility resulting in more efficient private transport. |
 PHOTO: MAMMUT MEDIA/NORDEN.ORG
Chapter 3
Direct Electrification, the Central Pillar of Decarbonisation
Being a central solution track in all NCES scenarios, direct electrification in turn influences the potential development of other solutions and choices towards a carbon neutral Nordic energy system. Falling costs for renewable electricity generation, a distribution grid that already reaches most end-users, together with increasing competitiveness for certain end-uses, where for example biofuels was thought to be the only reasonable option, make direct electrification central to decarbonisation. In short, the NCES analysis finds that direct electrification built on clean electricity, is likely to play a larger role than suggested by many previous studies, including the NETP projects.
Key messages
-
Direct electrification is a cornerstone in all NCES scenarios; it is often the cheapest way to reduce emissions, it can enhance energy efficiency and, in many instances, offers cost savings independent of climate policy.
-
Electrification of transport is accelerating in all scenarios. The shift away from fossil fuels resulting in a 75% reduction in energy consumption per passenger km, and an increased electricity demand of 80 TWh/year by 2050.
-
Chemical industries and refineries have good potential for GHG reduction utilising electrification and renewable hydrogen.
-
There remains significant potential, around 50 TWh, for direct electrification in manufacturing industries and service sectors that is currently not utilised by the cost optimum model in the NCES scenarios.
-
In Denmark and Sweden more than half of district heating from 2030 onwards is expected to be delivered by heat pumps lifting waste heat from data centres, industries, and renewable fuel production to district heating quality.
-
Sweden is in a good position for electrification of heavy-duty road transport, both as first mover on electric highways, but also as a producer of new electric trucks.
-
Norway is ahead of the curve on BEVs and have an extremely high electrification of final energy consumption in all sectors – more than 60% in 2050.
-
Iceland has significant potential for further electrification of heavy industry and for hosting data centres. The level of electrification depends on whether or not Iceland will import bioenergy.
3.1 Drivers for electrification
Electrification emerges as the pillar of carbon neutrality across all the NCES scenarios, although factors such as grid investments, electricity market development, and battery costs will influence the extent of its roll-out. By 'electrification' we mean direct electrification, where electricity directly substitutes fuel combustion, for instance in a car or industrial processes. This should not be confused with indirect electrification such as production of synthetic fuels by electric processes, which will be further explored in chapter 4.
Across all NCES scenarios, the rate of electrification accelerates from 2025 before levelling out around 2040, at which point the transition of the energy system reaches a new stable state and the rate of additional electrification subsides as seen in Figure 3.1.
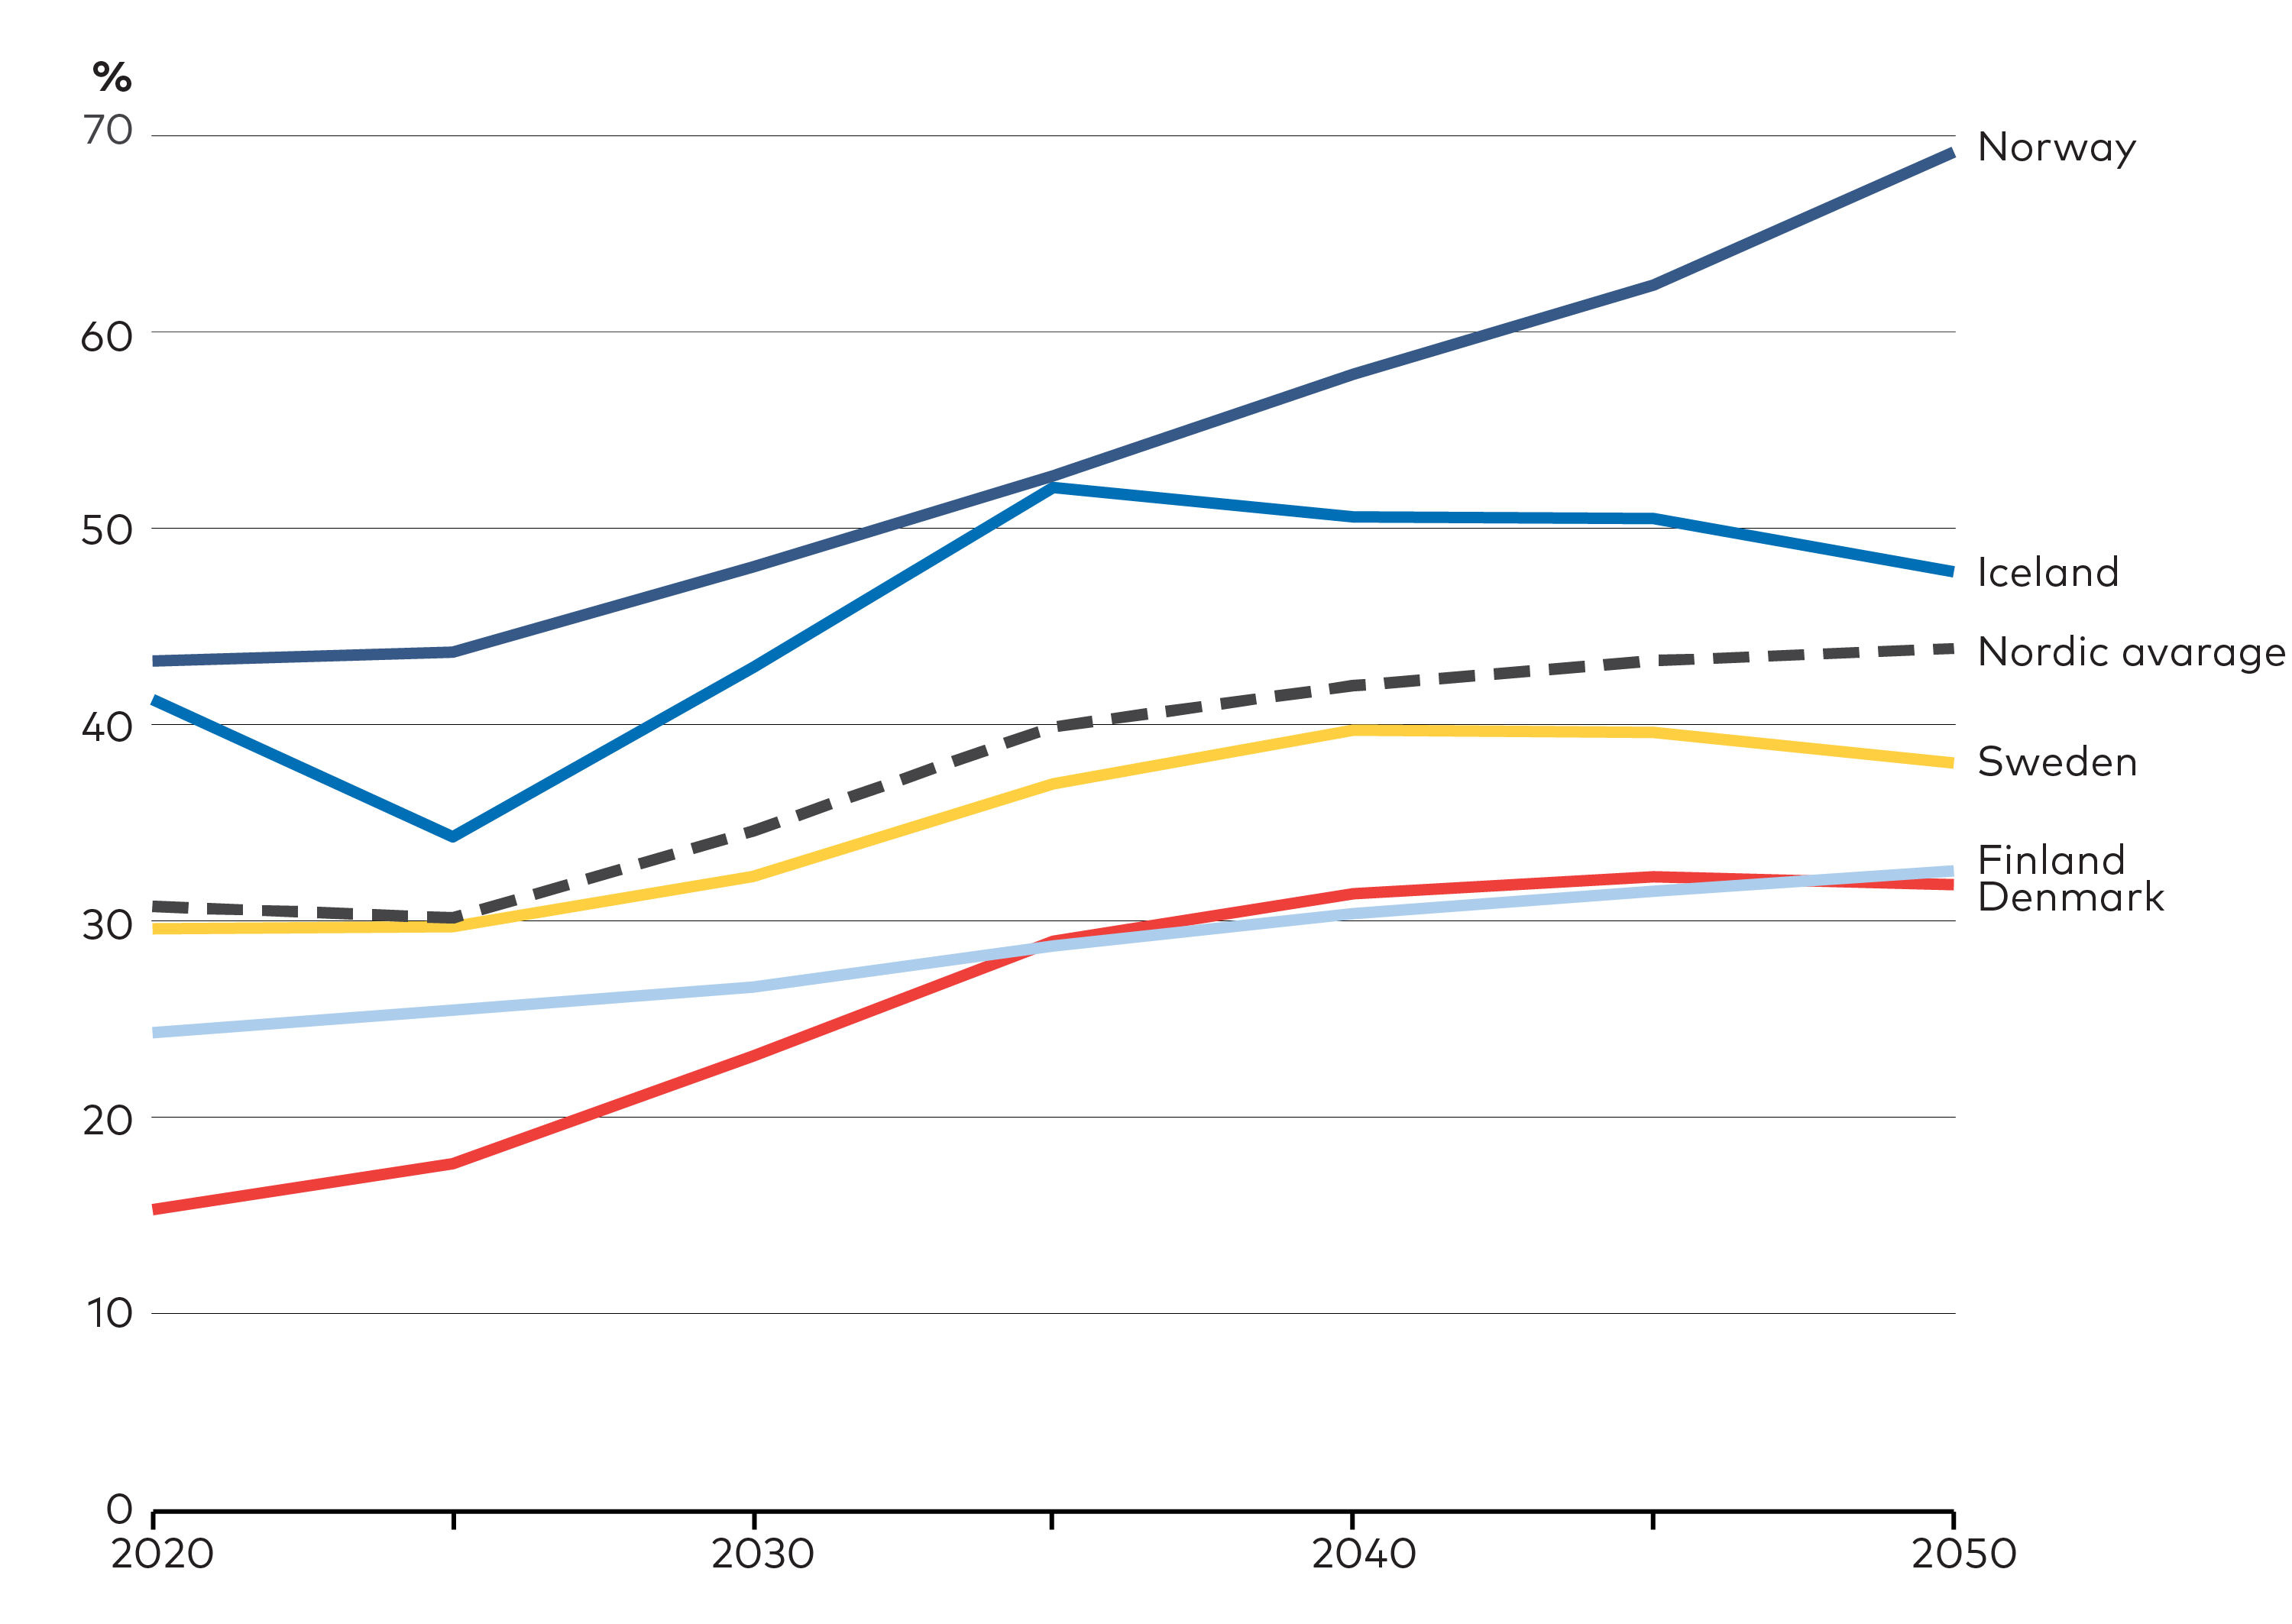
Figure 3.1. Final electricity demand as a share of total final energy demand – CNN scenario. Indicator showing direct final electricity demand divided by total final energy demand across all end-use sectors in each of the Nordic countries. The results are from the CNN scenario.
The main drivers for electrification in NCES are mainly the significant improvements in battery performance and price, and the continued drop in prices on solar PV and wind power (Figure 3.2.). This in combination with ambitious climate targets and technological development create advantageous conditions for electrification.
Looking across the economic sectors in the Nordics, electrification can cover many energy services. However, the potential for electrification is even larger than what is utilised in the NCES scenarios since electrification sometimes is more costly than other solutions. Meaning that the presented level of electrification in this chapter should not be taken as the maximum achievable, but simply the cost optimal solution for each country given the assumed prices and technology development used in NCES.
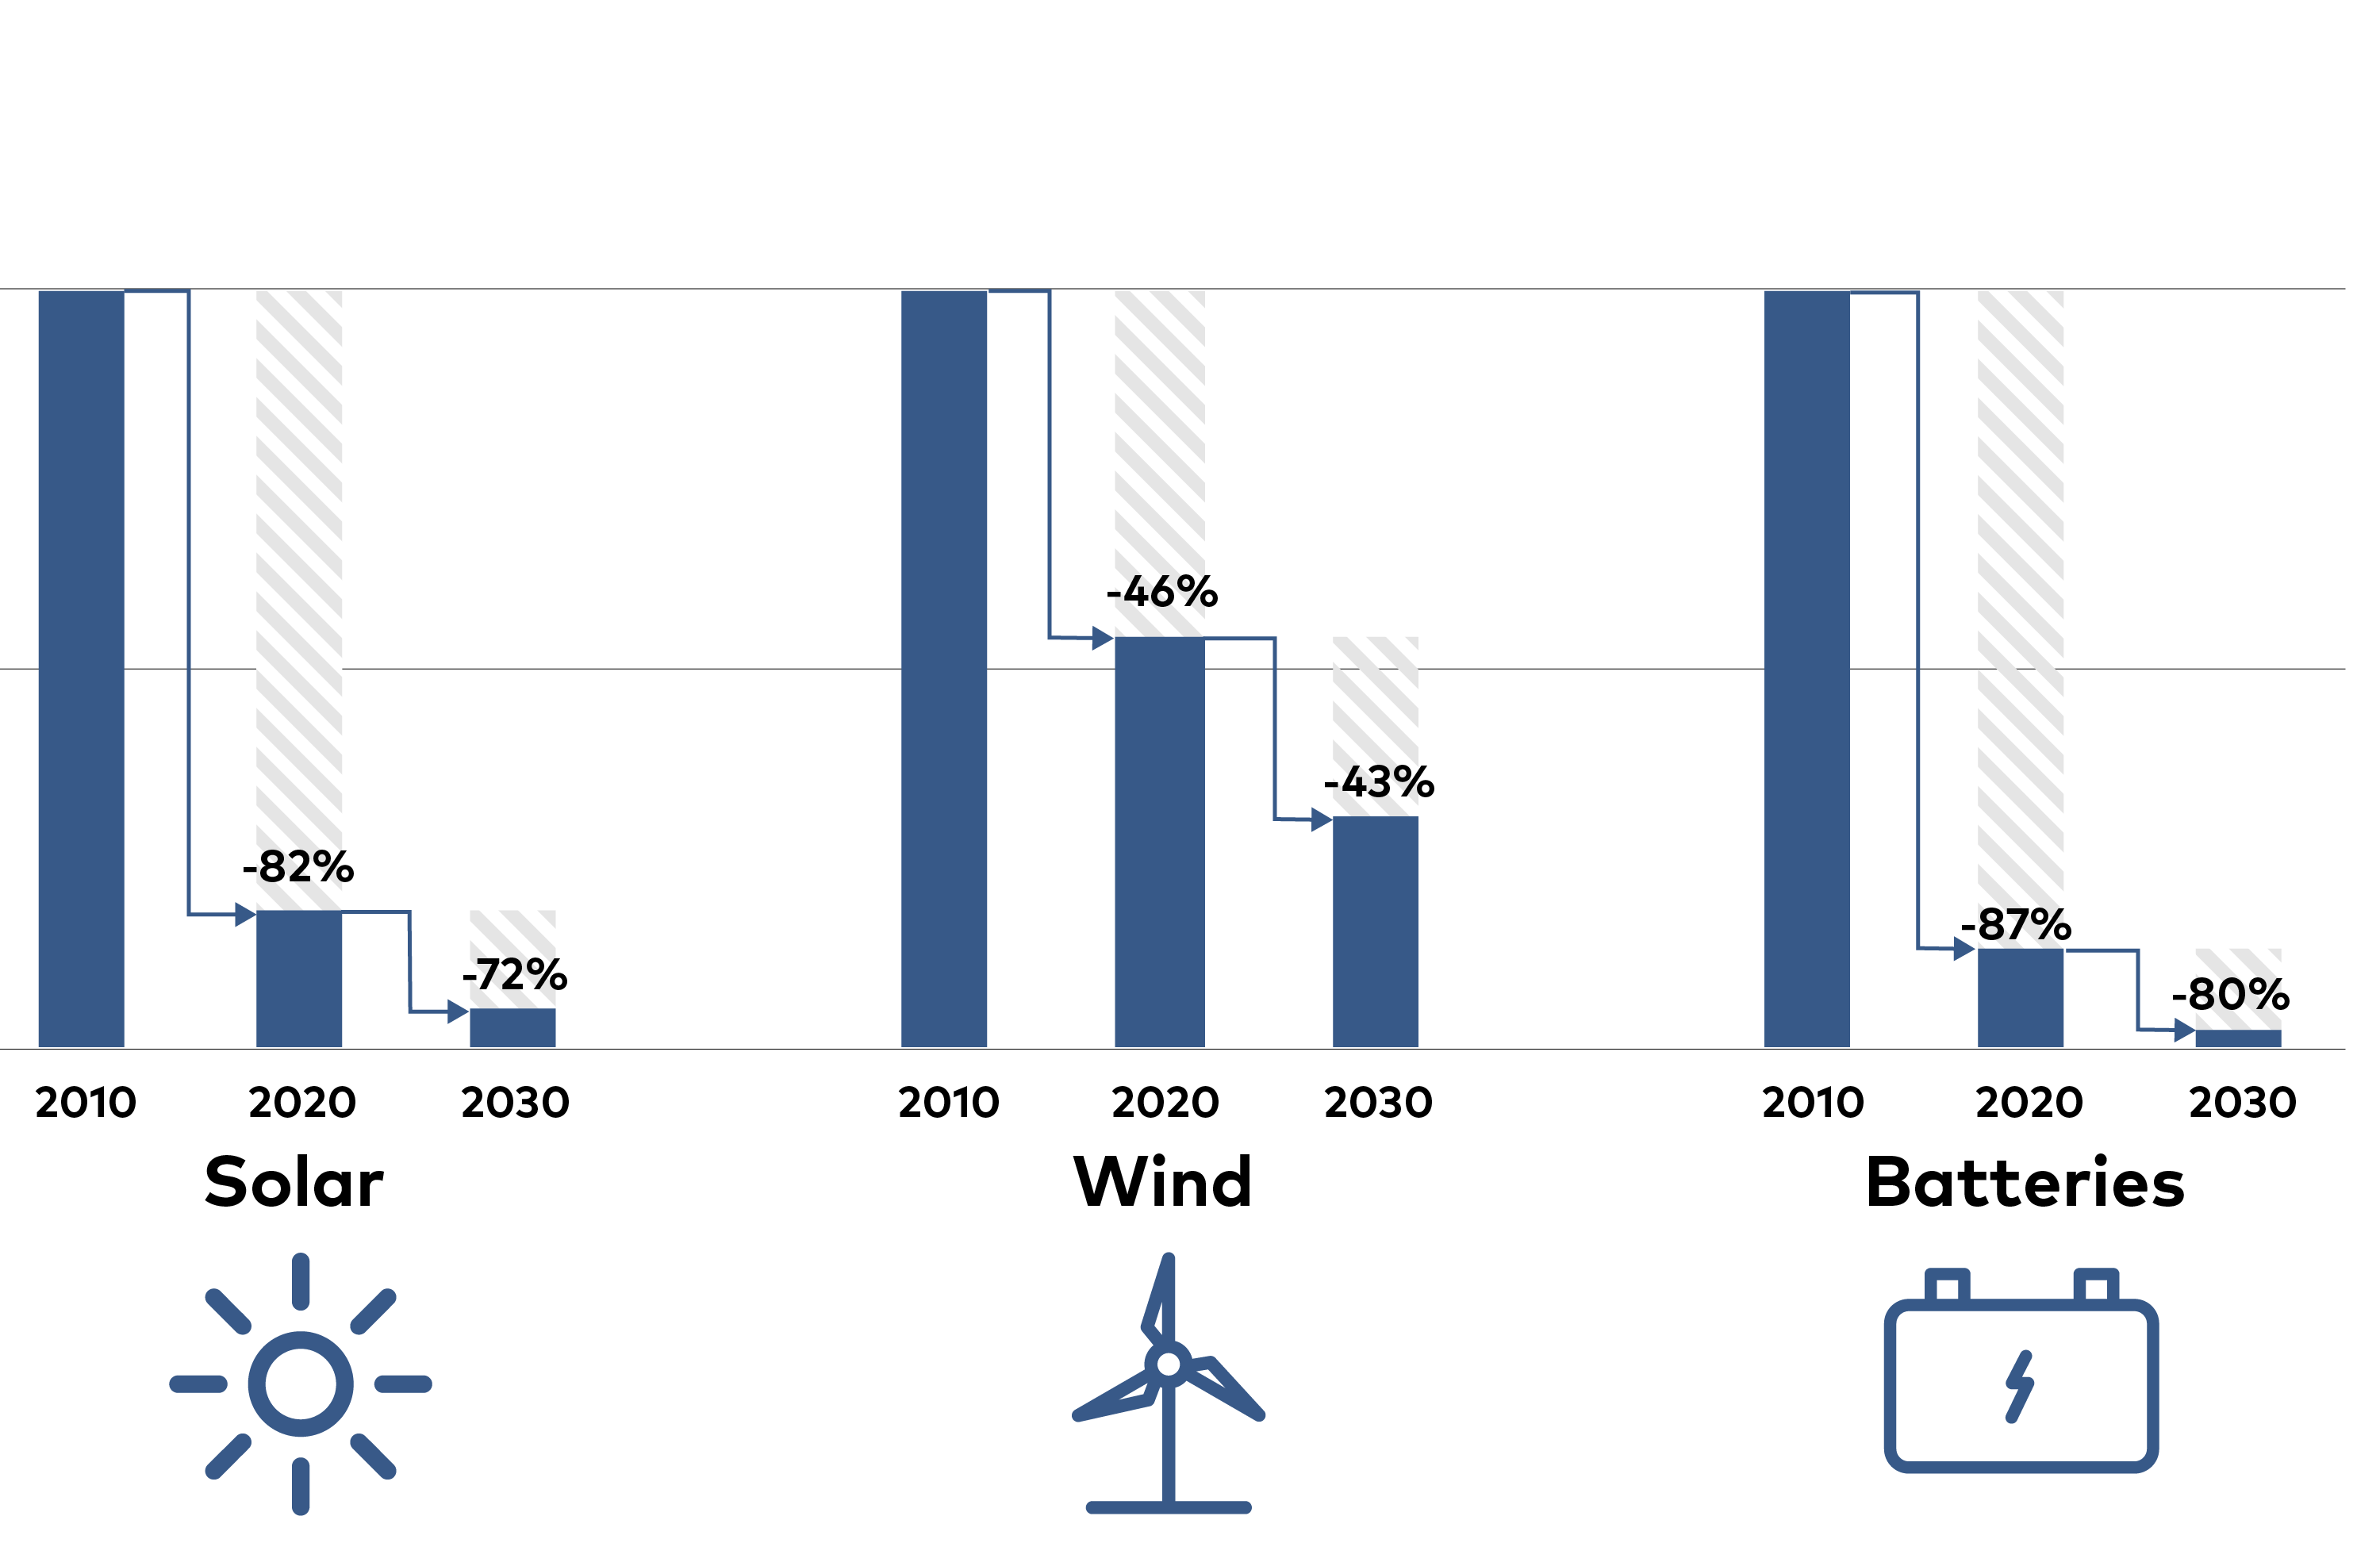
Figure 3.2. Projected cost developments. Historical and expected development in cost/kWh for solar panels, wind turbines, and batteries. Adapted from Dorr & Seba, 2020.
In addition, electrification of specific sectors also develops differently depending on the specific contexts of the Nordic countries. Denmark, Sweden, and Finland have a district heating system that meets much of their final heating and cooling demand and therefore has a lower rate of electrification than Norway. Norway has historically used mainly individual direct electric heating and therefore already has a high share of electricity in its final energy demand. Further, Norwegian power intensive heavy industry is largely based on hydropower and has also contributed to the high historical share of electricity use.
In Sweden, Iceland, Denmark, and Finland, where district heating supplies a large share of space heating, 48, 75, 40 and 40% respectively, the electrification of space heating primarily occurs in the form of heat pumps in district heating networks. The observed reduction in share of electricity demand around 2040 in Sweden can be explained by individual residential heating being switched from resistance electric heating to local heat pumps. But in general, all countries final energy demand starts to increase again at the end of the period as opportunities for further cost-effective electrification decrease.
3.2 Electrification can improve energy effiency
Electricity as energy carrier has attractive characteristics, with little loss it can supply almost any energy service demand. Switching to electric heating, engines, or pumps for example is often a central solution when implementing energy saving solutions in industries and buildings. This is why we see that an increase in electricity demand will reduce demand for other energy carriers as large-scale direct electrification delivers significant overall efficiency gains. Heat pumps for space heating can, by utilising 1 kWh electricity, deliver 2.5-4 kWh heat, while a boiler at maximum could deliver 1kWh heat from 1 kWh fuel.
The decrease in energy intensity for different sectors, energy input per service output as illustrated in Figure 3.3, is partly driven by electrification of processes but also by a general improvement in the efficiency of technologies using other energy carriers. For heavy industries in Sweden and Norway however, improved energy intensity lags. There are mainly two reasons for this development. Firstly, heavy industry in Sweden and Norway are already very efficient in their use of electricity to supply its processes. Secondly, for some industries the least-cost option in the model is to keep using fossil fuels by incorporating CCS, resulting in a stable or slightly higher final energy demand in the CNN. In contrast, in the NPH scenario the Swedish steel industry is assumed to instead switch away from coal using hydrogen and electricity, following a PtX pathway. This currently seems favoured by industry, exemplified by projects like HYBRIT and H2 Green steel.
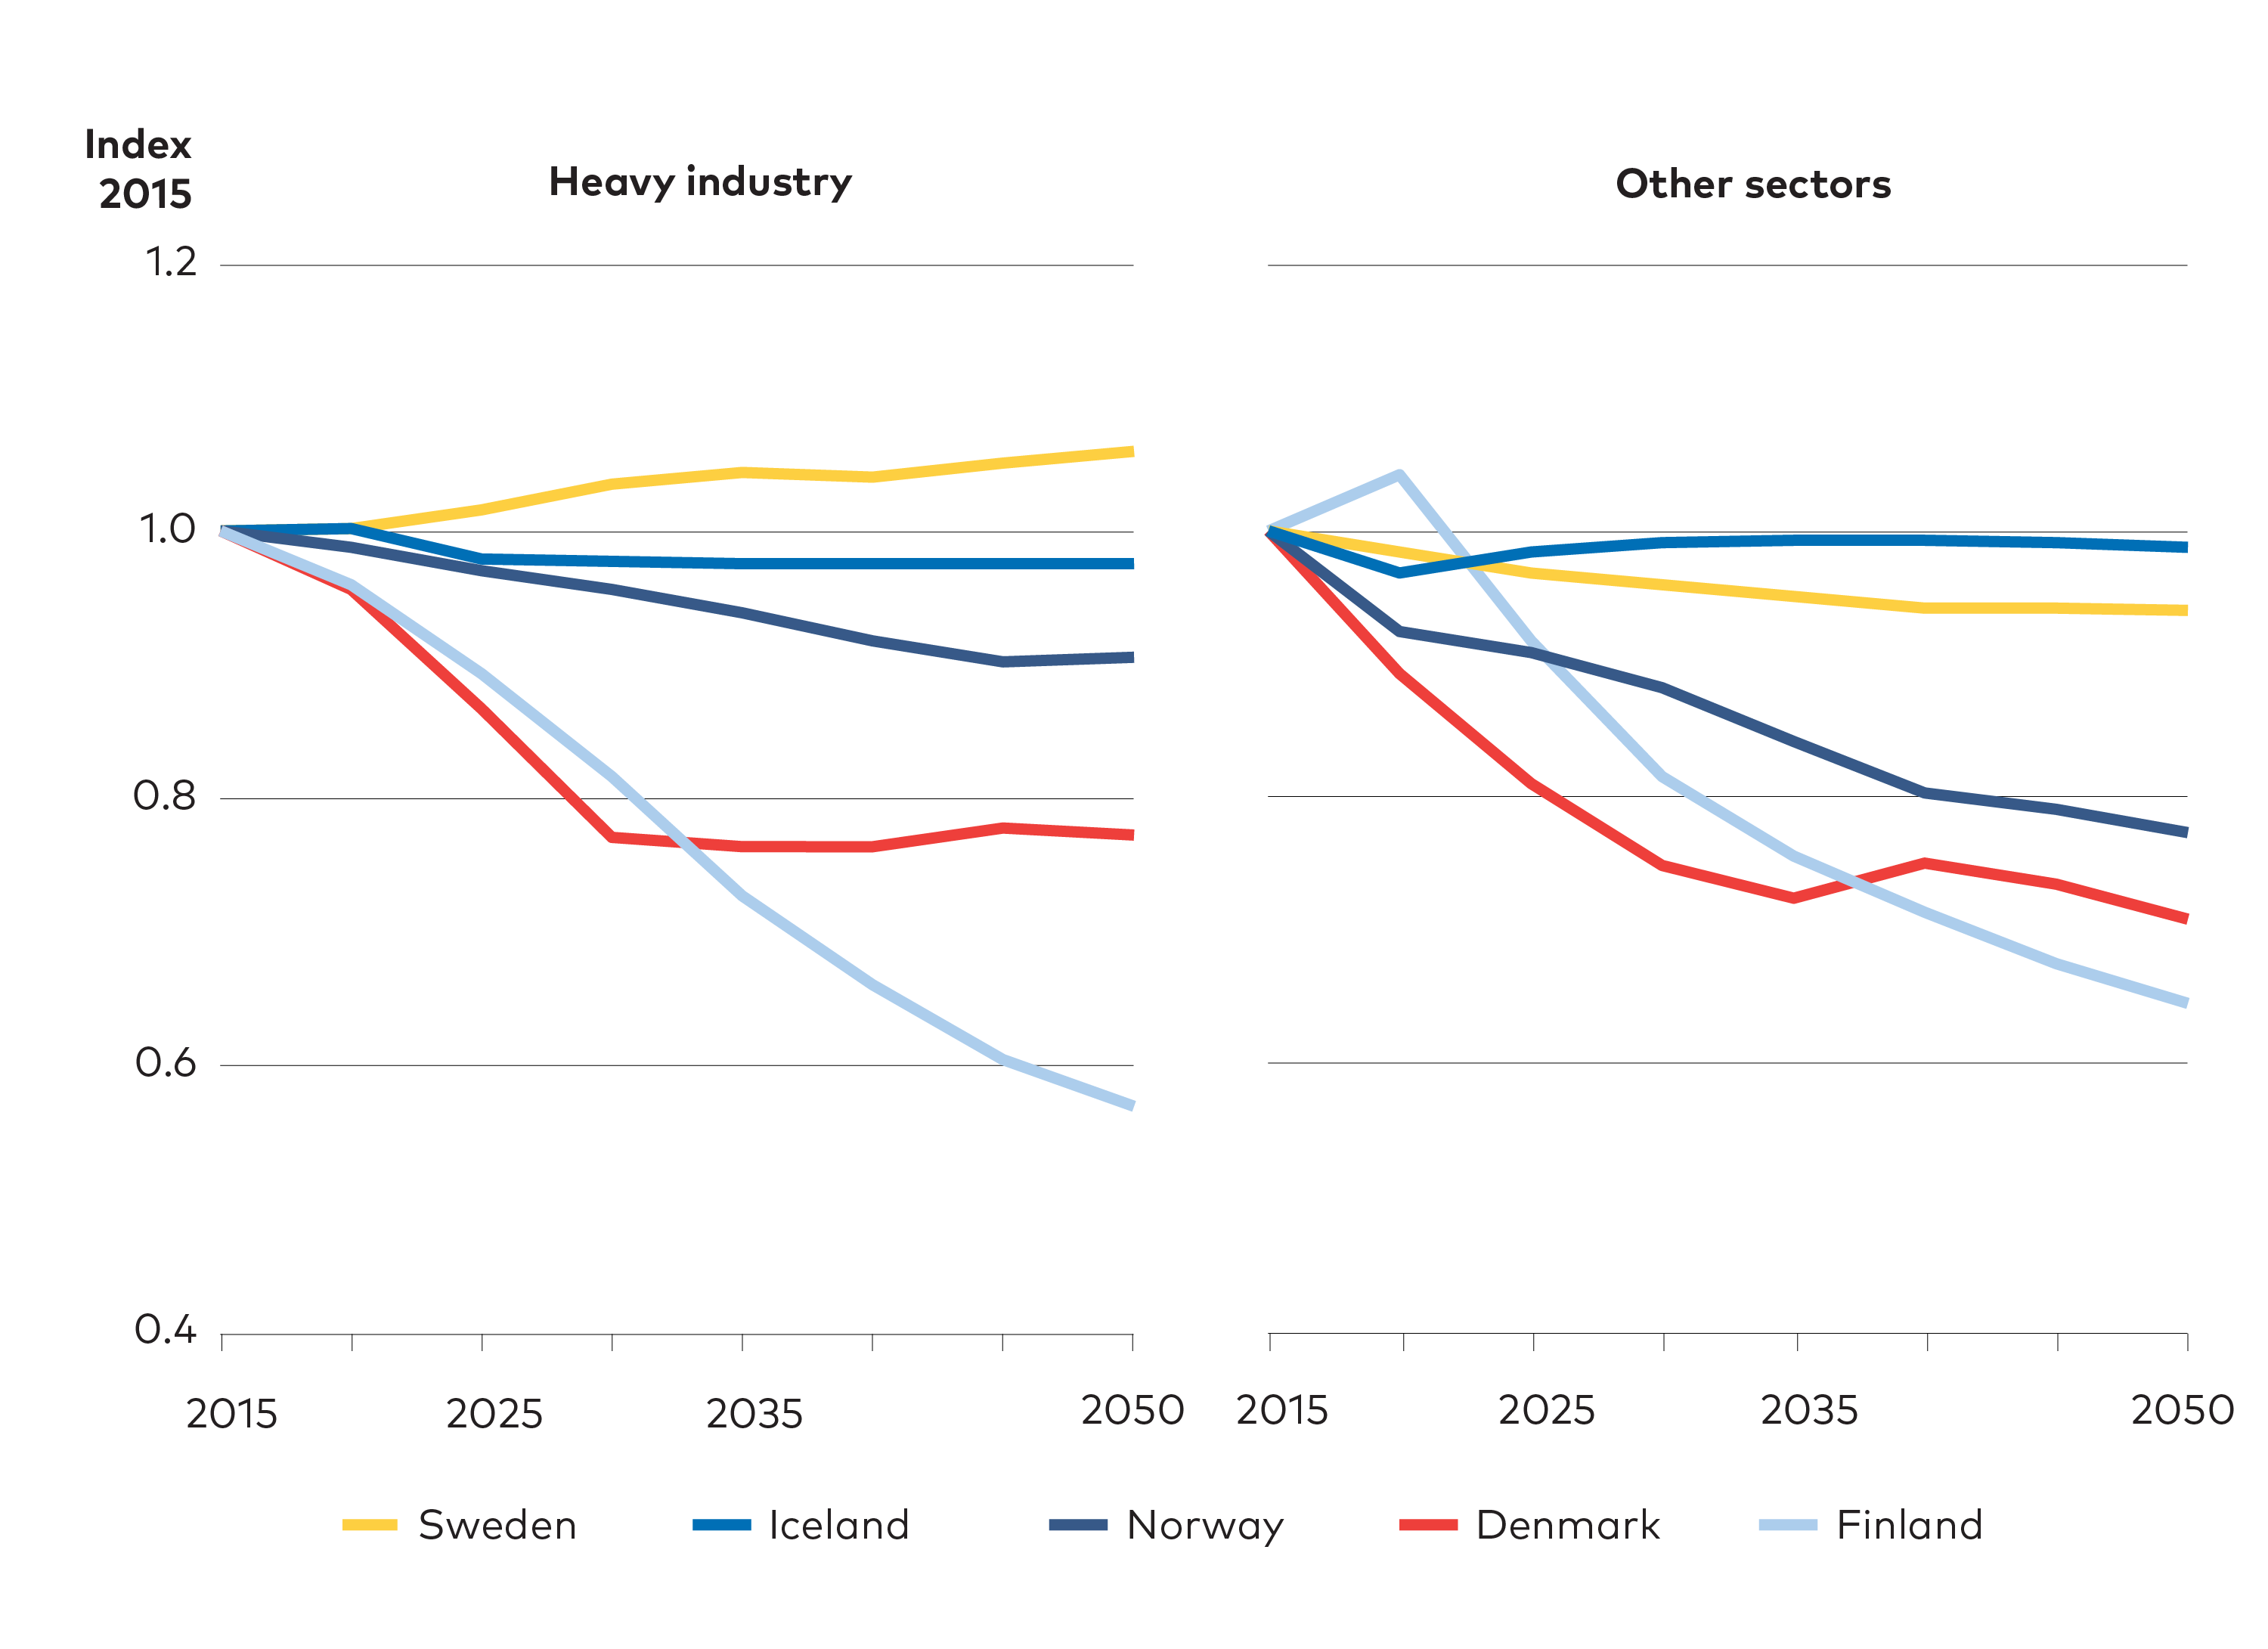
Figure 3.3. Energy intensity of industry and services - CNN scenario. In this figure, final energy input has been divided by resulting service level, output, to show the energy intensity of heavy industry and other sectors. Included in heavy industry is iron and steel, non-ferrous metals, mining, pulp and paper, and cement. Other sectors include manufacturing industries, data centres, services, and agriculture/fishery. Switching fuel and implementing more efficient technologies can lower energy intensity. Results from ON-TIMES.
New options for using electricity for process energy have become commercially available in recent years such as infrared heating and high temperature heat pumps. These options have the potential to completely change how industries produce process heat. However, these options are not fully utilised in the NCES scenarios as they are more costly and they are not needed for the model to reach national climate targets. Therefore, Sweden and Iceland is lagging in improving energy intensity in ‘Other sectors’ which includes manufacturing outside of heavy industry. Even though all countries have the same technological options on sector level, the ON-TIMES optimisation model results reflect different CO2 reduction targets across the countries. This means that there is more room available for further emission reductions if countries should choose to increase the ambition of their targets or if industries should choose to do more than targets require.
In road transport, opting for electrification also offers significant efficiency gains. Against traditional combustion engines, electric drivetrains offer an efficiency improvement factor ~3, meaning that energy consumption per passenger km plummets by 75% (Figure 3.4). Notably, in 2015 energy consumption per passenger km differs across the Nordic countries due to different driving patterns, average car size, and sutilisation rates. These consumption patterns converge as the fleet is replaced with more similar cars.
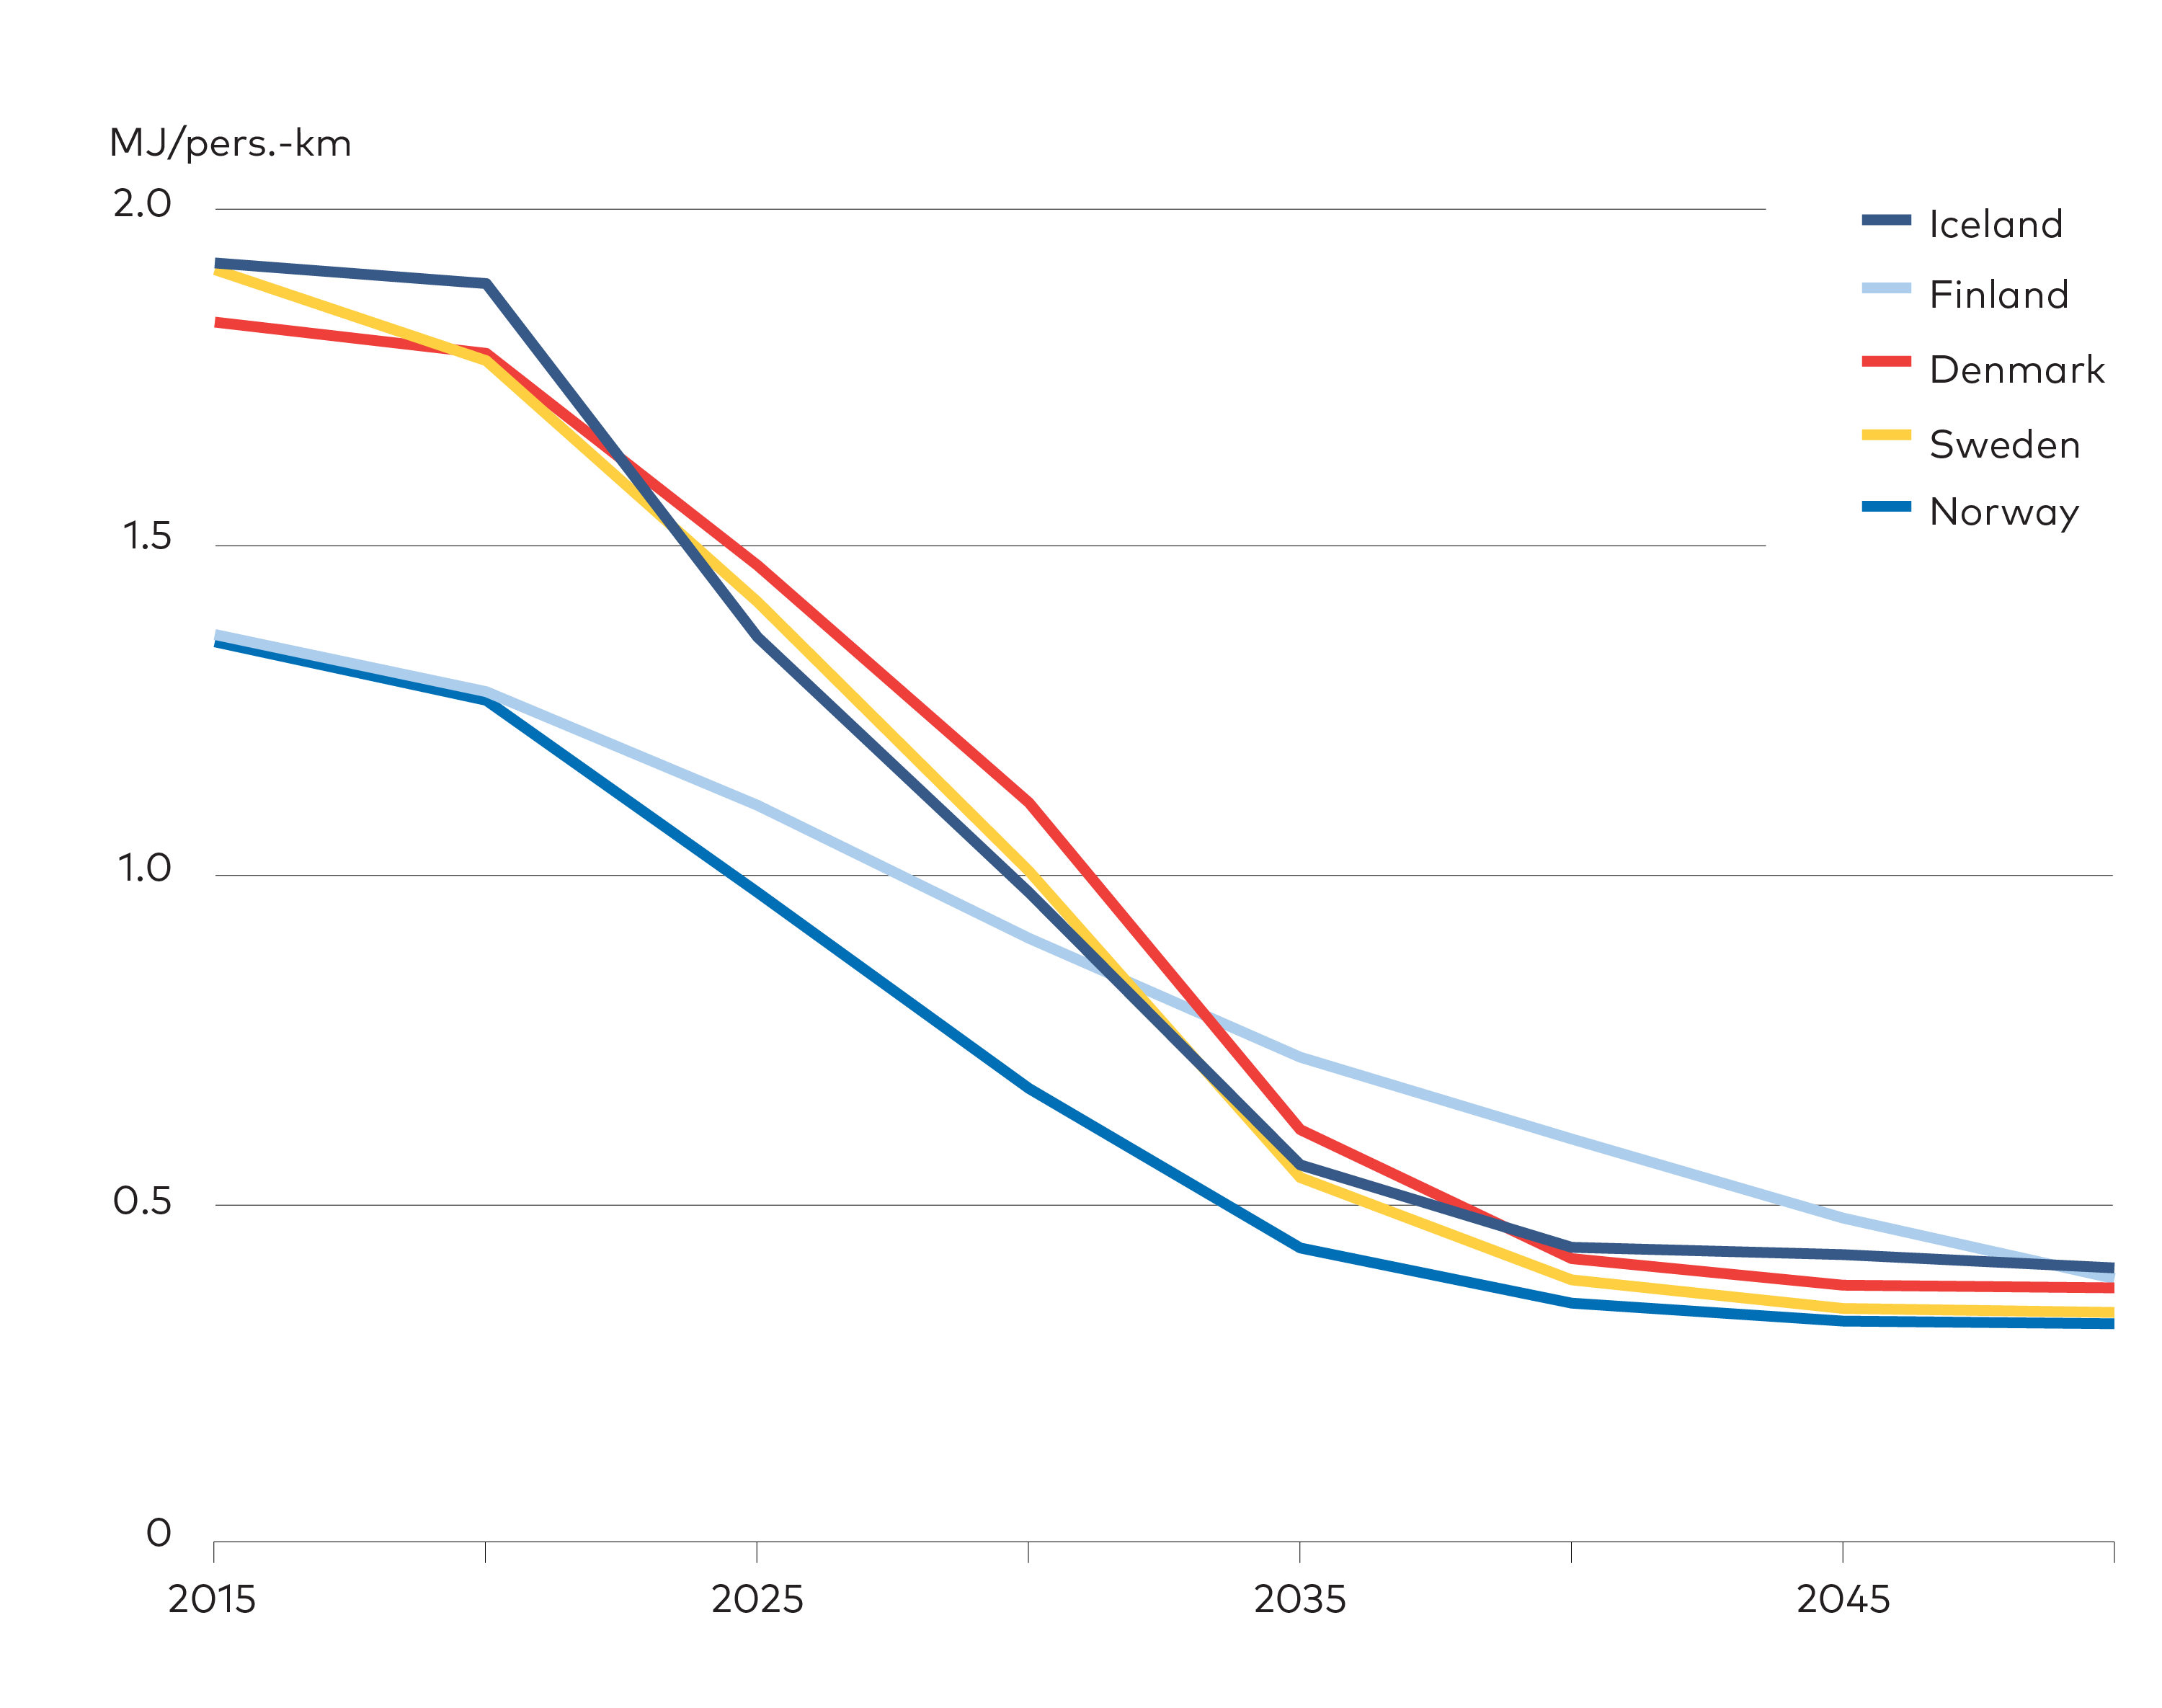
Figure 3.4. Energy demand per passenger km - CNN scenario. Energy consumption for cars per passenger km. The energy intensity reduces over time mainly due to the shift towards electrical vehicles.
3.3 Transport and power-to-x are the main drivers for electricity demand growth
Electrification of transport and PtX are the two main drivers for electricity demand growth across all Nordic countries. Data centres and electrification of process energy also add new demand but in lower volumes. These are applications that are either new, or that historically have relied on other energy carriers.
Traditional electricity consumption such as lighting or appliances generally remain flat to 2050 in all NCES scenarios due to efficiency gains. This means that expected growth in service demand for traditional electricity consumption is being counteracted by improved efficiency for different appliances, mainly driven by EU regulation.
In total, demand grows by 170 TWh from 2020 to 2050 in the CNN scenario, as shown in Table 3.1. This increase in demand should be seen as a minimum. In the NPH scenario increase in electricity demand is projected to be around 370 TWh but could increase to almost 600 TWh if additional electrification options are utilised, especially in industry. As will be further discussed in Chapter 4, a future scenario with very high PtX demand, where the Nordic region produce large volumes of PtX fuels for exports, electricity demand could reach more than 1 000 TWh/year by 2050.
Table 3.1. Electricity demand change in 2030 and 2050 compared to 2020 by end-use sector for CNN and NPH (TWh). First part of the table “ON-TIMES modelling results” are the changes found as a result from the model runs minimising total system costs. Second part “Extra electrification potential” is a rough estimate based on the plans for new industrial plants and fuels consumption in sectors, which could be replaced by direct electrification.
| CNN | NPH | ||||
| ON-TIMES modelling results | 2020 | 2030-2020 | 2050-2020 | 2030-2020 | 2050-2020 |
| Sector electricity consumption | |||||
| Cars | 1.0 | 8.0 | 34.5 | 8.0 | 34.5 |
| Trucks | 0.2 | 7.9 | 21.1 | 7.7 | 17.0 |
| Data centres | 1.4 | 21.9 | 33.4 | 45.3 | 68.3 |
| Aviation | 0.0 | 0.0 | 9.2 | 0.0 | 9.1 |
| Heating plants | 11.0 | 1.4 | -1.8 | 1.4 | -2.0 |
| Heavy industry | 96.0 | -1.9 | 1.4 | -3.1 | 10.6 |
| Fossil refineries and PtX | 25.6 | -10.5 | 39.3 | 13.0 | 219.1 |
| Transport - other | 3.8 | 3.5 | 13.8 | 3.5 | 13.9 |
| Other sectors | 155.9 | -1.8 | 11.7 | -1.3 | 10.9 |
| Residential | 128.5 | -8.5 | -11.4 | -9.1 | -12.9 |
| Sum | 423.6 | 20.0 | 151.2 | 65.4 | 368.5 |
| Sum w/ biomass sensitivity | 423.6 | 65.0 | 175.0 | 106.0 | 408.0 |
| Additional electrification potential | |||||
| Iron and steel (new plant types) | 40.0 | 90.0 | 40.0 | 90.0 | |
| Cement (CemZero) | 1.0 | 2.0 | 1.0 | 2.0 | |
| Other industries | 25.0 | 40.0 | 25.0 | 40.0 | |
| Space heat residential | 50.0 | 50.0 | 50.0 | 50.0 | |
| Sum extra potential | 116.0 | 182.0 | 116.0 | 182.0 | |
| Sum scenario + extra | 136.0 | 333.2 | 181.4 | 550.5 | |
| Sum scenario + extra w/ biomass sensitivity | 181.0 | 357.0 | 222.0 | 590.0 | |
In the NPH scenario the Nordic countries are assumed to be net exporters of hydrogen to continental Europe, exporting 170 TWh hydrogen in 2050. The Nordic countries have some comparative advantages for producing hydrogen with access to plenty of competitive RE production, possibility of utilising surplus heat from electrolysers for district heating, and companies with relevant expertise. In turn, this pushes up electricity demand for electrolysers at PtX plants to account for almost one third of the total electricity demand in 2050 as shown in Figure 3.5.
Figure 3.5. Projected growth in electricity demand – CNN and NPH scenario. Nordic electricity demand in the CNN and NPH scenario sectioned by use/sector. In 2020 total electricity demand in CNN is 423 TWh and in 2050 it reaches 575 TWh and in NPH it reaches 792 TWh.
Although the activity level in heavy industry is 10% higher in 2050 in NPH compared to CNN by 2050, it is not leading to a significantly higher electricity demand. Only iron and steel increase their electricity demand to the same extent in heavy industry. As the growth in traditional electricity demand is flat, due to efficiency gains out-balancing increased activity, then a measure for new demand in Table 3.1 is defined as sectoral electricity demand increase compared to 2020 levels.
If bioenergy availability decrease, electricity demand would increase. Electricity demand would increase by 20-40 TWh per year in a scenario with more limited bioenergy imports (both raw material and fuels), and reduced national bioenergy potential by 25%, as per a sensitivity analysis also shown in Table 3.1. For more information on scenario assumptions and sensitivities please see Table 2.7 in Chapter 2.
3.3.1 Transport volume development in NCES scenarios
NCES scenarios utilise transport volume forecasts conducted by national transport authorities. These typically show a substantial increase in transport volumes, with international aviation and cars accounting for the largest growth shares. As seen in Figure 3.6, 2020 exhibits a decline in aviation due to travel restrictions linked to the COVID‑19 pandemic. In the CNN and NPH scenarios, demand recovers by 2025 and catches up with historical growth rates thereafter.
These transport volume increases require fast market penetration rates of low carbon technologies to bring emissions in line with policy targets. And even under optimistic emissions scenarios, factors such as infrastructure requirements or effects on the urban environment remains challenging. Combined with the inherent uncertainties in transport volume projections, which could flatten with increased mobility services and changes in our behaviour, this makes a strong case for exploring additional pathways.
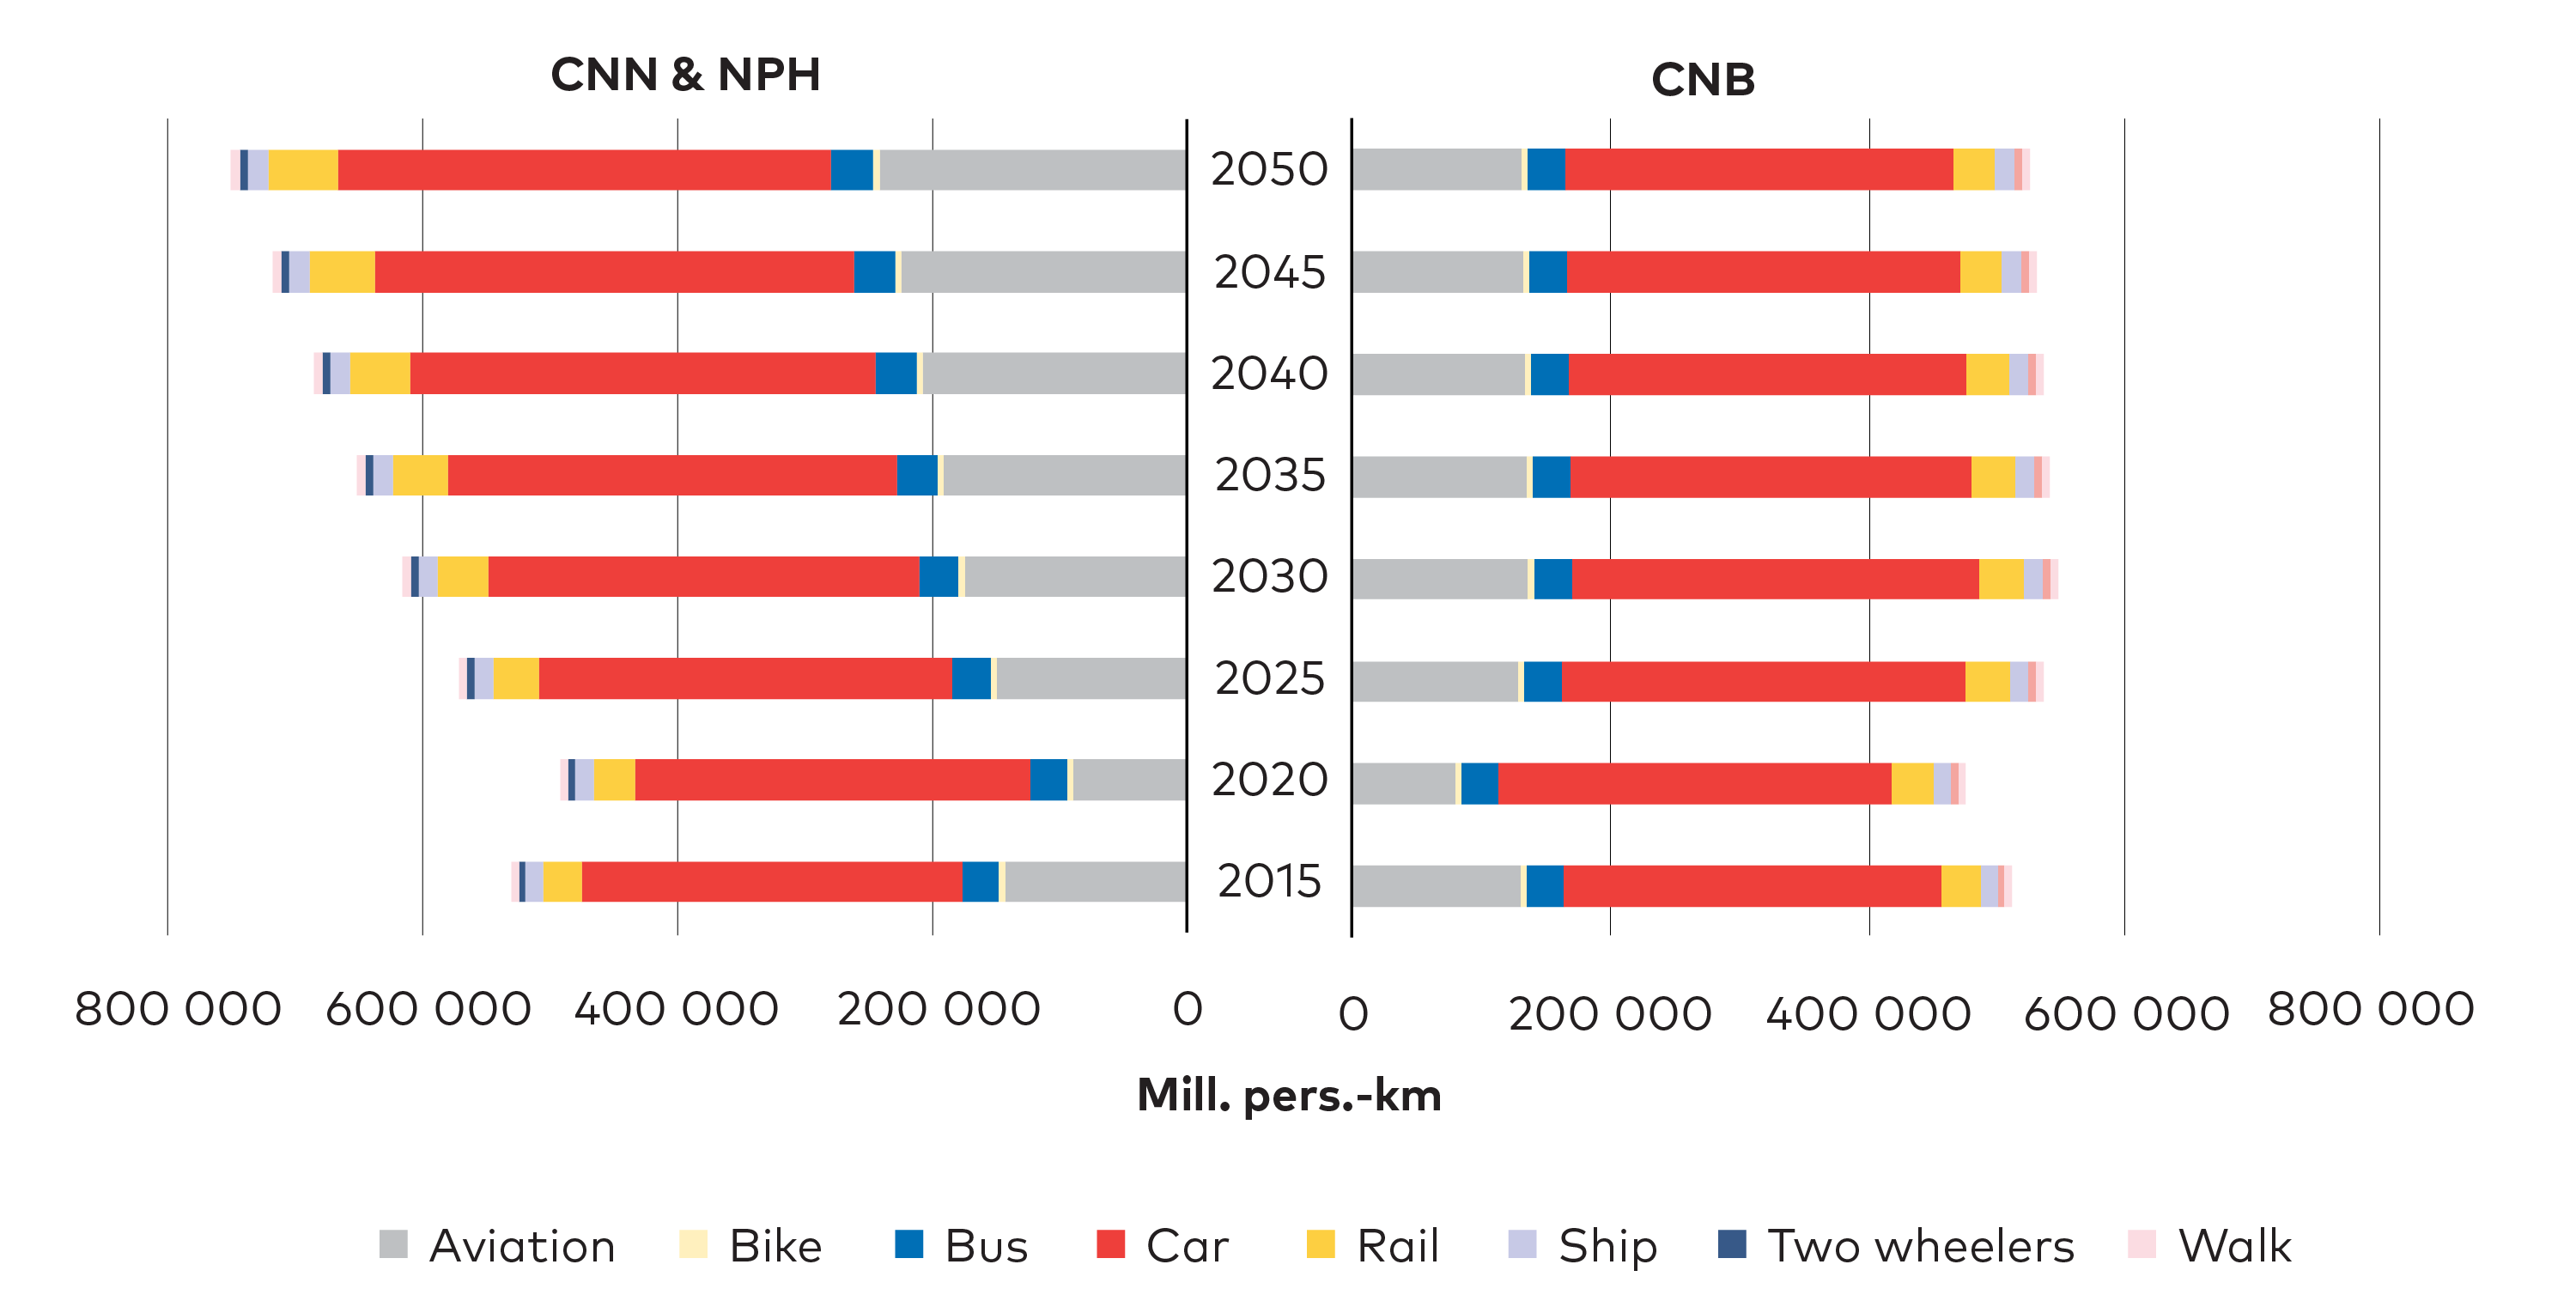
Figure 3.6. Projected transport demand in passenger km. The left panel show the CNN and NPH assumptions and the right show CNB. For CNN and NPH the biggest growth is expected in aviation (mainly international), but also in car and other means. For aviation, the “Covid-19 dip” can be seen in 2020.
The CNB scenario offers a contrast to CNN and NPH, demonstrating an increased environmental awareness which tempers growth in transport volumes. The CNB assumes that passenger km in cars will stay at 2020 levels throughout the period, and that international aviation volumes remain at 2015 levels until 2050. Increasing population and historical trends in willingness to travel longer distances is therefore assumed to not result in higher demand for transport. This could for example mean that more people are working from home, improvements are made for city planning, or that people have reached their limit of transport time. For more results related to shifts in travel behaviour presented in the CNB scenario, please see Chapter 7.
Modal shifts in passenger transport are not explicitly included in the NCES scenarios. The potential impact of modal shifts has however been demonstrated in the previous Nordic Energy Research project SHIFT, where modal shift options for Denmark, Norway, and Sweden were investigated.[1]www.nordicenergy.org/flagship/project-shift/ The project found that a 45% reduction of car transport could be possible by 2050 compared to 2015 due to structural planning policies such as better city planning and substantial efforts in shifting passengers from cars to walking, biking, bus, and trains.
3.3.2 Electrification of road transport will reduce costs and emissions
Cost savings drive much of the electrification of Nordic road transport in all NCES scenarios. Development of electric drivetrains and batteries make the expected ownership cost for BEVs fall below that of ICEVs by 2025 (Figure 3.7), and by 2030 electric trucks follow the same trend, (Figure 3.8).
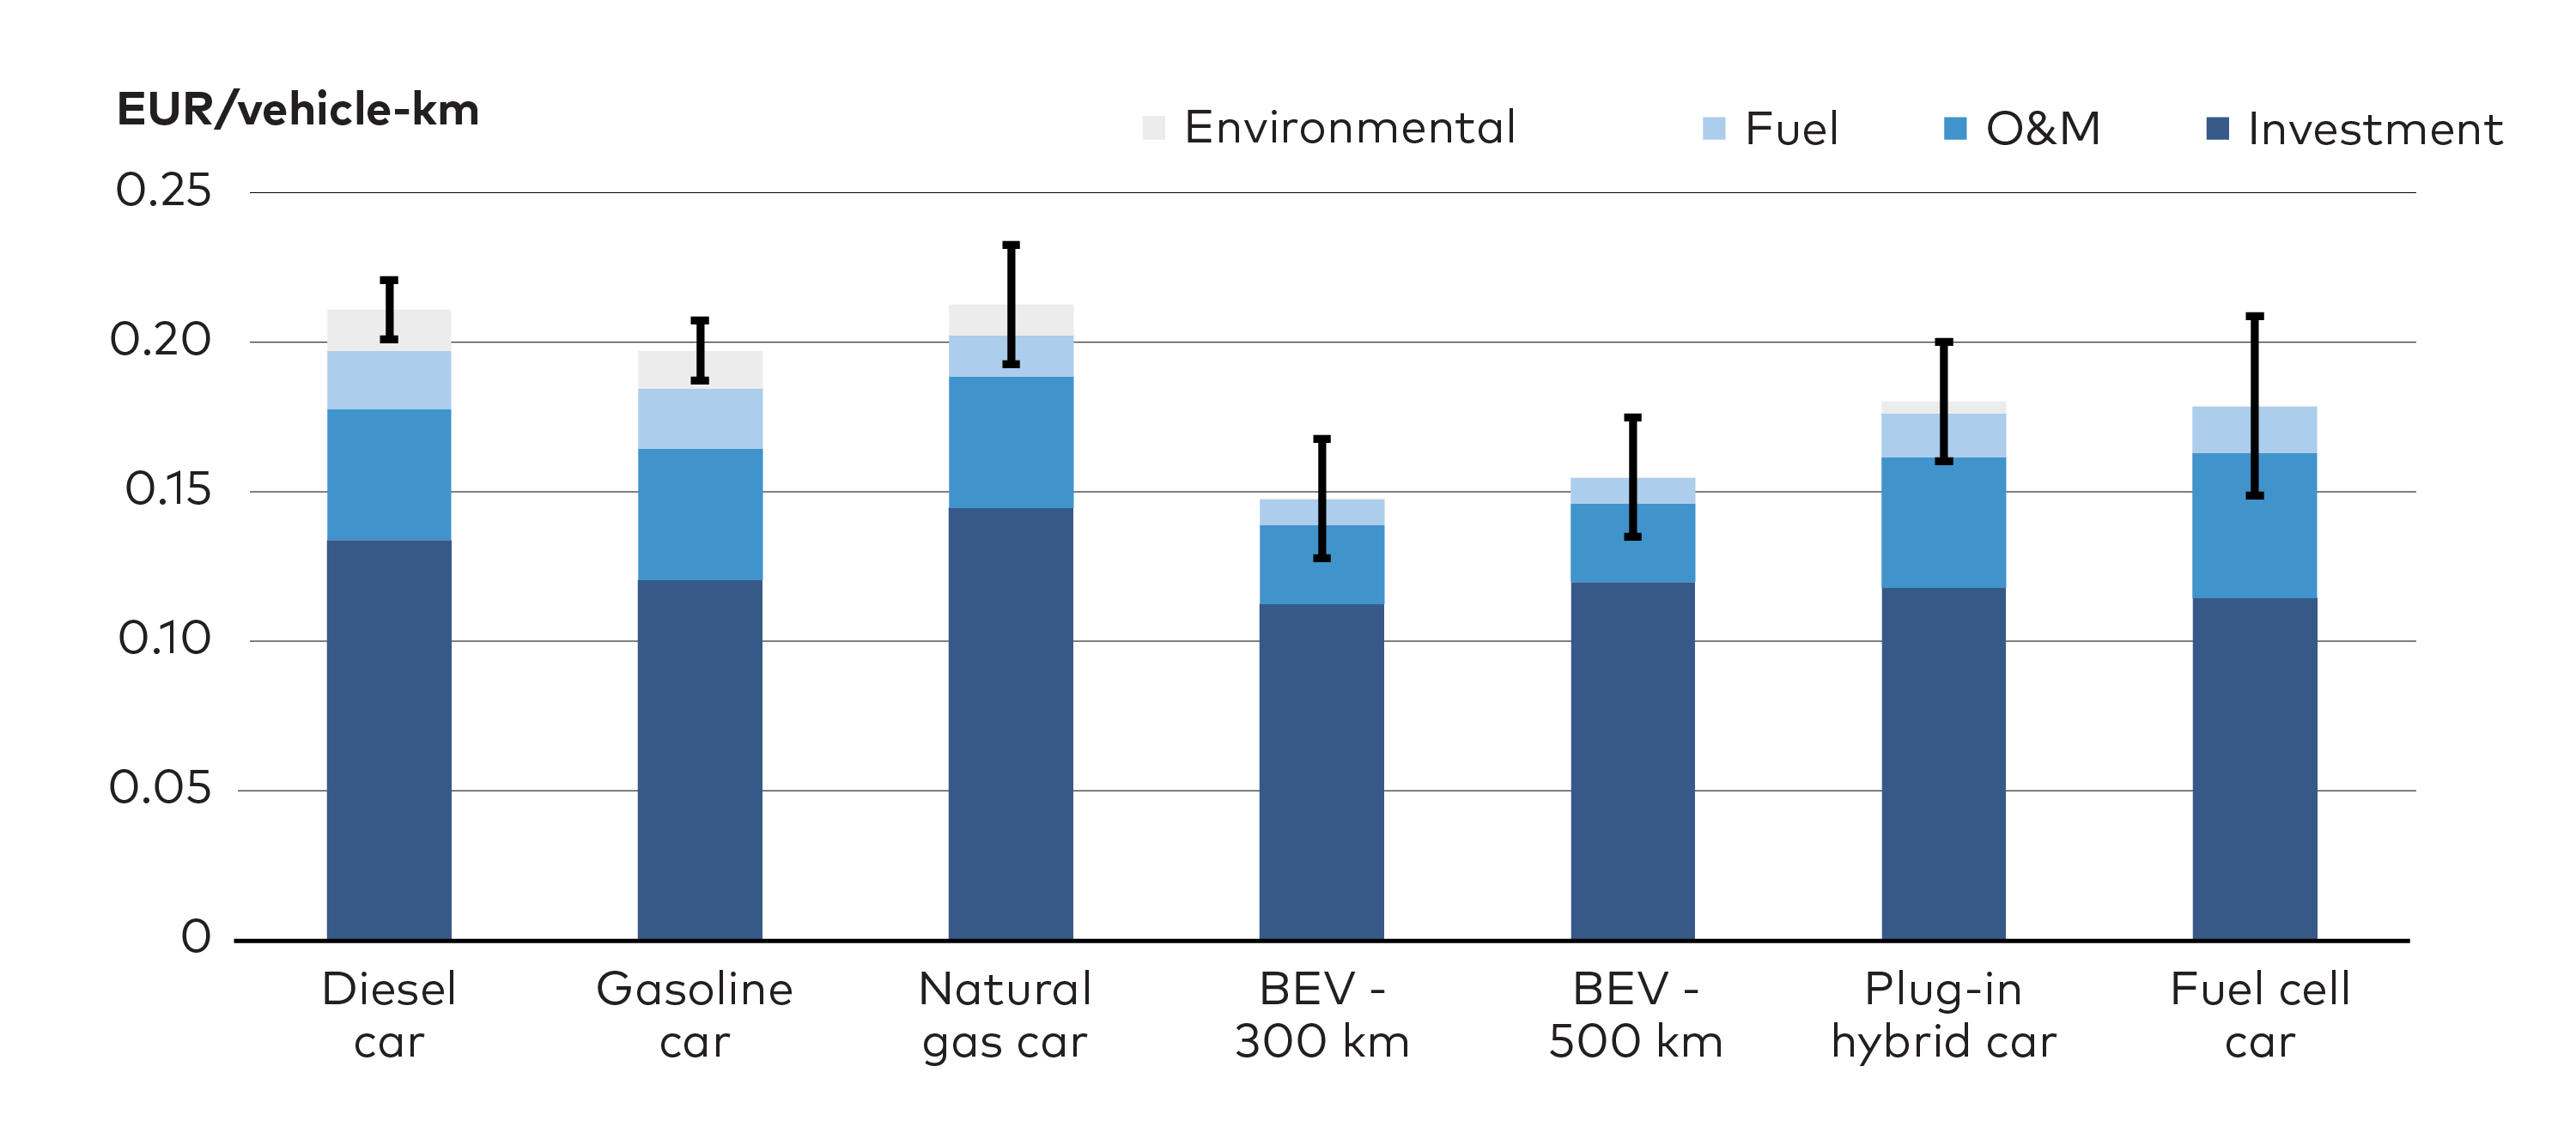
Figure 3.7. Levelized cost of transport for passenger cars. Environmental cost is CO2-Cost, 79 €/t by 2030 increasing to 125 €/t by 2040. Economic lifetime: 10 y. 300-500km is the range for the BEVs. Source: NCES Technology Catalogue.
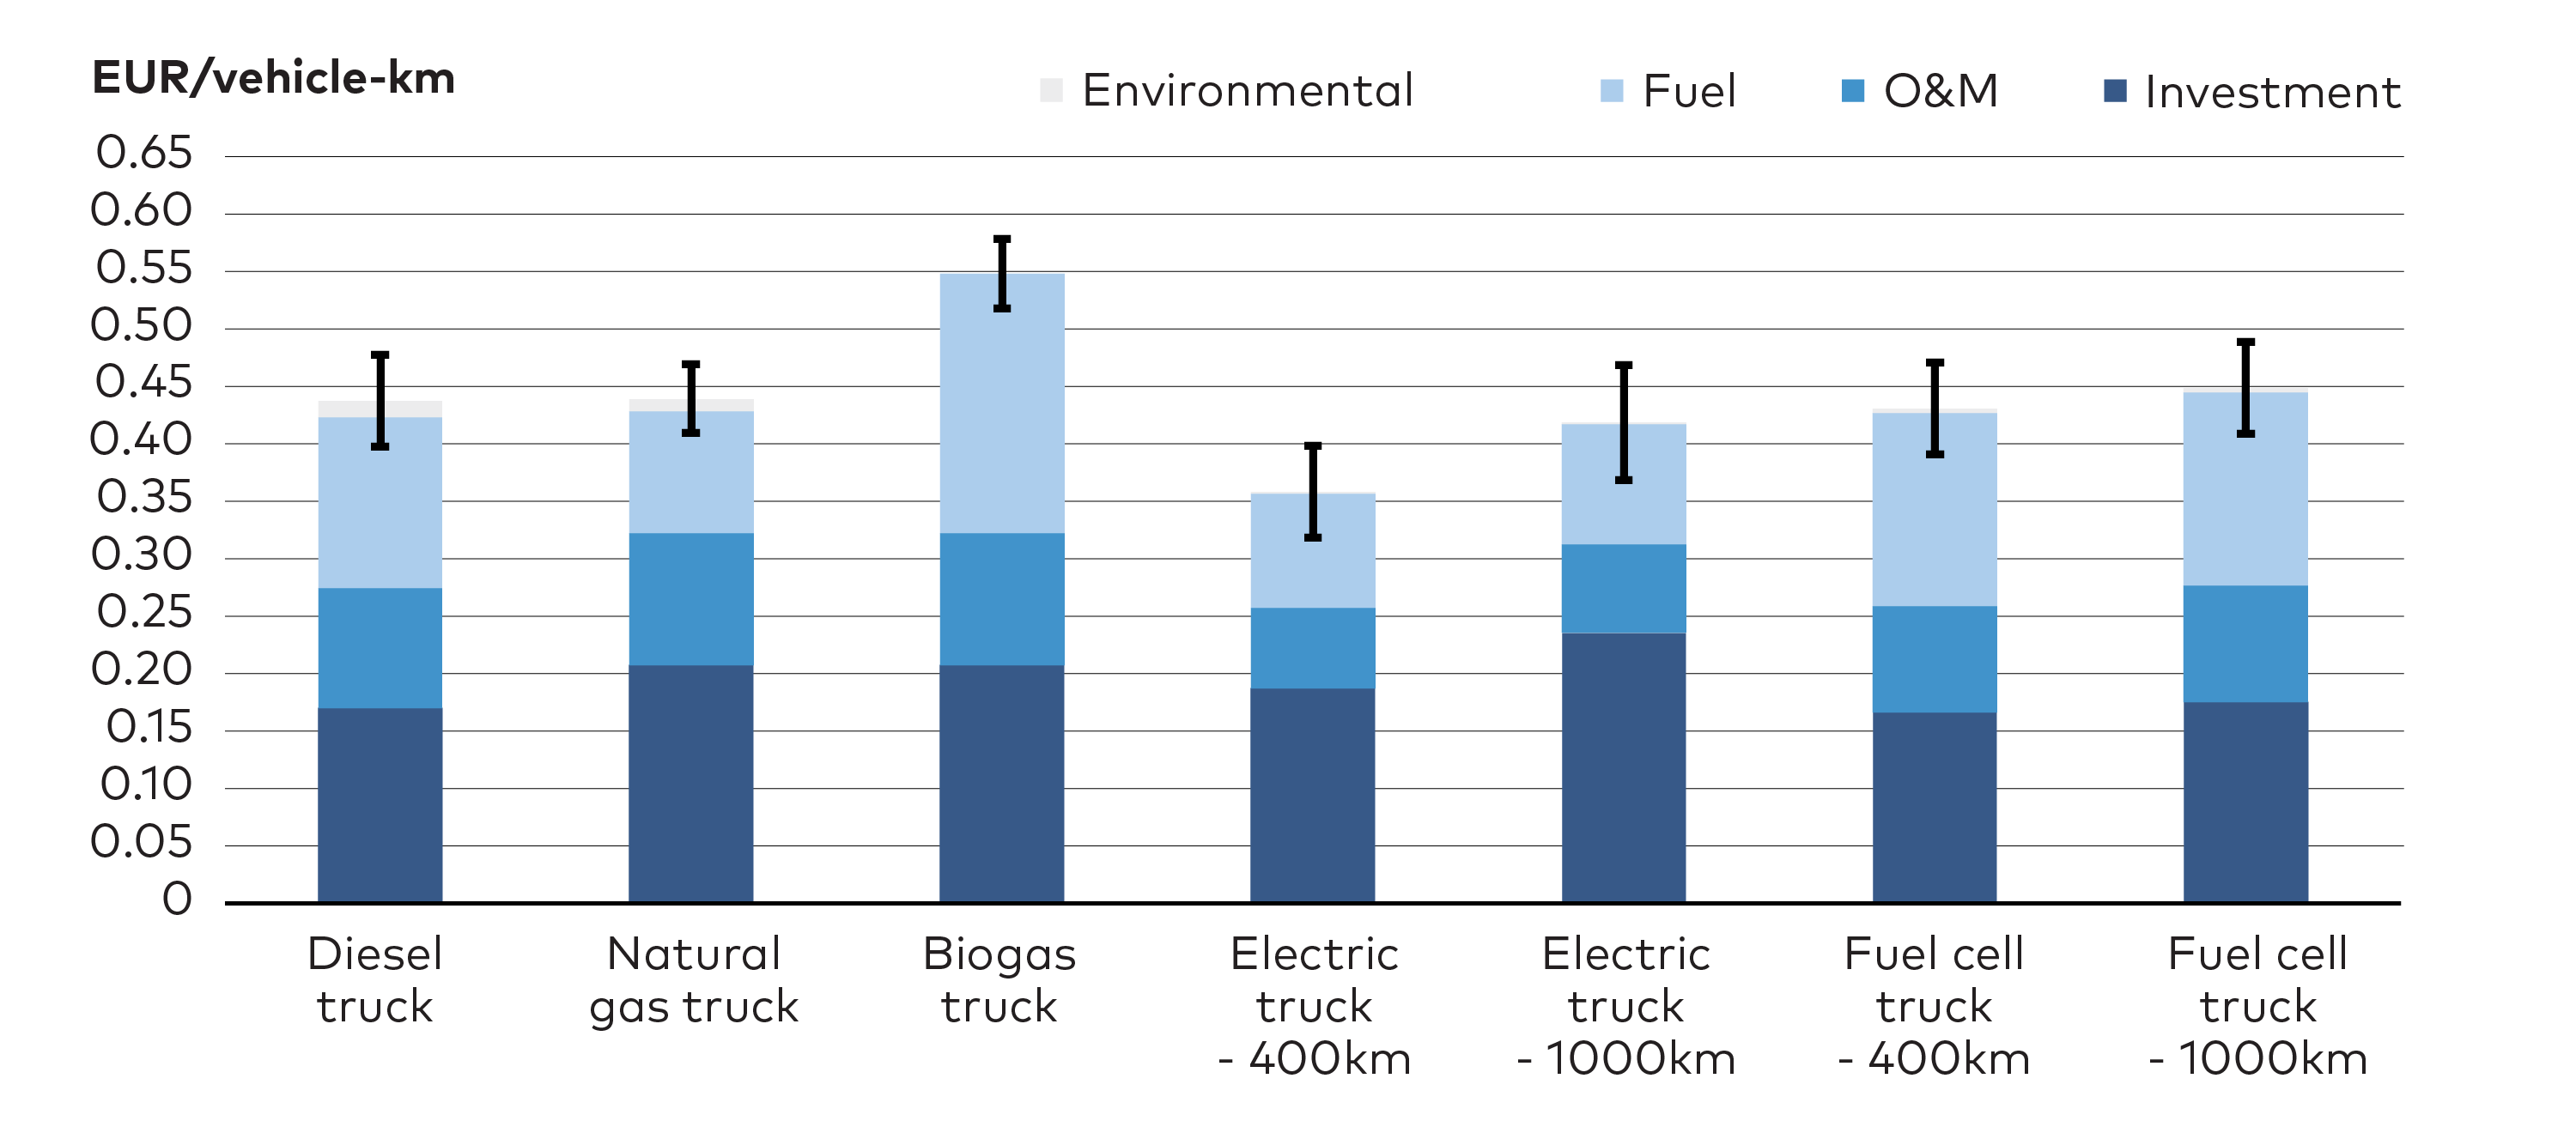
Figure 3.8. Levelized cost of transport for freight transport with trucks. Environmental cost is CO2-Cost, 79 €/t by 2030 increasing to 125 €/t by 2040. Economic lifetime: 10 y. 400-1000km is the range for the BEVs. Source: NCES Technology Catalogue.
As a result, all three scenarios show a dramatic acceleration in levels of BEV ownership in the coming decade (Figure 3.9 and 3.10). Norway has been ahead for some years having used tax incentives and other policy instruments, including advantages for BEV’s in cities, such as free parking, extra driving lanes for example, to boost BEV sales. In 2020, 54% of all new cars sold in Norway were BEVs and 20% were hybrids. In recent years Iceland and Sweden have started to catch up with BEVs constituting 36 and 31% of all new sales respectively.
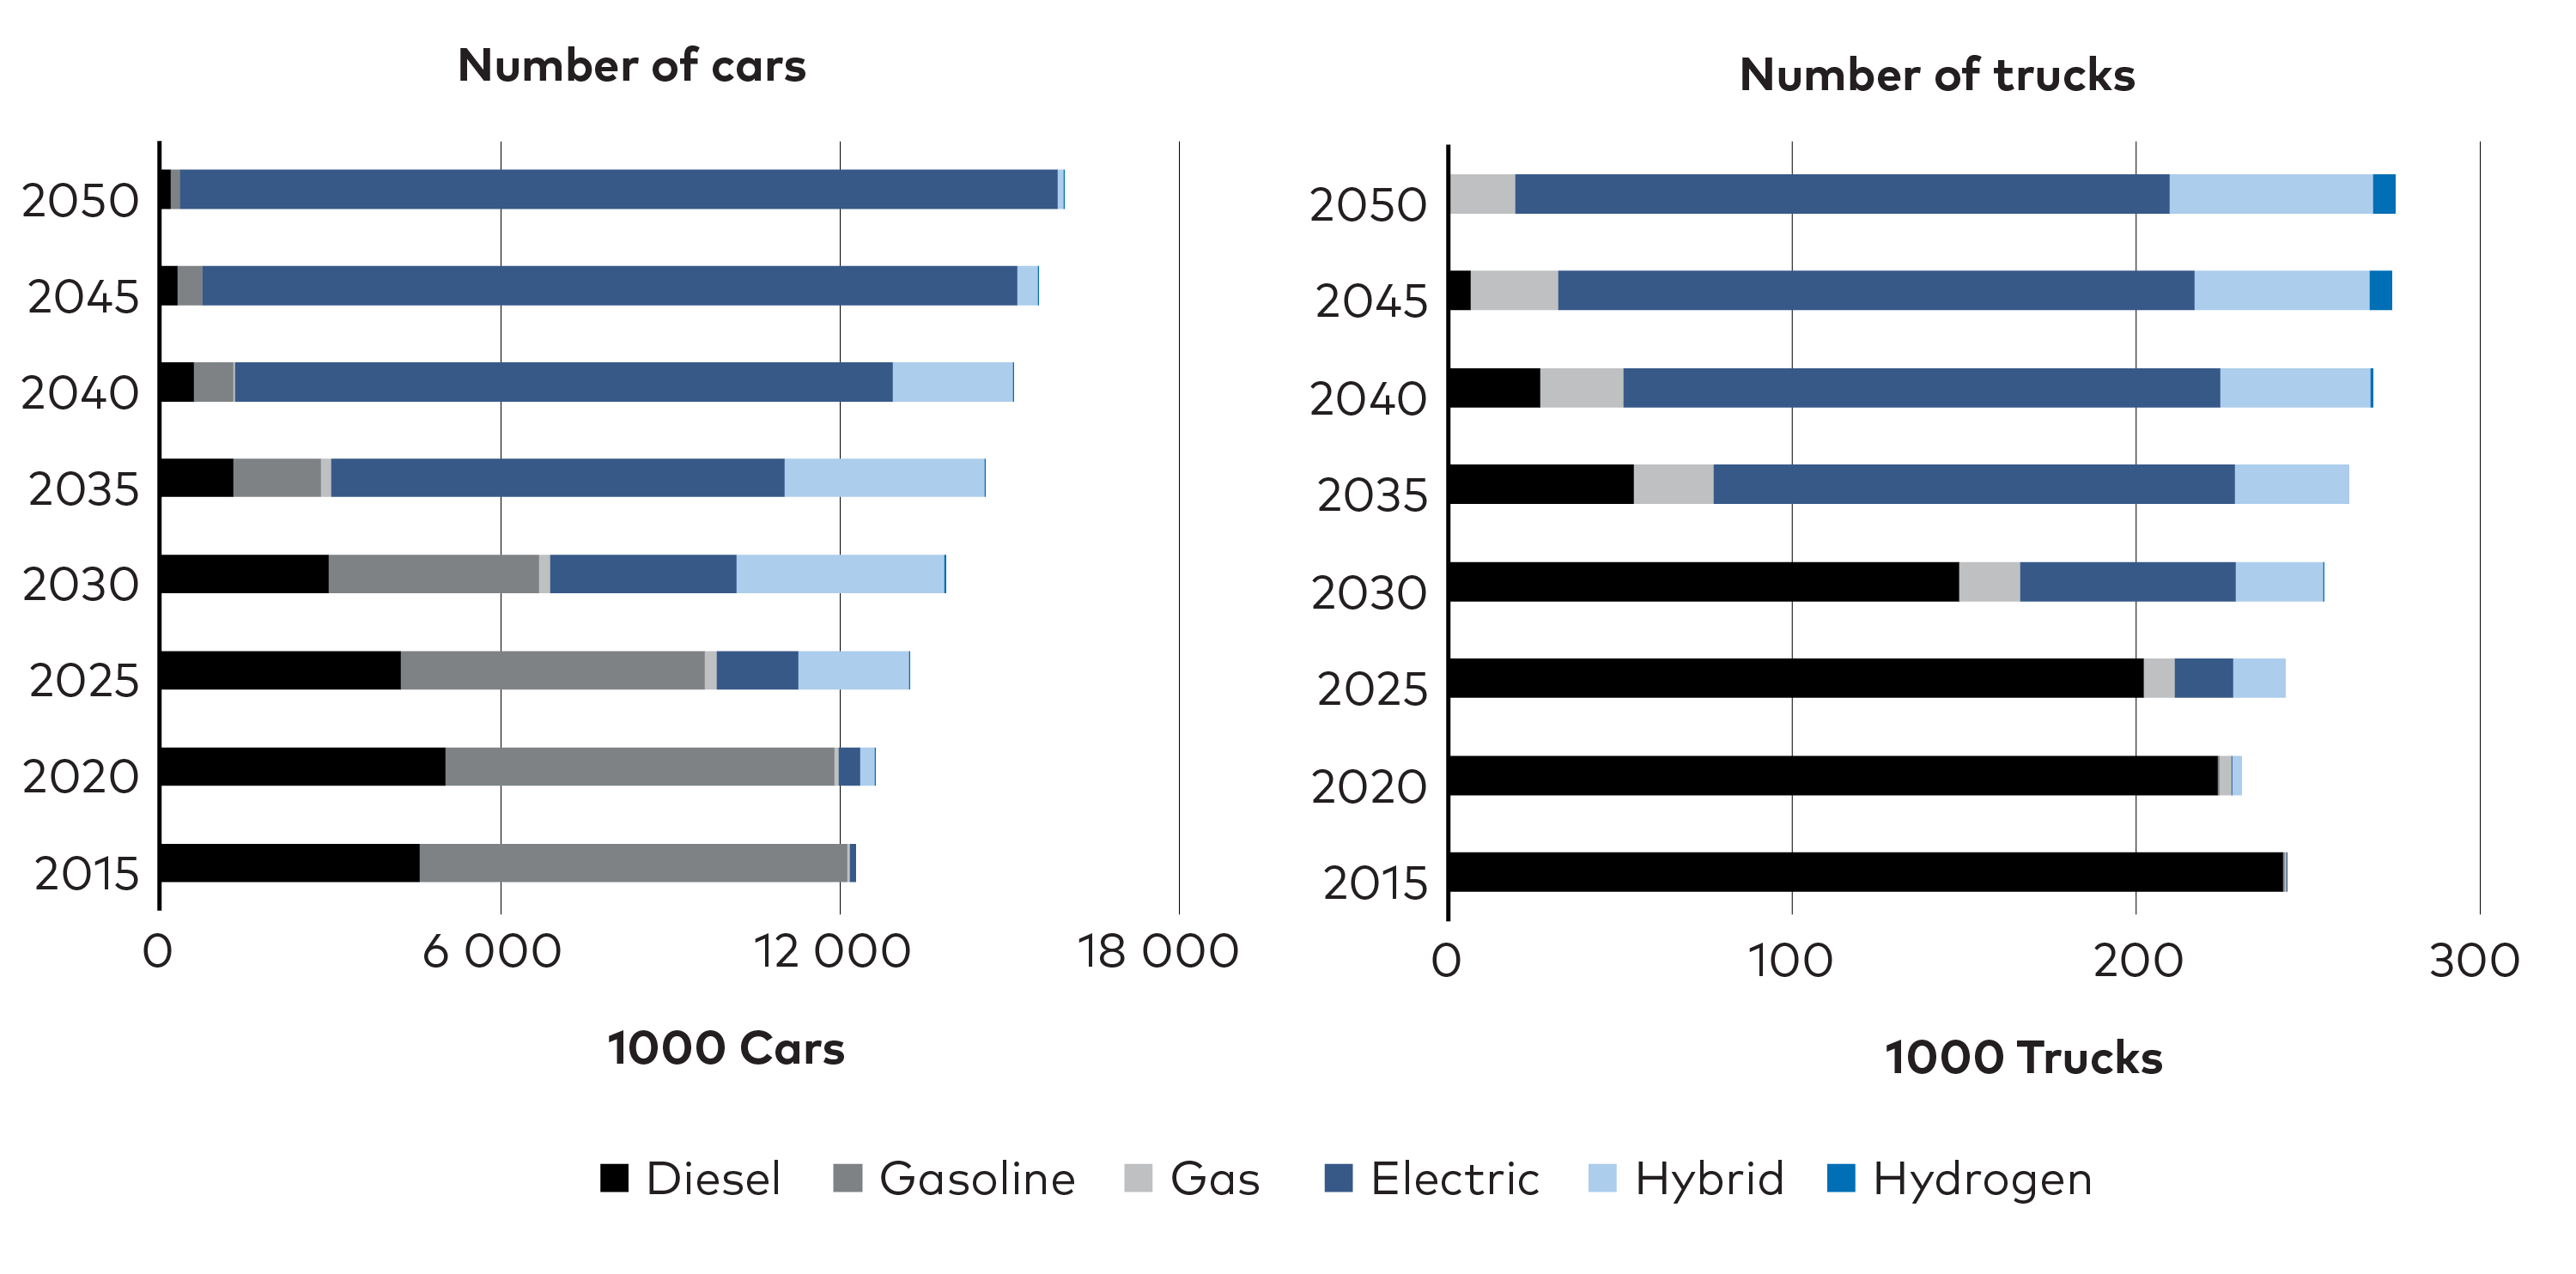
Figure 3.9. Development in the stock of cars and trucks (incl. vans) in the CNN and NPH scenario.
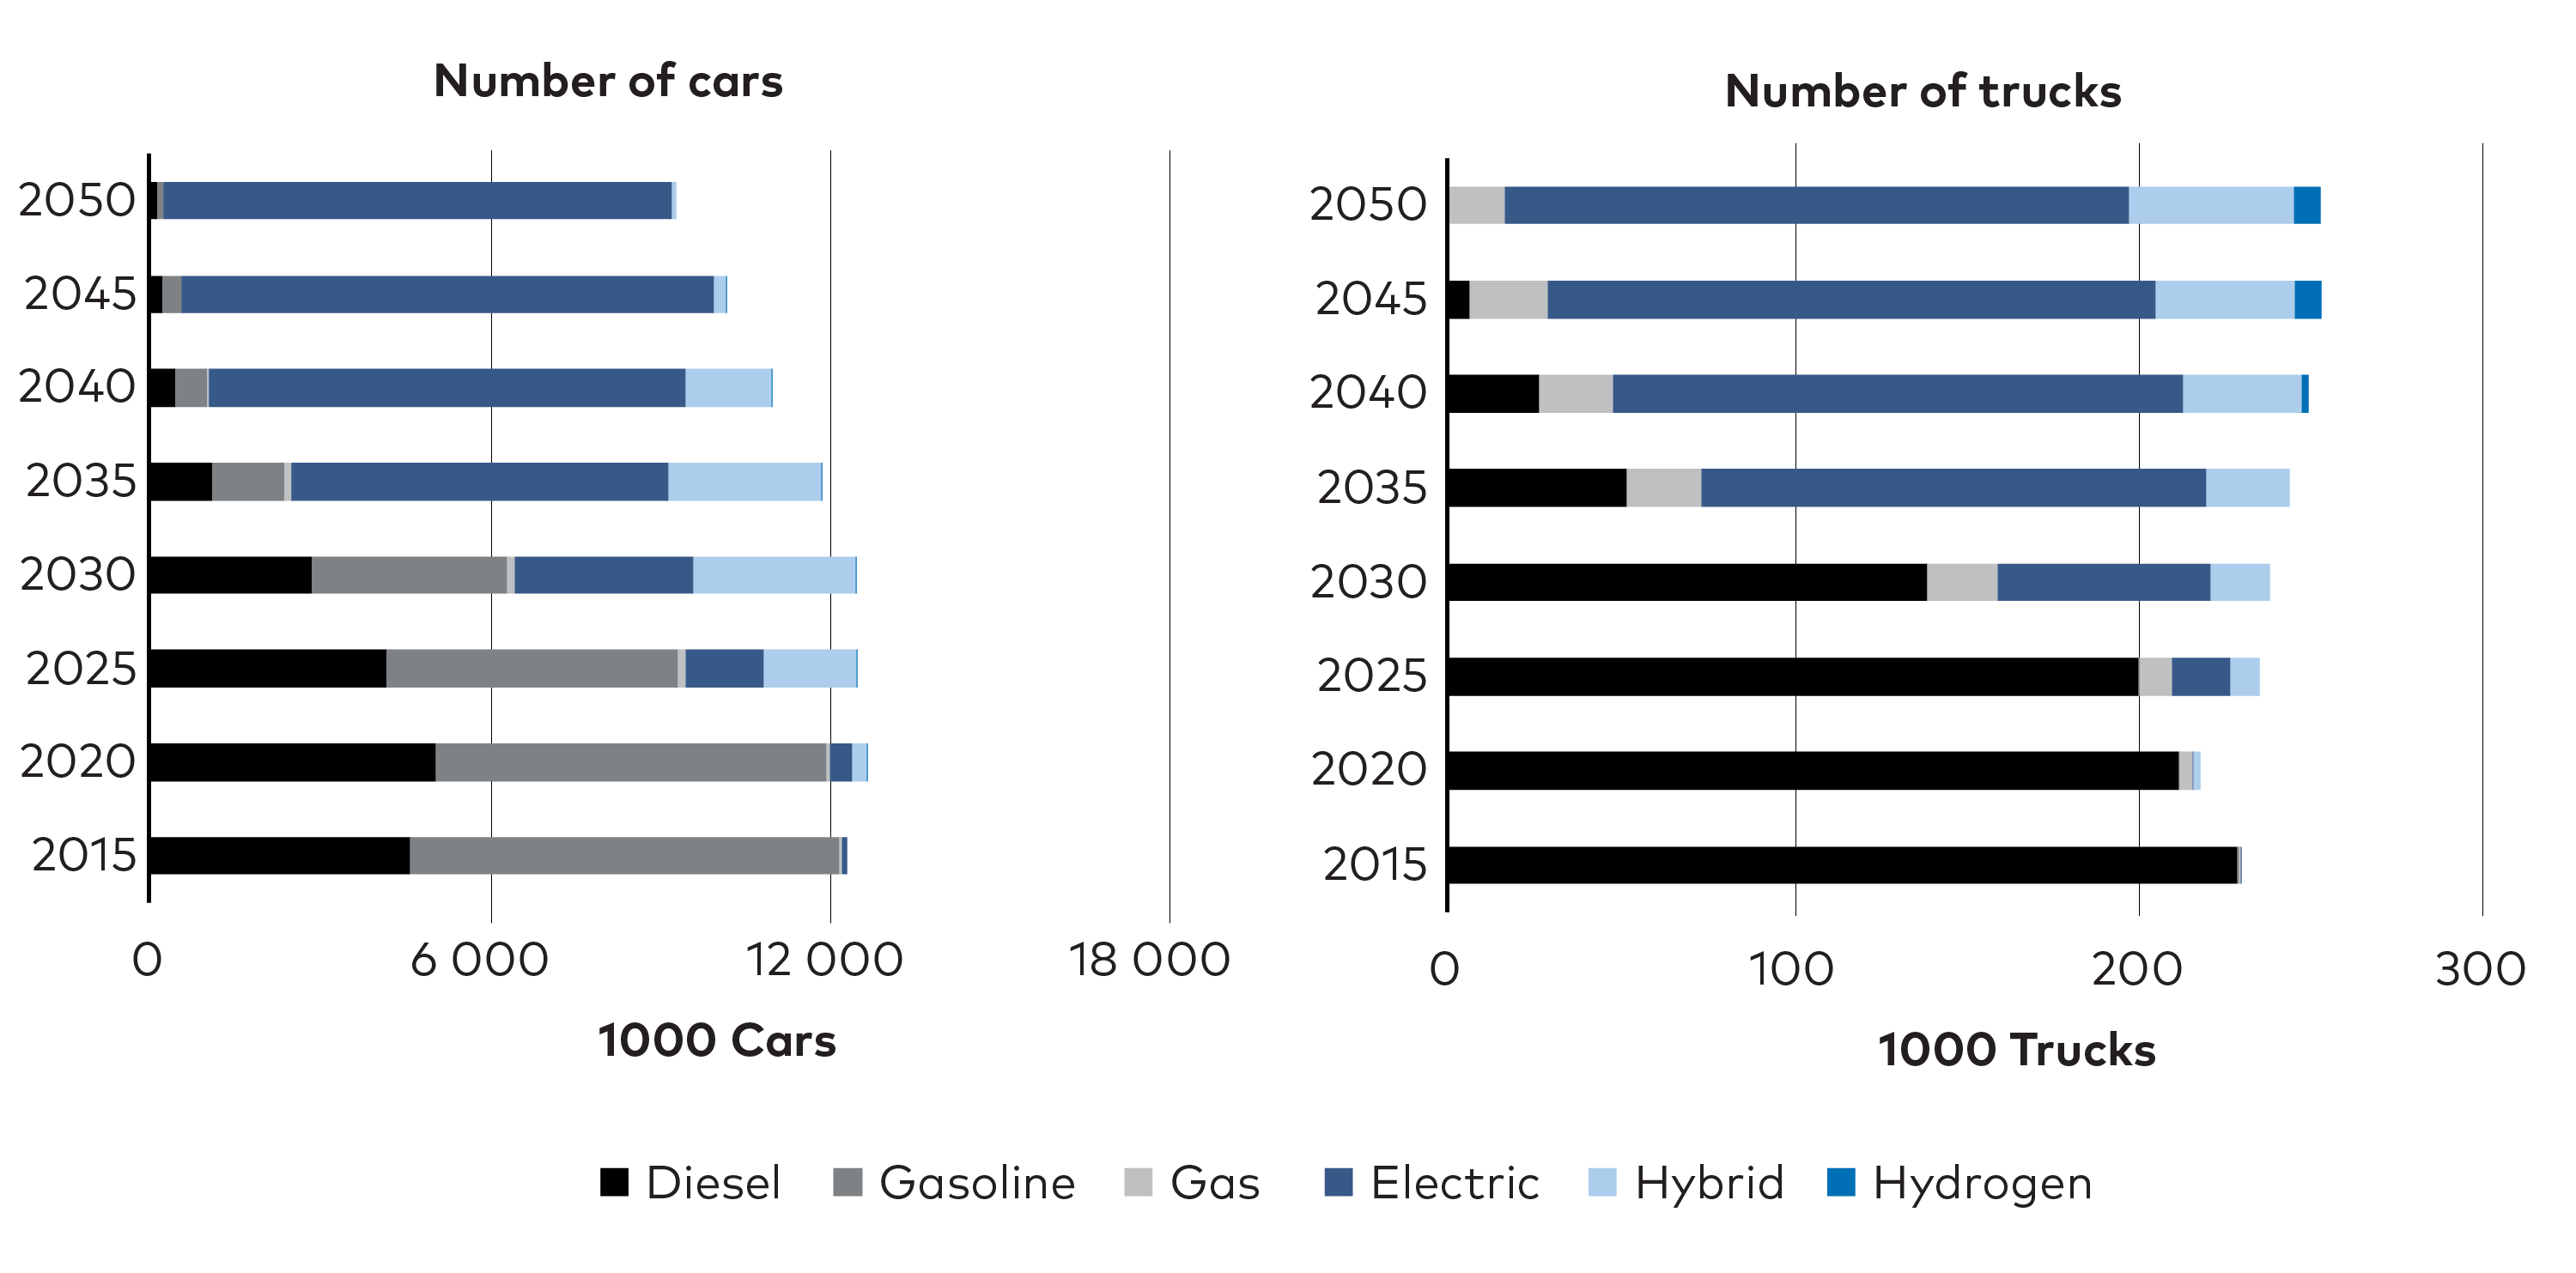
Figure 3.10. Development in the stock of cars and trucks (incl. vans) in the CNB scenario.
Already in 2035, BEVs make up two-thirds of the fleet both for cars and trucks across the Nordic region. This means BEVs market share will be near 100% in 2030. This transition is found to be feasible even without GHG reduction policies, but several things can slow down the roll-out, with lack of charging infrastructure as main risk.
The transition to electric trucks is initiated later, but market dominance will occur more quickly as the turnover rate for trucks is faster than for cars. However, at present the technological development of electric trucks has higher levels of uncertainty. Fewer BEV trucks are currently on the market, roll-out is dependent on whether truck manufacturers will focus on BEV’s, and even more so than for cars, the plans for instalment of charging infrastructure must be in place. In addition, some long-distance trucks will likely depend on liquid or gaseous fuels with high energy density. The NCES scenarios assume that BEV trucks can cover a maximum of 90% of long-distance road freight demand.
3.3.3 Electrification of transport creates demand for new infrastructure
Vehicles, of course, are only one part of electrification of transport. As mentioned, their roll-out also depends on availability of appropriate charging infrastructure and electric road applications.
Electric roads, or E-roads, allow vehicles with electric drivetrains to charge while driving. Three charging technologies currently seem most promising: through pantograph connections to overhead lines, via induction from a power source in the road, or conduction via tracks in the road. All three solutions have been tested in Sweden.[1]eRoadArlanda, n.d.; Region Gävleborg, 2020; Smartroad Gotland, n.d. An important aspect of these approaches is the potential to reduce battery size and increase the freight load. E-roads will be particularly beneficial along transport corridors between cargo centres, where smaller trucks can handle distribution. Before E-roads can support long-distances freight, a common approach would need to be agreed to avoid having to equip trucks with multiple systems. While declining battery costs could push the transition in favour of pure BEV of e-roads, the future share of each solution remains highly uncertain. Finally, Nordic collaboration is likely a necessity for e-roads to be successful as a common standard would be a requirement at least for long distance trucks.
Footnotes
- ^ eRoadArlanda, n.d.; Region Gävleborg, 2020; Smartroad Gotland, n.d.
By 2030, the Nordics will likely need 5-7 million home chargers and at least 30-60 thousand public fast chargers to support the BEV car fleet, rising to 12-18 million home chargers and 100-150 thousand public fast chargers in 2050. For electric trucks, the charging network also needs to be expanded rapidly, although that also depends on the development of e-roads that could reduce the need for charging stations.
As the number of fast chargers increases, it will become more important to charge intelligently and in balance with grid capacity. This is especially true for truck and bus chargers, which may have to be combined with electricity storage facilities operating to shave demand peaks. Charging facilities in city centres, where most people cannot have their own dedicated charger, will be a particular challenge. Flexible solutions must be developed to ensure that cars are charged and ready when needed by the user.
3.4 Sector coupling by district heating creates additional value
Electrification of district heating production can happen by introducing large scale heat pumps utilising different heat sources. Today district heating systems deliver 35% of residential heating in the Nordics, on average, divided between countries: Norway 2%, Denmark 40%, Iceland 75%, Finland 40%, and Sweden 48%. District heating and cooling (DHC) systems also supply heating in commercial and service sectors and deliver low temperature process heat to industry.
In the scenarios a big change happens between 2020 and 2025 where mainly biomass boilers and combined heat and power plants (CHP) is replaced by heat pumps utilising ambient heat, seawater, industrial waste heat, and surplus heat from data centres. The share of heat pumps increases throughout the period mainly driven by waste heat from PtX plants and bio-refineries. The decline in production is caused by the model implementing heat savings in buildings.
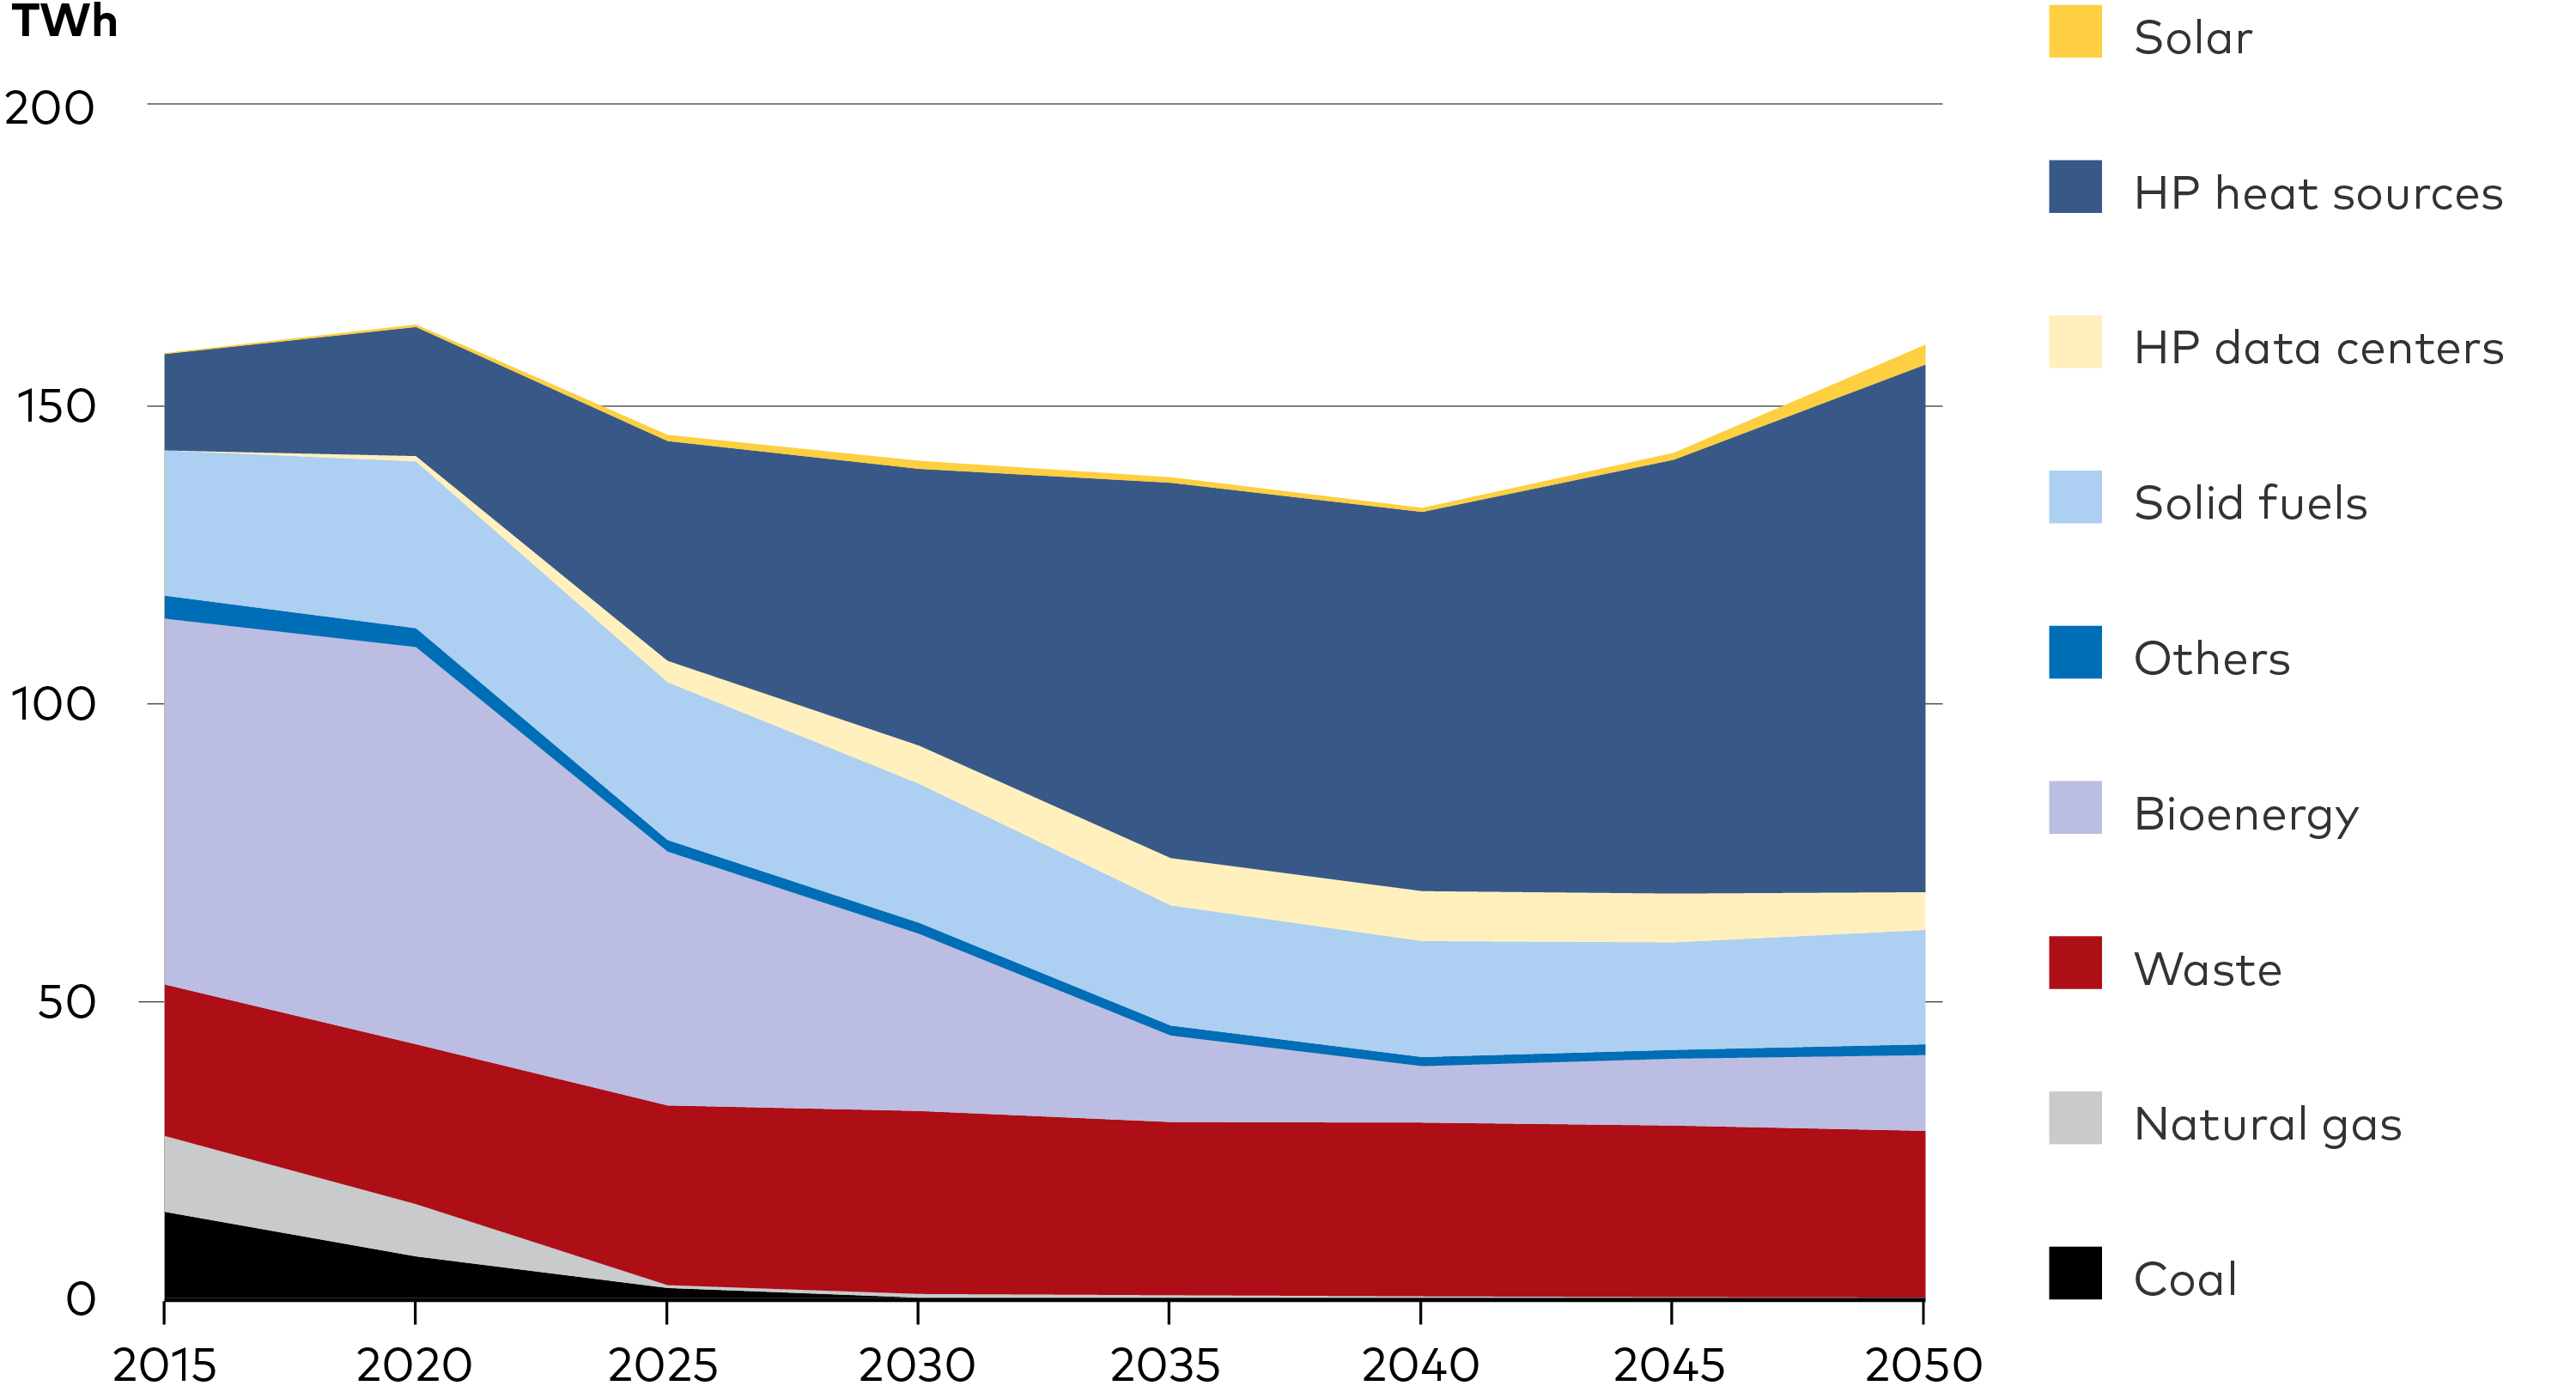
Figure 3.11. Development of district heat production - CNN scenario. District heat production in the Nordic countries in CNN scenario divided on energy type.
DHC becomes increasingly important in the NCES. In fact, such a system could boost the feasibility of new RE-refineries by creating a use – and thus a value – for the heat they produce. Such synergies would also reduce reliance on biomass, freeing up currently used resources for other parts of the economy where they have higher value.
3.5 Heavy industry, an untapped potential
In the NCES scenarios electrification of heavy industry is not seen to take off to the same extent as seen in transportation. In heavy industries, iron and steel, aluminium, pulp and paper, and cement and mining, the biggest challenge for decarbonisation is in iron and steel, and cement. This is partly because certain industrial processes demand higher energy flow rates and higher temperatures where electrification of the processes are not applicable. However, as already mentioned for some industries the least-cost option in the model is to keep using fossil fuels by incorporating CCS. The potential for electrification is therefore larger than what is seen in the NCES results and especially expansion of existing industry could lead to extra electricity demand.
In the following the options for those processes where electrification might not be possible, or emissions cannot be removed completely from the production process are briefly described and what these options could mean to electricity demand if realised.
In the cement production process, no matter what fuels used, CO2 is emitted from the calcination process when creating clinker in the rotary kilns. However, the fossil fuels used for process heat can all be replaced by renewable alternatives but the emission from clinker production remains. To become CO2-neutral the cement industry therefore needs CCS. The CemZero process, which is developed by Cementa and Vattenfall in Sweden, aim to heat the clinker process with RE.[1]Cementa & Vattenfall, 2018.Ensuring a clean electricity input to this process, the emissions from the clinker production will be a pure CO2 stream which is less expensive and less energy demanding to capture. If CemZero is implemented at the biggest cement production facility in Sweden, Slite Gotland, the estimated increase in electricity demand is 2 TWh per year and the power capacity needs to increase by 260 MW by year 2030.
Footnotes
- ^ Cementa & Vattenfall, 2018.
There are several alternative emission reduction processes for iron and steel industry which could remove the vast part of the emissions from this industrial activity. The HYBRIT process which is developed in Sweden aims to produce fossil free steel using hydrogen, produced with electricity from RE sources, as reducing agent instead of coke.[1]Åhman et. al., 2018.The iron and steel industry currently consist of three blast furnaces in Sweden and two in Finland. The process has potential to cut Swedish CO2 by 10% and Finland’s by 7% and would increase the Nordic electricity demand with an additional 20-30 TWh a year. On top of this, new plans for the industry in Sweden can increase electricity demand even more. LKAB has announced plans of scaling up production calling for another 20-30 TWh per year and finally H2 Green Steel has announced to start production using HYBRIT technology increasing electricity demand another 30 TWh.[2]Jernkontoret, 2021 If all these new plans will be realised it could increase the Nordic demand for electricity up to 70-90 TWh per year probably from 2030-40.
3.6 Target areas for direct electrification
To capture the many advantages of direct electrification in strategies to reach carbon neutrality, governments must take targeted action to remove existing barriers; in the absence of such policy action, industry will face more intense pressure.
- Roll out vehicle charging infrastructure and continue incentivising EVs, shifting focus from personal EVs towards heavier vehicles as prices decrease.
- Replace direct electric heating with heat pumps, both in district heating systems and locally.
- Ensure that regulation supports use of waste heat from industry, data centres, and other sources.
- Plan new RE-refineries to be placed in proximity to strong power grids and large district heating networks.
- Support manufacturing industry in implementing new options for electrification and renewable hydrogen.
- Test and demonstrate new solutions for electrification of heavy industry.
Near-term actions
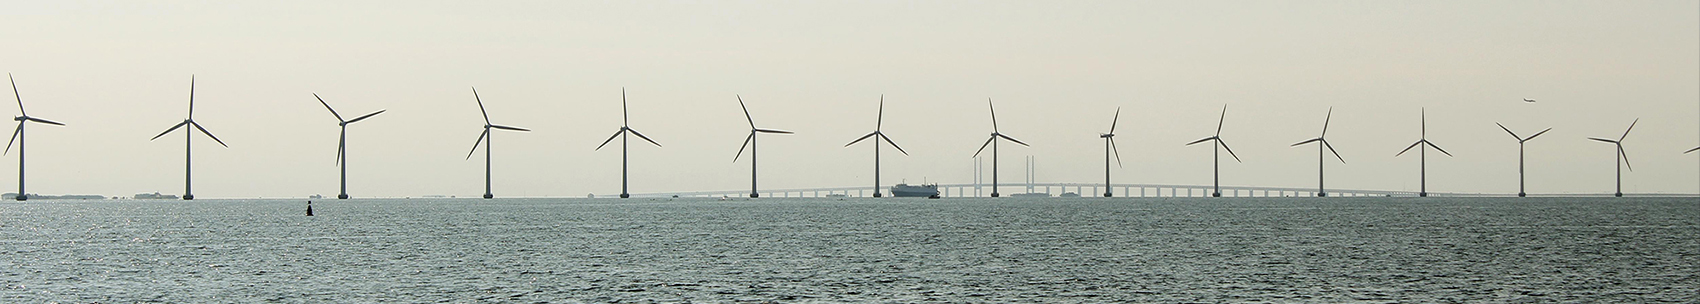 PHOTO: SIGURRDUR ÓLAFSSON/NORDEN.ORG
Chapter 4
Power-to-X: A Potential Game Changer for the Power Sector?
Using power to produce fuels, PtX, could become key to ensuring fossil free energy for applications that cannot be electrified for technical or financial reasons. In these areas, PtX competes with biofuels and to some extent CCS technologies to supply carbon neutral fuels. In the Nordic context, where biomass is not a scarce resource and sites for CO2 storage are abundant, it is still too early to conclude if PtX will take the prominent role that many industrial players and governments foresee. This chapter explains the nature of PtX technology potentials and explores if the Nordic countries could benefit from using its ample RE resources to export PtX fuels to rest of Europe.
Key messages
-
Despite increasing attention in the Nordic countries for PtX, among industrial players and governments, the central CNN scenario foresees only a modest demand for PtX fuel production in the Nordics. Demand comes mainly from sectors not suited for direct electrification, where sharp competition with biofuels and CCS tempers its potential.
-
The NPH scenario explores a stronger role for PtX, including provision of fossil free energy for the steel industries in Sweden and Finland, and targeted export to third countries.
-
PtX plants already under consideration by Nordic industry stakeholders would require an electricity demand of around 45 TWh by 2030 and another 40 TWh towards 2050.
-
The Nordic countries enjoy good hydro and wind resources and hold vast lands for locating PV plants, all of which could be used to produce PtX fuels to serve domestic and export demand from continental Europe.
-
The EU hydrogen strategy targets 40 GW electrolysis capacity by 2030 while its long-term climate strategy foresees demand for power increasing by 70-90% towards 2050, to serve PtX demand.
-
Fulfilling Nordic PtX export potential implies tripling Nordic power generation compared with today, primarily through build-out of onshore wind (mainly in northern Norway, Sweden, and Finland), offshore wind (in the waters of Denmark and Sweden), and deployment of solar power plants (across the region).
4.1 Opportunities for PtX
The potential for PtX development in the Nordic Countries should be seen in the context of the already existing trend of growing electrification which also appears as the predominant solution in NCES. Direct electrification is a much more efficient route than indirect electrification, typically by a factor of four, and as already seen electrification will most likely be the most efficient solution track for passenger cars and short-, medium-, and some long-distance transport by lorries. Similarly, heat pumps appear as an efficient and economical solution for low-temperature heating in buildings and industries.
Yet, there remain energy services where direct electrification is very challenging or technically infeasible – at least with our current knowledge and understanding:
-
Medium- and long-distance aviation
-
Medium- and long-distance navigation
-
Long-distance transport by trucks depending on battery development
-
Certain industrial processes involving direct fuel combustion or very high temperatures
-
Fuel for peak load plants in power and district heating systems
By 2050, the total fuel demand for these services is estimated to almost 400 PJ in the Nordic countries, an estimate which is of course associated with a great deal of uncertainty related to the underlying demand growth, consumer behaviour, and not least, to what degree direct electrification will take place as projected. For comparison, Nordic oil and gas consumption totals about 1 860 PJ today.
In addition to the energy services above, renewable fuels may be required for non-energy services such as production of fertilisers, plastics, and chemicals, which are not covered by modelling.
DIFFERENT TYPES OF PtX FUELS
PtX means generating fuels (X) from electricity (power). The key technology, electrolysers, produce hydrogen, which can be compressed and used directly, for example in industrial processes, or converted from hydrogen to fuels that are easier to transport and store such as ammonia by combining hydrogen with nitrogen from the air.
Hydrogen could also be converted into methane, methanol, e-diesel, or e-kerosene by combining with CO2. If the CO2 comes from biomass or is captured from the air, the fuel may be considered carbon neutral according to UNFCCC accounting principles or attributed with a low level of CO2 emissions depending on the type of biomass and considered time horizon.
Today, most hydrogen is produced from fossil fuels, typically through steam methane reformation processes. Adding CCS to the process eliminates most of the CO2 emissions, producing so-called ‘blue’ hydrogen.
While the emphasis in this analysis is placed on green hydrogen, hydrogen produced from RE, a role for blue hydrogen is not ruled out as a transitional solution. A role for blue hydrogen is particularly interesting for Norway as a use of natural gas resources. According to simplified calculations, replacing 1 TWh of green hydrogen with blue could potentially mean avoiding investment for 340 MW offshore wind capacity.
As discussed in chapter 2, PtX will compete with biofuels and CCS solutions for these non-energy services market, including the production of blue hydrogen, where carbon emissions are captured and stored. To what extent PtX fuels will be the preferred solution, is likely to be contingent not only on economics, but also on public perception of CCS and a broader range of sustainability parameters related to increased use of biofuels such as the effects on biodiversity, food security and its inherent carbon footprint. Table 4.1 provides an overview of these contingencies.
Table 4.1. Pros and cons of PtX, biofuels, and CCS technologies. As shown, PtX will compete with biofuels and CCS solutions to provide energy for applications where direct electrification is not an option. Evidently, the pros and cons of the three different routes go beyond economics.
| PtX | Biofuel | CCS | |
| Pros | - In principle no resource constraints (offshore wind and solar power as input). | - Appears cheaper than PtX for many applications. | - Appears cheaper than PtX and biofuels. |
| - Big push from governments and industrial players may lead to sharp cost reductions. | - Substantial biomass resource in the Nordic countries. | - Net-negative emissions as provided by biomass CCS, will most likely be needed to comply with future carbon budgets. | |
| - Emerging Nordic industry. | - Established Nordic industry. | - Emerging Nordic industry. | |
| Cons | - Production of most X’s are costly today. | - Biomass is a limited resource on a European and global level and use of land for biomass is in competition with food production and recreational purposes. | |
| - Limited experience and application. | - CO2 footprint and sustainability of many biofuels – in particular fuels produced from food crops – is problematic. | - Limited experience and application. | |
| - Environmental and planning conflicts related to large-scale deployment of wind and solar power. | - Limited experience and application when producing liquid biofuels from solid biomass | - Primarily relevant for large point sources. | |
| - Requires large investments in infrastructure (RE capacity, hydrogen grids and storages). | - Safety and sustainability related to long-term storage of CO2 underground | ||
| - Some X’s – such as E-kerosen for aviation are dependent on a CO2 source. | - BECCS is dependent on a limited energy source. |
4.2 PtX is in close price competition with biofuels and blue hydrogen
Even though many of the technologies in the PtX value chain are not new – alkaline based water electrolysis has a long track record, for example – there is a big potential for reducing the cost of PtX production. The cost of power is an obvious factor, making up around two-thirds of the cost of producing hydrogen, but there is also a considerable potential for improving the efficiency of electrolysers. For example, through the introduction of new technologies such as PEM[1]Polymer electrolyte membrane (PEM) electrolysis and SOEC[2]Solid Oxide Electrolysis Cell (SOEC). electrolysers.
There is also potential for reducing the capital costs of both electrolysers and following process steps. The system analyses undertaken in this project indicate that electrolysers would typically operate 5000-8000 hours annually corresponding to capacity factors of 0.6 to 0.9, but cost advances could reduce these values even further. Lowering the capital cost of electrolysers would allow for a higher degree of flexibility in the power system, because it would allow for less operation time of electrolysers, thus taking full advantage of hours where the power system overloaded with RE generation and power prices are low.
Footnotes
Figure 4.1 shows projected cost of producing different green gaseous fuels by 2030. Three different technology routes for green hydrogen - alkaline, PEM and SOEC electrolysers - are compared with the cost of producing blue hydrogen - from steam methane reforming combined with CCS - and biogas - from digestion from manure and other agricultural waste production. The graph also shows the cost of green ammonia, which due to the additional process steps, involves higher investment and fuel costs compared to hydrogen from electrolysis. However, ammonia has lower costs related to liquefaction and storage and may therefore prove most cost-effective for some applications.
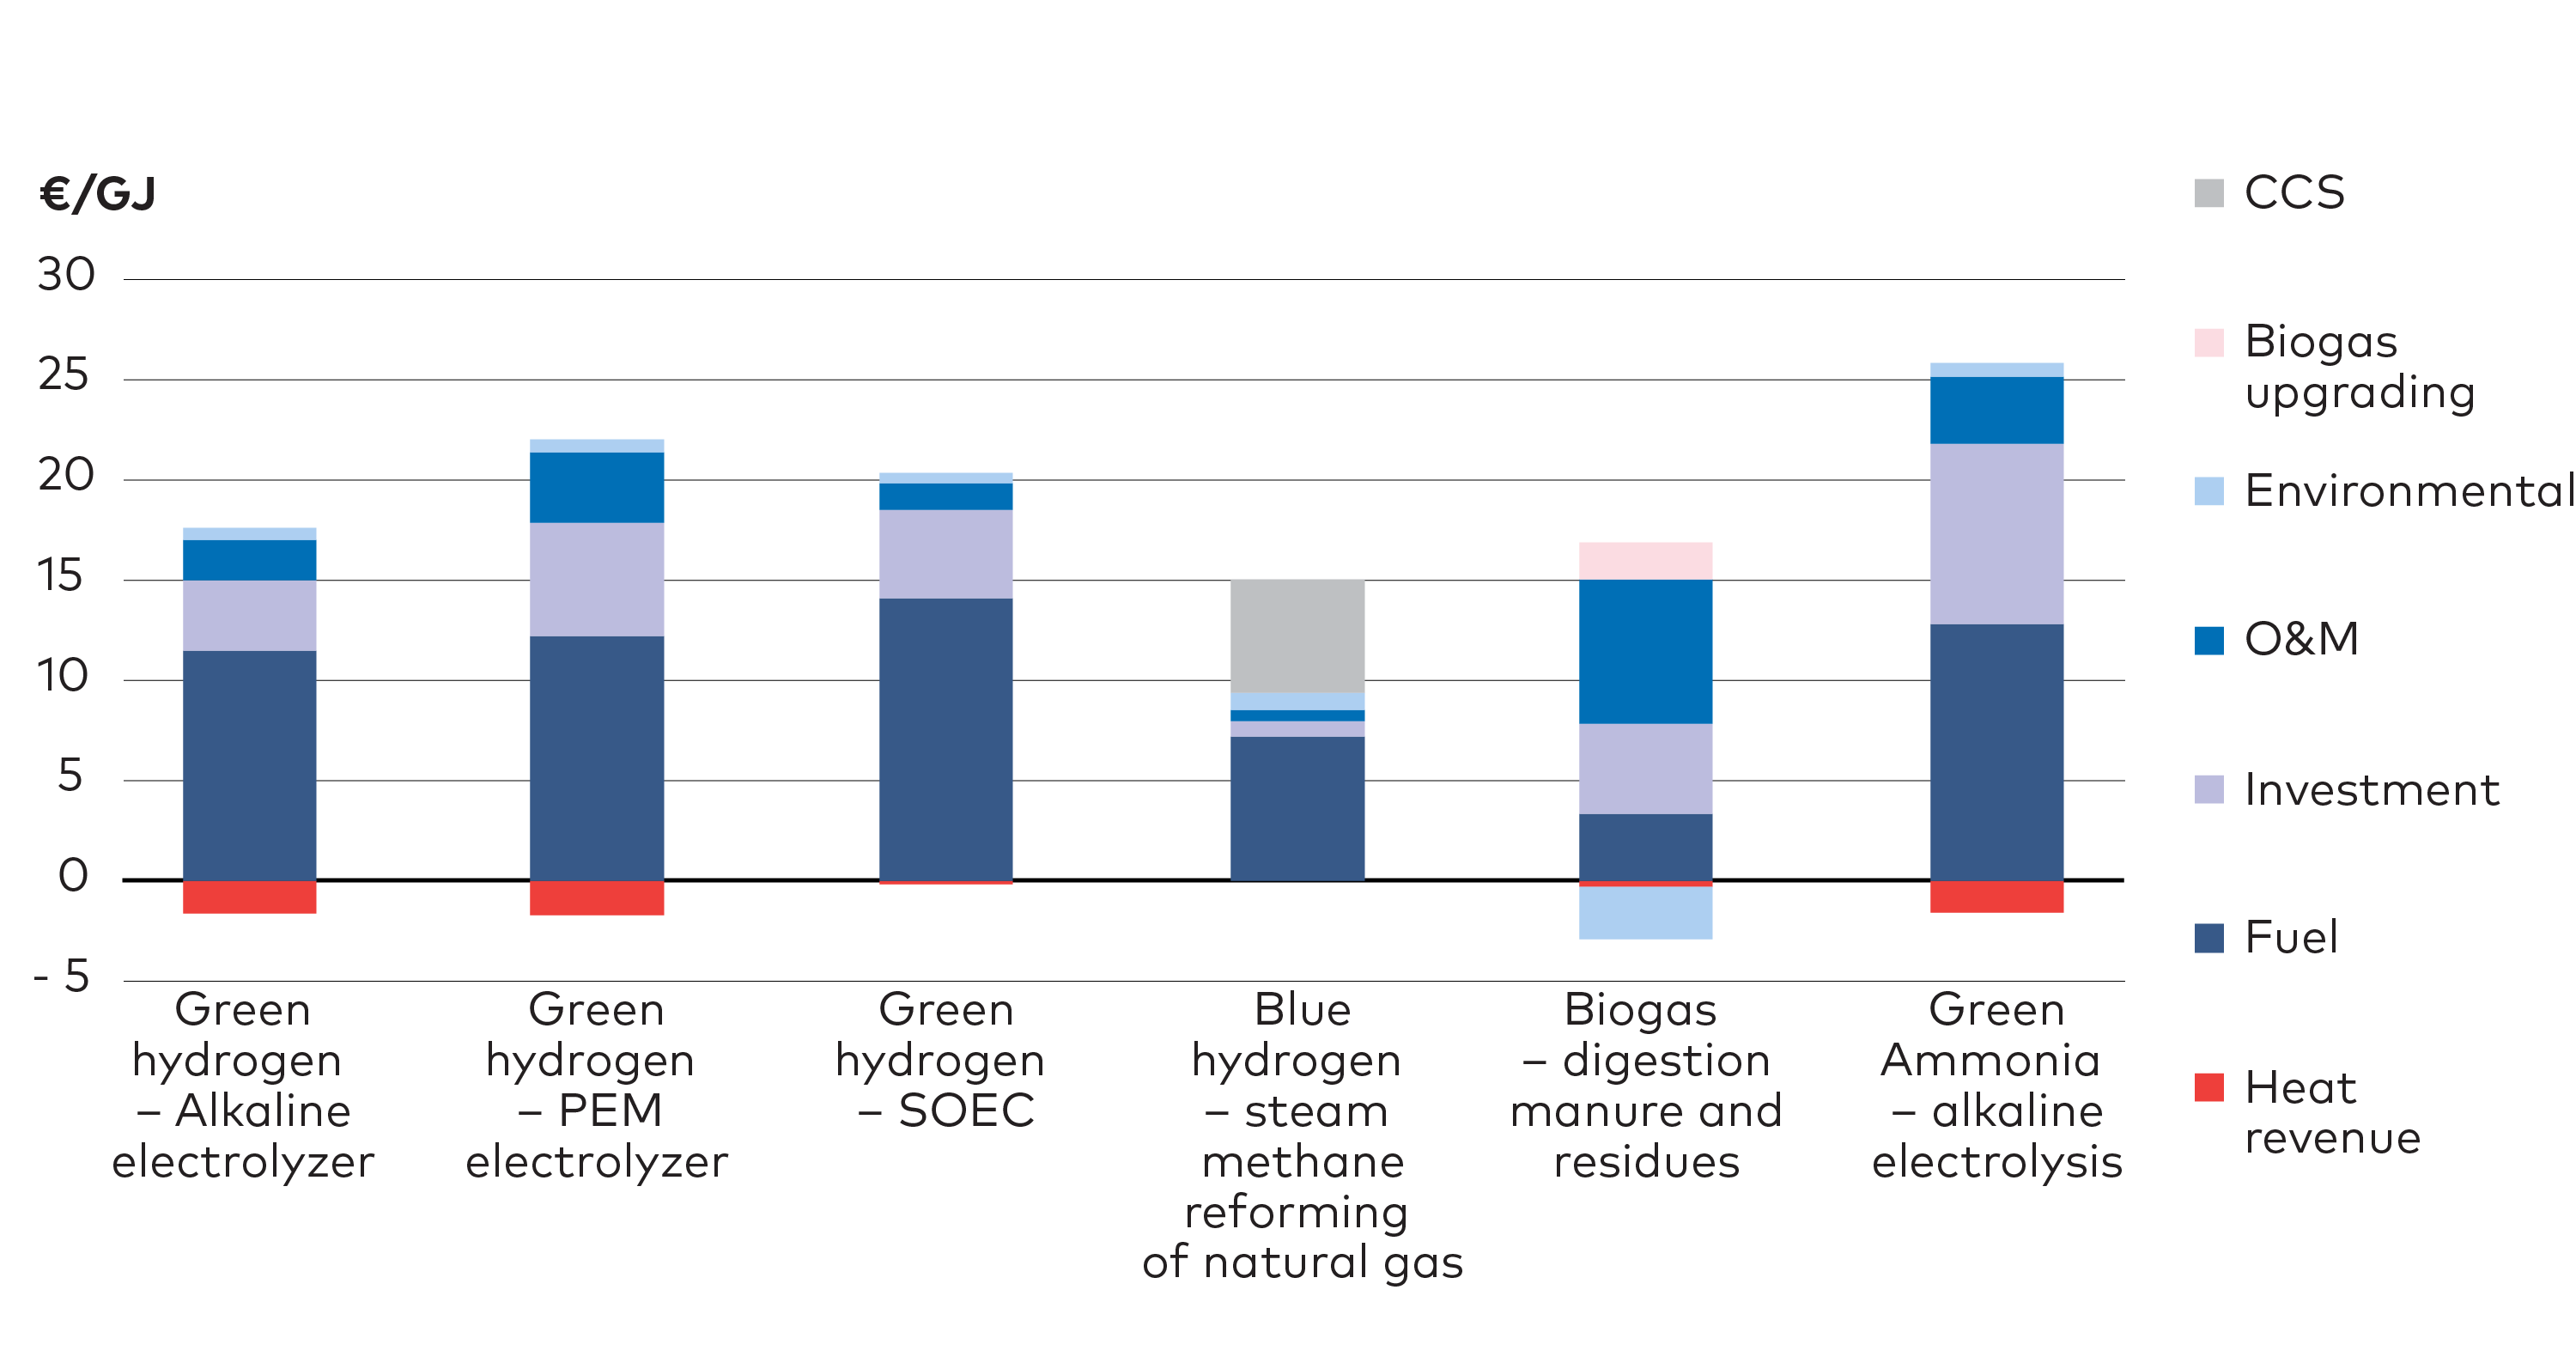
Figure 4.1. Levelized cost of gaseous fuels in 2030. Comparison of projected levelized costs of producing low-carbon gaseous fuels by 2030. Electrolysers are assumed to buy electricity at a cost of 30€/MWh. Environmental costs are shown with a potential negative contribution (benefit), as the GHG emissions associated with biogas production, non-treated manure (N2O, CH4), may be avoided. By this calculation blue hydrogen appears as the cheapest low-carbon gaseous fuel in a close run with green hydrogen from alkaline electrolysers.
In the NCES analysis, the cost of blue hydrogen, which appears as the most cost-effective solution at a price of around 15 €/GJ (1.8 €/kg H2), is dependent not only on the cost of CCS, but also on the market price of natural gas, which is projected to remain moderate at just above 5 €/GJ (19 €/MWh). Green hydrogen from alkaline electrolysers demonstrates almost as low costs as blue hydrogen if potential revenues from selling surplus heat are considered.
The cost of producing liquid fuels from green hydrogen is higher, in the order of 40 €/GJ for methanol and close to 50 €/GJ for e-diesel. For comparison, e-diesel produced from solid biomass through a gasification process such as Fischer-Tropsch is foreseen to cost around 35 €/GJ. Some lower quality bio-oils, made from solid biomass by fast-pyrolysis or catalytic hydro processing, are projected to cost around 20 €/GJ. For reference, the cost of petrol and diesel is around 13 €/GJ today, excluding taxes, externalities, and distribution fees.
It should be recognised that the competitiveness of PtX solutions will also depend heavily on the specific intended use. Pure hydrogen will be much less expensive to produce than for example a conversion to e-kerosene. Therefore, applications such as steel or fertiliser production, where hydrogen can replace fossil fuels directly, is a more obvious source of potential demand for PtX than for example for long-distance aviation, where a diesel-like fuel will probably be needed.
It is important to stress that large-scale deployment of all these technologies remains to be seen, whether it be electrolysis, blue hydrogen, e-diesel, or biofuels from solid biomass, and therefore cost and performance are associated with a substantial level of uncertainty.
4.3 Modest development for PtX
In the CNN scenario, electricity input for PtX processes increases to about 10 TWh by 2030 and about 36 TWh by 2050. The 2050 electricity input for PtX processes corresponds to a 9% increase in overall Nordic demand compared to 2019. In CNN, PtX fuels are almost entirely used in jet-fuels for aviation and a miniscule fraction in industrial processes.
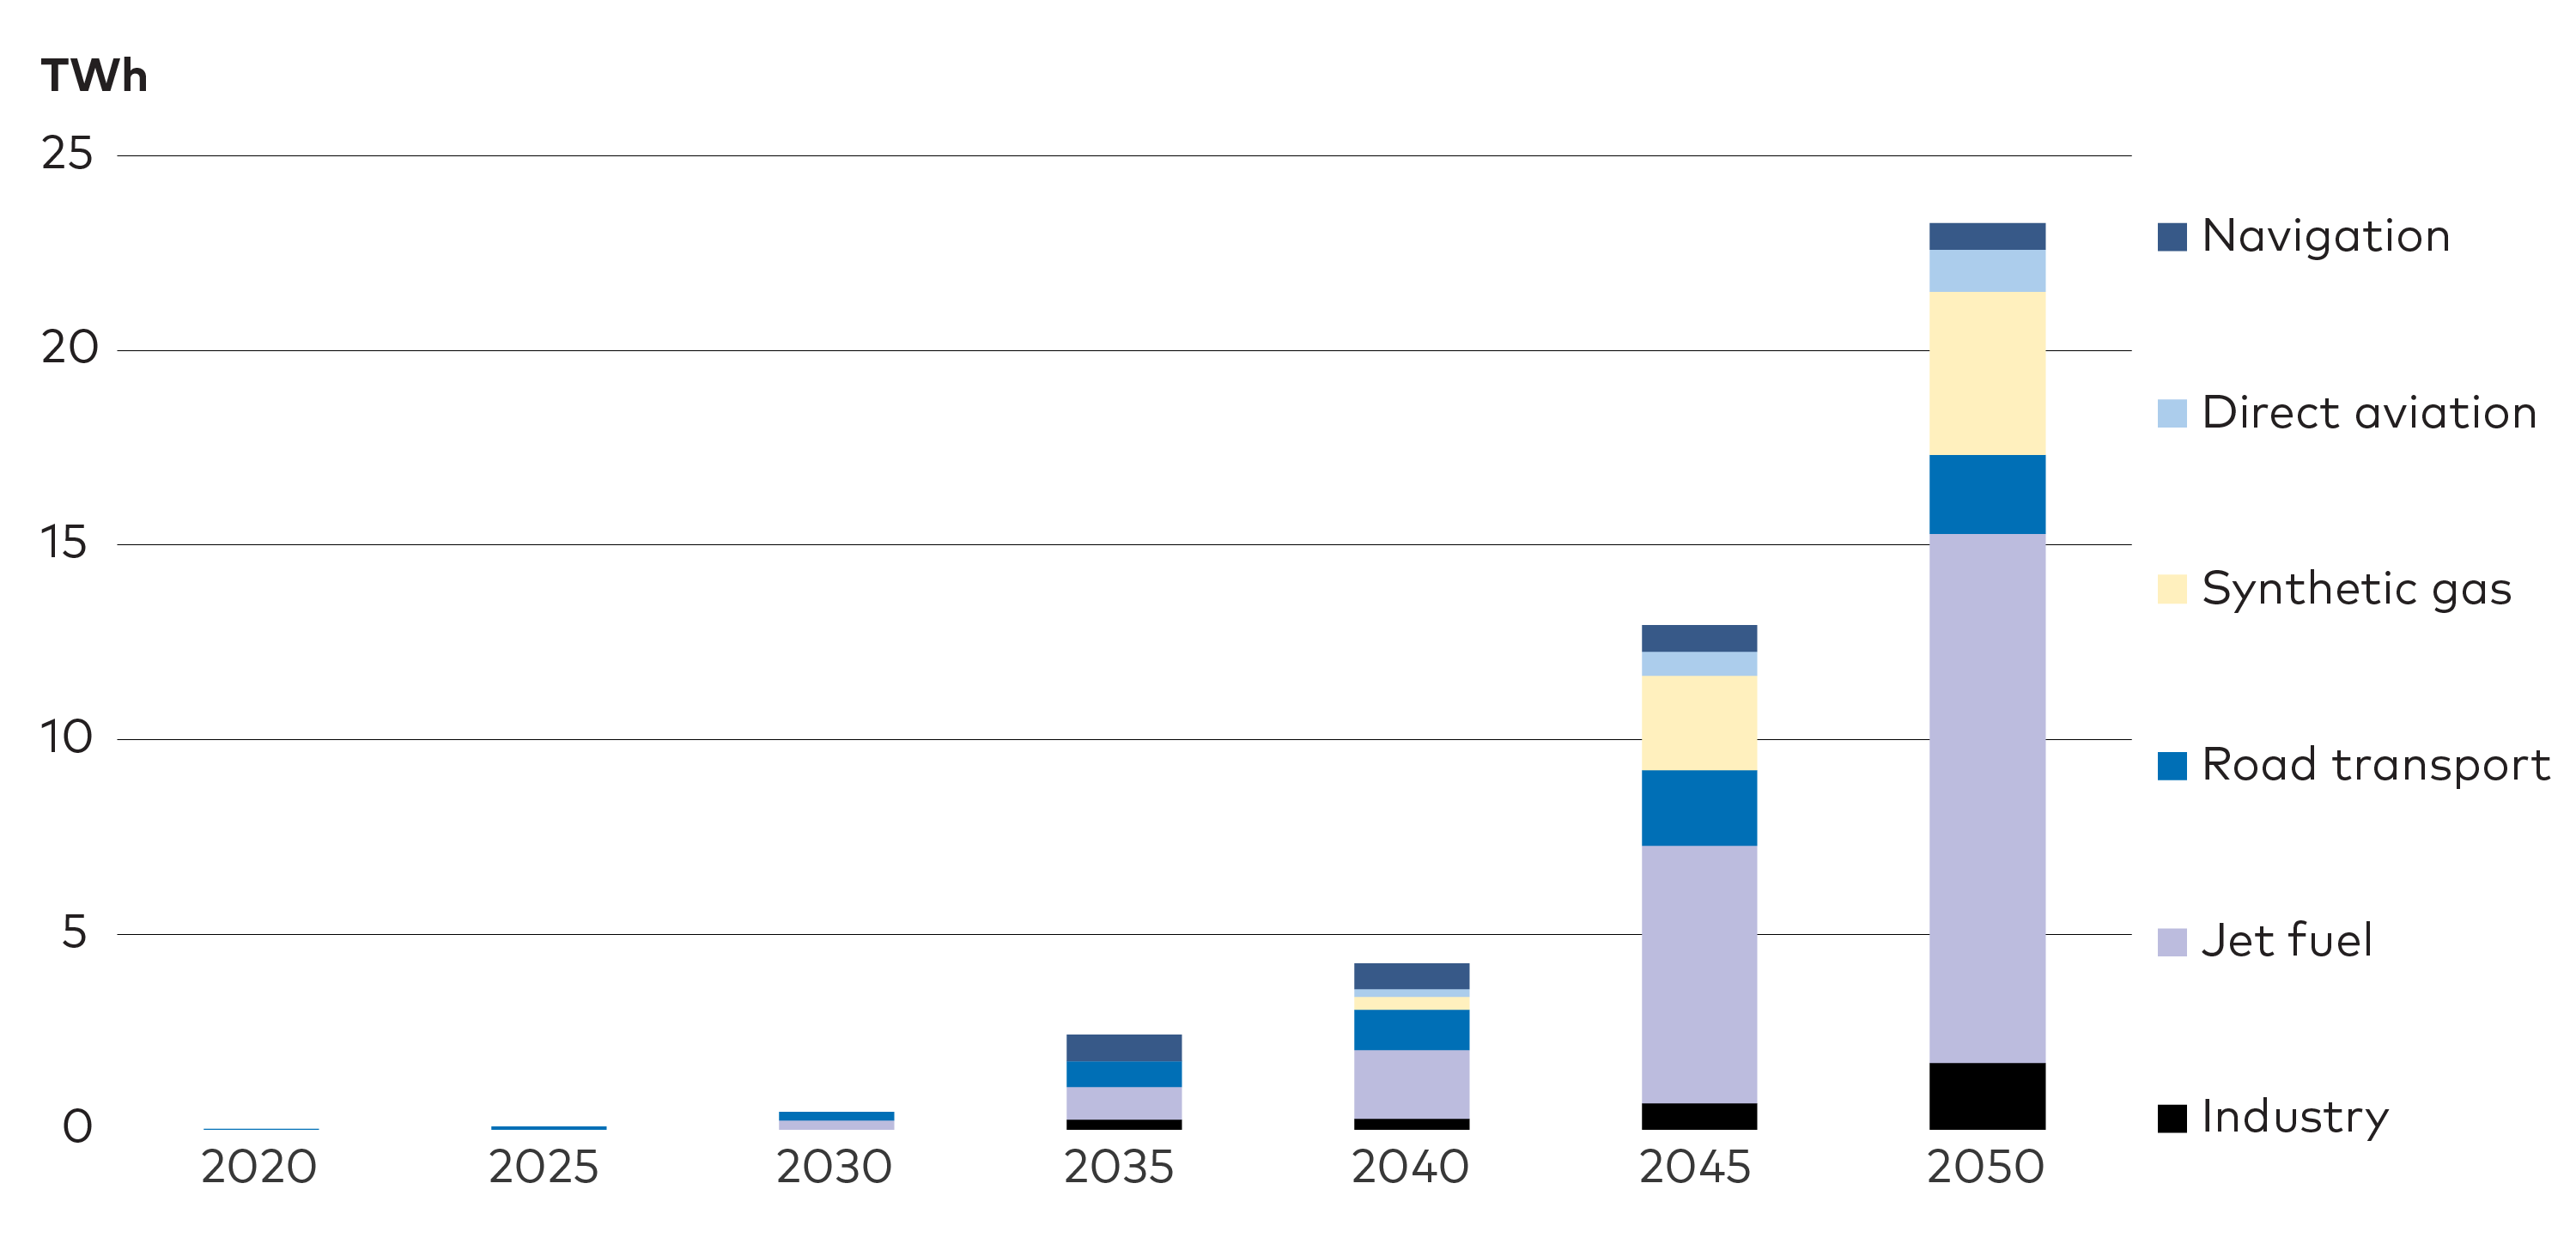
Figure 4.2. Hydrogen consumption by end-use. The majority of hydrogen generated in the CNN scenario is used as input in production of jet-fuels for aviation, whereas the demand in industries is rather limited. About 4 TWh of hydrogen is used for production of synthetic gas (methane), which is used for multiple purposes in the energy sector, including as back-up fuel in power and heat sectors.
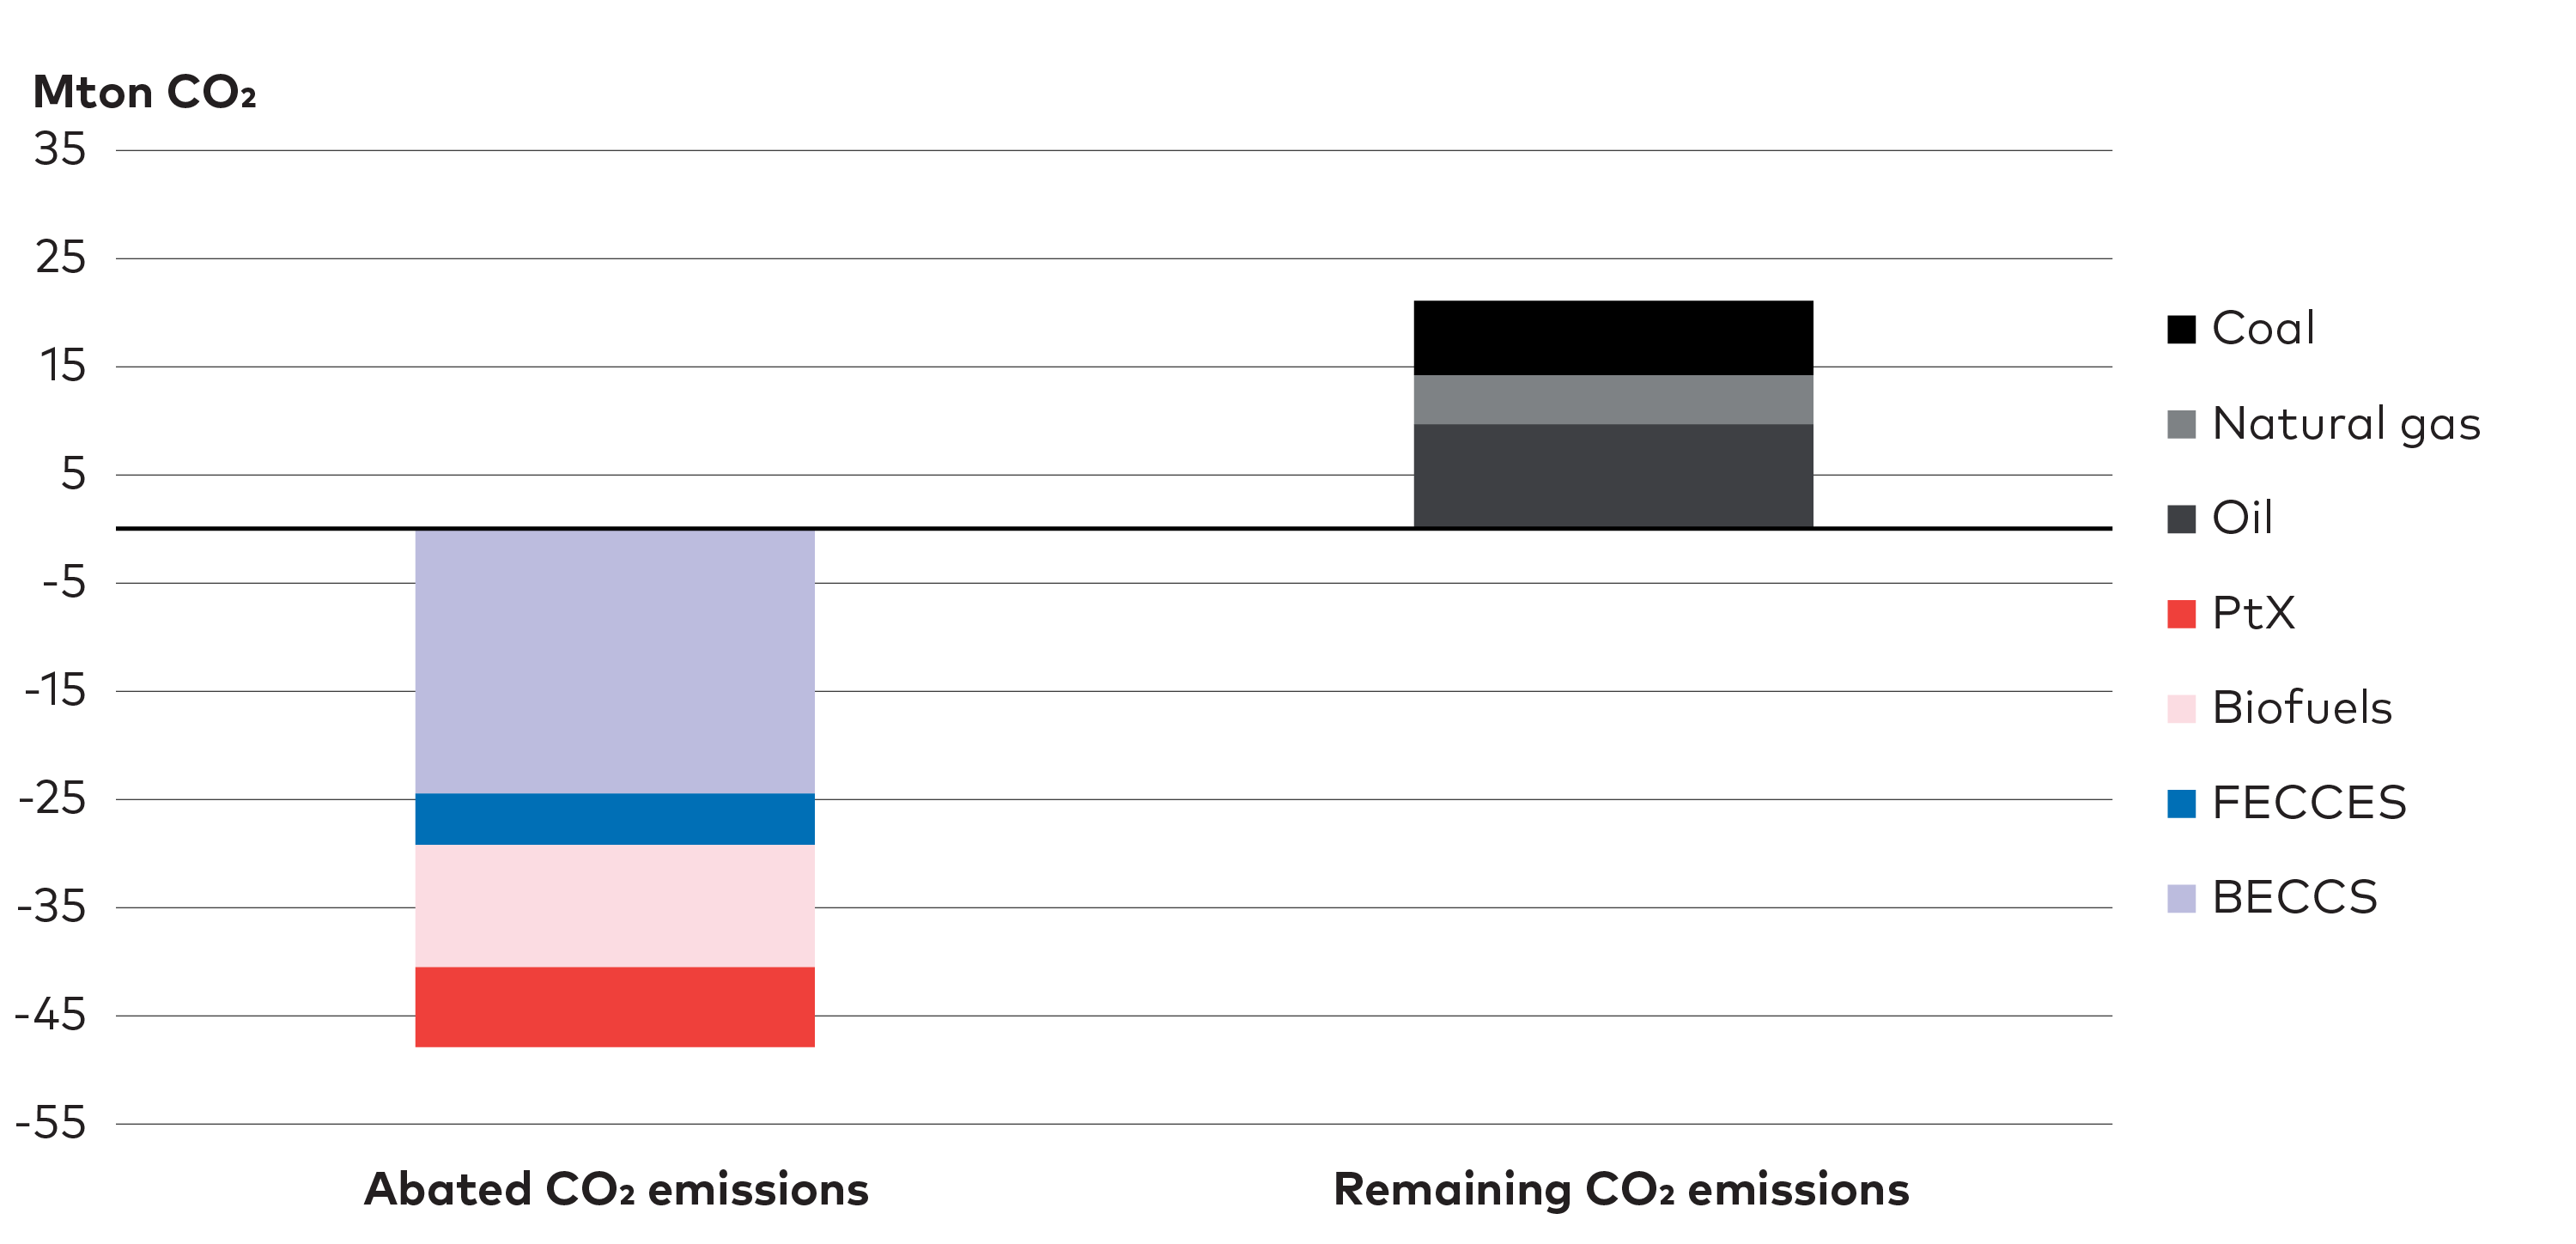
Figure 4.3. Effect on CO2-emissions from production of liquid and gaseous PtX, biofuels, and CO2 sequestration by 2050 - CNN scenario. Negative emissions from BECCS allows for continued use of oil and gas, which leads to emissions as illustrated in the right bar. From an accounting perspective it is difficult to separate the production of PtX from biofuels as a large portion of the renewable fuels are produced in integrated processes where hydrogen from PtX facilities boost the production of bioliquids and synthetic gas made from solid biomass. In the graph this split is made on energy input basis.
The relatively modest demand for PtX in CNN is explained by the ambitious direct electrification that takes place, which include a dominating role for BEVs as well as electric trucks. Even electric flights are expected to provide an important contribution to aviation. At the same time CCS technologies play a prominent role in the scenario and by 2050 the abatement of CO2 obtained through CCS, mainly BECCS, is approximately 29 Mt. For comparison, production of biofuels reduces CO2 emissions by 11 Mt and the production of PtX lowers CO2 emissions by approximately 7.4 Mt.
The negative emissions from BECCS allows for continued use of fossil fuels, and reduce the need for PtX and biofuels, in 2050. Therefore, emissions from fossil oil, natural gas, and coal still contribute about 9.7, 4.5, and 6.8 Mton CO2 emissions, respectively.
4.3.1 Exploring alternative pathway developments
To further explore the potential pathway for PtX in the Nordic countries, a number of sensitivity analyses have been undertaken to study the impact certain developments would have on PtX demand. As the potential for bioenergy and CCS development will impact the space for PtX expansion, restriction on biomass imports and/or a higher projected price of carbon storage (+ 32 €/ton) was applied as sensitivities. As Figure 4.4 shows, this further analysis supports the initial results. Even when implementing both sensitivities electricity demand for PtX fuels at the Nordic level only increase by ~16 TWh in CNN by 2050.
However, as outlined in the following sections there is an increasing interest in PtX among key players in the energy industry and governments. With this in mind, and at the same time considering the significant uncertainty related to both the future cost of PtX and the opportunities for delivering on the potential for direct electrification, the NPH scenario has been set up to investigate a situation with high demand for PtX fuels from the steel industry and for exports. The NPH scenario may also reflect a situation where direct electrification is not as successful as projected, thereby prompting a greater demand for liquid and gaseous fuels. As seen in figure Figure 4.4, by 2030 the electricity demand to supply PtX is 24 TWh in NPH, increasing to 217 TWh by 2050, which corresponds to more than half of current Nordic electricity demand.
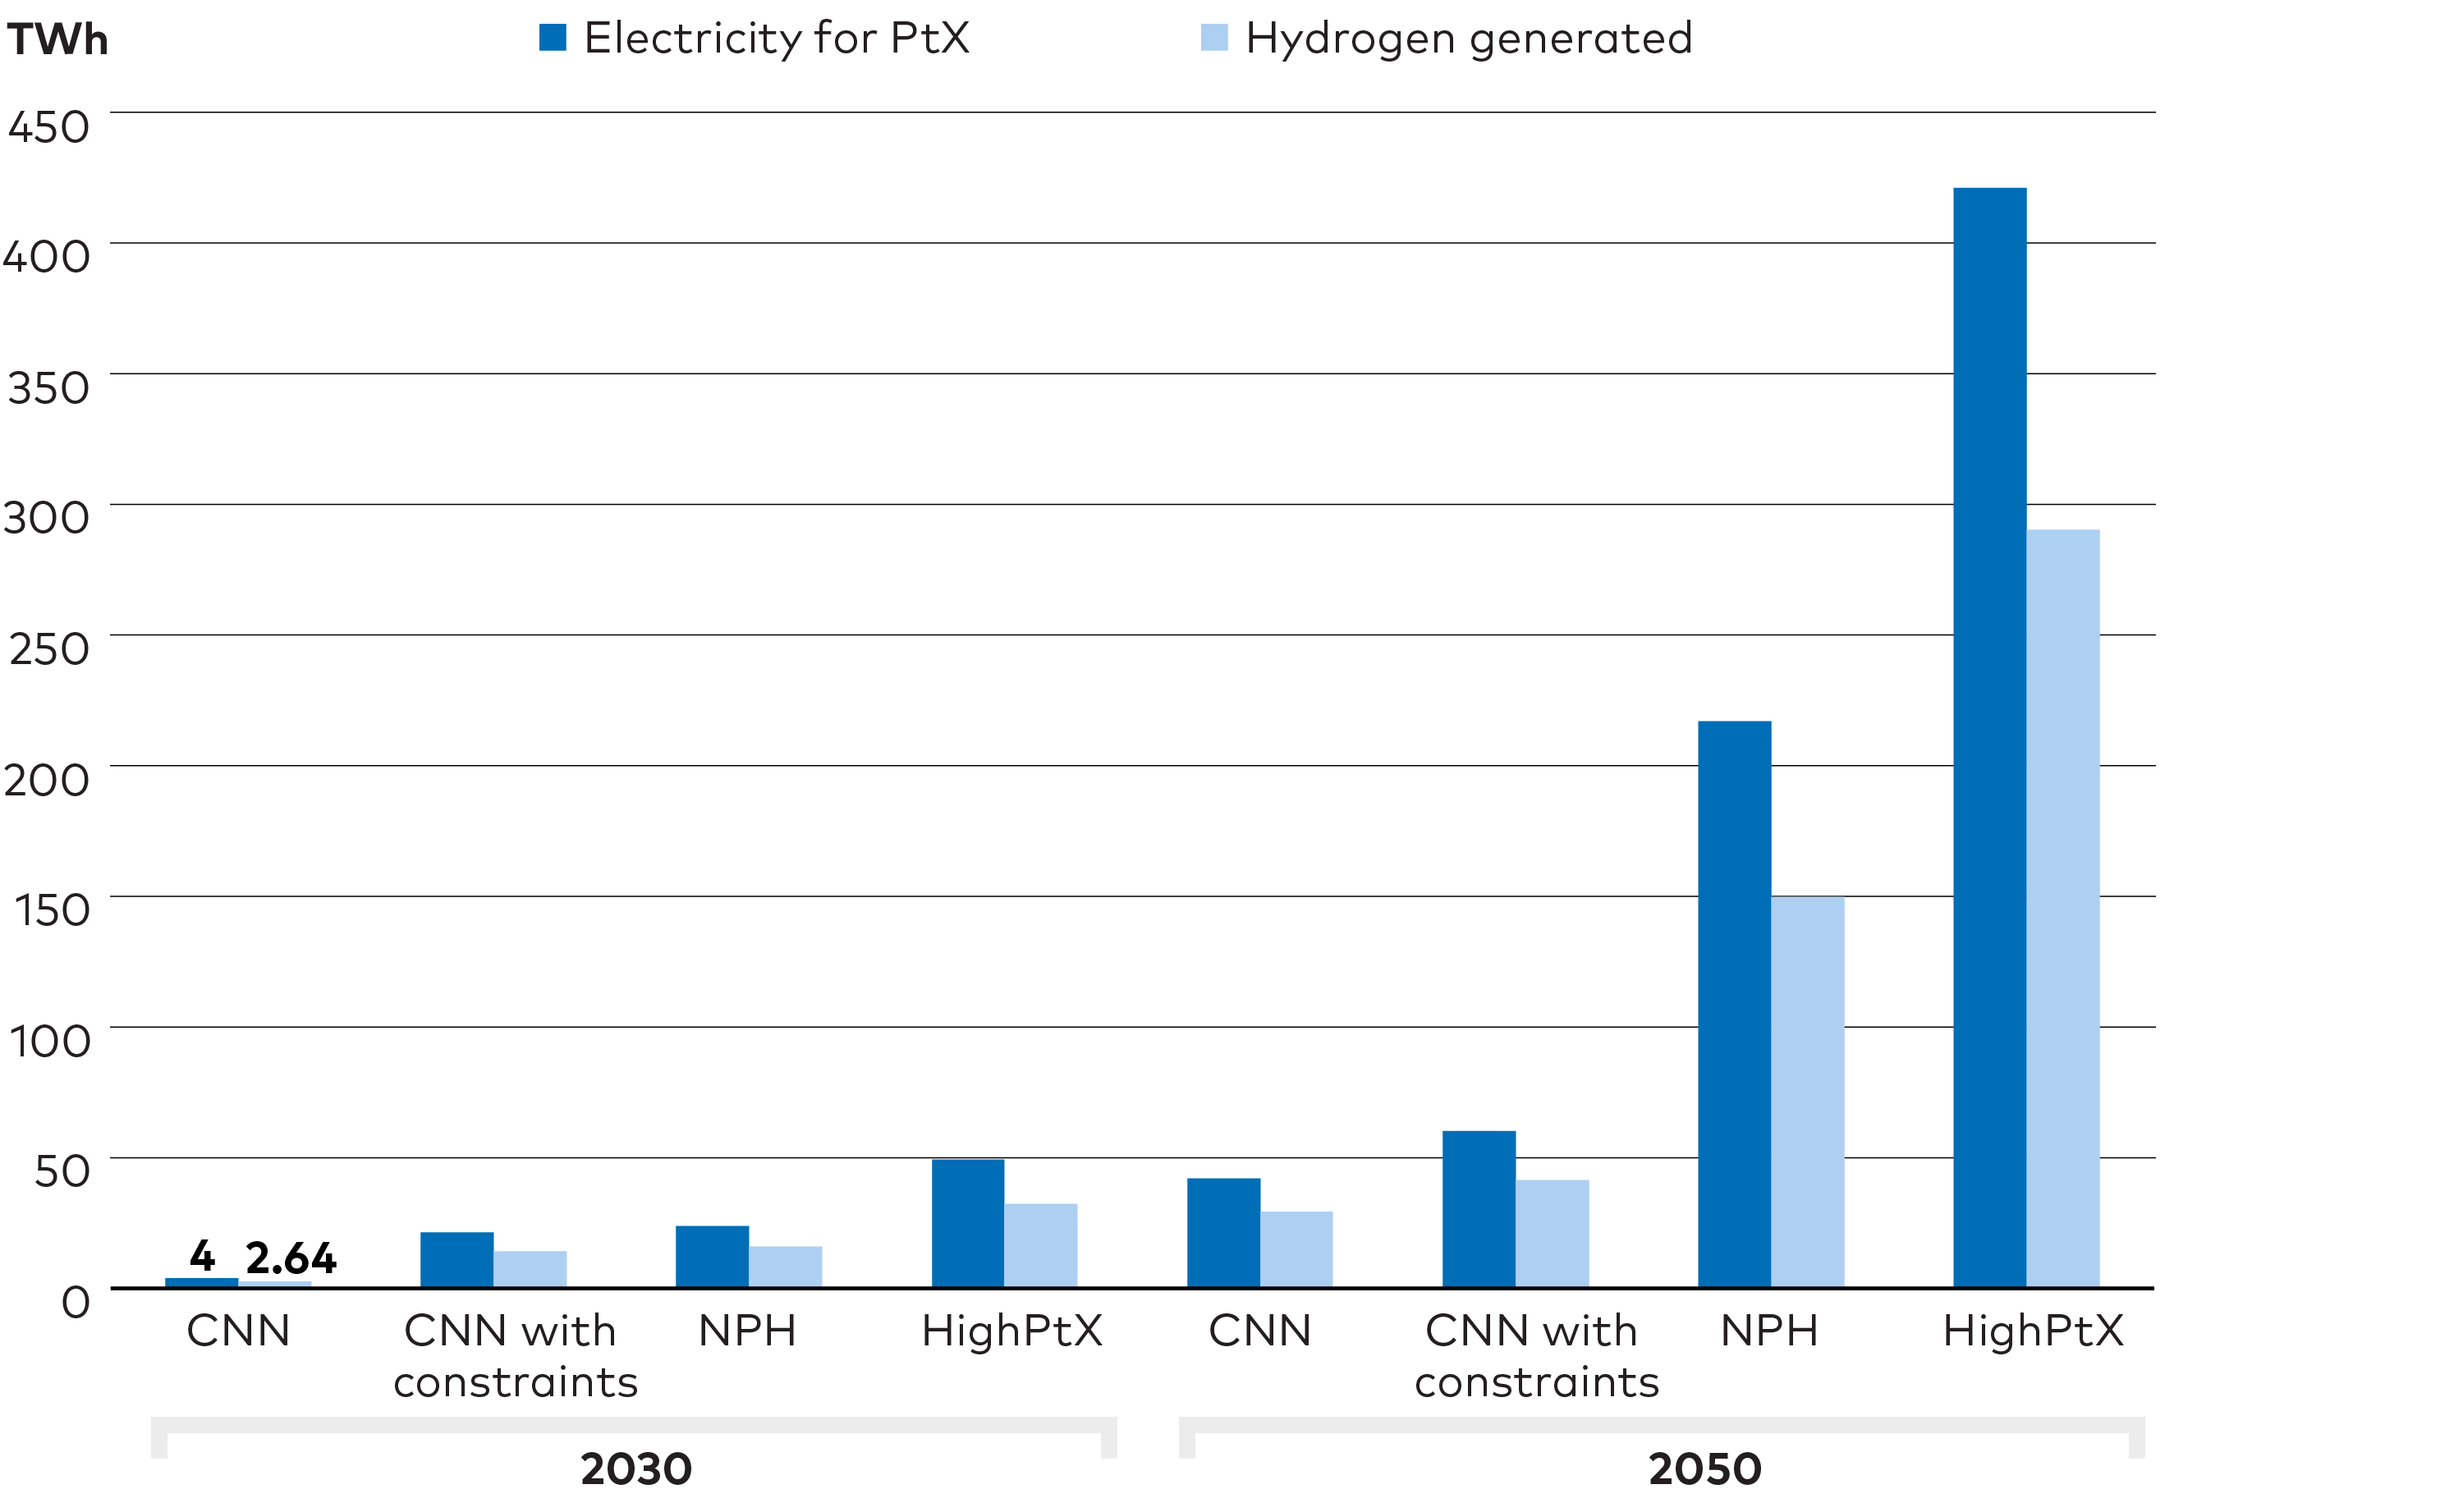
Figure 4.4. Electricity demand for PtX fuels. Electricity demand for producing PtX fuels in CNN, CNN with both constrains (restrictions on biomass imports and a higher projected price for carbon storage) and the NPH scenario. The biomass sensitivity implies that allowed import of biomass and biofuels are linearly reduced from today’s import level to zero in 2040. In addition, the total Nordic biomass potential for energy is also reduced by 25% in 2040 to hedge for other uses of biomass in the future. As seen in this figure, PtX-demand develop at a modest level in the CNN scenario and is not sensitive to restriction on biomass imports and/or a higher projected price of carbon storage.
4.4 Rising interest for PtX in the Nordics
Even though PtX may appear relatively costly, many stakeholders and governments see a big potential for these technologies. This should be seen in the light of the fact that PtX enables the production of fuels based on RE sources such as offshore wind and solar cells, which offer a substantial production potential and at the same time costs are expected to fall significantly in the future. PtX can also ease the integration of variable renewable energy (VRE) by acting as a storage medium for RE surplus generation, reducing the need for electricity infrastructure expansion. In that respect, PtX offers benefits over direct electrification, which, depending on the application, may require significant reinforcement of power grids, at both lower and higher voltage levels. In addition, PtX offers a long-term solution, completely breaking dependence on fossil fuels. Due to such benefits, Nordic stakeholders are showing increasing interest in PtX. Below follow some examples from current developments and plans for PtX expansion in the Nordic countries. To be able to in a larger extent incorporate such developments in the NCES analysis additional cases were introduced to shed light on potential PtX pathways. These additional cases are presented in section 4.5.
CASES OF PTX DEVELOPMENT IN THE NORDIC COUNTRIES
In Denmark PtX is heralded as key for reaching reduction targets
In Denmark PtX is perceived as an important building block for reaching the national 70 % GHG reduction target for 2030.
These plans include two ‘energy islands’ in the North Sea and the Baltic Sea to host large off-shore wind farms, with the prospect of connecting to PtX facilities at the islands or on shore.[1]Energistyrelsen, 2021. See Figure 4.5 below for an example illustration of the planned energy islands.
Several companies including Copenhagen airport, A.P. Moller - Maersk, DSV Panalpina, DFDS, SAS and Ørsted have formed a partnership to develop a hydrogen and electro-fuel production factory by 2023. When fully scaled-up by 2030, the project should total an electrolyser capacity of 1.3 GW. In February 2021, Copenhagen Infrastructure Partners, revealed plans for 1 GW ammonia factory to be commissioned by 2026.
A recent survey shows that private players have plans for installing about 4.5 GW of electrolyser capacity in Denmark by 2030, corresponding to an annual power demand of more than 22 TWh.
Footnotes
- ^ undefined
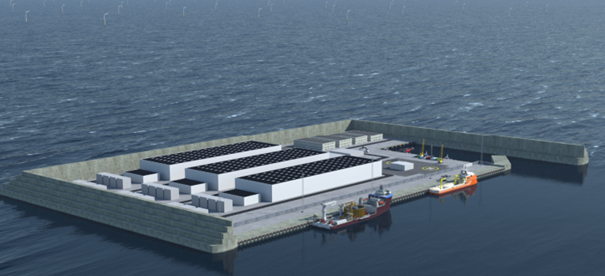
Figure 4.5. Illustration of a simplified layout for a 3 GW artificial energy island. A broad coalition of Danish political parties have decided to establish two energy hubs and associated offshore windfarms: one as an artificial island in the North Sea and one at the Danish island Bornholm. The energy island in the North Sea will have a start capacity of 3 GW, but the ambition is to increase 10 GW. The island will be constructed 80 kilometres from the shore of the peninsula Jutland. Source: Energistyrelsen, 2021, p. 49.
Fuel for aviation and freight is a key driver for PtX in Norway
In Norway, several partners are engaged in plans for aviation fuel plants as well as for ammonia which could be used for maritime freighters, agriculture, and industrial applications. Both Nordic Blue Crude and Norsk e-fuel AS have announced plans for plants at Herøya Industripark in Porsgrunn. Norsk e-Fuel AS an industry consortium of four partners; is planning for a commercial plant for hydrogen-based renewable aviation fuel. The first plant with a production capacity of about 0.1 TWh of renewable fuels per year annually is planned to be able to go into operation in 2023 and then be scaled up to around 1 TWh by 2026. Nordic Blue Crude has also announced plans for a pilot plant of the same size, initially including Sunfire and Climeworks as partners.
Statkraft, Yara and Aker Horizons want to build a 450 MW plant for ammonia via hydrogen in Porsgrunn, which can be completed in 5-7 years. In addition, Aker Clean Hydrogen and Varanger Kraft plan to build a similar plant of 100 MW in Berlevåg, which can be completed in 2025.
Iron ore and steel play significant roles in for PtX development in Sweden and Finland
In both Sweden and Finland, there is potential for using hydrogen for production of iron ore and steel. SSAB, which is active in both countries, aims to become fossil free by 2045 and the HYBRIT technology, which allows replacing coking coal, traditionally needed for ore-based steelmaking, with fossil free electricity and hydrogen, is key in this transformation process. The HYBRIT technology is developed in a consortium between SSAB, power producer Vattenfall and iron-ore producer LKAB.
In addition, in Sweden, Liquid Wind is planning for a plant in Örnsköldsvik for e-methanol, which they hope to be able to follow up with more plants at other locations in Sweden. At the same time Preem and St1 aim to increase the production of biofuels using fossil free hydrogen.
HYBRIT, LKAB, Preem, and St1 plans for processes that together can require an increased electricity demand of 55 TWh, or the equivalent of 8 GW of electrolysis power - which is also the proposed planning goal for 2045 in Fossil free Sweden's hydrogen strategy.[1]Fossilfritt Sverige, 2021.
In Finland, the government is supporting PtX through investment programmes for demo projects covering until now three sizeable PtX plants, which will produce green methane and hydrogen to replace fossil fuels in industries and oil refining.
Iceland power company explores hydrogen export opportunities
Iceland already has two operational hydrogen production sites, both located at geothermal power plants. The largest of the plants produces methanol for local applications and for export whereas the other plant delivers hydrogen for fuel-cell vehicles. Recently, Landsvirkjun, the national power company of Iceland, announced that the company is looking into establishing a hydrogen production facility at the Ljósafoss hydroelectric power plant and at the same time a memorandum was signed with the Port of Rotterdam regarding the option to export green hydrogen.
Footnotes
- ^ Fossilfritt Sverige, 2021.
4.5 Nordic PtX export potentials
The interest for PtX is not only evident in the Nordic countries. The European Commission (EC), and a number of individual European countries, have developed strategies for how hydrogen, carbon storage, and PtX can contribute to the green transition and business development. However, the European conditions for pursuing PtX development are vastly different from the Nordic countries and the European PtX pathway sets high ambitions. These high ambitions and drive for green hydrogen at the European level makes it likely that there could be a role for the Nordic countries to provide green PtX fuels for continental Europe. Effective use of the resources for clean electricity with very good hydro and wind resources and vast lands for locating PV plants, for export of green hydrogen could completely shift the role of hydrogen and PtX at the Nordic level.
To delve deeper into the potential development of Nordic PtX, in relation to the Nordic developments mentioned above, as well as the high ambitions for green hydrogen at the EU level, the NCES analyses provides some additional cases for PtX pathways.
4.5.1 PtX is key to European decarbonisation
According to the EC’s hydrogen strategy from 2020 for a climate-neutral Europe, cumulative investments in renewable hydrogen in Europe will have totalled up to € 180-470 billion by the year 2050.[1]European Commission, 2020.The strategy points to a target of 40 GW electrolysis capacity in the EU by 2030, corresponding to an electricity demand of around 160 TWh assuming a capacity factor of 0.45, as well as imports of hydrogen from outside of the EU from an estimated 40 GW of installed capacity as well. Within this context, Nordic neighbours, Germany, and the Netherlands, have laid out specific strategies for hydrogen during 2020. The German strategy earmarks €1.1 billion for subsidies until 2023 for development and testing of hydrogen technologies and anticipates meeting a projected 100 TWh hydrogen demand already by 2030, most of which will be covered via import.
Footnotes
- ^ European Commission, 2020.
In the long-term, towards 2050, the European demand for green hydrogen could become substantially stronger, seeing that green hydrogen appear as the preferred option for provision of low-carbon hydrogen in the EC’s long-term climate strategy from November 2018.[1]European Commission, 2018. In the EC’s strategy eight different reduction pathways towards 2050 are explored. Five of the pathways explore routes to 80 % reduction in GHG by 2050 focusing on either energy efficiency (EE), circular economy (CIRC), electrification (ELEC), hydrogen (H2), or PtX. Three additional pathways, seen to the far right in Figure 4.6, lead to either 90% or 100 % GHG reductions by 2050 by combining different technology options and lifestyle changes. The three scenarios that aim for 90% or 100 % reduction result in a doubling of power demand or higher and a very large portion of this increase is related to production of PtX fuels, see Figure 4.6 for the resulting increase in gross electricity generation.
Footnotes
- ^ European Commission, 2018.
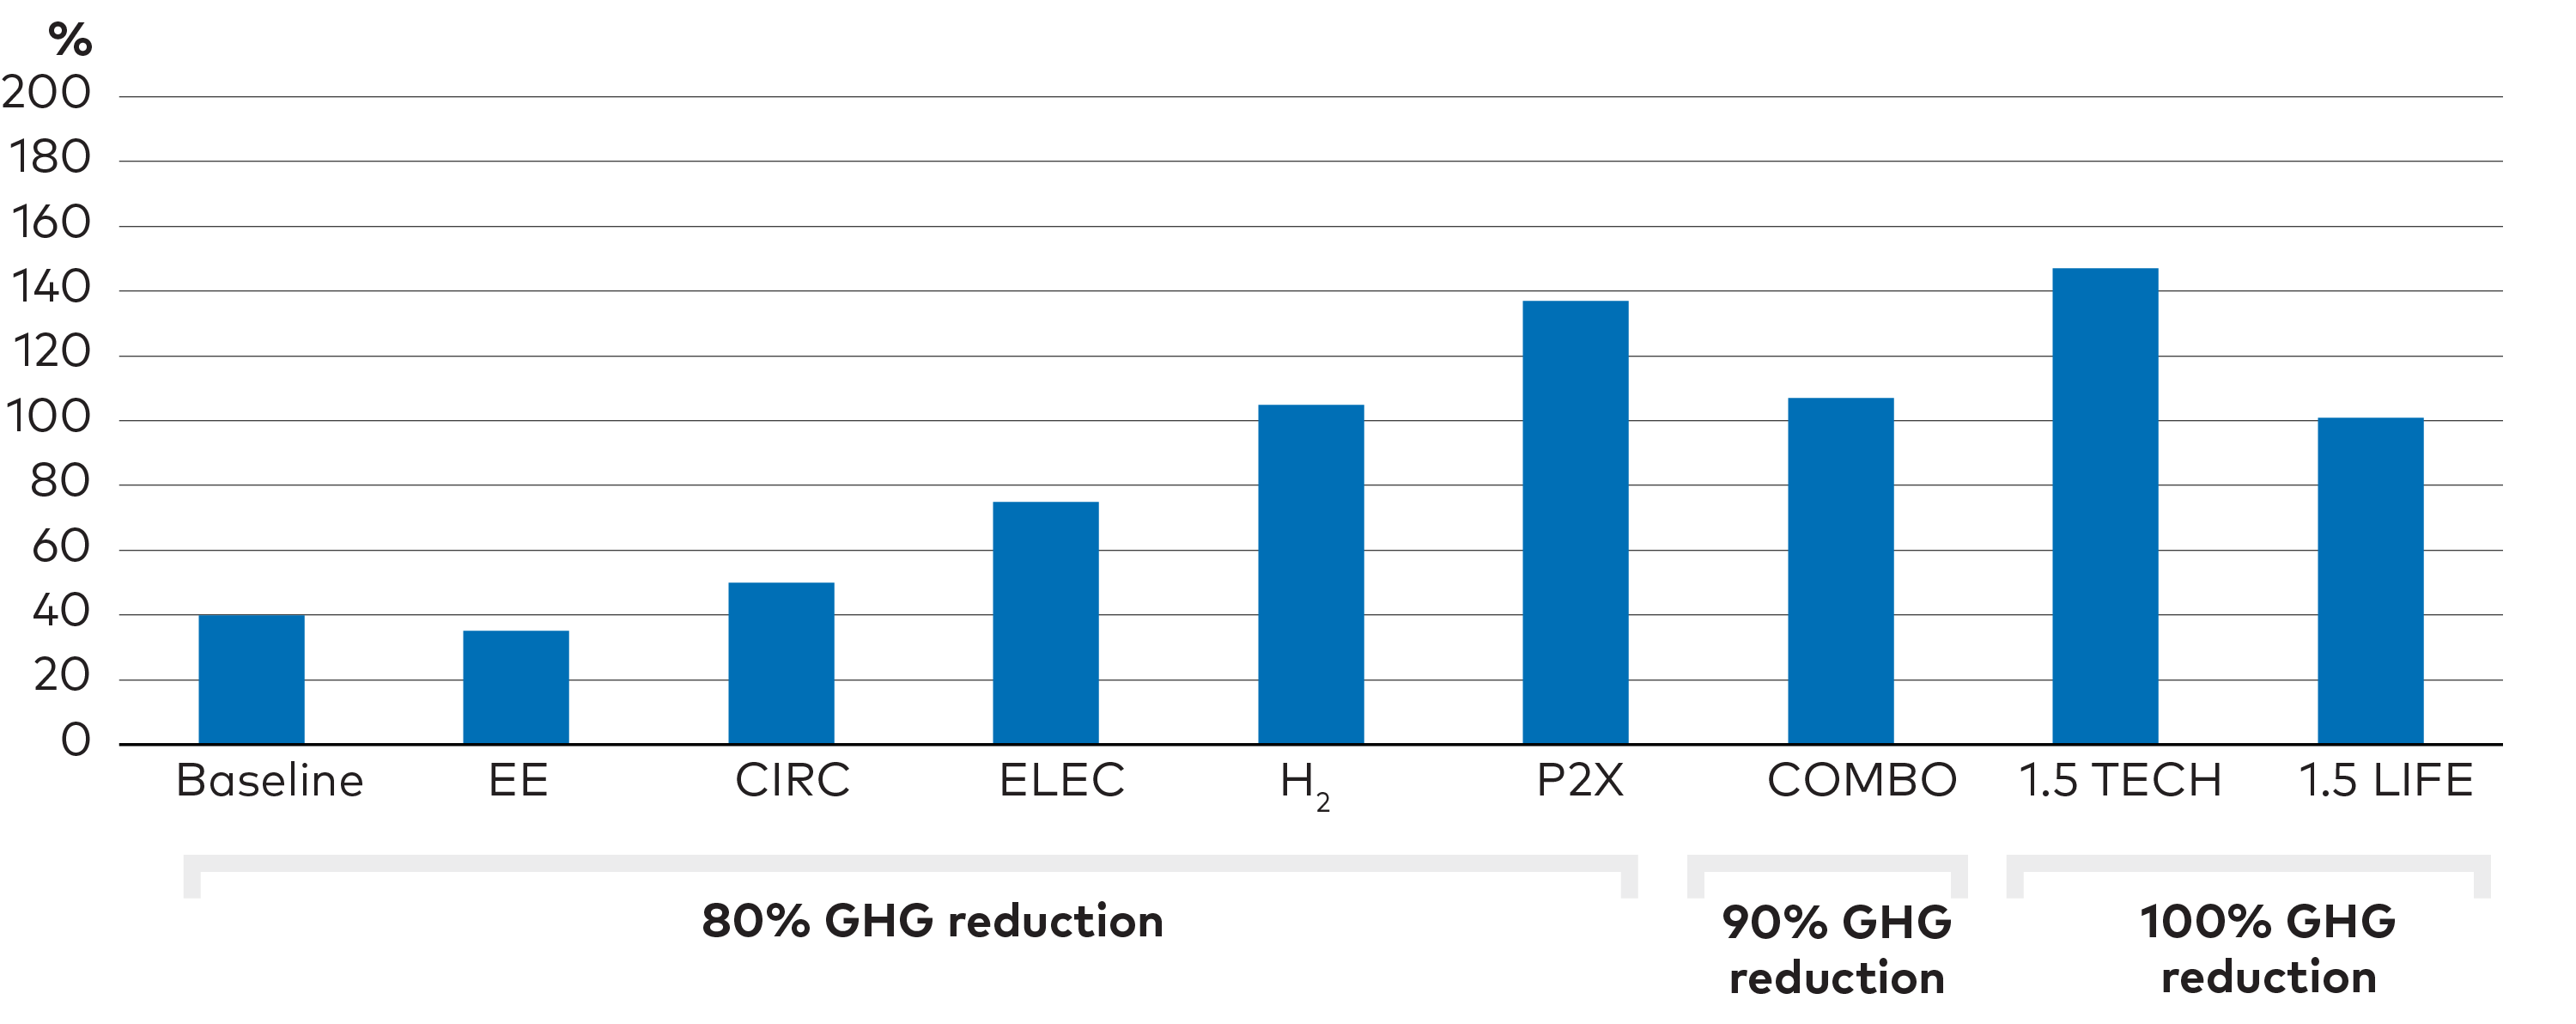
Figure 4.6. Increase in gross EU electricity generation compared to 2015. EU electricity demand may increase substantially to deliver on climate targets, potentially with large bearings on the Nordic power systems. The EC explored eight different reduction pathways in its long-term climate strategy from November 2018. The pathways leading to 90% or 100% GHG reduction by 2050, COMBO, 1.5 TECH and 1.5 LIFE, result in a doubling (or more) of power demand. A very large portion of this increase relies on production of PtX fuels. Source: European Commission, 2018. Own reading of Fig.22, p.74.
Compared to the CNN results, the EC Climate Strategy sees a much larger need for PtX fuels. A notable reason for the difference is that the relative biomass resources at EU level are scarce in relation to Nordic resources, consequently leaving a smaller role for both biofuels and CCS, and thus stronger need for PtX. At the same time, the EC projects a more moderate level of direct electrification, which leads to a larger demand for liquid and gaseous fuels.
Moreover, the strategy emphasises the opportunities for adding flexibility to a wind and solar dominated power system through use of electrolysers. Reducing the anticipated role of CCS technologies, and thus blue hydrogen, is also related to the fact that the strategy points to “inherent constraints of CCS”, such as economic performance, long-term functionality of carbon storage as well as public acceptance issues. In addition, the fossil fuel used for hydrogen production is mostly imported natural gas and pursuing a strategy based on large imports of blue hydrogen would not alleviate the EU from this dependency.
Of note is that the Nordic countries potentially could compete for the provision of green hydrogen with third countries, for example Morocco, Chile, or other locations with favourable solar and/or wind resources. To what extent these import options will materialise, and whether Europe will accept such import dependency, is difficult to predict. However, previous analyses indicate that Nordic PtX production may be competitive with imported PtX, when costs of long-distance transport are accounted for.[1]Dansk Energi, 2020.
Footnotes
- ^ Dansk Energi, 2020.
4.5.2 Three PtX cases show diverse trajectories
To examine the potential role of Nordic PtX export to Europe, the power market model Balmorel has been used to analyse three cases with different levels of PtX demand in the Nordic countries and in the EU. Two of these cases include more favourable conditions for siting onshore wind in the Nordic countries, lower cost of offshore wind everywhere, and allows for trading of PtX fuels between countries. The lower cost of offshore wind in the scenarios could result from either technological improvements or support from governments that favour RE deployment to take place offshore. Key assumptions are presented in Table 4.2.
For comparison the CNN and NPH scenarios have been added to Table 4.2. The NoPtX case has slightly lower electricity demand than the CNN scenario based on the ON-TIMES model, whereas the HighPtX and the Very-HighPtX case have substantially higher demand than the NPH scenario based on ON-TIMES. In this way, the PtX cases contribute to exploring the full span of possible outcomes with respect to PtX demand.
Table 4.2. Key assumptions underlying power system analyses focusing on potential PtX pathways.
| NoPtX | HighPtX | Very-HighPtX | CNN for comparison | NPH for comparison | |
| Modelling tool | Balmorel | Balmorel | Balmorel | ON-TIMES | ON-TIMES |
| Power demand to serve Nordic PtX by 2050 | 0 | 117 TWh 31 % of current demand | 156 TWh 42 % of current demand | 36 TWh | 43 TWh |
| Power for Nordic exports of PtX | 0 | 304 TWh | 499 TWh | 0 | 152 TWh |
| EU-18 power demand to serve PtX by 2050 | 0 | 1826TWh 68 % of current demand | 2437 TWh 90 % of current demand | Not analysed | Not analysed |
| Market for PtX between countries | No | Yes | Yes | No | Yes* |
| Acceptance of onshore wind in Nordic countries | Moderate | High | High | Moderate | Moderate |
| Investment cost of offshore wind by 2050 | 1.5 mill. €/MW for typical site | 1.1 mill. €/MW for typical site | 1.1 mill. €/MW for typical site | 1.39 mill. €/MW for typical site | 1.39 mill. €/MW for typical site |
| Limit on investments in new interconnector capacity between bidding zones | 1200 MW per 10 y | 6000 MW per 10 y | 6000 MW per 10 y | Not analysed | Not analysed |
| *A fixed level of export was assumed but a market for PtX was not modelled. | |||||
The NoPtX case provides a reference where power demand increases modestly as a result of direct electrification and where PtX production never takes off. The HighPtX case assumes a PtX demand in line with the EU’s COMBO scenario that leads to a 90% reduction of GHG by 2050, whereas the Very-HighPtX case builds on PtX demand from the EU Commission’s 1.5 Tech scenario which yields 100% reduction of GHG at EU level by 2050.[1]European Commission, 2018.
To properly analyse the interplay between the Nordic countries and the rest of Europe, the Balmorel model covers 18 countries in Central and Northern Europe[2]Austria, Belgium, Czech RepublicDenmark, Estonia, Finland, France, Germany, Italy, Latvia, Lithuania, Luxembourg, Netherlands, Norway,Poland, Sweden, Switzerland, and the United Kingdom, plus a detailed representation of offshore wind hubs in the North Sea and in the Baltic Sea. The modelling considers that there are additional costs associated with transporting PtX fuels where a cost of 10 €/MWh-H2 is included when PtX is moved from one country to another. The model does not specify the mode of transport – whether it is cheaper to produce a PtX fuel onsite that is relatively easy to transport, such as ammonia, or if its more cost-effective to transport hydrogen by pipeline. However, for comparison, the fee of 10 €/MWh H2 should be sufficient to finance approximately 1500 km of new hydrogen pipeline transmission capacity. This assumption is contingent on a reasonable utilisation of the pipe and disregarding compressor stations and the cost of compression. This way of modelling may underestimate cost of transporting PtX over long-distances and overestimate transport cost over shorter distances. Access to CO2 sources, in order to further process hydrogen into for example methanol or e-kerosene, is not considered in the power sector analysis.
4.5.3 Nordic PtX generation will depend on the export potentials
Due to the attractive case of producing PtX fuels in the Nordic countries in comparison to other locations in central Europe, the HighPtX and Very-HighPtX cases involve large-scale exports of PtX fuels, in particular to Germany, see Table 4.3. Power exports from the Nordics, mainly to continental Europe, are also higher in the two cases. The reason for this is that the model sees a benefit of combining the two export options depending on transport distances. Export of PtX fuels is particularly relevant for utilising the, from a European perspective, more remotely located RE resources, such as onshore wind and solar power in northern Sweden and Finland. In this case, the long distances between production in north and demand in Central Europe makes large-scale transport through the power grid uncompetitive, tipping the scale towards PtX-fuel export.
On the other hand, offshore wind in the Baltic Sea and in the North Sea, mainly in Denmark and Sweden, deployed to enable the increased demand of electricity for PtX production, prove attractive for a combination of export of PtX fuels from nearby plants and export of electricity directly from offshore wind via cables to continental Europe. From a system perspective, the export cables have the benefit of adding additional offshore wind to the European grid, which can be used to serve PtX demand while also contributing to security of supply by providing baseload power to the overall power system. The PtX solution track thus shows a large portion of offshore wind being directly connected to either Poland or Germany.
Table 4.3. Nordic power supply by 2050 in three cases with different level of power demand for PtX production at the Nordic level and in Europe. Supply is split in different end-uses as well as for export to other European countries. A large demand for PtX at the European level may become a driver for large-scale Nordic exports of PtX fuels and electricity.
| Nordic power supply 2050 divided by end-uses, TWh | NoPtX | HighPtX | Very-HighPtX |
| Electricity demand (excl. PtX) | 471 | 476 | 475 |
| PtX to serve Nordic demand | - | 117 | 156 |
| PtX for export | - | 304 | 499 |
| Net export of electricity | 78 | 219 | 230 |
| Grid losses | 9 | 9 | 10 |
| Total power generation | 542 | 1124 | 1369 |
With a doubling, or more, of electricity demand at the EU level in the two PtX cases, deployment of wind and solar power increase markedly since these technologies appear as the least-cost options. What this results in at the Nordic level, is a spectacular difference in the installation of solar, onshore wind and offshore wind capacity, which increase to 25, 41 and 12 GW respectively in the NoPtX scenario compared to 96, 85 and 95 GW in the HighPtX case – and 140, 104 and 118 GW in the Very-HighPtX case.

Figure 4.7. Nordic power generation in - No, High, and Very High PtX cases. Development in Nordic power generation in the three cases of different levels of power demand for PtX production. Increasing demand for PtX in Europe gives incentive for the Nordic countries to scale up power generation, potentially by more than a factor of three by 2050. Wind power, both onshore and offshore, and solar power supply the increase.
The very large investments in wind and solar plant capacity in the HighPtX and Very-HighPtX scenarios are also reflected in generation figures, with total Nordic power production increasing from around 400 TWh today to almost 1200 TWh by 2050 in the HighPtX scenario and more than 1300 TWh in the Very-HighPtX case (Figure 4.7).
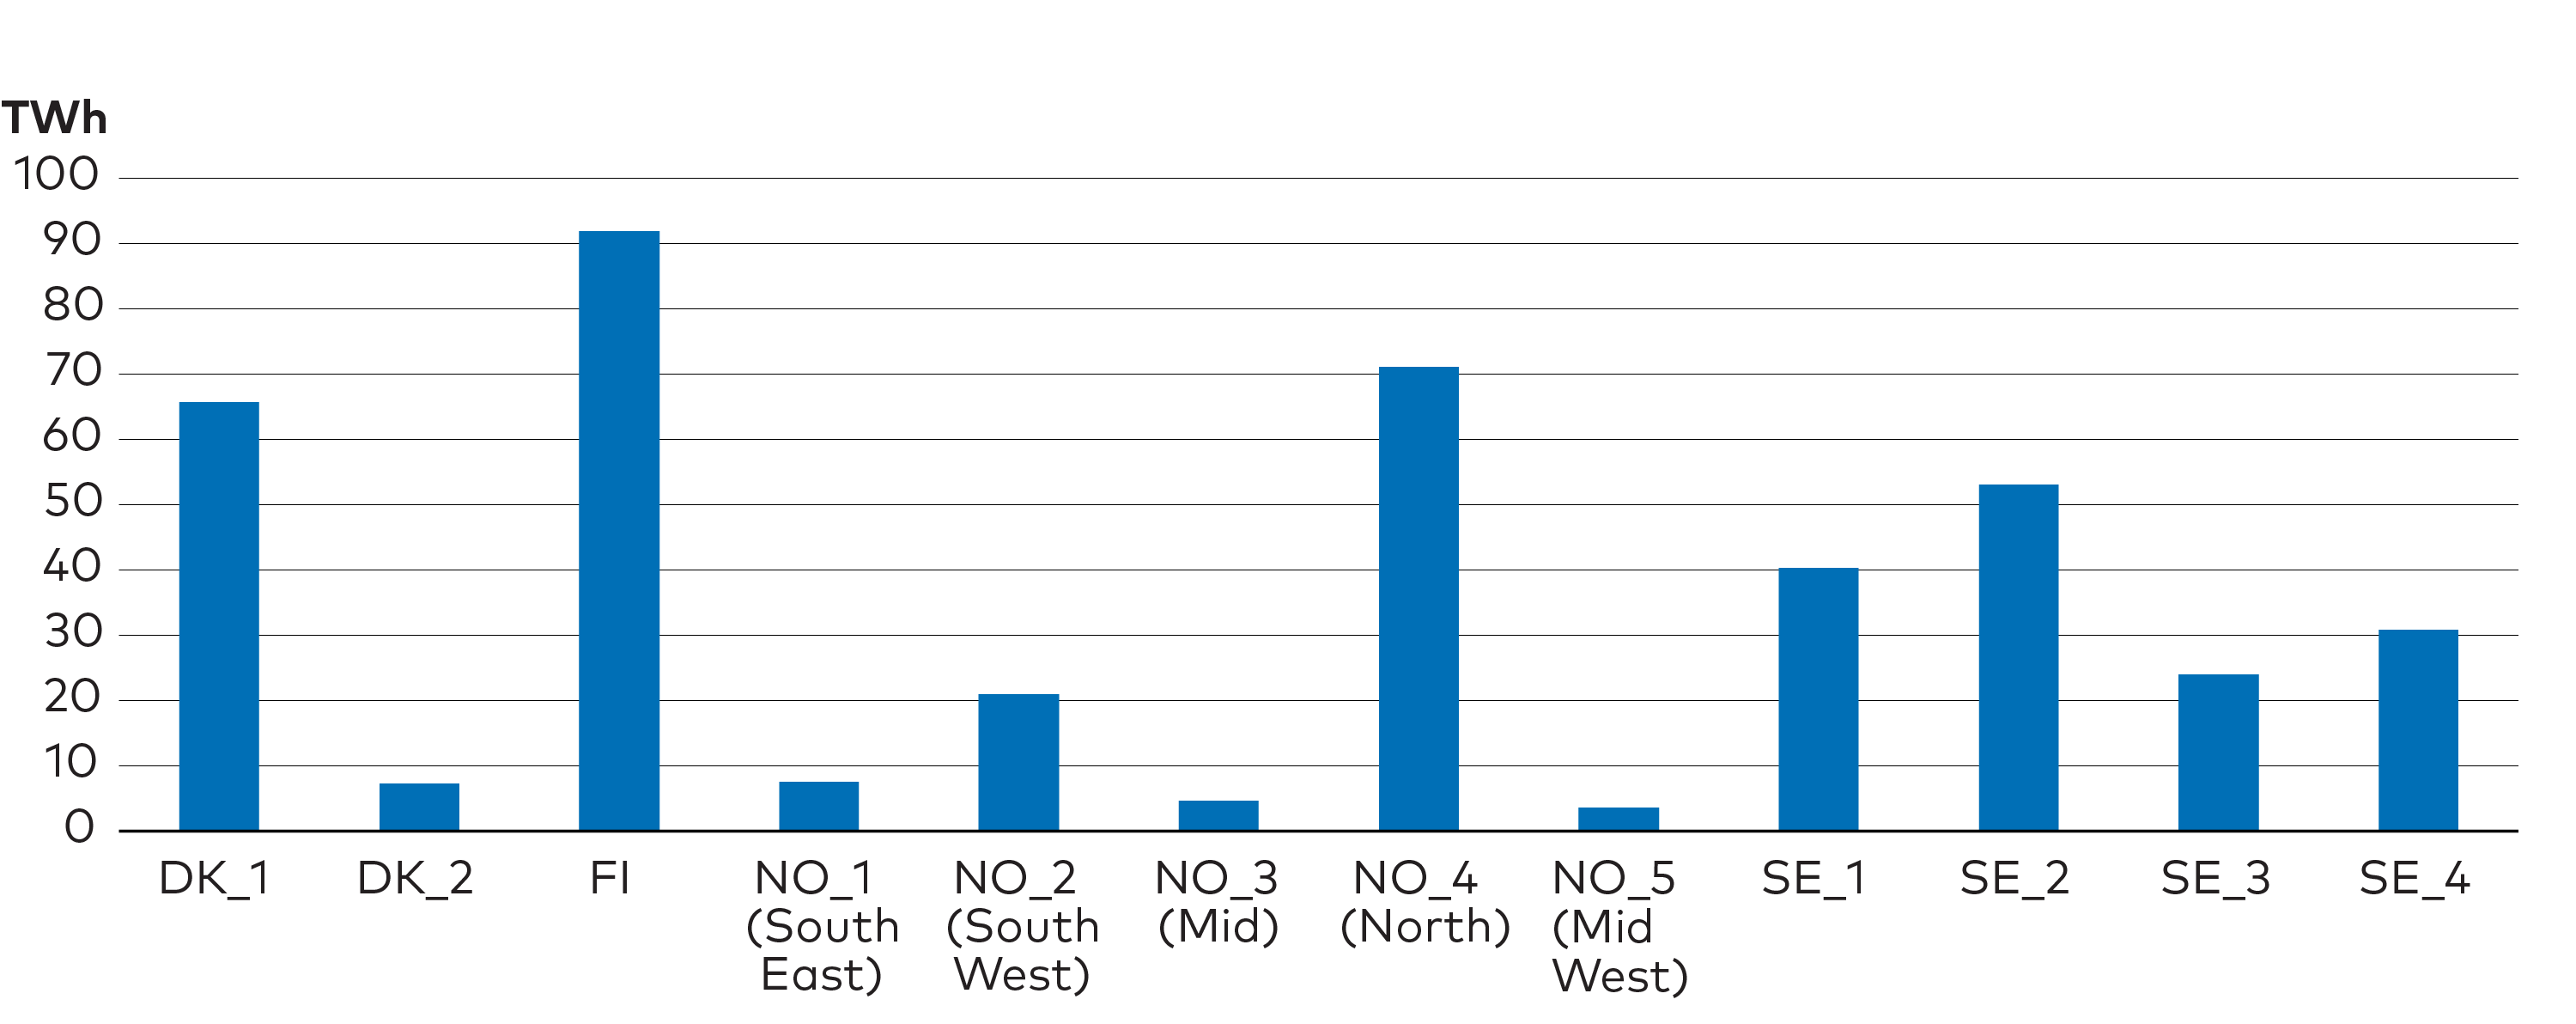
Figure 4.8. Electricity demand for PtX production. Electricity demand (TWh) for production of PtX per bidding zone in the HighPtX case by 2050. PtX facilities placed close to production facilities gain access to low-cost power and ease the stress on the transmission grid. Thus, a large portion of PtX production takes place in Northern Sweden and Norway and in Finland to take advantage of the potentials for hydro and wind power. Significant capacity is also seen in Western Denmark (DK_1) and Southern Sweden (SE_4) due to the proximity to offshore wind power.
4.5.4 PtX will affect Nordic infrastructure
In the HighPtX case, the generation capacity associated with exports of PtX and power from the Nordics is approximately at the same level as the generation capacity needed to serve Nordic electricity demand. One can easily imagine that such a massive increase in RE capacity will be challenging in terms of acceptance and competition with other interests even if most of the capacity is developed offshore, reducing the need for grid expansion between the Nordic countries
At the same time the model results point to a large need for investments in the power grid. Those investments are driven partly by the transition to RE technologies, which calls for more transmission capacity to balance out fluctuations in generation, and to transport power from regions, with surplus of RE resources to regions with deficits. Due to higher demand for power in the PtX-cases, and resulting higher level of RE capacity, more investments are also made in transmission capacity, yet the differences are not as big as one could expect because PtX facilities are flexible consumers that can be located close to generation, thus lessening the burden on the grid (Figure 4.9).
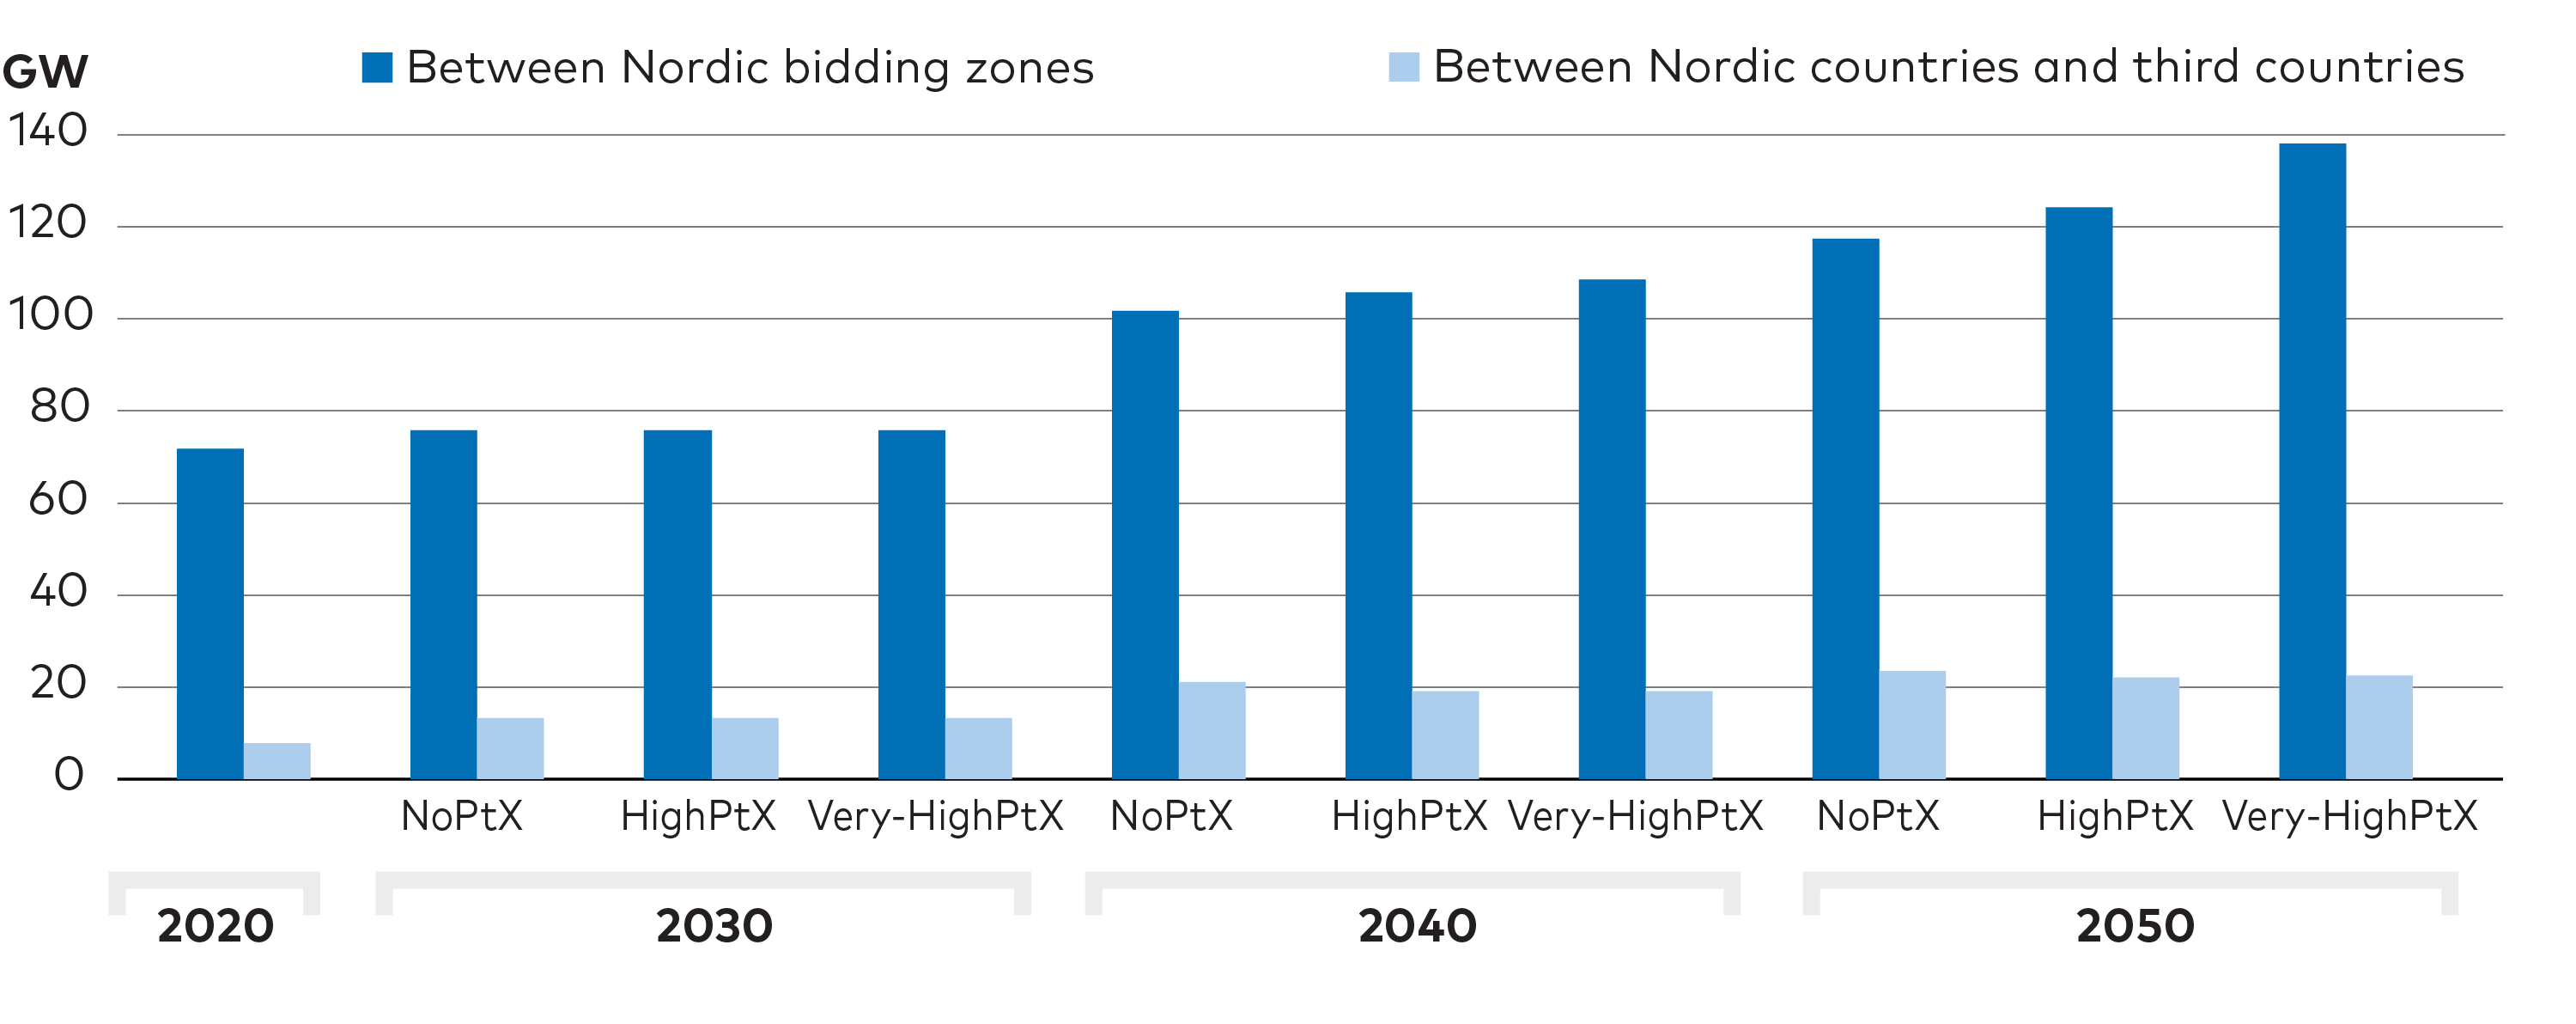
Figure 4.9. Transmission capacity - No, High, and Very High PtX cases. Development in transmission capacity in the three PtX cases, between Nordic bidding zones and between Nordic countries and third countries. The transmission grid between Nordic countries and to third countries need to strengthen considerable to accommodate increasing RE capacity. This finding is robust regardless of a large demand for PtX emerging or not.
Grid constraints within individual bidding zones have not been analysed, but it is obvious that the amount of PtX capacity and related deployment of wind and solar power capacity may pose significant challenges and costs related to grid integration. However, co-location of PtX plants and RE generators in hybrid constellations is likely to prove a cost-efficient measure to reduce the need for local grid reinforcements. In this respect, grid companies have an important role in stimulating co-location of demand and generation facilities through developing cost-efficient tariff structures. Off-grid hybrid plants could also prove attractive, if the proper sites for location of RE generators are located far away from the existing transmission grid, however, this solution misses out on the flexibility gains that arise from being part of a larger cohesive power system.
By the end of 2019, cumulated offshore capacity in the Baltic and North Sea was just shy of 22 GW. Though the offshore industry has seen strong progress over the last decade there is no doubt that it will be a daunting task to ensure deployment in offshore wind capacity and related grid infrastructure, at the level foreseen in the PtX cases. The power system analyses show a need for development of offshore power grids in the North Sea and the Baltic Sea to accommodate for the increasing amounts of offshore capacity. Even in the NoPTX scenario about 105 GW of offshore wind capacity is established in the North Sea and the Baltic Sea, compared to just over 300 GW in the HighPtX. Both scenarios involve development of meshed grids around wind hubs in both the North Sea and the Baltic Sea (Figure 4.10 and 4.11).
Price differences within Northern Scandinavia become more significant in the NoPtX scenario because PtX facilities do not contribute to levelling out prices across bidding zones and because investments in new transmission capacity is restrained in the NoPtX case to emulate a more cautious investment strategy by transmission system operators (TSOs)(Figure 4.10 and 4.11).

Figure 4.10. Transmission capacities and average power prices - NoPtX case. Grid map for Northern Europe in the NoPtX case by 2050. In a situation without demand for PtX, there is still a strong need to strengthen the transmission grid in Northern Europe. Colours indicate the average power prices per bidding zone: the redder the colour, the higher the prices. Average power price per bidding area is stated for each bidding zone. Capacities (in GW) for interconnectors between bidding zones are presented next to the lines. Although it constitutes a single bidding zone today, Germany is represented in four bidding zones in the model to reflect structural bottlenecks. Offshore wind hubs are indicated by circles.
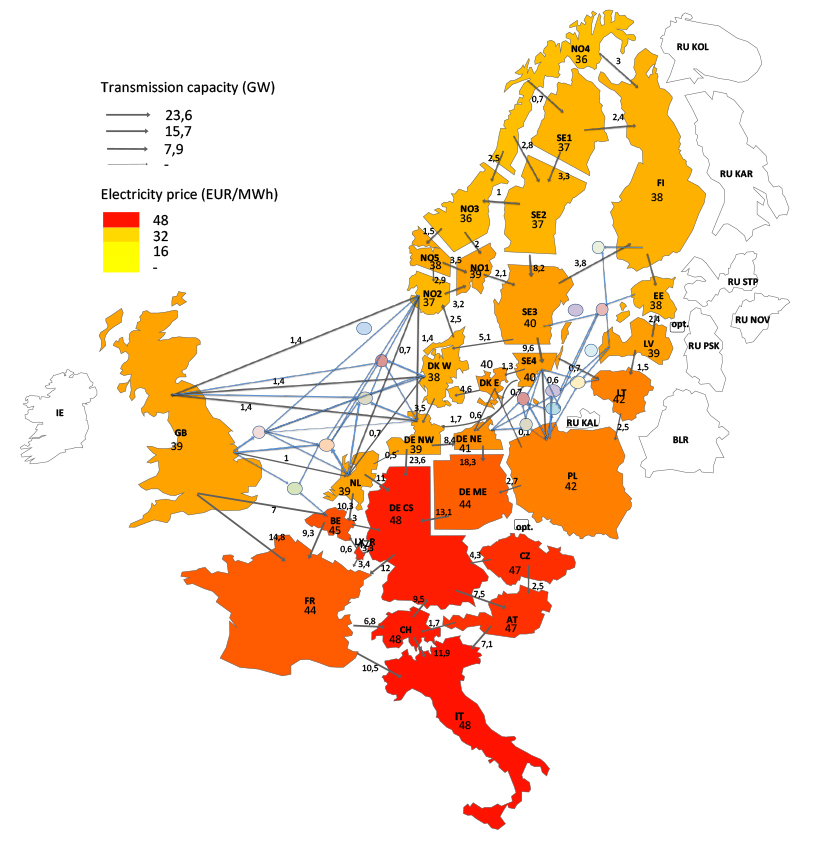
Figure 4.11. Transmission capacities and average power prices - HighPtX case. Grid map for Northern Europe in the HighPtX case by 2050. To accommodate for increased electrification and scale PtX demand the Northern European power need to be strengthened significantly and offshore grids need to be developed in the North Sea and in the Baltic Sea. The colours on the map indicate the average power prices per bidding zone, the redder the colour, the higher the prices. Average power price per bidding area is stated for each bidding zone. Capacities in GW for interconnectors between bidding zones are presented next to the lines. In the modelling, Germany is represented in four bidding zones to represent structural bottlenecks even though the whole of Germany constitutes one bidding zone. Offshore wind hubs are indicated by circles.
The extent to which there will be a need for coherent hydrogen infrastructure across the Nordic countries cannot be determined on the basis of the model analyses. The answer will depend on which types of PtX fuels will be preferred to produce and of course on how the demand for various PtX fuels will develop. If hydrogen becomes the primary energy carrier, it may prove relevant to develop local, regional, or possibly international connections that can move energy from the northernmost parts of the Nordic region to central Europe. However, it may turn out to be more attractive to produce ammonium locally, since ammonium is easier and cheaper to transport, potentially allowing significant savings on investments in hydrogen infrastructure.
4.6 Target areas for PtX
- Demonstrate PtX technologies in real operation environment and in growing unit scales.
- Further investigate the pros and cons of a proactive Nordic strategy to serve Europe with PtX fuels at large scale.
- At a national level, investigate in depth realistic long-term deployment potentials for onshore wind, offshore wind, and utility-scale solar to produce and potentially export PtX fuels.
- Develop a roadmap for a Nordic hydrogen infrastructure that considers both green and blue hydrogen. The roadmap should conceptualise a future Nordic hydrogen grid, including how the existing gas network and caverns can transport and store hydrogen, and explore how regulations and competencies for a cross-border hydrogen infrastructure can be established.
- Develop a roadmap for the long-term development of the Nordic power grid considering the need for internal upgrades, stronger interconnectors to third countries, and development of offshore grids in the North Sea and the Baltic Sea.
- Develop cost-effective power grid products that reward flexible use of the grid and provide incentives for optimal placement of PtX consumption.
- Analyse the possibilities for heat integration in relation to PtX, including between different types of PtX systems, for district heating, and new industries or technologies.
Near-term actions
 PHOTO: JOHANNES JANSSON/NORDEN.ORG
Chapter 5
The Important but Shifting Role of Bioenergy
Bioenergy is expected to maintain an important role in the Nordic energy system all the way to 2050, but biomass use for energy will likely gradually move from power and heat towards fuels for transportation and industry. Bioenergy used for heating and electricity generation hold the potential to provide energy security and flexibility in electricity systems with large shares of VRE supply. In addition, biofuels can be made almost identical in chemical properties to fossil counterparts, making them attractive as drop-in fuels and thus near-term substitution for fossil fuels in transportation while being one of the few alternatives for heavy transportation and aviation.
Key messages
-
The large Nordic wood biomass resources and vital forest industry value chain imply that bioenergy - primarily based on wood waste and forest industry residues - remain a main RE resource towards 2050.
-
With electrification of space heating, industrial heating, and road transport, biomass should to a larger extent be utilised in hard-to-abate sectors towards 2050.
-
Biomass offers flexibility in the transition of the Nordic energy system as it is storable and thus may be used for covering demand in periods with low supply of VRE.
-
Bioenergy can deliver negative emissions through BECCS, which are needed to meet climate targets.
-
Sustainable biomass supply is a key factor. It is expected that biomass demand for products, that can replace fossil-based counterparts, will grow in the future. This development may increase supply of residues for energy or it may increase competition with biomass for energy.
Bioenergy has been and still is an important fuel in Nordic power and heat, and it will likely remain so in the coming decades. However, as seen in chapter 3, electrification of heating can provide significant efficiency gains and the need for bioenergy could thereby decline. The potential for bioenergy growth in the NCES scenarios instead lies in a partial shift from power and heat towards a stronger role in hard-to-abate sectors, such as heavy and long-distance transport, and different industrial processes. In the CNN scenario, the annual bioenergy consumption for power and heat goes down from 142 TWh in 2019 to 98 TWh in 2050, while the corresponding numbers for biofuels for transportation is an increase from 30 TWh in 2019 to 68 TWh in 2050.
Due to low technological readiness of biofuel conversion routes, a successful change in this direction would require technological improvements and policies ensuring more advanced biofuels to be used in long-distance transportation and aviation. In addition, it is likely that bioenergy will remain a useful resource for heating in periods of high heat demand and low electricity supply. Since Nordic biomass for energy is mainly based on wood waste and wood residue resources, the future development of the Nordic forest industry will strongly affect bioenergy development.
5.1 Currently a major part of the mix
Biomass used for power, heat, and transportation represents a major renewable source in the Nordic energy system. As seen in Figure 5.1, the share of biomass in the total gross energy consumption is close to 25% in Finland, Sweden, and Denmark, and shares have increased since 2014. In total the Nordic use of biomass for energy has increased by 47 TWh from 2014 to 2019. The largest increase is observed for solid biofuels with +27 TWh, followed by liquid biofuels with +12 TWh.
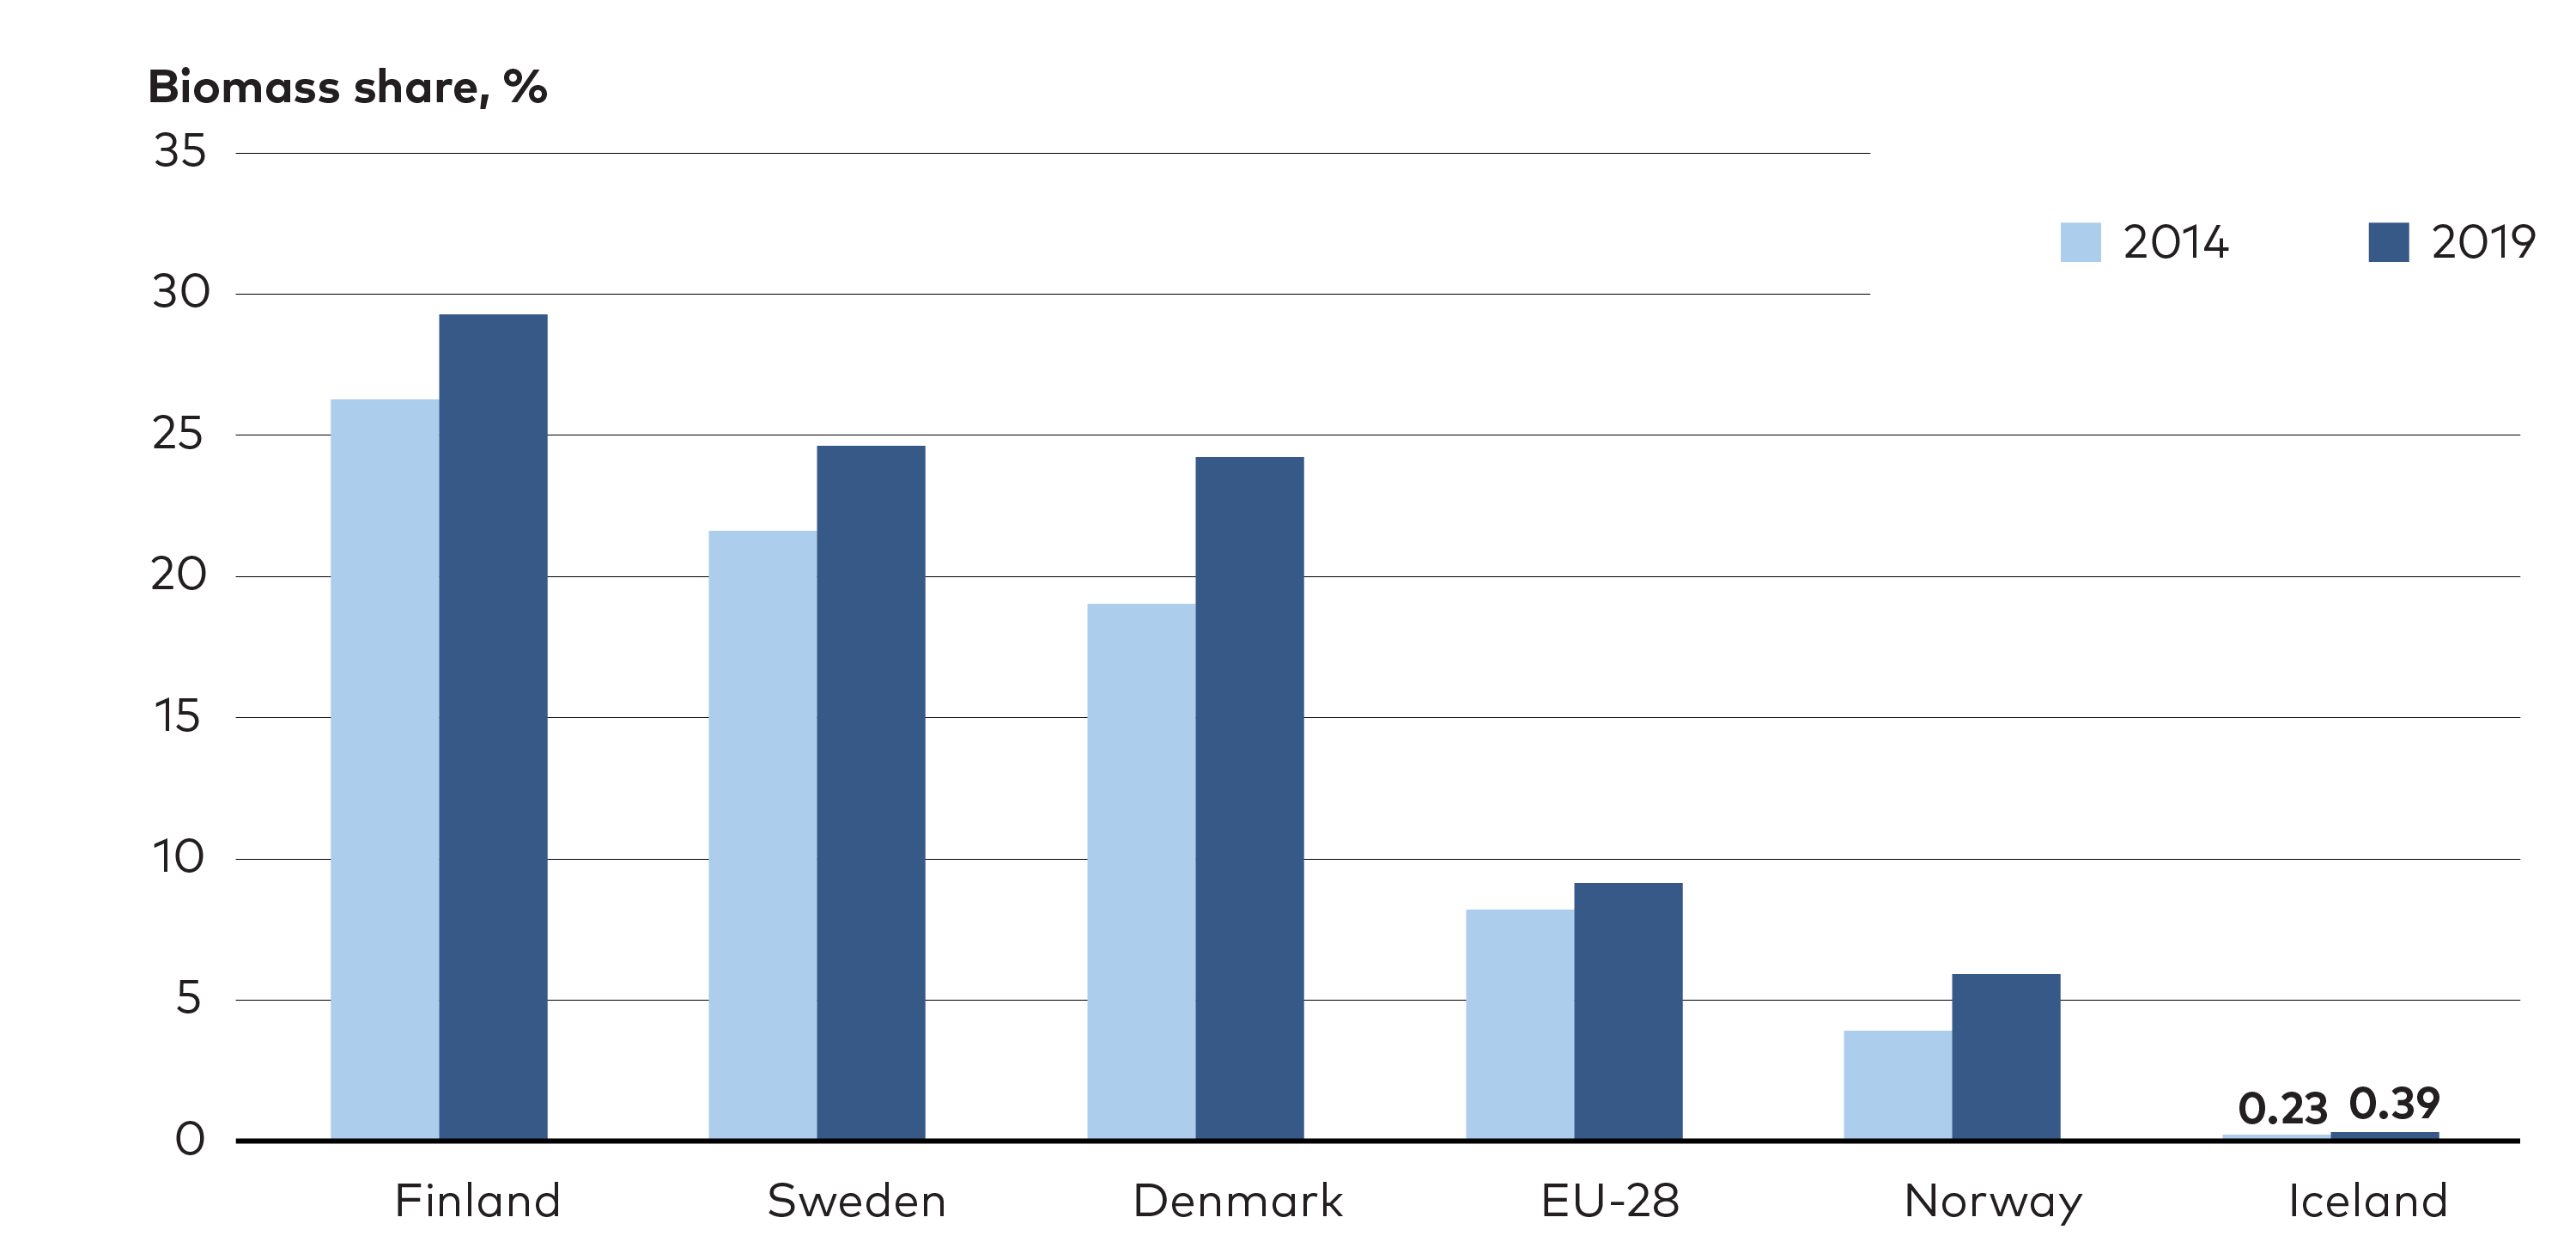
Figure 5.1. Share of biomass of total energy consumption. Use of biomass (including renewable waste but excluding peat) for energy as a share of total gross energy consumption, 2014 and 2019. Source: Eurostat, 2020.
Bioenergy has played a particularly important role in Nordic space heating, where about 45% of the 140 TWh/year of delivered heat in the Nordic district heating sector is based on solid biomass.[1]Eurostat, 2020
In road transportation, biofuels held a 14% share of the total energy consumed in the Nordics in 2019. At a global scale the Nordic biofuel consumption corresponds to 2.2% of the annual world production of biofuel, while the Nordic countries’ share of the world’s total energy demand in transportation is 0.7%.[2]IEA, 2021 The main share of current biofuel consumption is currently based on agricultural crops. It is, however, technically feasible to use forest biomass for biofuel, which will imply less conflicts related to use of land for food production.
5.2 Renewable and storable, but not unlimited
In developing the future carbon neutral energy system, biomass has some distinct favourable properties:
- Biomass and biofuels may be used directly in power and heat plants, and combustion engines.
- May be stored at low costs for long periods of time.
- Can provide negative CO2 emissions when combined with CCS.
5.2.1 Large domestic potentials
Biomass related to forestry and forest industries has the largest potential in the Nordic context. As seen in Figure 5.2, the Nordic biomass potential is estimated to approximately 350 TWh/year. In addition to forest biomass, the estimated potentials of agricultural biomass and waste biomass amounts to approximately 80 and 40 TWh/year.[1]Pöyry and Nordic Energy Research, 2019. The study on biomass potential, carried out by Pöyry and Nordic Energy Research, was conducted as an expert survey where theoretical potentials for certain wood and agricultural residues as well as waste was estimated for each country. For forest biomass the assessed categories were black liquor, chips, bark, sawdust, harvesting residues, stumps, and small diameter wood. For agricultural residues the categories were energy crops, straw and husk, grasses, and manure.
Footnotes
- ^ Pöyry and Nordic Energy Research, 2019.
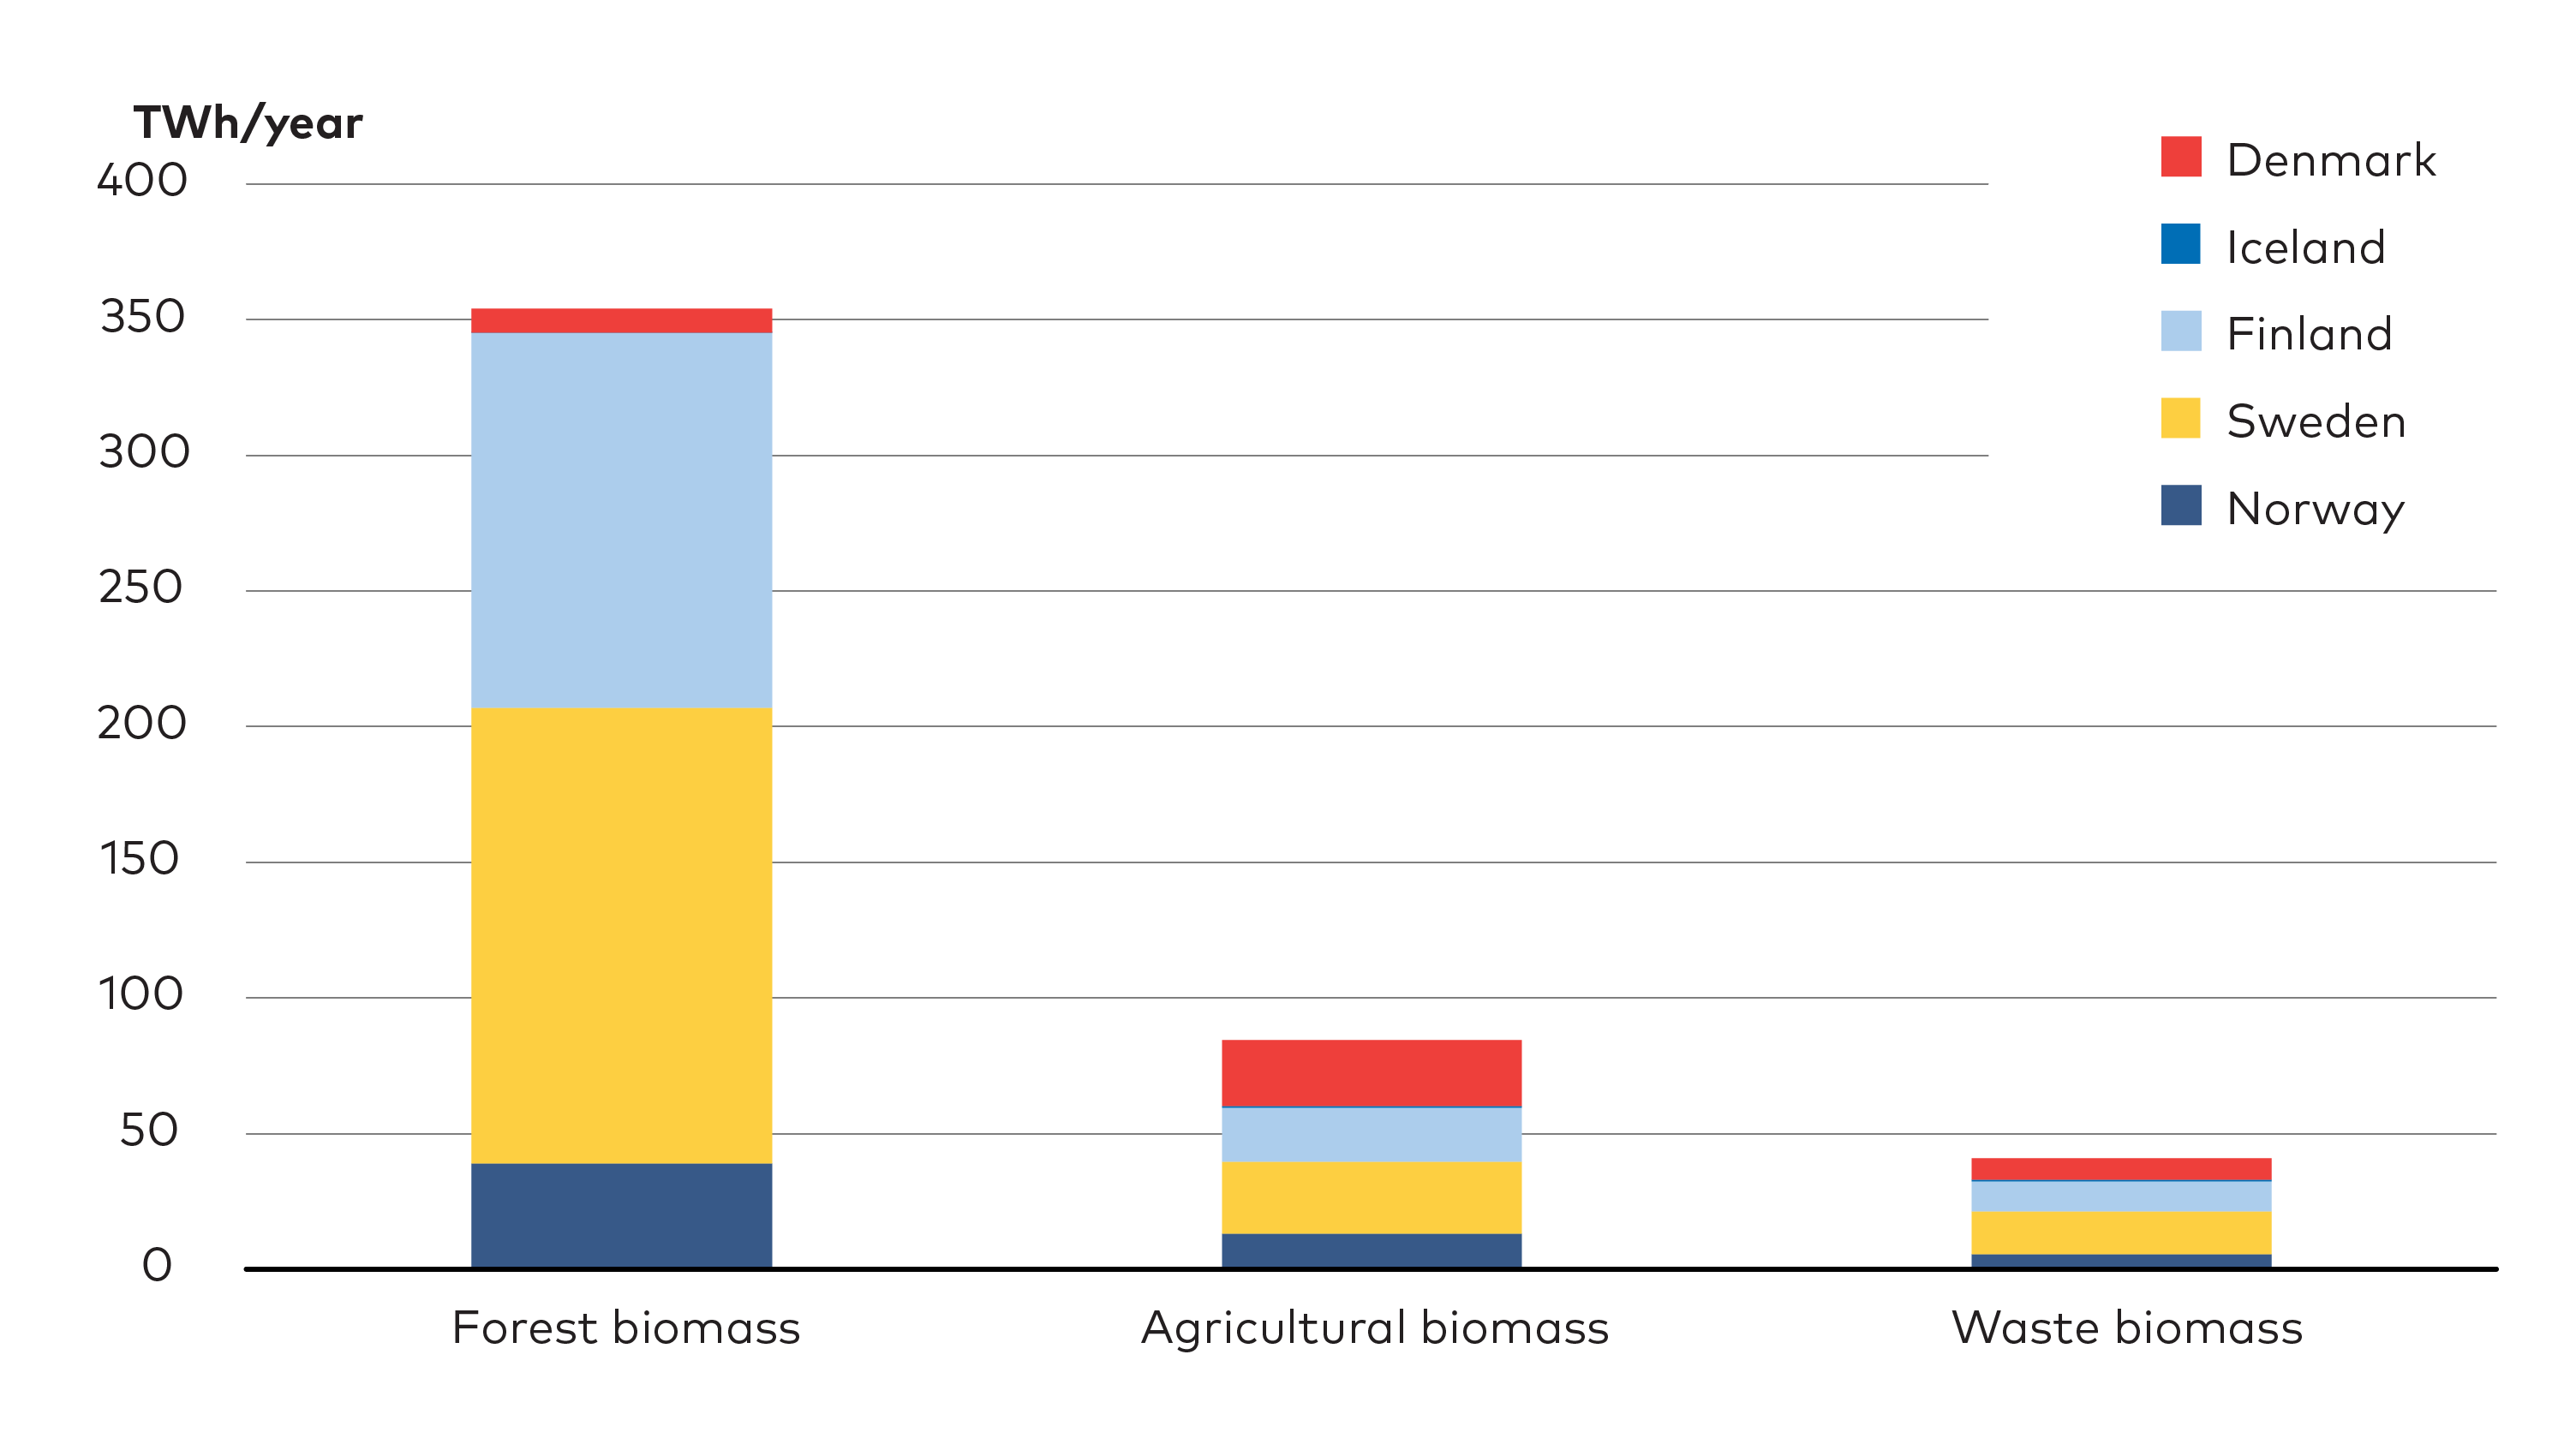
Figure 5.2. Bioenergy potentials. Nordic bioenergy potentials split by source and country. Source: Pöyry & Nordic Energy Research, 2019.
5.2.2 Forest residues the main resource
Although biomass is a RE source, it is not unlimited in its potential. Also, unlike other RE solutions like hydro, wind, and solar power, biomass for energy may directly compete with other industrial uses like pulp, paper, boards, and green chemicals.
In Figure 5.3 the forest biomass potential is split into various biomass categories where most of the reported potentials comes from biomass grades that have few other applications other than energy production. For harvest residues and small diameter wood, only a fraction of the potential is currently utilised. The black liquor potential is to a large extent already used for energy production. It is important to highlight these resource potentials, since, from both a climate and wider sustainability perspective, wood biomass used for energy should mainly be based on residues from forest operations and industries. Indeed, due to long rotations of Nordic forests, the GHG mitigation effect of using wood biomass harvested solely for energy purposes may have a time lag of many decades.
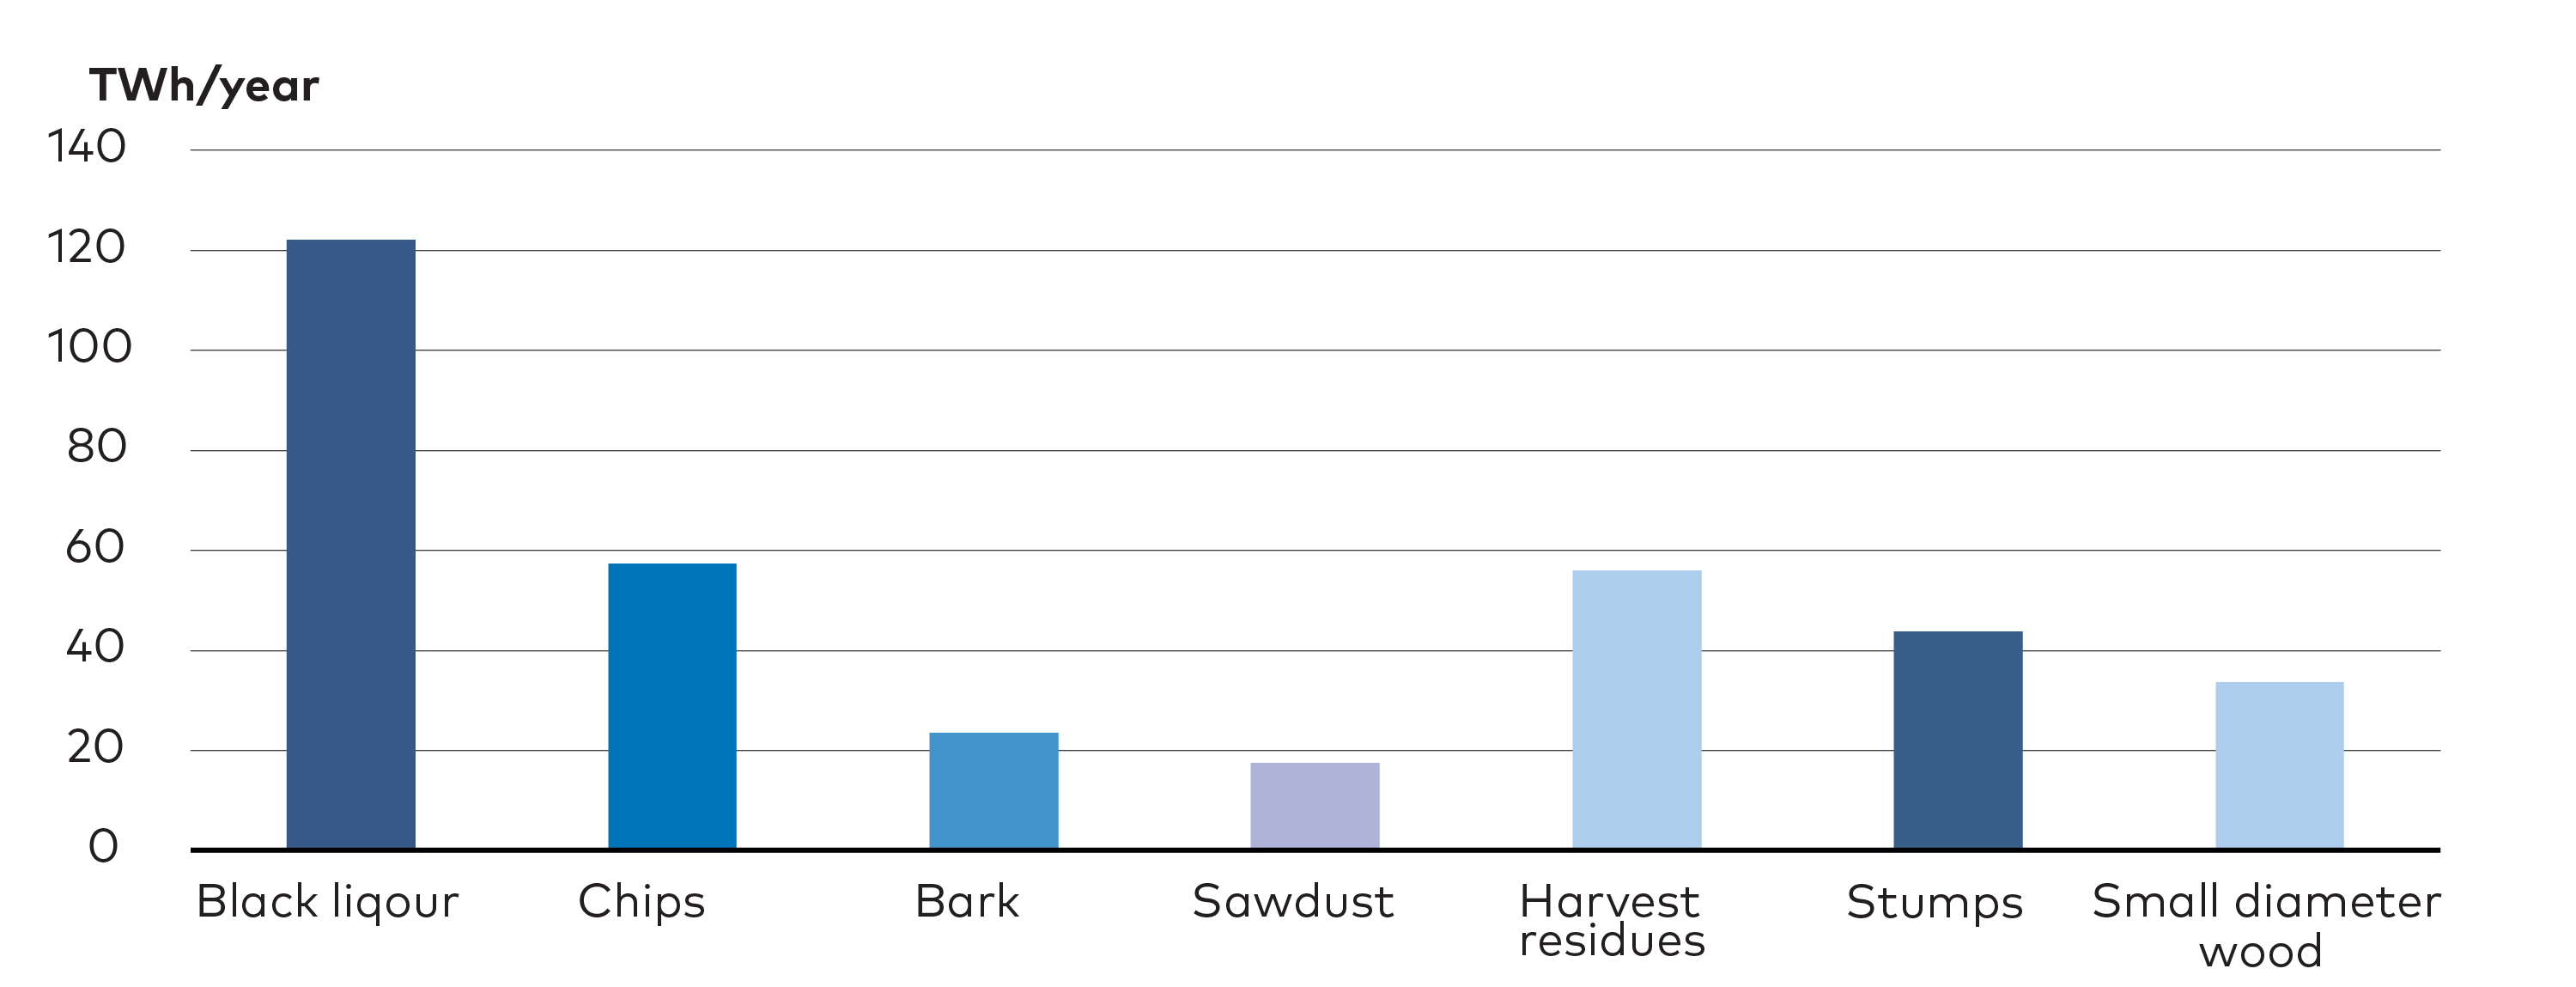
Figure 5.3. Wood-based bioenergy potentials. Nordic wood-based bioenergy potentials divided between main biomass sources. Black liquor is a by-product from kraft pulping, which mostly contain lignin and other extractives. Source: Pöyry and Nordic Energy Research, 2019.
5.2.3 Future potential largely dependent on forestry and forest industry developments
When assessing the future, long-term role of Nordic bioenergy there are, in addition to economic competitiveness, two critical aspects to address:
-
Future resource availability - since it is a renewable but not unlimited resource.
-
Expected development of forest industrial production since biomass for energy should mainly be based on residues and waste resources from other forest industrial production. At the same time, bioenergy may also experience competition from other applications of low-quality wood biomass.
As seen in Figure 5.4, the annual growth of Nordic forests has been well above the annual harvest for several decades, implying a steadily increasing growing stock of wood biomass. The standing stock of wood has increased more than 50% since the mid 1970-ies indicating an increasing potential also for wood bioenergy. The sixty years of history shown in Figure 5.4 suggests that the volumes of forest biomass will increase further in the coming decades. However, there is also increasing attention towards other ecosystem services from forest areas which limit wood resource availability for harvesting.
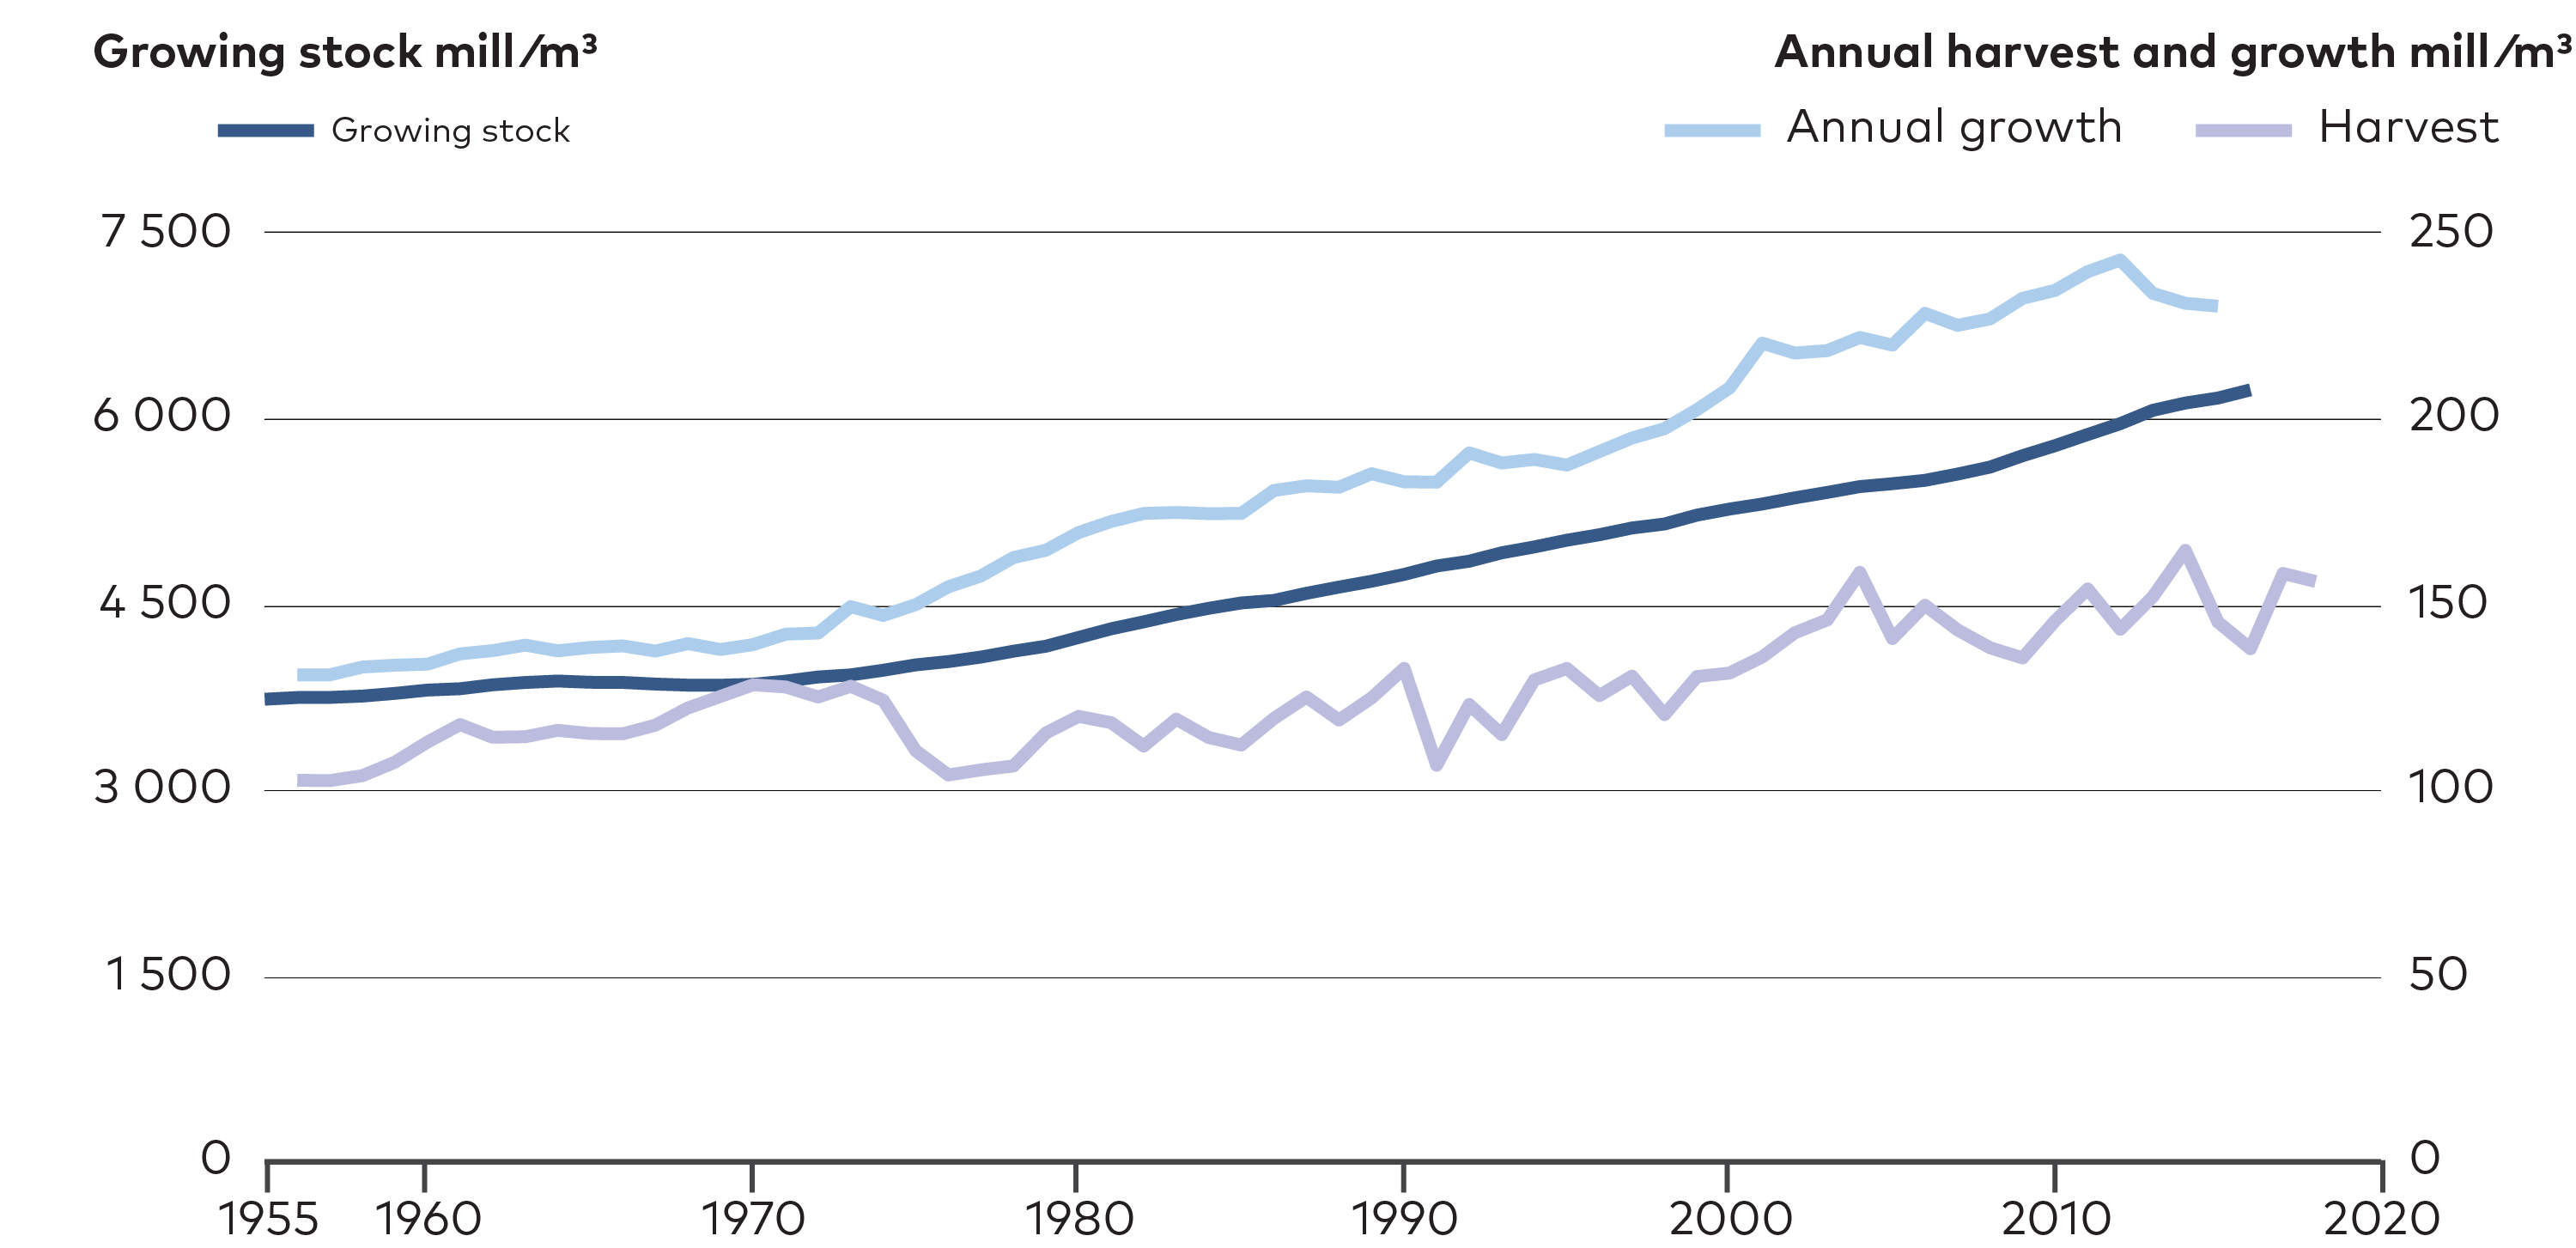
Figure 5.4. Annual growth of Nordic forests. In this graph, the annual forest growth in the Nordic countries Norway, Sweden, and Finland is displayed along with yearly harvest levels shown on the right axis. The difference between these two factors cause the trend of growing stock shown in the left axis. Source: Jåstad, 2020.
On the wood demand side, the forest industry is undergoing a major transition where demand from printing paper industries is declining. Despite this decline there is an increasing demand for wood pulp, the major raw material used for production of paper, from pulp mills in Sweden and Finland. This growing alternative demand for wood pulp will be further explored together with the scenario results.
5.3 The role of bioenergy shifts from heat and power to a large palette of applications
In the NCES scenarios, biomass for heating still plays an important role as supplement to electricity in the future energy system but the model results also show that there is need for biomass in other sectors like transportation and power intensive industries in deep decarbonisation scenarios. Bioheat production may therefore be challenged due to increasing competition for biomass in the long-term. While biomass for power and heat may decline, biomass use for liquid biofuels is expected to continue increasing. Illustrating the increase in biomass demand, Figure 5.5 shows the historical biofuel consumption in the Nordics as well as modelled biofuel consumption in the CNN scenario to 2050.
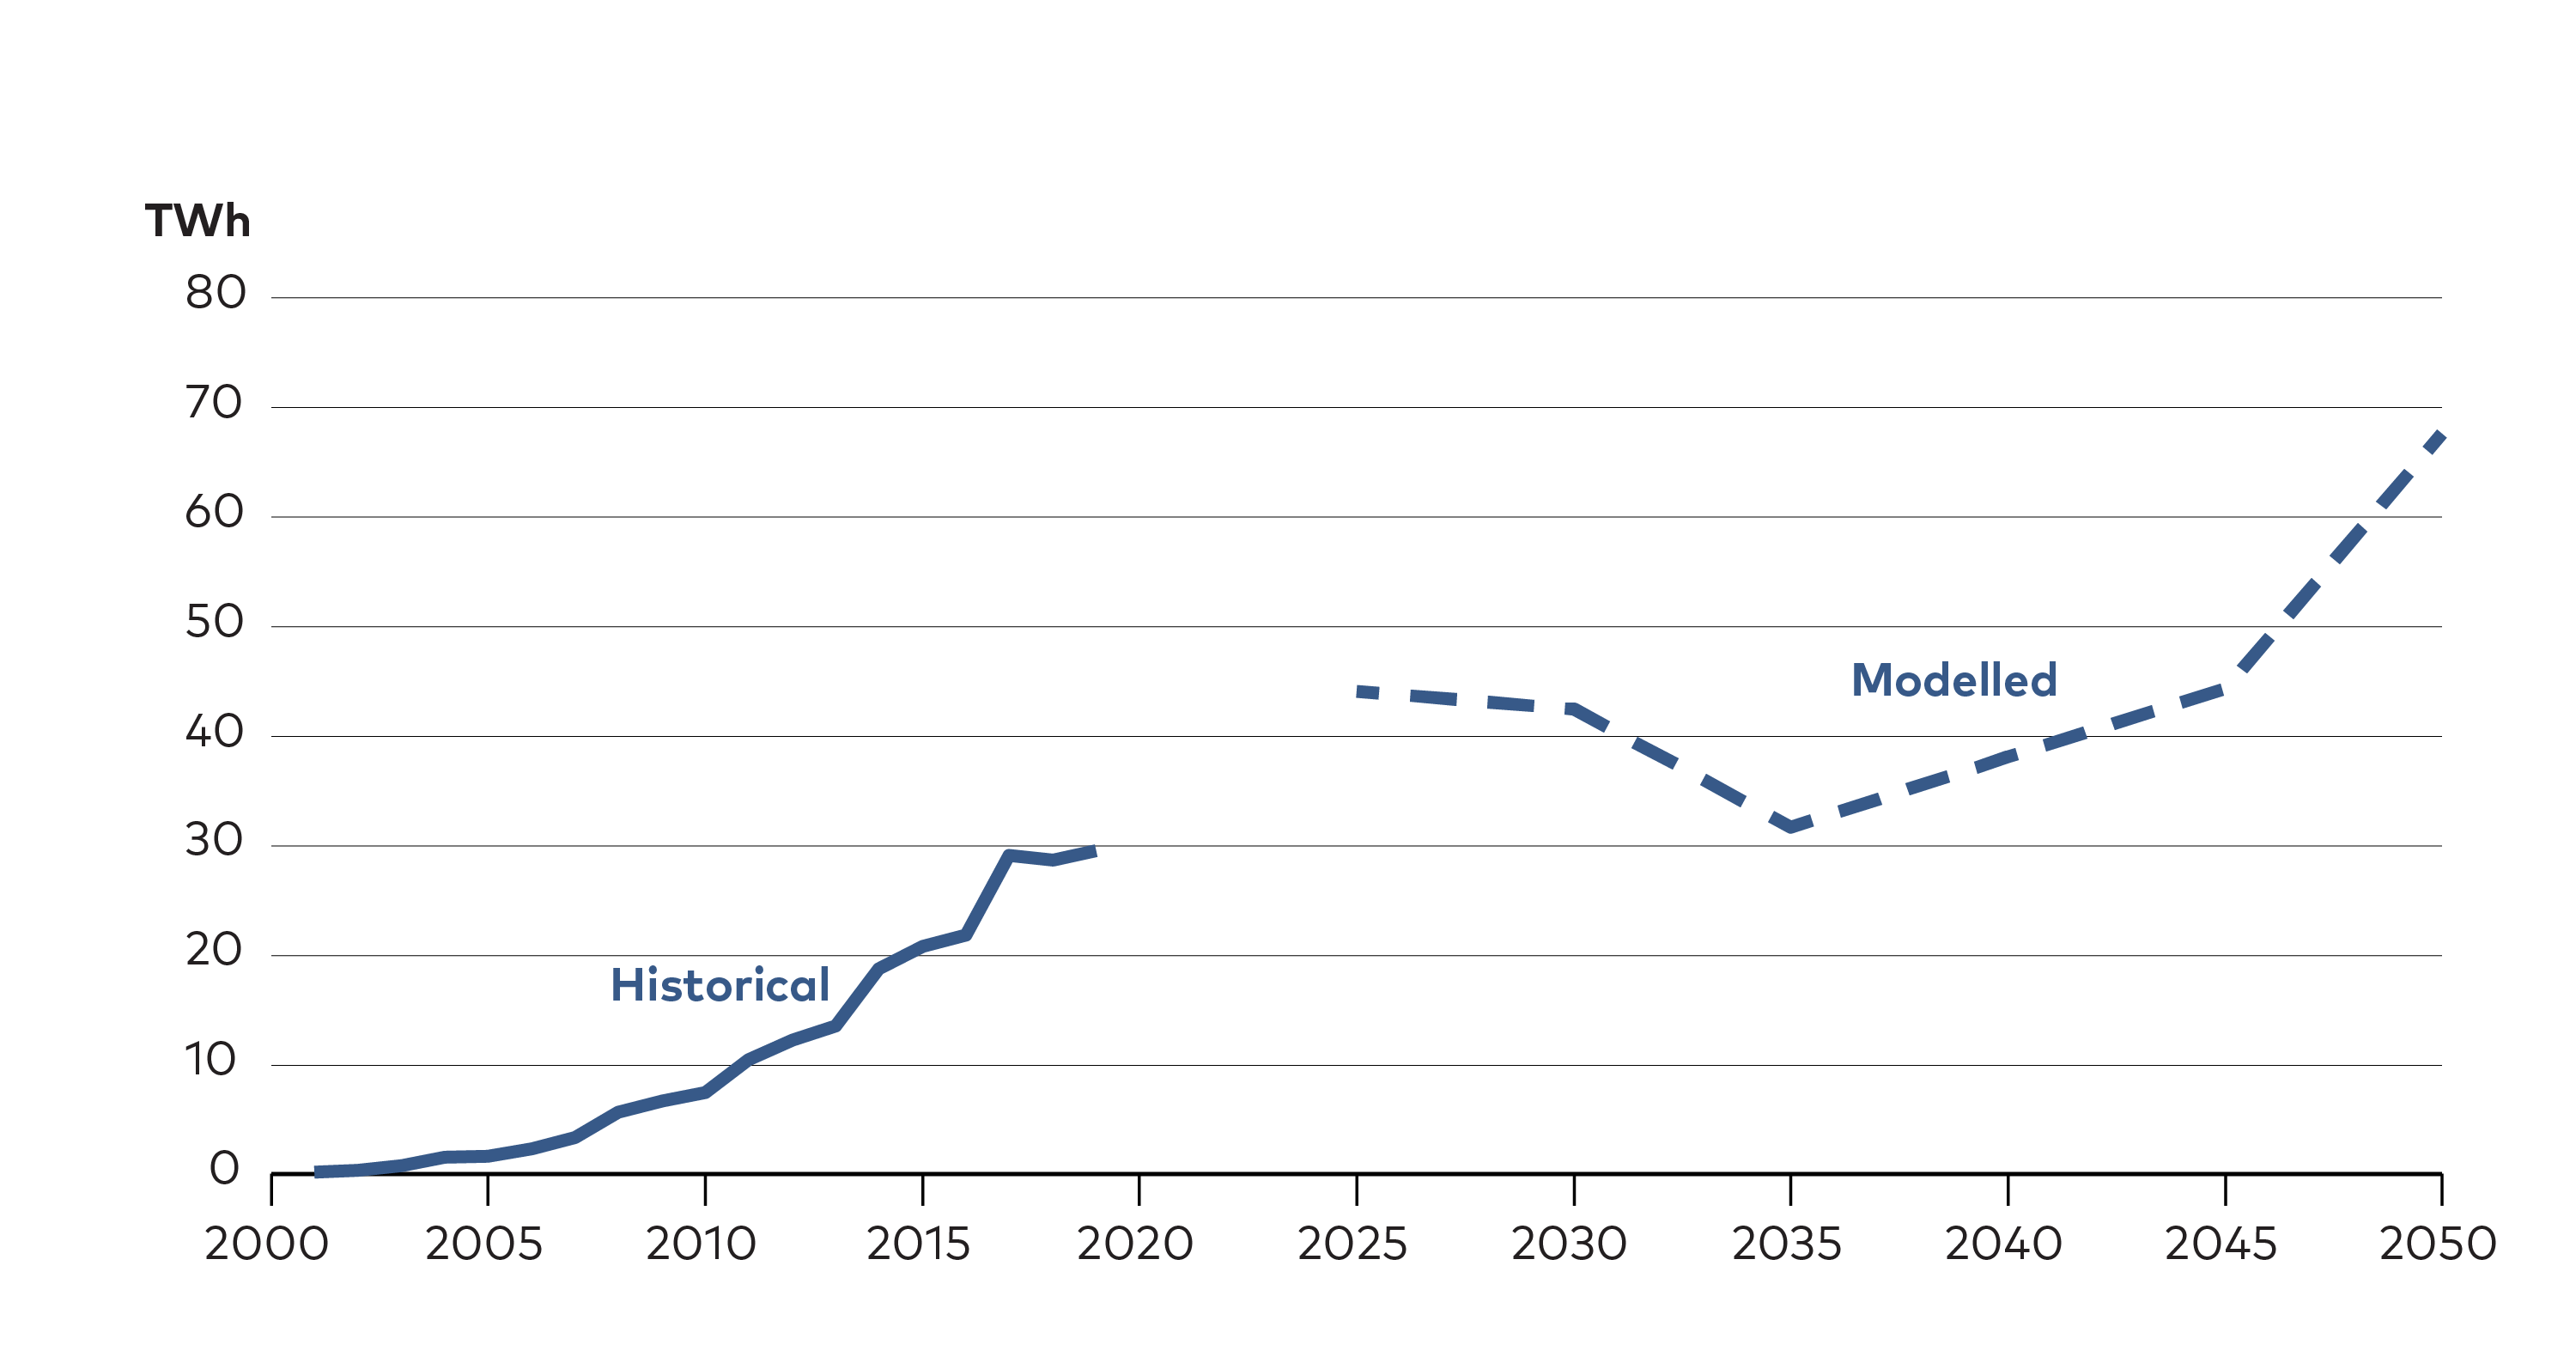
Figure 5.5. Forest-based biofuel demand continuously increase. Historical biofuel consumption in the Nordic countries for the period 2000-2020, and modelled biofuel consumption after 2025 show a significant increase in biofuel demand during the period.
5.3.1 Total bioenergy use will slightly increase to 2050
The model results from the CNN scenario shows that total bioenergy use is increasing slightly towards 2050, reaching a level just above 400 TWh in 2050 (Figure 5.6). The growth is driven by a large increase in bioenergy use for transportation and industry sectors, while bioenergy use for heating and power generation is decreasing.
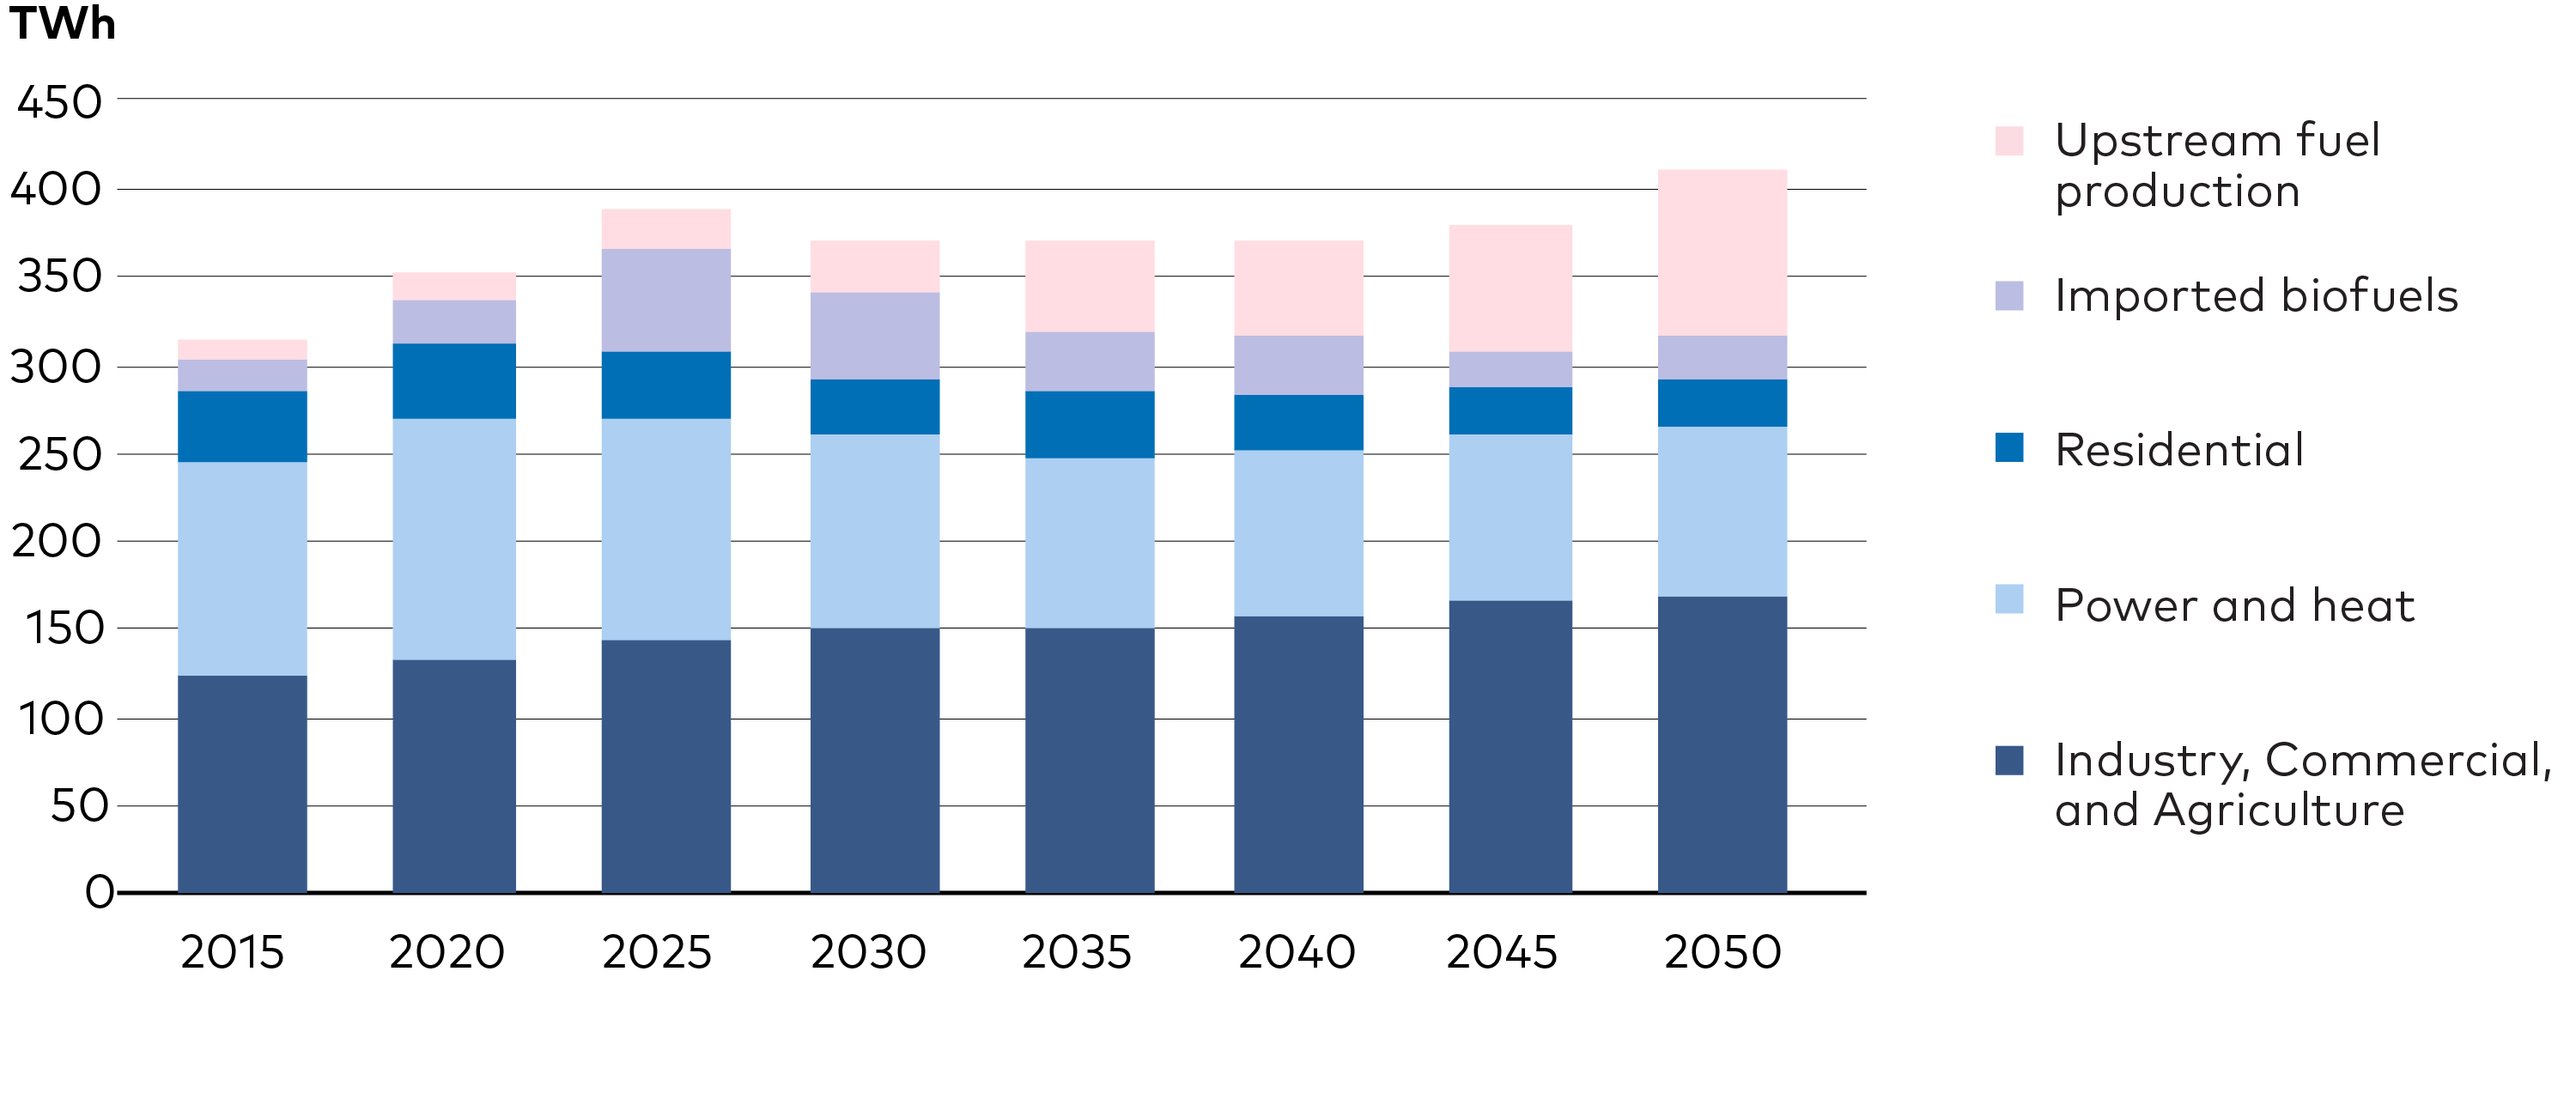
Figure 5.6. Total bioenergy use - CNN scenario. Modelled bioenergy use divided on main end-use sectors (TWh).
As seen in Figure 5.7, wood biomass, including black liquor, remains the main resource of Nordic bioenergy to 2050 in the scenarios. The scenarios also show an increasing use of agricultural biomass, while waste resources are utilised according to availability through the period.

Figure 5.7. Use of biomass shifts from power and heat towards upstream applications. Biomass resources used in different end-use sectors (TWh).
5.3.2 Biofuels filling the gap in transportation
Compared to the NETP2016 report, the CNN scenario show higher biofuel consumption for road transport in 2030, increasing from 14 TWh in NETP2016 to 41 TWh in the CNN. However, the modeled use of biofuels for transportation in 2050 is significantly lower in the CNN scenarios than it was in NETP2016. In the NCES CNN scenario, the use of biofuels as drop-in for diesel and gasoline increases to 43 TWh by 2025 which is a significant increase from the approximate 28 TWh in 2019 (Figure 5.8). From 2030 the scenarios suggest a decline in use of biofuel for road transportation due to heavy electrification. While electricity becomes the major energy source in road transportation during the 2030’s, biofuel remain a major renewable alternative in shipping and aviation. In CNN, biofuel consumption in aviation, biokerosene, increases from 2 TWh in 2030 to almost 31 TWh in 2050, corresponding to 72% of the liquid fuel demand in aviation in 2050. Overall, the NCES scenarios indicate a relatively firm demand for biofuels in the period 2030-2050, which point out the need for major investments in biorefineries/biofuel plants to meet projected demand levels by domestically produced biofuel.
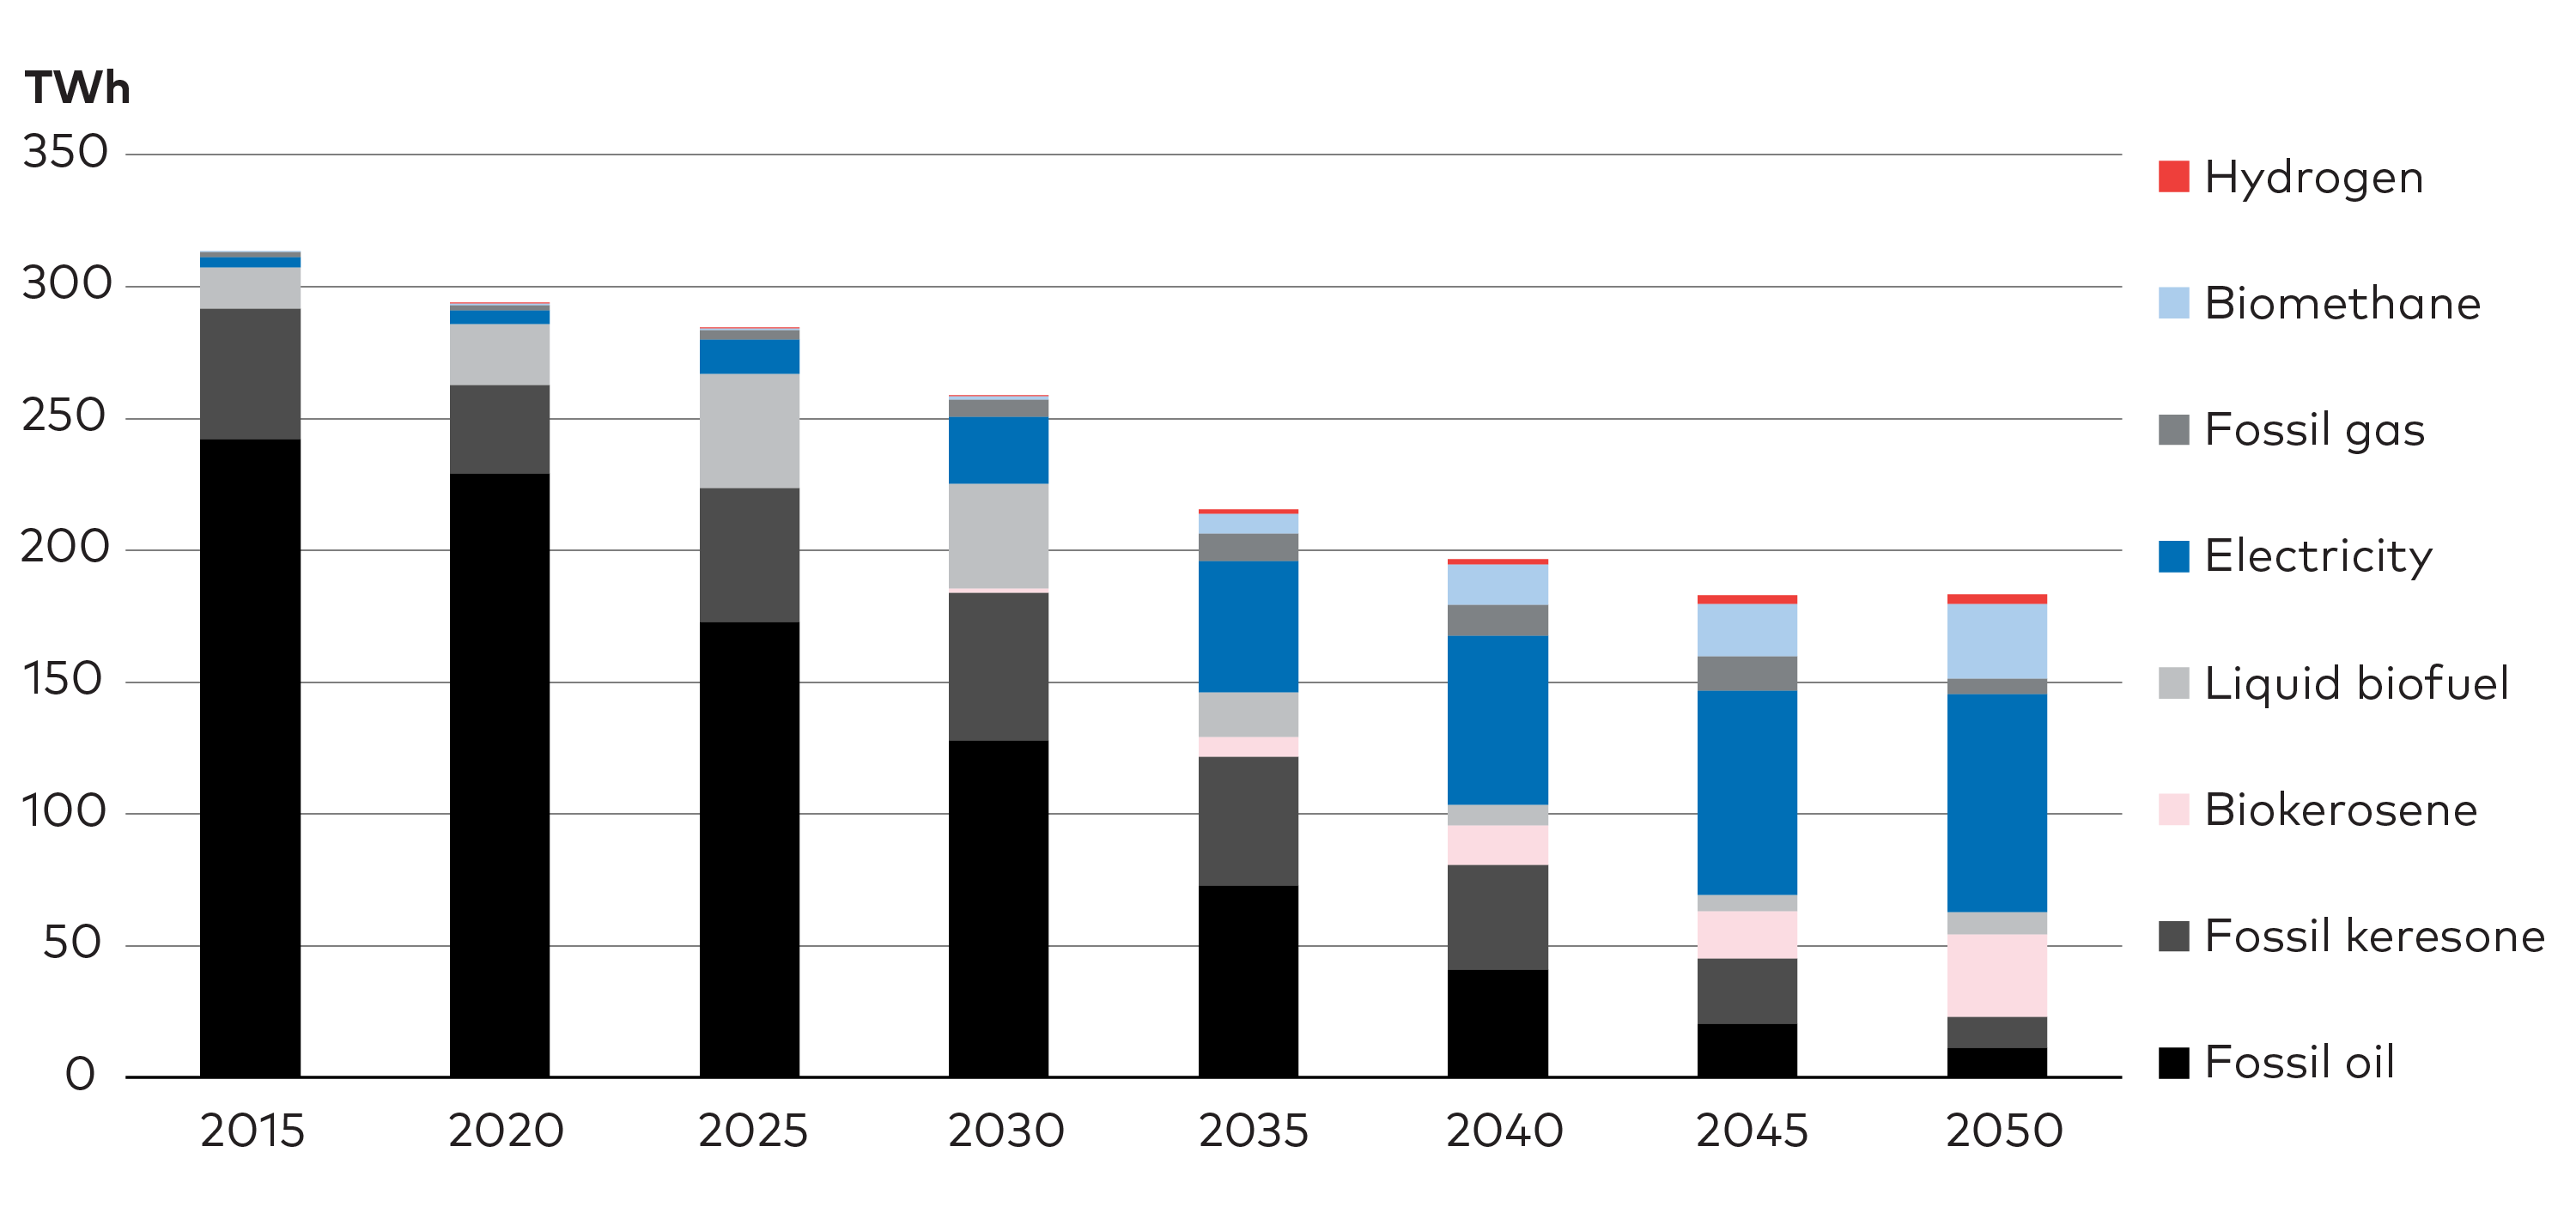
Figure 5.8. Transport fuel consumption. Fuel consumption for all transport in the Nordic countries, incl. international aviation and shipping from the ON-TIMES model CNN scenario.
5.3.3 Biomass and biofuel imports can be avoided, but costs would increase
Biomass and biofuel may be exported and imported at relatively low costs. In the CNN scenario, the Nordic countries are importing a rather minor share of biomass, varying from from 51 TWh to 78 TWh of biomass for energy (Figure 5.9). However, to account for a possible substantial increase in global biomass demand, we have added a sensitivity option to each scenario where allowed import of biomass and biofuels are linearly reduced from today’s import level to zero in 2040. In addition, the total Nordic biomass potential for energy is also reduced by 25% in 2040 to hedge for other uses of biomass in the future.
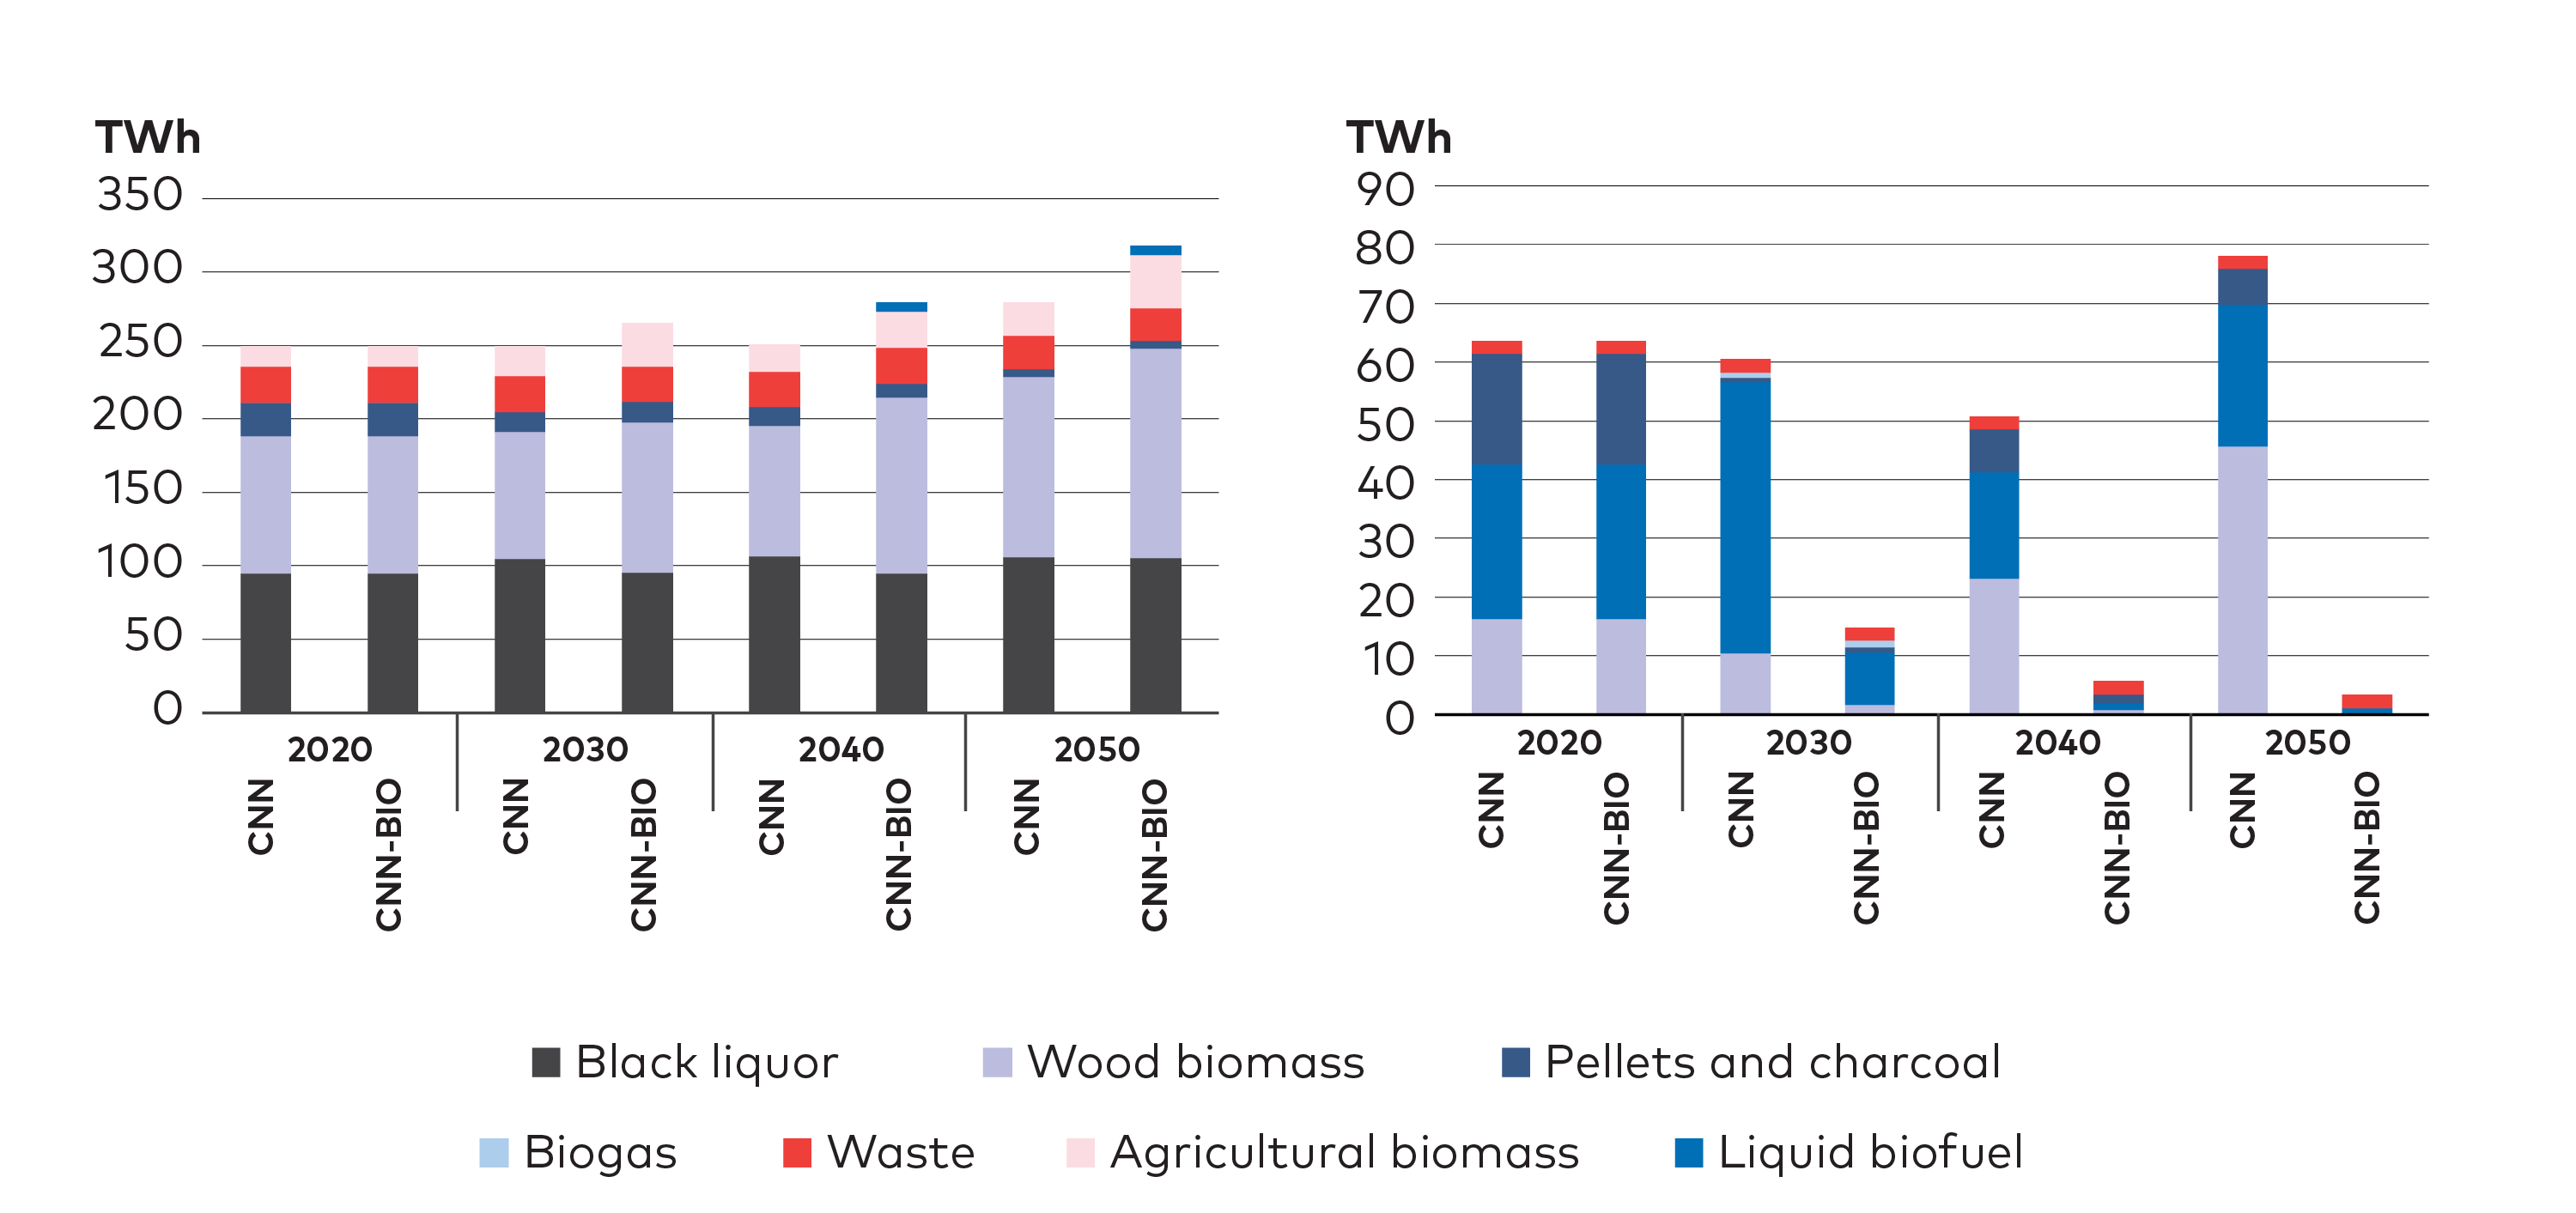
Figure 5.9. Primary domestic biomass supply. Biomass primary supply from domestic resources in the Nordic countries, left panel, and import/export of biomass and biofuels, right panel. The two bars for each year represent the CNN scenario, left bar, and CNN-BIO with bioenergy constraint, right bar.
The model results show that consumption of bioenergy is relatively similar across all NCES scenarios, including when domestic potential and imports are restricted. Given strong electrification of transport and heating, this indicates that biomass resource for energy in the Nordic countries are sufficient for a substantial contribution towards a carbon neutral energy system. However, in the scenarios allowing no biomass import, more local biomass resources like harvest residues are utilised at a somewhat higher cost. As such, the sensitivity analysis show that bioenergy import is driven largely by cost differentials rather than physical limitations. However, it should be noted that some of the Nordic biomass residuals are more difficult or expensive to utilise for energy and fuel production than wood chips and wood pellets, causing a demand for imported biomass. Also, in the CNN-BIO scenario there is an increase in PtX plants but the expected renewable fuel output develops similarly (Figure 5.10).
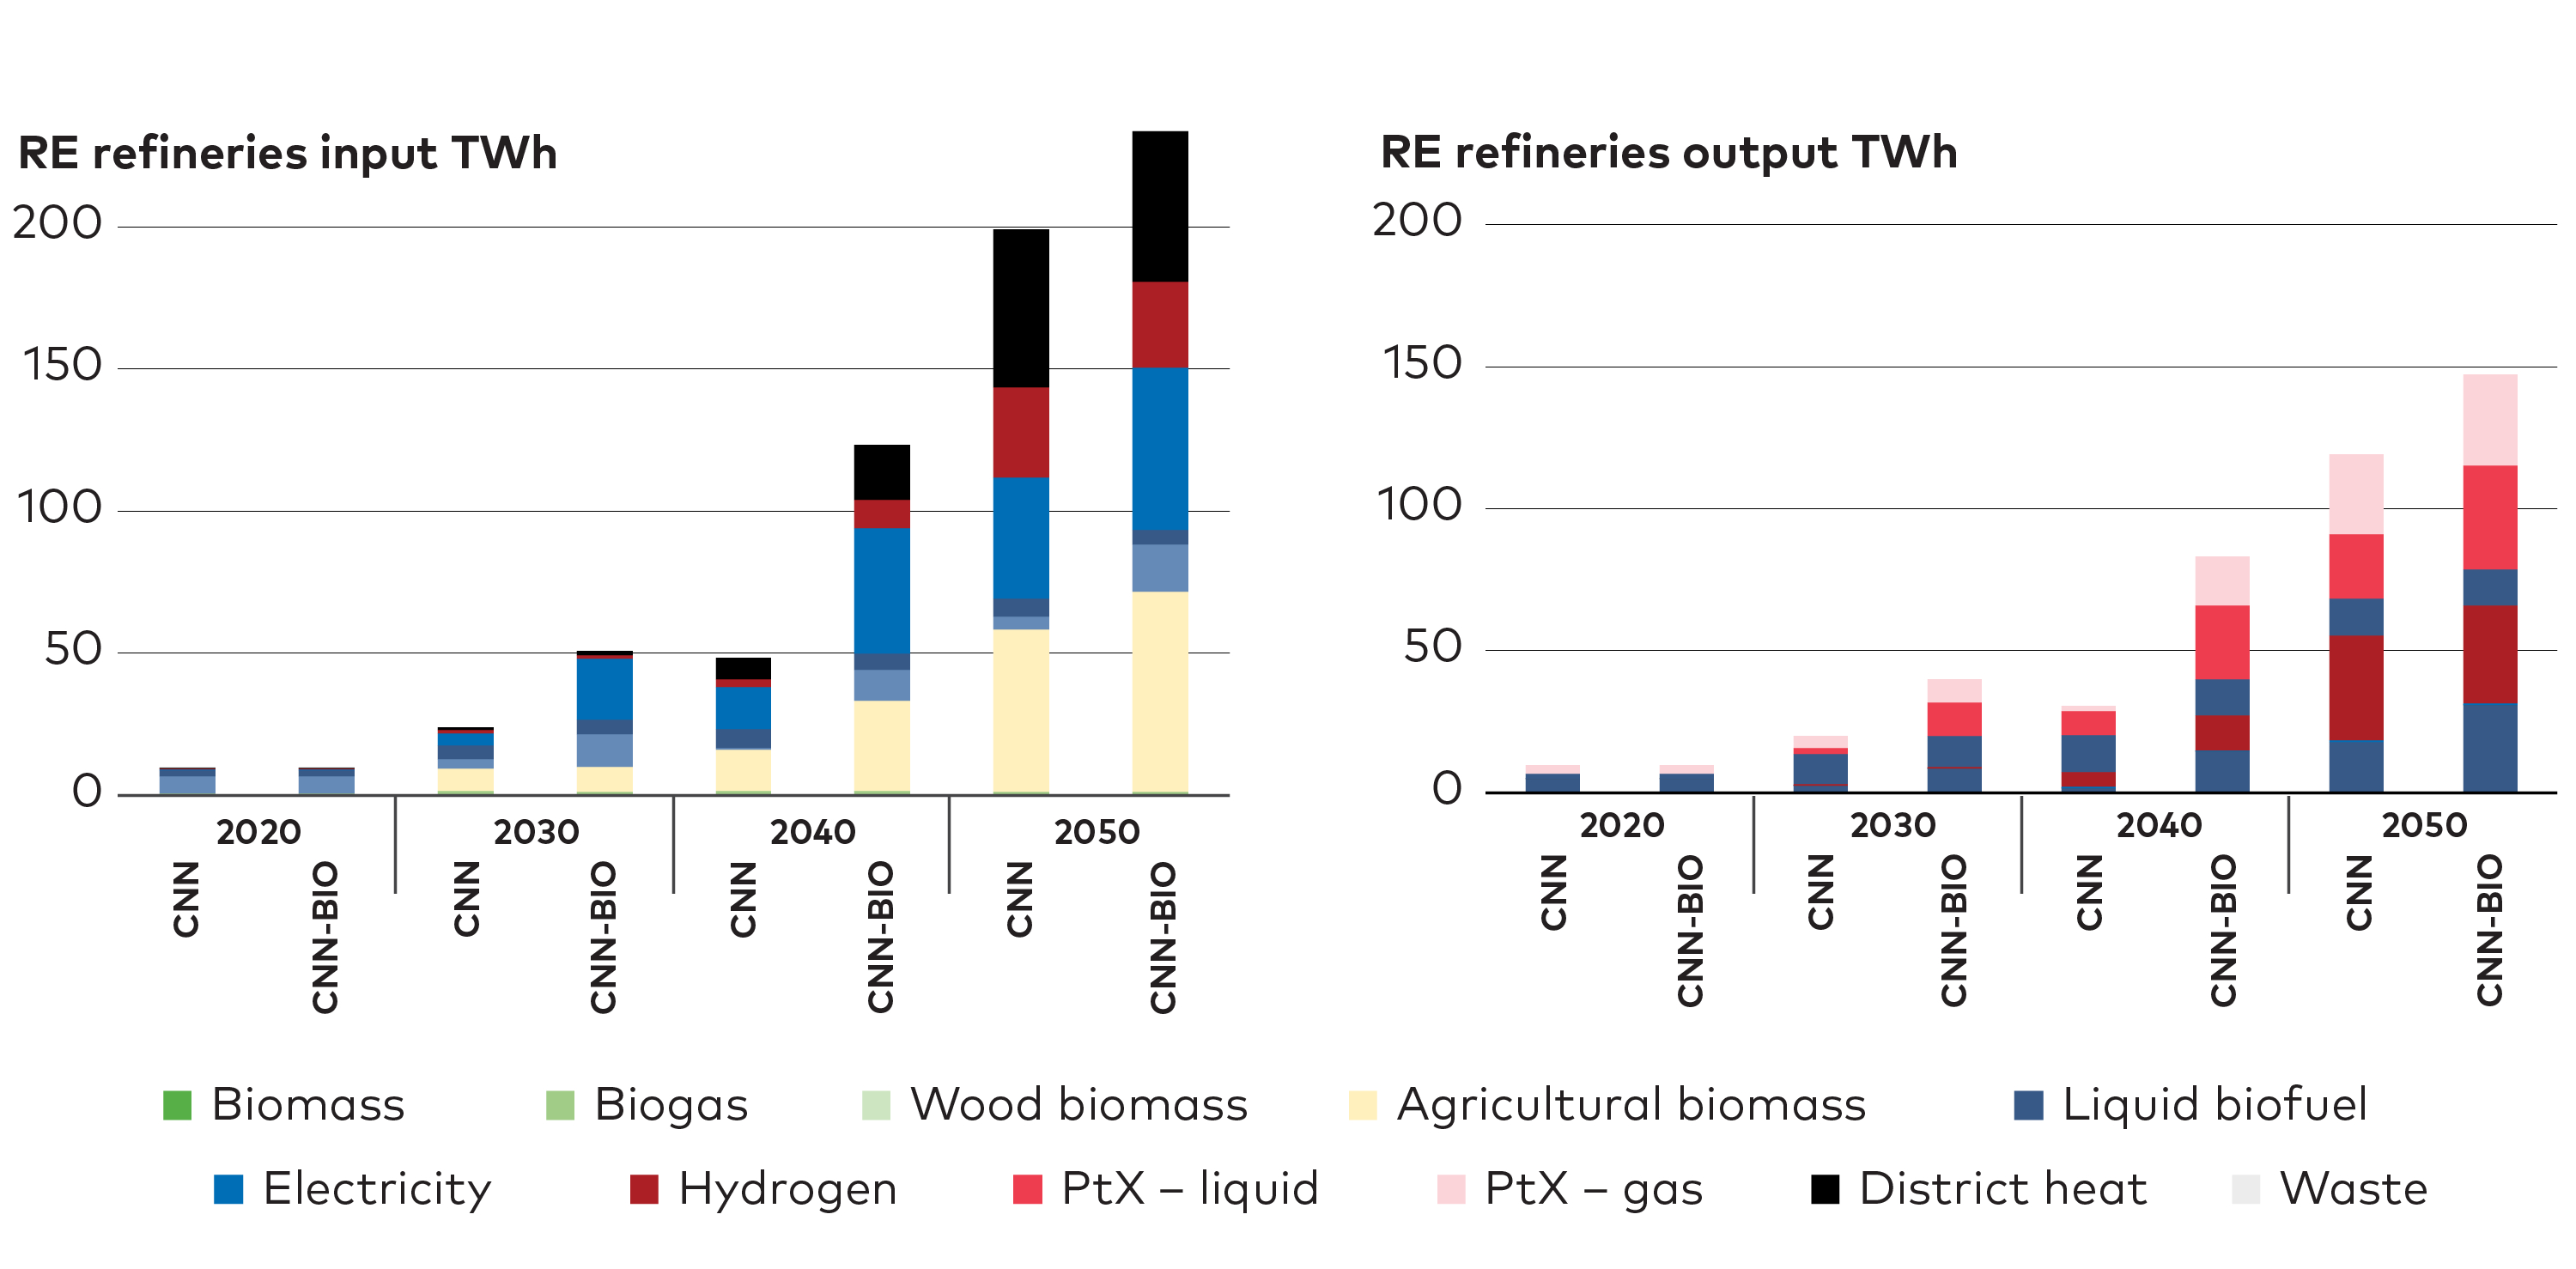
Figure 5.10. Limitations in biomass for bioenergy increases demand for PtX. Feedstock input to renewable refineries, bio-refineries, and PtX, in the CNN scenario are shown in the left figure. To the right is the output in the form of biofuels and E-fuels. The left bar in each year represents the CNN scenario while the right is CNN-BIO with added bioresource constraint where Nordic countries are not allowed to import biomass or biofuel after 2040 and national biomass potentials are reduced by 25%.
5.4 Large scale biorefineries will still require significant support and development
Analysis of the most prominent forest-based biofuel technologies indicate that fast pyrolysis and hydrothermal liquefaction (HTL) appear to be the most promising technologies from a cost per GJ perspective, see Figure 5.11.
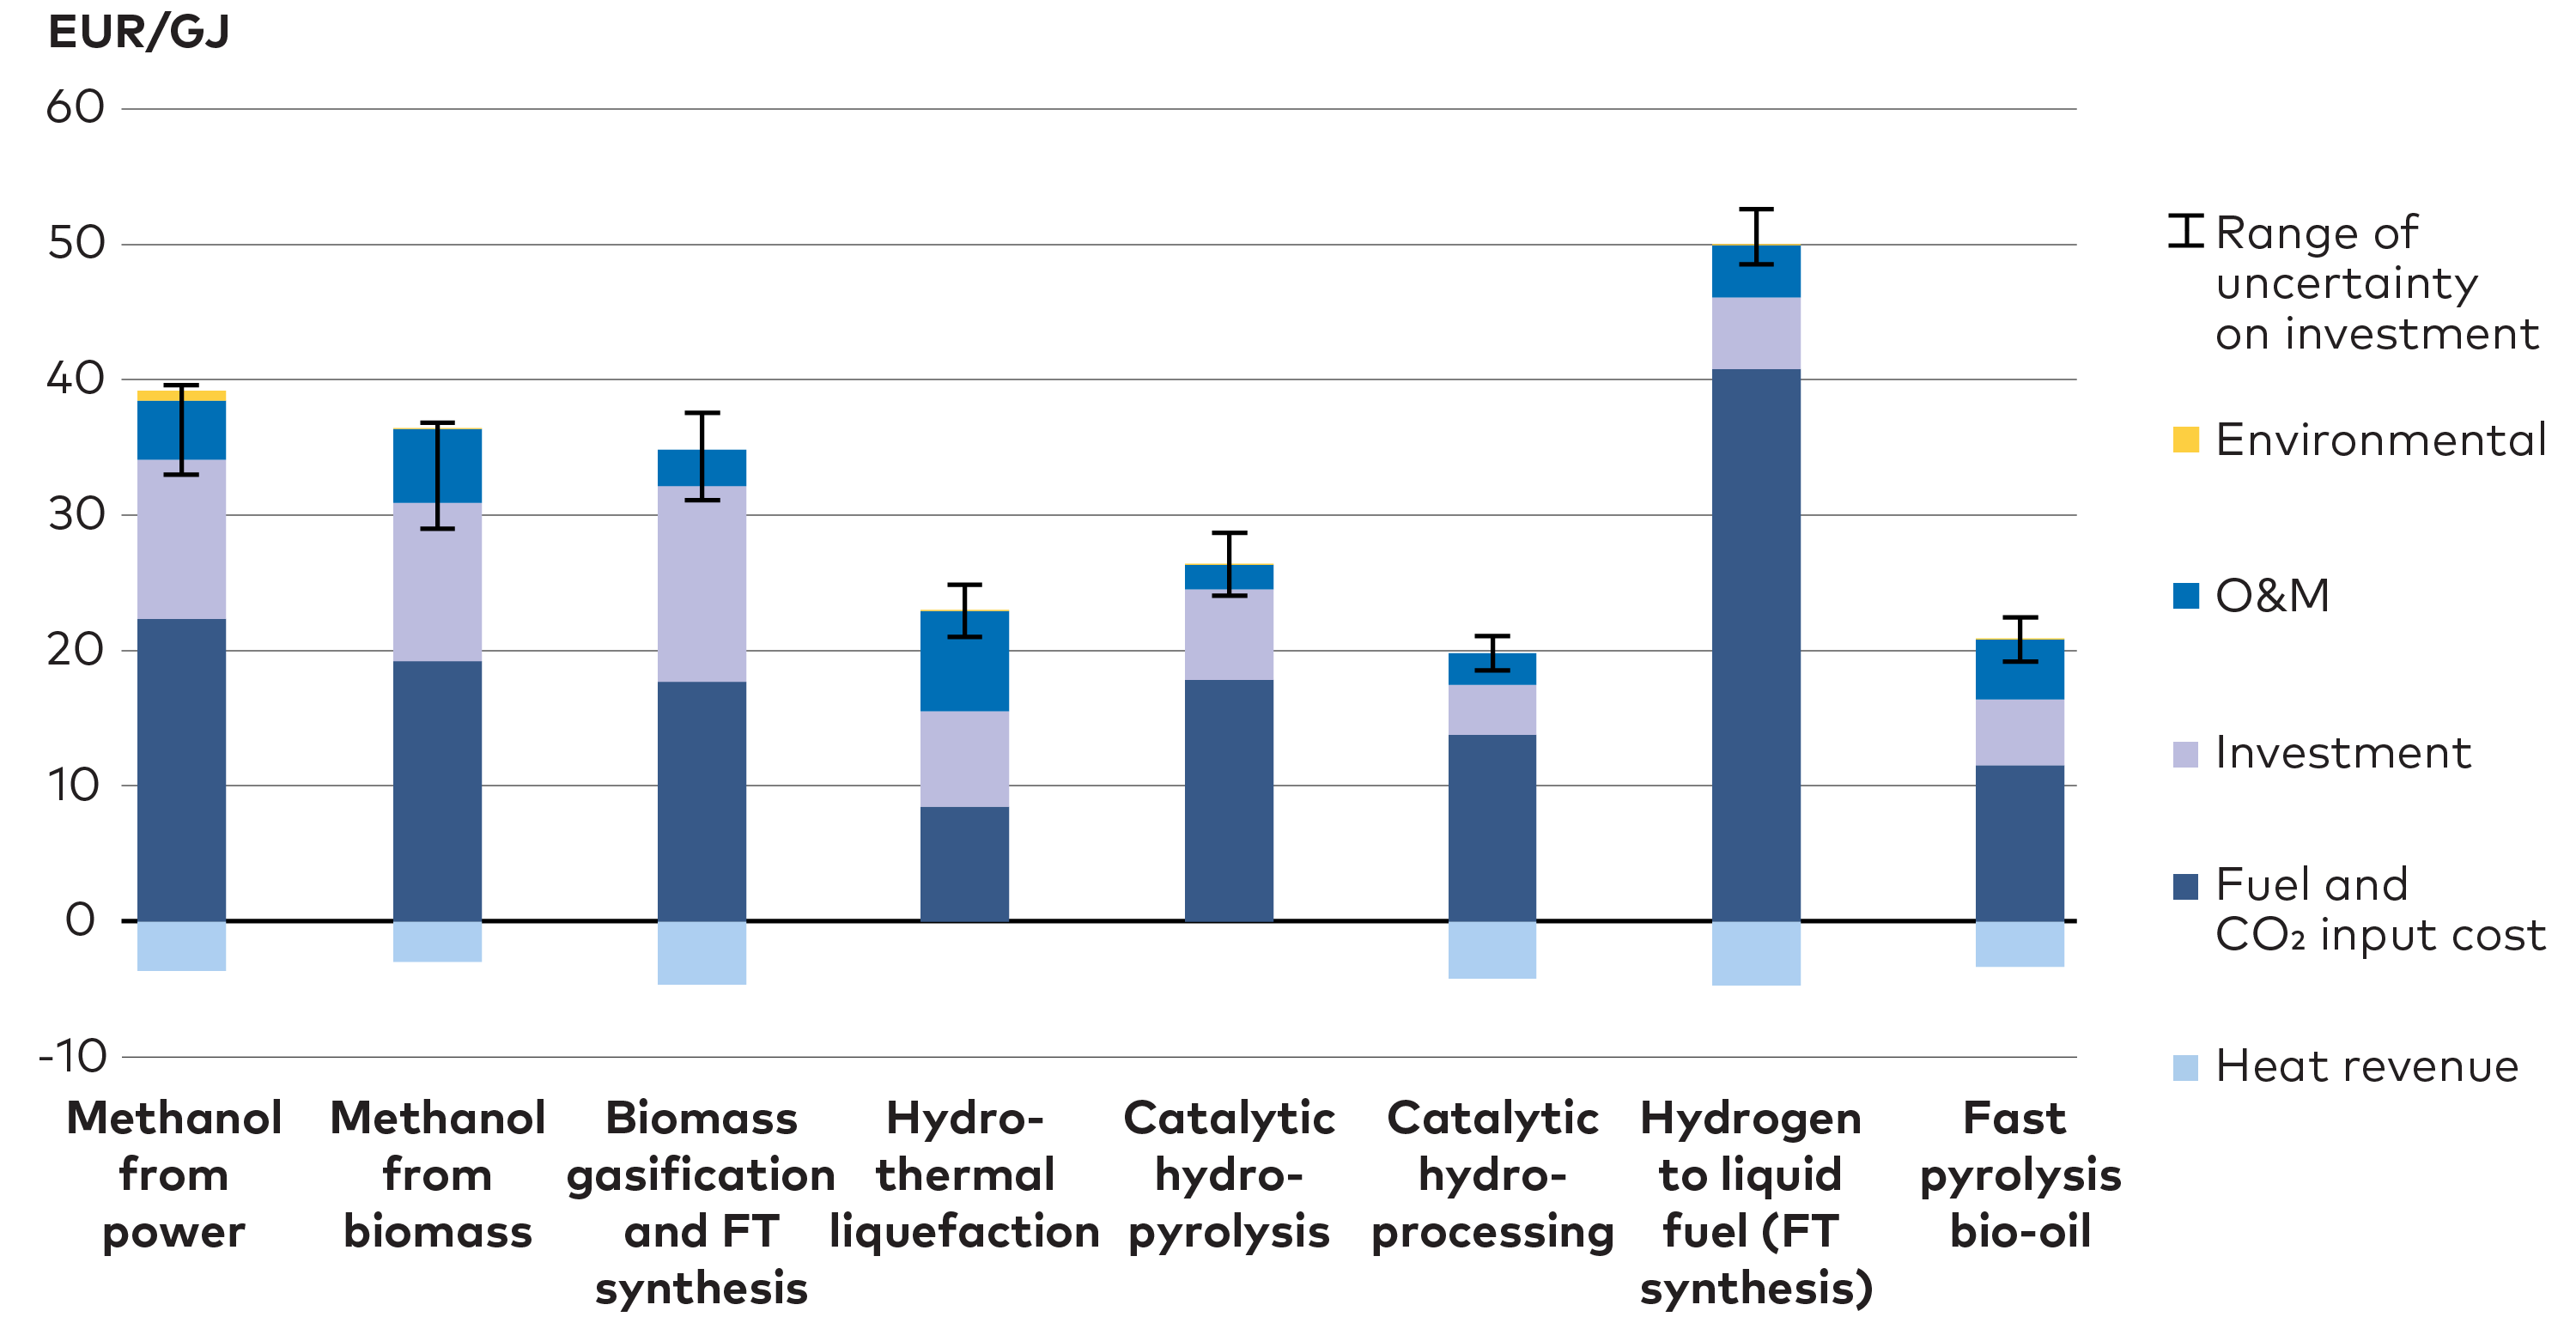
Figure 5.11. Levelized cost of fuel - 2030. Levelized cost of fuel production from Nordic Clean Energy Technology Catalogue. Comparing the different pathways to bio- and E-fuels included in the ON-TIMES model.
BIOFUEL AND E-FUEL TECHNOLOGIES
-
Methanol from power is based on a process where electricity and CO2 are used to produce methanol.
-
Methanol from biomass may be produced via anaerobic metabolism by different bacteria, or from syngas (e.g. CO, CO2, and H2).
-
Biomass gasification and FT synthesis. Gasification of biomass happen when biomass is heated up to high temperatures, around 800-1300 °C, with low amount of oxygen resulting in a syngas (e.g. CO, CO2, and H2). After gasification, the syngas is sent over to a Fisher-Tropsch reactor where CO and H2 is used for making artificial fuel. Fisher-Tropsch synthesis can be used for producing a large variety of liquid fuel by controlling the fraction of H2 and CO2 in the syngas.
-
Hydrothermal liquefaction is a biofuel technology which utilise the property of water near its critical point, i.e. moderate temperature, around 200-300 °C, and high pressure, 10-25 MPa.
-
Hydrogen to liquid fuel (FT synthesis) is a process where power is used for producing hydrogen and together with CO2 is used in a Fisher-Tropsch synthesis to produce different types of liquid fuel.
-
Fast pyrolysis bio-oil is a gasification technology with absence of oxygen and a short reaction time which will give a large content of liquid biomass. The liquid biomass, bio-oil, need to be upgraded to be used as biofuel.
The costs shown in Figure 5.12 indicate that renewable fuels are dependent on either tax on fossil fuels or support in production. The huge investments needed for new green refineries, both for biofuels and PtX, will need support to get started and favourable access to financing.
In the energy system model ON-TIMES we assume a certain technology development bringing down costs on biofuels and E-fuels, for more information see NCES Technology Catalogue. However, this development can only be expected if responsibility is taken for cost development. Hence, incentives are needed for initialising the building of the first large scale facilities, to learn from, optimise production, and bring down costs.
5.5 Target areas for bioenergy
For Nordic bioenergy to succesfully contribute to the energy transition the NCES scenarios highlight the following areas for near-term action:
Near-term actions
-
Facilitate electrification of heating, but plan for flexible heating systems where biomass or other renewable resources may supplement or replace electricity in periods of high heat demand and low electricity supply.
-
Rely primarily on technologies that can use waste resources, wood waste, and forest industry residue resources. From economic and climate perspectives, high quality wood should be allocated for building materials and other applications storing carbon in products for a long period of time.
-
The biofuel blending requirements deployed in the Nordic countries should be strengthened with gradually increasing shares of the mandate set aside for advanced biofuels.
-
Prioritise development of technologies that can provide fuels for aviation. Demonstrate the technologies in operation environments and in growing unit scales.
 PHOTO: MAGNUS FRÖDERBERG/NORDEN.ORG
Chapter 6
Carbon Capture and Storage, and Negative Emissions are Essential
It is hard to see a path to net zero emissions without any use of technologies for CCS and negative emissions. In cases where no viable alternatives to reducing emissions exist, CCS or even negative emissions become critical. This is reflected in existing Nordic national climate targets, and CCS technologies are a vital component in all NCES scenarios.
Key messages
-
Negative emissions are a necessary component if Nordic climate neutrality targets are to be reached.
-
In 2050 25 Mton CO2 are captured and stored, which corresponds to 12% of total Nordic emissions reductions needed compared to 2020 emissions.
-
90% of captured CO2 in 2050 is from biogenic sources and municipal waste; less than 10% is from fossil sources.
-
Norway and Iceland currently lead the development of CO2 storage, with the Northern Light project in Norway and the Carbfix facility in Iceland.
-
Nordic countries are well suited for CCS and technologies for negative emissions as plenty of storage options are available as well as relevant researchers and companies.
-
The competition between the different CCS options is very tight, especially between CHP-BECCS and CCS in the steel and cement industries.
-
90% of the CO2 capture takes place after 2035, but the roll-out starts already by 2030, highlighting the need to accelerate deployment through policy support.
6.1 The Nordic countries are well suited for carbon capture and storage solutions
Nordic carbon neutrality targets are formulated so that the region does not have to eliminate emissions altogether. For instance, the Swedish national target requires territorial emissions to fall by 85% by 2045 compared to 1990 levels, leaving some 11 Mton to be compensated for by negative emissions and international credits. Should the Swedish, or indeed the Nordic target, be reformulated as a zero-fossil target, it is likely that CCS would be key to meeting such targets. Thus, deployment of CCS and technologies for negative emissions depend not only on resources and energy demand but also on how national and Nordic climate targets are formulated.
In this report, the CCS-term is used as an umbrella term encompassing a family of technologies: carbon capture and storage (CCS), carbon capture, utilisation and storage (CCUS), and bioenergy-CCS (BECCS), in instances where the distinction between them is not critical.
Nordic countries are well suited for deploying carbon capture and storage and technologies for negative emissions. Added together, Nordic CO2 storage potential is several times larger than Nordic GHG emissions from today and onwards, with suitable geological formations beneath and around, especially, Norway and Denmark. Iceland has a particular option storing CO2 in porous basalt rock formations. Figure 6.1 shows emission point sources and storage options in the Nordic countries and Table 6.1 presents Nordic storage sites included in the NCES model analysis.
Advantages in the Nordic countries related to CCS and negative emission technologies include:
- Short distances from emissions sources to storage sites.
- Many bioenergy fired plants with a potential for BECCS.
- Sector integration options, with district heating as the most obvious short-term option.
- Potential for PtX and bio-fuel factories, which in some cases also can use captured CO2.
- Expertise in form of researchers and companies.
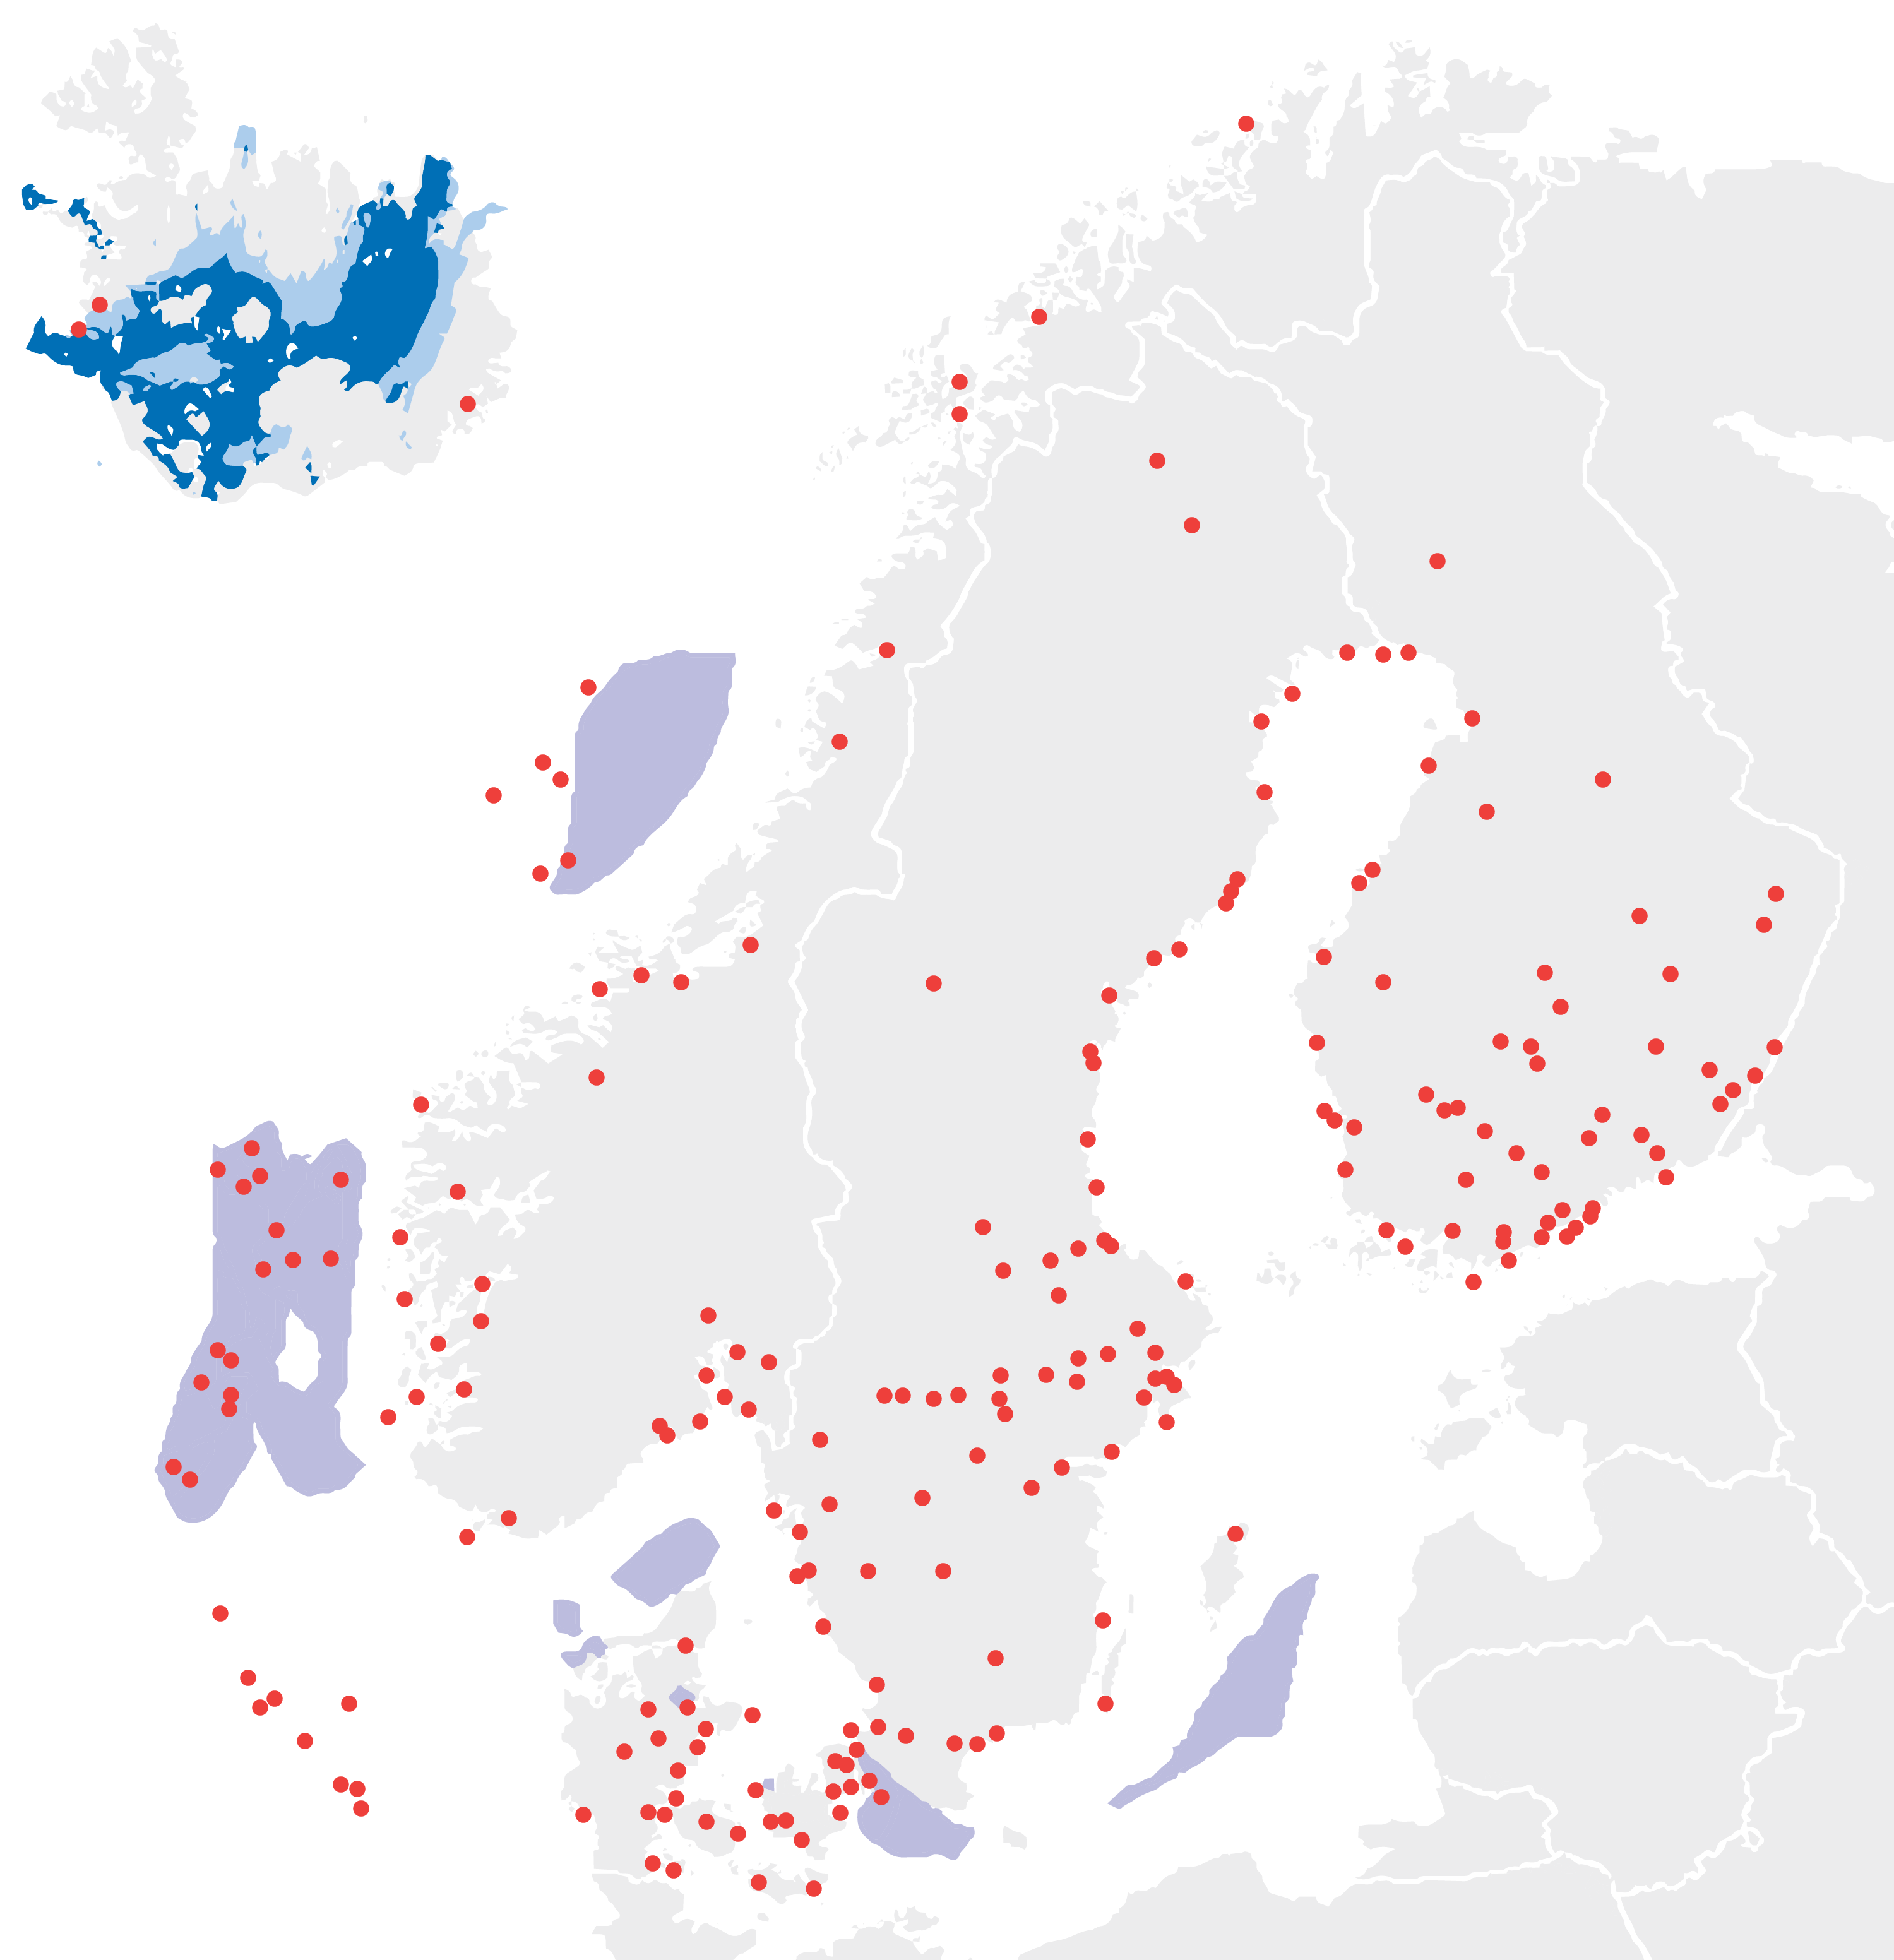
Figure 6.1. Nordic GHG emissions point sources and potential carbon storage sites. The figure illustrates CO2 emission sources (red dots) in the Nordic countries and potential CO2 storage sites (purple and blue). Source: Nordiccs, 2011 & 2014.
Table 6.1. CO2 storage sites included in ON-TIMES.
| CO2 storage | Country | Size Mt CO2 | Storage type | Location |
| Thisted structure | Denmark | 11000 | Saline | Onshore |
| Gassum Structure | Denmark/Norway | 600 | Saline | Onshore |
| Gassum Aquifer | Denmark | 3700 | Saline | Offshore |
| West/Southern Zealand | Denmark | 1150 | Saline | Onshore |
| Hanstholm structure | Denmark | 2800 | Saline | Offshore |
| Mid/Southern Jutland | Denmark | 480 | Saline | Onshore |
| North Sea oil and gas fields | Denmark | 2200 | Hydrocarbon | Offshore |
| Southern hydrocarbon fields | Norway | 9000 | Hydrocarbon fields | Offshore |
| Middle hydrocarbon fields | Norway | 9000 | Hydrocarbon fields | Offshore |
| Northern hydrocarbon fields | Norway | 9000 | Hydrocarbon fields | Offshore |
| Gran formation | Norway | 8000 | Saline | Offshore |
| Amager greensand | Sweden | 1000 | Saline | Offshore |
| Faludden structure | Sweden | 700 | Saline | Offshore |
| Basalt rock | Iceland | >7000 | Basalt rock | Offshore |
| Basalt rock | Iceland | ?? | Basalt rock | Onshore |
6.2 NCES modelling includes a suite of technologies for carbon capture and storage
There are several options for CCS and negative emissions, and it is still uncertain which technology will dominate in the future. CCS means capturing CO2 from flue gases and transporting it to a site for permanent storage. Options for separating the carbon dioxide from flue gases include post combustion and oxyfuel, with pros and cons for each alternative. CCS post combustion solutions have the benefit that they can be attached to existing power plants and industrial plants, see Figure 6.2. The interference with existing infrastructure is therefore limited. However, burning fossil fuels with CCS will never fully remove the CO2 emissions and it also comes with a penalty in the form of higher energy consumption. Only if using CO2-neutral fuels in these processes, such as sustainable biomass, it can lead to negative emissions, BECCS.

Figure 6.2. The figure illustrates a typical example of a CCS post combustion solution that can be attached to power plants or industrial plants. Adapted from Danish Energy Agency, 2021.
Other options for negative emissions include direct air carbon dioxide capture and storage (DACCS), pyrolysis of biomass to produce biochar that is ploughed down in farmland for storage, and forestation. CO2 capture technologies included in the NCES modelling framework, their input and outputs, as well as important limitations are summarised in Table 6.2. Figure 6.3 gives an overview of the model structure for carbon capture options in ON-TIMES.
Table 6.2. Overview of options for CCS capture technologies included in the NCES study.
| Technology | Input | Output | Limitations | Other comments |
| Fossil CCS Post combustion | Electricity (lower efficiency), steam | Flue gas with remaining CO2, CO2 flow for storage or Use, surplus heat. | Needs a fossil-based CHP or heating plant which are phased out. Only reduce emission by 80-90%. | Reduce emissions, but increase energy consumption. |
| BECCS Post combustion | Electricity (lower efficiency), steam | Flue gas with remaining CO2, CO2 stream for storage or use, surplus heat. | Needs a biomass-based CHP or heating plant. Both availability of biomass and future of biomass heating plants are uncertain. | Potentially negative emissions if sustainable biomass is used in the plants. |
| Oxyfuel thermal power plant | Oxygen, fuel | Pure CO2 stream for storage or use, electricity and heat | Needs pure oxygen for combustion | Potentially negative emissions if sustainable biomass is used in the plants |
| Biogas production with CCS | Manure, organic waste, biomass | Methane, CO2 stream for storage or use | Availability of manure, organic waste, and biomass | Reduction of GHG emissions by transforming CH4 emissions to CO2 emissions |
| Direct Air Capture (DAC) | Atmospheric air, electricity, heat | CO2 stream for storage or use, surplus heat | Uncertain technology. Limited by access to area, electricity, and heat source. | Can be placed independently of other plants. Close to storage or cheap electricity |
| Hydrous Pyrolysis/ Pyrolysis* | Biomass, heat (electricity), hydrogen | Gas for fuel production/ biooil, biochar for the soil, waste heat | Farmland, biomass resources in competition with e.g. BECCS | Only CCS option without a Not In MY BackYard (NIMBY) problem |
| Forestation** | Area | Stored CO2 in trees and soil | Area and time | More nature and recreative areas |
| * Pyrolysis is the heating of biomass to 200-400⁰C. If water is present, it is hydrous pyrolysis and without water just pyrolysis. When heating the biomass, the volatile parts become gas and the re-maining mass is called bio-char. Around 20% of the energy content in biomass ends up in the bio-char. ** Not included in the model optimisation, forestation is part of the LULUCF balance and are exogenous to the ON-TIMES model and are not changed between the scenarios. | ||||
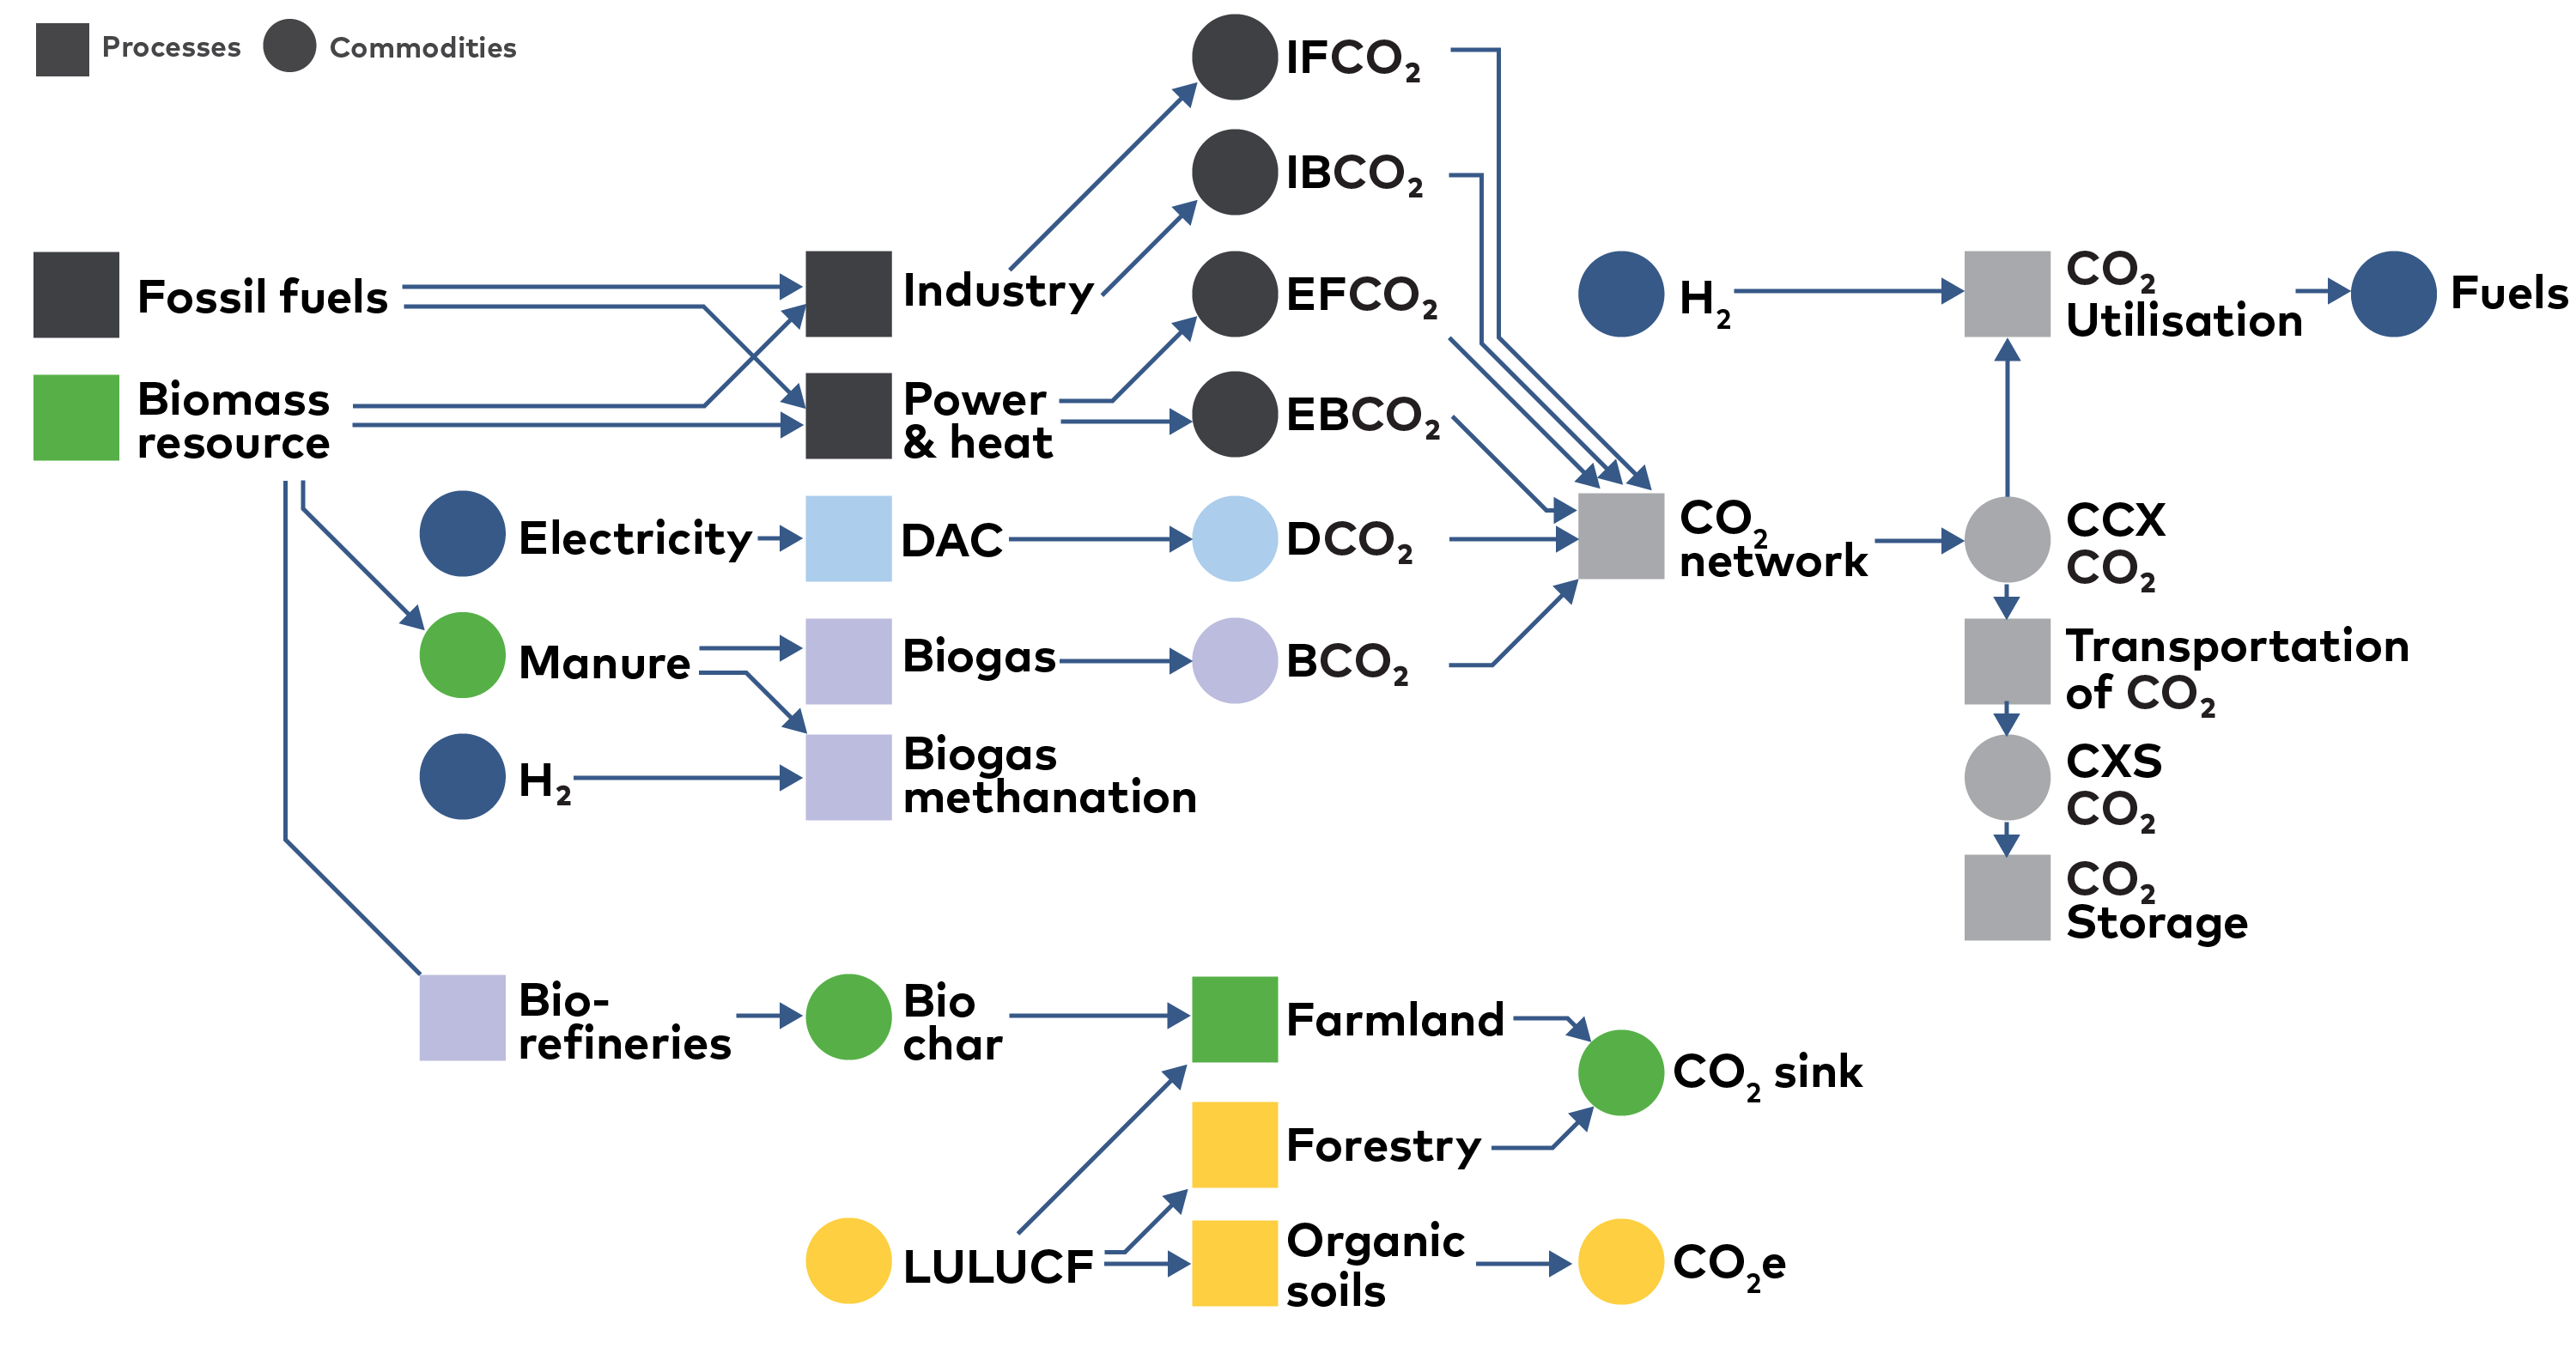
Figure 6.3 Schematic over model structure for carbon capture. Illustration of model structure for carbon capture in ON-TIMES. All square boxes represent processes included in the model and the ellipses commodities such as energy carriers or CO2 streams (the orange-coloured parts are exogenous to the model). Black colour is post combustion technologies, blue - capture from air, purple - is bio-refineries and grey are CO2 streams. It is tracked if the CO2 comes from burning of fossil fuels or from bioenergy, this is to be able to account for negative emissions. All captured CO2 can either be used for fuel production or transported to storage.
6.3 The uncertain cost of CCS
The cost projections of carbon capture technologies are uncertain as not many full-scale plants are in operation. Figure 6.4 shows the NCES levelized cost[1]Technology data and assumptions can be found in the Nordic Clean Energy Scenarios Technology Catalogue. of carbon capture (not including transport and storage) in 2030 and 2050 of capturing one ton of CO2 for some of the technologies. The calculated costs are system and scenario dependent since they depend on prices of the process inputs (such as heat and electricity) and the operation time the plant is having in the modelled system. When calculating the Levelized Cost Of capturing CO2, LCOCO2, all cost (investment, operation and management, and fuel), and income from sales of products like district heat are summed up and divided by captured ton of CO2 and then the net value the LCOCO2 can be calculated. We have not been able to do this calculation for the full ON-TIMES model so Figure 6.4 are based on analysis run with only the two Danish regions of the model. This means the figure does not give a fully correct picture of the situation in the full Nordic area in ON-TIMES, but it illustrates the internal competition between CCS solutions.
Footnotes
- ^ Technology data and assumptions can be found in the Nordic Clean Energy Scenarios Technology Catalogue.
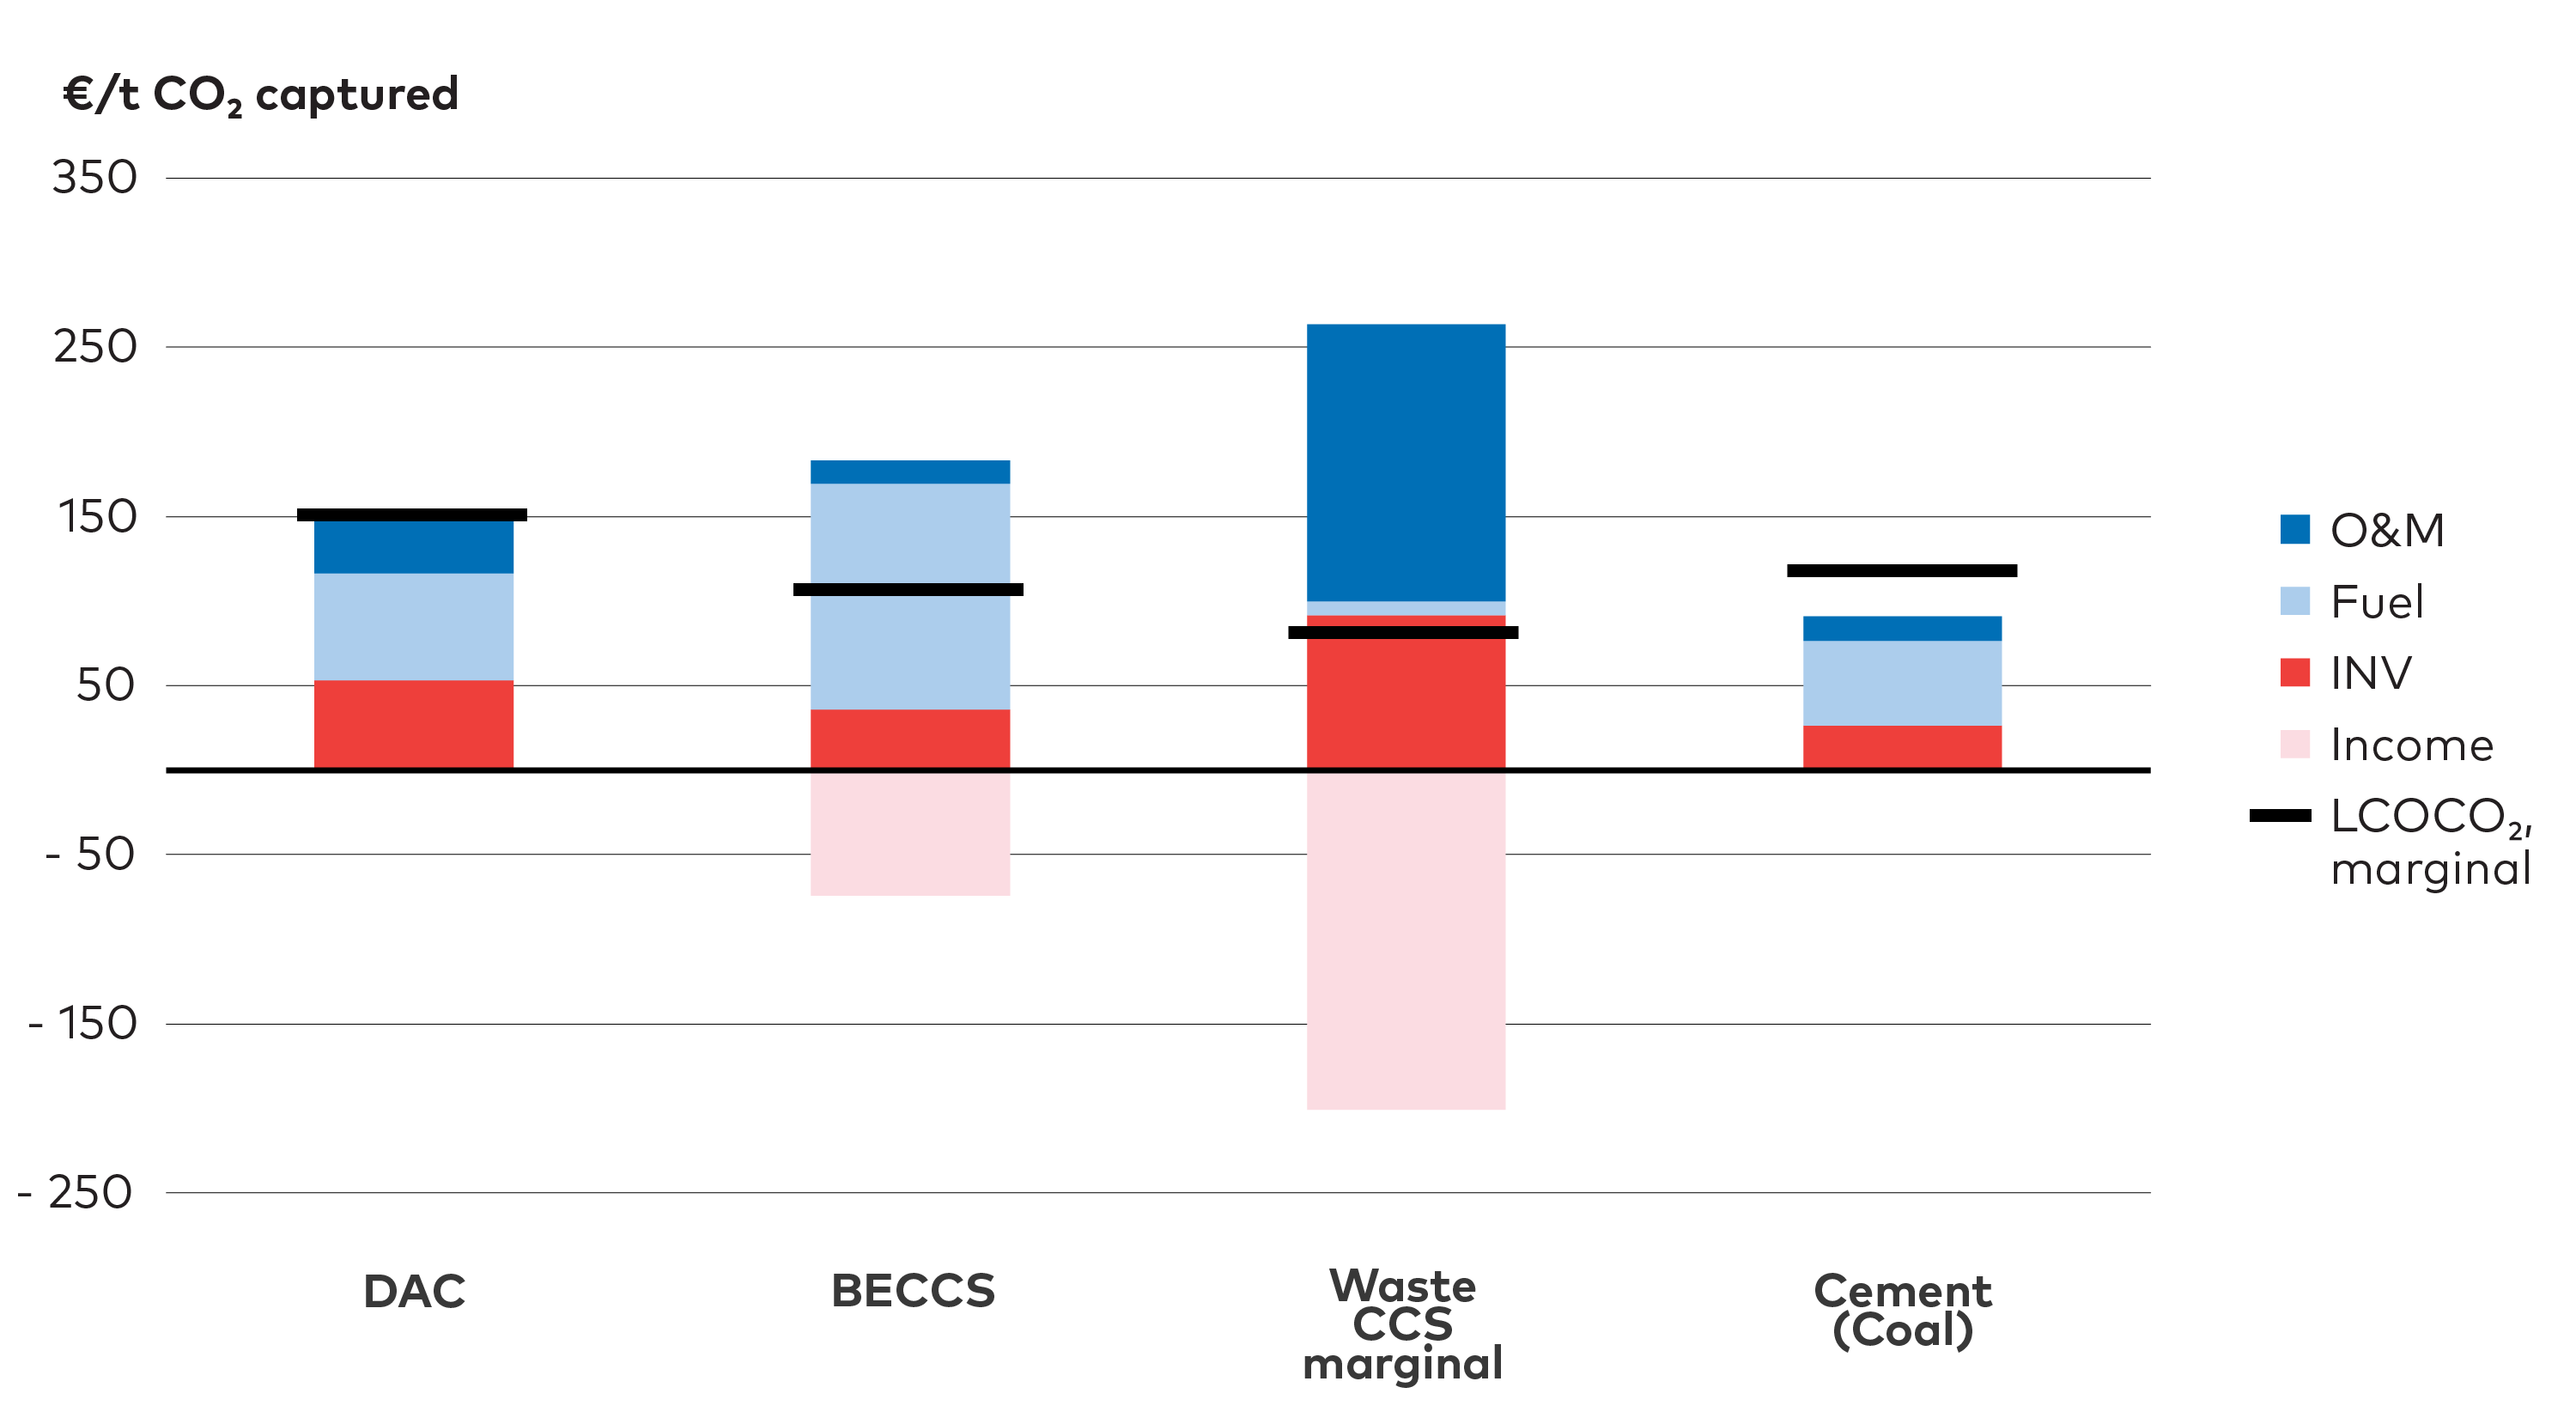
Figure 6.4. Levelized cost of CO2 negative emissions - 2030. Calculated Levelized Cost of CO2 Negative Emissions (LCOCO2) for technologies included in NCES scenarios. LCOCO2 for waste and cement/heavy industry is the price for retrofitting existing plants. The calculated LCOCO2 are based on model runs giving plant full load hours in the system etc. Income – reflects sale of electricity and heat as well as revenues associated with waste combustion. The colours of the bars represent different financial streams, and the black line is the net marginal cost of CO2 captured. The black line for cement is above the stacked bar to cover the cost of removing the extra emissions caused by the efficiency loss by adding CCS to the cement plant.
The LCOCO2 of forestation is not estimated as it is exogenous to the ON-TIMES model and for the pyrolysis options the price is difficult separate from other parameters in the model. But the pyrolysis option is used by the model from 2040 onwards, so with the price regimes in the NCES scenarios it can compete on CO2 capturing price after 2040. The costs of CCS in iron and steel industry are not in Figure 6.4 either, but the LCOCO2 cost is close to the BECCS option. Therefore, CCS in the steel industry is utilised in the scenarios and not CCS in cement industry. But as seen from Figure 6.4 the costs for BECCS, and CCS in waste and cement are similar, making it difficult to say which technology will turn out to be cheapest. This means that it could just as well turn out to be the cement industry investing in CCS in the future.
As mentioned, CCS use in iron and steel is sensitive to changes in the technology cost, there is no introduction of CCS in the cement sector in the NCES scenarios. This is because the model sees technologies such as BECCS and pyrolysis as cheaper to deploy than to eliminate emissions all together in hard-to-abate sectors.
6.4 CCS technologies play important roles in the NCES scenarios
Demonstrating the importance of negative emissions in the scenarios for the Nordic region to reach their current climate targets, biogenic CO2 dominates the captured volumes. For example, out of the total 25 Mton captured CO2 in the CNN scenario in 2050, 20 Mton are biogenic.
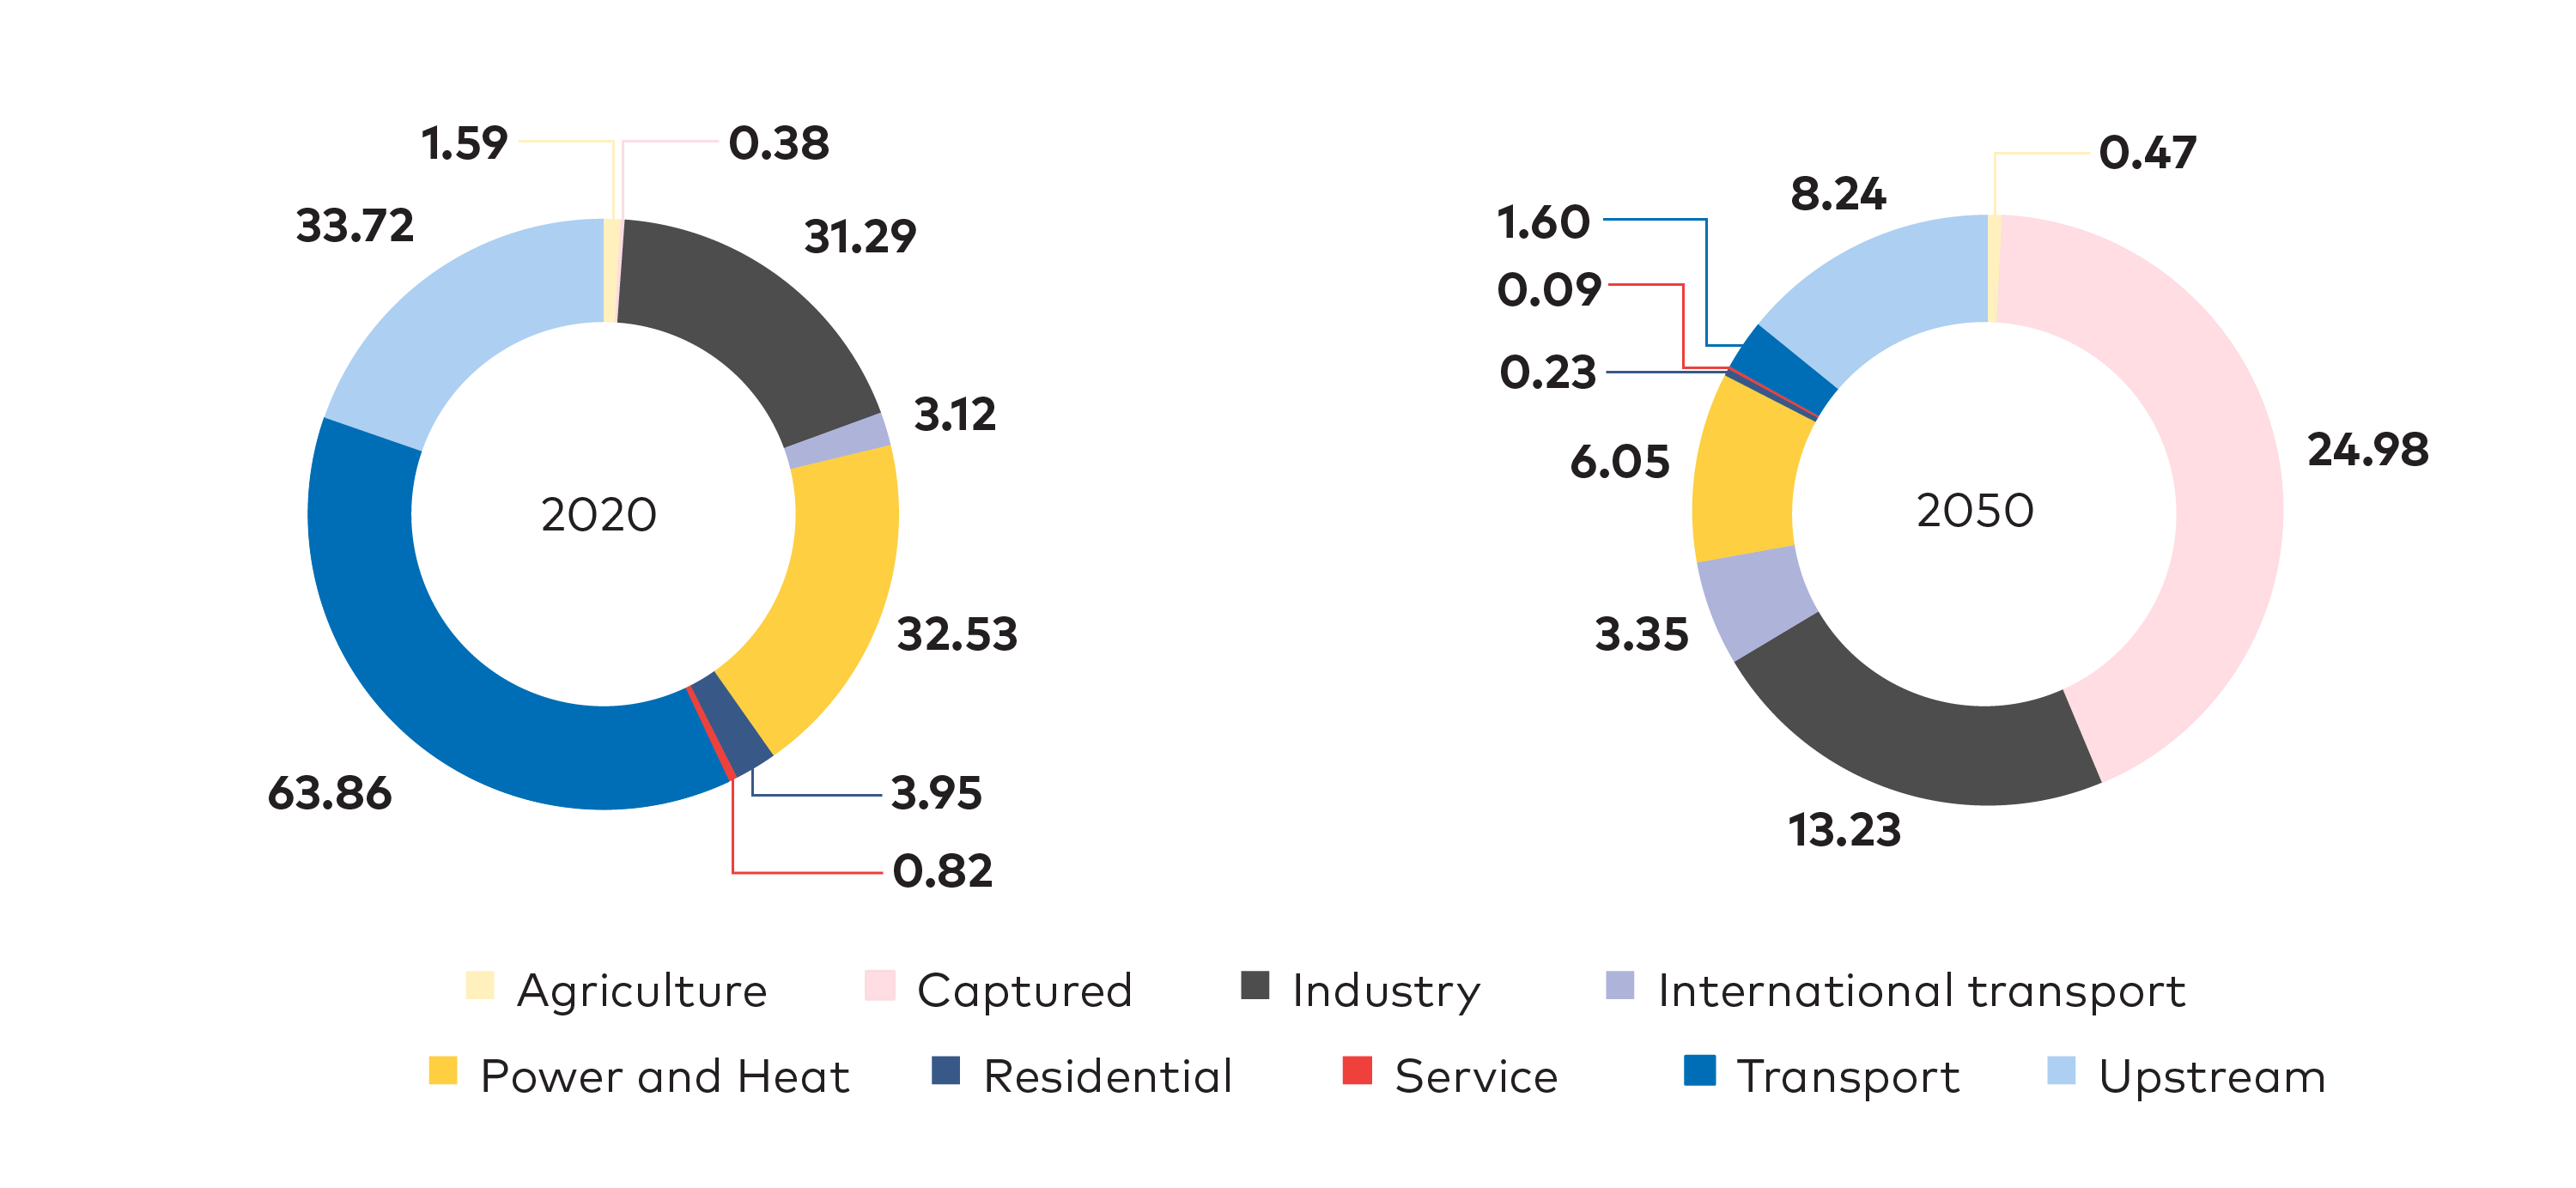
Figure 6.5. Remaining energy-related CO2 emissions in 2020 and 2050 - CNN scenario. In the CNN scenario, there remains about 33 Mton of energy-related CO2 emissions in hard-to-abate sectors in 2050, after accounting for 3 Mton of fossil emissions captured in the iron and steel industry. This underlines the importance of negative emissions to compensate for some of those remaining emissions.
In 2050, 25 Mton CO2 are captured and stored, which corresponds to 12% of total Nordic emissions reductions needed compared to 2020 emission levels, demonstrating the key role of CCS and negative emission technologies (Figure 6.5). 90% of the captured CO2 in 2050 is from biogenic sources and municipal waste, less than 10% is from fossil sources. From 2030 onwards the contribution from carbon capture technologies takes off significantly, reaching 15-25 Mt captured CO2 annually in the CNN scenario (Figure 6.5). Almost 90 % of the capture takes place after 2035. 70-80 % of the captured CO2 is sent to storage and 20-30 % used for fuel production.
The cost of carbon capture, transport of CO2, and storage are uncertain as the large-scale introduction needed to bring down costs is still to come. To evaluate the influence of cost connected to CCS, a sensitivity analysis was run for all scenarios where the storage cost was increased by a factor of 10 to represent uncertainty in costs as well as difficulties with public acceptance for storing CO2 underground. Within this sensitivity analysis the model still can capture and use CO2 for fuel production but storing has become a lot more expensive resulting in almost 50% reduction in total captured CO2. The increased storage costs give an extra total mitigation cost of CCS around 30€/ton CO2 (20-60% increase), which has significant impact on the results (Figure 6.6).

Figure 6.6. Captured CO2 in 2025-2050 - CNN scenario. Yearly capture of CO2 on sources in the Nordic countries. To the left is the CNN scenario and to the right CNN with a sensitivity on the price of CO2 storage that adds approximately 20-60% to the total mitigation cost/ton of CO2.
The results show that should CO2 storage and thereby CCS become 20-60% more expensive, investments in alternative mitigation options will increase. Direct CO2 emissions from especially industry will reduce more and earlier. As an example, it seems likely that the iron and steel sector would opt for a different route to reduce emissions such as the hydrogen/direct reduction route. In fact, this route already seems favoured by the Swedish steel industry, with plans in place to replace the current fleet of blast furnaces with direct reduced iron (DRI) plants using hydrogen. This case is analysed within the NPH scenario and discussed further in Chapter 4.
CO2 capture is utilised in all scenarios and all countries, but capture volumes vary between 0,5 to 8 Mton per year and the mix in types of carbon capture differs from country to country as shown in Figure 6.7.
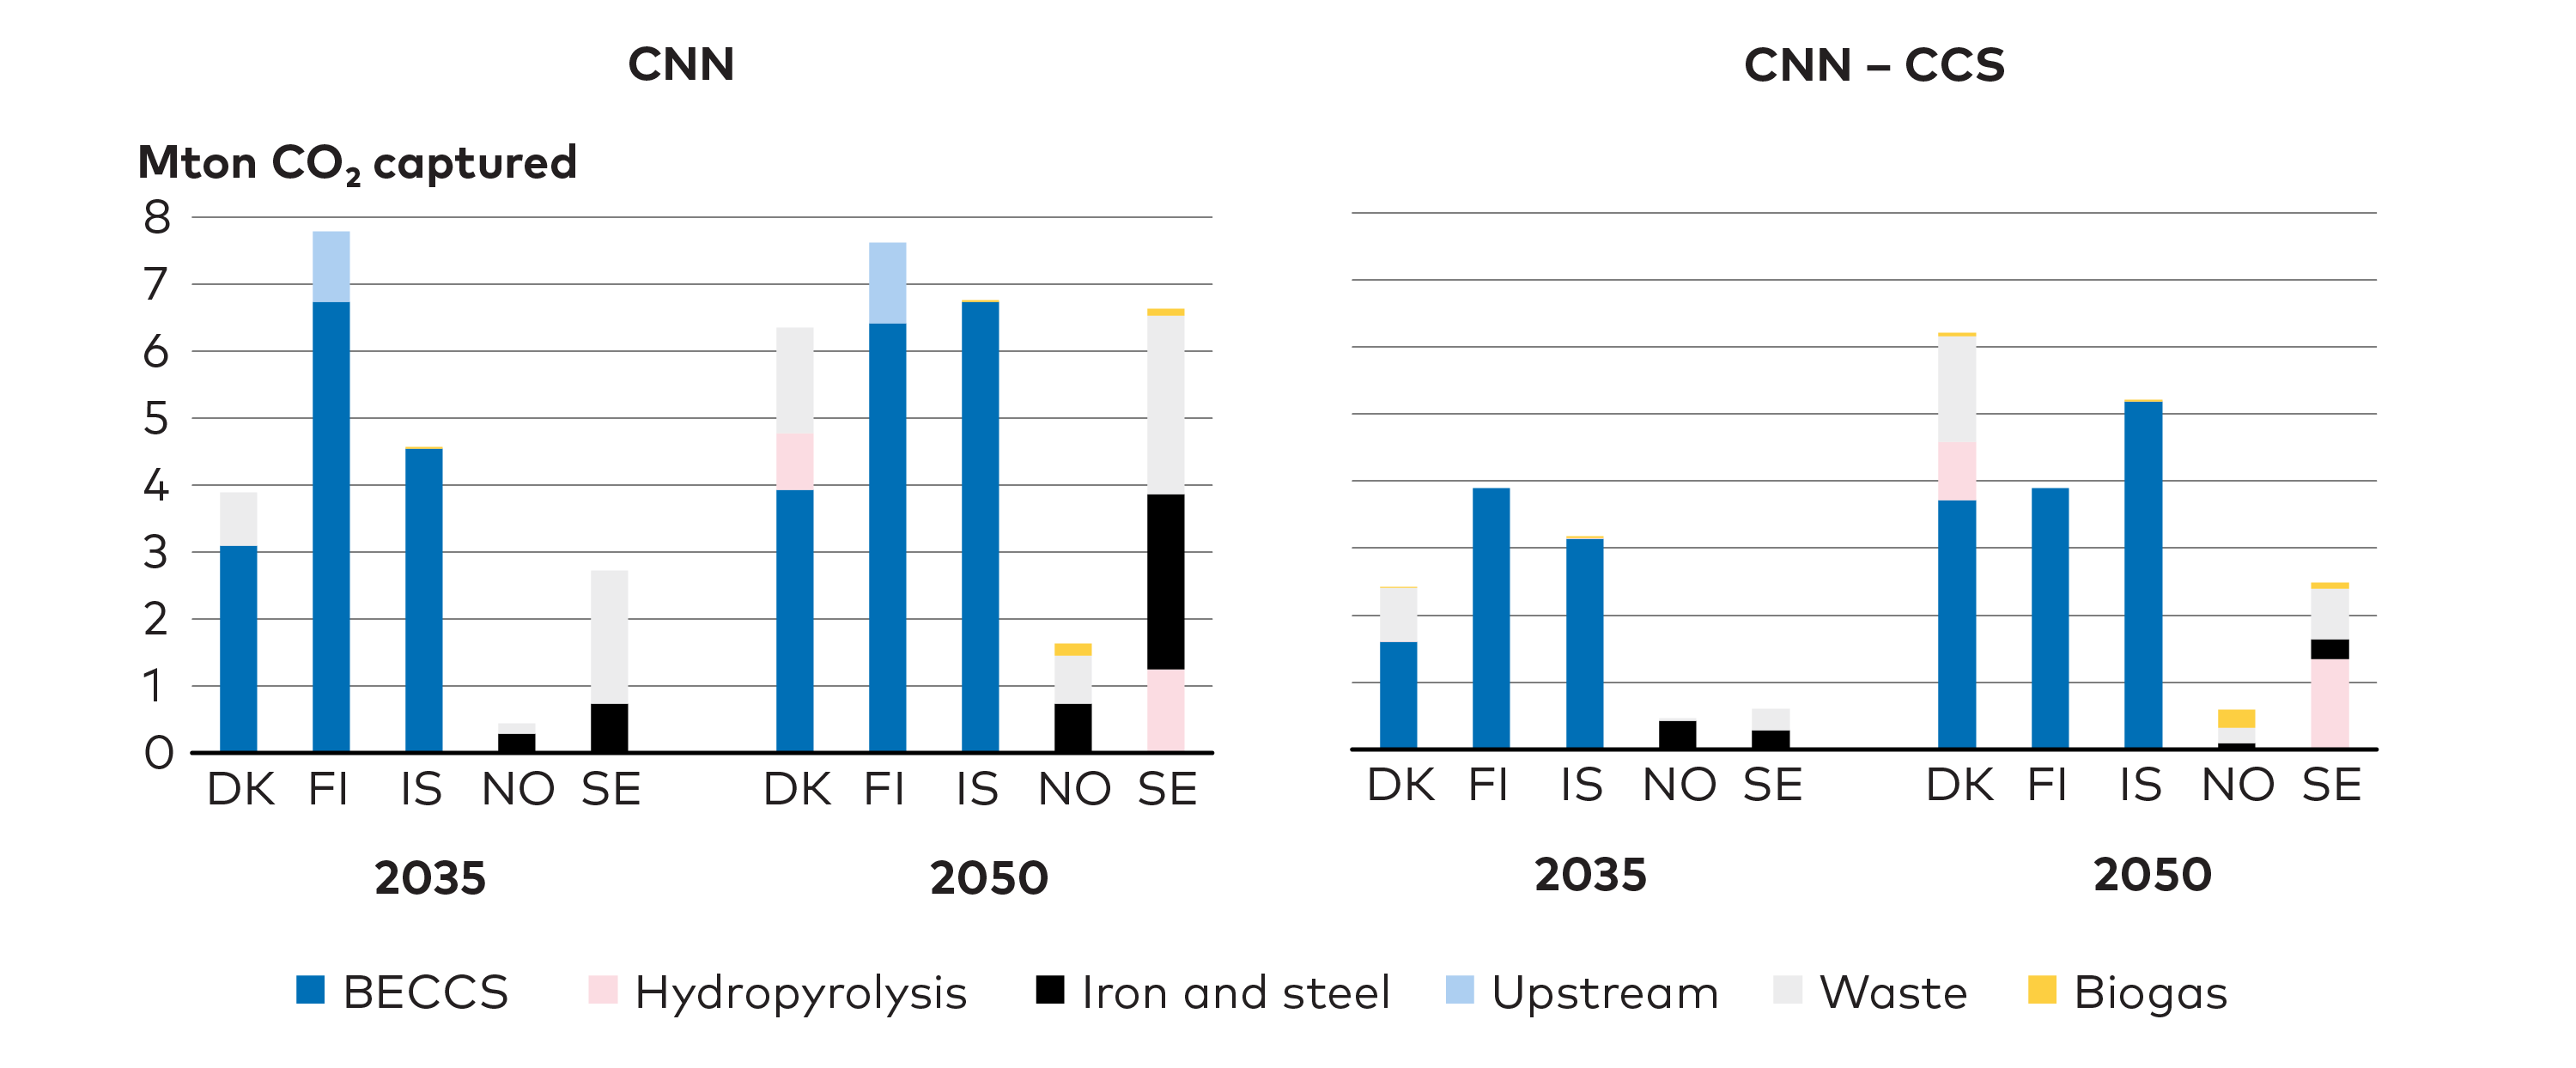
Figure 6.7. Source and country for captured CO2. Captured CO2 divided on source and country for the CNN scenario (to the left) and the sensitivity with increased CO2 storage cost to the right.
As seen in Figure 6.7, the CCS options implemented by the model differs between the countries. Post combustion carbon capture on municipal waste district heating (DH) incineration plants is the second most used technology for capturing CO2, responsible for 22% of all captured CO2. Number one is CHP biomass plants (BECCS) capturing almost 55% until 2050. In Denmark and Finland, the main option utilised is BECCS, while in Sweden, where waste makes up about 20% of district heating fuel input to CHP plants, CCS is more often applied to district heating with waste as fuel. In Norway, heavy industry dominates the CCS use. As district heating systems are effective for hosting capture technologies, captured volumes in Sweden, Denmark, and Finland, where district heating has a major role in the heating market, are large compared to Norway.
In the CNN scenario, Iceland is using BECCS and hence import biomass to produce negative emissions, simply because it is cheaper than DACCS in the short run. But if biomass imports to Iceland are constrained, the model immediately shifts to DAC technology instead.
Be aware that the presented results are modelling results, from a model finding the cheapest options, but as the different CCS types are close in costs, the results cannot be used to point out the winning technology. The total amount of captured CO2 in each country is on the other hand a robust result, linked to the GHG target of the country and available technology options. So e.g., in Sweden and Norway it can just as well be BECCS that is used instead of CCS on waste plants or a mix of both.
However, although investments in CCS linked to biomass CHPs are attractive from a pure CO2 reduction perspective, it should be noted that there is a risk of further locking-in CHP plants that otherwise would have gradually been replaced by DHC facilities using waste heat for district heating. However, what we see in the NCES scenarios is that these plants are competing with cheap renewable electricity making CCS less of a cost competitive solution.
6.5 Economies of scale and network effects hinder investment in CCS
The NCES analysis clearly show the potential benefits of CCS technologies, and yet progress on CCS deployment has been slow both in the Nordic region and globally. While cost reductions are expected, reflected in the scenarios, they are also uncertain and CCS plants are currently costly. Further, CCS requires significant investment in new infrastructure for capturing and transporting the CO2 from capture site to storage. There are large economies of scale and network effects; the entire chain from capture to storage needs to be in place for the technology to have positive impact. This makes it risky and difficult for individual firms to invest, and coordination between actors in the CCS-value chain will most likely be necessary.
Norway and Iceland currently lead the development of CO2 storage, with the Northern lights project in Norway[1]Northern lights, n.d.and Carbfix operation in Iceland.[2]Carbfix, n.d.Storage volumes are unlikely to be a limiting factor, but competition between storage providers would likely have a positive impact on costs and there are potential storage options in the other Nordic countries as well.
6.6 Target areas for CCS and negative emissions technologies
There are currently no direct policy incentives for negative emissions, and the incentives for CCS have so far been insufficient. The cost-effective development suggested by the modelling will not be realised without additional policy action. In the long-term, it seems possible to create a market for negative emissions. In the short-term, governments could create a demand for BECCS by carrying out procurements of negative emissions. Target areas for near-term action include:
-
Continued action to strengthen international climate targets and carbon prices.
-
Establish clear national positions in support of CCS technologies to build long-term market confidence.
-
Government support for coordinated infrastructure development to reduce investment risks and entry barriers for individual actors.
-
Support for large-scale demonstration and commercialisation projects still needed.
-
Launch initiative to create economic incentives for negative emissions. This could include procurement of negative emissions through reversed auctions, fixed storage tariffs, or quota obligations for emitting activities.
-
Consider including negative emissions in the EU Emissions Trading System (EU ETS).
Near-term actions
 PHOTO: UNSPLASH.COM
Chapter 7
How Behaviour and Acceptance can Influence Future Energy Systems
Human behaviour that affects energy demand will directly impact the Nordic energy transition. A myriad of drivers, at different levels of society, will make it easier or harder to achieve carbon neutrality. Transitions to carbon neutral energy systems require a balanced mixture of new technologies, infrastructure, social acceptance, and behaviour change. While acknowledging the challenge of quantifying the possible changes, the CNB scenario probes different ways in which to disrupt historical trends in passenger transport, acceptance of onshore wind and dietary habits. As all NCES scenarios achieve the aim of carbon neutrality, the most important aspect is the ways in which behaviour changes can ease the emission reduction burden across other sectors and thus lower overall costs.
Key messages
-
Widespread changes in behaviour and acceptance can either help or hinder the transition towards carbon neutrality.
-
20% lower passenger transport demand (due to changes in travel habits) and a shift towards low-consumption lifestyles, resulting in 10% lower industrial demand and 5% lower freight transport, would result in a 17% lower final energy demand by 2050 and 10% lower total system costs compared to the CNN.
-
Disrupting historical trends of increasing passenger transport demand per person and number of cars per person could lower the costs for the Nordic transport sector with up to €10 billion per year by 2050.
-
Behaviour change and acceptance can enable wider adoption of new technologies. For example, the upper share of BEVs depends mainly on costs and technological improvements of vehicles, but infrastructure, public acceptance, and how much companies and citizens are willing to change their habits in fuelling and trip planning, also play important roles.
-
Public acceptance of onshore wind power shows signs of waning as installed capacity expands. Increased resistance could force deployment and investments in more costly options such as offshore wind power. New transmission lines could face similar issues.
-
Widespread adoption of more sustainable dietary choices could reduce agricultural GHG emissions up to 10% (3 MtCO2eqv), thereby reducing the need for negative emission technologies that now are necessary to meet national targets. It could also free up land for other uses, including to serve as carbon sinks.
-
Near-term policy action to promote behaviour change, influencing a range of factors affecting behaviour both in industries and among individual consumers should be tailored to specific sectors.
7.1 The potential of behaviour change to reduce overall energy demand
Energy demand in end-use sectors drives decisions throughout the energy value chain. Historically, energy demand per person and associated CO2 and GHG emissions have increased with economic growth and social development. Technological solutions can save energy and lower the CO2 content of consumed energy by improving the overall efficiency, but a growing body of research investigates opportunities to boost this development by encouraging changes in human behaviour that would actively contribute to achieving lower energy demands and support the energy efficiency targets.
To capture a small sample of these aspects, the NCES project developed the CNB scenario, which incorporates several assumptions on how behaviours, values and attitudes could impact Nordic energy systems, individually and as a whole. Specifically, the scenario examines where behaviour change could reduce energy demand, in turn reducing the system build-up and corresponding investments projected without such change. The CNB focuses on selected energy and GHG emitting sectors that have been reviewed in recent literature. Within the end-use sector, it considers a 20% lower demand for passenger transport, and 10% lower industrial demand and 5% lower freight transport volumes, as the result of lower rates of consumption. Under such assumptions, the power demand in Nordic countries would be 5% lower in 2050 and final energy demand would be 17% lower in 2050 compared to the CNN scenario (Figure 7.1). Total system costs would also decrease by about 10% over the period.
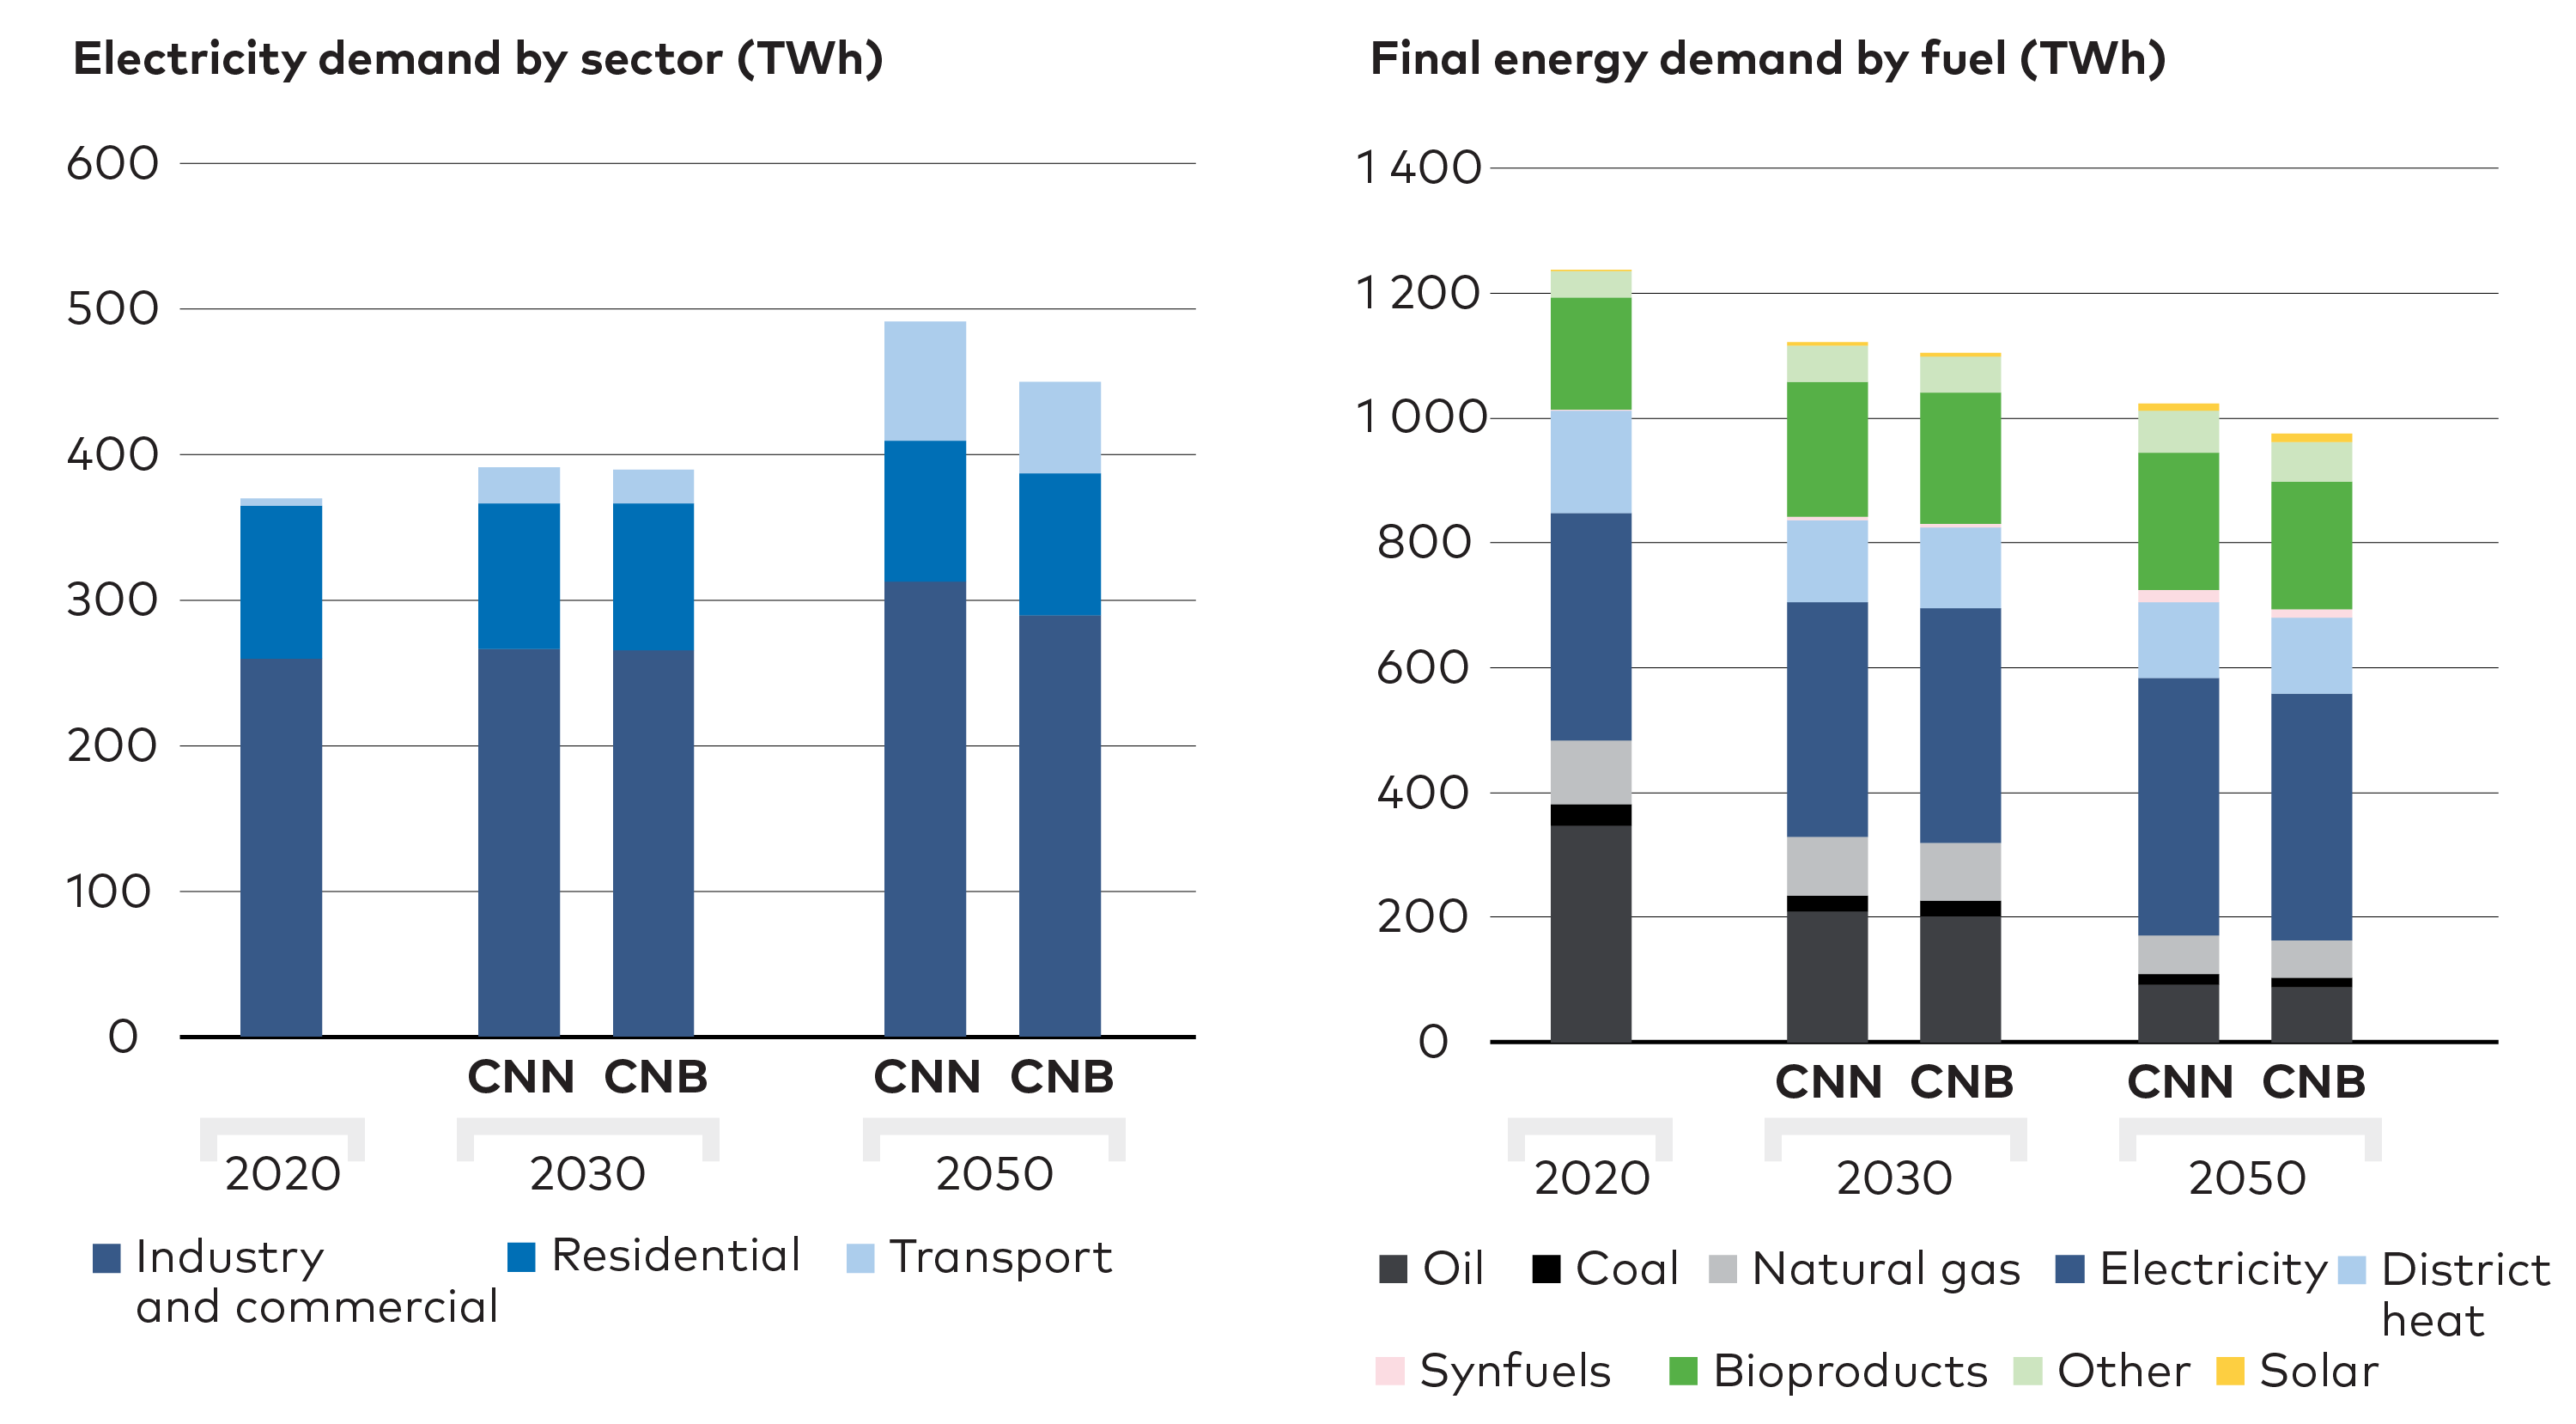
Figure 7.1. Behaviour changes would impact energy demand. Modelled impact of quantified assumptions of behaviour changes on electricity and final energy demand.
For low-carbon electricity production, the CNB models higher acceptance of expanded onshore wind power capacity. In addition, the model analyses the potential impact of dietary changes, lowering agricultural GHG emissions by 10%. These changes do not have a direct effect on energy demand in CNB but do make the transition easier. We direct readers to sections 7.3 and 7.4 for more details on these impacts.
7.2 Reducing transport demand
Preceding chapters emphasise the importance of electrifying transport to achieve carbon neutrality in the Nordics. The CNB adds to this by examining the extent to which that transition could be eased if behavioural changes reduced demand for transportation and the overall number of vehicles.
Passenger land transport, measured in passenger kilometres (pkm) travelled per person per year, increased from 12 100 pkm/yr in 1990 to 14 100 pkm/yr in 2018 (Figure 7.2). National authorities typically project a growing demand in the passenger transport sector; as such, these assumptions also underpin the CNN and NPH scenarios. In CNB, it is assumed that land transport demand per person returns to 1990 levels due to increased remote working and a larger share of the population living in cities with shorter transport distances. At the national level, this is compensated by increasing populations that keep the total transport volumes approximately at current levels in the CNB.
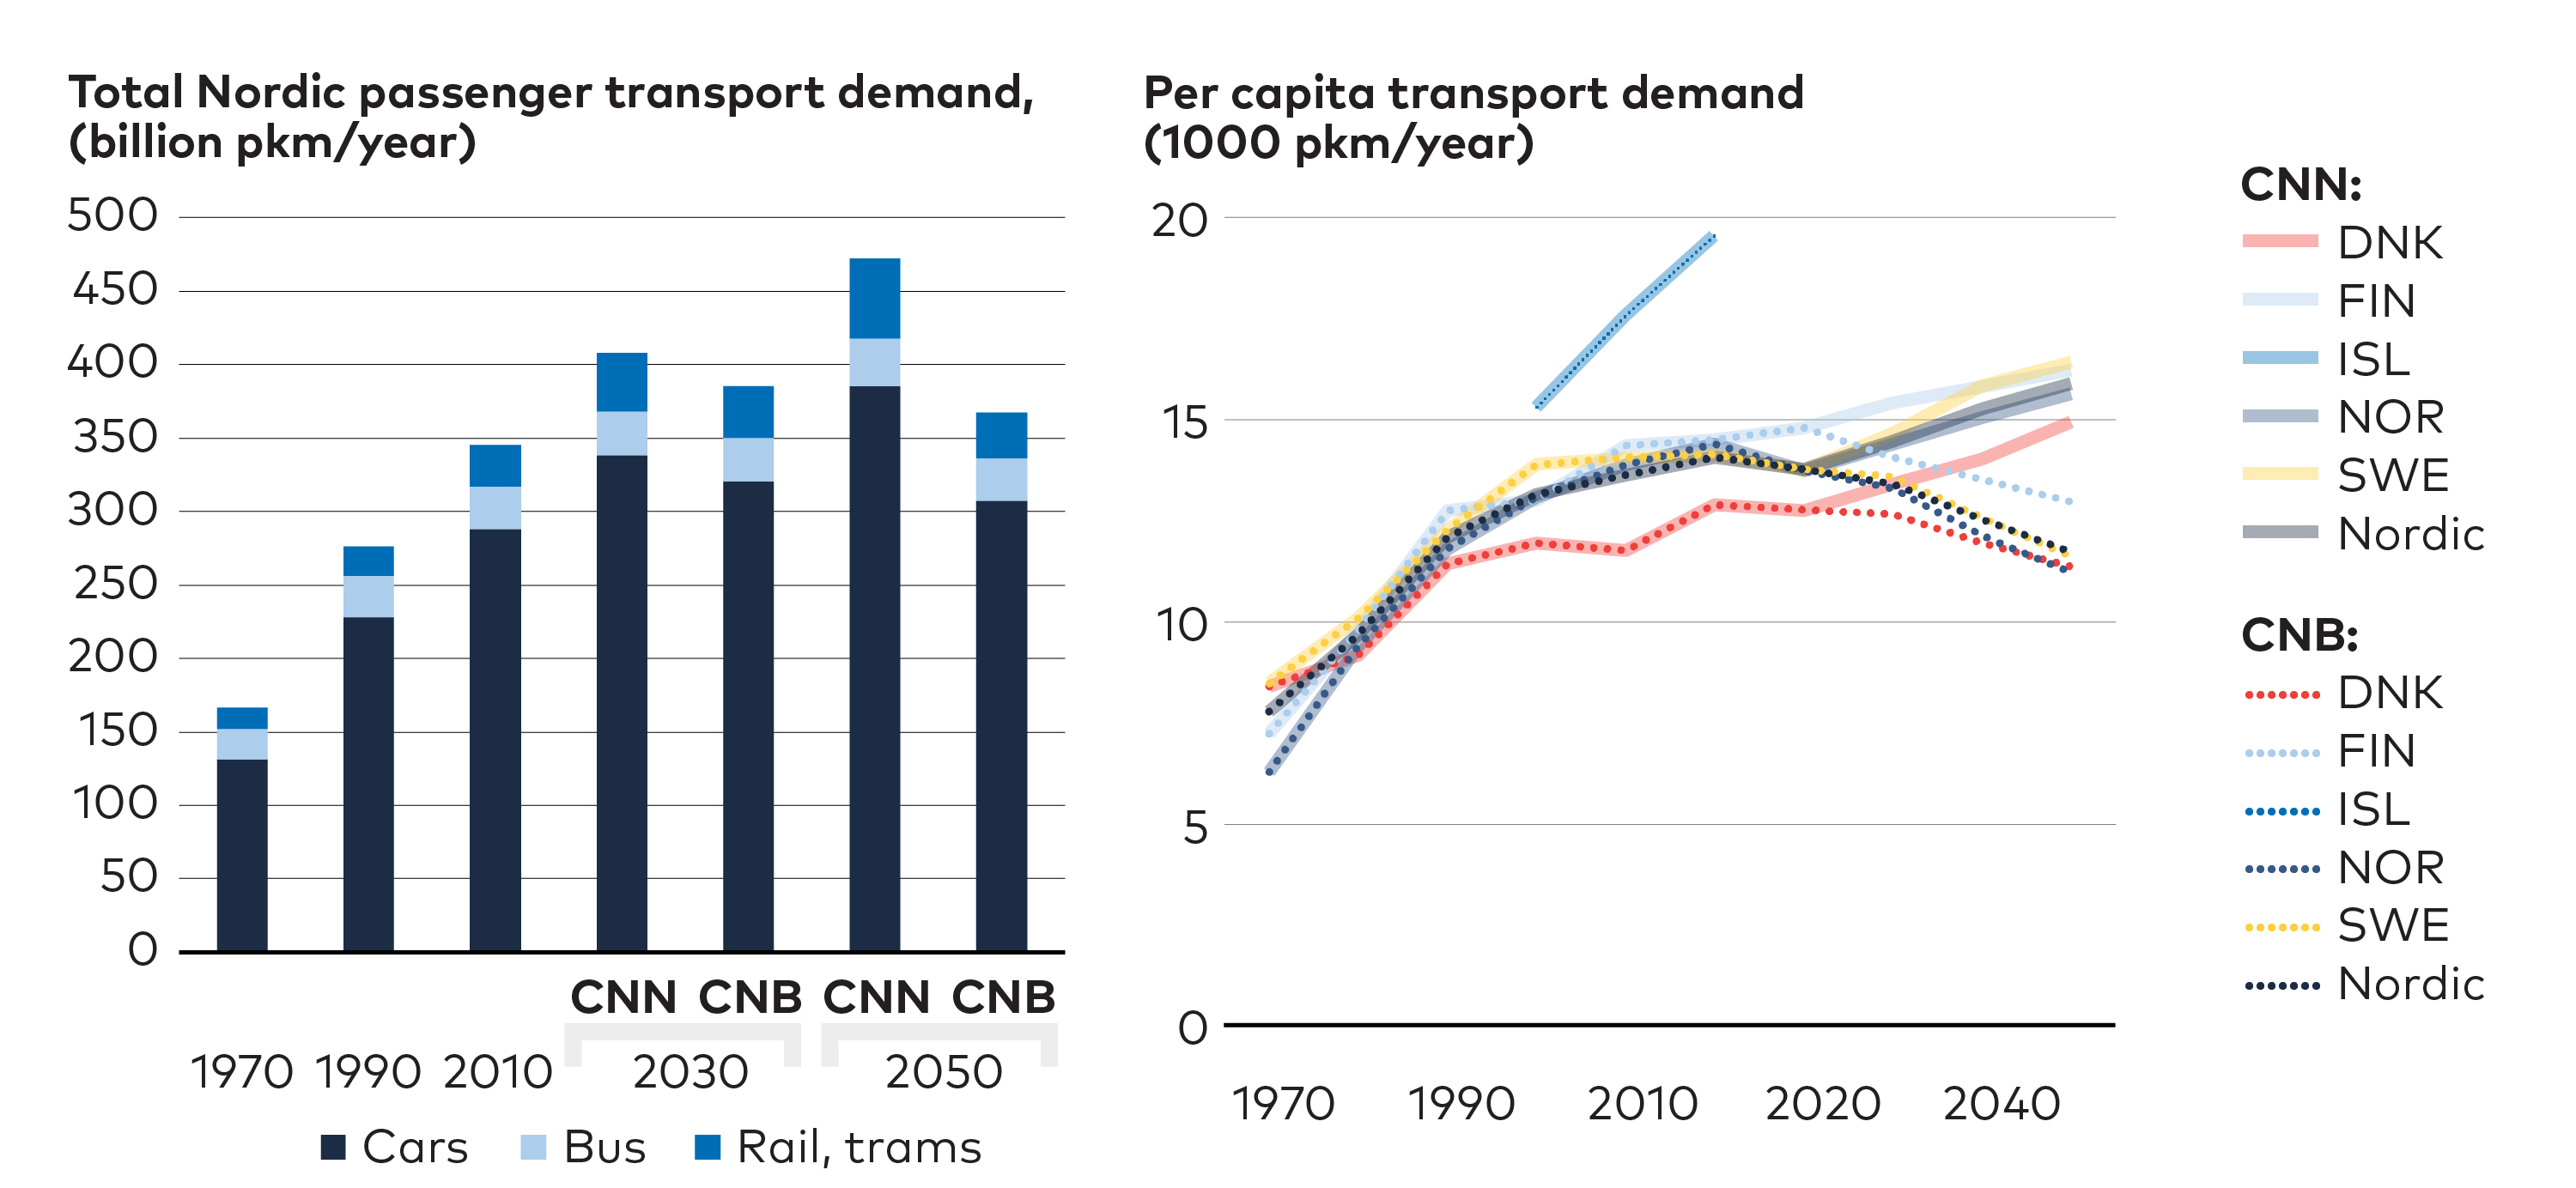
Figure 7.2. Historical trends and scenario pathways for transport demand development. Historical and projected on-land passenger transport demand in Nordic countries in total (left) and per person (right). Note: Iceland statistics were available only from 1995 to 2018.
The number of cars is increasing in Nordic countries in both absolute terms and measured per person (Figure 7.3). Car sharing could increase the average use rate of cars, effectively increasing and maintaining the economic value of the fleet and curb the trend of increasing numbers of vehicles. Car sharing would not lower total passenger kilometres or change the mode of transportation. Rather, it has the potential of reducing vehicle kilometres through higher efficiency of use and thus the energy consumption of the transport sector. In addition, it could reduce the land needed for parking lots, creating opportunity for more sustainable and efficient use of urban environments. At present, shared mobility options account for only a small share of total transport volumes and might be limited only to urban areas.
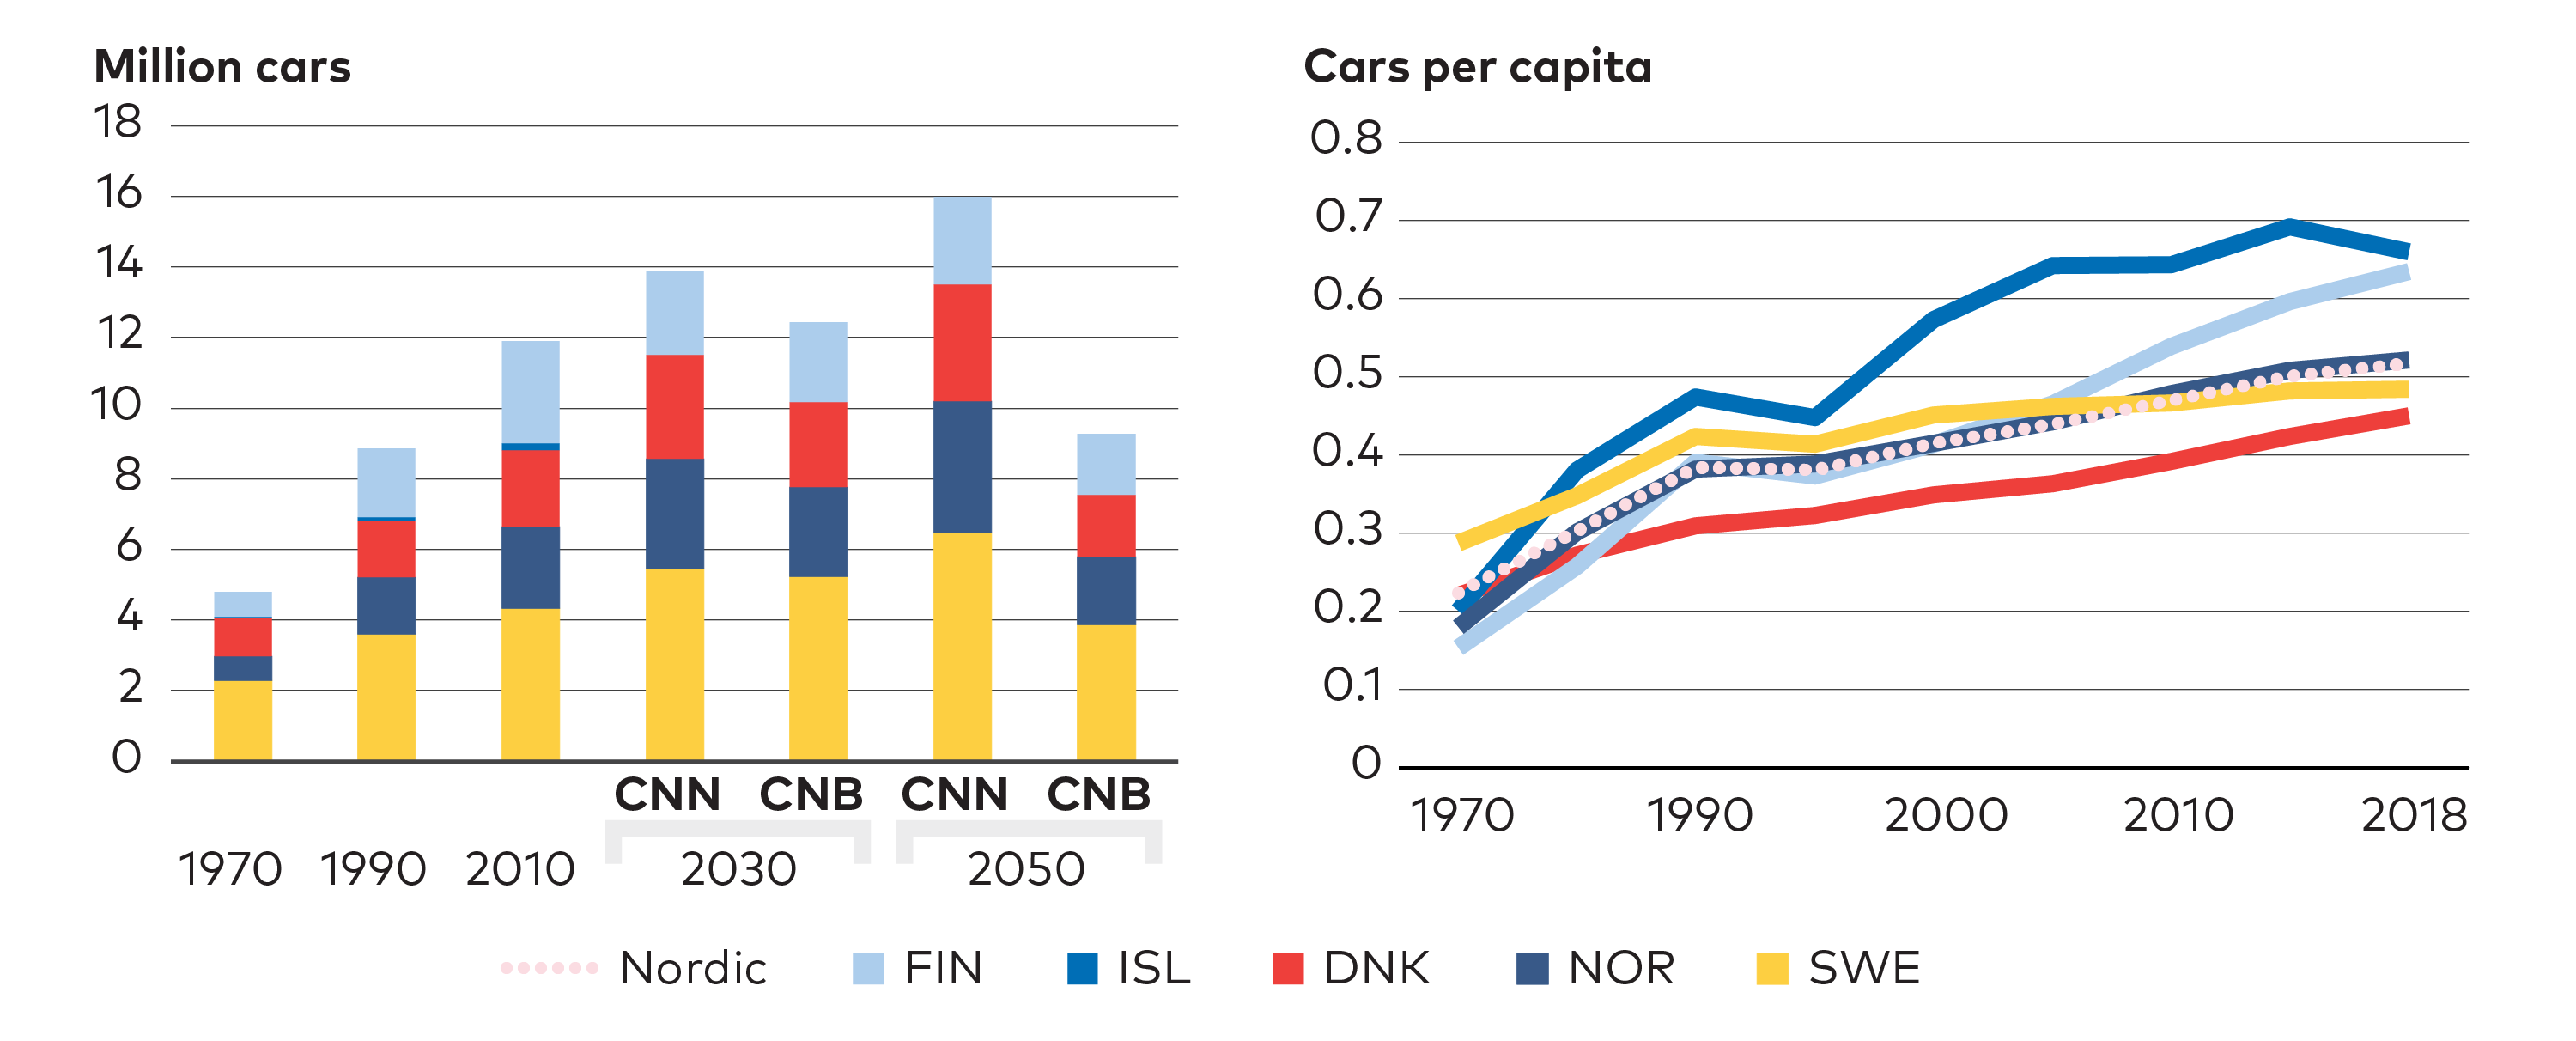
Figure 7.3. Shared and autonomous mobility can curb historical trends. Number of cars in Nordic countries per person (right panel) and total number of cars historically and in the CNN and CNB scenarios (left panel). Note: Iceland statistics were available only from 1995 to 2018.
A third type of behaviour change would be a shift from one transport mode to another, from cars to buses for example. Across the Nordics, land transport shares are massively skewed towards cars (87%), followed by buses (8%), rail (7%), and trams and metro (1%).[1]European Commission, 2020.Shares between these four different modes have been stable from 1990 to 2020. As mentioned in chapter 3 however, modal shifts are not modelled in the scenarios. For more information on the potential impacts of modal shifts, more information is available from the previous Nordic Energy Research project SHIFT.[2] www.nordicenergy.org/flagship/project-shift/
Footnotes
- ^ European Commission, 2020.
- ^ www.nordicenergy.org/flagship/project-shift/
7.2.1 International transportation and aviation
Increased long-distance travelling is a good example of a trend related to individual choices that make carbon neutrality harder to achieve. Over the past 30 years, aviation fuel consumption in the Nordics has doubled – from ~25 TWh/yr in the early 1990s to 51 TWh/yr in 2018. This trend is the result of an increased number of work trips, holidays, and transit passengers. Despite efficiency gains in aviation, related emissions rose by 16% in the EU from 2005 to 2017 and some projections estimate a further increase of 21-37% by 2040.[1]EEA, 2019.Airports in Copenhagen, Stockholm, and Helsinki are all among the top 20 busiest airports in the EU, servicing 30, 27, and 21 million passengers per year respectively.[2]European Commission, 2020.Oslo and Reykjavik airports both service a large number of passengers transit flights from Asia and US and before covid-19 they serviced 29 and 10 million passengers per year[3]Avinor, 2021.
The outbreak of the COVID-19 pandemic in 2020 completely disrupted long-distance travel in ways that may influence long-term trends, particularly as online conferencing proved a viable alternative to many in-person meetings. The NCES CNN scenario assumes a post-COVID-19 return to historical growth pathways while the CNB shows reduced aviation demand (Figure 7.4). Technological gains towards 2050 deliver significant decreases in aviation fuel consumption, as seen in CNN scenario, and these are further strengthened by lower demand in CNB. The need for alternative fuels in aviation is 20 TWh smaller in CNB than in CNN in 2050. Aviation CO2 emissions are the same in both scenarios as emissions from biofuels and PtX fuels are not calculated for consuming sectors.
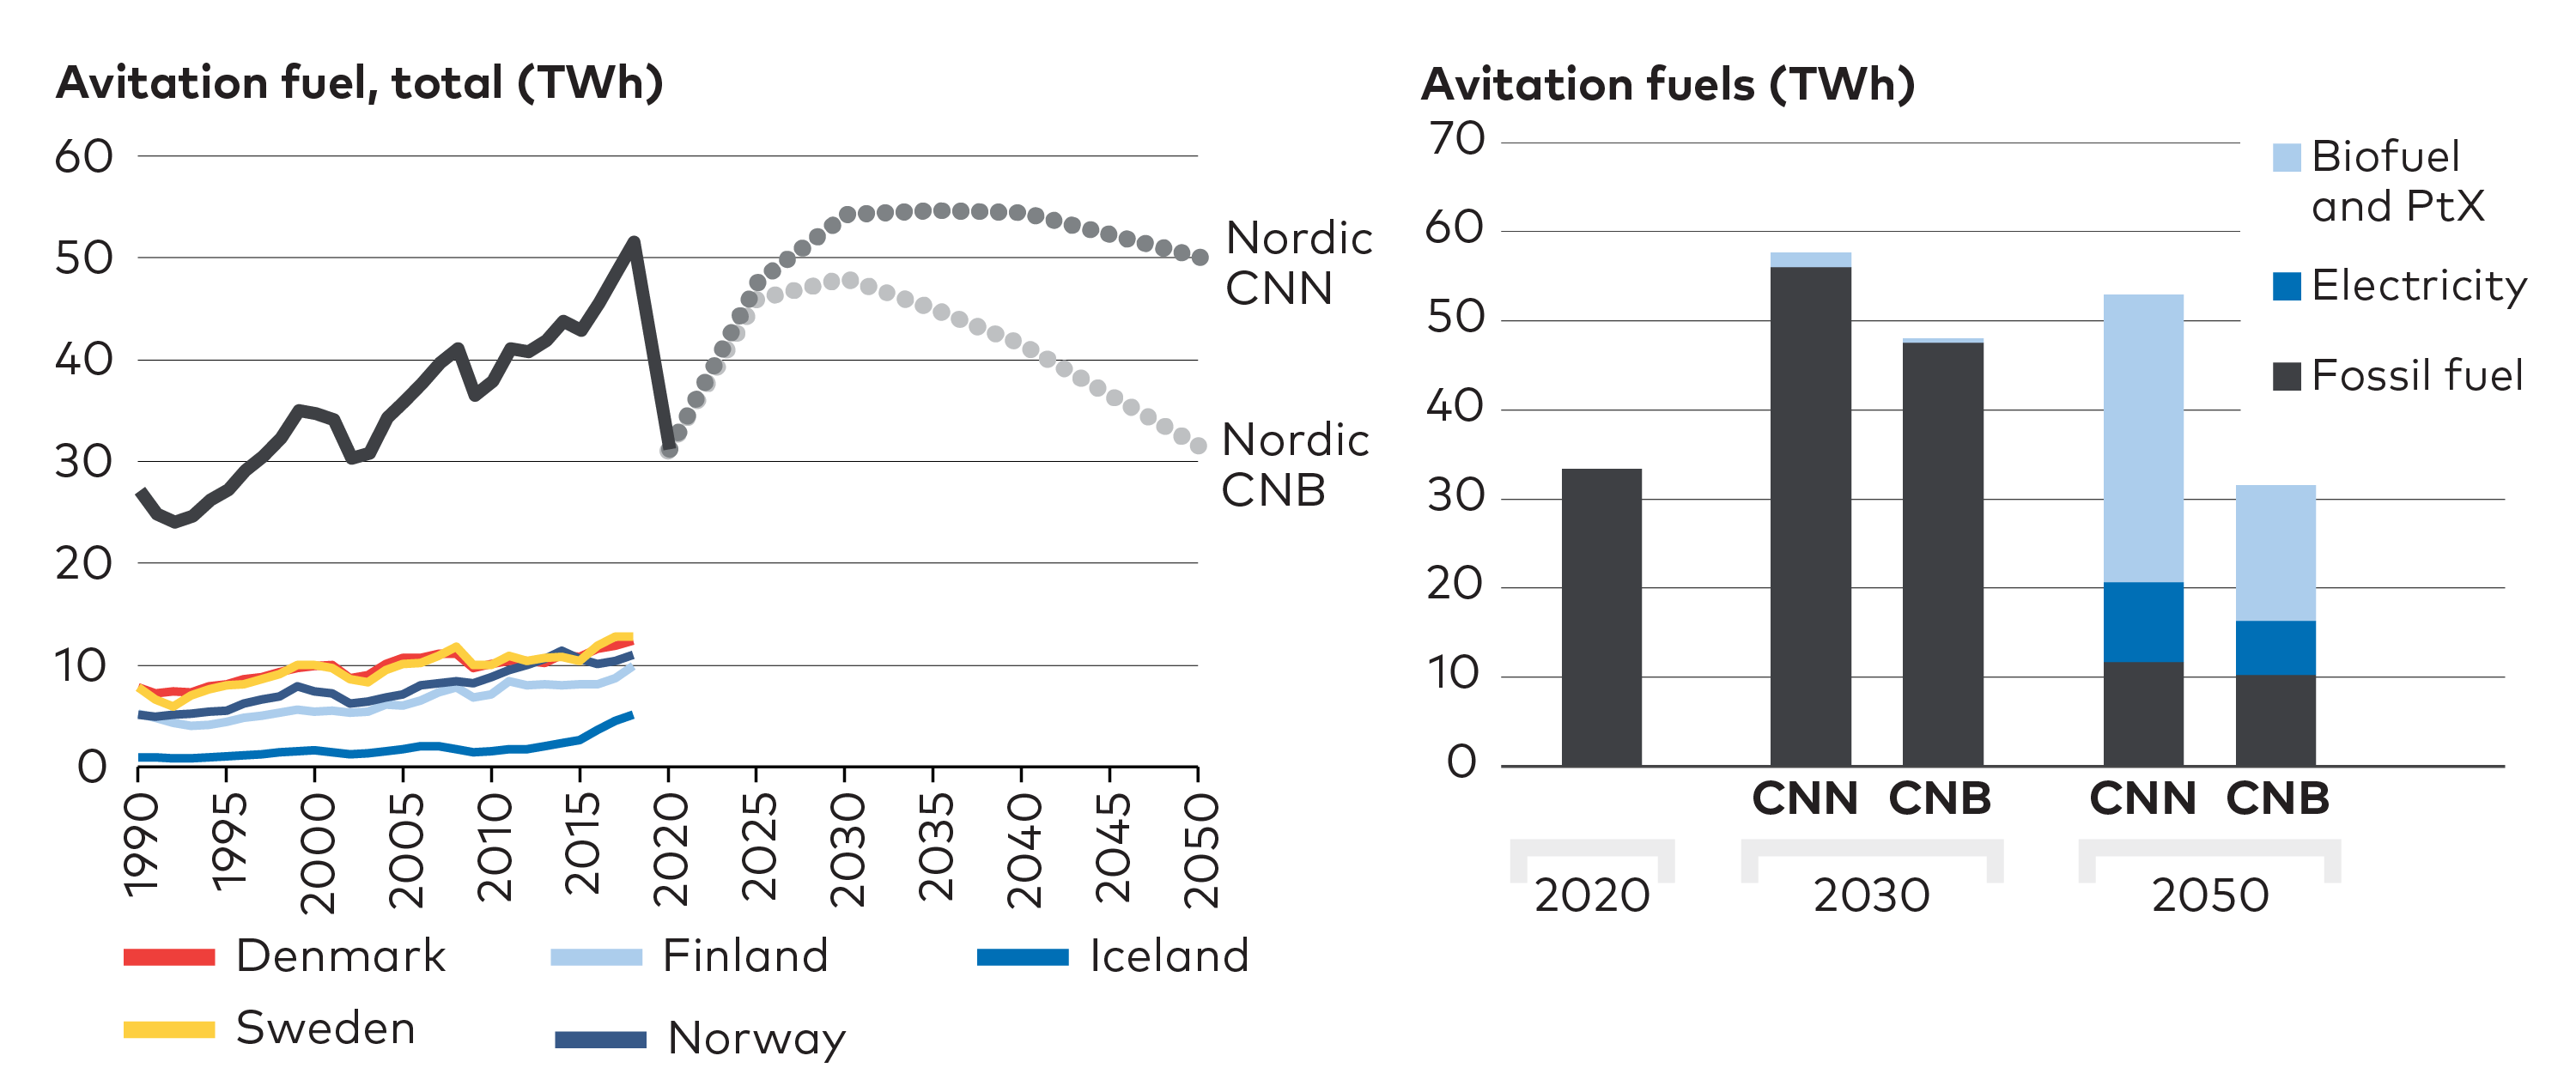
Figure 7.4. Fuel consumption in domestic and international aviation. Total fuel consumption in domestic and international aviation (left) and by fuel (right) in the CNN and CNB scenarios.
7.2.2 Effects of changes in transport behaviour
As all NCES scenarios are designed to reach carbon neutrality by 2050, behaviour changes in transport in the CNB result in quite modest changes in emissions (Figure 7.5). However, as heavy transportation is particularly difficult to decarbonise, especially aviation and shipping, lower demands would reduce the energy consumption of these sectors. This would lower the overall costs of the energy transition and make emission targets easier to achieve. Long-term, aviation can partly be directly electrified, but there is still a significant need for drop-in sustainable bioliquids and PtX liquids. Shipping can move also to natural gas and synthetic natural gas. In total, CNB has 15 TWh lower demand of bioliquids and synthetic fuels for transport and 20 TWh lower transport electricity demand than CNN in 2050.

Figure 7.5. Fuel consumption and resulting emissions drop significantly - CNN and CNB scenarios. Nordic transport sector fuel consumption, including all domestic and international transport, in CNN and CNB scenarios (left) and corresponding CO2 emissions (right).
However, what likelihood is there for change in behaviour via claims of reducing climate change impact? Considering growing trends in passenger transport on land and air coupled with insights from other studies, where coercive measures designed to influence consumer choices and behaviours received little support from citizens, pointing to a prevalence of a value-action gap. Studies in Britain and Sweden found that climate-based aviation policies received positive overall support, but respondents were more accepting of regulatory measures, such as the biofuel blending mandate. In addition, several studies on ‘flight shame’ – a social stigma linked to the acknowledgement of the high emissions caused by flying – report that the number of flights has remained stable over the past years, suggesting that flight shame has little actual effect.[1]NRK, 2019.
Footnotes
- ^ NRK, 2019.
The modest decrease in emissions seen in the modelling, resulting from increased shared mobility and lower rates of international aviation, analysed through the lens of historical trends and the presence of the value-action gap, tells us that perhaps other measures, of technological or political nature, show more promise for transformative change.
7.3 Social acceptance of wind power limiting onshore wind deployment
Massive scale-up of wind power is central in all NCES scenarios modelled. As such, citizens reactions to more and larger onshore wind farms is vital to consider; public resistance to such scale-up could become a key barrier to the proposed transition pathways.
In recent years, wind power has been among the most accepted options for electricity production, yet local opposition has led to the delay or ultimate cancellation of several projects. Particularly in Norway there has been a growing oppostion against onshore wind power.[1]Taraldsen, 2020. According to Norwegian Water Resources and Energy Directorate, NVE, support for wind power development in Norway dropped sharply from 65% in 2018 to 51% in 2019.[2]NVE, 2020. While a narrow majority still supported development of new onshore wind in 2019, the percentage of those in opposition doubled from 10% in 2018 to 24% in 2019,[3]Aasen, Klemetsen, Ursin Reed & Vatn, 2019. demonstrating how quickly attitudes can change. Finnish Energy Association’s annual survey of energy attitudes also shows volatility in opinions of wind power, with acceptance ranging from 85% (2013) to 71% (2016) and back to 83% (2019). The change can be tracked against the evolution of public arguments on feed-in tariffs.[4]Energiateollisuus, 2019.
Previous techno-economic modelling of very low social acceptance of onshore wind demonstrates the potential effects of such opposition. Lower acceptance was modelled as higher costs of onshore wind investments, added constraints on total capacity, and delayed investments that lead to higher system overall cost caused by onshore wind being compensated for by more costly PV and offshore wind.[1]Bolwig et al., 2020.
The NCES scenarios show a range of possible outcomes for wind power. Ultimately, the increasing power demand from direct and indirect electrification has a greater influence on wind power development than does the assumed higher levels of allowed build-out of onshore wind power (Figure 7.6). In the CNB, reduced energy consumption in transport results in a lower electricity and PtX demand thereby reducing wind power expansion in the scenario. This led to a situation where the model invested in a lower amount of onshore wind despite a higher threshold for build-out of onshore wind power as the demand for wind power was lower than in CNN.
Footnotes
- ^ Bolwig et al., 2020.
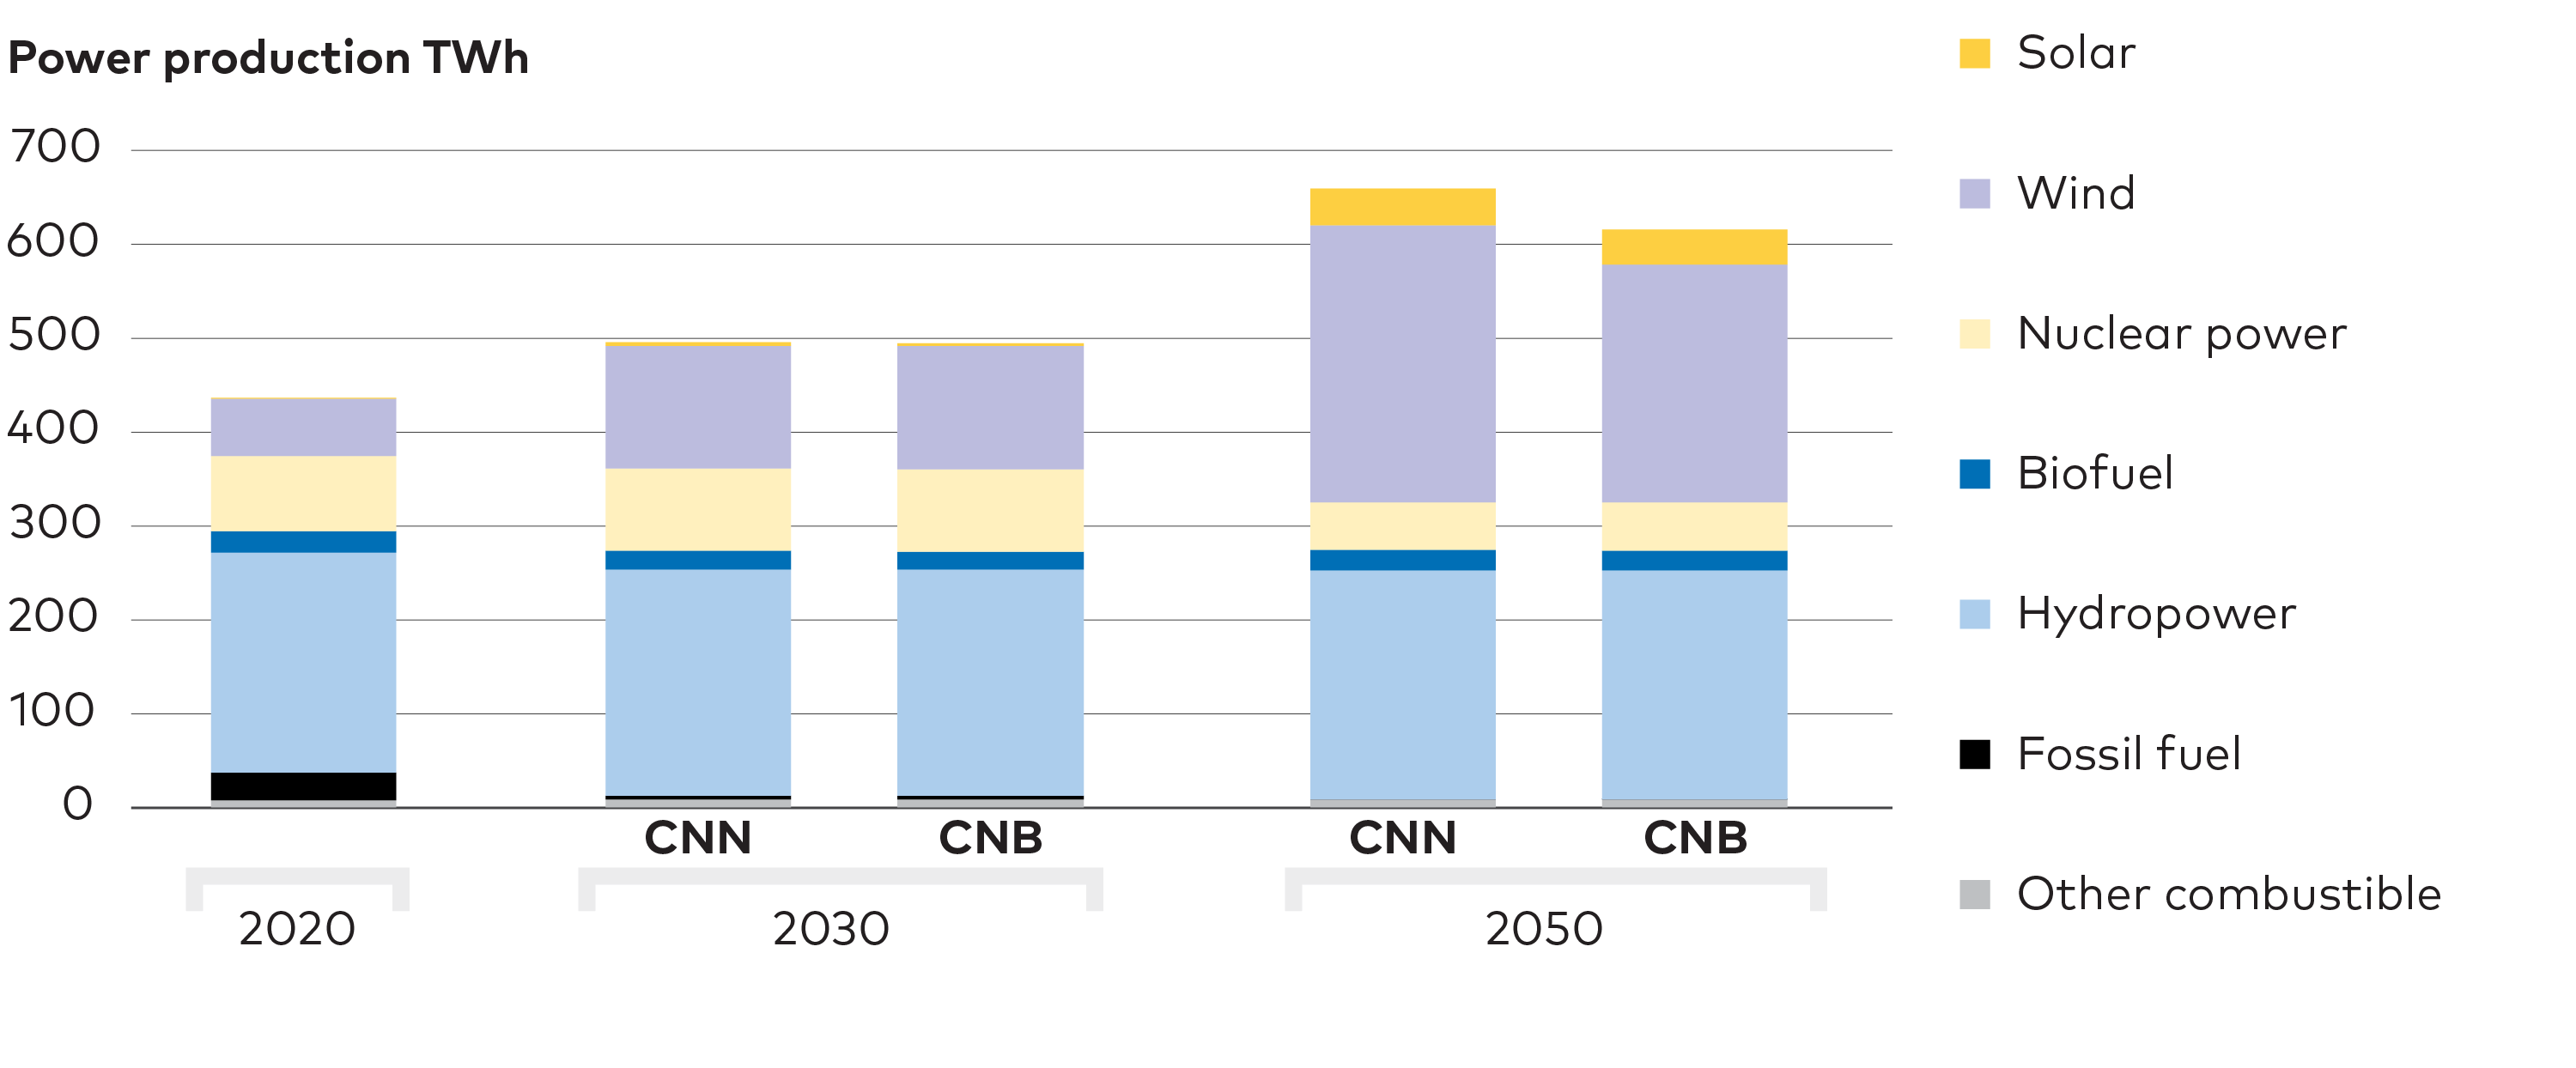
Figure 7.6. Power production development - CNN and CNB scenarios. Power production in Nordic countries by fuel in 2020 compared to CNN and CNB scenario results. Due to the lower demand for energy for transportation the model has invested in less wind power capacity in the CNB scenario than in CNN by 2050.
The acceptance of transmission lines is a similar issue to onshore wind power acceptance. Modelled scenarios also include a high increase of transmission capacities and their acceptability could be a topic for further research.
7.4 Dietary changes to improve health and reduce emissions
Agricultural emissions constituted 14% of total Nordic GHG emissions in 2018.[1]UNFCCC, 2020. These are difficult to abate with technological development alone. As discussed in Chapter 6, Nordic countries would need to compensate these emissions with negative emissions via LULUCF sinks or BECCS. Dietary changes could reduce agricultural emissions and thereby reduce the need for negative emissions.
The emerging trend of dietary changes to reduce climate and environmental impacts have in the NCES scenario CNB served as a case for behavioural changes and their potential effects on agriculture emissions. Dietary changes can lower emissions related to livestock, fodder cultivation, and fertilisation. Substituting ruminant meat - cattle, sheep, goat etc. - with pork or poultry and transitioning towards vegetarian diets have the greatest impacts. Importantly, dietary change to reduce consumption of animal products would mean smaller animal populations, potentially unlocking new possibilities for land-use in the Nordics and globally. Freed field area could be used to boost biomass availability, enhance forest sinks and biodiversity, support leisure or tourism, or maintain farming for the export of products.
Footnotes
- ^ UNFCCC, 2020.
Data show a slight decline in pork and beef consumption in the Nordic region over the period 1990-2018 while highlighting differences in consumption patterns in individual countries (Figure 7.7). A similar pattern is seen in milk consumption, which is strongly linked to beef production.
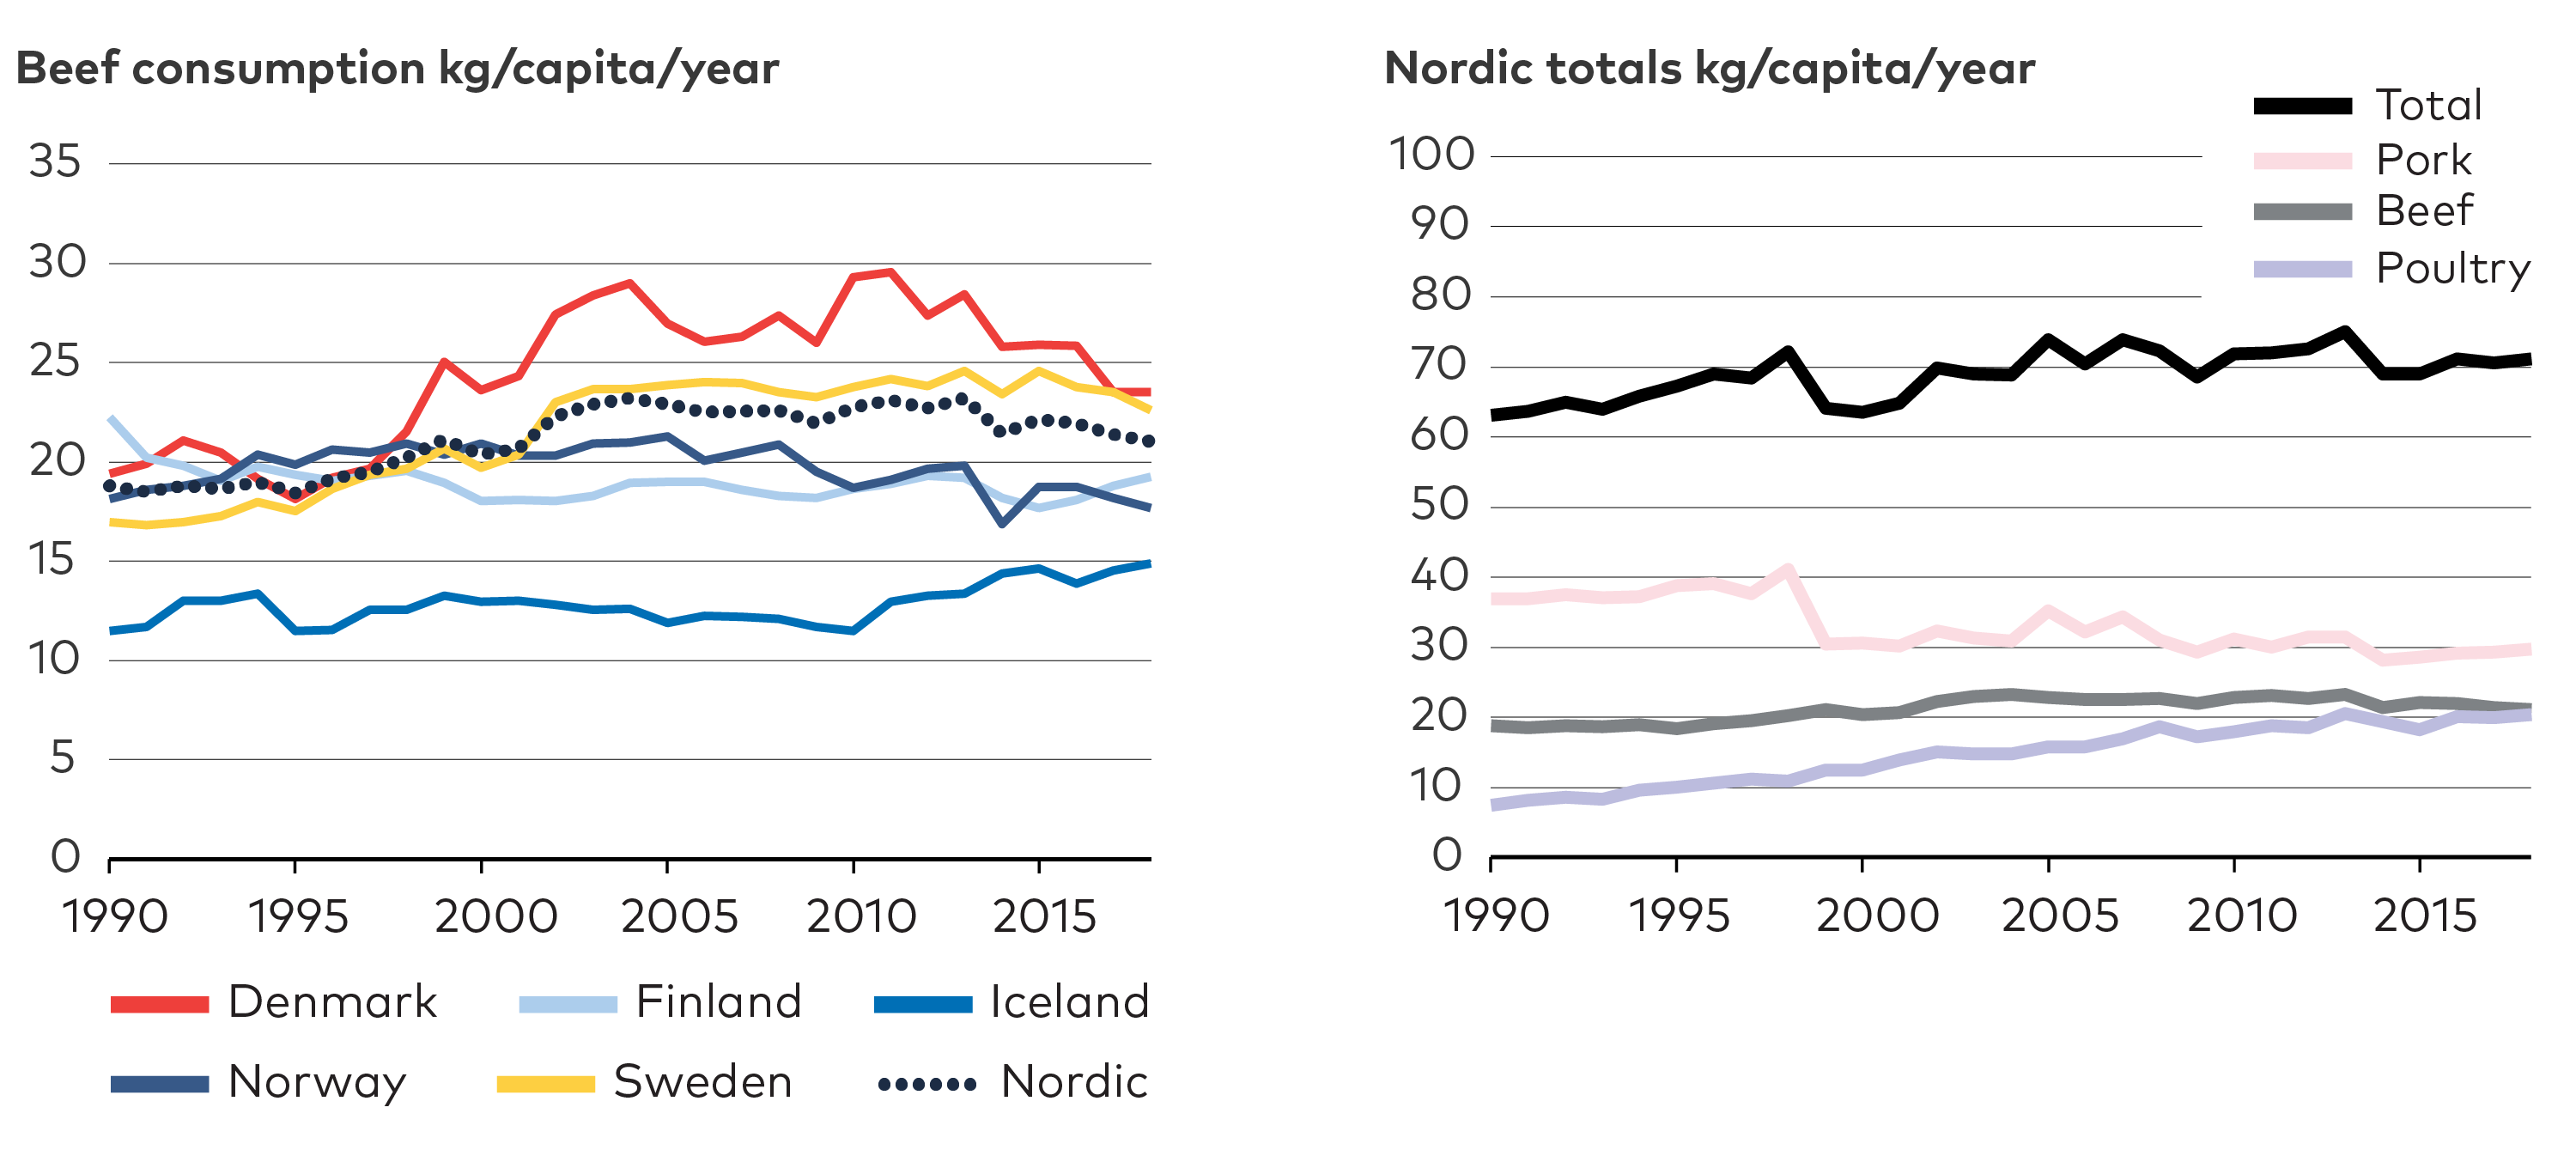
Recent studies support the continuation of the observed decline in 2019 and 2020.[1]Mikkala, 2020; Ellingsen, 2019; Jordbruksverket, 2021.Scaled up, a shift to more sustainable eating habits could reduce energy demand and associated GHG emissions while also delivering positive benefits for individual health and the environment.
The baseline development modelled by the EC estimates only slight reductions in agricultural GHG emissions by 2050. With added technological mitigation, emissions could be reduced by 30% according to the EC modelling study.[2]European Commission, 2018. Reflecting EC modelling, the CNN assumes that Nordic agricultural GHG emissions would decline by 30% by 2050 compared to 1990 by technological solutions and improved agricultural practices.
To provide an analysis of what effect a more climate-friendly diet might have on the Nordic region more ambitious reduction targets for agriculture were set for the CNB scenario. EC modelling suggests that in parallel with technological and agricultural improvements, overall reductions of animal product consumption could achieve emissions reduction of up to 45%. One Finnish study found that wide adoption of a fully vegan diet could reduce food-related emissions by 30-40%.[1]Saarinen et al., 2019. Therefore the CNB is set up to deliver 40% reductions where the additional 10% is a result of dietary changes. This equals approximately 1.3 MtCO2eqv in Denmark, 0.7 MtCO2eqv in Finland and Sweden, 0.5 MtCO2eqv in Norway, and 0.1 MtCO2eqv in Iceland. Thus, dietary changes could reduce Nordic agriculture emissions by 3 MtCO2eqv by 2050.
Footnotes
- ^ Saarinen et al., 2019.
As with the effects of transport demand changes, since all scenarios achieve the carbon neutrality target, additional reduction in agriculture GHGs did not result in a lower total of CO2 emissions (Figure 7.8). What this analysis is meant to show is how lower agriculture emissions can reduce the need for BECCS and the consequent amount of biomass needed in power and heating allowing which allows for more flexible use of the biomass. In addition, it is also likely that dietary changes would have wider impacts on GHG emissions outside of the NCES scope by reducing emissions in third countries that export food to the Nordics.
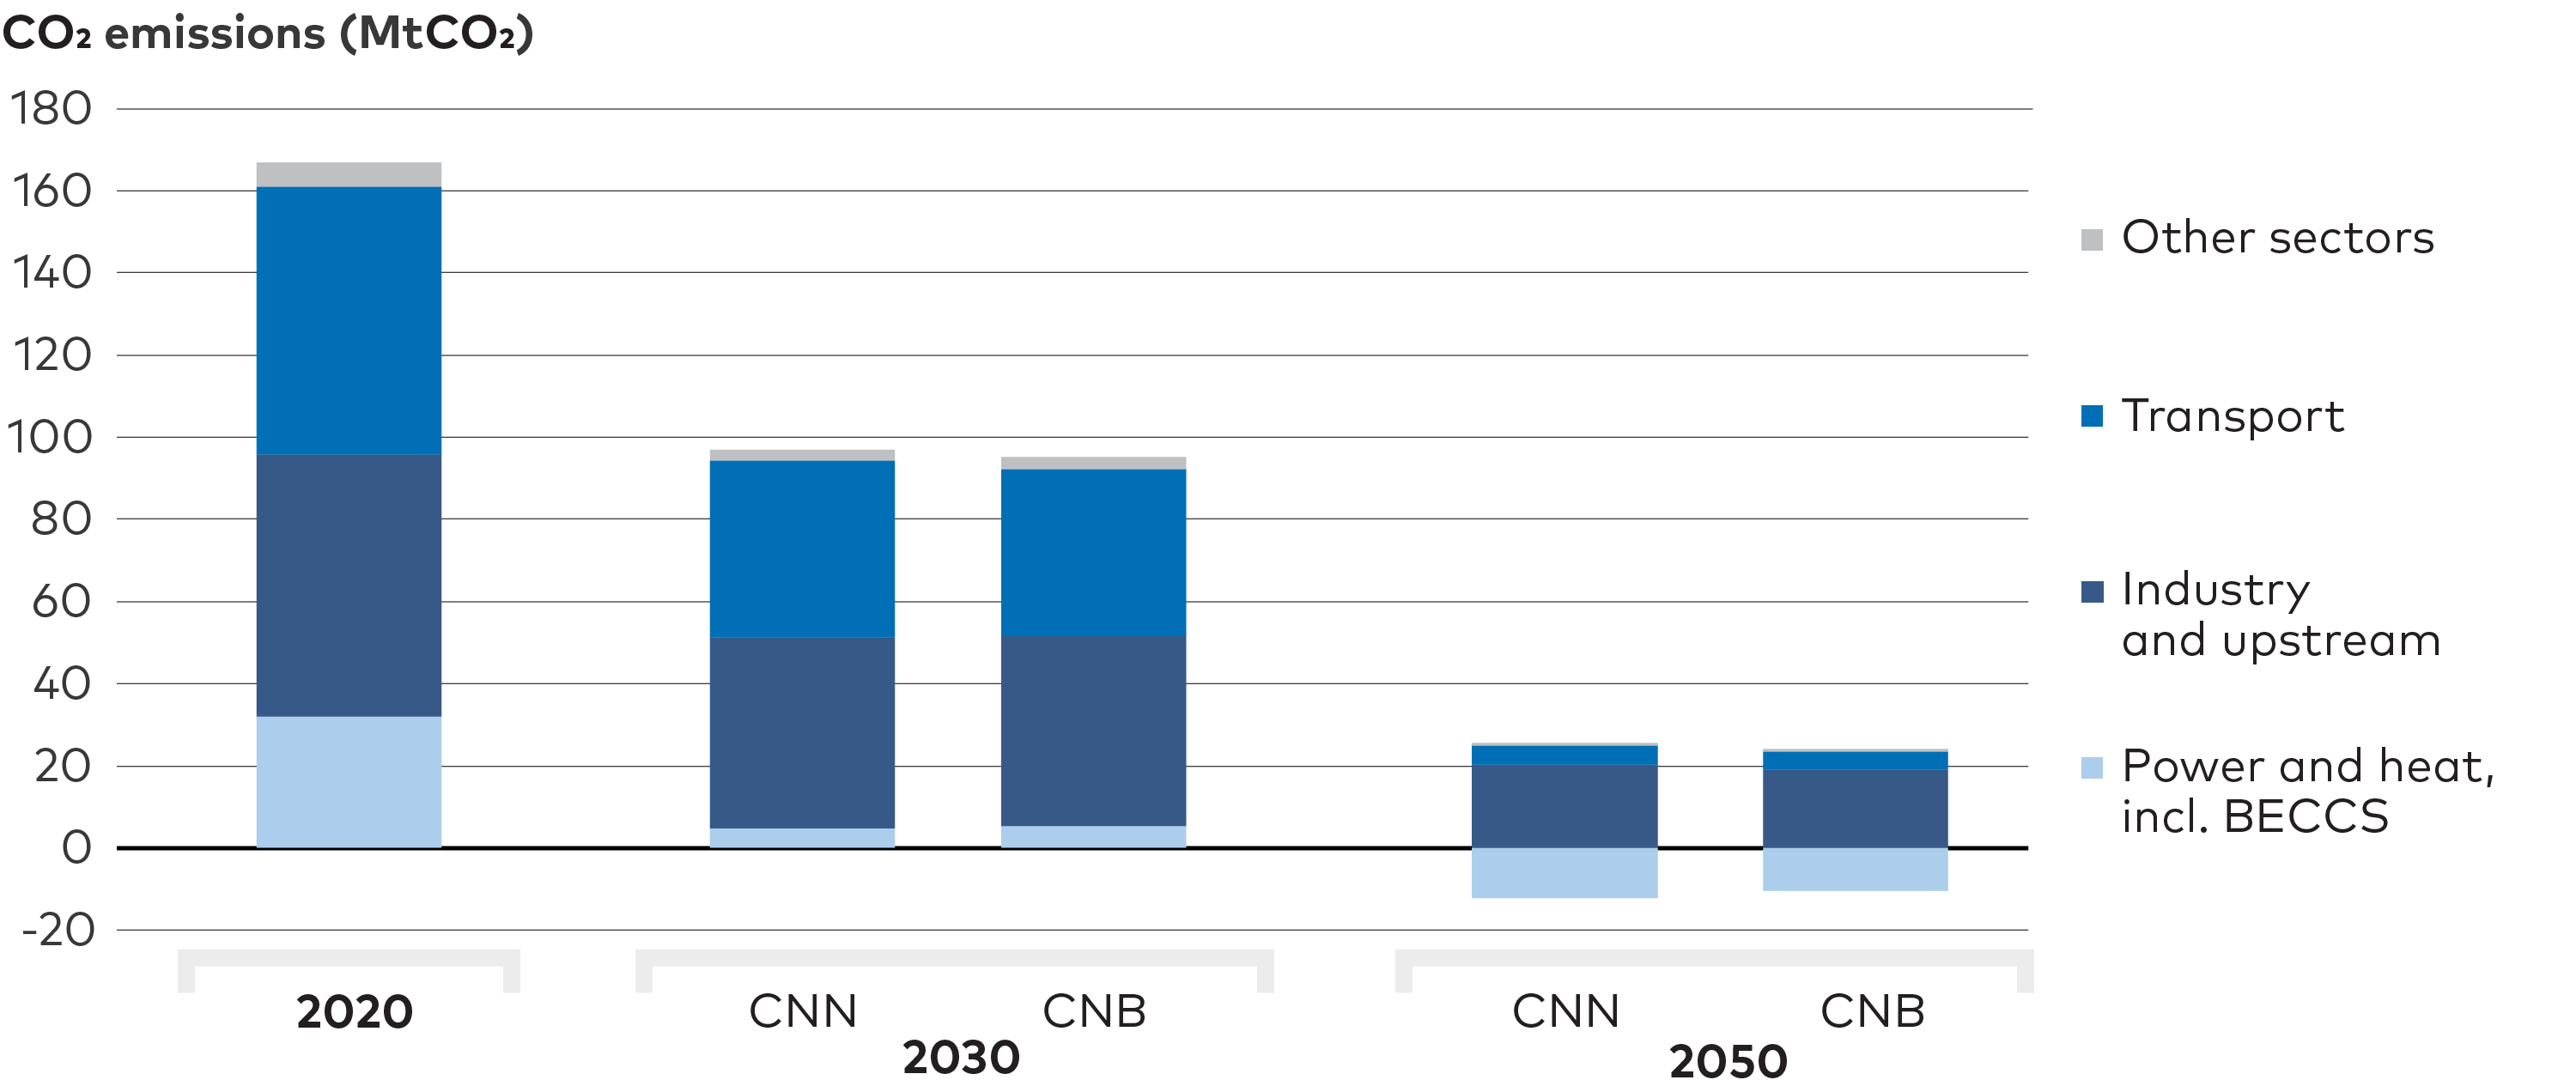
Figure 7.8. Development of CO2 emissions - the CNN and CNB scenarios. The results for CO2 emissions in the Nordic countries in the CNN and CNB scenarios are not different from each other as they both achieve the carbon neutrality target by 2050.
7.5 Target areas for behavioural change and social acceptance
Recommendations and policies that seek to guide and direct behaviour change need to be diverse and designed to target formal, collective, and individual viewpoints. Affecting only one of these three factors would result in a smaller shift in behaviour. Several previous studies clearly show that Nordic citizens demonstrate a value-action gap in that stated values and attitudes (whether personal or collective) do not necessarily correlate with action. Thus, actions and targets should seek to close this gap.
Near-term actions
-
Implement policies to encourage lower consumption and preference for products with lower CO2 footprints. Generally, these should include price signals, support for new technologies or infrastructure, labelling, information campaigns, and measures to support social groups that may lack the means to incur upfront investment costs.
-
Improve infrastructure for and access to public transport. Studies show that this can disrupt historical trends of increasing transport demand per person.
-
Recent experience with the COVID-19 pandemic having forced people into remote working revealed positive aspects that may be desirable to maintain, which could partly curb an anticipated rebound in transport volumes.
-
Build-up and enabling of new infrastructure, most importantly an extensive network of charging stations at homes and in public spaces, will be vital to encourage behavioural change in support of electrifying transport.
-
Implement measures to boost social acceptance of onshore wind. Studies suggest that the most efficient ways to do this include highlighting social justice aspects, balancing associated benefits and disturbances, increasing community engagement in wind power projects, and transparently sharing information on topics of current concern.
-
Promote dietary change through measures targeting industry and individuals. In contrast to what one might assume for such a highly individual topic, dietary changes can be influenced most effectively through industry standards or regulation that restrict the manufacture of the most CO2 intensive products within product groups and through eco-labelling (e.g. adding CO2 footprints to packaging) that encourages consumers to make more informed decisions.[1]Korkala, Hugg & Jaakkola, 2014; Hoek, Pearson, James, Lawrence & Friel, 2016
Footnotes
- ^ Korkala, Hugg & Jaakkola, 2014; Hoek, Pearson, James, Lawrence & Friel, 2016
 PHOTO: SIGURRDUR ÓLAFSSON/NORDEN.ORG
Chapter 8
A Case for Nordic Collaboration and the Nordics’ Role in the European Transition
This chapter explores the scope for Nordic collaboration and coordination related to highly interconnected energy infrastructure that is crucial in the transition of the energy sector: Power grids and interconnectors, CCS infrastructure, and the role of PtX. In these areas, the Nordic countries’ energy systems are highly dependent on each other, changes in one part of the system affects costs and opportunities in others. This analysis explores interlinkages within the Nordic context based on the NoPtX and the HighPtX cases, including how Nordic renewable energy resources can contribute to the European transition.
Key messages
-
As the generation mix of the Nordic electricity sector is transformed and wind generation take centre stage, the development of necessary infrastructure emerges as a major coordination challenge in all scenarios and cases.
-
Changes in Nordic power flows result in a need to increase the exchange capacity between the Nordic bidding zones by 60-70% between 2030 and 2050. In addition, considerable investments in both direct and hybrid interconnectors to neighbouring markets are envisaged.
-
Concerted planning and new cost distribution mechanisms are likely to be instrumental for a cost-efficient transition of the Nordic energy sector.
-
The balancing offered by Norwegian hydropower may be instrumental in a future Nordic power system dominated by wind generation. At the same time, net exports of almost 70 TWh from Norway in the NoPtX case are facilitated by transit of power via Swedish and Danish transmission grids and interconnectors.
-
PtX offers flexibility to the power system and an alternative way of exporting Nordic power surplus, representing substantial potential export value for all the Nordic countries. In extension, PtX exports would relieve the transmission grid and reduce the need for interconnectors.
-
Nordic cooperation could bring down costs of CCS deployment, for instance through economies of scale.
-
The Nordic region could play a key role as an exporter of PtX fuels and electricity to continental Europe. This could involve large revenues for Nordic energy companies and potentially have a significant effect on European GHG emissions.
8.1 Going alone or playing as a team – the benefits and drawbacks of Nordic collaboration
In this chapter we take a closer look at the division of labour between the Nordic countries in the achievement of decarbonisation and discuss to what extent it makes sense to talk about the Nordic region as one unit, to what extent national developments mutually support each other, and to what extent Nordic cooperation is instrumental to reach the decarbonisation target.
The Nordic countries do not share a common plan or policy for decarbonising the Nordic energy sector and realise the joint commitment to make the region carbon neutral by 2050. However, all the countries have similar national decarbonisation targets and commitments, embedded in the EU climate and energy framework and the Paris agreement. The NCES scenario results show that it is possible – although demanding – to decarbonise the Nordic energy sector.
The modelling rests on the assumption that each country will do what is necessary to fulfil their own national targets. At the same time, there are clear interlinkages in parts of the Nordic energy system, particularly in relation to market integration and infrastructure. Hence, changes in one part of the system affect the whole. Notably, electrification will play a vital role in the Nordic energy system, and the electricity market, apart from Iceland, is highly interconnected. Still, important decisions are not subject to common decision procedures or impact assessments. For example, infrastructure developments, renewable generation targets, infrastructure and interlinkages for PtX transportation, solutions for transport and storage of captured carbon, and the setting up of biomass markets for energy production are just some of the areas where the Nordic region is likely to benefit from concerted action.
In this chapter, we dive deeper into the topics of Nordic power market interlinkages, CCS infrastructure, improved flexibility through Nordic collaboration, and the Nordics’ role and potential contribution to decarbonisation in the larger European context.
8.2 The integrated Nordic power market is very valuable
In the sections below, we explore the revealed interlinkages and interdependencies of electricity trade routes within the Nordic area. The analysis shows that changes in the generation mix and other aspects of the Nordic countries’ decarbonisation strategies substantially affect flow patterns, prices, and grid issues in neighbouring systems. For further analyses of flexibility aspects, see Chapter 9 and Annex A.
In the analysis of power market impacts, NCES have utilised the Balmorel model to provide a detailed analysis of the power market. In this chapter, we base the discussion on the results from additional case studies presented in chapter 4, i.e., the results from the NoPtX and HighPtX cases, of which the key assumptions are presented in Table 8.1.
Table 8.1. Key assumptions underlying the power system analyses for Nordic power market interlinkages.
| NoPtX | HighPtX | CNN for comparison | NPH for comparison | |
| Modelling tool | Balmorel | Balmorel | ON-TIMES | ON-TIMES |
| Power demand to serve Nordic PtX by 2050 | 0 | 117 TWh 31% of current demand | 36 TWh | 43 TWh |
| Power for Nordic exports of PtX | 0 | 304 TWh | 0 | 152 TWh |
| EU-18 power demand to serve PtX by 2050 | 0 | 1826TWh 68% of current demand | Not analysed | Not analysed |
| Market for PtX be-tween countries | No | Yes | No | No |
| Acceptance of onshore wind in Nordic countries | Moderate | High | Moderate | Moderate |
| Investment cost of offshore wind by 2050 | 1.5 mill. €/MW for typical site | 1.1 mill. €/MW for typical site | 1.39 mill. €/MW for typical site | 1.39 mill. €/MW for typical site |
| Limit on investments in new interconnector capacity between bidding zones | 1200 MW per 10 y | 6000 MW per 10 y | Not analysed | Not analysed |
It should also be kept in mind that although the decarbonisation strategies vary between the NCES scenarios and added cases, it is assumed that within each of them, all countries pursue the same type of strategy. This is not necessarily the case, and the picture would change if countries continued to pursue independent strategies, such as the emphasis on direct electricity exports, development of offshore hubs and hybrid projects, electrification, green industry development, and PtX production, but the interdependencies would not necessarily be reduced. Thus, although the Nordic countries may not coordinate their decarbonisation strategies, there is clearly a case for coordination of power infrastructure.
8.2.1 Norway emerges as the powerhouse within the Nordics – NoPtX case
The picture that emerges in the NoPtX case is one where the Nordic countries by and large continue down the paths they have already started. At the end of these paths is a substantial change in the characteristics of the Nordic power system. Most notably, we see an increase in total wind power generation of 200 TWh from 2020 to 2050. Onshore wind capacity increases from 20 to 40 GW, while offshore wind capacity also grows to almost 20 GW in 2050. Figure 8.1 below gives an overview of changes in the generation mix per country from 2020 to 2050.

Figure 8.1. Changes to generation mix per Nordic country. Total generation by energy source, for 2020 and 2050, in the NoPtX case.
NoPtX key results for each Nordic country:
- Denmark continues to phase out thermal capacity, and from 2040 onwards more than 90 % of total power generation is based on solar and wind generation. Total generation is almost doubled from 2020 to 2050, and wind generation in 2050 amounts to 65 TWh with two-thirds coming from wind power generation offshore.
-
In Finland, nuclear capacity is increased before 2025 as Olkiluoto 3 is expected to come online by 2022. Towards 2050, nuclear capacity decreases as older units, Loviisa and Olkiluoto 1, are decommissioned. In 2050, onshore wind power accounts for about 45% of total generation, with the remainder roughly equally divided between biomass, hydro, and nuclear production. Total generation increases from just above 65 TWh in 2020 to about 95 TWh in 2050.
-
In Norway, the increase in hydropower generation is modest. Annual wind generation increases from almost 14 TWh in 2020 to 43 TWh in 2050. Offshore wind power starts to play a role after 2030 with 9 GW in 2040 and 11 GW in 2050. Total generation increases by 40%, from 150 TWh in 2020 to almost 210 TWh in 2050.
-
In Sweden, biomass and nuclear generation are gradually replaced by wind power, of which one-third of the capacity is offshore in 2050. In 2050, total generation is 170 TWh, a relatively modest increase of 20 TWh compared to 2020, with 70 TWh being wind generation.
This transition implies some dramatic changes in the trade flows and the need for grid capacity investments within and from the Nordics to continental Europe.
8.2.1.1 Substantial grid investments instrumental for decarbonisation
The transition of the Nordic electricity sector requires substantial expansion of interconnection and transmission capacity, implying a considerable acceleration of transmission infrastructure investments. While the planned and expected increase in total transmission capacity between Nordic price areas amounts to 4 GW in the decade 2020 to 2030, the modelling suggests that a more comprehensive capacity expansion is needed to accommodate the power flows foreseen in 2050. The total increase in exchange capacity between the Nordic bidding zones is 64%, representing a major acceleration of grid investments post 2030.
In addition, the model projects a tripling in direct interconnector capacity, an increase of 16 GW, to continental markets, and massive investments in offshore hub infrastructure of an additional 15 GW, as is shown in more detail in Chapter 4. Important to note is that these numbers do not include grid investments within bidding zones, which are likely to be affected as well.
The trade results reveal dramatic changes in volumes and flows. Looking exclusively at intra-Nordic trade, excluding exchange with offshore hubs and continental markets, the Nordic countries, except for Norway, are net importers in 2050 (Figure 8.2). Norwegian net exports to Denmark, Finland, and Sweden add up to 46 TWh in 2050. A substantial share of Norweigan exports, approximately 40%, stays within the Nordic market although some is transited to continental markets as well. Direct net exports from Sweden and Denmark to countries outside the Nordics, when offshore hybrid projects are not considered, amount to 11 and 7 TWh respectively.
Figure 8.2. Trade flows between Nordic countries. Net trade flows comparison between the Nordic countries in the NoPtX case in 2020 and 2050.
Total annual net exports from the Nordics amount to 42 TWh, excluding offshore capacity, in 2050. However, the total exports from Norway, including exports via direct interconnectors, is estimated to reach 69 TWh/year. Thus, in the NoPtX case, Norway emerges as the “powerhouse” of the Nordic region. To support such massive exports, substantial investment in interconnectors of 12 GW, and transmission capacity of 4.2 GW between bidding zones within Norway is envisaged. This capacity is additional to the expansion of onshore wind generation. If such investments were perceived to be made for the sake of power exports, they are likely to meet substantial public resistance if current political sentiments in Norway prevail. Apart from the substantial costs involved, the environmental consequences are likely to be met with strong public resistance.
Thus, the main picture that emerges from this case is first, that Nordic direct exports are mainly based on a Norwegian surplus, and second, that Sweden and Denmark are both net importers from Norway, but also transit countries for some of the Norwegian exports to continental Europe. If Norwegian flows cannot be transited through the Swedish and Danish grids, the alternatives are more direct export capacity, for example to the UK, lower power generation in Norway, or increased power consumption, for example from green industry. Another alternative to electricity exports is to export PtX based on renewable generation, this is the cased we explore in the HighPtX case.
8.2.1.2 If grid investments are restricted, flows find different paths
To investigate what lower grid investments would entail, we carried out a sensitivity analysis where grid expansion is restricted to 300 MW per connection per 5-year period, compared with the 600 MW restriction in the main scenario setup. As shown in Figure 8.3, stricter limitations will reduce the pace of grid expansion.
Reduced grid capacity expansion will to some extent impact generation capacity. The results show that solar generation capacity would be reduced and some of the onshore wind power would be relocated offshore. Interconnector capacities are somewhat reduced as well. Nordic power surplus is thereby not substantially reduced, but in some cases takes a different path to reach neighbouring markets.
Overall, the sensitivity shows that the transition can be achieved with lower grid capacity investments but does not change the overall conclusion. Substantial grid investments will be instrumental to achieve carbon neutrality.
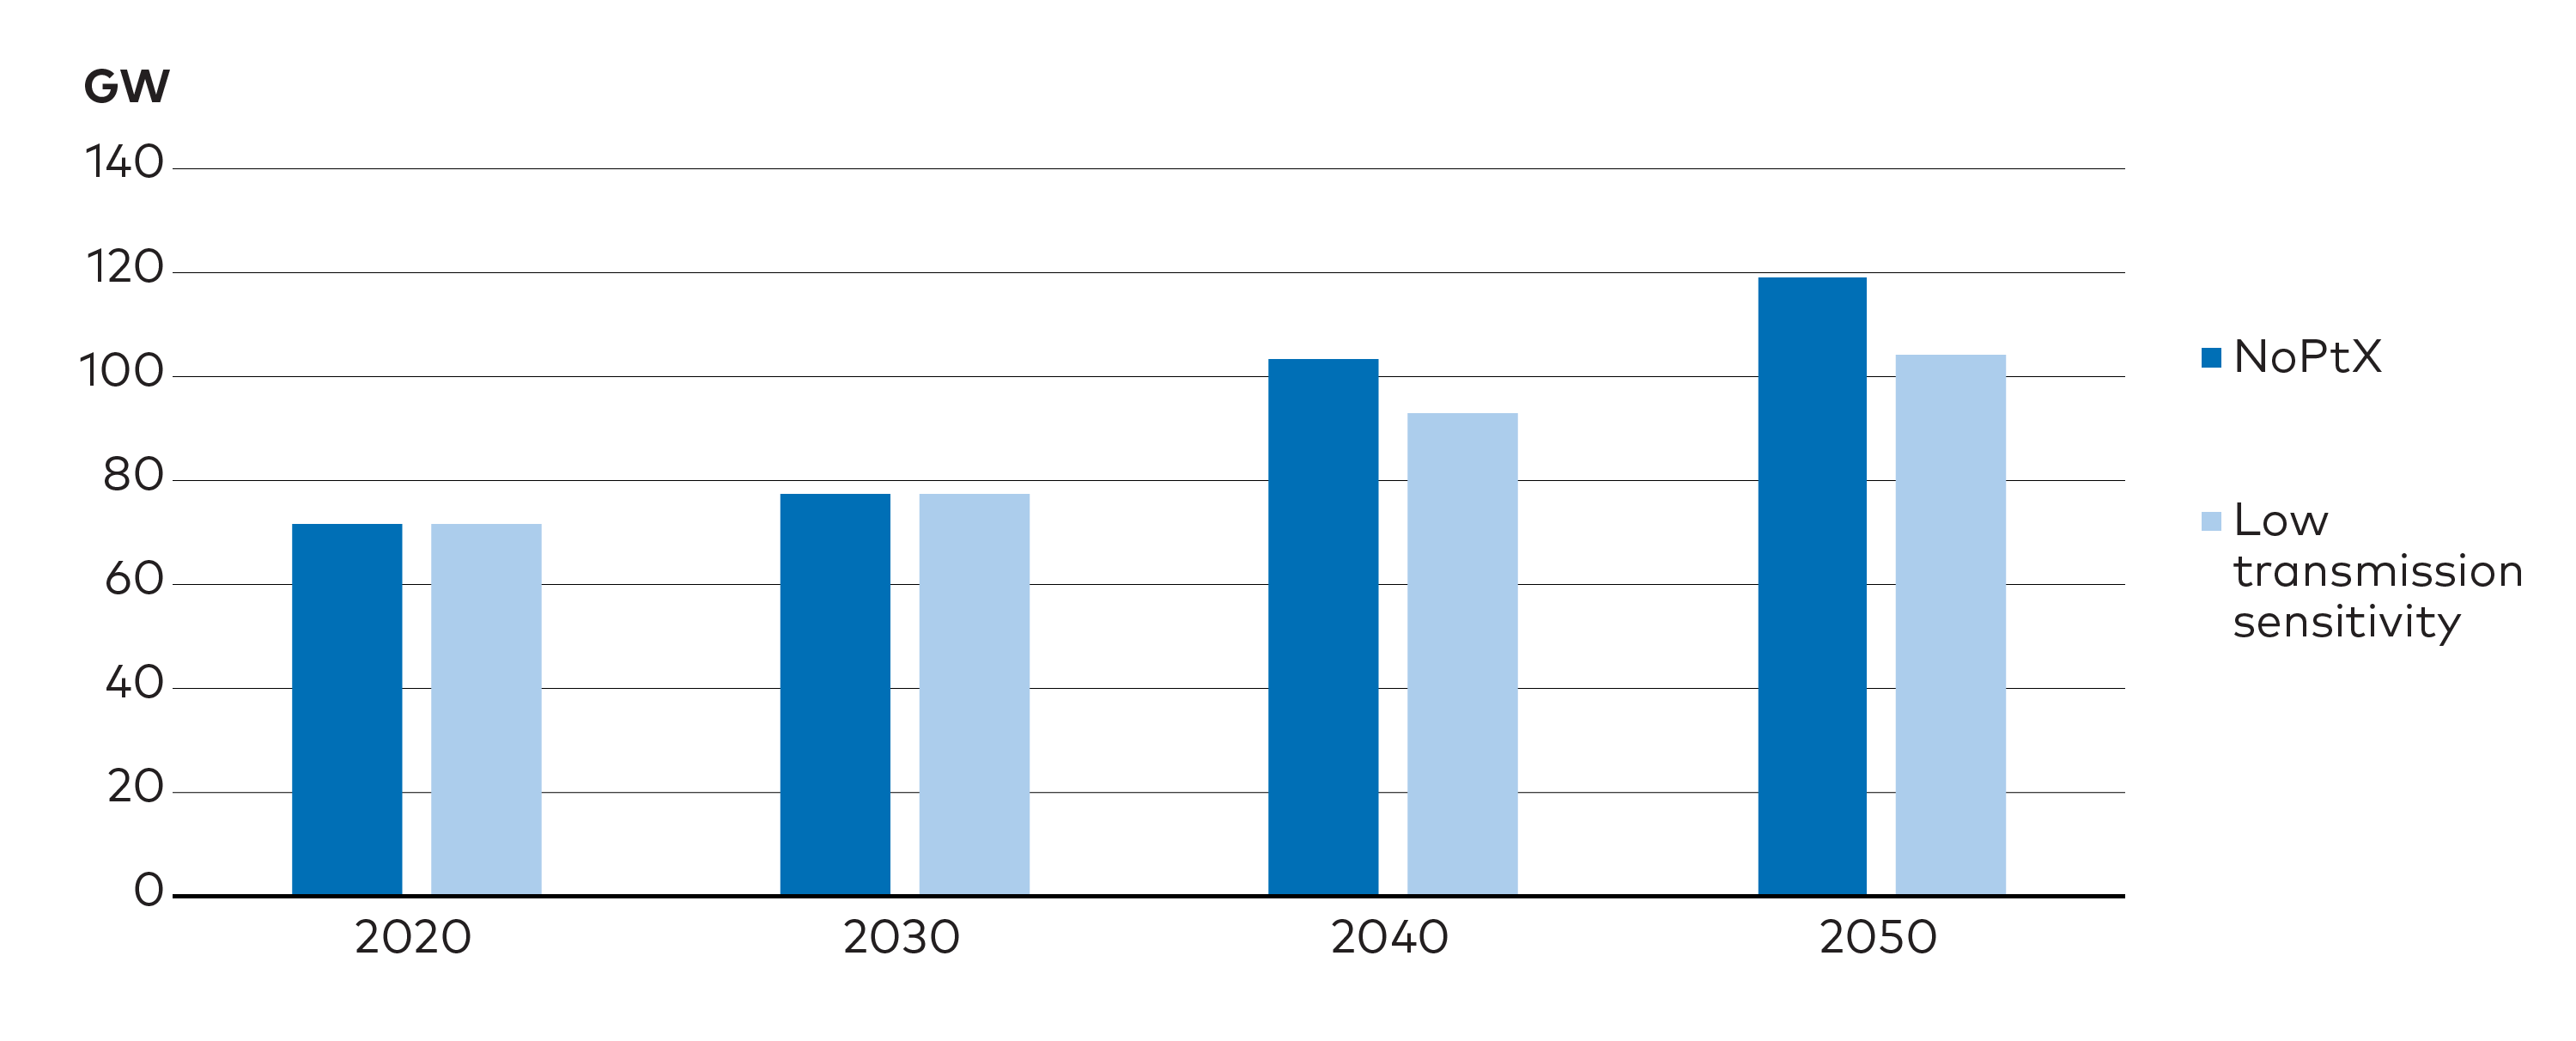
Figure 8.3. Substantial grid investments are necessary. Grid capacity expansion between Nordic bidding zones, comparison of NoPtX case and sensitivity with stronger restriction on build-out post 2030.
As grid investments are needed to realise carbon neutrality targets, several challenges arise in addition to the need to raise needed capital and manpower resources. Grid investments have long lead times, they need to be coordinated, and are likely to be met by public resistance. The Nordic TSOs have a history of cooperation and the Nordic grid is highly connected, but history also shows that there are obstacles and conflicting interests implying that grid development is not guided by a pan-Nordic approach. For the Nordics to develop the grid in tandem with a transition of generation, stronger coordination and cooperation models and reinvented cost distribution measures will be instrumental. Considering long lead times for major grid investments in general, cooperation on planning and development of cost distribution models should start immediately if the Nordic TSOs are to be able to gear up towards the investments that will be needed from 2030 onwards.
8.2.2 Denmark emerges as the dominating Nordic energy supplier – HighPtX case
In the NoPtX case, Nordic efforts are directed towards decarbonisation of the energy system through electrification. In addition to direct use as electricity, in the HighPtX case, RE resources are extensively used for PtX production for Nordic industry and export. This naturally has ramifications for electricity trade flows and grid investments. The main result of this added case analysis is that while total power generation in the Nordic region is more than doubled to just above 1100 TWh, the total expected grid investments are not very different from the NoPtX case, see detailed numbers in chapter 4 (Figure 4.10). This is because Nordic RE generation can be exported in the form of PtX volumes.
HighPtX key results for each Nordic country:
-
In Denmark, solar generation increases to 35 TWh in 2050, a 22 TWh increase from the NoPtX case. Offshore wind generation is almost five times higher at an astounding 210 TWh, making the total Danish wind generation amount to 230 TWh in 2050. Inland production of PtX uses 73 TWh of electricity while 110 TWh is exported as electricity. Thus, Denmark becomes a large exporter of both power and PtX.
-
In Finland, the changes in generation are also quite dramatic, with solar generation amounting to 22 TWh and wind generation almost doubled to 110 TWh. Nuclear is also up from 19 in NoPtX to 27 TWh since in this case the 1200 MW Hanhikivi nuclear power plant is projected to be commissioned by 2030. PtX production accounts for 92 TWh of total electricity demand. Overall, the result is that a net import demand of 14 TWh in NoPtX is replaced by a net surplus of 2 TWh.
-
Power generation in Norway increases where mainly onshore wind capacity is built out from 2035 onwards, reaching a total generation of 108 TWh in 2050. Offshore wind increases 50% compared to NoPtX, however starting from a relatively low level. Most of the increased wind generation is used for and exported in the form of PtX, representing 108 TWh in power consumption. For Norway, PtX exports partially replace direct electricity exports compared to NoPtX, implying reduced grid and interconnection investments as well.
-
Swedish total generation is also more than doubled compared to NoPtX. The increase comes from solar generation, onshore wind, and offshore wind with an additional 32, 50, and 130 TWh respectively. While supply and demand are balanced in NoPtX, Sweden becomes a net importer of electricity in the HighPtX case, as PtX production increases substantially even here.
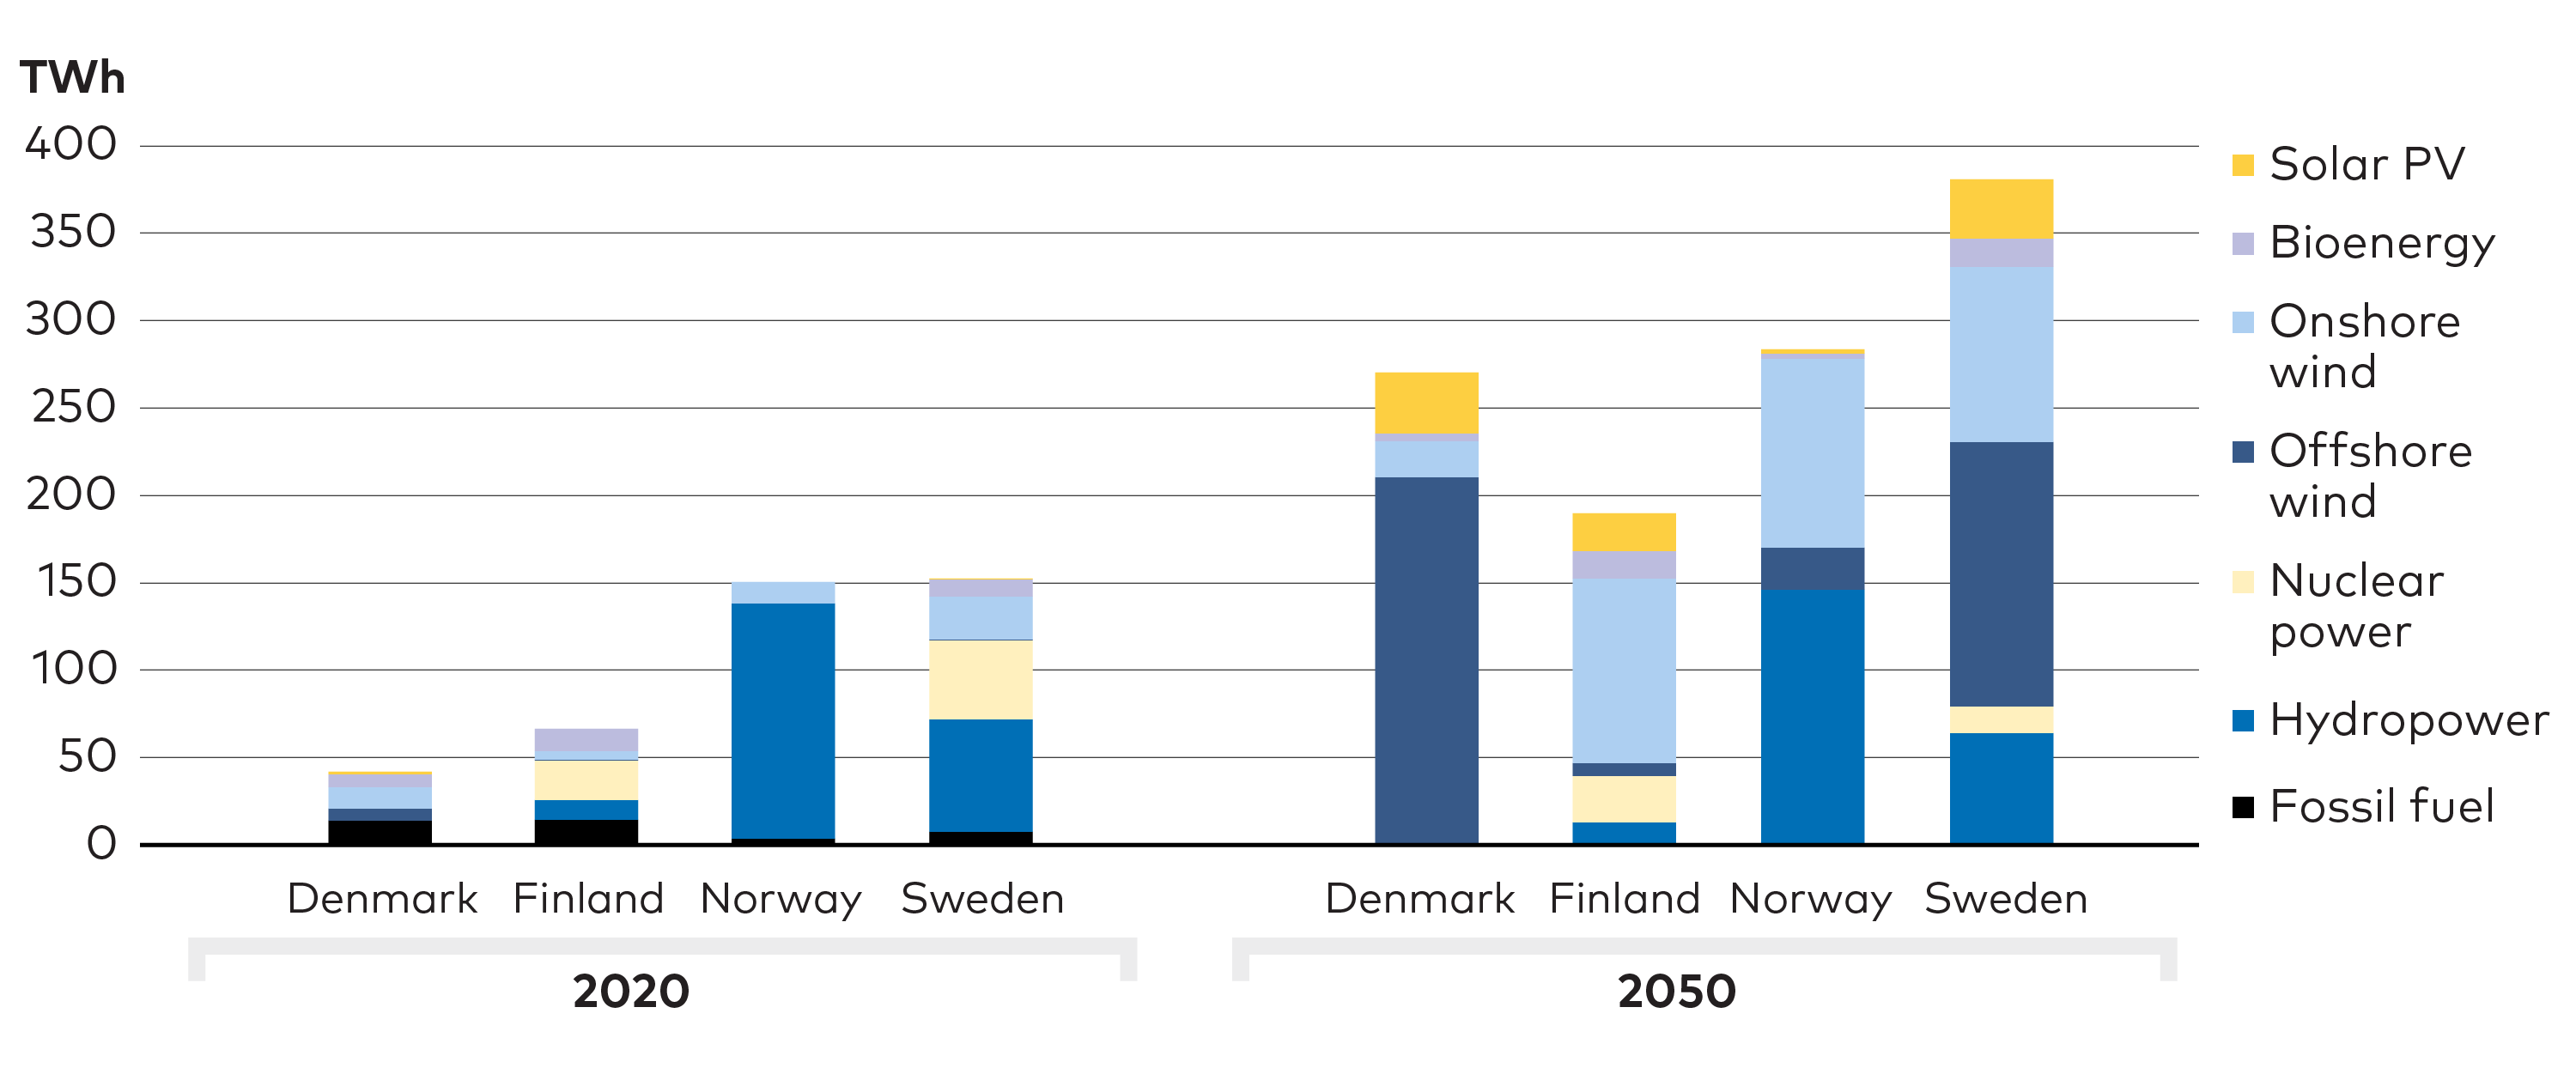
Figure 8.4. Total energy generation by source - HighPtX case. Total generation by energy source in the Nordic countries in 2020 and 2050 in the HighPtX case.
Compared to NoPtX, the net intra-Nordic power exchange drops in the HighPtX case. Notably, power exports from Norway are largely replaced by PtX exports. In the HighPtX case, the bulk of investments take place in PtX production capacity and offshore wind and offshore transmission capacity. Among the Nordic countries, the latter occurs primarily in Danish waters in the North Sea, see Figure 8.4.
Both Sweden and Denmark emerge as large electricity exporters in the HighPtX case. Although Norway still exports more than 20 TWh to its Nordic neighbours, more than half of its power surplus, this export is then transited to continental markets. Sweden also transits Danish power exports, mainly to Poland.
Overall, Denmark emerges as a dominating energy supplier and exporter from the Nordic market, based to a large extent on the access to offshore wind resources in the North and Baltic Seas, and the proximity to the European markets. Swedish net electricity exports also substantially increase to 80 TWh per year, based on expansion of both onshore and offshore wind.
PtX facilitates increased exports based on Nordic renewable electricity
The HighPtX case illustrates that PtX production and export is an alternative to direct electricity exports, and it offers an avenue by which the exports of Nordic renewables can be increased. In addition, PtX increases flexibility in the power system and reduces the need for investments in transmission and interconnector capacity. Thus, these added potentials and the location of PtX production should also be considered in the planning of intra-Nordic connectivity expansions and the planning of interconnectors.
8.3 Possible Nordic synergies in carbon storage infrastructure
As discussed in chapter 6, CCS is a necessary ingredient in the carbon neutrality targets explored in the NCES scenarios. The total captured volumes are quite distributed within the Nordic region, and except for the case of Finland are largely stored in the country where captured. For the Nordic countries, the question of deployment is rather about whether the cost of CCS could be reduced by realising synergies and economies of scale through cooperation on transport and storage solutions.
As illustrated in Figure 8.5, a significant part of storage capacity potential exists in the North Sea and is connected to depleted gas fields that are suitable for CO2 storage due to their geological characteristics and because they are already connected to the North Sea gas pipeline infrastructure.
Figure 8.5. Location of potential CO2 storage. Map outlining potential CO2 storage locations in the Nordic region. Source: Nordiccs, n.d.
For example, the demonstration project Northern Lights aims to offer the flexibility to receive CO2 from different sources by developing infrastructure to transport CO2 from capture sites by ship to a terminal outside of Bergen on the Norwegian west coast. From there, the carbon can be transported by pipe to permanent storage offshore. The project has qualified as a European project of common interest and is as such eligible to support under the Connecting Europe Facility programme. The plan is to complete the first phase of the project by mid-2024 with a capacity to transport and store up to 1.5 million tonnes of CO2 per year, and with an ambition to expand the capacity to 5 million tonnes in the second phase. The projected 2050 capacity corresponds to one-fifth of the Nordic capture volume depending on the NECS scenario.
The project is planned with spare capacity to be able to exploit economies of scale. A Norwegian analysis shows that economies of scale can be achieved both in investment and operation, implying that the transport and storage cost of subsequent projects will be lower.[1]DNV GL, 2020. While transport and storage of 0.4 - 0.8 Mton CO2 costs 6.6 BNOK in NPV terms, scaling up the capacity to 1.5 million tonnes in the first phase, increases the cost by only 1.3 BNOK. Meaning that increasing capacity times two to almost four increase costs by a mere 20%. Increasing the capacity to 5 million tonnes of CO2 in phase 2, entails larger investments and lower economies of scale in relation to the resulting expansion of storage capacity.
Footnotes
- ^ DNV GL, 2020.
8.4 The Nordic region can facilitate the European transition
In chapter 4 we explored how the Nordic region could play a key role as an exporter of PtX fuels and electricity to continental Europe. This could involve large revenues for Nordic energy companies and potentially have a significant effect on European GHG emissions.
In the HighPtX case, which exhibits a high demand for PtX fuels both in the Nordics and the rest of Europe, Nordic exports of PtX amount to approximately 210 TWh. Such exports would result in power demand of just above 300 TWh. Exports at this level would correspond to annual Nordic PtX sales in the order of 11.3 billion €, assuming PtX export takes place as green hydrogen at an estimated price of 1.8 €/kg. At the same time, the HighPtX case includes direct Nordic electricity exports of around 220 TWh, mainly to Germany and Poland, at an annual value of around 9.5 billion €. To this could potentially be added a significant export of blue hydrogen, which would be worth some 5.4 billion, assuming annual export of 100 TWh as proposed by one of the key stakeholders in Norway.[1]Falnes, 2021. In total, there is potential for exports of around 530 TWh worth more than 26 billion € annually by 2050.
Footnotes
- ^ Falnes, 2021.
Table 8.2. Potential exports of hydrogen and electricity to the rest of Europe by 2050 in the HighPtX case. It has not been analysed whether it will be more profitable to convert green and blue hydrogen to other PtX fuels that are easier to transport and store, such as ammonia or methanol. The Nordic countries could potentially supply large amounts of fossil-free energy in the form of electricity, green hydrogen, and blue hydrogen, to support the green transition in the rest of Europe.
| Potential exports of hydrogen and electricity by 2050 | Exports in TWh | Estimated value in € |
| Green hydrogen | 210 | 11.3 billion € |
| Blue hydrogen | 100 | 5.4 billion € |
| Electricity | 220 | 9.5 billion € |
| Total | 530 | 26.2 billion € |
8.4.1 Nordic export of PtX fuel and green electricity may abate up to 50 Mt of CO2 in the EU
The basis that would enable the Nordics to become a powerhouse for the European clean energy transition entails massive development of renewable generation capacity. Such a development is likely to depend on a political determination to establish PtX and green electricity as export industries in the Nordic countries and requires a shift in public acceptance in favour of the Nordics playing such a role.
The scope for such an industrial strategy also hinges on developments in continental European markets. The realisation of an offshore grid infrastructure is one crucial element, as it seems inconceivable that such a strategy can be based on onshore renewable generation. It also depends on the realisation of the European strategies for offshore wind and PtX. Will the other EU Member States be willing to be dependent on massive energy imports or scale up their PtX production and power generation from offshore wind in their own waters, solar PV, or reintroduce nuclear power at a large scale? And if they cannot import from the Nordics nor expand their own energy production sufficiently, would they rather import green hydrogen from third countries, for example, Morocco or Algeria? Or would they lower their climate ambitions in response to the potentially higher cost of green energy in the absence of import opportunities from the Nordic countries?
To illustrate the potential climate effects of such Nordic energy exports, let us, as an example, assume that two-thirds of exports from the Nordics to the EU are replaced by a mix of clean electricity and green hydrogen produced domestically in the EU or imported from third countries, and that one third is replaced by either natural gas or electricity produced from natural gas. Under these crude assumptions, Nordic exports would reduce European CO2 emissions by 48.5 Mt/year by 2050, see Table 8.3. This is more or less equivalent to total Danish GHG emissions today or almost 30% of total Nordic CO2 emissions. Compared to total EU-27 GHG emissions of around 3 900 Mt in 2018, a reduction of 48.5 Mt/year corresponds to a 1.2% decrease.
Table 8.3. Potential climate effects of Nordic exports of hydrogen and clean electricity by 2050. Nordic exports of fossil-free energy to the rest of Europe may hold significant climate effects. The effect is highly uncertain as the NCES cannot foresee how continental Europe would ensure supply in absence of a Nordic import option.
| Potential climate effects of Nordic exports of hydrogen and clean electricity by 2050 | Exports, TWh | Exports replacing fossil energy (1/3), TWh | CO2 factor of displaced fuel | CO2 reduction, Mt |
| Green hydrogen | 210 | 70 | 205 kton/TWh (natural gas) | 14.3 |
| Blue hydrogen | 100 | 33 | 205 kton/TWh (natural gas) | 6.8 |
| Electricity | 220 | 73 | 375 kton/TWh (power from natural gas) | 27.4 |
| Total | 530 | 176 | 48.5 |
8.5 Target areas for Nordic collaboration
The transition of the Nordic energy sector and the opportunities to exploit Nordic RE resources to achieve net-zero emissions and possibly contribute to decarbonisation in Europe imply substantial investments in energy infrastructure. These investments come in addition to the necessary investments in renewable electricity generation and other zero or low-carbon technologies such as carbon capture. The electricity infrastructure in the Nordic region is already highly interconnected. Changes in one part of the system affect the rest of the system, and this interconnectivity implies that the costs and results achieved by efforts by one country may rely heavily on the access to infrastructure in other countries. While it is possible to achieve net-zero emissions without coordination, successful coordination is likely to offer more efficient solutions and substantially lower costs.
- Stronger coordination of and commitments to Nordic power infrastructure planning
Near-term actions
In the near-term, coordination of power infrastructure planning emerges as urgent. Major infrastructure decisions are complex and in the context of the energy transition, should be based on a regional perspective. This requires a common understanding of system developments and the implications for different parts of the system. As a near-term action, a common Nordic action plan and roadmap should be developed as a basis to better understand the infrastructure needs, in particular for the power infrastructure. This work could form a basis to identify no-regret investment options and the most urgent projects to facilitate efficient transition. Such a plan should build on, but also strengthen the Nordic grid expansion plan, and should be backed by stronger political and financial commitments by the Nordic countries.
- Nordic cooperation on integrated offshore wind and grid development
Also, the implications of plans for offshore wind deployment and the development of offshore grids should be explored and considered in the common grid development plan.
- Common vision for the role of PtX production in the Nordics
The role of PtX and identification of the most promising sites for PtX production should also be commonly assessed, including how PtX would affect the grid expansion plan and to what extent there is a basis for a common Nordic PtX infrastructure. Here, the timing may not be as crucial as for the grid development plan, but as PtX affects grid expansion, a common long-term Nordic vision could have ramifications even for short-term infrastructure planning. As part of the development of such a vision, a common Nordic should be made the EU and central Member States such as Germany to demonstrate and explore the contribution that green PtX could make in the European transition.
- A common Nordic CCS strategy
The possibility to realise economies of scale in transportation and storage of captured carbon from distributed Nordic sites should be explored. This could be organised in a cooperative platform that could investigate and make suggestions for a common Nordic CCS strategy.
 PHOTO: YADID LEVY/NORDEN.ORG
Chapter 9
Not Everything is Uncertain: Robust Results Across all NCES Scenarios
Regardless of which decarbonisation pathway is pursued, near-term action and investments in the areas outlined in this chapter will deliver substantial benefits. Stronger grids, increased flexibility, wind and solar electricity, electrification of transport and CCS technologies are vital to all NCES scenarios. Existing solutions, like bioenergy and district heating, continue to be important, and innovative market developments can unlock the potential of both emerging and existing technologies. Energy demand reduction through efficiency improvements and behavioural change will make policy targets easier and less costly to reach. NCES analyses also show that the Nordic countries can reach their climate target without utilizing all available options. Some sectors could move faster, allowing the Nordic countries to head for more ambitious targets, should it become necessary.
Key messages
-
Certain solutions and near-term decisions are critical to all NCES scenarios. In these areas, the inevitable presence of uncertainty should not be used as a pretext for taking no action.
-
Although average prices are unlikely to rise, price variations will. Policy makers need to be prepared for this and incentivise flexibility. Unless prices can vary and sometimes rise to high levels, there will not be incentives to develop solutions to enhance flexibility.
-
Integration of markets for heat, electricity, and gas, including sector coupling, will unlock new flexibility resources.
-
Accelerate investments in stronger electricity grids and infrastructure for direct electrification such as vehicle charging.
-
Wind power dominates new electricity generation, potentially held back by lack of grid capacity and public acceptance.
-
PtX development strongly affects the prospects for offshore wind and solar PV growth.
-
Energy efficiency is a critical component in all NCES scenarios. Direct electrification plays a big part in improving efficiency, aided by broad technology development and sector coupling which reduces energy system losses.
-
Electrification of road transport, increase rapidly. Electrically chargeable cars reach 100% market share around 2025, with battery-only cars dominating the market by 2030. Electrification of trucks also accelerates but with a few years delay.
9.1 No-regret options do exist
Not everything about the Nordic energy future is uncertain. Even though projections on technology costs, political climate, and broader societal trends are notoriously difficult to produce, one should not make that a pretext for not acting.
Stronger political and investment focus on green solutions, together with technological development that has made wind, solar, and BEV’s cheaper than fossil competitors, creates a space for no-regret options. Options that make sense no matter what future scenario we investigate. In this chapter, we outline some of these options based on the solutions that appear in all the NCES scenarios.
9.2 New flexibility resources must be tapped
Taking action to increase energy system flexibility will be important in all NCES scenarios. Compared to most other countries in Europe, the Nordic countries have a strong starting point for the integration of VRE sources, but as the NCES scenarios show challenges cannot be dismissed.
Hydropower and trade have long been the dominating sources of flexibility in the Nordic power system, along with moderate amounts of biomass-fired power plants, and a small contribution of gas and oil-fired peak capacity used on rare occasions when power prices are extraordinarily high. Nuclear power provides a stable input and only rarely contributes flexibility to the system.
Quantifying flexibility resources is a difficult task, and market design will have an undeniable impact on the extent to which resources are realised. However, a sense of scale and character of different options is given in Table 9.1. Overall flexibility needs and solutions identified in the NCES scenarios are further discussed in Annex A.
Table 9.1. Overview of Nordic electricity flexibility resources in the HighPtX case of the NCES NPH scenario in 2050. Flexibility from demand and trade, within the Nordic countries and with non-Nordic countries, becomes key for integrating RE generation.
| Hydro | Intra-Nordic trade | Extra-Nordic trade | PtX | Electric vehicles | District heating | Individual heating | Industrial heat | |
| Flexibility (GW) | 30 | 124* | +/- 24 (+44)** | 59 | 25*** | 9*** | 2*** | 3*** |
| Timescale | hours-season | hours-weeks | hours-weeks | hours-season | hours | hours-season | hours | hours-season |
| * Total capacity between Nordic bidding zones which for comparison is just above 70 GW today. ** Transmission capacity between offshore hubs and third countries, most of this capacity is only available for export. *** Constrained by hourly demand profile. | ||||||||
Aspects of Nordic electricity trade has already been covered in Chapters 4 and 8. In the following is presented what new flexibility resources will grow in importance in all NCES scenarios and which can be tapped as electrification accelerate and PtX gains traction.
PLACING PTX-PLANTS CLOSE TO PRODUCTION FACILITIES AND PREFERABLY AT SITES WHERE SURPLUS HEAT FROM THE PTX PRODUCTION CAN BE USED FOR DISTRICT HEATING will both relieve the electricity grid and improve energy efficiency. However, these two location considerations will often have to be weighed against each other. Placing PtX plants as well as solar and wind generation in off-grid constellations may be a good solution if distances to the transmission network are considerable. But generally, grid connection is desirable due to synergies with the rest of the electricity system.
DISTRICT HEATING ARE AN OFTEN-OVERLOOKED POTENTIAL FOR SECTOR COUPLING, for instance through using excess heat from hydrogen production and biorefineries. Tighter integration of heat, gas, and electricity networks can add valuable flexibility to the energy system. Nordic district heating plants are often designed to handle complex fuels, including municipal waste and recycled waste wood.
BEVS AND SMALL-SCALE HEAT PUMPS COULD CONTRIBUTE WITH SHORT-TERM FLEXIBILITY TO THE ELECTRICITY SYSTEM. Their potential depends on consumer preferences and whether energy companies succeed in creating products that provide sufficient incentive for consumers to adopt more energy efficient behaviour. There may be a mismatch between the need for flexibility at the local level, where distribution companies typically prefer a relatively even load over the day, and the incentive to adapt consumption to the supply of variable electricity generation and price signals in national electricity markets.
INDUSTRY’S ELECTRICITY DEMAND FLEXIBILITY GOES BEYOND THE OPTION TO REDUCE ACTIVITY WHEN ELECTRICITY PRICES ARE HIGH. A potentially more attractive option is to establish two-tier energy supply systems, where the industry's process heat is provided from either an electric boiler or a renewable fuel boiler, depending on the relationship between power and fuel price each hour. This will require more investments in energy facilities, but in return, the company will be able to reduce its energy costs and profit from providing ancillary services to the electricity system. As more variable energy enters the grid, electricity prices will become more volatile, and the business case in such solutions could be improved.
PREPARE FOR OCCASIONALLY VERY HIGH ELECTRICITY PRICES AND POTENTIALLY INVOLUNTARY LOAD SHEDDING. The Nordic energy-only market has so far proven effective for integration of RE by providing clear price signals between consumers and producers for when and where electricity is needed. However, there is a legitimate discussion whether the energy-only model results in enough investments in peak power capacity to deal with scarcity situations and if it generates sufficiently high prices to drive the needed investments in new production capacity as well as in demand response and flexible loads like PtX plants and district heating.
GRID TARIFFS CAN ENCOURAGE USE AND PRODUCTION OF POWER AT THE RIGHT TIME AND AT THE RIGHT LOCATION. Traditionally most tariff structures have allocated almost all costs to consumption. In a modern power system, tariffs should incentivise consumers to consume electricity when the grid is not strained, encourage energy companies to locate power plants at strong spots in the grid, and provide incentives for owners of PtX plants to establish them closely to production facilities.
Local markets for flexibility, like the Energinet pilot on Lolland, the Swedish part of Coordinet, the Switch project, and the Norwegian Norflex, may prove critical to develop solutions for real-time local flexibility easing the strain on grids, and pave the way for cost-effective RE integration.
DRAMATIC ELECTRICITY GRID IMPROVEMENTS are required to enable the transformation of Nordic industry and transport. As shown in chapter 8 significant infrastructure build-out will be required: in all NCES scenarios the Nordic and European power grid is strengthened more than in the latest ENTSOE plan. Already today, there are grid bottlenecks that hinder urban and industrial development in some regions making stronger grids a no-regret option for policy-makers.
The benefit of a stronger grid is not only about ensuring adequate supply; the increase in VRE will result in production above total regional or national demand in many hours per year. A strong grid will avoid curtailment and thereby loss of energy.
On a seasonal scale, a strong grid will smooth out and make use of seasonal differences in RE potentials, sending wind power to Norway in winter when inflow is low for hydropower and in spring and summer with low wind hydropower can be supplied in turn. Equally important, short-term balancing is also dependent on efficient electricity transmission. Transmission lines can for example help move electricity from areas with high wind speeds to areas with low or no wind.
THE NCES SCENARIOS DO NOT REQUIRE DEPLOYMENT OF NEW STORAGE TECHNOLOGIES, because trade, flexibility measures on the supply side and demand response appear sufficient to provide needed flexibility. But given the relatively high curtailment levels of wind and solar in some cases – for example 5% in the HighPtX case - and the uncertainty related to cost developments of storage solutions like flow batteries and thermal electric storage, dedicated storage technologies could play a role in a decarbonised Nordic power system.
9.3 Wind and hydro will dominate nordic electricity generation, but public acceptance is not a given
Wind dominates investments in new power generation in all NCES scenarios, growing from about 15% of total Nordic electricity generation in 2020, to about 40% (CNN, CNB) or 50% (NPH) in 2050 (Figure 9.1). In the HighPtX case wind accounts for 65% of Nordic generation. In absolute terms, this means the NCES scenarios span additions of some 60-175 GW of wind power capacity and 200-700 TWh of electricity.
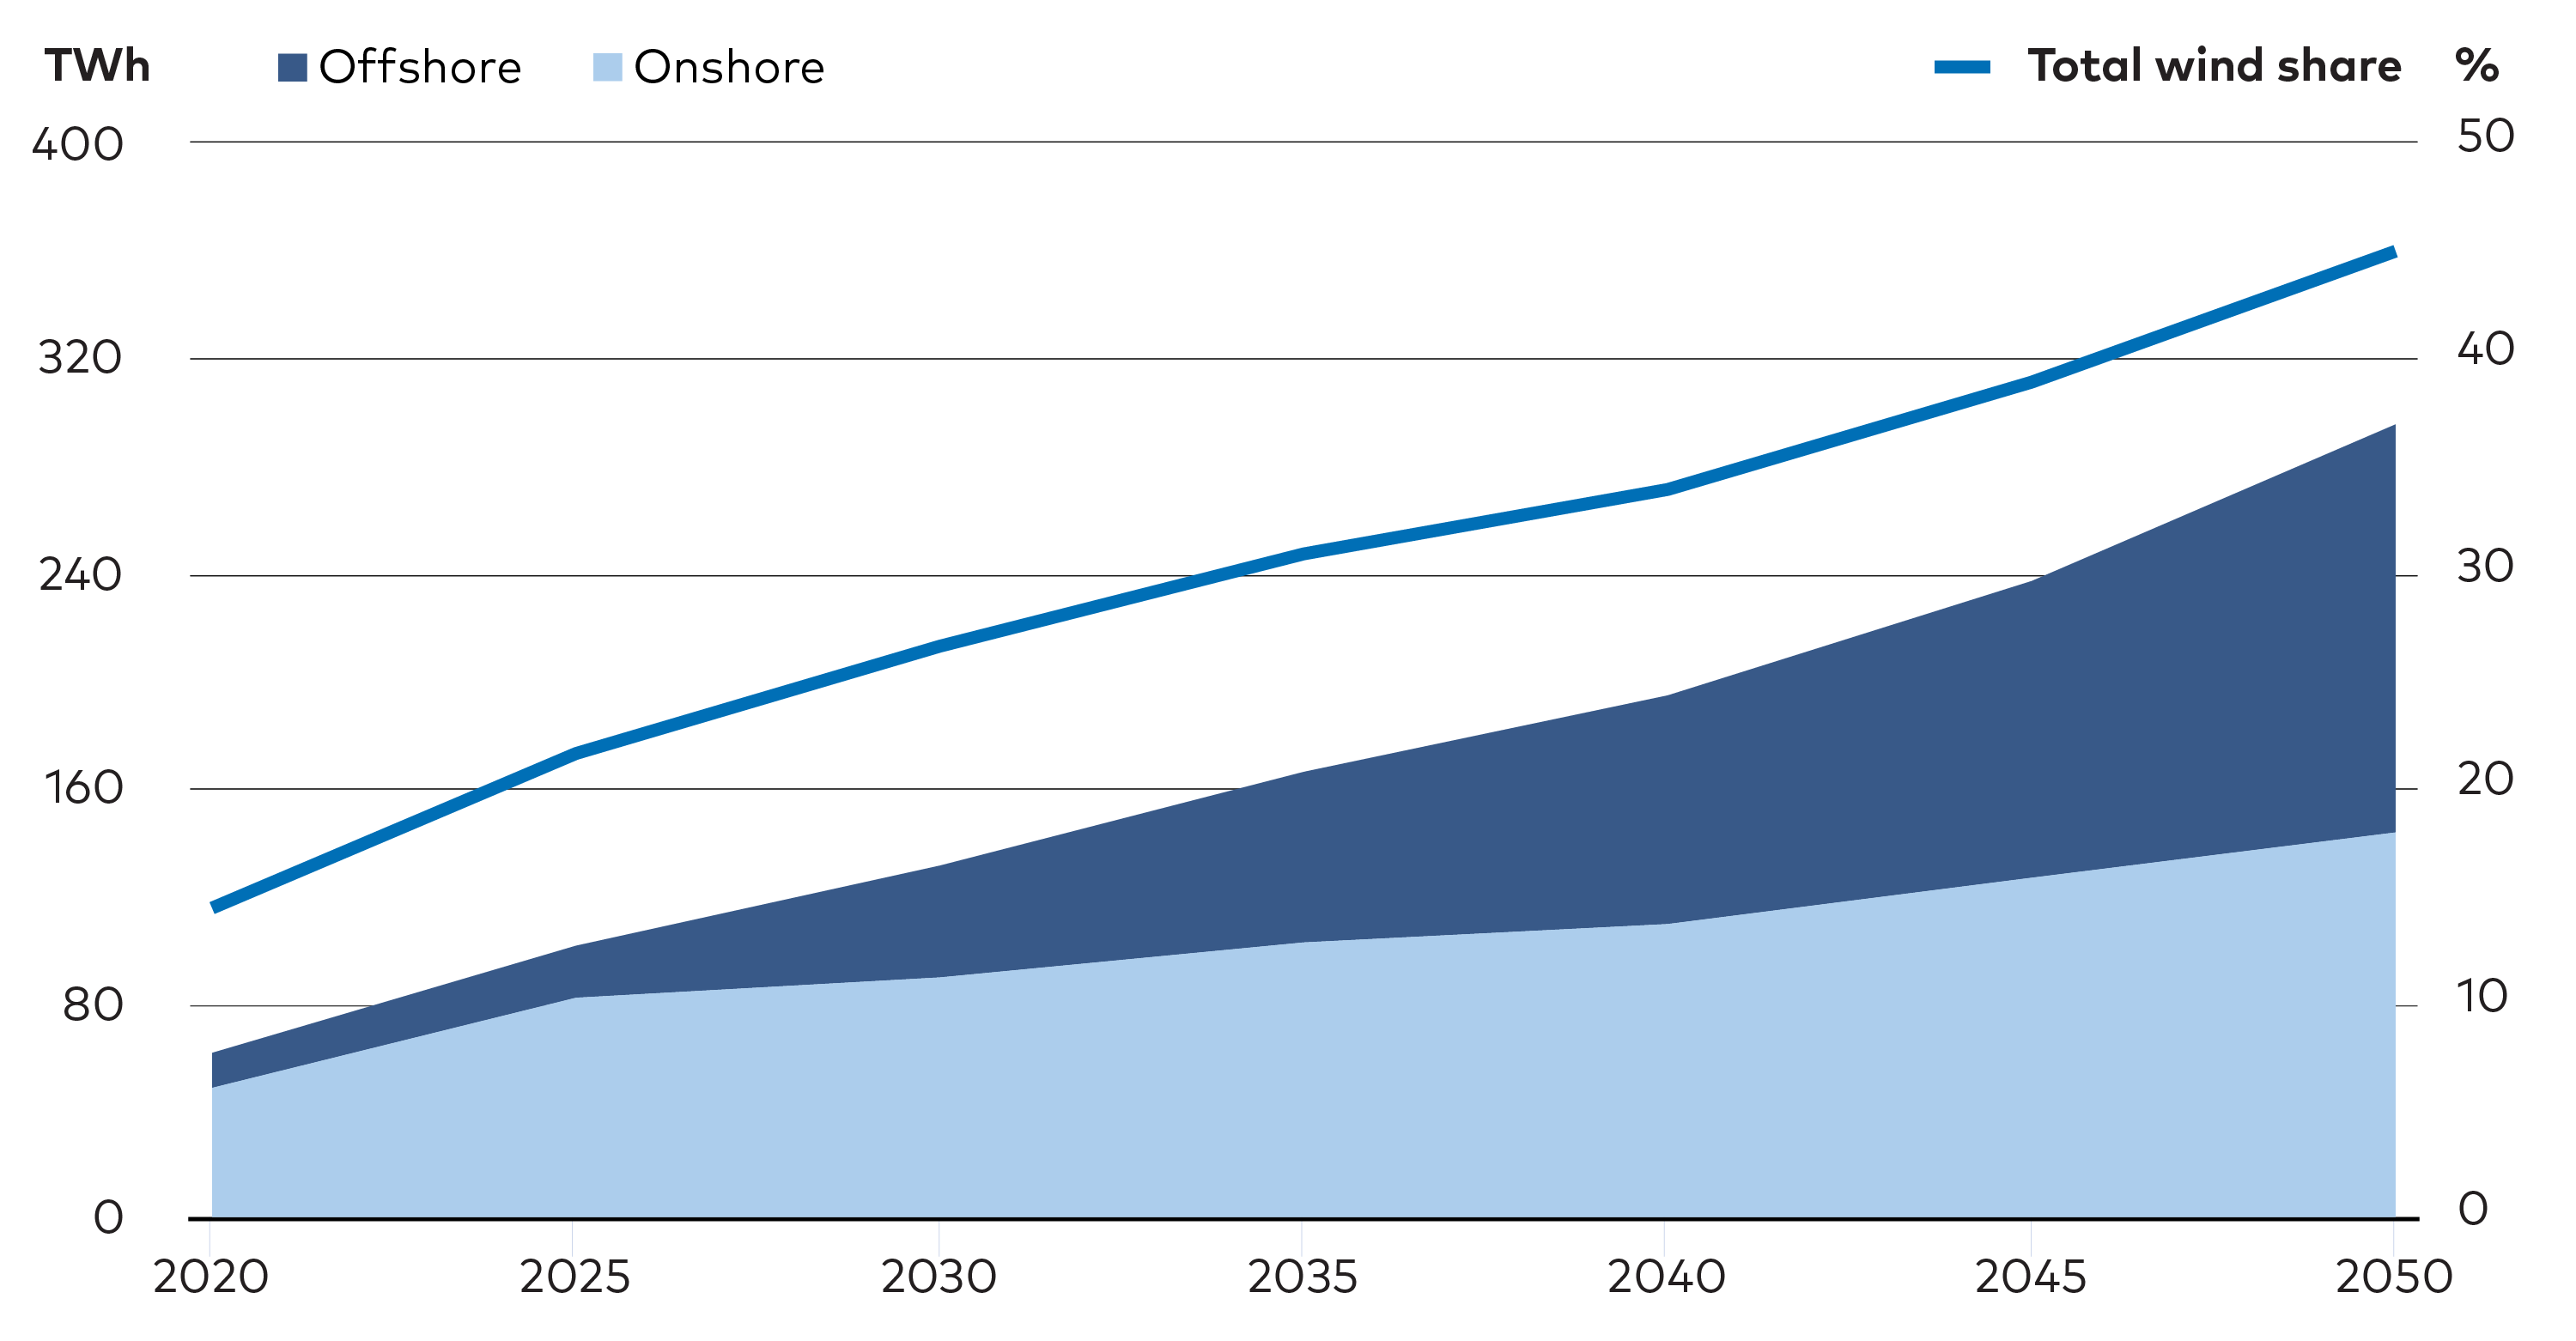
Figure 9.1. Nordic wind power generation 2020 to 2050 - NPH scenario. Nordic wind power generation grows from 15% of total generation in 2020 to almost 50% in 2050 in the NPH scenario in 2050.
Wind investments accelerate up to the maximal potential in almost all scenarios. That is no surprise, given the falling costs of wind technology and the increase in demand for both electricity and PtX fuels domestically and from other countries.
A least-cost pathway to carbon neutrality relies on realising as much of the Nordic potential as possible. Onshore wind is already the cheapest power generation option in the Nordic region-Hydropower also has low costs but on the other hand a limited growth potential. Sweden and Norway have particularly good wind resources in relatively sparsely populated areas.
However, grid capacity and public acceptance are likely to be the main growth limiters for onshore wind expansion, not cost competitiveness. The onshore wind potentials used in the ON-TIMES modelling of the CNN and NPH scenarios are shown in table 9.2. Public acceptance for these levels of expansion is far from certain. The NCES scenarios require 10-20 000 new wind turbines on- and off-shore compared with the ~6 000 turbines currently existing in the Nordic region.
Table 9.2. Onshore wind power potentials in the Nordic countries applied in the CNN and NPH scenarios developed with ON-TIMES
| Denmark | Finland | Iceland | Norway | Sweden | |
| Onshore wind power potentials (GW) | 8 | 20 | 6.5 | 14 | 28 |
However, current German levels of onshore wind can provide additional perspective. Today, almost 150 MW of onshore wind is installed per 1000 km2 in Germany. In the Nordic countries installed onshore wind capacity is 7-20 MW/1000 km2, except in Denmark which has just above 100 MW/1000 km2. Transferring German acceptance levels to the Nordics would yield a total potential of 225 GW of onshore wind (Table 9.3). To this should be added that the population density in Germany is approximately 10 times higher than in Finland, Norway, and Sweden which speaks in favour of an even larger Nordic potential.
Table 9.3. Current levels of onshore wind deployment in Germany compared with the Nordic countries.
| Onshore wind in 2019 (MW) | Area (km2) | Population density (capita/km2) | Current level of deployment (MW/1000 km2) | Deployment if same acceptance level as Germany (MW) | |
| Denmark | 4 411 | 43 094 | 135 | 102 | 6 400 |
| Finland | 2 211 | 338 145 | 16 | 7 | 50 500 |
| Norway | 2 442 | 323 802 | 16 | 8 | 48 400 |
| Sweden | 8 792 | 450 295 | 23 | 20 | 67 300 |
| Germany | 53 330 | 357 022 | 233 | 149 | 53 300 |
Citizen engagement may be as important as other requirements such as physical planning, grid development and efficient regulation to enable and handle the volumes of new wind power capacity in the NCES scenarios, particularly onshore.
Offshore wind also grows in all scenarios (Figure 9.2) its deployment depending on the cost relationship between offshore and onshore wind, the need to power PtX plants, and the acceptance for onshore wind turbines.
Offshore wind is still dependent on policy support to be competitive, for example by governments providing grid connection free of charge but could reach cost-parity around 2030.
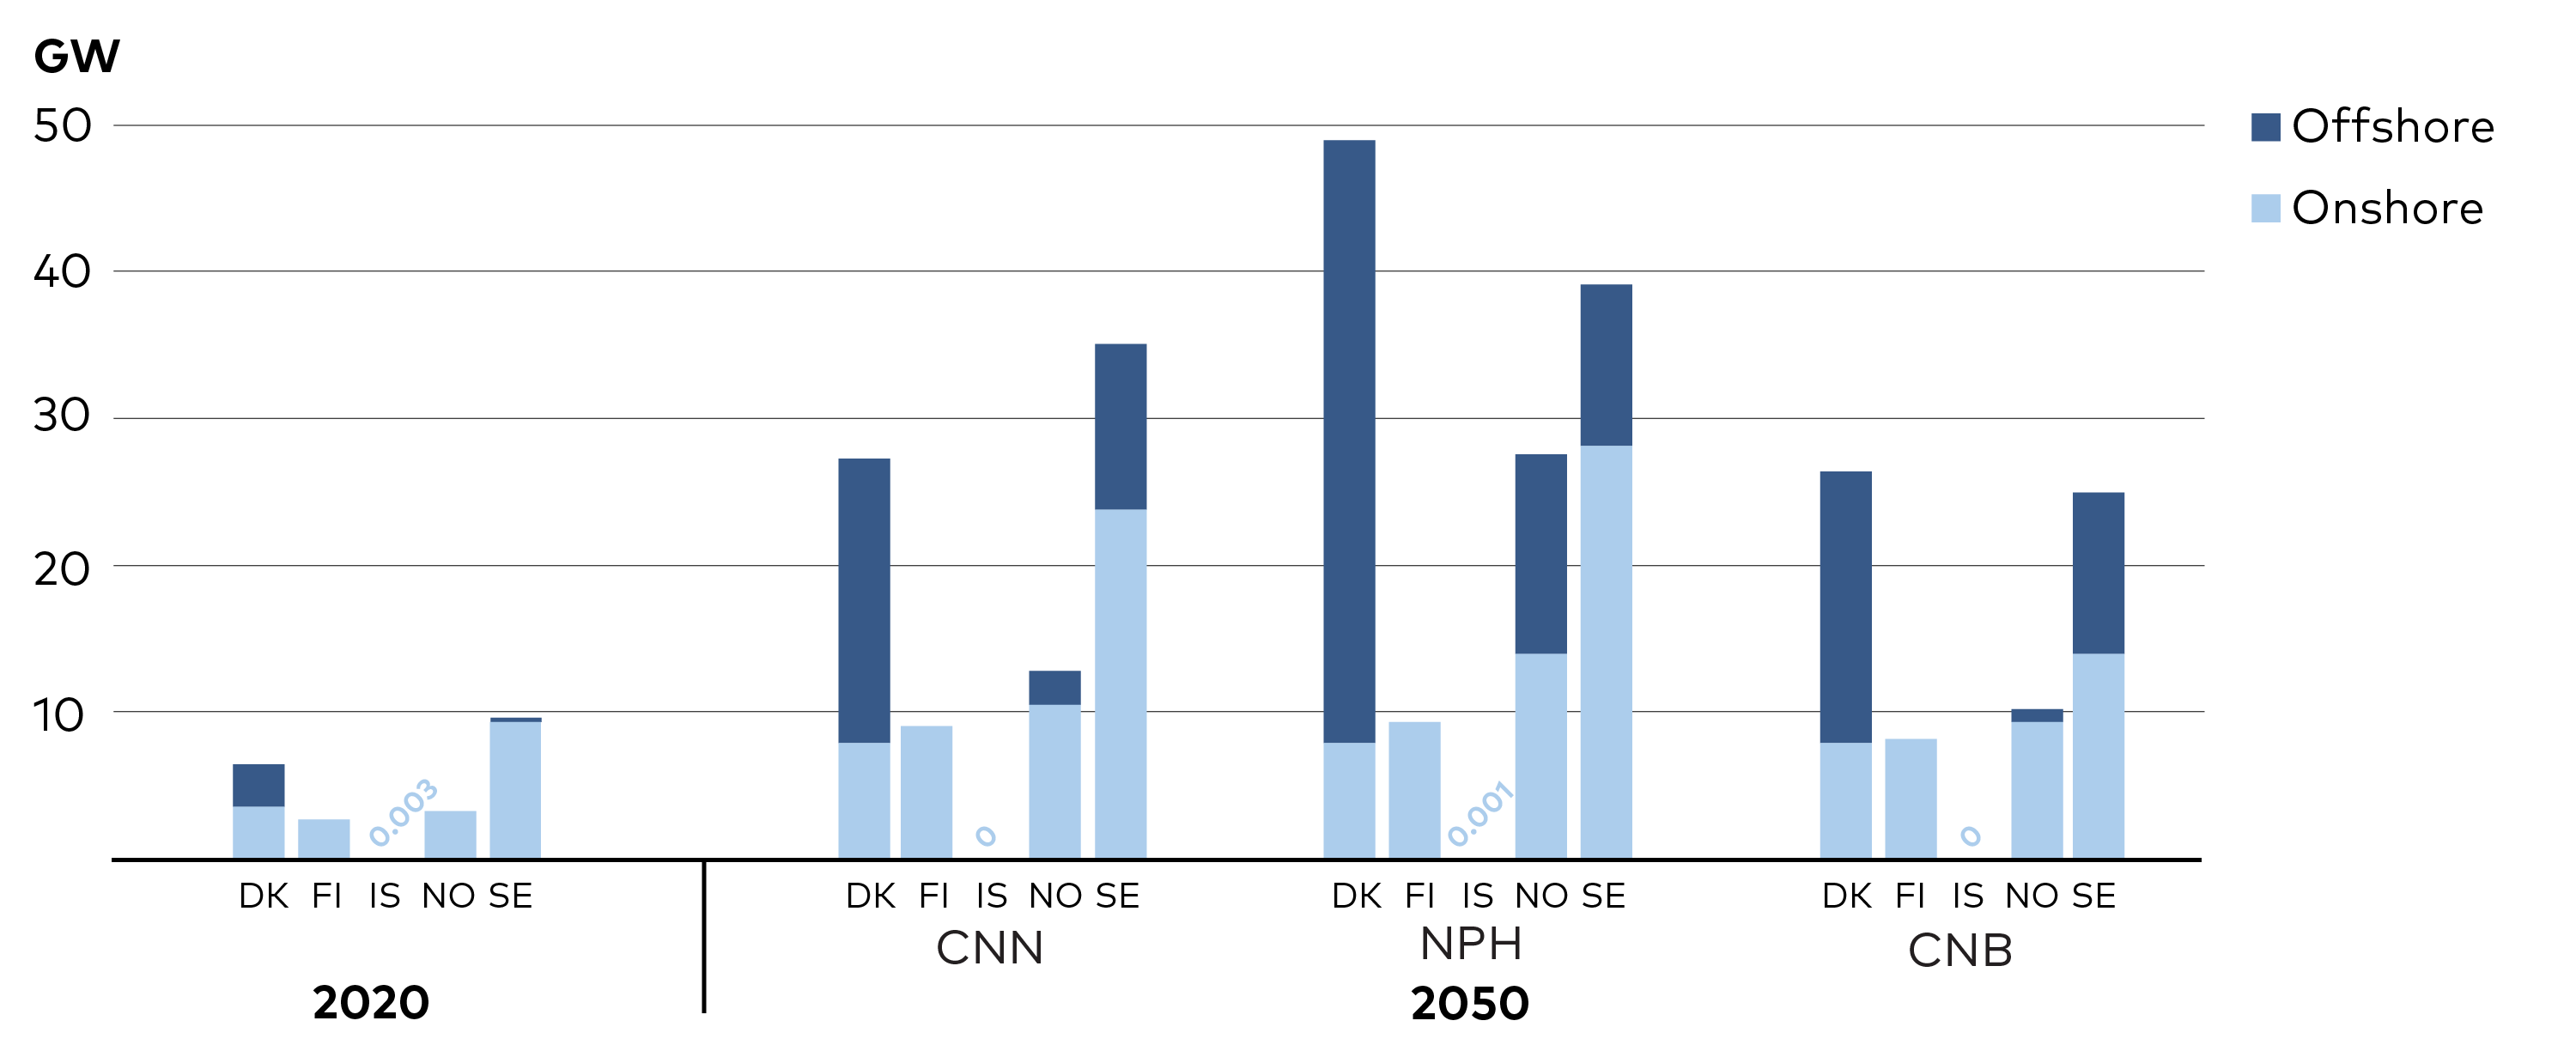
Figure 9.2. Installed wind power capacity by country in 2020 to 2050. Onshore and offshore wind power grow in all scenarios, with offshore accelerating later than onshore.
Demand for PtX is a crucial factor for offshore wind development, along with acceptance for onshore wind. The PtX cases that were analysed with the Balmorel model, show that if electricity demand for PtX does not take off there will be a need for only around 20 GW of offshore wind in the Nordic countries by 2050. If PtX materialises as projected in the HighPtX case (see Chapter 4), however, offshore wind deployment increases to somewhere between 30 and 90 GW by 2050.
9.4 Solar power expands from a low base
Solar power is currently almost negligible in all Nordic countries except for Denmark, which had just over 1 GW installed capacity by end of 2019. At the Nordic level solar PV capacity grows to 12-16 GW in 2030, most of which located in Denmark.
By 2050 Nordic solar capacity could grow to some 30 - 40 GW in the main scenarios (Figure 9.3) This growth in solar power is driven by its low levelized cost of energy, which are projected to continue to drop. However, solar power has a cannibalising effect on the power price, since generation is concentrated over relatively few hours (900-1000 full-loads annually in the Nordic countries), which holds back deployment particularly in Finland, Norway, and Sweden.
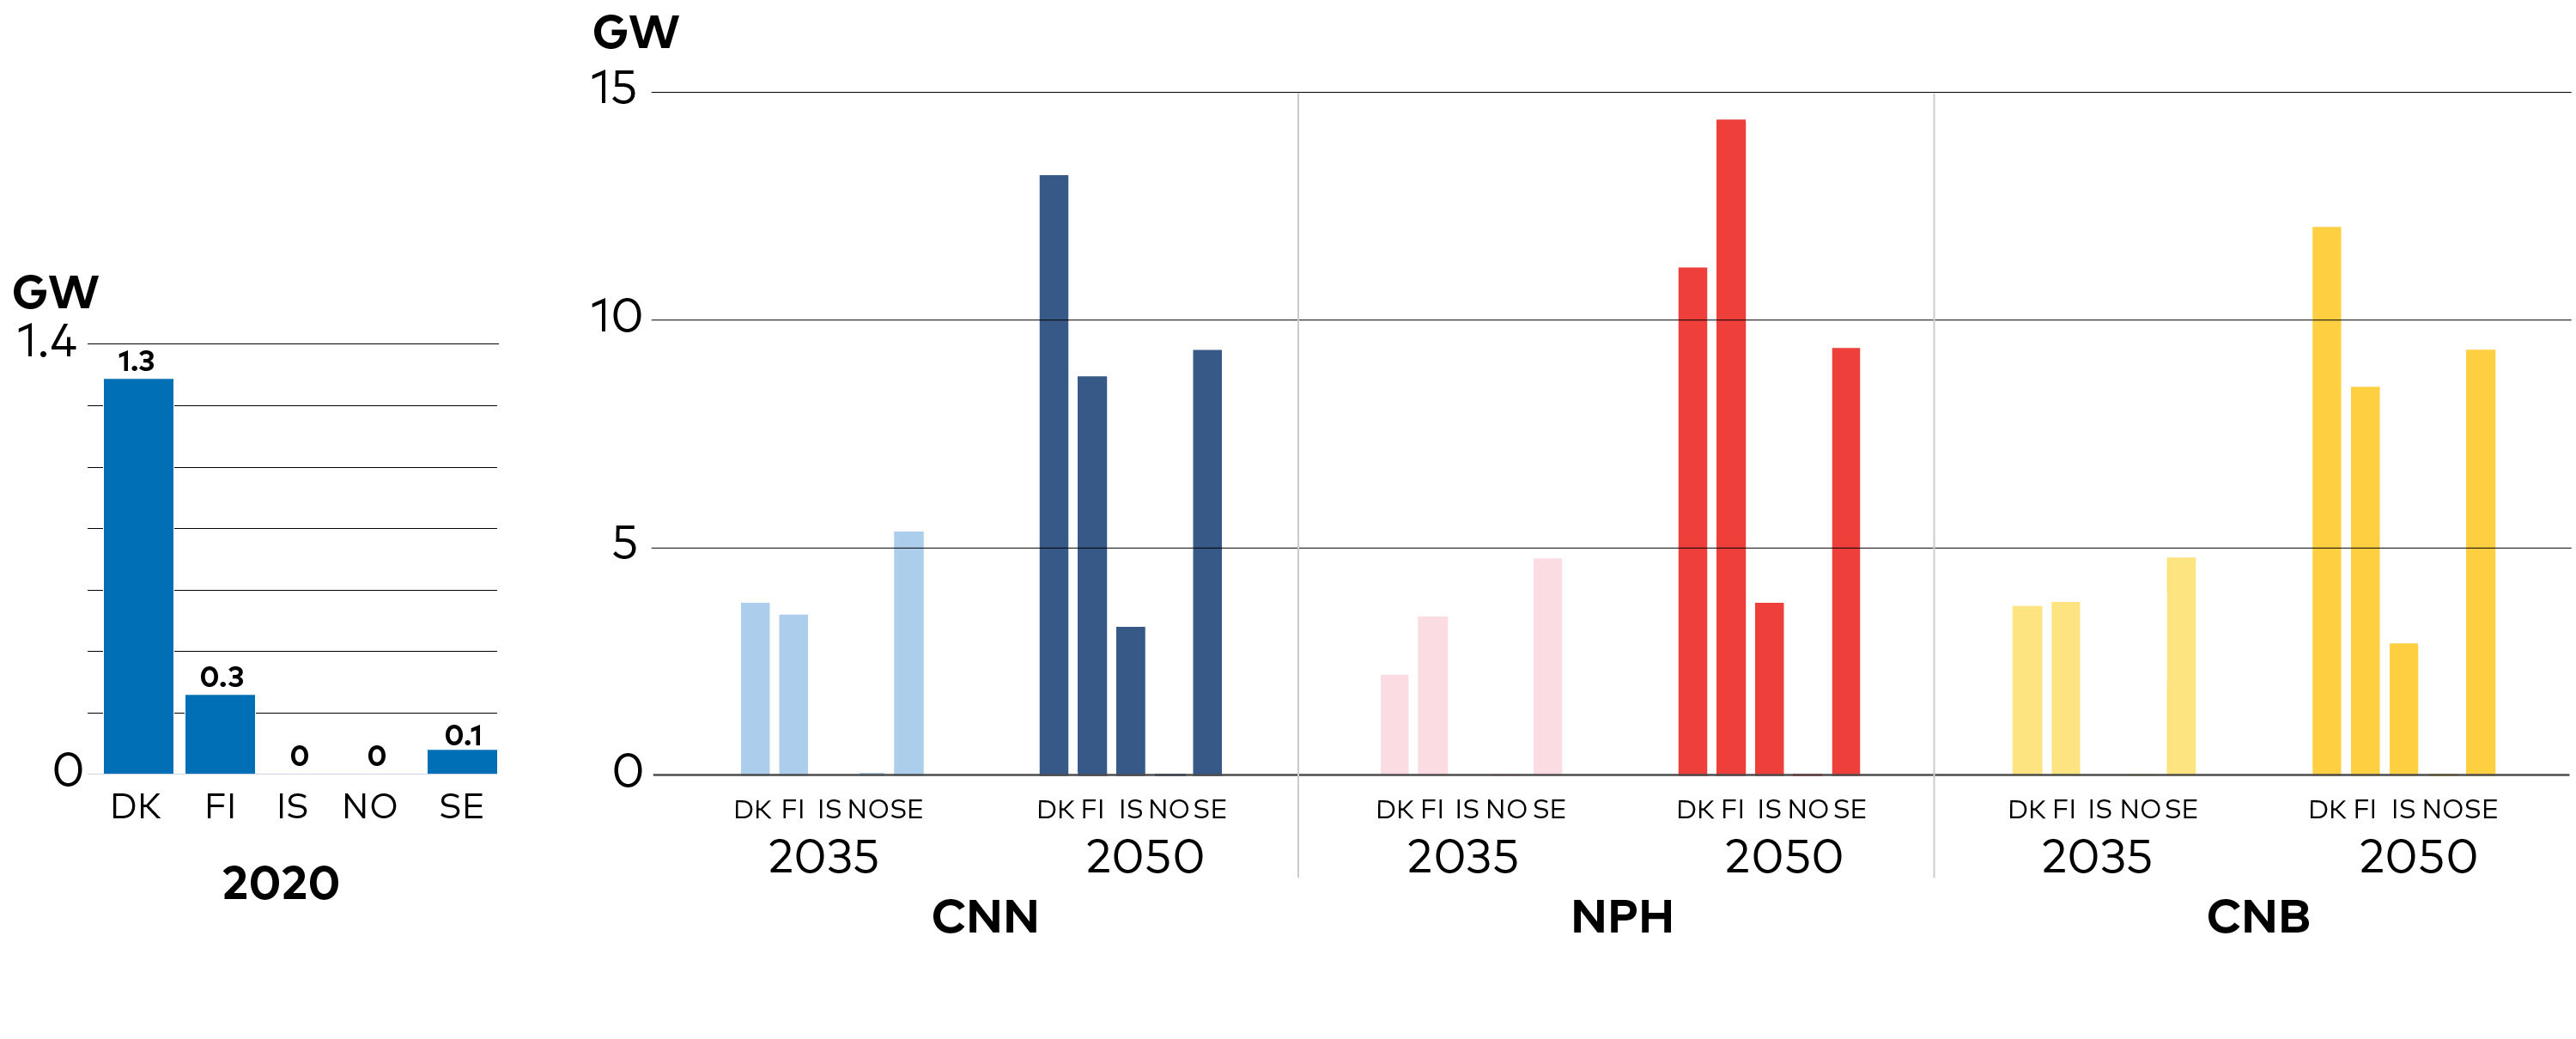
Figure 9.3. Installed solar PV capacity by country in 2020 to 2050. Solar PV grows to make a meaningful contribution to the Nordic energy system.
In the cases with high PtX demand PV deployment increases markedly. A large power demand obviously requires more power capacity but PtX seems to be a particularly good fit for solar power due to the flexible nature of PtX demand. Modern ground-mounted PV plants are able to provide competitive power and it is reasonable to assume that the price of solar power will only go down in the coming decades.
Yet, at Nordic latitudes, the capacity factor of solar power plants is not more than 10-15% depending on the design of the facility and seeing as most of the production takes place only during the summer where electricity demand is comparatively low. At the same time, nuclear power and run-of-river hydropower supply cheap baseload power in Norway, Sweden, and Finland leaving limited space for solar PV expansion. However, adding PtX demand to the equation changes the picture, by adding a flexible load all over the year. The solar power capacity factor is too low to supply PtX facilities on its own but it provides a good supplement to wind turbines, which normally produce more power in winter months.
The effect of PtX on solar is shown in the HighPtX case: in 2050 there is 33 GW of PV capacity in Denmark (which is the defined maximum in the model for Denmark), 23 GW in Finland, and 36 GW in Sweden (Figure 9.4). All in all, solar power supplies 8% of total power generation in 2050 in HighPtX compared to just 3% in the NoPtX case.
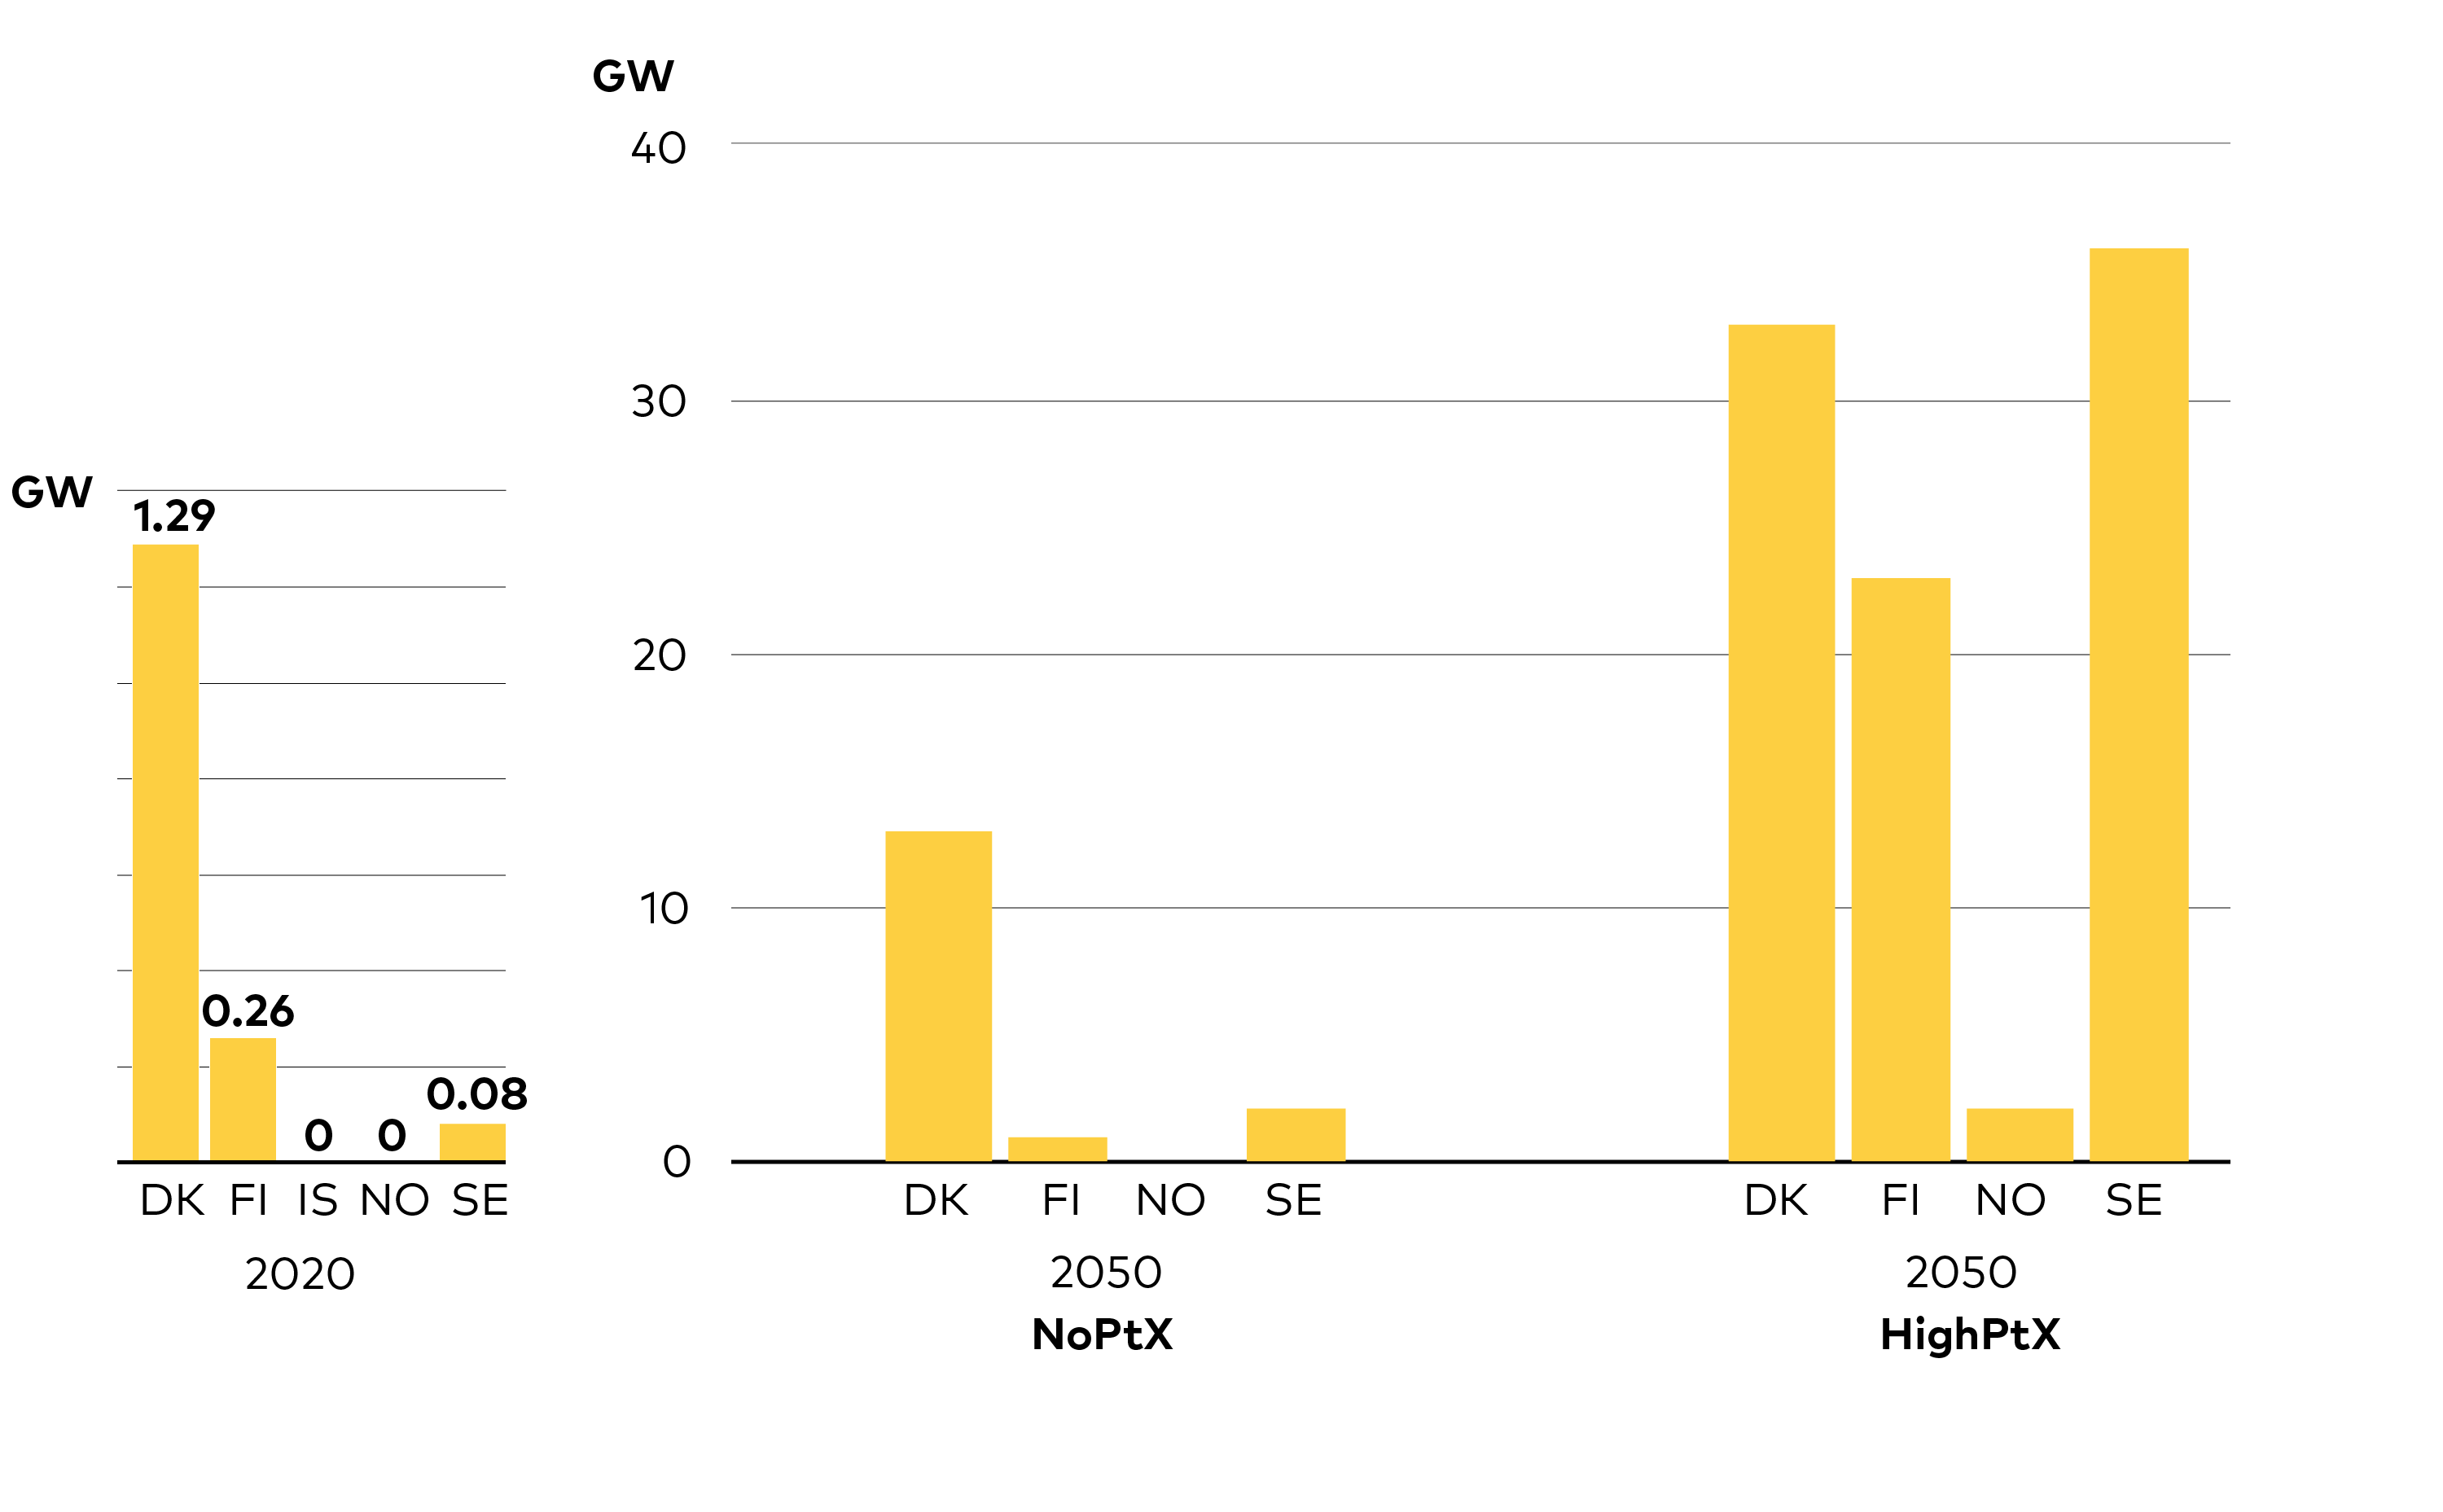
Figure 9.4. Solar PV capacity under different levels of PtX. Demand for PtX fuels has a strong effect on Nordic solar PV deployment
Some important limiting factors for solar in the Nordic energy system are for one the cannibalizing effects it has on power prices. In addition, since solar power is limited to fewer concentrated hours of the day this effect gets exacerbated. As costs for solar decreases over time, solar power will be in a better position to manage such effects and curtailment will be more acceptable. In cases with high electricity demand, such as the HighPtX case, the potential for solar will be greater.
Nuclear electricity unlikely to be a dealbreaker but could play a long-term role
The fundamental pathways to a decarbonised energy system are very similar whether or not nuclear is part of the Nordic electricity mix after 2040. Necessary near-term decisions, such as those associated with strengthening the electricity grid, and decarbonising industry and transport, do not significantly alter depending on the presence or absence of nuclear power.
Nevertheless, the future of nuclear power has long been a contentious and politicised topic, particularly in Sweden. One should not dismiss the challenges of meeting increasing electricity demand while moving to the higher shares of wind and solar in electricity supply that we see in all NCES scenarios.
The share of nuclear in the Nordic electricity mix falls in all NCES scenarios. From just under 20% in 2020, to about 15% in all scenarios in 2035, to 8% in CNB and CNN and 11% in NPH by 2050. Lifetime extensions of up to 80 years for the existing fleet of reactors in Sweden and 60 years in Finland are cost-effective in all scenarios. In the NPH scenario, where domestic Nordic electricity demand rise by 85% and total electricity generation more than double (107% growth) by 2050, investments in new reactors in Sweden could become cost-effective, albeit only just This development in NPH is supported by the assumption that future construction costs are significantly lower than those of nuclear plants currently under construction in the EU.
To shed light on the role of nuclear the HighPtX case (see chapter 4) based on the NPH scenario, was subjected to further analysis. Please see Annex B for a detailed description of this analysis.
1. HighPtX, High Nuclear:
-
Sweden: The lifetime of the current fleet of Swedish reactors are extended to at least 2050, but no investments in new reactors are made, leaving 7 GW of nuclear capacity in Sweden by 2050.
-
Finland: All existing nuclear power plants, including Olkiluoto 3, which is expected to be operational by 2022, as well as Hanhikivi 1 which is commissioned by 2030, are in operation by 2050. This leaves Finnish nuclear capacity at 5.6 GW by 2050.
2. HighPtX, Low Nuclear:
-
Sweden: All Swedish reactors are closed after reaching their 60 years lifetime which occurs around 2040.
-
Finland: Hanhikivi 1 is not established and by 2050 only Olkiluoto 2 and 3 are operational, resulting in 2.5 GW of nuclear capacity in total.
In total the difference in nuclear capacity between the two cases is approximately 10 GW at the Nordic level (Figure 9.5).
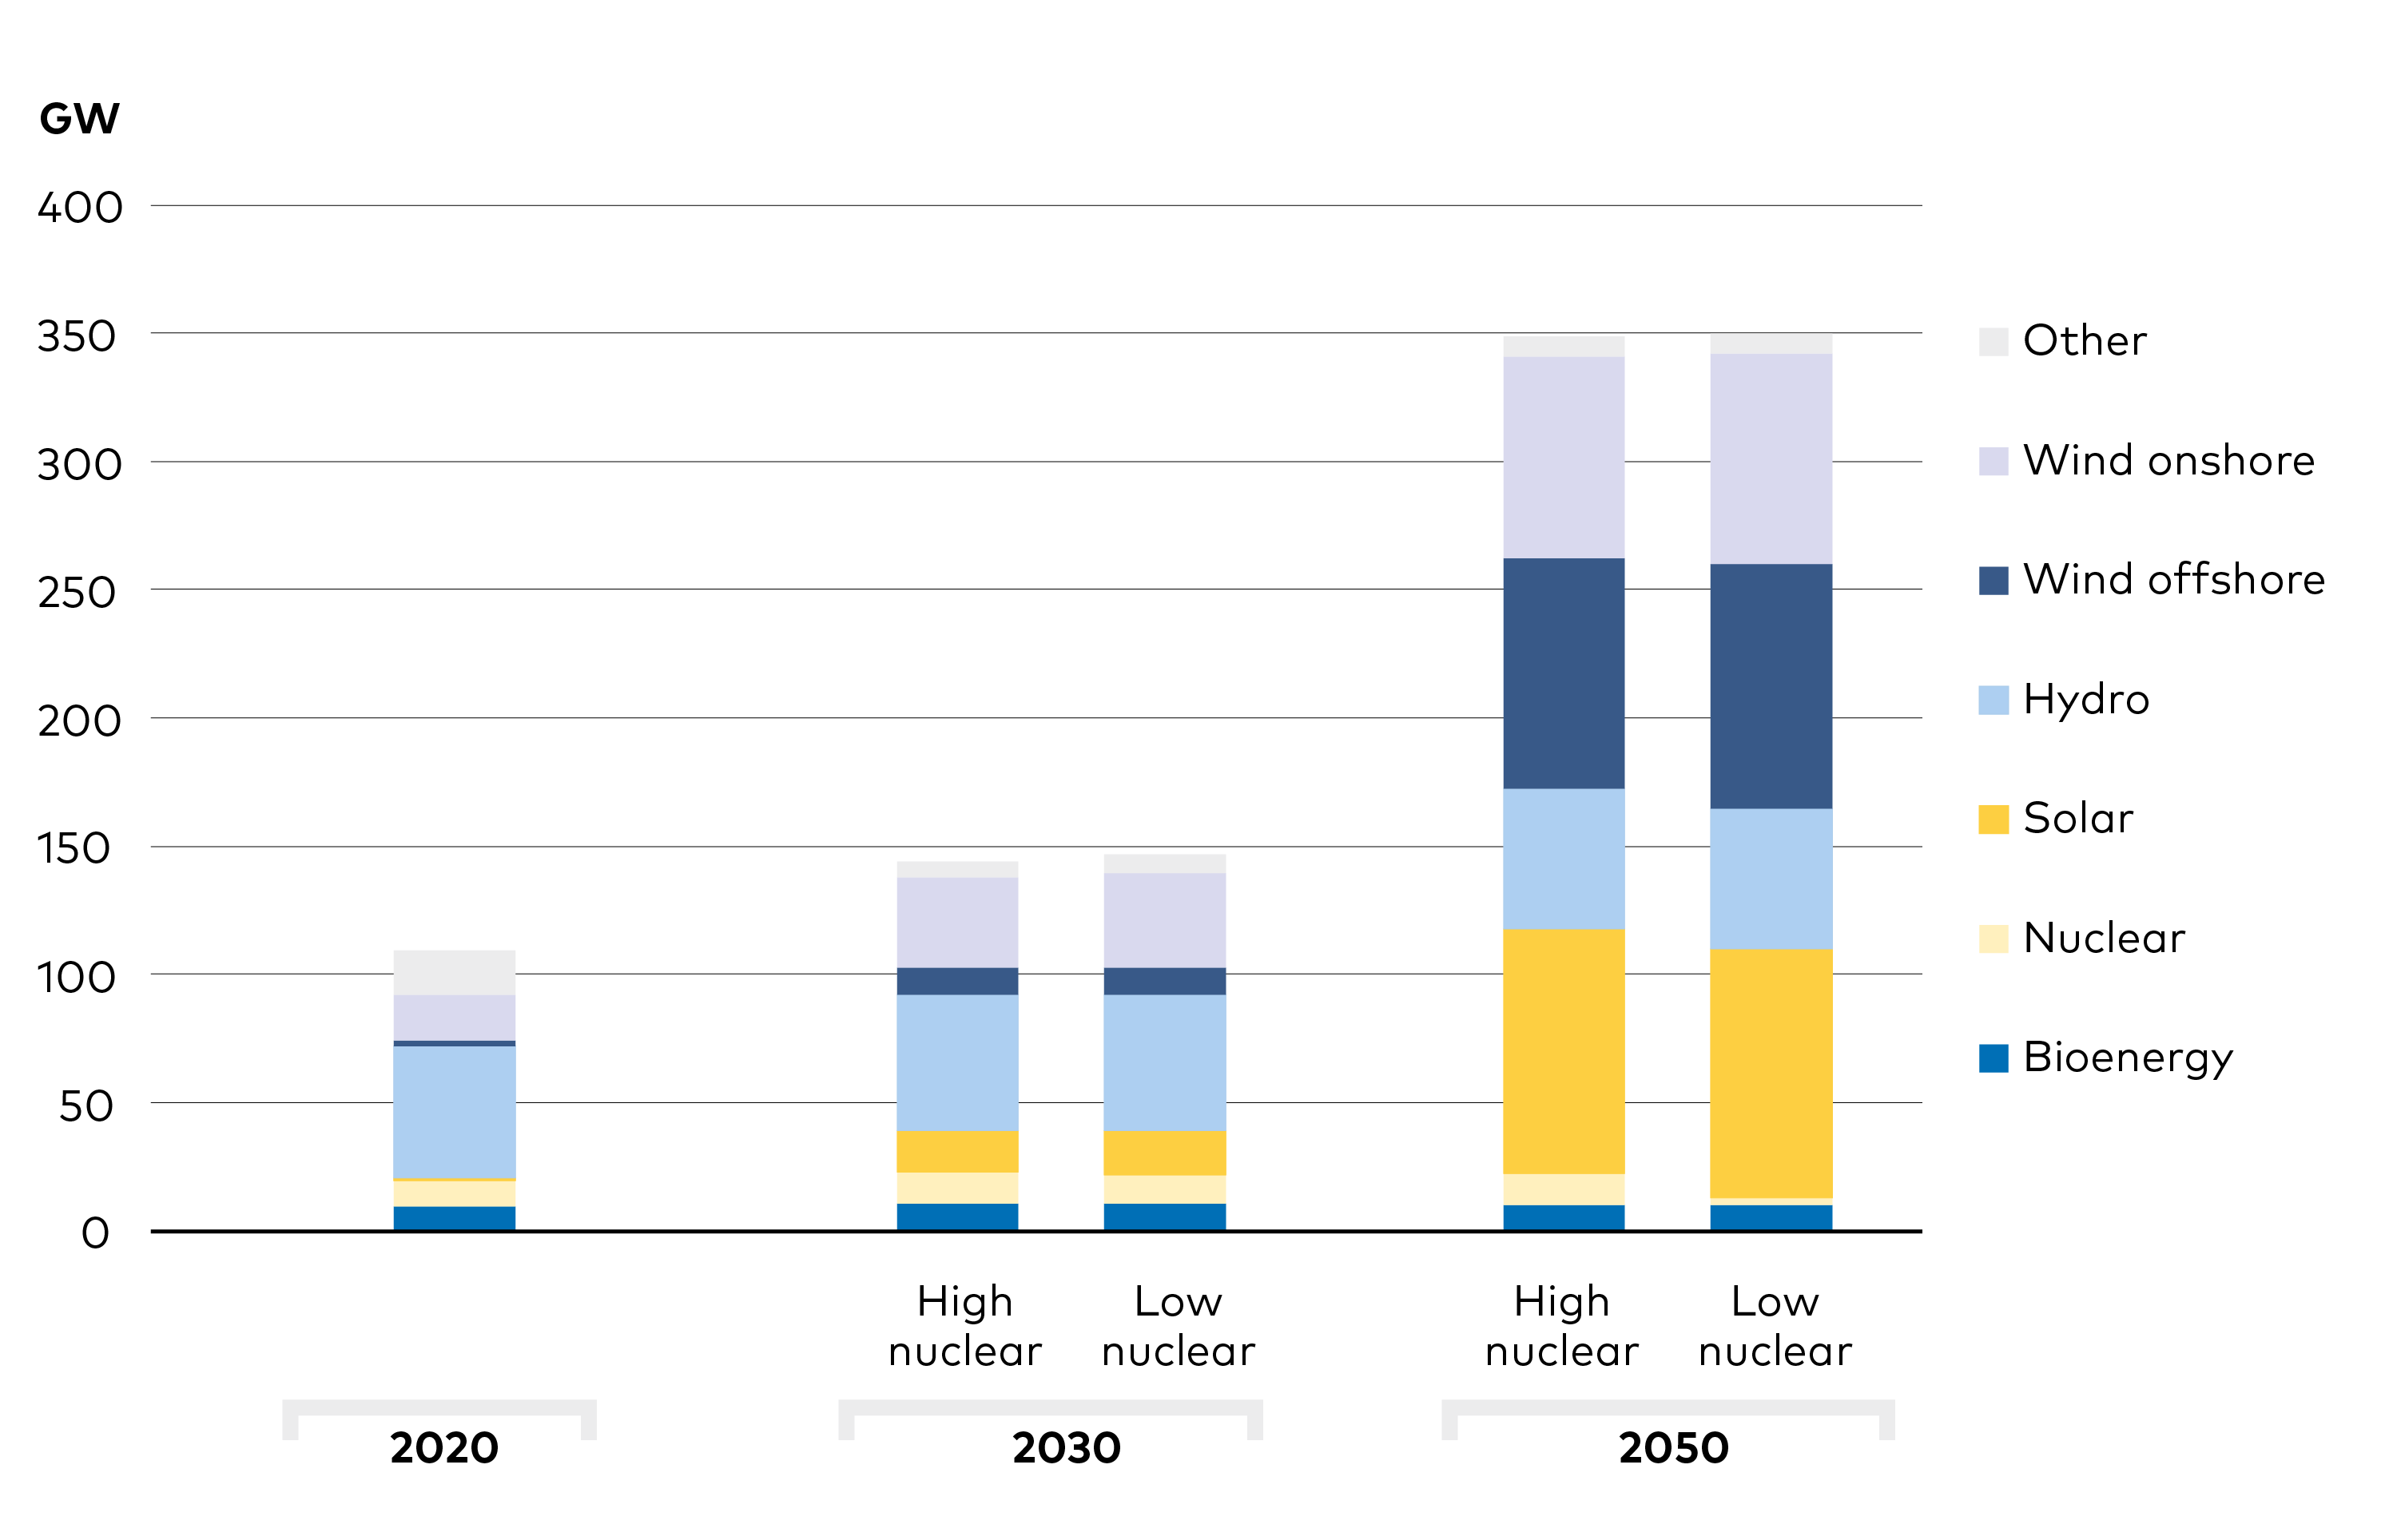
Figure 9.5. Nordic power generation capacity, nuclear sensitivity analysis. Nordic investments in offshore wind rise by 5 GW (6%), onshore by 3 GW (4%) and solar capacity by 2 GW (3%) in the High nuclear case compared to the Low nuclear case.
Broadly speaking the differences between the two cases are small, particularly compared to other changes in the energy system. But two notable observations can be made:
Offshore wind would compensate for most of the decrease in nuclear capacity and electricity generation. In the low-nuclear case, net Swedish electricity export fall by 18 TWh (20%), while total Nordic exports fall by 11 TWh (5%). At the same time, electricity demand in Sweden is reduced by 9 TWh as PtX production capacity is moved to other countries. Nordic investments in offshore wind rise by 5 GW (6%), onshore by 3 GW (4%) and solar capacity by 2 GW (3%). Some additional investments also occur outside the Nordic region. In total, 25 GW of new capacity, including 2 GW gas turbines but mainly wind and solar, is established across Europe (incl. Sweden) to compensate for the reduction of 10 GW Nordic nuclear capacity.
System balancing challenges seem manageable. A detailed analysis of how security of electricity supply would be affected, for instance measured as the probability of loss of load in one or more Nordic price areas, is beyond the scope of the NCES analysis. But the NCES modelling does not indicate an absolute upper bound, nor any tipping points, beyond which the cost of balancing of the system rises dramatically or its operation becomes infeasible. An analysis of Nordic electricity prices in the two cases confirm this picture. Electricity prices are higher in the low nuclear case, reflecting the higher costs of alternative supply options, but not dramatically so. The shape of the price duration curves is similar, and average annual Nordic system prices rise by 1%. The biggest price difference is observed in the Swedish price area SE3 where the annual average price is 1 €/MWh (2.6%), higher in the Low nuclear case (Figure 9.6).
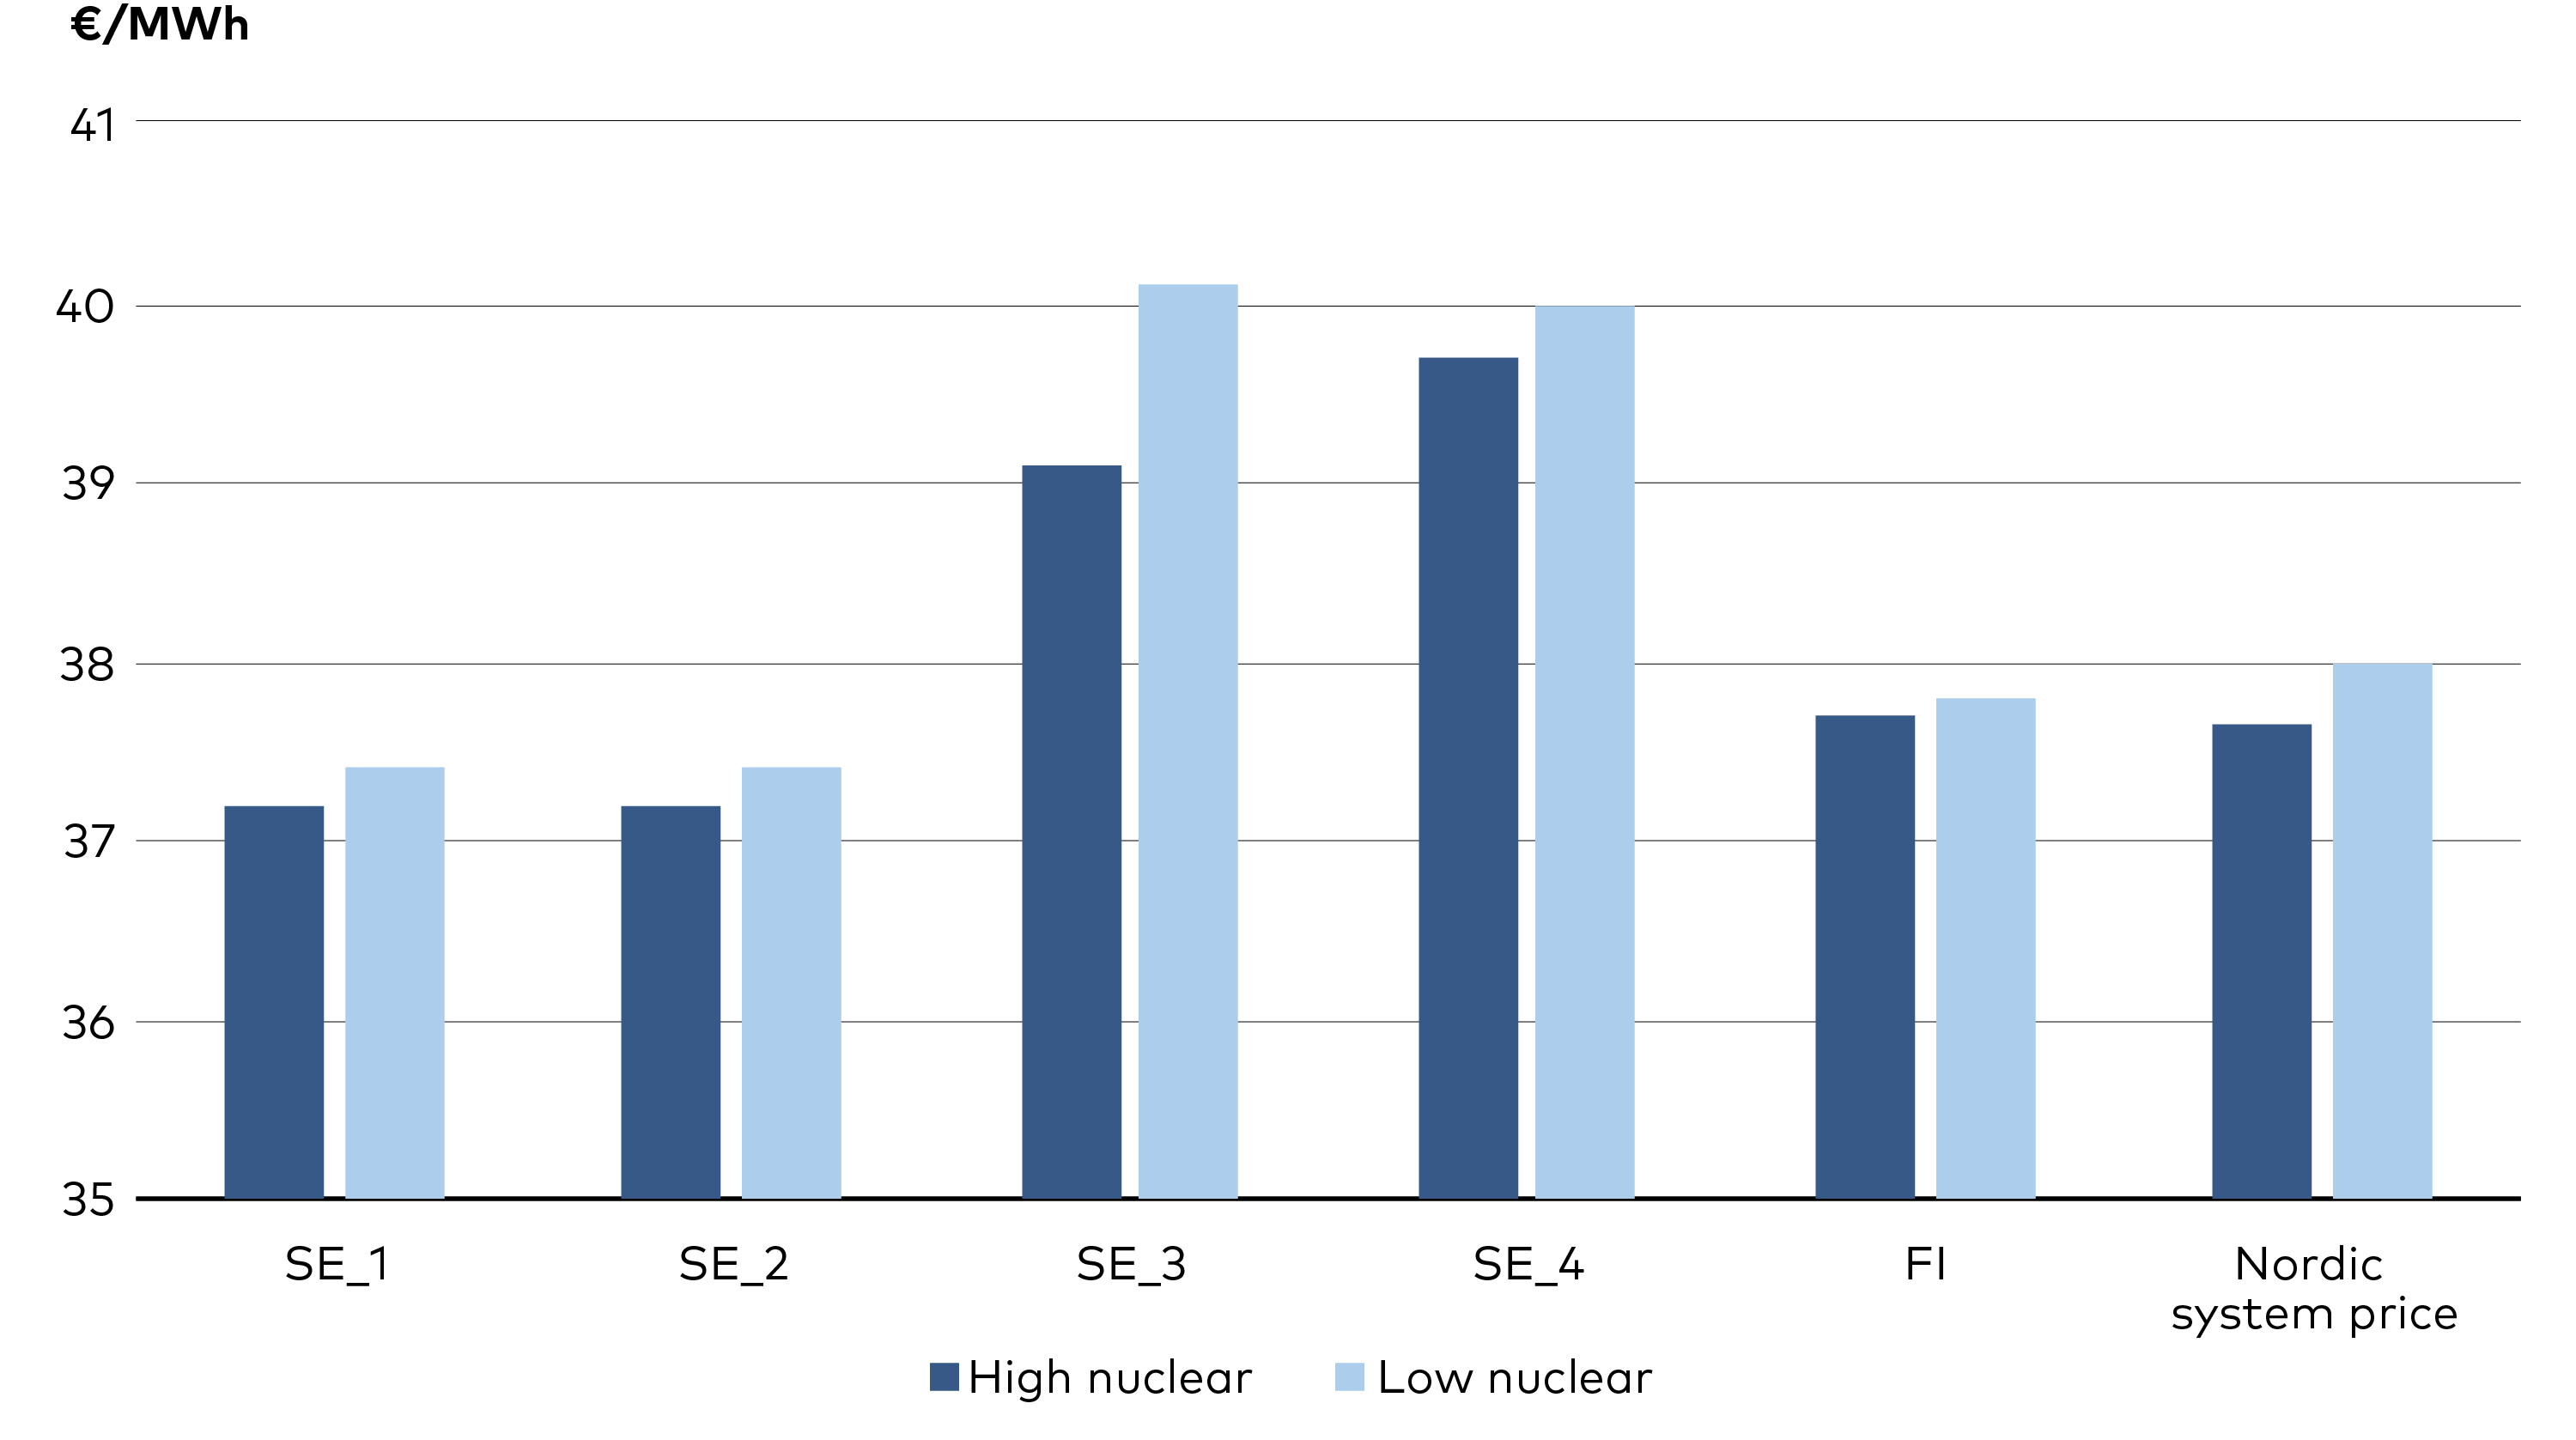
Figure 9.6. Annual average electricity prices in 2050, Nuclear sensitivity analysis. In the Low Nuclear scenario average annual Nordic electricity prices rise by 1% compared to the High Nuclear case, while average annual prices in the SE3 price area rise by 2.6% Note that y-axis is cut to highlight differences between cases.
9.5 Electrification of transport will not be limited to light-duty vehicles
Electrically chargeable cars reach 100% market share already around 2025, with battery-only cars dominating the market by 2030 (Figure 9.7). The actual number of cars needed in the future is more uncertain as this depends on the extent of modal shifts and how people embrace car sharing and how autonomous vehicles are used. As Nordic electricity is almost completely decarbonised and EVs dominate the market in all NCES scenarios, the number of cars will not significantly affect emissions. However, one should not underestimate other positive effects of a reduced car stock: lower costs, less congestion and freed-up space, to name but a few.
Figure 9.7. Development of stock of vehicles in the NCES CNN and NPH Scenario, 2015-2050. Development in the stock of cars and trucks (incl. vans). PHEV and BEVs make up more than 50% of the passenger vehicle stock already in 2030, and completely dominate by 2050. Note that both ‘Diesel’ and ‘Gasoline’ categories include blends with increasing shares of non-fossil fuels.
NCES analyses also show that direct electrification is competitive in heavy-duty road transport, in contrast to many previous studies. Again, the primary explanation is the cost decrease and improved energy density of batteries, which makes direct electrification cheaper than alternatives such as biofuels or fuel cell vehicles. For short distances, like distribution trucks, battery vehicles are the most likely choice. For long-distance heavy-duty transport, it is possible that biofuels, PtX fuels or combinations of batteries and electrified roads, can compete. The electrification of trucks takes off with a few years delay, and with slightly higher uncertainty in technology choice, in comparison to the passenger vehicle market.
As discussed in chapter 3 and 5, direct electrification also has important energy efficiency benefits, as it reduces total demand for electricity compared with synfuels or fuel cells due to the high electricity intensity of production of such fuels. Moreover, electrification reduces the pressure on bioenergy resources.
9.5.1 Shipping and aviation cannot continue as before
Fossil fuel use in shipping and aviation needs to decrease from almost 100% in 2020 to around 10% in 2050 (Figure 9.8). In shipping, synthetic natural gas and hydrogen dominate fuel use in 2050, while biokerosene, e-kerosene, and hydrogen replace fossil fuel in aviation. Most synthetic fuels in NCES scenarios are based on green hydrogen, but some are derived from bioenergy, in some cases combined with CCS.
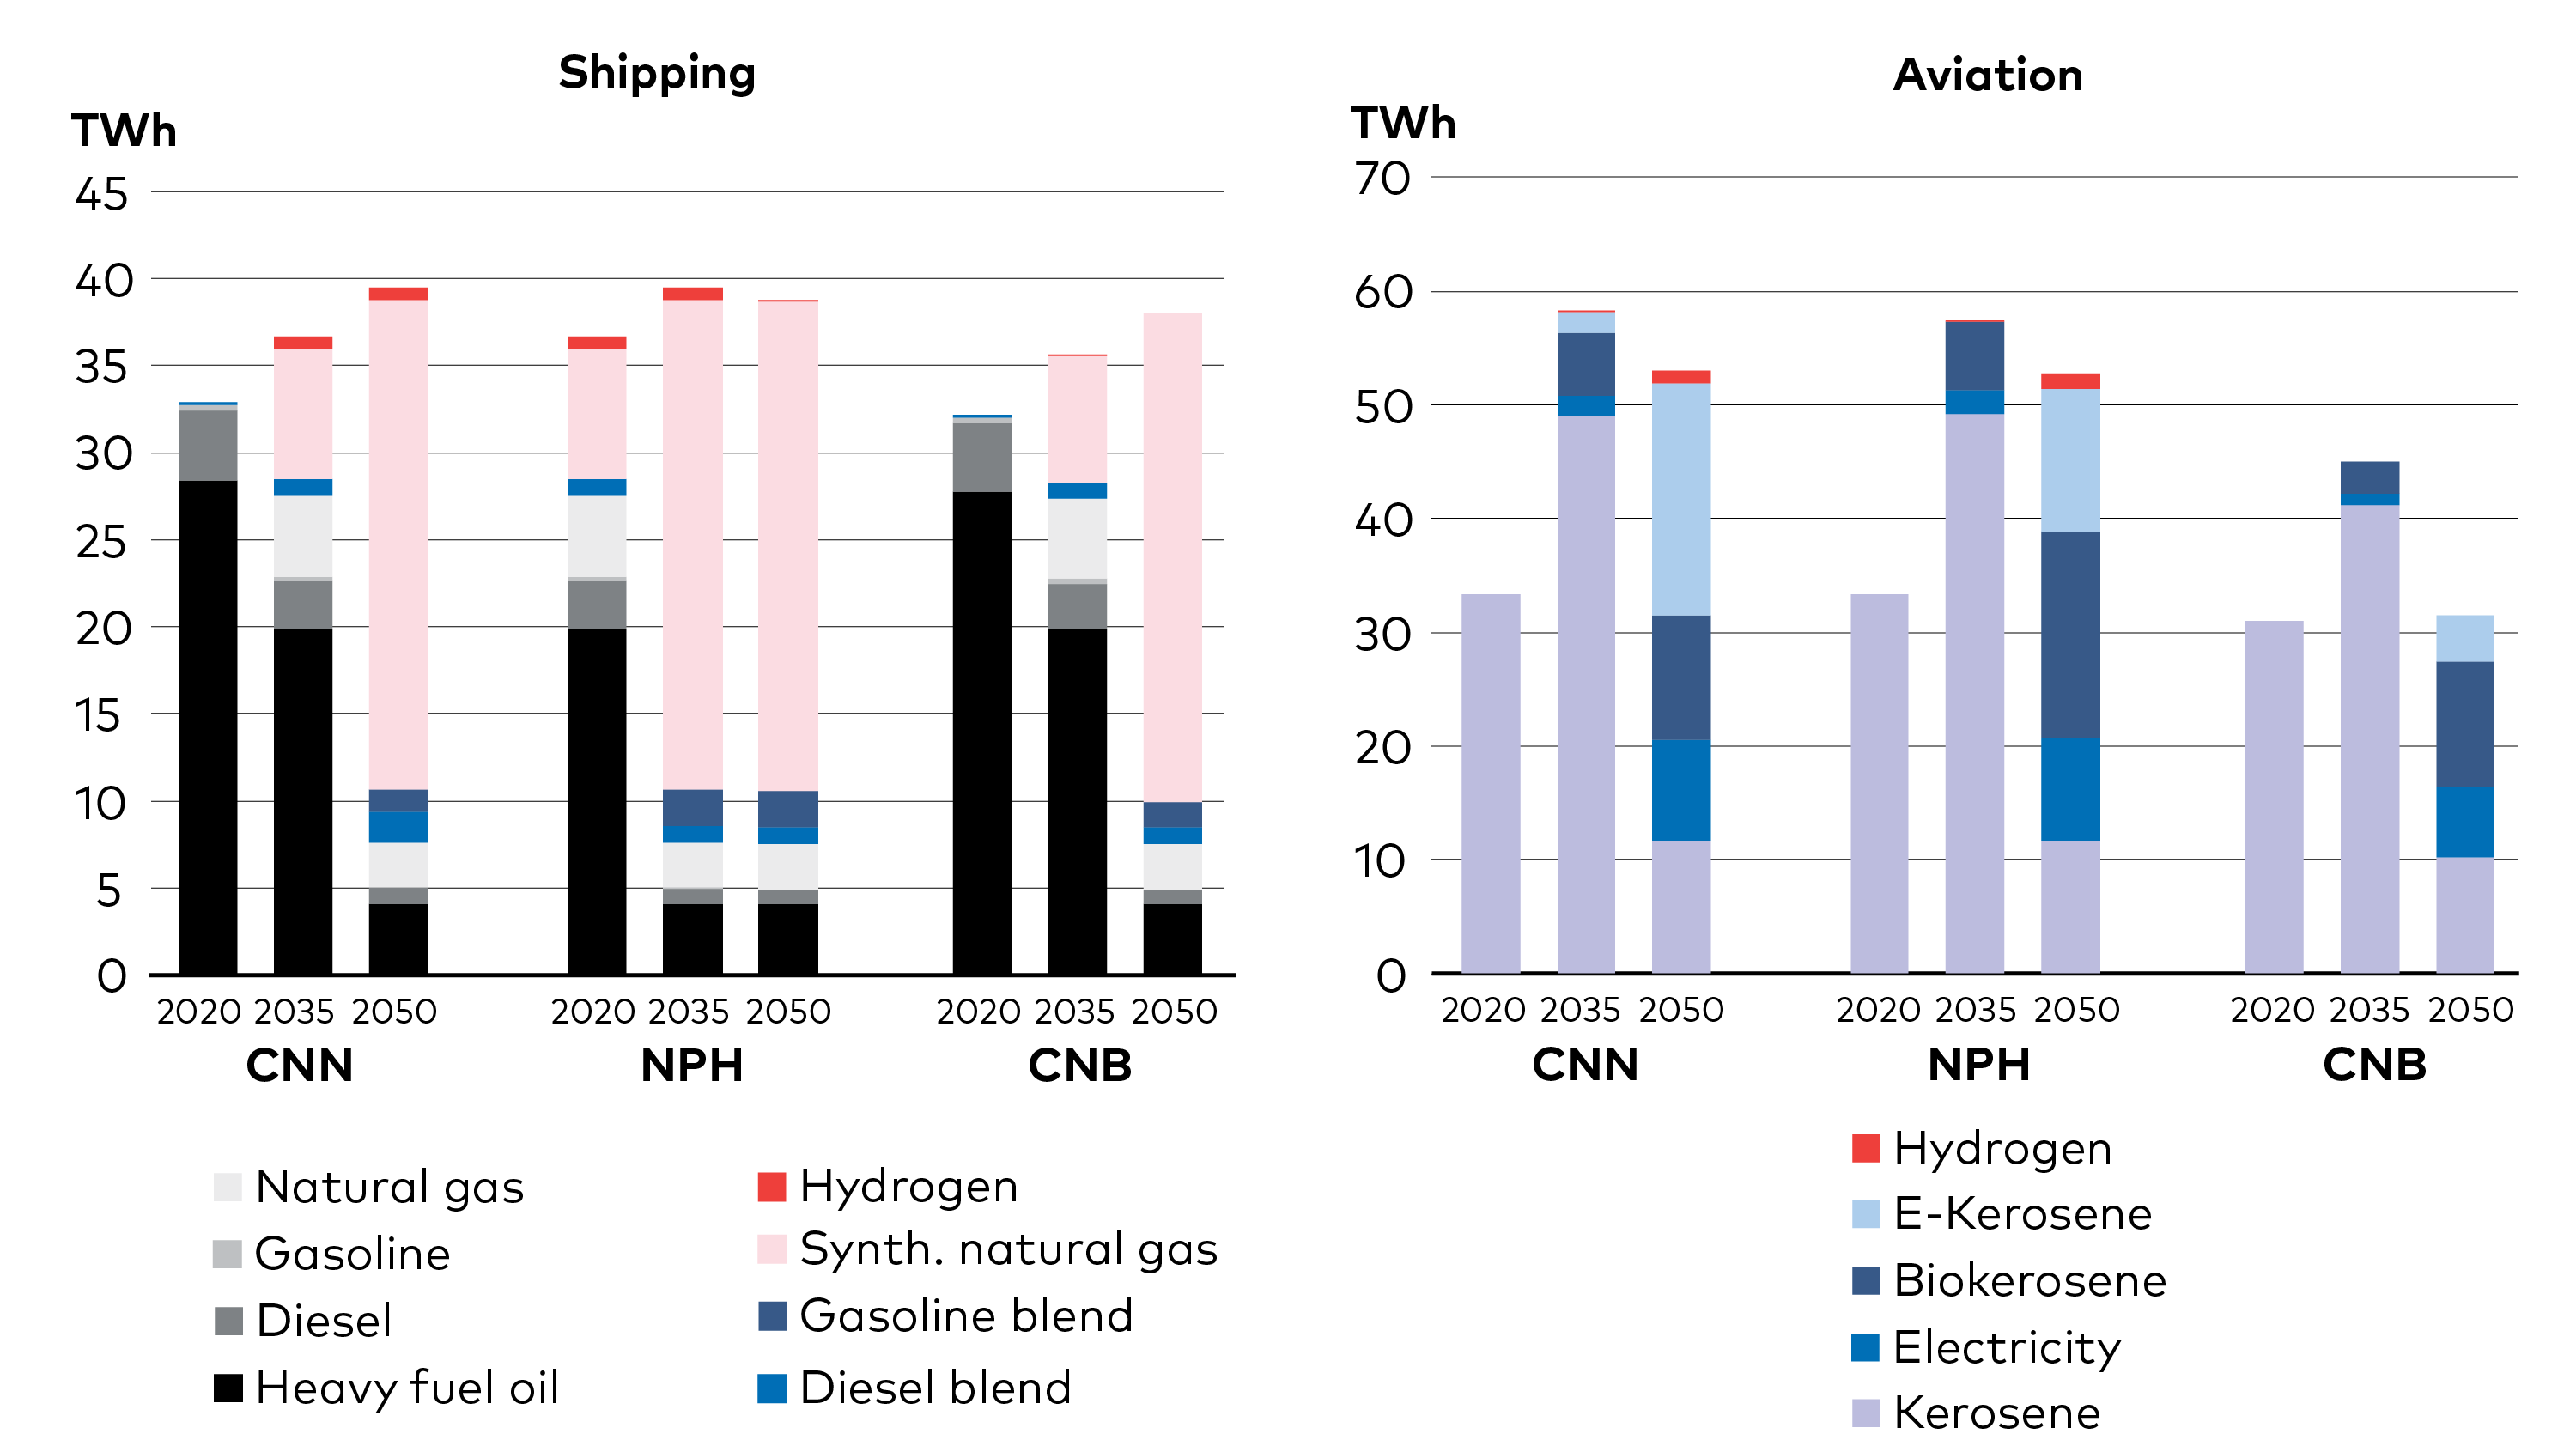
Figure 9.8. Fuel use in shipping and aviation - 2020 to 2050. Fossil fuel use in both national and international shipping and aviation is replaced by a mix of PtX fuels, biofuels and electricity in all NCES scenarios.
9.6 Energy efficiency plays an important role in all scenarios
Energy efficiency is a critical component in all NCES scenarios. As discussed, direct electrification plays a big part in improving efficiency, and other technology improvements occur in all sectors. Moreover, system integration and sector coupling are a necessity to reduce energy losses. This is particularly important in a moderate to HighPtX case. Using excess oxygen and heat from electrolysis will improve both economics and energy efficiency and is an important element in the NCES scenarios. As a result, final energy demand per capita decreases by 5% (NPH) to 30% (CNB) in the NCES scenarios.
As shown in chapter 7, reducing transport volumes would also make a difference. This can be realised, at least in part, through the use of the most efficient transport mode and moving away from individual transport modes. Infrastructure planning and development need to recognise this to a greater extent, than has previously been the case, to promote efficient transport modes and behaviour.
Even if energy supply is largely decarbonised, it is important to realise that without energy efficiency improvements it will be significantly more costly to reach carbon neutrality, electricity exports will be lower, and the amount of energy infrastructure required will be higher.
9.7 Biomass fills the gaps
Although wind and solar power is subject to more attention in the energy transition, the NCES scenarios show that bioenergy from sustainable biomass will likely remain pivotal in the future Nordic energy system. The vast Nordic wood biomass resources are the main reason that the share of biomass in total gross energy consumption is approximately 30% in Finland and 25% in Sweden. Since biomass for energy is a limited resource, directly competing with other industries for supply, bioenergy industries should to the largest possible extent rely on waste resources and residues from other industrial processes.
While biomass has traditionally been used in power and heat, the scenarios indicate new roles for bioenergy in hard-to-abate sectors. Particularly in heavy load, long-distance transportation and long-distance aviation, there are few alternatives to biofuels as replacements to fossil counterparts. Here biofuels can fill in the gaps where other solution tracks do not get us all the way to a fully carbon-neutral energy system.
Bioenergy will most likely also maintain a significant role in Nordic heating towards 2050, benefitting from being storable over long periods and well suited as supplement for power-to-heat in cold periods. NCES scenarios show that BECCS plays an important role in a fully carbon-neutral Nordics by 2050, providing up to 20 million tonnes of negative emissions in 2050, corresponding to about 10% of the required reduction from 2020 levels (see chapter 6).
9.8 Moving to carbon neutrality is unlikely to push electricity prices higher
There is little support for concerns that the large investments required to realise a carbon-neutral energy system would mean higher electricity prices.
Compared to the average prices in 2017-2019, power prices in the NCES scenarios are foreseen to increase by 5-10 €/MWh towards 2040 in Denmark, Norway, and Sweden. In Finland, where power prices were already higher than in the other Nordic countries in the period 2017-2019, power prices decrease somewhat on the way to 2050. The analysis was carried out for the NoPtX case, which is based on the CNN scenario, and for the HighPtX case, based on the NPH scenario.
The main reason for the rise in power prices in Denmark, Norway, and Sweden is the assumed increase in the CO2 price that is used in these cases, which were analysed using the Balmorel model. In the ON-TIMES modelling if the NCES scenarios the GHG targets generate the CO2 shadow price, no assumptions on CO2 prices were made. CO2 prices are projected to escalate to 79 €/ton by 2030 and 125 €/ton by 2040 and onwards, in line with the IEAs Sustainable Development Scenario. The higher CO2 price affects the marginal cost of coal and gas power plants in Germany and Poland, which also has an upward effect on power prices in the Nordic countries, in particular in Denmark due to the proximity to continental Europe. Beyond 2040, power prices mostly remain stable but decrease in some parts of the Nordic region. The reason for this is the expected continued cost decreases of RE plants, which is sufficient to keep prices steady.
Power prices in the scenarios follow the same pattern, just slightly higher in NPH due to the higher demand for electricity and therefore the need to put more costly supply options into play (Figure 9.9).
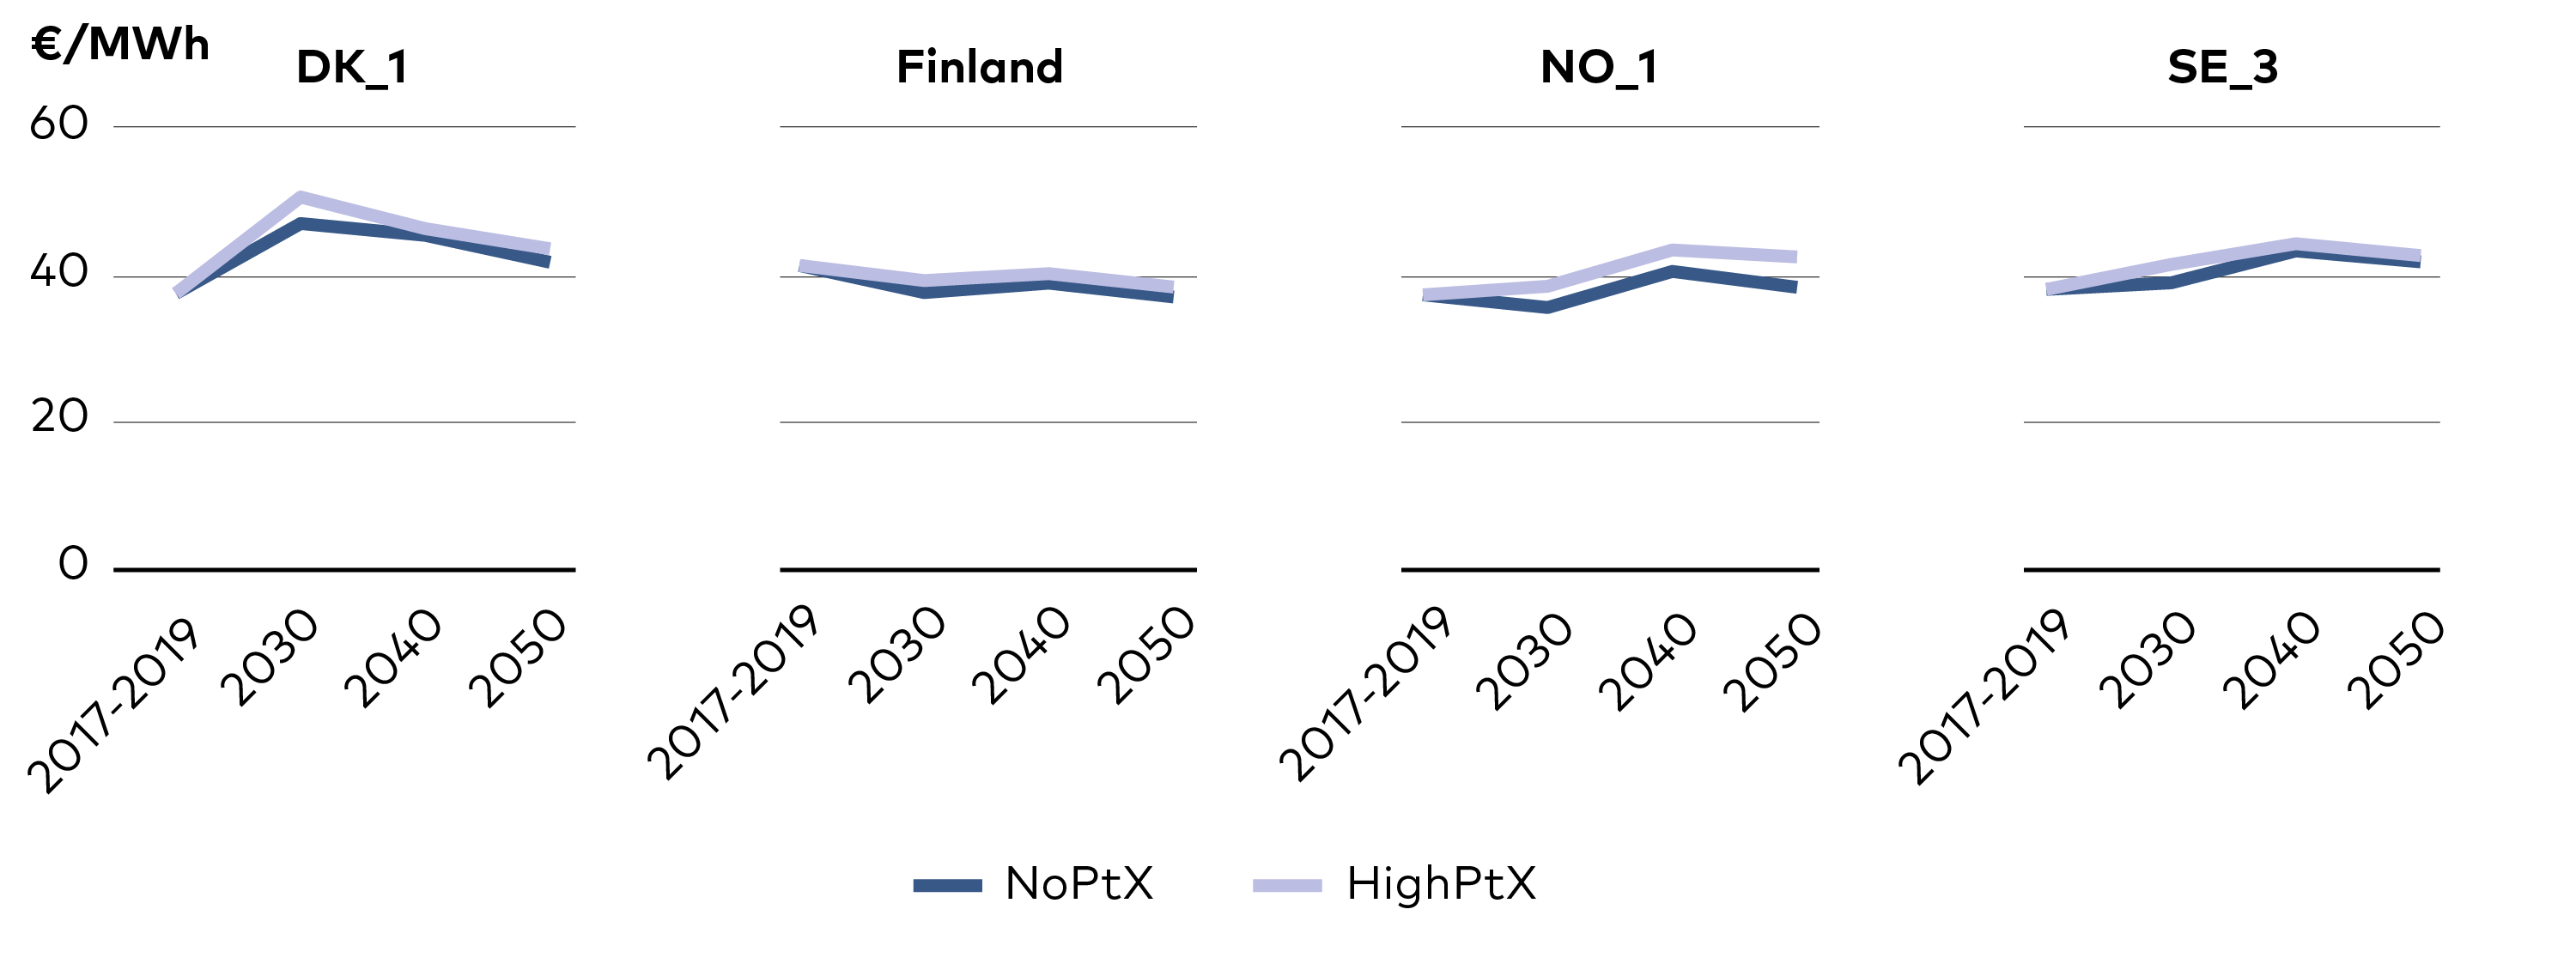
Figure 9.9. Development of Nordic power prices - 2017 to 2050. Historic power price 2017 -2019 for price areas DK_1, Finland, NO_1 (Oslo) and SE_3 (Stockholm) and projected power prices towards 2050 in the CNN and NPH scenarios, based on power system analyses with the Balmorel model. Power prices in Denmark, Norway and Sweden are foreseen to increase 5-10 €/MWh towards 2040 compared with historic prices; thereafter, they remain stable or decrease slightly. In Finland, power prices are expected to decrease a little over the period.
9.9 Target areas for no-regret options
The inherent uncertainty in making predictions about the future does not prevent there being a clear list of no-regret policy actions that would enable developments required in all NCES scenarios:
-
Reform grid planning to enable shorter lead times and more proactive expansion, while also looking for system smart local solutions that can reduce grid capacity needs. The necessary pace of the transition will be difficult to maintain with the current processes.
-
Work to develop effective and inclusive decision-making processes for energy infrastructure, including onshore wind and electricity grids. This will require management of difficult conflicts of interests, balancing legitimate local concerns with system benefits, and handling technical as well as legal issues.
-
Facilitate deployment of charging infrastructure to accelerate the electrification of transport for instance by including charging in city planning and support of public charging infrastructure and e-roads.
-
Ensure that transport infrastructure development is aligned with climate targets, facilitating a lower trajectory of transport demand development and a move away from individual transport modes.
-
Accelerate public investments in RDD&D, including in CCS technologies, biorefining and PtX. Several critical technologies are still at an early stage of maturity and need continued investment to reach cost competitiveness. This will involve pilot and demonstration activities where public funding and risk-sharing will be necessary.
-
Work domestically and internationally to strengthen incentives for low carbon fuels in shipping and aviation. Nordic competence in biorefining can be a competitive edge in the development of modern aviation fuels.
Near-term actions
ANNEX A
Flexibility Needs and Solutions in the NCES Scenarios
Taking action to increase energy system flexibility is important in all NCES scenarios. Thus, incentivising and investing in technologies and markets for flexibility is a rational and low risk option.
It is useful to distinguish between three sources of flexibility: flexible supply, flexible demand and storage, and flexibility through electricity trade. Historically supply and trade have been the source of flexibility in the Nordic power system. With the advent of electrification in demand sectors and as PtX gains importance, new flexibility options emerge, which may become as important as supply side measures for balancing of the electricity system.
A.1 New Flexibility resources exist and must be tapped
A.1.1 Flexible supply and curtailment
Compared to most other countries in Europe, the Nordic countries have a strong starting point for the integration of VRE sources due to large hydropower capacities and associated reservoirs. Hydropower delivers the lion share of flexibility on the production side in NCES scenarios, along with moderate amounts of biomass-fired power plants, and a small contribution from gas and oil-fired peak capacity, which is only used on rare occasions when power prices are extraordinarily high. Nuclear power provides a stable input to the power system and rarely contributes with flexibility. Although in principle it could through down-regulation of production during periods with very low power prices.
Frequent curtailment of wind and solar on the other hand becomes a necessity to balance the system and avoid over-supply of generation in windy and sunny conditions. Since all modern wind turbines and utility scale PV plants are capable of curtailing generation, excess electricity is not a technical but economic problem.
In the NoPtX case, curtailment levels are quite modest; only 2 TWh (0,8%) of wind and solar generation is curtailed by 2050. In the HighPtX case however, where wind and solar capacity soars to over 800 TWh by 2050, some 41 TWh of variable generation is curtailed, corresponding to 5% of total wind and solar generation.
A.1.2 Flexible demand and storage
The district heating sector and PtX plants can potentially offer the electricity system a high degree of flexibility since demand can be switched on and off over long periods and they both possess good regulating properties. By 2050, about 40% of district heating is provided from electricity, mainly from large-scale heat pumps. A finding which is independent of how electricity demand for PtX will develop. When there is a shortage of power in the electricity system and prices increase, district heating companies will be able to shift to other production facilities. For example, through combined heat and power plants or heating boilers. In addition, PtX plants will also be able to discontinue their production until electricity prices drop again.
It is essential that PtX plants are placed close to production facilities so they can relieve the electricity grid as much as possible, and preferably at sites where surplus heat from PtX production can be used for district heating. However, these two location considerations will often have to be weighed against each other. Placing PtX plants as well as solar and wind generation in off-grid constellations may be a good solution if distances to the transmission network are considerable. In general, however, grid connection is desirable to be able to take advantage of synergetic effects in the rest of the electricity system.
The extent to which BEVs and individual heating with heat pumps could contribute flexibility to the electricity system is subject to uncertainty. It will depend on consumer preferences and whether energy companies succeed in creating products and solutions that provide sufficient incentive for consumers to adopt more energy efficient behaviour. In addition, there may be a mismatch between need for flexibility at local level, where distribution companies would typically prefer a relatively even load over the day, and the incentive to adapt consumption to the supply of variable electricity generation and price signals in sale markets as a whole. The flexibility potential associated with individual heating, heat pumps and direct electric heating, is probably best suited to handle short periods with imbalances or power scarcity. If the heat supply is disconnected for more than a few hours, it will cause comfort problems in most buildings and it is relatively expensive to establish energy storages in connection with small heating systems. In this respect, BEV potentially offer a greater flexibility potential. The driving range of a modern electric car typically exceeds 300 km, and for the average commuter there will be plenty of battery capacity still available on a typical day. This allows for charging to take place at times when it puts the least strain on the power system. Applying Vehicle-to-grid (V2G) technology, EVs could potentially provide power to the grid in situations of capacity shortage.
Industrial electricity supply may also hold a significant potential for flexibility. Some industrial processes are so energy intensive that it will be cost-effective to stop manufacture when electricity prices reach a certain level. However, another potentially more attractive option is to establish two-tier supply systems, where industry process heat is provided from either an electric boiler or a fuel boiler, running for example on biogas, depending on the relationship between power and fuel price each hour. This will require more investments in energy facilities, but in return the company will be able to reduce its energy costs and profit from providing ancillary services to the electricity system. As more and more variable energy enters the grid, electricity prices will become more volatile, and the business case in such solutions could be improved.
Though some deployment of dedicated electricity storage takes place in Germany and other central European countries, we do not see these technologies in the Nordic countries in the NCES scenarios. This is due to the fact that demand response, trade, and flexibility measures on the supply side appear sufficient. However, given the relatively high curtailment levels, particularly in the HighPtX case, and the uncertainty related to cost developments of storage solutions including flow batteries and thermal electric storages, it cannot be ruled out that dedicated storages could play a role in a decarbonised Nordic power system.
A.1.3 Electricity trade
Trading electricity between regions increase the value of RE generation through smoothing effects and improved access to integration resources. The strong interconnectors in the Nordic region are also important for security of supply by allowing generation resources, including wind and solar power, to be shared when the system is strained.
The smoothing effects can be illustrated by comparing duration curves for wind power generation for Sweden, the Nordics, and EU18 (Figure A. 1). There are no occasions with no wind or solar power generation in the system and a wider geographic scope results in a higher minimum contribution from wind and solar power, see Table 9.1.
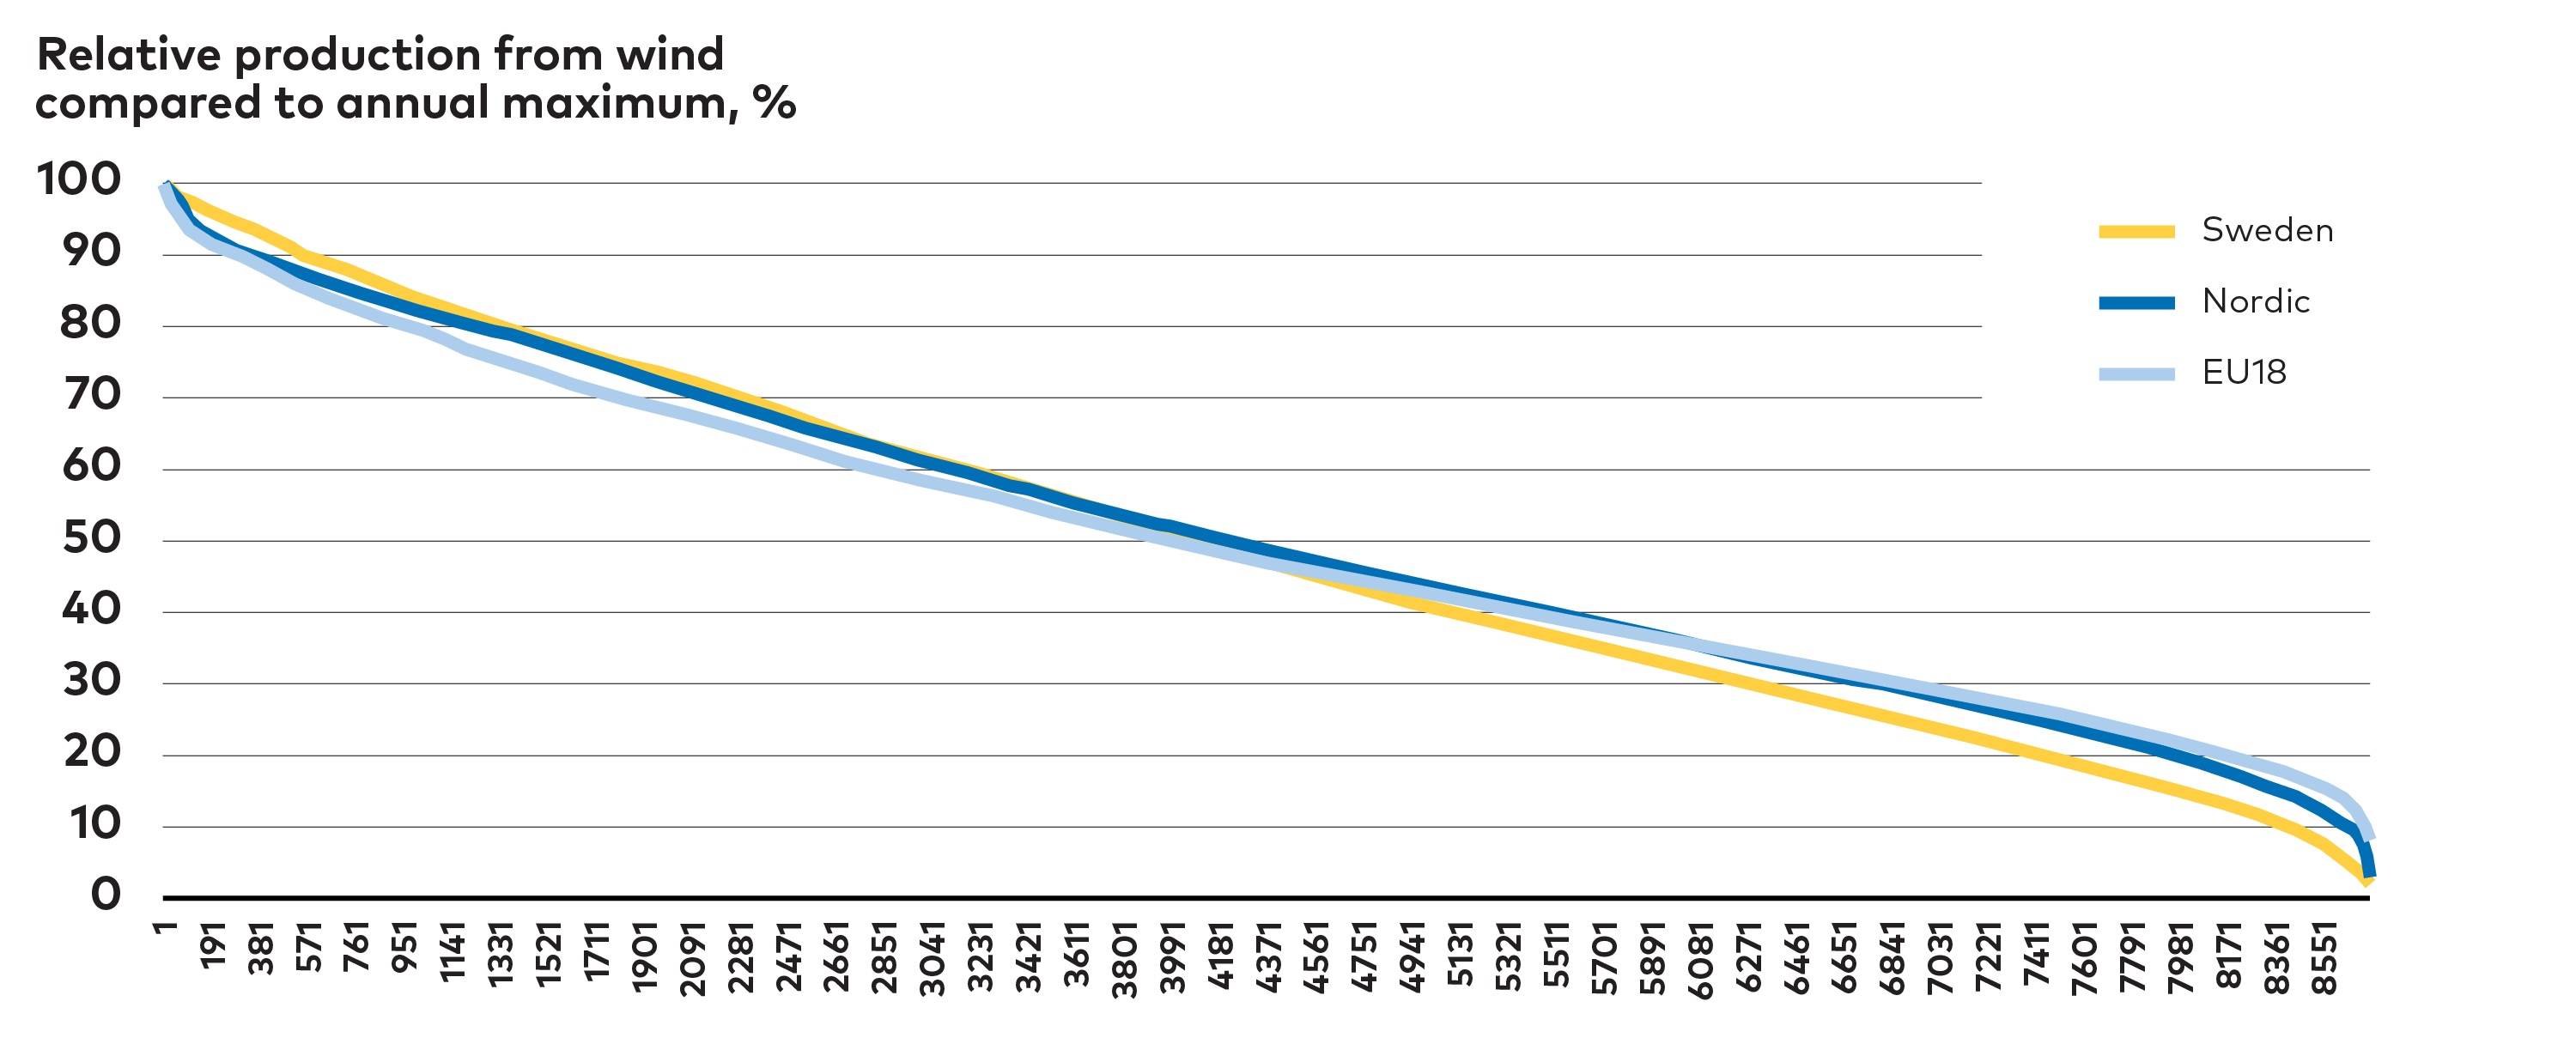
Figure A.1. Relative production from wind power compared with observed annual maximum generation. Relative production from wind power compared to the observed annual maximum generation in Sweden, the Nordic countries, and EU18. The wider the geographic scope the higher is minimum contribution from wind.
Looking only at Sweden, the hour with lowest minimum wind and solar power generation in HighPtX displays a generation figure of 1.2 GW. However, in the Nordic region minimum wind and solar generation is never less than 9.2 GW and at the EU18 level it never goes below approximately 72 GW. If we look at average production in the 100 hours with the lowest wind and solar, which is a more valid estimate of wind and solar power contribution to security of supply, we see a similar pattern.
Table A.1. Minimum wind and solar generation relative to peak generation
| Minimum wind and solar generation levels | Generation in hour with lowest wind and solar generation relative to peak generation | Average generation in 100 hours with lowest wind and solar relative to peak generation |
| Sweden | 1.7% (1.2 GW) | 5% (3.7 GW) |
| Nordics | 5.2% (9.2 GW) | 10% (18.2 GW) |
| EU18 | 7.0% (71.8 GW) | 11% (115.7 GW) |
Trading patterns in the HighPtX case shows that Nordic countries export electricity in most hours. A significant portion of this comes from offshore wind farms in Nordic waters directly supplying power for continental Europe. Exports are generally higher, when Nordic wind and solar generation is also high, but they do not follow a certain systematic pattern, rather the interconnectors are used to even out fluctuation in RE generation between countries and regions. Unlike what one could expect, we do not see large imports to the Nordic countries when the average Nordic power prices are high, reflecting that in these situations import options are limited as the European power system is also in scarcity of RE.
Figure A.2 shows a week of operation pattern of Nordic power generation in early May 2050 in the HighPtX case. Total generation varies in accordance with wind and solar power generation. In days where wind power generation is particularly high, the Nordic countries are mainly exporters of electricity, except at mid-day where high solar power generation in continental Europe leads to Nordic countries importing. At these times we also see a strong dip in electricity prices because of over-supply in the system. Hydropower generation is relatively modest at 10-12 GW during most of the week expect the first 10 hours, where hydropower compensates for low levels of wind and solar power, by providing around 26 GW to the system.
Power demand also adjusts to power prices and is markedly higher at mid-day. This higher demand in daytime reflects increasing demand for energy services such as cooking, lighting, or appliances. The most notable adjustments are the electricity demand for PtX and district heating since these demands can relatively easily be shifted to enjoy low power prices.

Figure A.2. Projected hour-by-hour operation of the Nordic power system in Week 18 (early May) 2050. Hour-by-hour operation of the Nordic power system in week 18, early May, in 2050, HighPtX case. Particularly high power generation can be seen for Tuesday, Wednesday, and Thursday. The top figure shows generation by energy source, the bottom shows electricity demand by end-use. Flexible hydro power generation, exchange of power with third countries and demand response are all important to balancing the large share of wind and solar power in the Nordic power system.

A 1.1.4 Realising flexibility potentials
Quantifying flexibility resources is a difficult task, and the market design will have an undeniable impact on the extent to which resources are realised. However, a sense of scale and character of different options is given in Table A.2. Focus is again on the HighPtX case, which displays the greatest deployment of VRE generation and the largest flexibility potential due to the significant deployment of PtX capacity.
Table A.2. Overview of Nordic electricity flexibility resources in the HighPtX case of the NCES NPH scenario in 2050. Flexibility from demand and trade, within the Nordic countries and with third countries, become key for integrating RE generation.
| Hydro | Intra-Nordic trade | Extra-Nordic trade | PtX | Electric vehicles | District heating | Individual heating | Industrial heat | |
| Flexibility (GW) | 30 | 124* | +/- 24 (+44)** | 59 | 25*** | 9*** | 2*** | 3*** |
| Timescale | hours-season | hours-weeks | hours-weeks | hours-season | hours | hours-season | hours | hours-season |
| * Total capacity between Nordic bidding zones which for comparison is just above 70 GW today. ** Transmission capacity between offshore hubs and third countries, most of this capacity is only available for export. *** Constrained by hourly demand profile. | ||||||||
The Nordic energy-only market has so far proven effective for integration of RE. The energy-only market sends clear price signals between consumers and producers for when and where electricity is needed. A feature which only becomes more important with more VRE in the system and flexible demands. This does not mean though that it has not been the focus of much discussion whether the energy-only model sufficiently result in enough investments in peak power capacity to deal with scarcity situations. In addition, it is frequently discussed if it generates sufficiently high prices to drive the needed investments towards RE capacity in a market which is increasingly dominated by generators with very low variable costs.
In scarcity situations, power prices will increase as a result of voluntary load-shedding, price elastic demand, or in involuntary disconnection of consumers causing the price to hit the price ceiling, currently at 3 000 €/MWh. The resulting high prices will give market players incentives to invest in peak power capacity and bring balance back to the market. The main question is therefore whether politicians and consumers are willing to accept occasional high prices and potentially involuntary load shedding of consumers on rare occasions?
Correspondingly, demand response will also become increasingly important for stimulating investments in wind and solar power, since new flexible loads like PtX plants and district heating will not be price takers in the market like traditional consumers. On the contrary, district heating will only consume power if prices remain at a level lower than alternative supply options, or as for PtX low enough to produce a fuel that is competitive to alternatives. Consequentially, new load will have a stabilising effect on power prices.
To realise the full potential for flexibility a key is that grid tariffs encourage use and production of power at the right time and at the right location. Traditionally most tariff structures have allocated almost all costs to consumption. In a modern power system, tariffs should incentivise consumers to consume electricity when the grid is not strained, encourage energy companies to locate power plants at strong spots in the grid, and provide incentives for owners of PtX plants to establish them close to production facilities.
Local markets for flexibility, like the Energinet pilot on Lolland, the Swedish part of Coordinet, the Switch project, and the Norwegian Norflex, may prove critical to providing real time local flexibility solutions, easing the strain on grids, and pave the way for cost-efficient RE integration.
Will the Nordic energy system need instruments to safeguard security of supply? Maybe – it will depend on whether politicians will accept high prices and disconnection of consumers on rare occasions. It is also a matter of whether looking at the energy sector as a market or as critical infrastructure. These topics are important to continue discussing but are outside of the scope of analysis within this NCES project.
Annex B
Nuclear Electricity Could Play a Long-Term Role, But is Unlikely to be a Dealbreaker
The fundamental pathways to a decarbonised energy system are very similar no matter if nuclear is part of the Nordic electricity mix after 2040 or not. Necessary near-term decisions, such as those associated with strengthening the electricity grid and decarbonising industry and transport, are not essentially different. Furthermore, the significant expansion of variable renewable electricity generation in the Nordic countries is also likely to continue whether or not nuclear power is extended post 2040, even though there may be a certain degree of substitution effects between nuclear and renewables.
The future of nuclear energy has long been a contentious and politicised issue, particularly in Sweden. One should not dismiss the challenges of moving to the high shares of wind and solar in Nordic electricity supply that we see in all NCES-scenarios. Moreover, as electrification progress, demand for electricity is likely to rise, moderately in some scenarios and dramatically so in others. This underscores the importance of a robust electricity system. As nuclear currently provides 25 - 30% of the dispatchable Nordic electricity generation, it is important to understand the consequences if that resource is removed from the system.
Nuclear energy is treated the same way as other technologies in the NCES scenarios. Investments are modelled based on assumptions about future costs of both lifetime extensions and investments in new reactors. For a simplified overview of these assumptions see Table B.1. However, for political reasons, nuclear power is only considered an option in Finland and Sweden. As with all technology cost projections assumptions are uncertain, and for nuclear projections are arguably harder than for other technologies. Capital costs, which dominate total costs, are linked to political risks, and observed costs of current projects vary more across the world than they do for other technologies.
The NCES results assume that future costs for Nordic nuclear come closer to those achieved in other parts of the world, i e significantly lower than those observed in recent nuclear projects in the EU, including Finland.
Table B.1. Assumed investment costs in Swedish nuclear reactors, Pressurised Water Reactor (PWR) and Boiling Water Reactor (BWR).[1]Energiforsk, 2021 The NCES analysis has not considered Small Modular Reactors, as they are currently deemed too far from commercialisation. For full details please see the NCES technology catalogue available at www.nordicenergy.com.
Footnotes
- ^ Energiforsk, 2021
| Reactor type | Overnight investment costs, lifetime extension (€/kW) | Overnight investment costs, new reactors (€/kW) |
| PWR | 925 | 4 500 |
| BWR | 690 | 4 500 |
B.1 What would happen if Swedish nuclear is phased out after 2040?
The share of nuclear in the Nordic electricity mix falls in all NCES scenarios. From just under 20% in 2020, to about 15% in all scenarios in 2035, to 8 %, in CNN and CNB, and 11%, in NPH, by 2050.
All scenarios contain lifetime extensions up to 80 years of the existing fleet of Swedish reactors and 60 years for the Finnish fleet of nuclear power plants. In the NPH scenario, where domestic Nordic electricity demand rise by 85% and total electricity generation more than double (107% growth) to 2050, the analysis with ON-TIMES shows that investments in new reactors in Sweden could be cost effective, albeit only just and the uncertainties are high.
To shed light on the role of nuclear the HighPtX case (see chapter 4) based on the NPH scenario, was subjected to further analysis. The HighPtX scenario contains the highest electricity demand, and the highest share of wind and solar, so is likely to be the most sensitive scenario to changes in dispatchable electricity generation. The HighPtX case was analysed to see what effect nuclear power would have on the Nordic energy system in a high electricity demand scenario. These two additional variants of the HighPtX case were analysed using the Balmorel power system model.
1. HighPtX, High Nuclear:
- Sweden: Lifetime of current fleet of Swedish reactors are extended to at least 2050, but no investments in new reactors are made, leaving 7 GW of nuclear capacity in Sweden by 2050.
- Finland: All existing nuclear power plants, including Olkiluoto 3, which is expected to be operational by 2022, as well as Hanhikivi 1 which is commissioned by 2030, are in operation by 2050. This leaves Finnish nuclear capacity at 5.6 GW by 2050.
2. HighPtX, Low Nuclear:
- Sweden: All Swedish reactors are closed after reaching their 60 years lifetime which occur around 2040.
- Finland: Hanhikivi 1 is not established and by 2050 only Olkiluoto 2 and 3 are operational, resulting in 2.5 GW of nuclear capacity in total.
In total the difference in nuclear capacity between the two cases is approximately 10 GW at the Nordic level.
Broadly speaking the differences between the two cases are relatively small, particularly compared to other changes in the energy system, but two notable observations can be made:
Offshore wind would compensate for most of the decrease in nuclear capacity and electricity generation. In the low-nuclear case, Nordic investments in offshore wind rise by 5 GW (6%), onshore by 3 GW (4%) and solar capacity by 2 GW (3%) to compensate for the 10 GW lower nuclear capacity. Net Swedish electricity export fall by 18 TWh (20%), while total Nordic exports fall by 11 TWh (5%). The model does not invest in other dispatchable capacity in the Nordic countries, such as gas turbines, to make up for the loss of 10 GW nuclear capacity. However, if we look at the broader European system, we see that the lower levels of nuclear capacity in Sweden and Finland leads to investments in 1 GW gas and oil turbines in continental Europe and another 3 GW offshore wind, 2 GW onshore wind, and 9 GW solar power. In total, 25 GW capacity, mainly wind and solar, is established across Europe, including the Nordic countries, to compensate for the reduction of 10 GW nuclear capacity in Sweden and Finland.
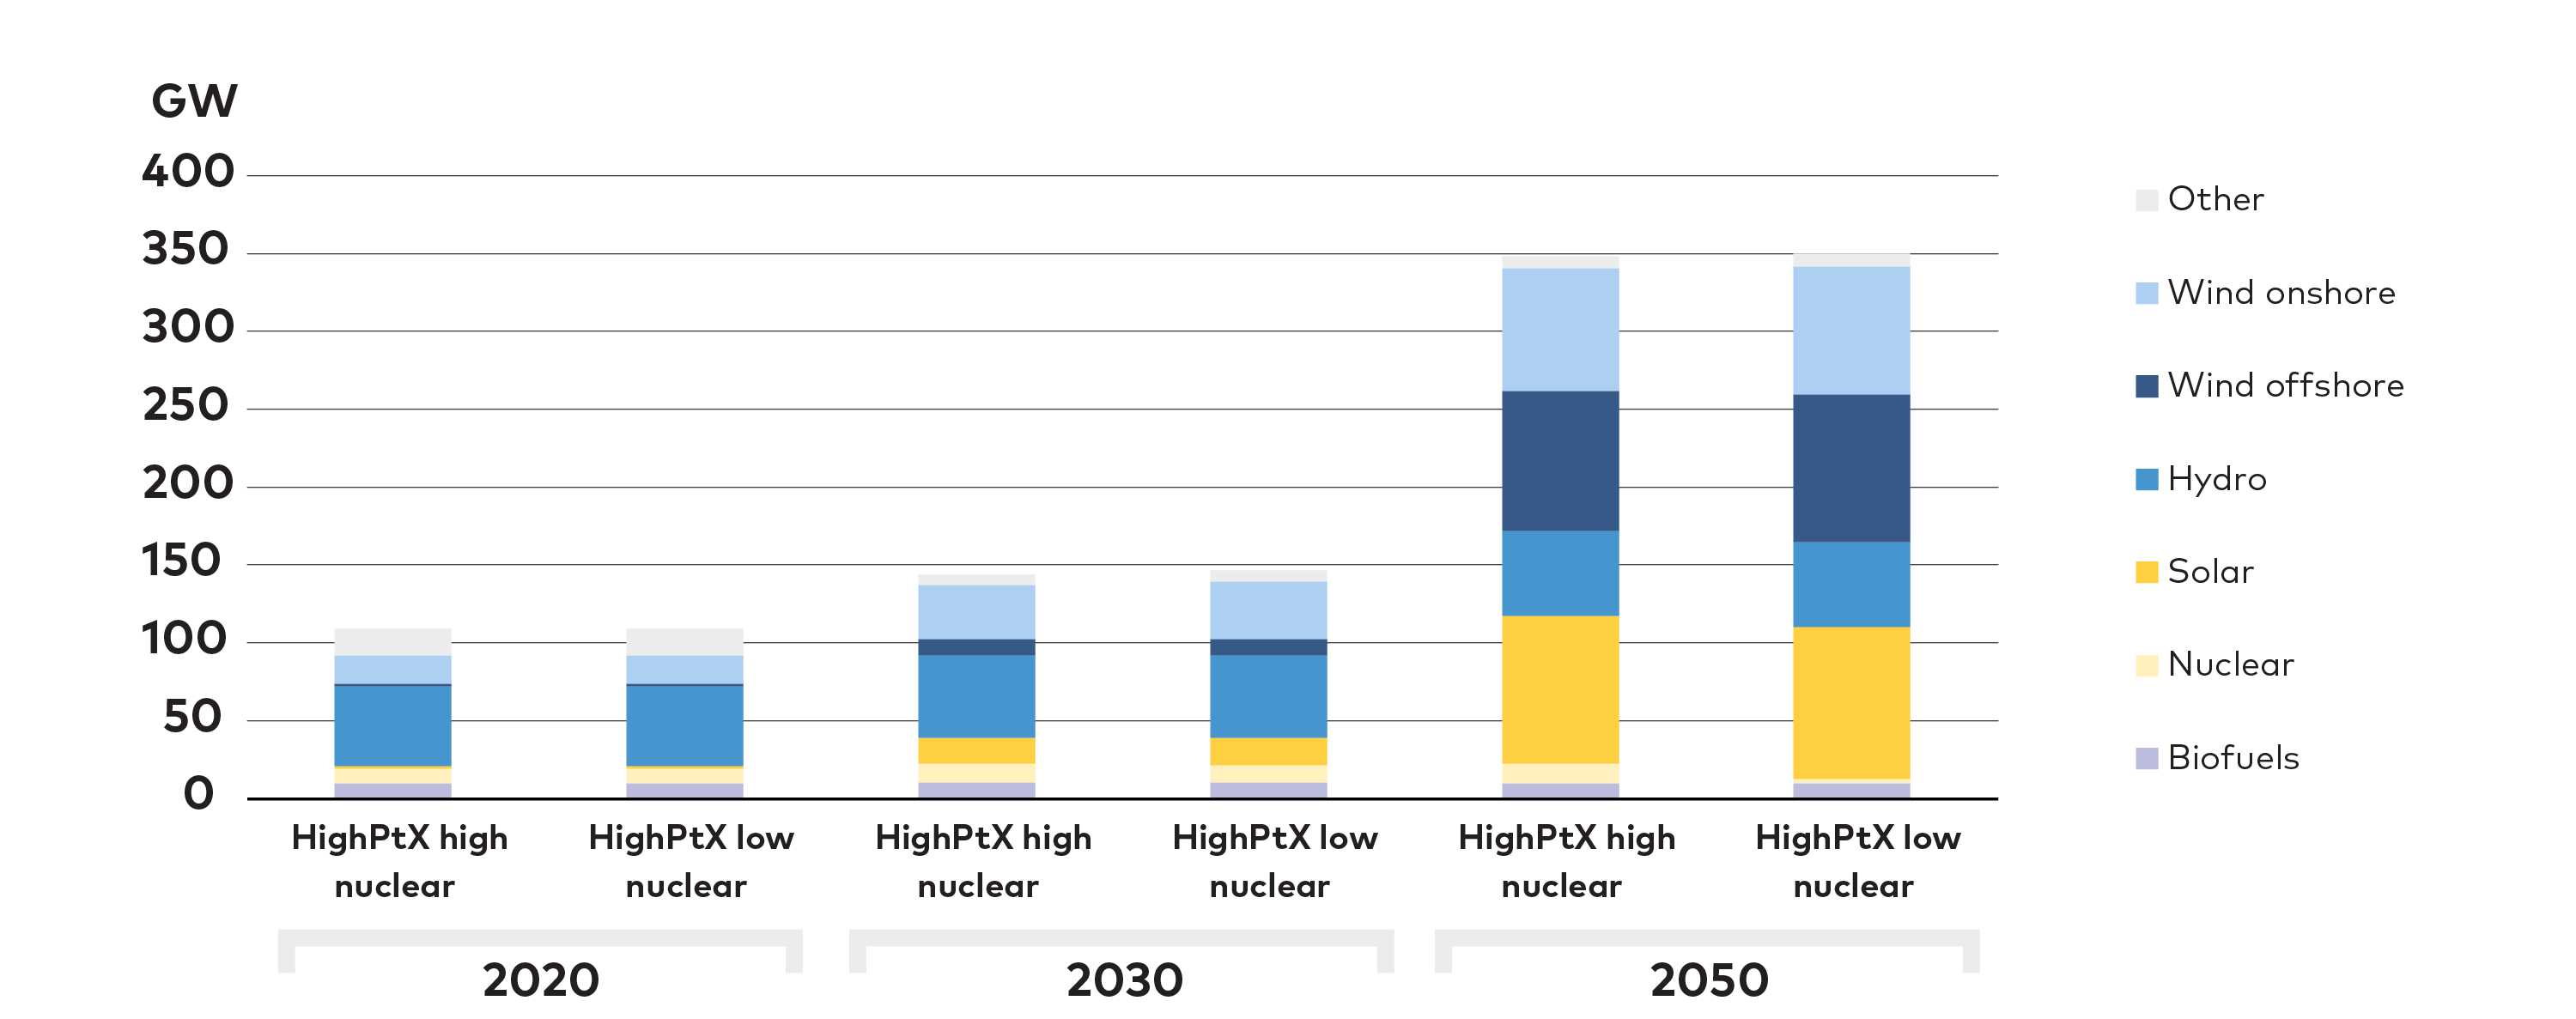
Figure B.1. Nordic installed capacity in 2020-2050, HighPtX sensitivity analysis. Nordic installed capacity in the HighPtX High Nuclear case and HighPtX Low Nuclear case. Nordic investments in offshore wind rise by 5 GW (6%), onshore by 3 GW (4%) and solar capacity by 2 GW (3%) to compensate for the 10 GW lower nuclear capacity.
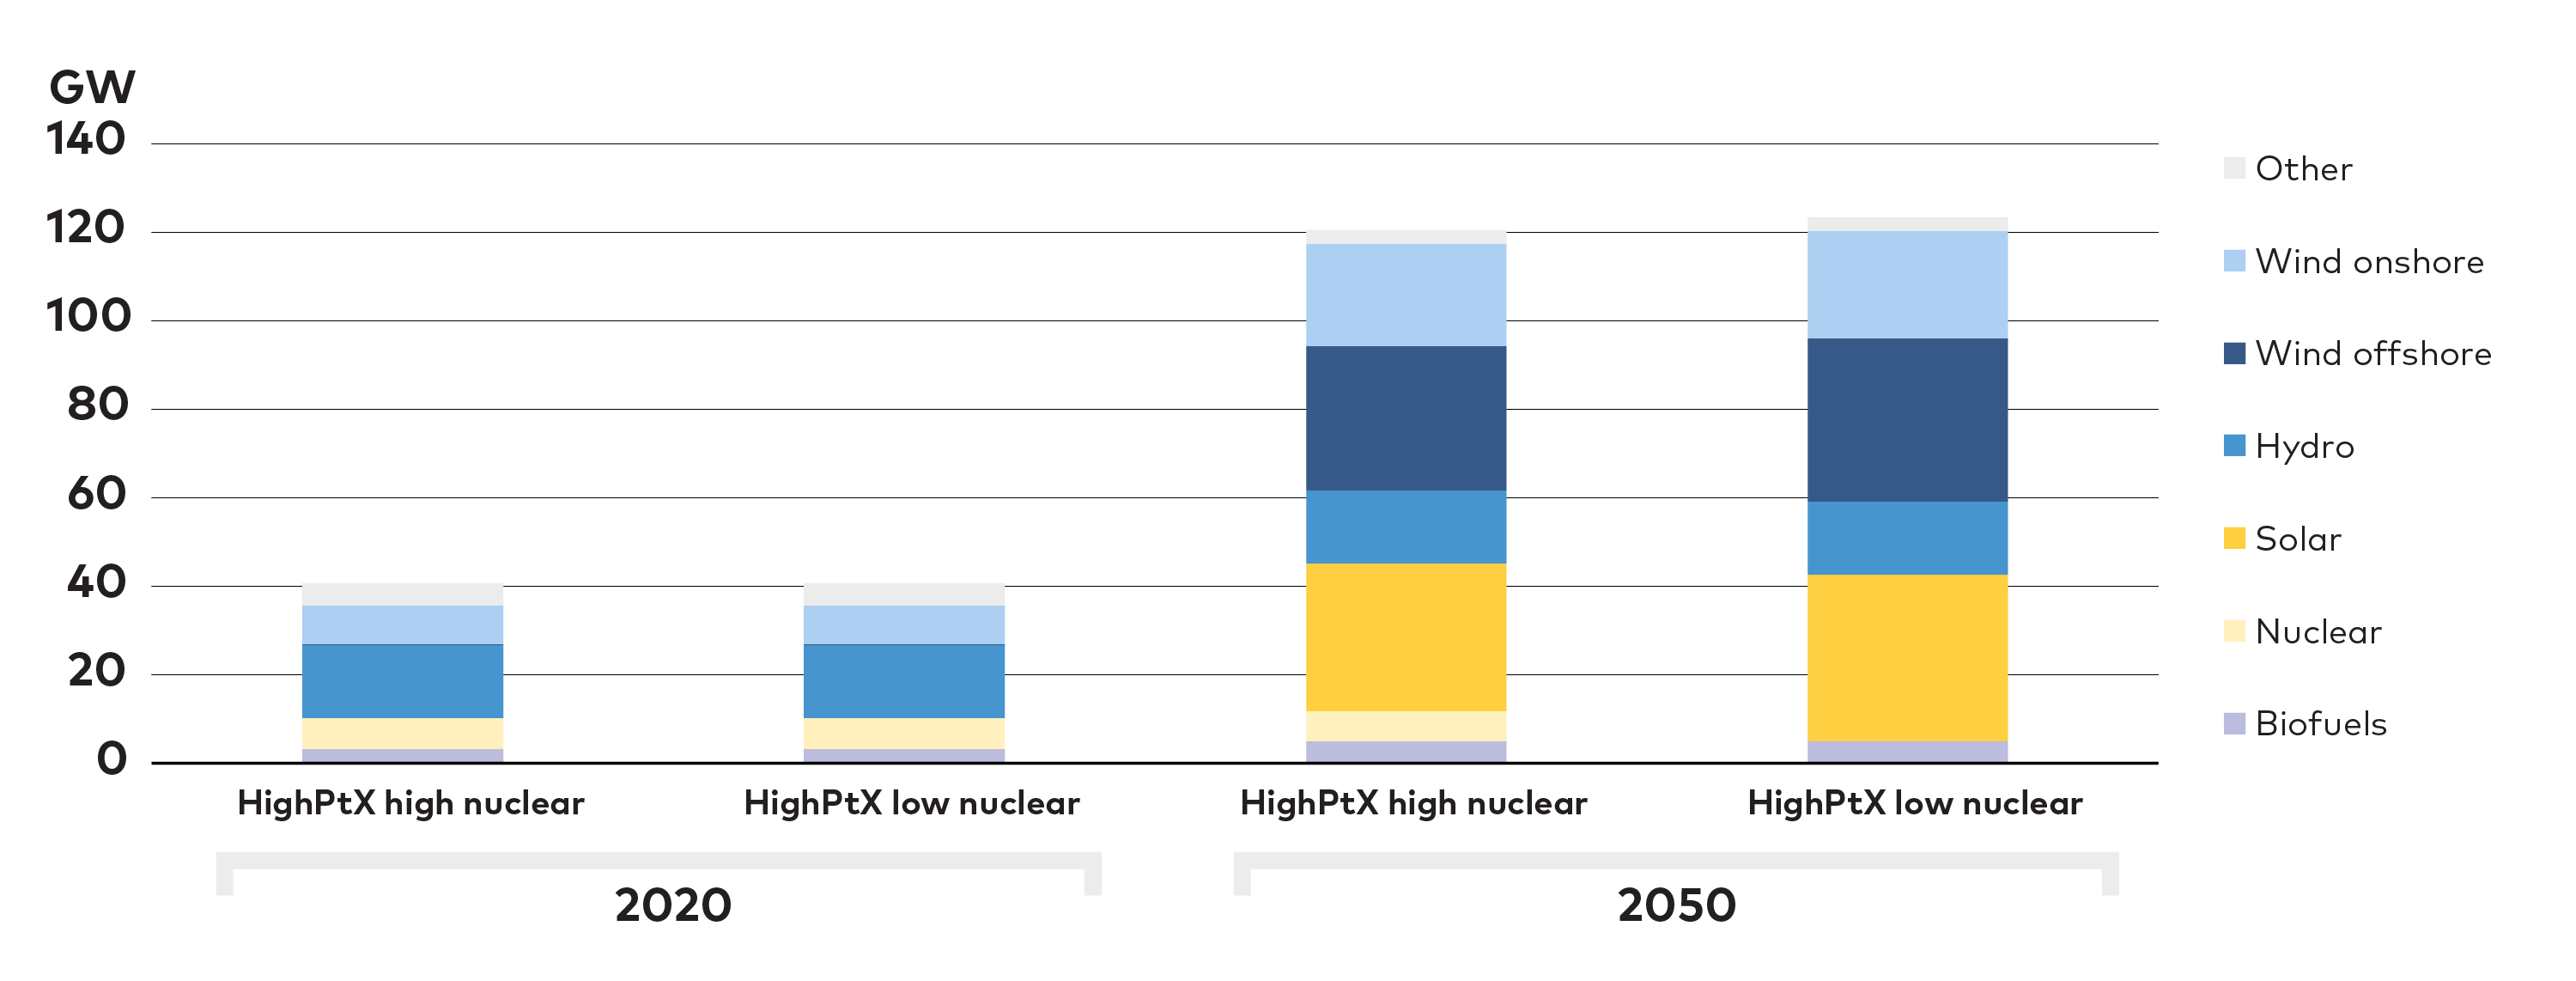
Figure B.2. Swedish installed capacity in HighPtX High Nuclear case and HighPtX Low Nuclear case. Swedish investments in offshore wind rise by 4 GW, onshore by 1 GW and solar capacity by 2 GW to compensate for the lower nuclear capacity. Reducing nuclear capacity leads to more Nordic investments in wind and solar capacity, but not in thermal power capacity.
Balancing challenges seem manageable. A detailed analysis of how security of electricity supply would be affected, for instance measured as the probability of loss of load in one or more Nordic price areas, is beyond the scope of the NCES analysis. But the NCES analysis does not indicate an absolute upper bound, nor any tipping points, beyond which the cost of balancing of the system rises dramatically or its operation becomes infeasible.
In the NCES scenarios electricity trade is an important mechanism for meeting electricity demand and ensuring efficient integration of RE across Europe. The analysis has considered the ongoing decarbonisation of power generation across the EU, including phase out of thermal power in Germany and Poland. We see a fast transition to higher RE shares reaching 75% in 2030 and 94% in 2050 at the European level and CO2 emission reductions of about 79% by 2030 and just above 100 %by 2050, due to use of BECCS. In 2050, Germany and Poland are assumed to have 85% and 78% of wind and solar in the generation mix respectively.
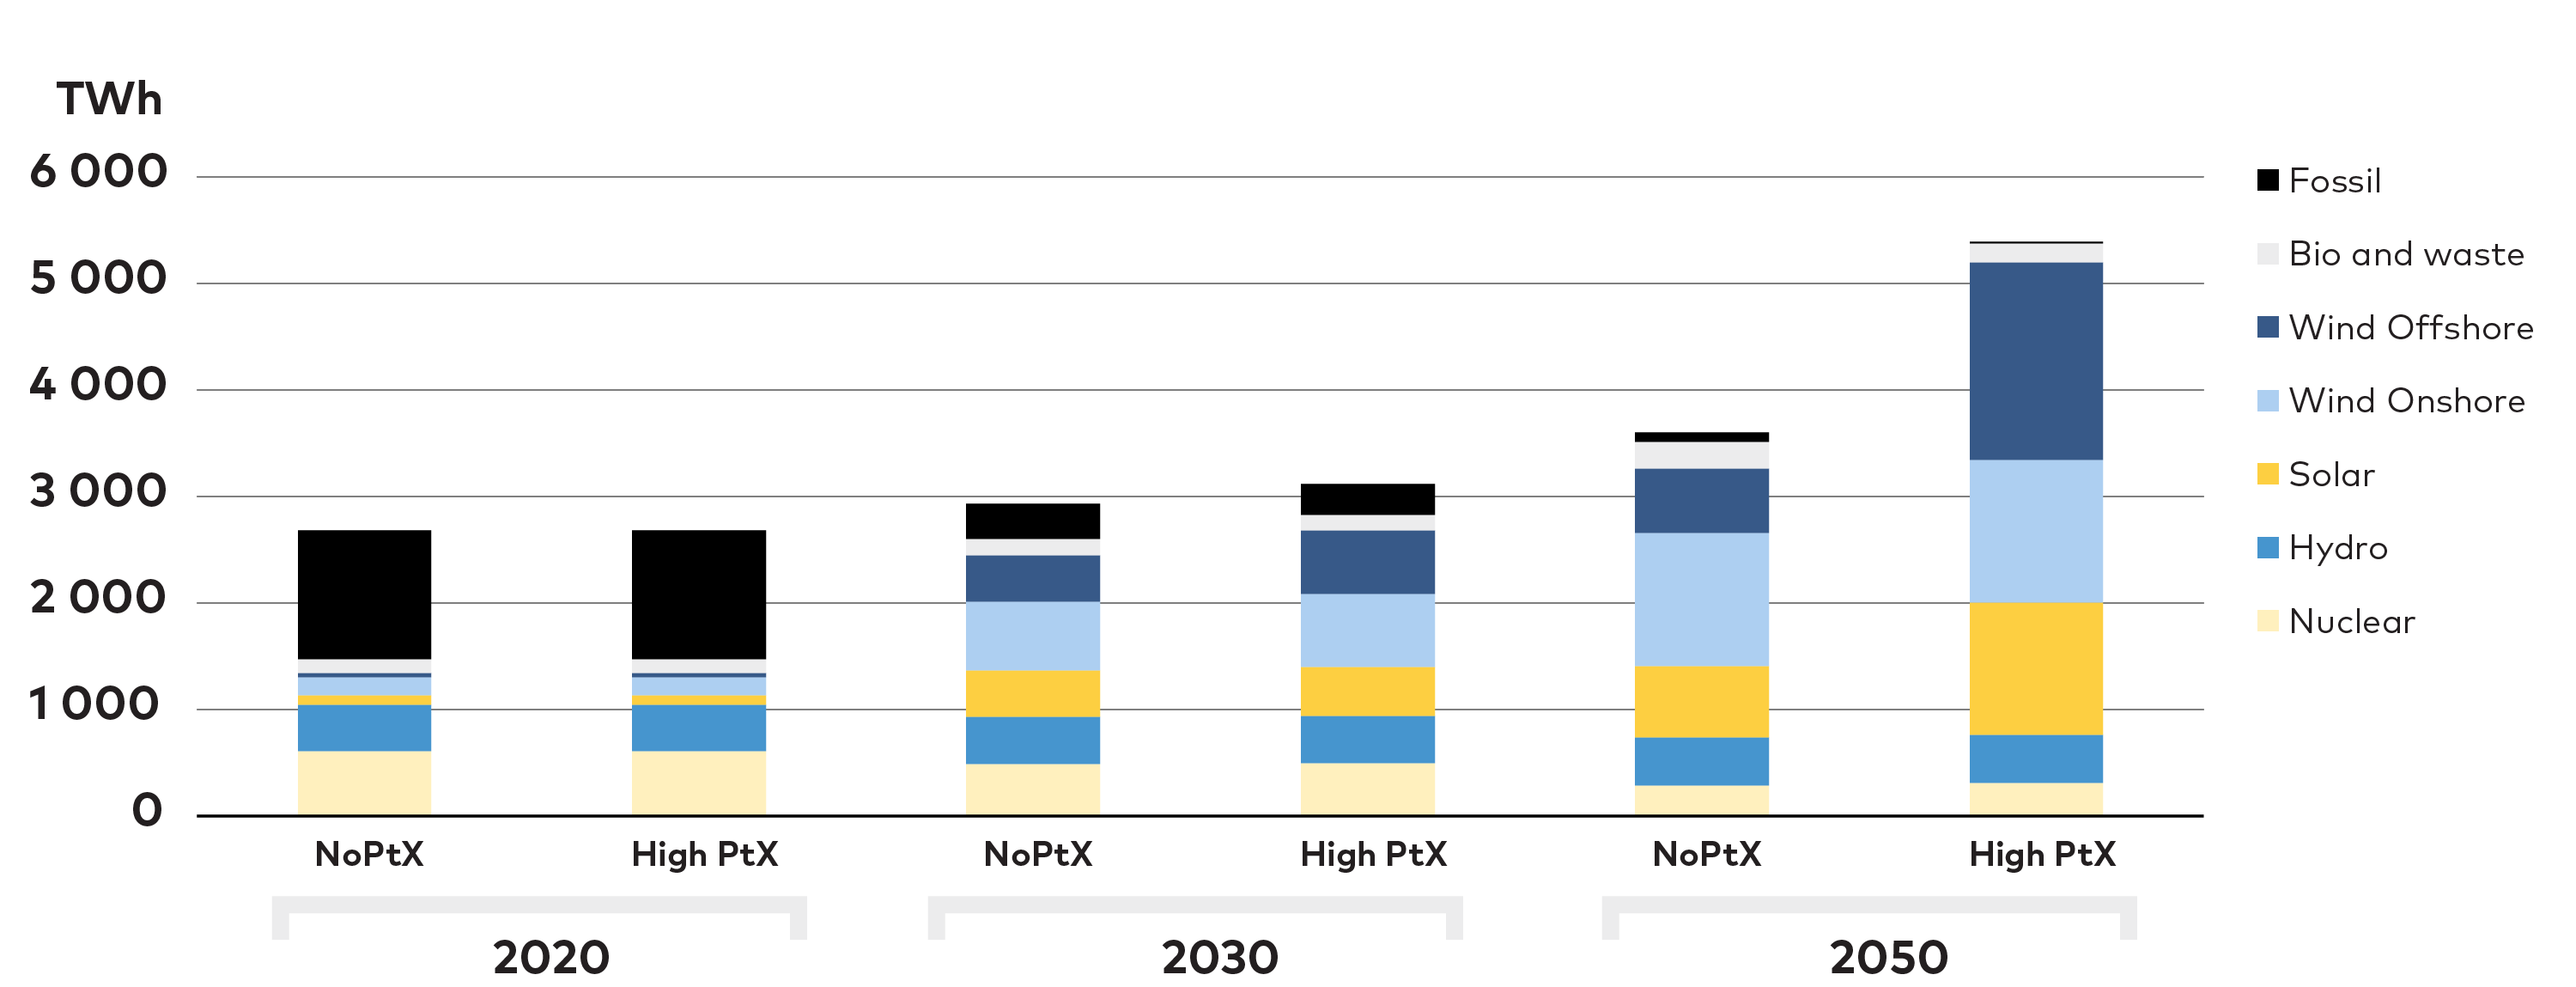
Figure B.3. Electricity generation in the European power system (EU-18), 2020 to 2050. Electricity generation by energy source in the European power system (EU-18). Wind and solar power become the dominating source of electricity production already by 2030 and in 2050 renewables account for 94% of all generation at the European level.
Balancing the energy system would become more challenging without nuclear but in the the overwhelming majority of a typical year balancing the Nordic system will be feasible without draconic measures like rolling blackouts or extreme prices. Looking at the Swedish power system in more detail we see disconnection of consumers 13 hours annually in SE3 and SE4 as a result of capacity inadequacy in both HighPtX High Nuclear and the Low Nuclear case. In SE1 and SE2 the capacity balance is less tight and brown outs are therefore not necessary. The disconnection of consumers in SE3 and SE4 is a result of an economic optimization reflecting that it is not economically rational to ensure back-up in all hours of the year. If brownouts are not politically acceptable, they could be avoided by establishing additional back-up capacity for example through markets for strategic reserves, a measure which is currently applied in Sweden and Finland. Still, very high power prices are relatively rare in both situations, in the HighPtX High Nuclear there are 115 hours annually in Sweden (average of SE1 to SE4) where power price exceed 100 €/MWh whereas in the HighPtX Low Nuclear case the 100 €/MWh mark is surpassed 131 hours annually.
INCENTIVES TO INVEST IN PEAK POWER CAPACITY IN AN ENERGY-ONLY MARKET
In the Nordic electricity market, the price ceiling is 3 000 €/MWh. If the price ceiling is reached, involuntary disconnection of consumers, so called brown-outs, is needed unless back-up capacity is procured by the system operator. Contrary to a blackout, where the system collapses, a brown-out is a controlled disconnection of pockets of customers. This is usually done according to a schedule protecting consumers that are believed to have a particularly high willingness to pay for electricity, such as hospitals, railways, and certain industries.
Unrealistically assuming that there is no demand response in the market, disconnections could on average take place for around 17 hours a year. The rationale is that it takes 17 hours with a profit contribution of approximately 2 900 €/MWh (price ceiling minus short-run marginal cost of approximately 100 €/MWh for a peak power plant) to recover the fixed capital costs of new peak power capacity of around 50 000 €/MW per annum. If the marginal unit is an existing gas or oil-fired power plant the fixed cost is lower, around 10 000- 15 000 €/MW per annum, the price ceiling would only have to be reached 3-5 hours a year.
We do see a slightly higher reliance of import in the HighPtX case with low nuclear capacity, although the maximum Swedish import capacity is almost identical in the two cases. In the HighPtX High Nuclear case Sweden is by 2050 a net importer of power in 700 hours (2.4 TWh). This number increases to 1300 hours a year (4.7 TWh) in the HighPtX Low Nuclear case. However, it is important to emphasise that a large portion of the hours where Sweden imports power do not take place when the power balance is strained, rather the import is a means to ensure cost-effective integration of variable renewables across the region. If we narrow the scope to situations with high power prices in Sweden (>75 €/MWh) we see 83 such import-hours in the HighPtX High Nuclear and 197 import-hours in the HighPtX Low Nuclear case.
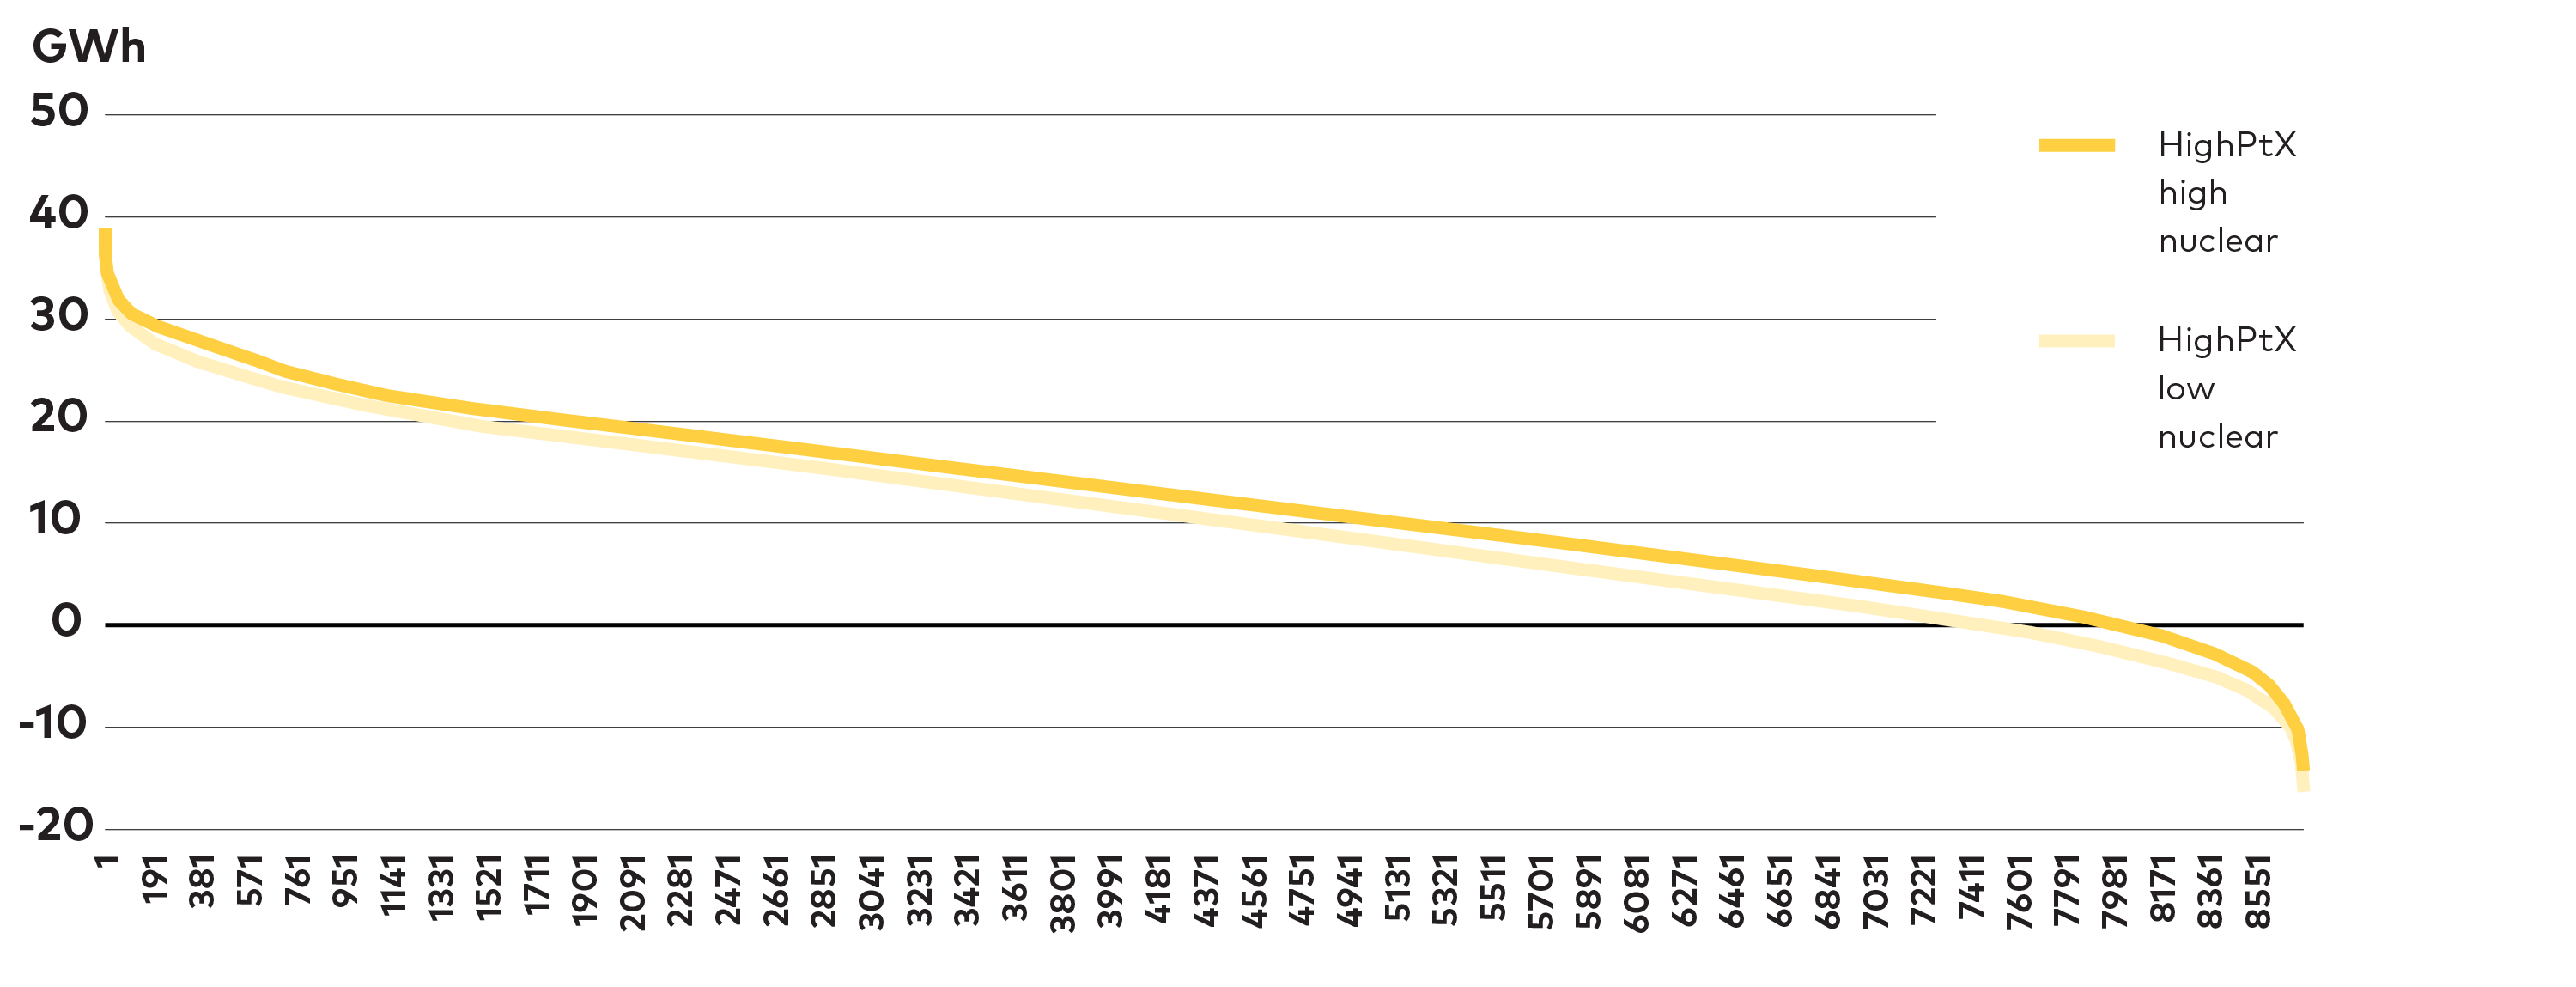
Figure B.4. Net exchange of power from Sweden. Duration curve for net exchange of power from Sweden (+export, - import) in the HighPtX High Nuclear case and HighPtX Low Nuclear case. In the HighPtX High Nuclear case Sweden by 2050 is net importer of power in 700 hours (2.4 TWh) increasing 1300 hours a year (4.7 TWh) in the HighPtX Low Nuclear case. Absence of nuclear power in Sweden increases import of power from other countries.
Nevertheless, there could be instances where there is not enough capacity in the Nordic system, and where electricity import is not available. A simple indicator of this challenge is the difference between the annual peak demand and the dispatchable capacity, as shown for Sweden in Figure B.5. The figure disregards power consumption for PtX plants and power for district heating plants since both loads are assumed to be flexible and would therefore voluntarily abstain from using electricity at high power prices. Such flexibility options are not considered for the other demand categories in the figure, such as classic, data centres, individual heating, industrial demand, and EVs. The peak figure is therefore a pessimistic estimate of the maximum load on the system.

Figure B.5. Swedish installed dispatchable capacity and peak demand - 2050. The gap between the annual peak load and dispatchable capacity in Sweden grows from 7 GW in the HighPtX High Nuclear to 14.5 GW in the HighPtX Low Nuclear case.
It would be expensive to eliminate the inherent risk of relying on trade, but likely not impossibly so. An upper estimate of the cost of closing this gap and always ensuring adequate capacity at all times, is the cost of closing the peak capacity gat with flexible biogas fired gas turbines.
Assuming that the Low Nuclear system has an additional 7 GW capacity gap and the overnight investment cost of open cycle gas turbines is €500/kW, the Low Nuclear case would require an additional investment of some €3.5 billion compared with the High Nuclear case, as shown in Figure 0.5 This is a substantive amount of money, but likely only a few percentage points of total investments in Swedish electricity generation.
An analysis of Nordic electricity prices in the two cases confirm this picture. Electricity prices are higher in the Low Nuclear case, reflecting the higher costs of alternative supply options, but not dramatically higher. The shapes of the price duration curves are similar, see Figure B.6, and average annual Nordic system price rise by 1 %. The biggest price difference is observed in SE3 where the annual average price is 1 €/MWh (2.6 %) higher in the Low Nuclear case.
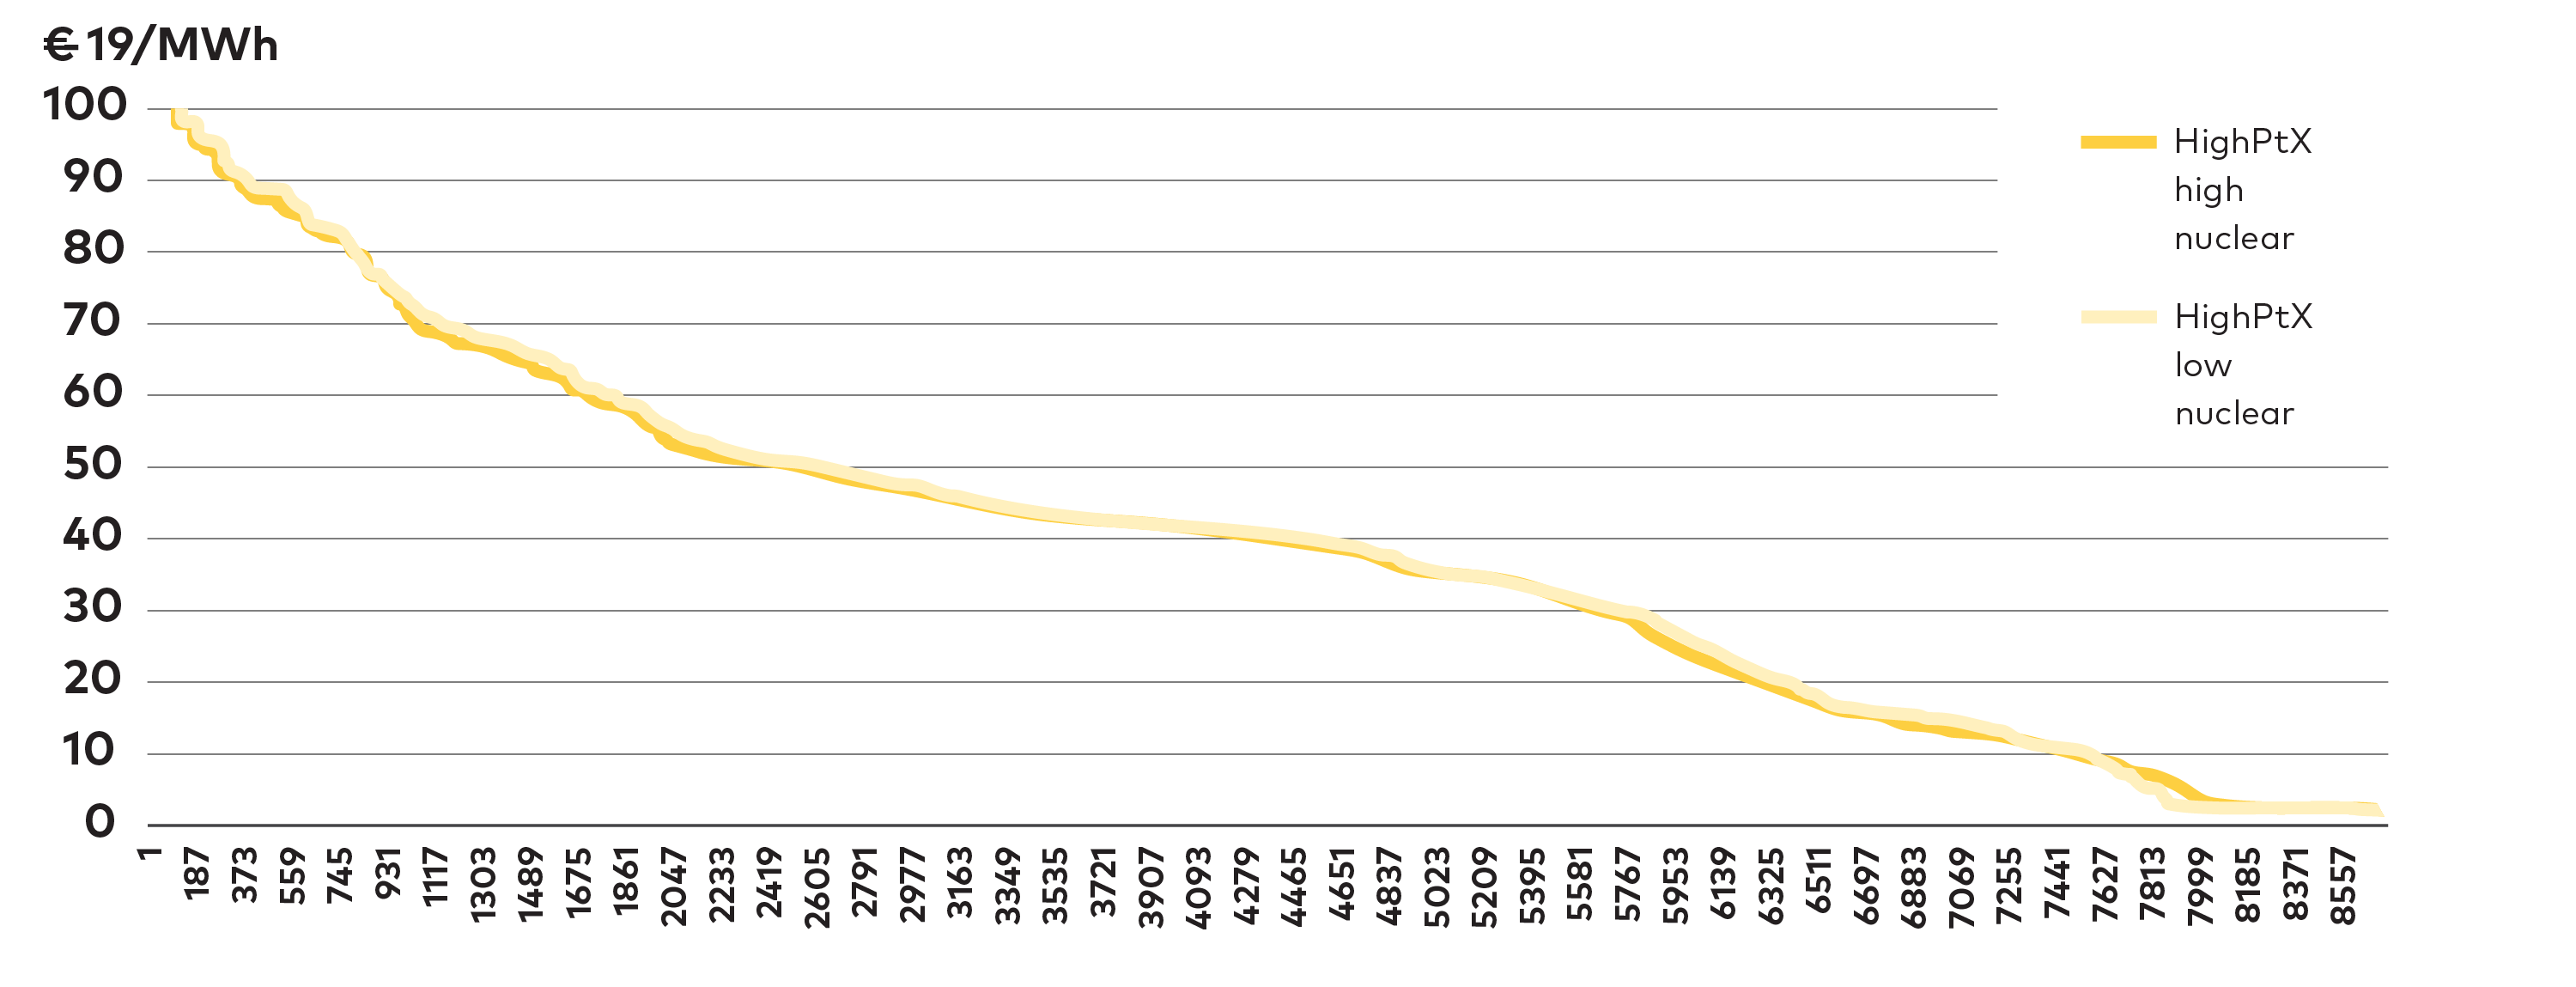
Figure B.6. Price duration curve, Sweden 2050. The price duration curves do not change dramatically between the two cases.
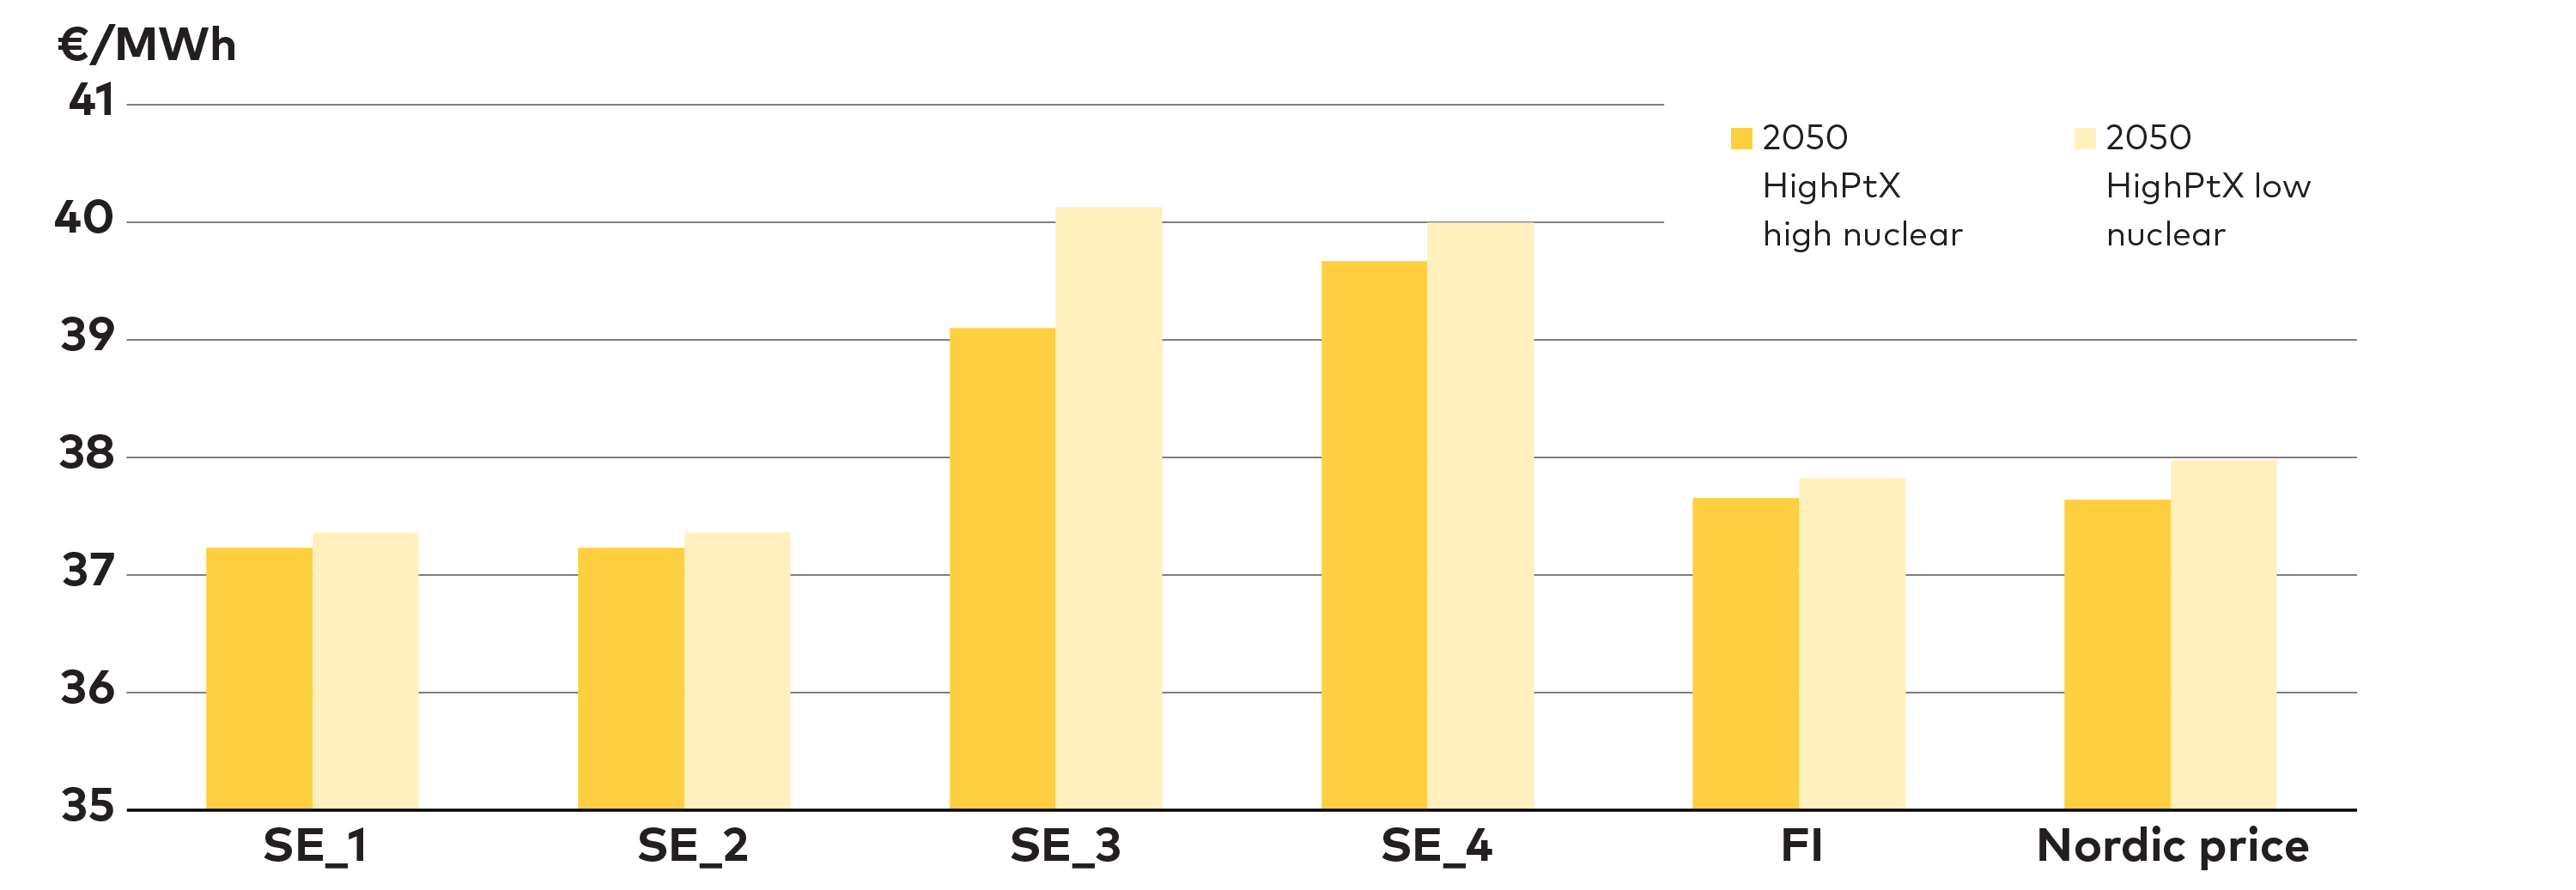
Figure B.7. Annual average electricity prices in 2050, HighPtX sensitivity analysis. In the Low Nuclear scenario average annual Nordic electricity prices rise by 1% compared to the High Nuclear case, while average annual prices in SE3 price area rise by 2.6% Note that y-axis is cut to highlight differences between cases.
Abbreviations
| BECCS | Bioenergy with Carbon Capture and Storage |
| BEV | Battery Electric Vehicle |
| BWR | Boiling Water Reactor |
| CCS | Carbon Capture and Storage |
| CCUS | Carbon Capture, Utilisation, and Storage |
| CHP | Combined Heat and Power |
| CIRC | Circular Economy |
| CNB | Climate Neutral Behaviour |
| CNN | Carbon Neutral Nordic |
| CNN-BIO | Carbon Neutral Nordic with Bioenergy constraint |
| DAC | Direct Air Capture |
| DACCS | Direct Air Carbon dioxide Capture and Storage |
| DH | District Heating |
| DHC | District Heating and Cooling |
| DRI | Direct Reduced Iron |
| EC | European Commission |
| EE | Energy Efficiency |
| EEA | European Environment Agency |
| ELEC | Electrification |
| E-roads | Electric roads |
| EU | European Union |
| EU ETS | EU Emissions Trading System |
| EV | Electric Vehicle |
| GDP | Gross Domestic Product |
| GHG | Green House Gases |
| HTL | HydroThermal Liquefaction |
| ICEV | Internal Combustion Engine Vehicle |
| IEA | International Energy Agency |
| IPCC | Intergovernmental Panel on Climate Change |
| LCOCO2 | Levelized Cost Of capturing CO2 |
| LULUCF | Land Use, Land-Use Change and Forestry |
| NCES | Nordic Clean Energy Scenarios |
| NETP | Nordic Energy Technology Perspectives |
| NHP | Nordic Powerhouse |
| NVE | Norwegian Water Resources and Energy Directorate |
| PEM | Polymer Electrolyte Membrane |
| PHEV | Plug-in Hybrid Electric Vehicle |
| PtX | Power-to-X |
| PV | PhotoVoltaic |
| PWR | Pressurized Water Reactor |
| R&D | Research and Development |
| RDD&D | Research, Development, Demonstration, and Deployment |
| RE | Renewable Electricity |
| SOEC | Solid Oxide Electrolysis Cell |
| TSO | Transmission System Operator |
| UNFCC | United Nations Framework Convention on Climate Change |
| V2G | Vehicle-to-Grid |
| VRE | Variable Renewable Energy |
References
Chapter 1
European Commission. (2020). National energy and climate plans (NECPs). Retrieved from, https://ec.europa.eu/energy/topics/energy-strategy/national-energy-climate-plans_en
European Environment Agency. (2019a). Trends and projections in Europe 2019. EEA Report No 15. Retrieved from, https://www.eea.europa.eu/publications/trends-and-projections-in-europe-1
European Environment Agency. (2019b). National policies and measures on climate change mitigation in Europe. Retrieved from, https://www.eea.europa.eu/themes/climate/national-policies-and-measures
European Environment Agency. (2020). Greenhouse gas emissions from transport in Europe. Retrieved from, https://www.eea.europa.eu/data-and-maps/indicators/transport-emissions-of-greenhouse-gases-7/assessment
European Environment Agency. (2019c). Member States’ greenhouse gas (GHG) emission projections. Retrieved from, https://www.eea.europa.eu/data-and-maps/data/greenhouse-gas-emission-projections-for-6
Government of Iceland. (June 23, 2020). New Climate Action Plan - Iceland will fulfil its commitments and more. Retrieved from, https://www.government.is/diplomatic-missions/embassy-article/2020/06/23/New-Climate-Action-Plan-Iceland-will-fulfil-its-commitments-and-more
IEA. (2020). World Energy Outlook. Retrieved from, https://www.iea.org/reports/world-energy-outlook-2020
Koljonen, T., Aakkula, J., Honkatukia, J., Soimakallio, S., Haakana, M., Hirvelä, H., Kilpeläinen, H., Kärkkäinen, L., Laitila, J., Lehtilä, A., Lehtonen, H., Maanavija, L., Ollila, P., Siikavirta, H., & Tuomainen, T. (2020). Hiilineutraali Suomi 2035 - Skenaariot ja vaikutusarviot. VTT Technical Research Centre of Finland, VTT Techno. Retrieved from, https://www.vttresearch.com/sites/default/filesnordicenergyresearch2021-01.pdftechnology/2020/T366.pdf
Miljødirektoratet. (2020). Klimakur 2030 - Tiltak og virkemidler mot 2030. M–1625. Retrieved from, https://www.miljodirektoratet.no/klimakur
Ministry for the Environment and Natural Resources. (2018). Iceland’s Climate Action Plan for 2018-2030. September, 1–9. Retrieved from, https://www.government.is/lisalib/getfile.aspx?itemid=5b3c6c45-f326-11e8-942f-005056bc4d74
NEPP. (2020). Insikter och vägval i energiomställningen: Slutrapport från NEPPs andra etapp. Retrieved from, https://www.nepp.senordicenergyresearch2021-01.pdfInsikter_och_vagval.pdf
Nordics Statistics Database. (n.d.). Demography: Population size. Retrieved from, https://www.nordicstatistics.org/population/
OECD/IEA & Nordic Energy Research. (2013). Nordic Energy Technology Perspectives: Pathways to a Carbon Neutral Energy Future. Retrieved from, https://www.nordicenergy.org/wordpress/wp-content/uploads/2012/03/Nordic-Energy-Technology-Perspectives.pdf
OECD/IEA & Nordic Energy Research. (2016). Nordic Energy Technology Perspectives: Cities, flexibility, and pathways to carbon neutrality. Retrieved from, https://www.nordicenergy.org/wp-content/uploads/2015/12/Nordic-Energy-Technology-Perspectives-2016.pdf
Chapter 3
Cementa & Vattenfall. (2018). CemZero – A feasibility study evaluating ways to reach sustainable cement production via the use of electricity. Retrieved from, https://www.cementa.se/sv/cemzero
Dorr, A. & Seba, T. (2020). Rethinking Energy 2020-2030: 100% Solar, Wind, and Batteries is Just the Beginning. RethinX. Retrieved from, https://static1.squarespace.com/static/585c3439be65942f022bbf9b/t/5f96dc32289db279491b5687/1603722339961/Rethinking+Energy+2020-2030.pdf
eRoadAlanda. (n.d.). Roads of the future – electrified roads. Retrieved from, https://eroadarlanda.com/about-the-project/
European Commission. (2018). A Clean Planet for all: A European long-term strategic vision for a prosperous, modern, competitive and climate neutral economy. Retrieved from, com_2018_733_analysis_in_support_en_0.pdf (europa.eu)
Jernkontoret. (2021). HYBRIT möjliggör en helt fossilfri värdekedja för malmbaserat stål. Retreived from, https://www.jernkontoret.se/sv/publicerat/nytt-fran-jernkontoret/nyheter/2021/hybrit-mojliggor-en-helt-fossilfri-vardekedja-for-malmbaserat-stal/
IEA. (2018). Nordic EV Outlook 2018: Insights from leaders in electric mobility. Retrieved from, https://webstore.iea.org/nordic-ev-outlook-2018
IEA. (2020). Global EV Outlook 2020: Technology Catalogue. Retrieved from, https://www.iea.org/reports/global-ev-outlook-2020
Region Gävleborg. (2020). The World’s first electric road on the E16. Retrieved from, https://www.regiongavleborg.se/regional-utveckling/samhallsplanering-och-infrastruktur/elvag/the-electric-highway-in-english/
SHIFT. (2019). Final report: Shift project summary. Retrieved from, https://www.nordicenergy.org/flagship/project-shift/
Smartroad Gotland. (n.d.). The world's first wireless electric road charging an e-bus and an e-truck. Retrieved from, https://www.smartroadgotland.com/
Åhman M., Olsson, O., Vogla, V., Nyqvist, B., Maltais, A., Nilsson, L.J., Hallding, K. & Nillson, M. (2018). Hydrogen steelmaking for a low-carbon economy: A joint LU-SEI working paper for the HYBRIT project. Stockholm Environmental Institute and Lund University. Retrieved from, hydrogen-steelmaking-for-a-low-carbon-economy.pdf (sei.org)
Chapter 4
Dansk Energi. (2020). Anbefalinger til en dansk strategi for Power-to-X Dansk Energi, 2020. Retrieved 22-03-2021 from https://www.danskenergi.dk/sites/danskenergi.dk/files/media/dokumenter/2020-11/Anbefalinger-til-en-dansk-strategi-for-Power-to-X.pdf
Energistyrelsen. (2021). Cost benefit analyse og klimaaftryk af energiøer i Nordsøen og Østersøen. A209704-001. COWI. Retrieved from, https://ens.dk/sites/ens.dk/files/Vindenergi/a209704-001_cost_benefit_analyse_endelig_version.pdf
Fossilfritt Sverige. (2021). Strategy for fossil free competitiveness: Hydrogen. Retrieved 21.03.2021 from, https://fossilfrittsverige.se/en/strategies/hydrogen/
European Commission. (2018). A Clean Planet for all, A European long-term strategic vision for a prosperous, modern, competitive and climate neutral economy. Impact Assessment. Retrieved 21.03.2021 from, https://ec.europa.eu/clima/sites/clima/files/docs/pages/com_2018_733_analysis_in_support_en_0.pdf
European Commission. (2020). A hydrogen strategy for a climate-neutral Europe. Retrieved 22.03.2021 from https://eur-lex.europa.eu/legal-content/EN/TXTnordicenergyresearch2021-01.pdf?uri=CELEX:52020DC0301&from=EN
Chapter 5
Eurostat. (2020). Complete energy balances [nrg_bal_c]. Available at: https://appsso.eurostat.ec.europa.eu/nui/show.do (accessed: 22.05.20).
Jåstad, E. O. (2020). Assessments of the future role of bioenergy in the Nordic energy and forest sectors. [Doctoral Thesis]. Ås.
Pöyry and Nordic Energy Research. (2019). Potential for Bioenergy in the Nordics. Available at: https://www.nordicenergy.org/publications/potential-for-bioenergy-in-the-nordics/ (accessed: 01.02.21).
Chapter 6
Carbfix. (n.d.). We make CO2 into stone. Retrieved from, https://www.carbfix.com/
Danish Energy Agency. (2021). Technology Data. Retrieved from, https://ens.dk/en/our-services/projections-and-models/technology-data
Nordiccs. (2011). Nordic emission points. Retrieved from, https://data.geus.dk/nordiccs/map.xhtml
Nordiccs. (2014). Prospective Nordic CO2 storage sites. Retrieved from, https://data.geus.dk/nordiccs/map.xhtml
Northern Lights. (n.d.). Accelerating decarbonisation. Retrieved from, https://northernlightsccs.com/what-we-do/
Chapter 7
Aasen, M., Klemetsen, M., Ursin Reed, E. & Vatn,A. (2019). Folk og klima: Nordmenns holdninger til klimaendringer, klimapolitikk og eget ansvar. Rapport 2019:20. Cicero. Retrieved from, https://pub.cicero.oslo.no/cicero-xmlui/handle/11250/2634149
AC Hoek, D Pearson, SW James, MA Lawrence, S Friel. (2016). Shrinking the food-print: A qualitative study into consumer perceptions, experiences and attitudes towards healthy and environmentally friendly food behaviours. Appetite. DOI. 108. 10.1016/j.appet.2016.09.030.
Avinor. (2021). Statistics. Retrieved from, https://avinor.no/en/corporate/about-us/statistics/traffic-statistics
Bolwig, S., Folsland-Bolkesjø, T., Klitkouc, A., Lund, P.D., Bergaentzlé, C., Borch, K., Olsen, O.J., Kirkerud, J.G., Chen, Y.K., Gunkel, P.A. & Skytte, K. (2020). Climate-friendly but socially rejected energy-transition pathways: The integration of techno-economic and socio-technical approaches in the Nordic-Baltic region. Energy Research & Social Science, 67. https://doi.org/10.1016/j.erss.2020.101559
Ellingsen, A. (2019). Norwegians’ meat consumption has decreased. Norway Today. Retrieved from, https://norwaytoday.info/finance/norwegians-meat-consumption-has-decreased/
Energiateollisuus. (2019). Suomalaisten energia-asenteet 2019. Retrieved from, https://energia.fi/files/4313/Energiateollisuus_-_Energia-asenteet_2019.pdf
European Commission. (2018). A Clean Planet for all: A European long-term strategic vision for a prosperous, modern, competitive and climate neutral economy. Retrieved from, com_2018_733_analysis_in_support_en_0.pdf (europa.eu)
European Commission. (2020). Statistical pocketbook 2020: EU Transport in Figures. Retrieved from, https://ec.europa.eu/transport/facts-fundings/statistics/pocketbook-2020_en
European Environmental Agency. (2019). European Aviation Environmental Report 2019. Retrieved from, https://ec.europa.eu/transport/sites/transport/files/2019-aviation-environmental-report.pdf
Food and Agriculture Organization of the United Nations, FAO. (2018). Food balances & New food balances. Retrieved from, www.fao.org/faostat/en/#data.
Jordbruksverket. (2021). Trenden fortsätter - mer svenskt, mindre importerat och mindre kött på tallriken. Pressmeddelande. Retrieved from, https://www.mynewsdesk.com/se/jordbruksverket/pressreleases/trenden-fortsaetter-mer-svenskt-mindre-importerat-och-mindre-koett-paa-tallriken-3081906
Korkala, E., Hugg, T. and Jaakkola, J. (2014). Awareness of Climate Change and the Dietary Choices of Young Adults in Finland: A Population-Based Cross-Sectional Study. PubMed. DOI. 10.1371/journal.pone.0097480.
Mikkala, E. (2020). What was eaten in Finland in 2019? Luke, National Resources Institute Finland. Retrieved from, https://www.luke.fi/uutinen/mita-suomessa-syotiin-vuonna-2019/
NRK. (2019). Forsker: – Flyskam har ikke slått ut i Norge. Retrieved from, www.nrk.no/norge/forsker_-_-flyskam-har-ikke-slatt-ut-i-norge-1.14781148
NVE. (2020). Langsiktig kraftmarkedsanalyse. Retrieved from, www.nve.no/energiforsyning/kraftmarkedsdata-og-analyser/langsiktig-kraftmarkedsanalyse/
Taraldsen, L.E. (2020). Norway to Rein In Wind Power After Raging Opposition From Locals. Bloomberg Green. Retrieved from, www.bloomberg.com/news/articles/2020-06-19/norway-to-rein-in-wind-power-after-raging-opposition-from-locals
UNFCCC. (2020). Greenhouse Gas Inventory Data - Comparison by Category. Retrieved from, https://di.unfccc.int/comparison_by_category
Saarinen, M., Kaljonen, M., Niemi, J., Antikainen, R., Hakala, K., Hartikainen, H., Heikkinen, J., Joensuu, K., Lehtonen, H., Mattila, T., Nisonen, S., Ketoja, E., Knuuttila, M., Regina, K., Rikkonen, P., Seppälä, J. & Varho, V. (2019). Ruokavaliomuutoksen vaikutukset ja muutosta tukevat politiikkayhdistelmät: RuokaMinimi-hankkeen loppuraportti. Valtioneuvoston kanslia Helsinki. Report 2019:47. Retrieved from, https://julkaisut.valtioneuvosto.fi/handle/10024/161742
Chapter 8
DNV GL. (2020). The Norwegian Full-Scale CCS Demonstration Project: Potential for reduced cost for carbon capture, transport, and storage value chains (CCS). Report nr, 2019-1092, 2nd revision. Retrieved from, https://ccsnorway.com/wp-content/uploads/sites/6/2020/07/Report-Cost-reduction-curves-for-CCS-Gassnova-version-2b-1.pdf
Falnes, J. (2021). Equinor vurderer hydrogenrør til Europa: – Hvis vi gjør dette, så blir det gigantisk. E24. Retrieved from, https://e24.no/olje-og-energi/i/M3jaX5/equinor-vurderer-hydrogenroer-til-europa-hvis-vi-gjoer-dette-saa-blir-det-gigantisk
Nordiccs. (2014). Prospective Nordic CO2 storage sites. Retrieved from, https://data.geus.dk/nordiccs/map.xhtml
Annex B
Energiforsk. (2021). El från nya anläggningar. Report 2021:714. ISBN: 978-91-7673-714-9
About this publication
Nordic Clean Energy Scenarios
Solutions for Carbon Neutrality
Markus Wråke, Kenneth Karlsson, Anders Kofoed-Wiuff, Torjus Folsland Bolkesjø, Tomi J. Lindroos, Martin Hagberg, Mikkel Bosack Simonsen, Thomas Unger, Berit Tennbakk, Eirik Ogner Jåstad, Antti Lehtilä, Nelli Putkonen, Tiina Koljonen.
© Nordic Energy Research 2021
http://doi.org/10.6027/NER2021-01
Layout: Gitte Wejnold
Front page photo: 1+2: Unsplash.com, 3: Shutterstock.com, 4: Unsplash.com
Graphic designers of figures and illustrations: Julius Uusikylä, Måns Eklund, KRUT
Published dd/m/2021
Nordic Energy Research
Nordic Energy Research is an institution under the Nordic Council of Ministers which manages and finances international research programs and projects that add value to national work in the Nordic countries. In addition, we perform certain secretariat and analytical functions in the energy policy cooperation under the Nordic Council of Ministers.