
- Front page
- Image - page 2
- Contents
- Authors and Editors
- Harry Flam and Oskar Nordström Skans: The Nordic economies and the COVID-19 pandemic
- Torben M. Andersen, Steinar Holden, Seppo Honkapohja: Economic developments and policies during the COVID-19 crisis – Nordic experiences
- Werner Eichhorst, Johannes Brunner: Labour market and social policy responses to the COVID-19 pandemic in the Nordic countries – A view from the outside
- Comment by Ragnar Arnason
- Gylfi Zoega: Iceland’s fight against COVID-19 – An economic perspective
- Comment by Svend E. Hougaard Jensen
- Comment by Gylfi Magnússon
- Lars Hultkrantz, Mikael Svensson: The economic cost of COVID-19 – Iceland, Norway, and Sweden
- Comment by Tuulia Hakola-Uusitalo
- Comment by Ulf Persson
- Caroline Hall, Inés Hardoy, Martin Lundin: Schooling in the Nordic countries during the COVID-19 pandemic
- Comment by Hjördis Hardardottir
- Comment by Hanna Virtanen
- Kristiina Huttunen, Hanna Pesola: COVID-19 and labour market outcomes by gender in Finland
- Comment by Birthe Larsen
- Comment by Helena Svaleryd
- About this publication
MENU

Contents
This publication is also available online in a web-accessible version at https://pub.norden.org/nord2022-001
Authors and Editors
Editors: Harry Flam and Oskar Nordström Skans
Technical Editor: Hedda Thorell
Harry Flam, professor emeritus, IIES, Stockholm University.
Oskar Nordström Skans, professor, Uppsala University.
Torben M. Andersen, professor, University of Aarhus.
Steinar Holden, professor, University of Oslo.
Seppo Honkapohja, visiting professor, Aalto University School of Business.
Werner Eichhorst, professor, IZA institute of Labor Economics.
Johannes Brunner, student assistant, IZA institute of Labor Economics.
Comment by Ragnar Arnason, professor emeritus, University of Iceland.
Gylfi Zoega, professor, University of Iceland.
Comment by Svend E. Hougaard Jensen, professor, Copenhagen Business School.
Comment by Gylfi Magnússon, professor, School of Business, University of Iceland.
Lars Hultkrantz, professor emeritus, School of Business, Örebro University.
Mikael Svensson, School of Public Health & Community Medicine, University of Gothenburg.
Comment by Tuulia Hakola-Uusitalo, research director, Competition and Consumer Authority.
Comment by Ulf Persson, senior advisor, Swedish Institute for Health Economics (IHE).
Caroline Hall, IFAU and Uppsala Center for Labor Studies (UCLS).
Inés Hardoy, research professor, Institute for Social Research.
Martin Lundin, IFAU and Uppsala Center for Labor Studies (UCLS).
Comment by Hjördís Harðardóttir, postdoctoral researcher, University of Iceland.
Comment by Hanna Virtanen, head of research, ETLA Economic Research.
Kristiina Huttunen, research professor, Department of Economics, Aalto University School of Business, Helsinki GSE, VATT and IZA.
Hanna Pesola, senior researcher, VATT Institute for Economic Research, Helsinki GSE.
Comment by Birthe Larsen, associate professor, Copenhagen Business School.
Comment by Helena Svaleryd, professor, Uppsala University.

The Nordic economies and the COVID-19 pandemic
1 Background
The Nordic countries weathered the COVID-19 pandemic relatively well compared to most other high-income countries, both in terms of public health and economic repercussions. Infection and excess mortality rates were comparatively low in the Nordic Region, except in Sweden, where they relied more on recommendations and guidelines than mandatory measures to contain the spread of the virus. The fall in GDP was also comparatively small and short-lived in all of the countries except Iceland, where tourism plays a more prominent role in the economy.
This issue of the Nordic Economic Policy Review surveys the economic repercussions of the pandemic and the health and economic policies introduced to minimise its impact in the Nordic countries. Although national policies were broadly similar, they also differed in many respects. Given that some enjoyed greater success than others, comparing different policies and their effects may yield valuable lessons for the future.
Limitations of space and time have forced us to be selective in our choice of topics. Other subjects are covered, and covered more comprehensively, in the report by the Swedish parliamentary ‘Corona Commission’ (Coronakommissionen 2022) and in the online forum voxeu.org, which summarises hundreds of studies by economists and researchers from other disciplines.
Despite these constraints, we present a broad range of policy-relevant articles on a variety of issues. Two of the articles comparing economic policies and outcomes include countries from outside the Nordic Region. The article by Torben Andersen, Steinar Holden, and Seppo Honkapohja focuses on the macroeconomy. The one by Werner Eichhorst and Johannes Brunner focuses on the labour market.
Several of the articles highlight the difficult trade-offs facing decision-makers during a pandemic. Ideally, all decisions taken to minimise the costs of a pandemic – on public health and the economy – should be made within the same framework so that the economic effects can be compared with the impact on health and general welfare. Under this approach, public health effects are expressed in monetary terms, as seen in the article by Lars Hultkrantz and Mikael Svensson. They provide an example of the health benefits of school closures compared to the costs incurred in terms of reduced learning and reduced future incomes. Based on these criteria, they conclude that schools should have remained open. Gylfi Zoega’s article discusses health and economic policies in Iceland during the pandemic and reaches a similar conclusion on this point. Decisions on public health measures were made separately from those on economic policies. Zoega argues that if decisions had considered health and economic effects together, they would have resulted in better outcomes.
School closures were an important measure in suppressing the spread of the virus. In their article, Caroline Hall, Ines Hardoy, and Martin Lundin provide a comprehensive survey of research into the effects of school closures and distance learning on learning outcomes and future earnings.
Finally, Kristiina Huttunen and Hanna Pesola investigate whether the pandemic had differential earnings effects on men and women in Finland. Sectors with a relatively large share of women employees, such as health care and hotels and restaurants, were particularly affected by restrictive measures. At the same time, it was mainly women who bore the brunt of school closures and had to stay at home and take care of the children. Their results are, perhaps surprisingly, contrary to expectations.
2 Macro-economic effects and policies
Andersen, Holden, and Honkapohja’s article describes the macroeconomic effects of the pandemic in the Nordic countries and discusses the role played by the fiscal policy measures taken to mitigate these effects on incomes, employment, and companies.
The Nordic countries suffered relatively small decreases in GDP compared to the European average. GDP dropped by approximately the same amount in 2020 in Denmark, Finland, Norway and Sweden and had recovered to pre-pandemic levels by the second quarter of 2021. The authors attribute the relatively small downturn in economic activity in the Nordic Region to a high degree of digitalisation that facilitated a significant shift from the workplace to working from home. Iceland was hit harder than the other Nordic countries and took longer to recover due to its relative overreliance on the tourism industry.
The countries all introduced various forms of job retention and wage compensation schemes. At the peak of the pandemic’s effect on the labour market, in the second quarter of 2021, 8–12 percent of all employees were affected by such policies. The loss of working hours hit young, lower-skilled and immigrant workers the hardest. Andersen, Holden and Honkapohja argue that there are compelling arguments for maintaining jobs and incomes in the face of a pandemic: the measures can be seen as insurance against shocks that are outside the control of those affected and therefore have no adverse incentive effects; they prevent the destruction of human and company-specific capital; and they serve to maintain aggregate demand, which in turn shields other, less affected sectors and helps the economy to recover more rapidly once containment restrictions are lifted. However, the authors also stress that measures must be temporary and include sunset clauses. Otherwise, they risk triggering negative incentive effects.
Companies received various forms of support; for example, subsidies for fixed costs, subsidies based on loss in turnover and injections of liquidity. The authors provide a valuable discussion of the pros and cons of these different types of support. In general, governments have to balance the costs of letting otherwise profitable companies go bankrupt and losing company-specific tangible and intangible capital and the costs in terms of poorer economic efficiency of providing support. Offering the wrong incentives, the dead-weight costs of higher taxation and the preservation of inefficient structures are some of the causes of low economic efficiency.
The scale of the fiscal measures varied across the countries. Iceland, and to a lesser extent Norway, relied more on higher public spending than the other countries, while Denmark, and to a lesser extent Sweden, resorted to deferred tax payments and accelerated spending.
The Nordic countries were comparatively successful in handling the negative economic impact of the pandemic and achieving a rapid recovery by maintaining production capacity and job matches as well as aggregate demand. Andersen, Holden, and Honkapohja ascribe this to the general structure of the Nordic societies, with their high levels of trust and cooperation, reliance on digitalisation, and well-functioning public sectors with good social safety nets.
3 Labour market effects and policies
Despite initial concerns, the economic impact of the pandemic on the Nordic countries as a group appears to have been relatively modest. Focusing on the labour market, Werner Eichhorst and Johannes Brunner’s article presents evidence of the economic impact in the Nordic Region compared to other European countries.
Several different factors are discussed. One element is the role of digital preparedness. In contrast to other countries on the continent, such as Germany, Nordic countries were more digitally prepared at the start of the pandemic. A relatively high proportion of workers (except in Norway) were already working from home before the pandemic. This helped ease the transition to a more digital economy, in which larger numbers of people could work from home, and more economic activity could take place online.
The article also suggests that pre-existing social policies were important in the face of the emerging crisis. They argue that the Nordic model, with its extensive public transfers and labour market policies, may have proved beneficial in the pandemic. It is conceivable that the impact of economic uncertainty is less pronounced if unemployed workers can receive support within existing systems rather than through ad hoc constructs such as those introduced in the US at that time.
Another factor discussed in the article was the relative health of Nordic public finances, which compared favourably to those in many other countries before the pandemic. This ensured swift support to particularly badly affected sectors. Finally, the article discusses the various measures introduced to keep companies solvent, the measures implemented to stabilise income, and labour market policies to maintain employment.
Overall, the article paints a somewhat optimistic picture of the economic resilience of the Nordic countries. The authors argue that the countries faced the economic crisis from a comparatively favourable starting point. However, they also point to the need to confront ongoing structural change to limit the impact on income distribution. These are challenges politicians in Nordic and other countries must address in years to come.
4 The disconnect between economic and health policies in Iceland
Gylfi Zoega’s article compares Iceland’s performance in macroeconomic variables, infections and deaths to the other Nordic countries, other island economies and some larger economies that are similarly reliant on tourism. He then looks at the Icelandic economy and public health during the pandemic through the lens of basic concepts of economics and political economy: cost-benefit analysis, externalities, time inconsistency and the problem of public action. His discussion of Iceland’s experience provides lessons common to all countries during the pandemic.
The salient point made by Zoega is that there was a clear disconnect between the Chief Epidemiologist’s decisions that were directed at preserving public health on the one hand and the government´s decisions that were directed at minimising the negative impact on the economy on the other. He suggests that if both types of decisions had been taken within a unified and consistent framework, such as a cost-benefit analysis, in which the increased morbidity and mortality caused by the pandemic is expressed in monetary terms as in the paper by Hultkrantz and Svensson, the social cost of the pandemic would probably have been lower. In particular, Zoega contends that measures to prevent the spread of the virus were unnecessarily costly. Preventative and control measures at Iceland’s only international airport would have been less costly than social distancing or school closures and should have been maintained during the pandemic instead of the stop-and-go pattern that ensued.
Zoega argues that the government had an inflated view of the importance of the tourism sector to the economy, which dictated its stop-and-go policy. Tourism is, however, also the main import item. An astonishing 83 percent of the Icelandic population made at least one trip abroad in 2019 and spent five times as much per day as tourists arriving in Iceland. Much of what tourists in Iceland consume is imported. Consequently, the share of tourism in GDP is not particularly high (approximately 8–9 percent) and is roughly the same as in Denmark, Finland and Germany.
The government eased containment measures to increase the inflow of tourists to Iceland as the number of infections within the country decreased. This occurred on four occasions between the start of the pandemic in 2020 and the end of 2021. It can be regarded as an example of time-inconsistency, in the same way as it may be tempting for a government to keep unemployment low by expansionary fiscal policy in the short term at the cost of higher inflation and contractionary fiscal policy in the longer term.
5 Health effects in monetary terms
The article by Lars Hultkrantz and Mikael Svensson estimates the health-related costs of the coronavirus in Iceland, Norway and Sweden from the start of the pandemic up to 15 August 2021. These costs include both premature mortality and morbidity. Sweden experienced much higher rates of mortality and morbidity per capita than both Iceland and Norway. This was most probably due in part to differences in policies. As documented elsewhere in this issue, Sweden relied primarily on recommendations to the general public and did relatively little testing early on in the pandemic, whereas Iceland and Norway relied more heavily on mandatory policies and more extensive use of testing as a preventive measure. Containment measures were adopted later in Sweden.
The social cost of mortality is commonly estimated by the value of a statistical life, a single figure being attached to each premature death regardless of age and health status. Hultkrantz and Svensson are the first researchers to estimate the cost of mortality in the Nordic countries based on the concept of quality-adjusted life-years. They base their estimate on people’s willingness to pay to avoid the risk of death multiplied by the estimated number of remaining life-years multiplied by the number of deaths due to COVID-19 or the number of excess deaths. The advantage of using these measures instead of the value of a statistical life is that those who died from the coronavirus were predominantly older people in comparatively poor health. Approximately 50 percent of those who died were living in nursing homes. The estimated morbidity cost is based on actual expenditure on health care, actual lost income and the intangible cost of having a lower quality of life due to illness.
The total cost of morbidity and mortality combined is estimated to equal 1.4 percent of GDP in Sweden, 0.2 percent in Norway and 0.08 percent in Iceland. This may represent an underestimation of the figures as the costs of longer-term effects of COVID-19 infections and the negative effects of social distancing and school closures on mental health and well-being are not included. It should be added that estimates based on the value of a statistical life arrive at much higher cost estimates precisely because older people in comparatively poor health were affected the most.
Ideally, it would be good to evaluate the different policy measures introduced to contain the pandemic (thereby reducing morbidity and mortality costs, which could be considered beneficial) against the economic costs of those measures. Hultkrantz and Svensson provide an interesting example of such a cost-benefit analysis. They estimate the earnings losses that upper secondary students will incur over their lifetime due to school closures against the health-cost benefits on mortality and morbidity of the closures. Intriguingly, they find that the net social cost of closures of upper secondary schools may have been high; the benefits in terms of health are estimated to be only a few per cent of the cost in terms of lost lifetime incomes.
6 School closures and distance learning
Caroline Hall, Inez Hardoy, and Martin Lundin review research on school closures and distance learning before and during the pandemic. They argue that the Nordic countries were in a better position to tackle the transition to distance learning than most other countries due to comparably reliable access to broadband and computers and high levels of digital preparedness among students, teachers and parents. Nonetheless, all of the Nordic countries underwent rapid transitions into a new style of teaching that forced many aspects of traditional schooling to change. The article accurately describes this as a transition into emergency remote teaching.
Although the Nordic countries all relied on school closures to mitigate the spread of the virus, the scope of such closures varied. In Sweden, pre-schools and schools up to ninth grade (age 16) remained open throughout the pandemic. However, even though schools remained open, many students in the Nordic countries had to participate from home due to COVID-19 symptoms or close contact with infected individuals.
The evidence presented in the article suggests that we may expect negative effects on learning from the rapid transition to distance learning. This appears to be a perception shared by teachers and students alike across the Nordic countries. The challenges of distance learning are multidimensional. There is no social interaction, and some students may lose motivation without their teachers having any real opportunity to counteract the process.
The negative effects are also likely to be unevenly distributed across student backgrounds. This makes intuitive sense as parents substitute for teachers when learning takes place in the home, which may reduce the equalising role played by schools. The article discusses the evidence supporting this intuitive and concerning conjecture. Although younger students may suffer the most from distance learning, the article notes that the learning loss may be most pronounced for upper secondary students, as they were subjected to the longest closures in all of the Nordic countries.
Overall, the results in the article convincingly show that the challenges faced by educators in the Nordic countries are likely to prevail well after the pandemic has subsided. The authors also point out that some of these learning losses may have gone undetected due to the cancellation of national exams. Dealing with the effects of learning loss among disadvantaged students is a challenge that will require the attention of policy makers for years to come.
7 Labour market effects for women and men
The conventional wisdom regarding economic recessions is that they predominantly affect males. The main reason is that men are overrepresented in highly cyclical industries such as manufacturing and construction and are therefore more significantly affected in terms of employment and earnings. However, Kristiina Huttunen and Hanna Pesola show that this conventional wisdom is not directly applicable to the pandemic recession.
Two factors may serve to disfavour women in this instance. The first is the large drop in labour demand in service sectors where women typically dominate, such as in hotels and restaurants. However, women are also overrepresented in the public sector, most notably in health care, where labour demand increased during the pandemic. The second factor is found on the supply side. Closures of schools and pre-schools increased the demand for working parents to provide childcare at home during the pandemic. Typically, women are more likely to bear the brunt of domestic childcare, which may negatively affect their earnings. The impact of these two factors on women’s earnings versus men is not clear a priori.
Huttunen and Pesola use Finnish register data to show how the earnings of unemployed or furloughed men and women during the pandemic were affected. Somewhat unexpectedly, overall earnings losses are shown to be considerably greater for men than for women. The greatest earnings losses occurred in the most affected sectors, as could be expected, but they were evenly distributed between men and women. In addition, the authors show that earnings losses were, in fact, neither greater nor more persistent for families with children, which is contrary to expectation. This holds true both for men and women with families.
Overall, the evidence shows that women and men suffered earnings losses due to job loss or similar during the pandemic. However, gender differences, and differences dependent on family status, were, in fact, negligible. The authors conclude that the recession caused by the pandemic seems to have been more gender-neutral than an average recession, at least in Finland.
Reference
Coronakommissionen (2022). Sverige under pandemin, slutbetänkande av Coronakommissionen [eng: Sweden during the pandemic, final report from the Corona commission]. (SOU 2022:10). Stockholm, Sweden: Coronakommissionen.

Economic developments and policies during the COVID-19 crisis – Nordic experiences
Abstract
The paper reviews economic developments and policy measures in the Nordic countries during the pandemic focusing in particular on the unconventional policies deployed to protect incomes, jobs, and firms in the short run. The recession was the deepest but also shortest on record, which indicates that the underlying economic policy logic of preserving production capacity and job matches to make a swift recovery possible worked. The policies also maintained domestic demand. The general structure of the Nordic societies, with a high level of trust and cooperation, a high degree of digitalization, and a comprehensive social safety net, contributed to the recovery process.
Keywords: Pandemic, lockdown, recession, unconventional policies.
JEL codes: E2, E3, E6, H2, H3, H5, H6, I1, J3.
1 Introduction
In response to the COVID-19 pandemic, countries have resorted to both unconventional containment policies to reduce the spread of the virus and unorthodox economic policy measures in the form of emergency or relief packages to support households, job -matches and companies.
The pandemic has had severe health and economic consequences worldwide. A summary of the development until mid-2021 is given in Figure 1, showing a cross-plot for OECD countries of the accumulated decline in economic activity relative to the fourth quarter of 2019 (2019.4), for the period 2020.1 to 2021.2, as well as the total number of confirmed deaths due to COVID-19 until the end of March 2021. Most countries have had declines in economic activity, which were unprecedented, large in scale, and abrupt compared to other crises. Global GDP declined by 9.1 percent in 2020.2 and in the Euro-area by no less than 14.6 percent. Countries that were most severely affected in terms of the health dimension also tend to have been most affected economically. These differences reflect not only different policy strategies for health and the economy but also structural differences, e.g., the importance of tourism, digitalisation, demographic factors and other related aspects.
Figure 1 The COVID-19 crisis, accumulated number of deaths and decline in economic activity per 2021.2
Of the Nordic countries, Denmark, Finland, and Norway had the mildest health and economic consequences. The economic repercussions in Sweden are at approximately the same level as the other Nordic countries, but the health consequences have been more grave. Conversely, in Iceland, the economy was severely hit, but the health consequences were mild.
In response to the COVID-19 pandemic, numerous containment policies and restrictions (or non-pharmaceutical interventions NPI) have been deployed to contain the spread of the virus. These include both containment (lockdowns, restrictions on gatherings, travel restrictions etc.) and health-oriented measures (test, trace and isolate, hygiene measures, masks etc.). Relief packages were also introduced to compensate for some of the economic consequences of the restrictions imposed, a topic to which we will return below.
There were large differences between countries in the choice of strategies to contain the virus (see Baker et al. (2021) for descriptions of different health strategies and Han et al. (2020) for a survey of strategies taken in various countries). In high-income countries in Europe and North America, most countries chose a suppression strategy, aiming to push infection rates down to very low numbers. Some countries started out with a mitigation strategy, trying to contain the pandemic to avoid capacity in health care systems becoming overwhelmed. However, in several cases, infection rates increased sharply, causing a switch to a suppression strategy with strict containment measures. China and several other Asian countries, as well as Australia and New Zealand, chose an elimination strategy with more severe lockdown measures in an effort to stop transmission completely. Among the Nordic countries, Denmark, Finland, Iceland, and Norway implemented strict measures to suppress the pandemic, while Sweden adopted a less strict strategy. Sweden did not adopt stringent lockdown restrictions with compulsory stay-at-home orders, school closures or mandated working from home. It relied to a greater extent on recommendations and softer containment measures and restrictions.
This paper provides an overview of economic developments in the Nordic countries during the pandemic and considers and discusses the economic policy measures put in place, focussing in particular on the unconventional policies deployed to protect incomes, jobs, and companies in the short term. This paper does not address health developments and containment policies. For a discussion and references on these issues, see Andersen et al. (2022).
A general caveat is that the pandemic is not yet over and continues to have a considerable impact. The Omicron strain is highly contagious and has become dominant. The outlook for the future is uncertain, both in relation to the severity of Omicron infection and, more generally, around the future development of the pandemic.
The paper starts by providing an overview of the economic developments in the Nordic countries seen in a comparative perspective (Section 2). The principal arguments underlying the use of relief packages and instruments are reviewed (Section 3). This is followed by a more in-depth discussion of key elements of the relief packages: job-retention schemes (Section 4), direct support to companies (Section 5) and monetary and macroprudential policies (Section 6). Finally, we assess the role of relief packages and provide some concluding remarks (Section 7).
2 Economic Developments
The pandemic caused a sharp decline in economic activity at the start of 2020, although Denmark, Finland, Norway and Sweden were less affected than most other countries. Iceland is an exception as the initial recession was deeper and the economic recovery to the pre-crisis GDP level took longer than in the other four Nordic countries (see Figures 2a–2f below).
In the second half of 2020, activity started to recover, and a second round of containment policies in winter 2020/2021 has not had the same negative effects on activity as the first round. By 2021.2, economic activity had recovered to a level close to the level prior to the pandemic (2019.4), and in Denmark had even surpassed it. Iceland’s GDP only returned to the pre-pandemic level at the end of 2021. In short, with the exception of Iceland, the decline in economic activity in the four Nordic countries was smaller than in most other countries, and activity has quickly recovered to pre-pandemic levels.
The smaller negative effect in the second round is interesting since the second round of containment measures was approximately as strict or stricter than the previous round. This suggests a difference between the unanticipated and unexperienced event in the first round (the onset of the pandemic) and subsequent adaptation and learning processes applied during the second round.[1]Gamtkitsulashvili and Plekhanov (2021) conclude, based on an empirical analysis covering 53 countries, that economic activity became less sensitive to mobility during the pandemic which shows an adjustment to containment measures and restrictions. However, economic activity remains closely correlated with mobility, and increased activity has been primarily associated with increased mobility. The economic support policies and private sector knowledge that were in place the second time may also have played a role.
Footnotes
- ^ Gamtkitsulashvili and Plekhanov (2021) conclude, based on an empirical analysis covering 53 countries, that economic activity became less sensitive to mobility during the pandemic which shows an adjustment to containment measures and restrictions. However, economic activity remains closely correlated with mobility, and increased activity has been primarily associated with increased mobility.
Looking closer at the aggregate demand components, a typical business cycle picture emerges with declines in private consumption (and hence imports), investments and exports.[1]With the very significant fluctuations in exports and imports, Iceland differs from the more moderate developments in the other four Nordic countries. However, these declines were not driven by the usual business cycle mechanisms or economic imbalances (e.g., as during the financial crisis in 2008–2009) but by lockdown restrictions and behavioural responses to the pandemic. This is also important for the recovery since, in combination with economic policies, the aggregate demand potential was maintained and could be released in tandem with the reopening of the economies.
The similar responses in terms of private consumption during the first phase of the pandemic across the Nordic countries, despite the differences in health strategies, is particularly noteworthy. Andersen et al. (2020b) explores this issue in a comparison of Sweden and Denmark using real-time transaction data from a large bank in Scandinavia (see also Andersen et al. 2020a). They find a drop in aggregate spending of around 25 percent in Sweden and approximately 29 percent in Denmark, indicating a strong behavioural response in Sweden despite much more lenient policy measures in that country. There is also an interesting age gradient in the behavioural response, as spending dropped much less in Sweden than in Denmark for the young low-risk group and more for the older high-risk group. Thus, the containment policies in Denmark reduced the economic activity of the low-risk population, which provided protection for the older high-risk group, implying that the latter group did not cut their spending as much.
The quick recovery in activity in the Nordic countries (except Iceland), despite the initial sharp drop, stands in contrast to the financial crisis, which also saw large declines in economic activity (except for Norway), but a much slower recovery (see Andersen et al. 2022). This underlines how the COVID-19 crisis differs from a typical business cycle downturn.
Footnotes
- ^ With the very significant fluctuations in exports and imports, Iceland differs from the more moderate developments in the other four Nordic countries.
Figure 2a Key facts on economic developments – Nordic countries and EU, GDP
Figure 2b Key facts on economic developments – Nordic countries and EU, government consumption
Figure 2c Key facts on economic developments – Nordic countries and EU, investments
Figure 2d Key facts on economic developments – Nordic countries and EU, private consumption
Figure 2e Key facts on economic developments – Nordic countries and EU, exports
Figure 2f Key facts on economic developments – Nordic countries and EU, imports
While some developments in key macro-variables are similar to previous downturns, there are also some notable differences. One striking fact is that house prices generally rose in 2020–2021 (see Andersen et al. 2022). The rises were greatest in Denmark and Sweden, but also noticeable in Norway and the Euro area, and somewhat smaller in Iceland and Finland. House price increases are a surprising phenomenon, as an economic downturn is normally associated with falling house prices due to declining incomes, higher unemployment and greater economic uncertainty. However, low and falling interest rates have helped support house prices, and stay-at-home policies may also have increased demand for housing. It could also be interpreted as showing that, perhaps due to the relief packages, the crisis did not trigger a very significant increase in economic uncertainty perceived by consumers.
There are large sectoral differences in both the impact of the pandemic and the subsequent recovery rate in the four larger Nordic countries (see Figures 3 and 4). Some sectors were barely affected or may even have had increased activity, while others were severely affected. Although the recovery has been rather broad-based, trade, tourism, entertainment, and recreation have not yet recovered to pre-crisis levels of activity.
Figure 3 presents noticeable differences between the four Nordic countries (comparable data for Iceland is not available). Sweden had larger falls in the industry and manufacturing sectors in the second quarter of 2020 than the other Nordic countries, which probably reflects a negative impact of reduced foreign demand. On the other hand, activity in the ‘Other’ sector, which includes the arts, entertainment, recreation and other service activities, fell much less in Sweden than in the other Nordic countries in 2020.2. This suggests that the weaker restrictions in Sweden had some economic benefits in the form of smaller reductions in activity in these sectors, even if the difference is not pronounced in the aggregate.
Bougroug et al. (2021) analyse the role of the sectoral structure for the economic responses to the pandemic in Denmark, Norway and Sweden. Sweden has a relatively significant industrial sector and a smaller service sector than Denmark and Norway. The authors conclude that differences in sector structure account for only a small fraction of the differences in overall economic performance in the three countries.
Figure 3 Sectoral changes in value added. Decline 2020.2 relative to 2019.4
Figure 4 Sectoral changes in value added. Recovery gap: Value added 2021.2 relative to 2019.4
It is now widely recognised that both the health and economic implications of the corona pandemic and lockdown policies depend not only on policies related specifically to these areas but also on behavioural responses, national characteristics, including population structure, urbanisation, health care system, sector structure, degree of digitalisation, and the economic situation at the outset of the pandemic (see, e.g. Furceri et al. 2021 and Sapir 2020). One important factor is the degree of digitalisation as it enables transition from physical to virtual activities (e-commerce, meetings, teaching, working from home etc.). The higher the degree of substitution between physical and virtual activities, the lower the economic consequences of containment restrictions. The degree of substitution depends on the sectoral composition of the economy and the level of digitalisation. Empirical evidence documents that digitalisation played a significant role in how the pandemic affected economic performance see, e.g., Zhuang (2021). The Nordic countries are among the most digitalised in Europe, and this is a contributing factor to the relatively smaller decline in economic activity in the bigger Nordic countries than elsewhere. Dingel and Neiman (2020) also report that the Nordic countries are among those where the greatest proportion of jobs can be done at home.
2.1 Labour market
The pandemic and containment policies caused an abrupt reduction in the activity level in all the Nordic countries, and in particular, contact intensive sectors were severely affected. Working hours fell sharply in some sectors, and the Nordic Region and other OECD countries employed new or existing job retention schemes to prevent permanent job losses, cf. section 4 below. Juranek et al. (2021) point out that the negative labour market effects in the early phase of the pandemic were slightly smaller in Sweden than in the other Nordic countries, reflecting the lighter restrictions introduced in Sweden. The gross number of workers in job-sharing, temporary layoff or wage-compensation schemes are shown in Figure 5 (data unavailable for Iceland). The figure displays gross numbers based on available statistics. It is informative in relation to the number of workers affected but who nonetheless have maintained a relationship to their job. A measure in full-time equivalents would have been useful to show the effects in terms of hours not worked, but comparable data is not readily available. The use of these schemes was most prevalent during the first wave of the pandemic, and they have subsequently been of less importance.
Figure 5 Work sharing/Wage compensation/short-time work/temporary layoffs, Nordic countries 2019.4 to 2021.3
The sectoral composition of the decline in activity had important implications for which groups of workers were the most affected. Contact-intensive sectors typically employ more young and low-skilled workers, as well as more immigrants, and consequently, working hours fell much more sharply for these groups (Alstadsæter et al. 2020a, 2020b, Campa et al. 2020, Hansen et al. 2020). The unequal effects are amplified by the tendency for teleworking to be easier for white-collar workers than blue-collar (Hansen et al. 2020). The labour market effects seem to be relatively balanced between the genders.
The increase in short-time work is not reflected in the employment and unemployment statistics from the Labour Force Surveys, in which employees are typically classified as employed as long as they have a job, even if they are on a job retention scheme and not actually working.[1]In Norway, employees on furlough are classified as employed in the Labour Force survey for the first six months on furlough. In Finland, temporary lay-off is not considered unemployment if the period is under three months. As a result, there is only a modest increase in unemployment rates, and a corresponding modest decrease in employment rates during the pandemic, with no noticeable gender differences. These modest effects reflect the role of relief packages (work sharing, wage compensation, see below).
Footnotes
- ^ In Norway, employees on furlough are classified as employed in the Labour Force survey for the first six months on furlough. In Finland, temporary lay-off is not considered unemployment if the period is under three months.
Figure 6a Employment rates
Figure 6b Unemployment rates
2.2 Public Finances
As expected, there was a significant deterioration in public finances, as indicated by Figure 7.a for net lending. This deterioration was not as severe in the Nordic Region (except Iceland) as it was in many other countries, which reflects that the downturn was not as deep as in other countries. The initial levels of public debt levels were low, which afforded some economic leeway to cope with the crisis (In Finland and Iceland, the effects were more severe, see Figure 7.b. Both had a higher initial debt level, and their projected debts exceeded the 60 percent limit). It should be noted that the final calculation of the cost to the public finances has not yet been carried out, as liquidity and loan arrangements were one of the fiscal tools deployed in the crisis. It should also be noted that a counterfactual approach involving no fiscal relief packages would have resulted in a deeper recession with a considerably greater impact on public finances.
Figure 7a Net lending
Figure 7b Public debt
3 Economic policies – relief packages
The imposition of containment measures and restrictions was largely an unanticipated event. The lockdown restrictions were motivated by the externalities arising from the spread of the virus caused by close contact between people. These restrictions may thus be interpreted as an unanticipated ‘market-closure’ or ‘business interruption’ shock, an event that is largely non-insurable.
The containment measures constrain the market mechanism. In the first instance, this takes place in areas where there is close contact between customers and employees, but also in workplaces where employees are in close contact with each other. While the lockdown regulations address a health externality and thus have a collective justification, individual companies, workers, and households must bear the consequences and costs.
As a consequence, governments have launched relief packages ranging from direct support to companies for loss of revenue, coverage of fixed costs, work-sharing arrangements, and liquidity and loan arrangements.[1]Some of the support measures conflict with the EU rules for state aid. In response to the COVID-19 pandemic, the EU Commission determined general rules for support and specific rules allowing temporary support. EU rules have influenced the specific design of some of the support measures. This also involved existing tax and welfare schemes, which in some cases were extended. These schemes are collectively financed via the public budgets. While activity declined, in part due to behavioural responses, traditional aggregate demand measures to support economic activity were not appropriate in the situation since attempting to boost activity would conflict with the overriding health concern of reducing physical contacts and thus reducing the spread of the virus.
Unconventional measures were needed instead. These are not part of standard economic toolkits, not even when steps are taken to affect activity or employment during deep recessions. There are three key arguments in support of such unconventional measures.
Footnotes
- ^ Some of the support measures conflict with the EU rules for state aid. In response to the COVID-19 pandemic, the EU Commission determined general rules for support and specific rules allowing temporary support. EU rules have influenced the specific design of some of the support measures.
The first type of argument is that the containment measures and lockdown policies can effectively be viewed as expropriation of market opportunities, justifying compensation. It could be argued that suppressing the pandemic is a common good, and the sectors which carry the burden of the measures should be compensated. The same could be said in respect of workers prevented from working, where the usual supports offered by the social safety net may be considered insufficient for this particular shock (here, too, there is no ex-ante moral hazard problem). The compensation measures may also be interpreted as an ex-post insurance of an unanticipated aggregate shock. Since companies and workers had no influence on the occurrence of this shock (no ex-ante moral hazard), there is no direct incentive issue in providing these supports. In particular, the support to companies has been contested, and it raises difficult issues, including which events to cover (demand may fall for many reasons) and whether there are alternative ways for business to cope with such situations. See the discussion in Section 5 below.[1]Henriksen et al. (2020) also argue that the insurance argument applies to households and not to companies – based on the view that capital owners receive high profits in good times, and may choose to diversify, so they should not be provided with insurance in bad times. Thus, the authors conclude that support to companies can be justified only in terms of efficiency (as is included in the second type of argument for support) and not insurance arguments. See e.g., OECD (2021b) for a discussion of insurance of economic losses triggered by a pandemic.
The second type of argument for support is that it is important to preserve production capacity to increase the likelihood of a V-shaped path for economic activity when containment policies are relaxed. In other words, perceiving the health situation and the containment measures to be temporary in order to minimise the risk that the economic repercussions become persistent. The negative effects of the containment measures and restrictions cannot be avoided, but a removal of them will only result in a rapid economic recovery if the production and demand capacity remains intact.[2]Guerrieri et al. (2020) show how the lockdown of some sectors (a supply shock) can reduce demand for sectors still open, a so-called ‘Keynesian supply shock’ where the change in aggregate demand is larger than the initial supply shock. In a setting with capital market failures (borrowing constraints, incomplete insurance) company closures and lay-offs may be excessive, providing a rationale for supporting companies, including support for job retention. Layoffs of workers breaking job-matches and closure of companies, followed by the hiring of workers and (re)opening of (new) companies, is associated with substantial transactions costs, time lags and loss of both real and human capital. From a societal perspective, this process is associated with excessive social costs (including fiscal costs), which leads to an efficiency argument in favour of support.
Thirdly, support for workers also helps to maintain income/consumption and reduce risks. This supports aggregate demand by preventing reduced demand in other sectors that remained open. Financial support to affected households also implies that aggregate demand can quickly pick up again when the economy reopens. The support includes work sharing/wage compensation but also temporary changes to the social safety net, e.g., extended benefit periods or higher benefit levels. Note that this argument applies not only to the sectors directly affected by containment measures but also to other more indirectly affected sectors by reducing risk and preventing a decline in aggregate demand.
Footnotes
- ^ Henriksen et al. (2020) also argue that the insurance argument applies to households and not to companies – based on the view that capital owners receive high profits in good times, and may choose to diversify, so they should not be provided with insurance in bad times. Thus, the authors conclude that support to companies can be justified only in terms of efficiency (as is included in the second type of argument for support) and not insurance arguments. See e.g., OECD (2021b) for a discussion of insurance of economic losses triggered by a pandemic.
- ^ Guerrieri et al. (2020) show how the lockdown of some sectors (a supply shock) can reduce demand for sectors still open, a so-called ‘Keynesian supply shock’ where the change in aggregate demand is larger than the initial supply shock. In a setting with capital market failures (borrowing constraints, incomplete insurance) company closures and lay-offs may be excessive, providing a rationale for supporting companies, including support for job retention.
All three arguments above apply to containment measures and restrictions, while arguably only the last two are relevant for the behavioural responses triggered by the pandemic (reduced activity due to behavioural responses are different since they are not the result of lockdown restrictions).
The ‘relief’ packages raise several issues in terms of design and implementation. Some of the key instruments used have no precedents and had to be implemented at short notice; hence they have a ‘crude’ design. This was also necessitated by the need for simple and easily administrative arrangements. The timeliness of the support was essential and, given the immense uncertainty at the start of the pandemic, the quick launch of the relief measures served as an important signal to households and companies. The choice of measures at the onset of the pandemic represented a largely improvisational response to a situation requiring acute action and where experience and knowledge on the effects of these interventions, both for the individual’s health and for society more generally, was largely absent. There was little time for detailed planning, and most countries launched a ‘package’ of unconventional initiatives within a small time window in response to the new situation.
The design of support measures is also complicated by the difficulty of separating the direct effects deserving support from other changes caused by general business cycle repercussions or second-round effects arising from the global economic impact of the pandemic. Such business cycle fluctuations are normally not insured at company level since this creates obvious incentive problems and disrupts the market mechanism. The schemes are based on simple criteria like, e.g., the decline in turnover or the risk of layoffs. Such measures reflect the effects of the pandemic, but they are not perfectly targeted. Many companies also experience declines in turnover, layoffs etc. during normal economic times, and such criteria do not directly identify the effects of the pandemic. In the unusual crisis situation of the pandemic, it can be argued that guaranteeing support was more important than its precise targeting and justified the more lenient criteria. The flipside is the placing of a large burden on the public budget and possible misallocation of real and human capital (see the discussion below).
A key problem with the emergency packages and unconventional measures is that they have a status quo bias. This applies particularly to measures covering part of fixed costs or loss of income and work-sharing arrangements that restrict the reallocation of capital and labour. Incentive problems also arise as companies may have insufficient incentives to adjust to the new situation (ex-post moral hazard problem: the consequences of the shock are worsened). These measures thus contain a locking-in problem in relation to both real and human capital. Accordingly, it is important that they are temporary in nature and have well-defined sunset clauses.
3.1 Policy instruments[1]Andersen et al. (2022), Table 2 compares the instruments for the four Nordic countries. IMF (2021) gives more information about the policy measures in Iceland.
The list of unconventional policy measures includes:
- Liquidity/loans/guarantees
- Subsidies
- Fixed costs
- Job matches (work sharing/wage compensation)
- Specific sectors, e.g., tourism
- Miscellaneous, e.g., culture - Income support
- Self-employed
- Households generally
More conventional measures include:
- Fiscal policy
- Expenditures
- Taxation - Monetary policy
- Macroprudential policy
Table 1 shows the discretionary fiscal measures in the Nordic countries as percentages of GDP. The numbers represent decisions about measures taken for 2020, 2021 and beyond. They denote upper limits for spending items as the actual uptakes are a lot smaller in some cases (see examples in the note below). The magnitudes of the items in the different countries are broadly similar.[2]It should be emphasised that there are uncertainties in the details of classifications. IMF warns about these problems when making comparisons between countries.
Footnotes
- ^ Andersen et al. (2022), Table 2 compares the instruments for the four Nordic countries. IMF (2021) gives more information about the policy measures in Iceland.
- ^ It should be emphasised that there are uncertainties in the details of classifications. IMF warns about these problems when making comparisons between countries.
Table 1 Decisions on discretionary fiscal measures during the COVID-19 crisis since January 2020, percent of GDP
| Denmark | Finland | Iceland | Norway | Sweden | |
| Additional spending or foregone revenue | 3.4 | 4.8 | 10.1 | 7.4 | 4.2 |
| Accel. spending, deferred revenue | 13.7 | 0.2 | 0.3 | 6.7 | |
| Equity, loans, asset purchase | 12.1 | 0.5 | 0 | 2 | 0.2 |
| Guarantees | 3.5 | 5.2 | 1.1 | 2.6 | 5 |
| Quasi-fiscal operations | 1.7 |
One particular measure taken in Denmark, alongside reopening, was the ‘unfreezing’ of holiday pay.[1]In Denmark, a proportion of wage income (typically 12.5 percent) is reserved for holiday pay, paid out during holiday periods. In the past, holiday pay depended on wage income earned in a previous period (i.e., there was a lag between accrual of holiday allowances and the pay-out period). A recent reform synchronised the earnings and the holiday period, and to avoid a double pay-out of holiday allowance, one part was frozen until retirement. In response to the COVID-19 crisis, it was decided to allow individualsto demand pay-out of the frozen holiday pay in two rounds (autumn 2020 and early 2021). This is an example of an (unconventional) aggregate demand policy that simultaneously directly improved the disposable income of households and tax revenue since holiday pay is taxable income. In autumn 2020, holiday pay corresponding to DKK 31 billion (1.4 percent of GDP) was paid out, and in early 2020, DKK 22 billion (1 percent of GDP). This had a considerable impact on households’ disposable income.
The following sections discuss the more specific design of labour market and employment support schemes (Section 4), support for companies (Section 5) and monetary and macroprudential policy instruments (Section 6). Note that the schemes are interdependent, as support to workers in the form of job-sharing (to avoid layoffs) also benefit companies, while support to companies preventing job losses and redundancies also benefit workers. The support schemes also reduce layoffs, unemployment and bankruptcies, thus benefitting financial institutions.
4 Labour market and employment support schemes
The pandemic and resulting lockdowns led to a sharp reduction in economic activity and employment levels all over the world. On average, in OECD countries, hours worked fell by 15 percent from 2019.2 to 2020.2, cf. Figure 8 below.[1]The figures in this section are based on OECD Employment Outlook (2021a). The reduction in total hours was smaller in the Nordic countries, at around 5 percent, varying from 10 percent in Iceland, 6 percent in Finland, 5.5 percent in Denmark, 4.7 percent in Sweden and 3.7 percent in Norway. The smaller reduction in the Nordic Region also reflected the shorter duration of the first wave and associated lockdown, as activity then picked up towards the summer.
Footnotes
- ^ The figures in this section are based on OECD Employment Outlook (2021a).
Figure 8 Decomposition of total hours change, 2019.2–2020.2, selected countries, percent change over the year
To prevent job losses and cushion the income loss for households, almost all OECD countries applied some form of job retention scheme. Many OECD countries had job-retention schemes in place prior to the pandemic, but most nevertheless modified their schemes to increase take-up, and/or they introduced new schemes (see OECD 2021a). On average, in the OECD countries, the take-up rate of retention schemes corresponded to 20 percent of dependent employment in April/May 2020. In the Nordic countries, the take-up rate was lower, at 10–12 percent in Denmark, Norway, and Sweden at the peak in April/May 2020, and 7.5 percent in Finland.
There are notable differences between the schemes in the Nordic countries. The description below focuses on the main aspects of the schemes during the first phase of the pandemic, omitting details and subsequent changes.
In Denmark, the new furlough scheme (‘lønkompensationsordningen’) was introduced to compensate companies that would otherwise have laid off at least 30 percent of their employees, or more than 50 employees. The furloughed workers were not allowed to work, although they received regular wages. For every three months on the scheme, five days were counted as holidays. The compensation for companies was 75 percent of the wage cost of a white-collar worker and 90 percent for blue-collar workers, in both cases with a maximum wage cap of DKK 30 000 per month. Companies were not allowed to lay off employees permanently while accepting help from the scheme. There was a degree of flexibility involved, allowing companies to take back employees if needed, with a corresponding reduction in the support they received.
In the work-sharing arrangement in Denmark (‘arbejdsfordelingsordningen’), companies could reduce working time partially for some or all workers, while workers received unemployment benefit (‘dagpenge’) for the days they do not work. Companies covered the costs of the benefits for the first two days when employees were not working, and they were subsequently only required to cover other costs such as insurance, etc.
For many years, Norway has had a furlough or short-time work scheme (‘permitteringsordning’), allowing companies to temporarily lay off workers if there is a temporary and unforeseen reduction in activity. The reduction in working hours must be at least 40 percent, and workers receive regular unemployment benefit while not working. In the pre-pandemic scheme, companies were required to pay full wages for the first 15 days, but this was reduced to two days, early in the lockdown, with the government subsidising the full wages (up to about NOK 50 000 per month) for the first 20 days. Unemployment benefit was increased to 80 percent of salary for the first NOK 25 000 per month and 62.4 percent of salary between NOK 25 000 and NOK 50 000 per month.
In Sweden, a new short-time work scheme was introduced in April 2020 for companies suffering temporary serious financial difficulties due to circumstances beyond their control. In contrast to the schemes in the other Nordic countries, working time can only be reduced up to a maximum of 60 percent or 80 percent (the maximum has varied over time). A reduction in working time of 80 percent involves a reduction in wage costs for the company of 72 percent and a reduction in employee wages of 12 percent (Tillväxtverket 2021).
In Finland, a system for temporary layoffs (furloughs) was already in place. Furlough may be for a specific period of time or until further notice. A shortened working week is also possible. Employees on furlough receive unemployment benefit, which is partially paid for collectively by both the employers and employees. The compensation for employees is lower than in the other Nordic countries, with 56 percent for a salary of 3000 euros per month and slightly less than 50 percent for 4000 euros per month (TYJ 2021). However, part-time furloughed workers may receive partial unemployment benefits on top of partial wages and considerably higher replacement rates (Juranek et al. 2021).
In Iceland, the government introduced an option for full-time workers to move to part-time work with government support. Employees could reduce their hours or salary down to 25 percent and supplement their earnings with government support. Companies with revenue loss above 75 percent were given the opportunity to apply for government support to recompense a portion of salary costs during the notice period (Government of Iceland 2020).
The key motivation for job retention schemes is to reduce wage costs for companies in severe financial difficulties, to prevent bankruptcies and avoid permanent layoffs. Job retention schemes allow companies to reduce working hours instead of laying off workers on a permanent basis. Another motivation was to mitigate the costs for the companies and employees most affected by the pandemic, as these costs were unevenly distributed.
However, job retention schemes also involve efficiency costs as well as financial costs to the government. When the government subsidises reduced working hours and furlough, companies may reduce hours worked even if the marginal productivity of labour is higher than in relevant alternatives because companies want to save on wage costs. To mitigate this problem, companies can be allowed to pay some of the wage costs, e.g., by requiring that they cover the wage costs for the first 15 days (as in the Norwegian scheme pre-corona) or that only a portion of the wage costs is covered (as in the Danish and Swedish schemes). Another efficiency cost is that furloughed workers are not usually available for other vacant jobs.
Another potential problem is that if companies incur little or no costs for furloughed employees, it may be tempting to keep them furloughed, even if the probability of reemployment is low, in the hope that business eventually improves. As the probability of finding a new job is likely to fall over a long period on furlough, this may reduce the overall probability of employment for those employees.
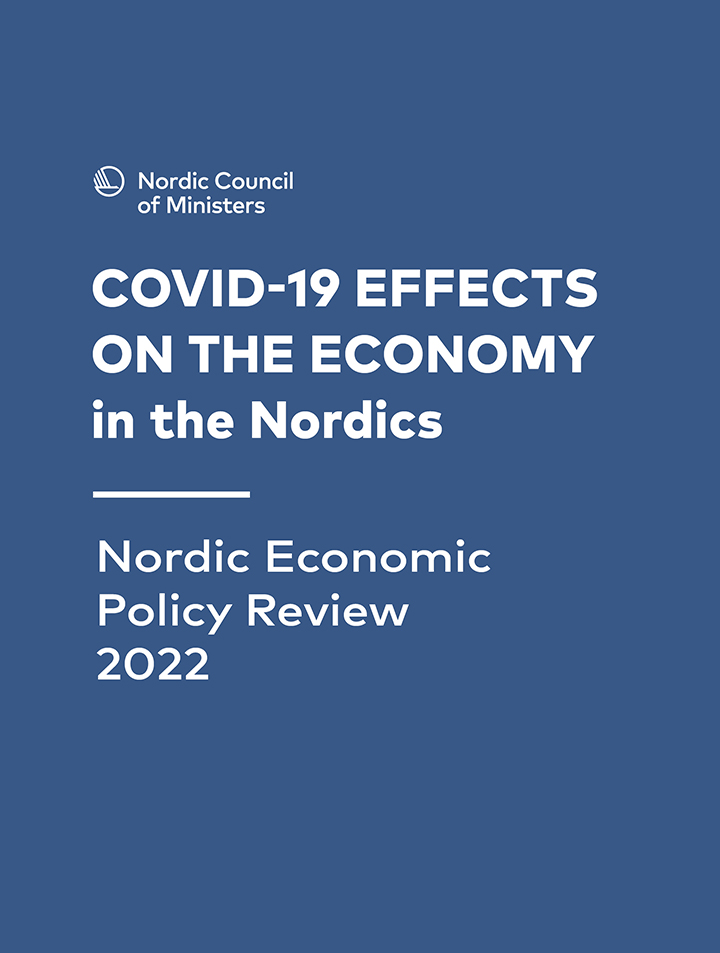
Figure 9a The costs of hours not worked for the government, companies and workers, selected countries – at the average wage level
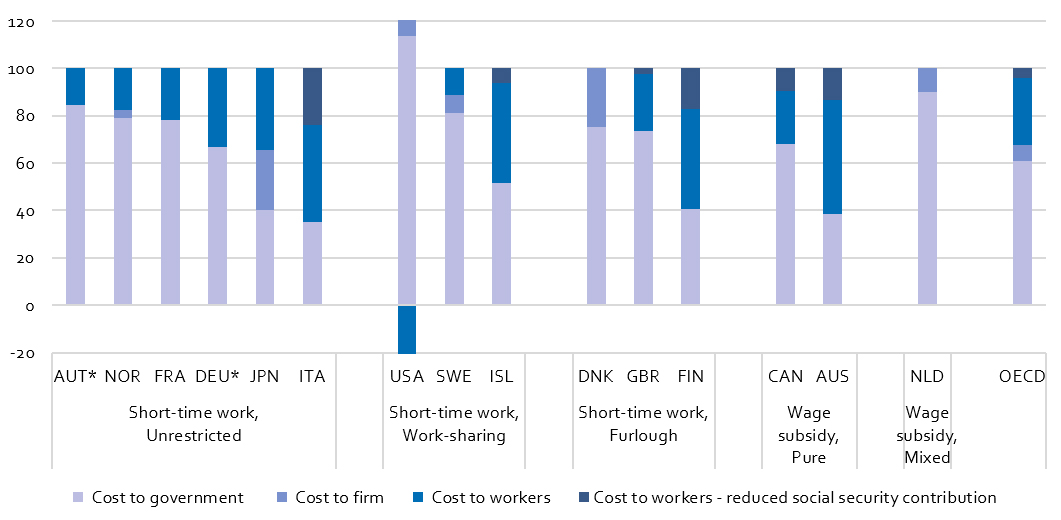
Figure 9b The costs of hours not worked for the government, companies and workers, selected countries – at the 67 percent of the average wage level
Compensating employees in a job retention scheme consists of recognisable trade-offs between insurance and welfare on the one hand and incentives and costs on the other. Full compensation would be good for the insurance and welfare of employees, while concerns about incentives and costs to the government would suggest lower compensation so as to lower public costs and incentivise employees on furlough to look for other jobs. During the pandemic, this trade-off is tilted toward the welfare of employees in order to share the burden and to increase trust and public support. Furthermore, during a situation with widespread lockdowns, there are fewer vacant jobs and thus less need to incentivise unemployed or furloughed individuals to look for other jobs.
Overall, the Finnish and Icelandic job retention systems seem to be the most favourable for employers, and the Danish system the least. For the employees, the Danish scheme is the most favourable and the Finnish and Icelandic system the least, while the Norwegian and Swedish systems fall somewhere in the middle.
It is difficult to assess the extent to which job retention schemes have contributed to the recovery in employment as the economy has improved because we have no counterfactual. There are, however, several studies indicating that the schemes have contributed positively to the prevention of layoffs. Bennedsen et al. (2020) collected survey data for some 10 000 Danish companies and matched them to furlough and administrative-accounting data. Comparing actual outcomes with the counterfactual, they estimate that the support schemes led to 285 000 workers being furloughed while there was a reduction of layoffs corresponding to 81 000 workers.
Most observers argue that job retention schemes have helped to save jobs by preventing bankruptcies and large numbers of permanent redundancies (see OECD 2021a, Hansen et al. 2020, da Silva et al. 2020). This is consistent with our own assessment. Without the support of such schemes, profit maximisation or strict short-run financial constraints might have caused companies to terminate more jobs. This could involve efficiency costs due to permanent job losses and increased macroeconomic uncertainty. However, it also seems likely that many of the furloughed employees would have been kept on by the companies even if there had been no furlough scheme. In these cases, the furlough scheme reduces costs to companies but at a considerable cost to the state. Overall, there appear to be positive efficiency and stabilisation arguments for extensive job retention schemes in a crisis like the pandemic.
5 Support for companies
Financial relief packages for companies are not standard parts of the economic toolkit and have no precedents, even in major crises in the past. They consist of two classes of instruments: liquidity/loan facilities and support for fixed costs. In addition, there are other instruments targeting specific sectors and schemes providing income support for the self-employed, which are not discussed here.
A key element in liquidity provision runs through the tax system via postponement of tax and VAT payments, lower penalties for late payments (reduced or no interest rates) or explicit loan arrangements based on tax and VAT payments and pension contributions by the company.[1]In addition, various loan arrangements have been extended either in the form of guarantees or explicit loans. This is a swift channel for providing liquidity to companies. It is targeted at companies with positive tax and VAT liabilities, and since this depends on past performance, the provision of liquidity is positively correlated with the viability of the firm.
Footnotes
- ^ In addition, various loan arrangements have been extended either in the form of guarantees or explicit loans.
Figure 10 Compensation scheme for fixed costs – 2020
In Denmark, Finland, Norway and Sweden, there are schemes in place to support the fixed costs of companies based on the decline in turnover,[1]Iceland has offered resilience support to help companies maintain a minimum level of activity while the impact of the pandemic persists. The subsidy amounts are based on operating expenses but may not exceed the amount of the revenue loss during the period in question, and there are upper caps across two groups with losses between 60 and 80 percent and losses between 80 and 100 percent. and the main features of these schemes, implemented during the first wave, are illustrated in Figure 10. These have subsequently undergone several adjustments, e.g., Denmark has adopted a smoother compensation curve and other schemes for second-round effects after the reopening of the economy. Support for the decline in turnover is increasing in the decline in turnover, but with a lower threshold determining eligibility and an upper cap (except for 100 percent lockdowns) on the support. In general, support is higher for moderate declines in turnover in Norway and Sweden, compared to Denmark, and the opposite for large declines in turnover. The Finnish scheme is the least generous. In addition, there are country-specific details on the measurement of turnover, the reference period and the definition of fixed costs.
The schemes aim at avoiding companies closing or having to face dire financial strain, and they are, by nature, company-specific. This raises a number of questions. In a normal situation, positive and negative shocks affect business opportunities, and in the process, some businesses may go bankrupt due to mismanagement or if demand for products/services declines for various reasons. Such closures do not represent a policy problem but are part of the market mechanism and serve to reallocate resources and ensure an efficient allocation of these. However, when many companies are affected simultaneously, a systemic issue arises. A small number of companies going bankrupt is not necessarily a problem, but the simultaneous bankruptcy of multiple companies may be. However, company-specific compensation policies interfere with the market mechanism and have a status quo bias by supporting existing companies based on historical performance measures such as turnover. If the support measures are left in place too long, they may impair adjustment and efficient use of real and human capital. Incentive problems also arise as companies may lack sufficient motivation to adjust to the new situation, e.g., by adapting their business model (for example, through e-commerce).
Footnotes
- ^ Iceland has offered resilience support to help companies maintain a minimum level of activity while the impact of the pandemic persists. The subsidy amounts are based on operating expenses but may not exceed the amount of the revenue loss during the period in question, and there are upper caps across two groups with losses between 60 and 80 percent and losses between 80 and 100 percent.
The company-specific nature of the intervention raises the question of whether businesses could either self-insure or insure against such events.[1]The nature of the ‘pandemic’ shock makes it impossible to diversify the shock in financial markets since that would require assets offering contingencies depending on the pandemic. They can self-insure either via financial buffers or loan financing. However, this raises other issues, especially for small and medium-sized enterprises. While companies generally retain buffers to cope with normal variations in business, the situation created by the pandemic is different and self-insurance under these circumstances is far from unproblematic. During a lockdown, when a company is precluded from operating, no revenue is generated, but there are irreversible/fixed costs that accumulate into a total lockdown cost. Especially for businesses operating in a competitive environment with small profit margins, it may be difficult to bear such costs and/or cover them through external financing. A business generating rent has a liquidity problem only, whereas one in a more competitive environment is more likely to have both a liquidity and solvency problem. Relying on self-insurance via capital markets during the pandemic thus has important implications for competition and is not as market-conform as it may first appear.
In addition, financing opportunities may be affected by the severity of containment policies and behavioural responses, past performance, solvency, changes in business opportunities post-pandemic, uncertainty about the length of the disruption of business, entrepreneurial skills, etc. Given the systemic nature of the event, a credit squeeze may also arise. In addition, decisions by financial institutions do not take the excessive social costs of bankruptcy into account, and hence the borrowing options may be too restrictive from a social point of view. Conversely, when otherwise financially viable businesses are in trouble, creditors (financial institutions, landlords etc.) may accept a haircut to avoid a more costly firm closure.[2]However, the large number of companies affected may trigger a financial accelerator effect arising from the declining value of collateral for loans. In this way, the negative shock is diversified. This mechanism is weakened by direct support to companies, which shifts the burden to the public purse and excludes private financing.
There is an important difference between schemes providing direct support and liquidity/loan arrangements.[3]Tax credits are effectively loans without any credit assessment. This allows the swift provision of liquidity but creates a risk that excessive tax/VAT liabilities are accumulated which later results in defaults (and loss of tax revenue). This is clearly an extreme alternative to market-based financing since it relies on self-selection by companies (provided they meet the conditions for ‘tax loans’). Ex-post, a difficult problem arises for tax authorities on how to handle defaults on tax loans. Each case would require a credit assessment to decide whether the company is viable, and whether a haircut on the debt is optimal. Such assessments are outside the normal competencies of tax authorities. Liquidity/loan arrangements overcome a short-run problem but are effectively implying self-financing or insurance, in the sense that businesses are offered the possibility of smoothing out the effects over time. Due to market imperfections, the risk of a credit squeeze and the urgency of providing liquidity/loans to a large number of companies, there is, therefore, an argument to be made for such schemes. However, they do not resolve the liquidity/solvency dilemma raised above, which pertains to business in more competitive environments.
Supporting companies’ fixed costs is far from unproblematic and raises many design issues. The design of the relief packages has three key dimensions: i) when is a business eligible for support, ii) what kind of support is available, and iii) for how long it be received? The eligibility conditions are crucial, and in the schemes applied, they are relatively broad, depending on the decline in turnover. This criterion is simple and relatively easy to implement, but it is not precisely targeted at companies adversely affected by the pandemic. A further problem is that fixed costs are not a well-defined term, and there may be different adjustment possibilities (including re-contracting, e.g., of leasing contracts). In addition, there are wide differences in the importance and nature of fixed costs between different businesses.
Footnotes
- ^ The nature of the ‘pandemic’ shock makes it impossible to diversify the shock in financial markets since that would require assets offering contingencies depending on the pandemic.
- ^ However, the large number of companies affected may trigger a financial accelerator effect arising from the declining value of collateral for loans.
- ^ Tax credits are effectively loans without any credit assessment. This allows the swift provision of liquidity but creates a risk that excessive tax/VAT liabilities are accumulated which later results in defaults (and loss of tax revenue). This is clearly an extreme alternative to market-based financing since it relies on self-selection by companies (provided they meet the conditions for ‘tax loans’). Ex-post, a difficult problem arises for tax authorities on how to handle defaults on tax loans. Each case would require a credit assessment to decide whether the company is viable, and whether a haircut on the debt is optimal. Such assessments are outside the normal competencies of tax authorities.
The decline in turnover is determined by relating turnover in a specific period to a reference period (typically the same period the previous year). While this is relatively simple, it raises issues since turnover in the reference period may be low or high for various reasons, and in any given period, some companies go through changes in turnover relative to their past performance. Although a 30 percent decline in turnover is large, it is not unusual even in a normal business cycle situation, as shown by data for Denmark reported in Andersen et al. (2021). The length of the reference period also matters. A short period implies that short-term variations are eligible for support, while a longer period implies some smoothing out and therefore only support in the event of more long-lasting declines in turnover (more self-insurance). The criteria should also be seen relative to the administrative costs for both business and the public sector and the risk of errors and fraud. There can be measurement issues around concepts like turnover and fixed costs, and while such schemes are relatively easy to administer, neither concept precisely targets the consequences of the pandemic for the individual company. More specific criteria easily become more complicated when more detailed measures are involved, for example, which is a cause of uncertainty for companies and administratively demanding.
These schemes should be temporary due to the implied status quo bias impeding structural adjustments,[1]The direct support to specific companies and industries in the emergency packages also have implications for industrial policy and trade policy. These measures have the bias that they support companies located within the country, and therefore could only be implemented through exemptions from EU rules. and they should have an explicit sunset clause both to give companies a clear planning platform and to signal that the scheme is an unusual solution for an unusual situation. However, the unpredictability of the pandemic has made it difficult to predetermine the duration of the schemes. Across the Nordic Region, the approach has been different. In Denmark, explicit sunset clauses have been included, and the cessation of the schemes followed reopening (with a short lag); in Finland, some schemes ceased at the end of 2020 and most of the rest at the end of 2021; in Norway, the schemes, for the most part, continued until the autumn or end of 2021, (although there were changes introduced over time) and finally, Sweden has not included sunset clauses but announced that ad hoc decisions would be made over time.
The fact that company closures have been very low during the pandemic (see Andersen et al. 2022) can be interpreted as a sign that the schemes have been overly generous and with potentially large deadweight losses by supporting businesses that did not need it. In Norway, the online newspaper E24.no reports that half of the companies that received compensation ended up with higher profits in 2020 than in 2019 (E24.no 2021). More than half of them would also have posted profits even without support. In total, these companies received NOK 1.7 bn. One example is Onepark AS, a parking company, which received NOK 26.7 million in support in 2020 and had an annual result of NOK 32.7 million. However, it is too early to conclude the precise effects the direct support schemes have had for businesses.
Footnotes
- ^ The direct support to specific companies and industries in the emergency packages also have implications for industrial policy and trade policy. These measures have the bias that they support companies located within the country, and therefore could only be implemented through exemptions from EU rules.
6 Monetary and Macroprudential Policy Instruments
The general objective of government policies was to mitigate the major negative developments in employment and production. Easing fiscal policies assumed a central role in government actions, as it is possible to use fiscal instruments to mitigate differential negative developments in different sectors or companies. At the same time, central banks in different countries introduced packages that eased monetary and financial regulation policies as they anticipated that the crisis would have significant impacts on companies’ liquidity.[1]See for example Demmou et al. (2021) and Alstadsæter et al. (2020a, 2020b). Big packages of complementary macroeconomic policies were probably helpful in mitigating the economic effects of the pandemic and achieving a turnaround. It is better to do too much than too little as the risks are asymmetric during a deep crisis.[2]Many economists called for a speedy and large menu of fiscal and monetary policies to mitigate the economic effect of the pandemic. For example, see the papers in Baldwin and Weder di Mauro (2020) and recent commentaries by Blinder (2021) and Gopinath (2021).
Footnotes
- ^ See for example Demmou et al. (2021) and Alstadsæter et al. (2020a, 2020b).
- ^ Many economists called for a speedy and large menu of fiscal and monetary policies to mitigate the economic effect of the pandemic. For example, see the papers in Baldwin and Weder di Mauro (2020) and recent commentaries by Blinder (2021) and Gopinath (2021).
6.1 Monetary policy
At the onset of the pandemic, many market economies were still in the process of recovering from the global financial crisis of 2008. Policy interest rates in most advanced economies were around, or in some cases, slightly below zero, and central banks had to employ unconventional policies.[1]Usually, the measures were combinations of large-scale asset purchases, refinancing of bank lending to companies and forward guidance by the central banks in different countries. Many central banks initiated new asset purchase programmes, liquidity provision and credit support as monetary policy measures to mitigate the recessionary effects of the pandemic.
In the Nordic countries, the Swedish Riksbank and the European Central Bank (ECB)[2]As Finland is a member of the Euro area, the ECB is the monetary policy maker for Finland. initiated new programmes of large-scale asset purchases. The ECB initiated a special pandemic emergency purchase program (PEPP) in March 2020, and the Riksbank introduced a new asset purchase programme in early 2020.
At the start of the crisis, Norway reduced the policy rate to zero from 1.5 percent and initiated special lending and liquidity support to banks. Being bound by the fixed exchange rate of the Krone to Euro, Denmark also provided credit support to banks. For further details of monetary policy measures taken by the Nordic countries, see Andersen et al. (2022). See also IMF (2021) for a discussion of monetary and other economic policies in Iceland.
Footnotes
6.1.1 Monetary policy measures in the Nordic countries
Denmark has a fixed exchange rate in which the Krone is pegged to the Euro. Accordingly, few monetary policy measures were adopted during the COVID-19 period in Denmark. Swap lines and credit facilities to the banking sector were provided in March 2020 to avoid liquidity problems in the financial system and to avoid reducing bank lending to businesses. In addition, the policy interest rate was increased slightly so that it reached a less negative level.[1]See Danmarks Nationalbank (2021). The latter move was designed to maintain the exchange rate of the Krone against the Euro at its pegged level.
Finland is part of the Euro area, so nearly all monetary policy measures affecting the Finnish economy are similar to those seen in the wider Euro-area. The European Central Bank (ECB) introduced a variety of measures designed to significantly ease monetary policy in response to the onset of the pandemic.[2]For example, see Lane (2021).
The ECB also introduced measures to supervise banks and issued instructions to them to refrain from paying dividends and other distributions. See the section on macroprudential policies below. The Bank of Finland introduced one specifically national measure. In March 2020, it restarted its programme to purchase commercial bonds and other commercial papers in the domestic corporate stock market.
Footnotes
The basic monetary policy framework in Iceland is based on inflation targeting, and the exchange rate is flexible. The policy is supported by occasional foreign exchange market interventions. When the COVID-19 crisis erupted, the monetary policy response by the central bank consisted of cuts in the policy interest rate, large scale purchases of government bonds, lowering of the deposits held by banks in the central bank and unsterilised foreign exchange interventions.
Monetary policy in Norway is based on inflation targeting, and the exchange rate for Norwegian Krone is flexible. This exchange rate regime gives monetary policy stabilising powers in the domestic economy. The main instrument is the policy interest rate which stood at 1.5 percent at the start of the COVID-19 crisis and the rate was reduced to zero. The loans and USD liquidity to banks were designed to ensure that the Norwegian financial system is able to avoid a liquidity crunch, which can lead to financing difficulties for businesses.
The monetary policy regime in Sweden is based on a floating Krona and inflation targeting.[1]See Jahnsson (2021) for a discussion of Swedish monetary policy in 2020. However, since 2014, the policy interest rate has been zero or negative, so that in the period from 2014 onwards, monetary policy has been based on unconventional policies. With the onset of the COVID-19 crisis, existing unconventional policies were continued, and new large-scale asset purchases, new liquidity provision and other support programmes were introduced.[2]See Sveriges Riksbank (2021) for a recent summary.
Footnotes
6.2 Macroprudential policies
Concurrent with other economic policies, there was also a swift policy reaction with macroprudential policies (and some microprudential policies) to contain the adverse financial developments. The policy objectives were to keep the financing conditions favourable, provide liquidity support to companies and stabilise household incomes. The policy instruments have included measures such as debt moratoria, restraints on dividend payments and related distributions, the release of structural buffers in banks and other financial institutions and instructions concerning lending criteria.
The pandemic and its negative impact on activity in the real economy led to concerns about liquidity and financing conditions for businesses, households and the financial system. Interestingly, the early effects of the pandemic did not impact house prices, with prices even increasing in some countries. The number of company bankruptcies in each of the four countries was fluctuating before the start of the pandemic recession, and the numbers started to decline on average.
The negative effects of the pandemic recession on the banking institutions were gradual. The amounts of bank lending to businesses and households in the four Nordic countries increased at the start of the pandemic, but there was a decline in the third quarter of 2020, and in later stages, a slight negative trend can be observed. Lending to households has been mirrored by declines in the four Nordic countries that have not triggered negative trends.
The crisis resulted in a decline in profitability as measured by the returns on equity of banks in 2020. However, the situation has improved in 2021. An analogous trend is seen in another profitability indicator, the cost-to-income ratios of banks in the four Nordic countries. See Andersen et al. (2022) for details.
As regards systemic risks in the financial system, basic indicators for credit risk and ratios of non-performing loans in banks show small increases in 2020 for Denmark, Finland and Norway (with a somewhat larger increase for Iceland) while there is no change for Sweden. See Figure 11 below. The situation seems to have stabilised in the first half of 2021. It should be noted that another indicator of possible non-performing loans, called Stage 2, shows a similar development. Household indebtedness is another indicator that is used in assessing credit risks. This indicator increased for Sweden, whereas the development has been relatively smooth for the other three countries.
Figure 11 Non-performing loans, banks
Source: EBA, Risk Dashboard.
At the start of the pandemic, financial supervisors in the Nordic countries introduced a variety of easing measures to mitigate potential liquidity problems and other strains in their banking sectors. These took the form of reductions in the capital buffers of banks and relaxation of lending standards. Reductions of capital buffers for banks have evidently been the main instrument for policy easing.[1]Interestingly, Icelandic banks made proactive provisions against losses in the tourist sector.
Footnotes
- ^ Interestingly, Icelandic banks made proactive provisions against losses in the tourist sector.
7 Assessment and concluding remarks
The pandemic has been unusual in many respects, including the application of containment measures and emergency relief for which there are no precedents and thus no empirical knowledge on which to rely. Even ex-post, it is difficult to discern the effects of the different elements due to the clustering of events within a narrow time frame.
Nevertheless, looking at the economic developments over the course of the pandemic, it is possible to make some general observations about the Nordic countries. While the decline in economic activity was historically large, the recovery, alongside the re-openings of the economy, has been surprisingly quick, though less so for Iceland.[1]The recession in Iceland was larger than in the four other Nordic countries and the recovery has taken longer. The difference seems to be due to the major role played by tourism in the Icelandic economy. This is illustrated in Figures 12a–12e, showing projections for economic activity at various points in time during 2020 and 2021. The rapid recovery despite the large downturn is an interesting feature from the perspective of business cycle models predicting that declines in activity, especially if they are large, can be persistent with a slow and gradual recovery process.
The health strategies of Sweden differed from those of Denmark, Finland, Iceland and Norway. During the initial stages, Sweden applied less strict measures to contain the pandemic, relying more on guidelines and voluntary restraint. This led to higher infection rates and mortality in the period 02.2020–03.2021. In autumn 2020, Sweden began to transition to somewhat stricter policies.
It can be noted that activity in some sectors (arts, entertainment and recreation), as well as other service activities, declined much less in Sweden than in Denmark, Finland and Norway in 2020.4 (see data in Figures 3 and 4). This suggests that the weaker restrictions in Sweden included some economic gain in the form of smaller activity reduction in those sectors, even if the difference is not noticeable in the aggregate data. Iceland’s exposure to tourism has been a crucial factor.
Footnotes
- ^ The recession in Iceland was larger than in the four other Nordic countries and the recovery has taken longer. The difference seems to be due to the major role played by tourism in the Icelandic economy.
As illustrated by GDP forecasts from the OECD, cf. Figures 12a–12e, economic activity has consistently recovered faster than predicted. The panels in the figures show forecasts at different time points (the most recent forecasts are from December 2021), and the actual outcomes. It is impressive that the Nordic countries, having experienced a steep decline in activity in the second quarter of 2020, have recovered so swiftly even though these economies are small and very open. However, it is important to note that the GDP measure now includes activity and measures to react and adapt to the pandemic, which does not provide overall welfare relative to a situation without corona. Thus, when considering the effect on aggregate GDP, this does not take into account that some decline in activity has been replaced by activity to cope with and adapt to the pandemic.
One possible interpretation of the developments in the Nordic countries is that the logic of the economic policy of preserving production capacity and job matches to make a swift recovery possible has worked. The packages have not only maintained the supply side but also ensured that domestic demand remained largely intact. This may be interpreted as a two-handed approach to addressing the economic consequences of the pandemic. The more general structure of the Nordic societies, incorporating high levels of trust and co-operation, reliance on digitalisation, combined with a well-organised societal model including a strong social safety net, has been an important contributing factor to the recovery process.
The policies implemented to cope with the pandemic have had significant fiscal costs,[1]It is too early to come to definite conclusions on the fiscal costs since there is still an issue in relation to postponed tax and VAT payments. In addition, the pandemic is not over yet and further fiscal spending may be required. but these should be compared to a pandemic without relief measures, not to a no-pandemic scenario. The Nordic countries entered the pandemic with fiscal elbow room, which gave them space for active policy interventions. By contrast, many other European countries had high debt levels and unsolved fiscal sustainability problems at the start of the pandemic.
Unlike the Financial Crisis, the COVID-19 pandemic has not caused a sovereign debt crisis, although debt levels for some countries are as high or higher than during the global financial crisis. An important reason for this difference is the extensive asset purchase programmes by central banks. One result is that government bond rates remained low (facilitating debt servicing), implying that the high debt levels have not triggered a deeper recession. This has benefitted the Nordic countries and is one factor contributing to the recovery.
In hindsight, the overall policy strategy pursued seems successful, although many specific elements can be discussed. The success was not based on ‘grand design’ since the policy measures represented an improvisation rather than being well-planned interventions. The policy strategy was not without risk, and it is probably crucial that the containment measures were only applied for a relatively short period of time and with an interim reopening between the two waves (rather than one long period of equal total length). The interim period allowed most businesses to recover activity in the second half of 2020 and rebuild some buffers for the next wave. It also allowed for learning and adaptation, contributing to a smaller decline in activity during the second wave.
Footnotes
- ^ It is too early to come to definite conclusions on the fiscal costs since there is still an issue in relation to postponed tax and VAT payments. In addition, the pandemic is not over yet and further fiscal spending may be required.
Figure 12a GDP forecasts for the Nordic countries, Denmark
Figure 12b GDP forecasts for the Nordic countries, Finland
Figure 12c GDP forecasts for the Nordic countries, Norway
Figure 12d GDP forecasts for the Nordic countries, Sweden
Figure 12e GDP forecasts for the Nordic countries, Iceland
Source: https://www.oecd-ilibrary.org/.
The Nordic Region, as well as other OECD countries, have deployed a broad set of measures to mitigate the negative impact on households, businesses and the overall economy. The job retention schemes have been important to shelter affected sectors and prevent permanent job losses. However, employers should incur some costs when workers are laid off temporarily to prevent excessive overuse of such schemes. Other types of support to companies have also been useful in preventing closures, bankruptcies and permanent job losses. Linking support to reductions in revenue ensures that companies operating normally do not receive support. Yet it has proved difficult to avoid providing support to companies where the reduction in revenue is caused by other factors and to businesses that could have done well without the support. It is important to evaluate the various support schemes to make design improvements for any new crises that may emerge in the future.
The relatively short period of time in which the measures have been in place is also crucial. This was not a given when they were implemented. As noted, the relief packages may be justified as temporary measures in an unusual situation, but a more prolonged lockdown would have posed a difficult dilemma. The cost in terms of hindering adjustment and reallocation of resources would, in that scenario, be much higher. If the application of unusual policy measures were to be extended beyond the COVID-19 pandemic, political demands for deploying such measures as part of a policy package for ‘normal’ times might emerge. This would be unfortunate.
It is also plausible that the policy strategy was successful because the crisis was not triggered by pre-existing economic imbalances. The Nordic countries were all performing reasonably well at the onset of the COVID-19 pandemic.
The future situation regarding the pandemic remains highly uncertain. While vaccination programmes have been effective, the pandemic is still ongoing, and there is a risk of new and more contagious variants of the virus. At worst, we could see a resurgence of the pandemic that results in a slowdown in the global economy, including in the Nordic Region.
References
Alstadsæter, A., Bratsberg, B., Eielsen, G., Kopczuk, W., Markussen, S., Raaum, O. & Røed, O. (2020a). The first weeks of the coronavirus crisis: Who got hit, when and why? Evidence from Norway. (National Bureau of Economic Research Working Paper, no. 27 131). Cambridge, MA: National Bureau of Economic Research.
Alstadsæter, A., Brun Bjørkheim, J., Kopczuk, W. & Økland, A. (2020b). Norwegian and US policies alleviate business vulnerability due to the COVID-19 shock equally well. (National Bureau of Economic Research Working Paper, no. 27 637). Cambridge, MA: National Bureau of Economic Research.
Andersen, A. L., Hansen, E. T., Johannesen, N. & Sheridan, A. (2020a). Consumer responses to the COVID-19 crisis: Evidence from bank account transaction data. (CEPR discussion paper, no. 14 809). London, UK: Centre for Economic Policy Research.
Andersen, A. L., Hansen E., Johannesen, N. & Sheridan, A. (2020b). Social distancing laws cause only small losses of economic activity during the COVID-19 pandemic in Scandinavia. PNAS, 117(34), 20 468–20 473.
Andersen, T.M., Schröder, P. J. H. & Svarer, M. (2021). Rapport fra den økonomiske ekspertgruppe vedrørende udfasning af hjælpepakker II. Copenhagen, Denmark: den økonomiske ekspertgruppe.
Andersen, T.M., Holden, S. & Honkapohja, S. (2022). Economic consequences of the pandemic – the Nordic countries. Stockholm, Sweden: SOU. Available at: https://coronakommissionen.com/wp-content/uploads/2022/02/underlagsrapport-economic-consequences-of-the-pandemic_the-nordic-countries.pdf.
Baker, M. G., Blakely, T. & Wilson, N. (2021). Elimination could be the optimal response strategy for COVID-19 and other emerging pandemic disease. BMJ Publishing group Ltd, vol. 371.
Baldwin, R. & Weder di Mauro, B. (Eds.) (2020). Mitigating the Covid crisis: fast and whatever it takes. London, UK: CEPR Press. Retrieved from: https://voxeu.org/content/mitigating-covid-economic-crisis-act-fast-and-do-whatever-it-takes.
Bennedsen, M., Larsen, B., Schmutte, I. & Scur, D. (2020). Preserving job matches during the COVID-19 pandemic: firm-level evidence on the role of government aid. (GLO discussion paper, no. 588). Essen, Germany: Global Labor Organization. Available at: https://www.econstor.eu/bitstream/10419/221802/1/GLO-DP-0588.pdf.
Blinder, A. (2021). Interactions between monetary and fiscal policy: Yesterday, today, and tomorrow. Remarks given at Jackson Hole symposium.
Bougroug, A., Kjos, Ø. K. & Sletten, P. (2021). Økonomisk utvikling gjennom COVID-19 – En sammenligning av utvikling i Norge, Sverige og Danmark. Oslo, Norway: Statistisk sentralbyrå.
Campa, P., Roine, R. & Stromberg, S. (2020). Inequality in the Pandemic: Evidence from Sweden. Stockholm, Sweden: Free Network, Policy Brief Series. Available at: https://freepolicybriefs.org/wp-content/uploads/2021/03/freepolicybriefs20210322.pdf.
da Silva, A.D., Dossche, M., Dreher, F., Foroni, C. & Koester, G. (2020). Short-time work schemes and their effects on wages and disposable income. Frankfurt, Germany: ECB Economic Bulletin 4/2020. Retrieved from: https://www.ecb.europa.eu/pub/economic-bulletin/focus/2020/html/ecb.ebbox202004_06~6b0e718192.en.html.
Danmarks Nationalbank (2021). Danmarks NationalBank and COVID-19. Copenhagen, Denmark: Danmarks Nationalbank. Available at: www.nationalbanken.dk.
Demmou, L., Franco, G., Calligaris, S. & Dlugosch, D. (2021). Liquidity shortfalls during the COVID-19 outbreak: Assessment and policy responses. (OECD Economics Department working paper, no.1 647). Paris, France: OECD Economics Department.
Dingel, J. & Neiman, B. (2020). How many jobs can be done at home? (National Bureau of Economic Research Working Paper, no. 26 948). Cambridge, MA: National Bureau of Economic Research.
E24.no (2021). Halvparten av bedriftene som fikk pandemi-støtte gjordedet bedre i 2020 enn året før. Oslo, Norway: E24. Retrieved from: https://e24.no/naeringsliv/i/5GWdVE/halvparten-av-bedriftene-som-fikk-pandemi-stoette-gjorde-det-bedre-i-2020-enn-aaret-foer.
European commission (2021). Policy measures taken against the spread and impact of the coronavirus – 12 February 2021. European commission. Available at: https://ec.europa.eu/info/sites/default/files/coronovirus_policy_measures_12_february_2021.pdf.
Eurostat (2021). EU labour force survey – correction for breaks in time series. Eurostat. Retrieved from: https://ec.europa.eu/eurostat/statistics-explained/index.php?title=EU_labour_force_survey_-_correction_for_breaks_in_time_series.
Furceri, D., Ganslmeier, M., Ostry, J. D. & Yang, N. (2021). Initial output losses from the COVID-19 pandemic: Robust determinants. (International Monetary Fund, Working Paper 21/18). Washington, DC: International Monetary Fund.
Gamtkitsulashvili, T. & Plekhanov, A. (2021). Mobility and economic activity around the world during the COVID-19 crisis. (European Bank of reconstruction and development, Working Paper, no. 259). London, UK: European Bank of reconstruction and development.
Gopinath, G. (2021). The interaction of fiscal and monetary policy. Remarks given at Jackson Hole symposium.
Government of Iceland (2020). Government of Iceland announces increased support for companies and extension of part-time unemployment benefits. Reykjavík, Iceland: Government of Iceland. Retrieved from: https://www.government.is/news/article/2020/04/28/Government-of-Iceland-announces-increased-support-for-companies-and-extension-of-part-time-unemployment-benefits/.
Guerrieri, V., Lorenzoni, G., Straub, L. & Werning, I. (2020). Macroeconomic implications of COVID-19: Can negative supply shocks cause demand shortages? (National Bureau of Economic Research Working Paper, no. 26 918). Cambridge, MA: National Bureau of Economic Research.
Han, E., Tan, M. M. J., Turk, E., Sridhar, D., Leung, G. M., Shibuya, K., Asgari, N., Oh, J., García-Basteiro, A. L., Hanefeld, J., Cook, A. R., Hsu, L. Y., Teo, Y. Y., Heymann, D., Clark, H., McKee, M. & Legido-Quigley, H. (2020). Lessons learnt from easing COVID-19 restrictions: an analysis of countries and regions in Asia Pacific and Europe. The Lancet, 396(10 261).
Hansen, M.E., Sørensen, S. Y. & Andersen, T. (2020). Analyse af udvikling og respons i nordiske arbejdsmarkeder som følge af COVID-19 pandemien. Taastrup, Denmark: Teknologisk institut. Retrieved from: https://www.teknologisk.dk/ydelser/analyse-af-udvikling-og-respons-i-nordiske-arbejdsmarkeder-som-foelge-af-covid-19-pandemien/42769.
Henriksen, E., Moen, E. & Natvik, G. J. (2020). En prinsipiell tilnærming til økonomiske tiltakspakker mens vi bekjemper koronaviruset [eng: ]. Oslo, Norway: Samfunnsøkonomen.
IMF (2021). Iceland IMF Country Report No. 21/106, June. Washington, DC: International Monetary Fund.
Jahnsson, P. (2021). The response in Sweden. (Chapter 6 in CEPR 2021). London, UK: Centre for Economic Policy Research.
Juranek, S., Paetzold, J., Winner, H. & Zoutman, F. (2021). Labor market effects of COVID-19 in Sweden and its neighbors: Evidence from administrative data. Kyklos, 74(4).
Lane, P. (2021). Monetary policy response in the Euro area. (Chapter 4 in CEPR 2021). London, UK: Centre for Economic Policy Research.
OECD (2021a). Employment Outlook. Paris, France: OECD.
OECD (2021b). Responding to the COVID-19 and pandemic protection gap in insurance. Paris, France: OECD.
Sapir, A. (2020). Why has COVID-19 hit different European Union economies so differently? (Bruegel Policy Contribution Issue no. 18). Brussels, Belgium: Bruegel.
Sveriges Riksbank (2021). The Riksbank’s measures in connection with the corona pandemic. Stockholm, Sweden: Sveriges Riksbank. Retrieved from: https://www.riksbank.se/en-gb/press-and-published/updates-on-the-riksbank-and-the-coronavirus-pandemic/the-riksbanks-measures-in-connection-with-the-corona-pandemic/.
Tillväxtverket (2021). Short-time work allowance 2020. Stockholm, Sweden: Swedish Agency for Economic and Regional Growth. Retrieved from: https://tillvaxtverket.se/english/short-time-work-allowance-2021/short-time-work-allowance-2020.html.
TYJ (2021). Guide to unemployment fund’s benefits 2021. Helsinki, Finland: Federation of Unemployment Funds in Finland. Available at: https://www.tyj.fi/wp-content/uploads/2019/11/Guide-to-unemployment-funds-benefits_2021.pdf.
Zhuang, A. Y. (2021). Digitaliserede økonomier har klaret sig bedre gennem pandemien. (Economic memo Danmarks Nationalbank). Copenhagen, Denmark: Danmarks Nationalbank.
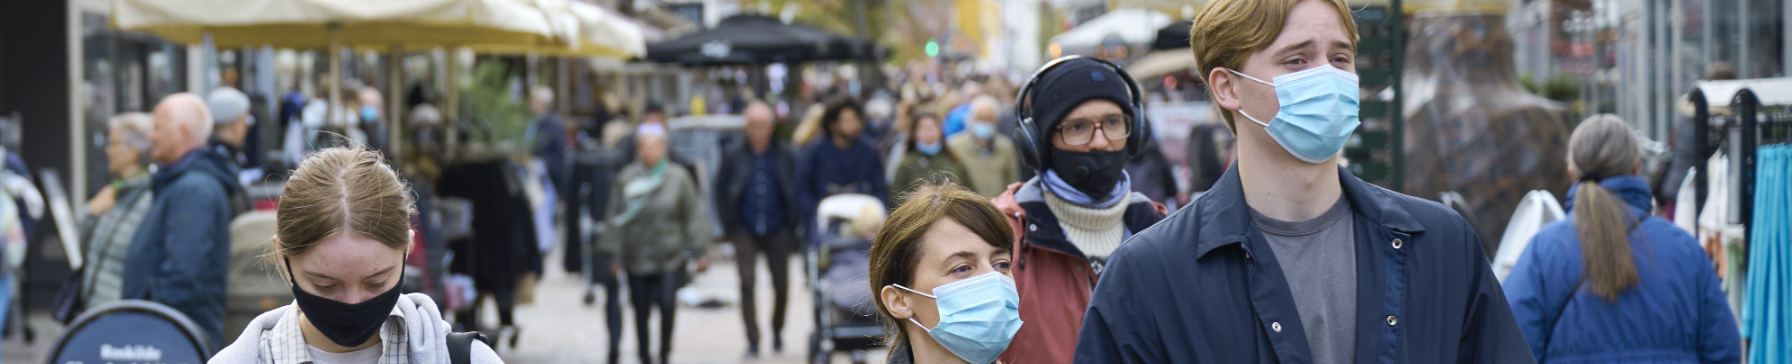
Labour market and social policy responses to the COVID-19 pandemic in the Nordic countries – A view from the outside
Abstract
The period since March 2020 has been a turbulent one for all European countries. The ongoing pandemic has led to several rounds of containment measures and restrictions on social and economic activities that have directly affected work and employment. To mitigate these effects, virtually all countries have adopted and implemented complex packages of fiscal, labour market and social policies to stabilise their economies, support companies and secure jobs and incomes. This article looks at the national responses and their impact during the COVID-19 pandemic in the Nordic Region, discussing and contrasting the Nordic experiences with Germany and the European average. Based on the currently available evidence, we argue that the Nordic countries managed the challenges of the crisis successfully, benefitting from advantageous social, economic and labour market conditions from the outset and an institutional repertoire of policies that were mobilised in due course.
Keywords: COVID-19, social policy, job retention, active labor market policies, Nordic countries.
JEL codes: J21, J65.
1 Structure
The article is organised as follows: the first section provides an overview and comparison of the health crisis and economic consequences for Denmark, Iceland, Finland, Norway and Sweden. The following section addresses the labour market and social policy responses in the Nordic countries, again against a comparative backdrop. The article concludes with an assessment of the responses and proposes measures that may be relevant in future health crisis reactions.
2 The economic consequences of the pandemic
2.1 Cases, deaths and containment
After the first outbreak of COVID-19 cases in December 2019, measures to track and record the health crisis were implemented in European countries at the beginning of 2020. One core parameter for comparison is the rate of deaths related to COVID-19. Therefore, we begin with the 14-day notification rate of deaths in the Nordic countries, Germany and the EU (ECDC 2021).
Figure 1 14-day notification rate of deaths
Source: ECDC (2021).
Figure 2 Excess deaths
Source: Solstad (2021).
Taking into account the rate of excess deaths, which uses the counterfactual case to the COVID-19 pandemic, and indicates the gap between the total number of deaths that occur (for any reason) and the amount that would be expected under normal circumstances (Solstad 2021) as an additional indicator of the severity of the health crisis (Figure 2), we can see that in terms of their rate of deaths in the second wave, Denmark and Sweden were outliers. Sweden was also an outlier during the first wave. If we examine the excess death ratio alone, then Sweden is similarly the outlier in the Nordic countries. We might be surprised that Sweden, in particular, differed in its responses to the pandemic from the other Nordic countries, given that they all sought to avoid their health systems being overrun and to prevent new cases of COVID-19 and deaths from the virus.
One such difference was the use of the power of the state of emergency. While Iceland, Finland and Norway imposed a state of emergency in early 2020, Denmark and Sweden did not. In fact, Sweden does not possess the legal option of introducing a state of emergency and, therefore, like Denmark, relied on amending existing legislation (Saunes et al. 2021). While governance and legislative features are part of the explanation of the health systems’ response to the COVID-19 pandemic (Strang 2020), the less restrictive Swedish response to the pandemic has been the subject of much academic and political debate. The lack of a national emergency option in Sweden possibly made the response in the initial phase of the pandemic less strict. The lack of a mask mandate seems to be another indication of the less restrictive Swedish approach, which again made it an outlier with regard to public health, and with resulting mortality rates that were significantly higher than in the other Nordic countries (Saunes et al. 2021). However, the latest increase in infections and death seems less pronounced in Sweden at the time of writing (with a notable deterioration in Germany, for example, during the same period).
In order to have a broad foundation for comparison in the Nordic Region, the Containment and Health Index, as part of the Oxford COVID-19 Government Response Tracker, provides a rough approximation on the strictness of containment and health measures, notwithstanding differences at regional level or in practical implementation (Hale et al. 2021). To track each country’s responses to the health emergency, the Oxford COVID-19 Government Response Tracker (OxCGRT) began collecting information on policy responses by governments to tackle COVID-19 at the beginning of 2020 (Hale et al. 2021). The information was then converted into policy indices. One such index is the Containment and Health Index, portraying the level of severity of 'lockdown-like' policies restricting people’s behaviour and health policies. It is based on ordinal containment and closure policy indicators, an indicator on public information campaigns and testing policy, contact tracing, face coverings and vaccine policy. This means it includes the contested policies for mask mandates and vaccines to the Stringency Index. Figure 3 shows the Containment and Health Index for the five Nordic countries.
Figure 3 Containment and health index
Despite all caveats, the Stringency and Containment and Health Index provides some useful comparable indication of the measures adopted by countries to combat the spread of the virus. By the end of February 2020, COVID-19 cases had been registered in all the Nordic countries. Denmark, Finland and Norway had imposed partial national lockdowns, whereas Sweden took a different approach. The lockdown was enforced through restrictions on international travel combined with reduced social interaction, such as the closure of non-essential businesses, schools, public events and similar. Finland and Norway also introduced temporary restrictions on internal mobility. In contrast to other European nations, curfews were not imposed in any of the Nordic countries. Businesses and educational facilities remained open by switching to teleworking and distance learning. By late April 2020, the economic consequences of the lockdown had become a central part of policy discussions, effectively changing the initial aim of halting the spread of the virus to controlling its spread. Phases of reopening, including measures such as the reopening of day-care centres and schools had not yet come into effect. Combined with the lockdown periods, the introduction of testing and tracing systems was an important instrument in curbing the spread of the virus. A diagnosis of COVID-19 meant a period of self-isolation for the individual concerned. Finland, Iceland and Norway all introduced penalty notices for violations of the isolation rules. Adherence to these measures was greatly assisted and supported by the welfare system that ensured financial support in case of sickness (Saunes et al. 2021).
2.2 Labour market and economy
While policymakers responded to the health crisis by implementing closure and containment measures to slow and impede the spread of the virus, these measures also impacted the labour markets and economies of all countries. Before we examine how countries were equipped to tackle the social and labour market impact, Figure 4 gives a comparative view on the decline and recovery of the economies as measured by changes in quarterly real GDP in 2020 and 2021.
Figure 4 GDP decline and recovery
Source: OECD (2021a), Quarterly National Accounts.
This data is from the OECD’s quarterly national accounts (QNA) and presents data collected from all OECD member countries and some other major economies. In order to establish a standardised comparison, and due to the ease of data collection, we have opted for comparative data for the GDP data of the selected countries. This may, in some cases, lead to differences within national records and figures. At the beginning of the COVID-19 crisis, in the first quarter of 2020, and compared to the final quarter of 2019, GDP in Iceland, Norway and the EU decreased only marginally, while GDP in Denmark, Finland, Norway and Sweden, appeared unchanged and may even have gone up slightly. In all of the countries reviewed, the greatest negative change occurred in the second quarter of 2020. With declines ranging from around -5 percent to -13 percent (compared to the fourth quarter of 2019), all five Nordic countries were still suffering less than the EU average. However, Iceland and Norway were closer to the EU level. The trend for all reviewed countries was an increase in GDP in the remaining quarters of 2020. GDP in the Nordic countries only fell in Iceland and Finland during the first quarter of 2021. By the second quarter of 2021, only Germany still had a negative difference compared with the fourth quarter of 2019. Finally, in the third quarter of 2021, all countries reported a positive variation from the fourth quarter of 2019, with Norway showing the highest growth.
Figure 5 Unemployment
Source: OECD (2021b), Labour market statistics.
In Figure 5, we see that unemployment developed in a similar fashion in the Nordic countries and the EU on average, according to comparable labour force data, although this may differ from national register data (for example, compared to the Icelandic statistics: Statistics Iceland 2022). Germany was able to maintain its unemployment rate at a relatively low level even though it gradually began to rise in 2020, while all the Nordic countries (except Iceland and Sweden) reported an initial drop in the unemployment rate in the first quarter of 2020. Iceland’s unemployment rate rose from the final quarter of 2019 to the final quarter of 2020. Sweden and Finland are the only two countries in this comparison that remained above the EU average throughout. All the Nordic countries experienced a decrease in their unemployment rates towards the end of 2021. However, Sweden and Iceland still have higher unemployment than at the outset of the crisis.
Another effect of the pandemic was the decline in hours worked. For the average annual hours actually worked, the OECD reported a 5 percent decrease for the EU 27 from 2019 to 2020. Iceland and Denmark had the highest reductions in hours worked with 3 percent and 2.5 percent respectively. Sweden came close to 2 percent while Norway and Iceland remained under 1 percent. In Germany, the reduction was 3.7 percent (OECD 2021c). Eurostat offers an index of total actual hours worked in the main job (Table 1). Some Nordic countries show a similar development of fewer hours worked from the first quarter of 2020 to the third quarter. Sweden has the largest change in hours worked in THE THIRD QUARTER OF 2020. All the Nordic countries and the EU27, on average, had begun to recover from the start of the last quarter of 2020, but in the first quarter of 2021, all countries in our observation dropped again. Corresponding to the evolution of the pandemic, there was a second recovery for some countries, only to be followed by another overall drop in the third quarter of 2021, according to our most recent available data.
Table 1 Hours worked
| Country | 2019-Q4 | 2020-Q1 | 2020-Q2 | 2020-Q3 | 2020-Q4 | 2021-Q1 | 2021-Q2 | 2021-Q3 |
| Denmark | 101.3 | 98.4 | 93.6 | 91.4 | 101.7 | 99.1 | 107.5 | 93.4 |
| Finland | 106.6 | 107.9 | 100.0 | 98.4 | 105.9 | 101.4 | 103.9 | 94.7 |
| Iceland | 116.5 | 113.7 | 105.0 | 104.0 | 106.0 | 105.2 | 102.9 | 91.9 |
| Norway | 101.6 | 101.1 | 95.1 | 86.2 | 97.2 | 102.7 | 105.5 | 91.8 |
| Sweden | 108.2 | 104.1 | 100.2 | 85.7 | 102.4 | 105.2 | 106.1 | 88.7 |
| EU27 | 105.8 | 100.8 | 89.3 | 96.3 | 99.6 | 100 | 103 | 97 |
Source: Eurostat (2022).
All in all, the economic impact of the crisis in the Nordic countries compared by GDP, unemployment and the change in hours worked was often less severe or at least close to the EU average. In the following section, we will look at some of the factors that potentially assisted this trend.
2.3 Potentially advantageous conditions for crisis management in the Nordic countries
In order to understand the different economic impacts, especially in comparison to the EU average, we assume that the following factors combined to play a crucial role in mitigating the impact in the Nordic countries: a) advanced digital infrastructure and teleworking capabilities, b) sustainable public finances and c) highly developed welfare states.
First, the high level of teleworking capability in the Nordic countries, i.e. the option to work from home instead of on the company’s premises, appears to have supported economic activity and employment while simultaneously enabling social distancing. We observe high rates of remote working in Finland, Iceland and Denmark in Figure 6. The amount of remote work during the pandemic increased in all countries, with Norway’s low rate of work from home being an outlier. Since the Nordic countries already had some of the highest proportions of remote workers before the pandemic, the increase was smaller than in countries in Southern and Central–Eastern Europe. Nonetheless, they remain at the top of the teleworking table (Predotova & Vargas Llave 2021). The OECD report of Sweden’s self-reported data puts the percentage of telework between 28 and 40 percent for the year 2020 (OECD 2021j).
Figure 6 Working from home by frequency, 2020
Source: Eurostat (2021b), adopted after Ker, D. et al. (2021).
One factor explaining the different prevalence of remote working in the EU is the variation in sectoral and occupational structures. Remote work is particularly widespread in knowledge- and ICT-intensive services. IT and other communication services, knowledge-intensive business services, education, research and similar activities had the highest shares of remote work by sector in 2018. The telecommunication, finance and insurance sectors followed, with over 20 percent prevalence in remote working. The lowest share of remote work occurred in administrative and support services and in manufacturing. In 2019, the rate of remote working was more widespread in countries such as Denmark, Finland and Sweden, where overall there were larger numbers in employment in knowledge and ICT-intensive services. Germany was closer to the EU-27 average by this indicator. However, there were many differences within sectors and, in some countries, workers had greater access to remote working than in others, depending on management and supervisory styles, the organisation of their work, and country-specific policies regarding aspects such as work flexibility (European Commission 2020a, Fana et al. 2020) or their access to reliable digital infrastructure.
Digital skills are another factor in explaining the differing prevalence of remote work across the EU. Remote work often relies on the skills of workers. Those with greater digital skills have often been better prepared for the changes during the COVID-19 pandemic. The proportion of individuals aged between 25 and 64 in the active labour force who have above average overall digital skills was reported to be considerably higher in the Nordic countries than the EU and German average. The number in Germany was approximately 43 percent, while all the Nordic countries were above 50 percent, with Iceland in a top position of 67 percent (Eurostat 2021a). The Digital Economy and Society Index (DESI) represents a broader benchmark of countries’ digital performance, measuring human capital, connectivity, integration of digital technology and digital public services. For 2021, the DESI ranked Denmark, Finland and Sweden as the overall highest scoring countries. The EU average was around 50 points, while the three Nordic countries all reached well above 60 points (European Commission 2020b).
Figure 7 DESI, 2019–2021
Apart from the Nordic countries’ digital skills and teleworking capabilities, greater sustainability of public finances is another condition that we argue increased the manageability of the pandemic and economic performance under difficult conditions. Longer-term public debt can be contrasted with the shorter-term general government budget balance (Table 2 and 3).
Table 2 Public debt, 2019–2020
| Debt of general government, percentage of GDP | ||
| Country | 2019 | 2020 |
| Denmark | 48 | 58 |
| Finland | 70 | 82 |
| Iceland | 66* | 77* |
| Norway | 47 | 53 |
| Sweden | 56 | 63 |
| Germany | 68 | 79 |
While public debt in all countries observed increased from 2019 to 2020, the overall picture shows Norway at the lower range of the scale together with Denmark and Sweden, while only Finland was slightly higher than Germany and close to the OECD average.
Another method of examining the overall economic situation besides debt is the public deficit as a balance of government income and expenditure. The public deficit developed, as expected, negatively from 2019 to 2020 in all countries (Table 3).
Table 3 Public deficits, 2019–2020
| Public deficits, percentage of GDP | ||
| Country | 2019 | 2020 |
| Denmark | 4.1 | -0.2 |
| Finland | -0.9 | -5.5 |
| Iceland | -1.5 | -8.6 |
| Norway | 6.6 | -3.0 |
| Sweden | 0.6 | -2.8 |
| Germany | 1.5 | -4.3 |
| EU | -0.5 | -6.9 |
In 2020, all Nordic countries reported a public deficit. Iceland’s decline was the greatest and even larger than the EU’s average contraction, which could be attributed to the particular vulnerability of a small economy during the crisis. Denmark, Sweden and Norway are at the top of the ranking. Finland’s public deficit is greater than Germany’s but still above the EU average (OECD 2021d).
In line with Greve et al. (2021), we would also argue that in the realm of social policy, advantageous conditions also existed. The Nordic welfare state model (Kuhnle 2019, Knutsen 2017) undoubtedly contains certain features that equip it with above-average crisis resilience. Important elements of the pandemic response were already present before the crisis, such as universal social protection systems, economically generous welfare transfers (e.g. benefits in unemployment: OECD 2022b) and social services (including health care) that all work as automatic stabilisers for household incomes and the economy, while active labour market policies allow for a successful recovery by quickly bringing unemployed people back into employment. These, and other similar factors, offer a solid foundation when comparing the policy responses of the Nordic countries (Greve et al. 2021).
3 Labour market and social policy responses in the Nordic countries
3.1 Stabilising jobs
The pandemic slowed down the global economy and countries were forced to respond to declining demand. To reduce job losses and unemployment, job retention (JR) schemes were implemented in most OECD countries, including the Nordic countries. The differences in design ranged from short-time work schemes (STW) and furlough to wage subsidies. While STW schemes subsidise hours not worked as a partial unemployment benefit and furlough typically implies a (full) temporary layoff with unemployment benefit receipt, wage subsidies to employers (WS) can also be used to top up the earning of workers on reduced hours, although they are typically assessed against turnover or sales figures of the companies involved (OECD 2021e). Countries also differ regarding the maximum duration of STW, the maximum reduction of working time allowed and the amount of the subsidy to workers and companies. Similar differences can be observed within wage subsidy systems, as they were introduced on a primarily temporary basis during the crisis. It should be noted that STW or furlough (temporary layoff) schemes were already in place in Denmark, Finland and Norway, even before the Great Recession. However, there was no STW scheme in place in either Sweden or Iceland before or during the Global Recession (Cahuc 2019, ILO 2012). Sweden introduced an STW scheme in 2014, while Iceland adopted its first short-time work scheme during the COVID-19 pandemic (Table 4) (EMCC 2021, OECD 2020).
Table 4 Countries’ job retention schemes
| Country | Pre-existing STW | Increased acces and coverage | Increased benefit generosity | Increased access for non-standard workers | New STW |
| Denmark | • | • | • | ||
| Finland | • | • | • | • | |
| Iceland | • | ||||
| Norway | • | • | • | ||
| Sweden | • | • | • | ||
| Germany | • | • | • | • |
There were several further differences between job retention schemes in the Nordic countries. First, Sweden implemented a temporary crisis-related expansion of its STW scheme, allowing for up to 80 percent of hours not worked at the more acute phase of the crisis in early summer 2020 and gradually phased this model out afterwards (Hensvik & Skans 2020, Berglund 2021). Denmark, in contrast, implemented a dual model with a temporary crisis-related STW scheme that complemented the existing and extended, part-time furlough system. In the Danish case, tripartite agreements were of particular importance (Larsen & Ilsoe 2021). In Finland, the existing furlough system was made more flexible in response to the pressure generated by the pandemic, along with more generous unemployment benefit rules (Sippola 2021, Greve et al. 2021). Similar steps were taken with regard to the Norwegian furlough system that was complemented by a wage subsidy (Svalund 2021). Finally, Iceland, the only Nordic country without a permanent STW model, introduced a new STW scheme during the crisis (OECD 2021).
Overall, however, the use of job retention schemes in the Nordic countries was lower than the OECD average. When observing the shares of dependent employment in a short-time work scheme, Germany reached its peak in April/May 2020, at around 15 percent (with some other EU member states exhibiting even higher proportions at the time). By September 2020, this figure had subsided again to just above 5 percent, increasing to 8 percent in February/March of 2021. Meanwhile, Denmark, Sweden and Norway peaked at approximately 10 percent. Denmark and Norway had returned to well below 5 percent by September 2020. While the OECD average hovered at around 7 percent between autumn 2020 and spring of 2021, the Nordic countries could, overall, report their proportion of job retention schemes at below 3 percent of dependent employment for spring 2021 (Figure 8).
Figure 8 Job retention schemes, 2020–2021
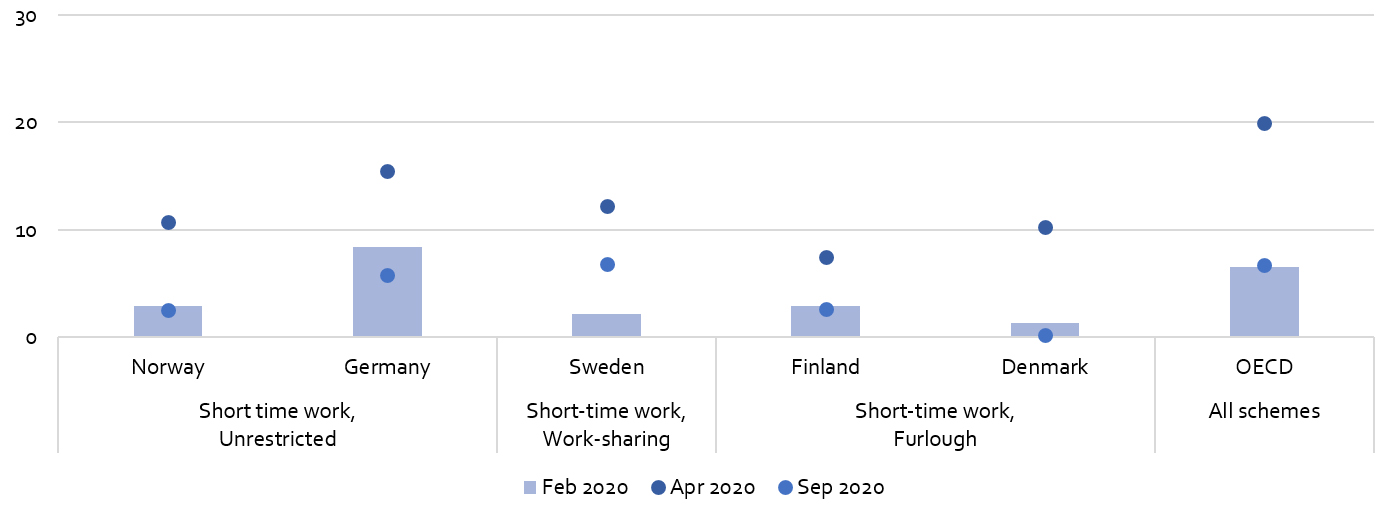
Job retention schemes can help alleviate the temporary disruption of economic activity. To achieve this effectively, they must be timely, targeted and temporary so as to minimise unintended negative effects on adjustments within companies and support job creation in later phases of the crisis and during the recovery (OECD 2021g). Even though most Nordic countries had considerable experience of JR schemes from before the Great Recession, interpreting the lessons from that crisis has not always been so straightforward. The nature of the crisis was noticeably different this time around. The Great Recession mainly affected the manufacturing sector, while the COVID-19 pandemic affected a much broader swathe of sectors. However, disentangling which sectors will continue to shrink (or grow) after the pandemic is tricky. Thus, the phasing out of job retention schemes depends on observing sectoral developments closely and evaluating whether the crisis is either temporary or systemic in the long term. The initial positive effects of STW on employment can become negative in the long run, so support measures should instead be reallocated to mobility support and retraining within the labour market, when STWs are in place for an extended duration in some companies and sectors, while labour shortages arise elsewhere in the economy.
3.2 Stabilising income
Despite the introduction of job retention schemes, some workers became unemployed during the pandemic. Many countries reacted by extending the amount, coverage and duration of benefits for non-standard workers while lowering job search requirements connected to both UI and minimum income support schemes (Greve et al. 2021). The self-employed in Europe were often not covered by UI, and as a response, temporary ad hoc non-contributory assistance schemes were implemented to support the self-employed affected by income losses due to the disruption of their activities. Denmark, Finland and Sweden eased the conditions for access to unemployment benefit for the self-employed during the pandemic, as this group is typically only insured on a voluntary basis in the Nordic countries. These measures included, in particular, less strict requirements regarding periods of business closure and reopening (Spasova et al. 2021).
Policies providing income replacement are not only beneficial to the individual but also work as an automatic stabiliser for the economy. The combination of tax and benefit systems in a given country work together to stabilise income. Dolls and Peichl (2019) calculated a stabilisation coefficient to compare the changes and scale of the stabilisation effect for the period 2007–2014. Of the Nordic countries, only Denmark, Sweden and Finland were included in their observations. The calculated stabilisation coefficient was larger in Germany than in any of these three countries. Denmark’s coefficient is closest to Germany, followed by Finland and Sweden, respectively, forming the end of our small sample. Overall, the Nordic countries have for a long time ranked above the EU average due to the income stabilisation effect achieved by their tax and benefit systems. During the crisis, in line with a broader tendency across many European countries, the Nordic countries eased benefit requirements for unemployment insurance and extended the coverage and amount of those benefits. Combined with ad hoc measures for non-insured people, this should have noticeably increased the redistributive role of the welfare state both in the EU and in the Nordic countries (see also Greve et al. 2021, Baptista et al. 2021).
3.3 Policies to support labour market access and mobility
An important element for tackling the economic impact was the activation of unemployed people through the provision of unemployment insurance. Following increased and permissive access to benefit receipt during the acute crisis, active labour market policies (ALMP) are vital in encouraging labour market recovery from the COVID-19 crisis. These policies help retrain workers or provide hiring and training incentives. If designed properly, these policies prepare for a recovery by using the time available during the period of low labour demand, e.g., by introducing training measures that help workers adapt to a changing environment (Card et al. 2018). Many countries responded to the COVID-19 crisis by adjusting their budget for ALMP. Iceland, Norway and Sweden increased their budgets and hired additional PES staff in 2020, reallocated staff and planned a further staff increase in 2021. Other changes to ALMP were adjustments to training programs in all five countries, Sweden again being an outlier in this respect. Finland, Iceland and Sweden added to, or adjusted, their employment incentives (here we refer primarily to hiring and wage subsidies schemes). Iceland, Sweden and Norway also reduced non-wage labour costs. According to OECD sources, Iceland was the only country that implemented public sector job creation, while only Sweden used start-up incentives in their labour market measures (OECD 2021h).
Table 5 Changes to active labour market measures in response to the COVID-19 crisis
| Adjustments to classroom-based training | Adjustments to on-the-job training | Employment incentives | Reductions in non-wage labour costs | Public sector direct job creation | Start-up incentives | |
| Denmark | ** | ** | — | — | — | — |
| Finland | *** | *** | *** | — | — | — |
| Iceland | *** | *** | *** | ** | *** | — |
| Norway | *** | *** | — | ** | — | — |
| Sweden | * | — | *** | ** | — | *** |
| Germany | ** | * | — | — | — | — |
Source: OECD (2021h).
However, as the OECD points out, those groups that were most heavily impacted by the COVID-19 crisis tended to have fewer contacts with PES during the pandemic. This is particularly the case for young unemployed people who availed of PES much less than other age cohorts. In Europe, only 34 percent of the unemployed in the age group 15–24 years contacted the PES to find work, compared to an average of 41 percent among all age groups. Fewer than 15 percent of unemployed young people contacted the PES to find work in Denmark and Iceland. In addition, in Iceland, this share dropped by 13 and 6 percentage points, respectively, between 2019 and 2020 (OECD (2021g).
As young people between the ages of 15 and 29 were strongly affected by the adverse labour market and social implications of the COVID-19 crisis, youth unemployment rose sharply at the onset of the pandemic and has remained above pre‑crisis levels in almost all OECD countries. Job retention schemes were widely available, as we have discussed, but they can hardly be considered a crucial instrument in supporting labour market entrants, with the possible exception of those on apprenticeship contracts. Therefore, early intervention through training support schemes and additional pathways to apprenticeships is potentially the best way to prevent the long-term scarring effects on young people’s labour market outcomes. Countries with effective ALMP and training systems are in a stronger position to avoid the massive exclusion of young people from employment. In this context, the Nordic countries supported young people through several policies targeting young labour market entrants (Table 6).
Table 6 Youth policies
| Youth strategies | Income support measures | Hiring subsidies | Work-based learning opportunities & apprenticeships | Strengthening employment services | |
| Denmark | • | • | • | ||
| Finland | • | • | • | ||
| Iceland | • | • | |||
| Norway | • | • | • | • | |
| Sweden | • | • | • | • | |
| Germany | • | • | • | • |
All five countries provided emergency and additional income support and promoted work-based learning opportunities and apprenticeships. Finland, Norway and Sweden had youth strategies to guide cross-sectoral and employment policies. Denmark and Norway strengthened the employment services for young people while only Sweden offered hiring subsidies to promote the employment of young people (OECD 2021i). One notable scheme was the support provided for summer jobs in Sweden (Hensvik & Skans 2020).
4 Conclusion and perspectives
We began our review with an overview of the pandemic situation as it developed in the Nordic countries and examined the economic impact of the crisis before providing a structured overview of the conditions and policy responses in the Nordic countries. Based on the evidence of existing welfare states and labour market institutions before the crisis, combined with the fiscal situation at the outset of the crisis, it seems reasonable to argue that the Nordic countries had an advantageous starting point for managing the economic and social impact of the crisis. All in all, the measures adopted were in line with the broader patterns observed across other countries, with particular attention paid to discretionary action to close gaps and reinforce policies such as job retention schemes, income support for non-insured persons or in the area of vocational training for young people. At first glance, while this seems an appropriate reaction, only further studies can furnish evidence of the long-term impact of both the crisis and crisis-response policies (or institutions, in general) on employment biographies.
The German IAB uses a European Labour Market Barometer to gauge the situation of the labour market in Europe. The latest data from Iceland and Denmark show a barometer score of 105 for Denmark (good) and a 95 score for Iceland (poor). Overall, for Europe, the latest score from 22 January was 101.8 (neutral) (IAB 2022). The OECD Economic Outlook from December 2021 expects government budget balances in the Nordic countries to develop positively. For the financial balance in percent of GDP, Denmark is estimated to have a small surplus, Sweden and Norway are predicted to have a marginal deficit, Iceland a high deficit approximately of -8 percent (of GDP) and Finland a deficit of -2 percent, in 2022. For 2023, the Nordic countries are expected to recover close to 0, with Denmark foremost and Finland and Iceland lagging behind at -1 percent and -4 percent, respectively (OECD 2021k). As the fiscal space shrinks, the policy space also becomes more limited, and more efficient targeting of the support measures will then become crucial for fiscal sustainability (IMF 2022a). The ILO World Employment and Social Outlook surveyed the pandemic development and finds that the use of employment retention schemes and reduction in working hours helped Europe cope with the crisis impact on the labour market. The ILO report also mentions the shortage of components and supply chain disruptions that affected some industries in their recovery (ILO 2022). Nonetheless, unemployment rates are projected to return to their pre-pandemic levels by 2022 for Northern, Southern and Western Europe, in line with the OECD Employment Outlook (2021); an expected return or close approximation to pre-crisis levels of both employment and unemployment for many European countries, including the Nordic Region, in 2022. The ILO report cautions against a possible rise in inequality, with some workers being less affected by the pandemic and governments cutting back on spending in the near future (ILO 2022). One of the groups most affected by the pandemic are the young, and many structural challenges remain that could lead to scarring due to delayed labour market entry, longer spells of unemployment and similar, which in turn may negatively affect the earning prospects of young people. However, the 2022 European Economic Forecast offers a slightly different outlook for some of the countries we have observed, based on country reports from Denmark, Finland, Sweden and Germany. Denmark is overall pictured as having a robust recovery and growth for the economy and the labour market. Finland also obtained a positive review. The supply chain disruptions are attributed to the slowdown of the growth in Sweden, but the strong labour market and fiscal support are expected to help with the private consumption. Germany also suffered due to the supply chain issues (European Commission 2022). With the advent of the Russian-Ukrainian war since February 24th, forecasts have been calibrated to the uncertainties stemming from the impact of sanctions and the expected changes to trade (IMF 2022b, OECD 2022a, ECB 2022), eventually bringing about another severe global crisis and recession, putting the recovery from COVID-19 to a halt.
Taking all these factors into consideration, it is unclear how rapidly or easily we will return to pre-crisis normality, as structural shifts due to ongoing technological innovations and changes in global markets continue to exert influence, combined with demographic change and the need to decarbonise the economies. In the Nordic countries, maintaining a high level of labour market attachment and productive employment is a core pillar of the socio-economic model: ‘social investment’ policies require sufficient resources, and the continual generation of funds for social protection, active labour market policies, education and training as well as research and innovation, to name just some crucial policy areas that must be addressed on an ongoing basis. The Nordic countries can be seen as forerunners in these productivity- and equality-enhancing social investment policies (Eichhorst et al. 2020, Thelen 2021). In fact, they have already moved into more automation-resistant work than most other developed economies due to the high emphasis on skill formation, innovation and digital infrastructure, as well as a strongly developed care and education sector. Nonetheless, several lessons can be drawn from the reaction to the COVID-19 pandemic, as it has unfolded in those countries. First, it is important to close existing gaps in social protection, particularly in the area of social insurance, for those typically not fully covered, such as the self-employed, through appropriate reforms (see Schoukens and Weber 2020, for example). This would reduce the need to react on an ad hoc basis when a crisis arises and potentially encourage hybrid careers as status shifts in employment would have fewer consequences for benefit entitlements. Second, to ensure labour market policies resilience, it may be important to re-evaluate the links between job retention schemes on the one hand and mobility-oriented policies such as hiring incentives or retraining support more systematically, taking the experiences of the recent crisis into account. The crucial design feature will be to establish an agreed juncture of transition from job stabilisation to mobility and adaptation. Ideally, this would also include a sectoral or regional perspective. It will also be important to clarify responsibilities regarding co-funding by the public sector and employers in that context. If reskilling on a massive scale is called for, because a return to existing jobs in existing companies after the crisis may not be viable, a negotiated solution involving governments and the social partners is probably the best approach. Again, the Nordic countries appear to have the necessary social and economic policies and experience to tackle these and similar challenges successfully, a finding basically also in line with the latest background report comparing the Swedish measures with its the crisis responses undertake by its Nordic neighbours Denmark, Finland and Norway (Andersen et al. 2022).
References
Andersen, T.M., Holden, S. & Honkapohja, S. (2022). Economic consequences of the pandemic – the Nordic countries. Stockholm, Sweden: SOU. Available at: https://coronakommissionen.com/wp-content/uploads/2022/02/underlagsrapport-economic-consequences-of-the-pandemic_the-nordic-countries.pdf.
Baptista, I., Fronteddu, B., Ghailani, D., Marlier, E., Peña-Casas, R., Regazzoni, P., Sabato, S. & Spasova, S. (2021). Social protection and inclusion policy responses to the COVID-19 crisis. An analysis of policies in 35 countries. Brussels, Belgium: European Social Policy Network (ESPN), European Commission.
Berglund, T. (2021). Job-retention schemes in Europe: Sweden. Brussels, Belgium: ETUI.
Cahuc, P. (2019). Short-time work compensation schemes and employment. Bonn, Germany: IZA World of Labor.
Card, D., Kluve, J. & Weber, A. (2018). What works? A meta-analysis of recent active labor market program evaluations. Journal of the European Economic Association, 16(3), 894–931.
Dolls, M. & Peichl, A. (2019). Auf dem Weg zur Sozialunion? München, Germany: ifo Institut.
Eichhorst, W., Hemerijck, A. & Scalise, G. (2020). Welfare states, labor markets, social investment and the digital transformation. (IZA Discussion Paper no. 13 391). Bonn, Germany: IZA. Retrieved from: http://dx.doi.org/10.2139/ssrn.3631602.
ECB (2022). ECB staff macroeconomic projections for the euro area. Frankfurt, Germany: European Central Bank. Available at: https://www.ecb.europa.eu/pub/projections/html/ecb.projections202203_ecbstaff~44f998dfd7.en.html#toc2.
ECDC (2021). Data on 14-day notification rate of new COVID-19 cases and deaths. Stockholm, Sweden: ECDC. Available at: https://www.ecdc.europa.eu/en/publications-data/data-national-14-day-notification-rate-covid-19.
EMCC (2021). Short-time working allowance. Dublin, Ireland: EMCC. Available at: https://www.eurofound.europa.eu/observatories/emcc/erm/support-instrument/short-time-work-allowance.
European Commission (2020a). Telework in the EU before and after the COVID-19: where we were, where we head to. European Union: European Commission.
European Commission (2020b). DESI by components – Digital Scoreboard. European Union: European Commission. Available at: https://digital-agenda-data.eu/.
European Commission (2022). European economic forecast – winter 2022. (European economy Institutional paper 169) Lux: European Commission. Available at: https://ec.europa.eu/info/sites/default/files/economy-finance/ip169_en.pdf.
Eurostat (2021a). Individuals' level of digital skills [ISOC_SK_DSKL_I]. (Data source). Available at: https://appsso.eurostat.ec.europa.eu/nui/show.do?dataset=isoc_sk_dskl_i&lang=en.
Eurostat (2021b). Employed persons working from home [LFSA_EHOMP]. (Data source). Available at: https://appsso.eurostat.ec.europa.eu/nui/submitViewTableAction.do.
Greve, B., Blomquist, P., Hvinden, B., & van Gerven, M. (2021). Nordic welfare states still – standing or changed by the COVID-19 crisis? Social policy & administration, 55(2).
Fana, M., Fernández-Macias, E., Milasi, S., Napierala, J., Vázquez, I. G. (2020). Telework, work organisation and job quality during the COVID-19 crisis: a qualitative study. (JRC Working Papers Series on Labour, Education and Technology, no. 2020/11). Seville, Spain: European Commission, Joint Research Centre.
Hale, T., Angrist, N., Goldszmidt, R., Kira, B., Petherick, A., Phillips, T., Webster, S., Cameron-Blake, E., Hallas, L., Majumdar, S. & Tatlow, H. (2021). A global panel database of pandemic policies (Oxford COVID-19 government response tracker). Nature Human Behaviour, 5, 529–538.
Hanson, C., Luedtke, S., Mayhew, S., Mounier-Jack, S., Spicer, N. & Sörensen, J. S. (2021). National health governance, science and the media: drivers of COVID-19 responses in Germany, Sweden and the UK in 2020. BMJ Global Health.
Hensvik, L. & Skans, O.N. (2020). European Labour Market Barometer. Nürnberg, Germany: Institute for Employment Research. Retrieved from: https://www.iab.de/en/daten/european-labour-market-barometer.aspx.
ILO (2022). World employment and social outlook: Trends 2022. Geneva, Switzerland: International Labour Office. Retrieved from: https://www.ilo.org/global/research/global-reports/weso/trends2022/WCMS_834081/lang--en/index.htm.
ILO (2012). Iceland – working time – 2011. Geneva, Switzerland: International Labour Office. Retrieved from: https://www.ilo.org/dyn/travail/travmain.sectionReport1?p_lang=en&p_structure=2&p_year=2011&p_start=1&p_increment=10&p_sc_id=1001&p_countries=MZ&p_countries=IS&p_print=Y.
ILO (2021). COVID-19 and the world of work – Country policy responses. Geneva, Switzerland: International Labour Office. Retrieved from: https://www.ilo.org/global/topics/coronavirus/regional-country/country-responses/lang--en/index.htm.
IMF (2022a). World economic outlook update – Rising caseloads, a disrupted recovery, and higher inflation. Washington, DC: International Monetary Fund. Retrieved from: https://www.imf.org/en/Publications/WEO/Issues/2022/01/25/world-economic-outlook-update-january-2022.
IMF (2022b). IMF staff statement on the economic impact of war in Ukraine. Washington, DC: International Monetary Fund. Retrieved from: https://www.imf.org/en/News/Articles/2022/03/05/pr2261-imf-staff-statement-on-the-economic-impact-of-war-in-ukraine.
Ker, D., Montagnier, P. & Spiezia, V. (2021). Measuring telework in the COVID-19 pandemic. OECD Digital Economy Papers, No. 314 Paris, France: OECD Publishing.
Knutsen, O.P. (Ed.) (2017). The Nordic models in political science: challenged, but still viable? Bergen, Norway: Fagbokforlaget.
Kuhnle, S. (2019). Welfare states with Nordic characteristics. In Jing T., Kuhnle S., Pan Y. & Chen S. (Eds.) Aging welfare and social policy. International perspectives on aging, vol 20. Springer, Cham.
Larsen, T.P. & Ilsøe, A. (2021). Job-retention schemes in Europe: Denmark. Brussels, Belgium: ETUI.
OECD (2020a). Job retention schemes during the covid-19 lockdown and beyond. Available at: https://www.oecd.org/coronavirus/policy-responses/job-retention-schemes-during-the-covid-19-lockdown-and-beyond-0853ba1d/.
OECD (2020b). OECD Economic Outlook, Volume 2020 Issue 2, OECD Publishing, Paris, https://doi.org/10.1787/39a88ab1-en.
OECD (2021a). Quarterly GDP (indicator). doi: 10.1787/b86d1fc8-en (Accessed on 20 December 2021).
OECD (2021b). Unemployment rate (indicator). doi: 10.1787/52570002-en (Accessed on 18 December 2021).
OECD (2021c). Hours worked (indicator). doi: 10.1787/47be1c78-en (Accessed on 18 December 2021).
OECD (2021d). General government debt (indicator). doi: 10.1787/a0528cc2-en (Accessed on 18 December 2021).
OECD (2021e). General government financial wealth (indicator). doi: 10.1787/325ddad1-en (Accessed on 18 December 2021).
OECD (2021f). General government deficit (indicator). doi: 10.1787/77079edb-en (Accessed on 18 December 2021).
OECD (2021g). OECD Employment Outlook 2021: Navigating the COVID-19 Crisis and Recovery, OECD Publishing, Paris, https://doi.org/10.1787/5a700c4b-en.
OECD (2021h). Active labour market policy measures to mitigate the rise in (long-term) unemployment – A summary of country responses to the OECD-EC questionnaire. Available at: https://www.oecd.org/els/emp/almpmeasurescovid19.pdf.
OECD (2021i). What have countries done to support young people in the COVID-19 crisis? Available at: https://www.oecd.org/coronavirus/policy-responses/what-have-countries-done-to-support-young-people-in-the-covid-19-crisis-ac9f056c/.
OECD (2021j). Teleworking in the COVID-19 pandemic: Trends and prospects, access: Teleworking in the COVID-19 pandemic: Trends and prospects (oecd.org)
OECD (2021k). OECD Economic Outlook, Volume 2021 Issue 2, OECD Publishing, Paris, https://doi.org/10.1787/66c5ac2c-en.
OECD (2022a). OECD Economic Outlook, Interim Report March 2022: Economic and Social Impacts and Policy Implications of the War in Ukraine. OECD Publishing, Paris, https://doi.org/10.1787/4181d61b-en.
OECD (2022b). Benefits in unemployment, share of previous income (indicator). doi: 10.1787/0cc0d0e5-en (Accessed on 17 February 2022).
Predotova, K. & Vargas Llave, O. (2021). Workers want to telework but long working hours, isolation and inadequate equipment must be tackled. Dublin, Ireland: Eurofound.
Saunes, I. S., Vrangbaek, K, Byrkjeflot, H., Jervelund, S. S., Birk, H. O., Tynkkynen, L.-K., Keskimäki, I., Sigurgeird.ttir, S., Janlöv, N., Ramsberg, J., Hernandez-Quevedo, C., Merkur, S., Sagan, A., & Karanikolos, M. (2021). Nordic responses to COVID-19: Governance and policy measures in the early phases of the pandemic. Health Policy.
Schoukens, P., & Weber, E. (2020). Unemployment insurance for the self-employed: a way forward post-corona (IAB-Discussion Paper, no. 32/2020). Nürnberg, Germany: Institute for Employment Research.
Solstad, S. (2021). The pandemic’s true death toll. (The economist, issue 20, 2021). UK: The Economist. Available at: https://www.economist.com/graphic-detail/coronavirus-excess-deaths-estimates.
Spasova, S., Ghailani, D., Sabato, S. C., Coster, S., Fronteddu, B., & Vanhercke, B. (2021). Non-standard workers and the self-employed in the EU: social protection during the Covid-19 pandemic. Brussels, Belgium: ETUI.
Statistics Iceland (2022). Labour force survey – quarterly figures. Reykjav’ik, Iceland: Statistics Iceland. Available at: https://px.hagstofa.is/pxen/pxweb/en/Samfelag/Samfelag__vinnumarkadur__vinnumarkadsrannsokn__2_arsfjordungstolur/?rxid=0c013977-7506-4b83-9f21-4ef29b6fb0cb
Svalund, J. (2021). Job-retention schemes in Europe: Norway. Brussels, Belgium: ETUI.
Strang, J. (2020). Why do the Nordic countries react differently to the covid-19 crisis? Aarhus, Denmark: nordics.info. Available at: https://nordics.info/show/artikel/the-nordic-countries-react-differently-to-the-covid-19-crisis/.
Thelen, K. (2021). Transitions to the Knowledge Economy in Germany, Sweden and the Netherlands, in: Growth and Welfare in Advanced Capitalist Economies: How Have Growth Regimes Evolved? Oxford University Press, DOI: 10.1093/oso/9780198866176.003.0006.
Comment on W. Eichhorst & J. Brunner: Labour market and social policy responses to the COVID-19 pandemic in the Nordic countries: A view from the outside
The article by Eichhorst and Brunner looks at the public policy responses to the COVID-19 pandemic adopted in the Nordic countries and the resulting impacts on major macroeconomic variables, in particular the labour market. The authors have assembled an extremely useful collection of data on certain key variables in the different Nordic countries, including the health impacts of the pandemic, their respective policy responses, macro-economic outcomes and the ability of their economies to recover from the disruption. They have then compared the Nordic data with similar statistics for Germany and the EU.
One of the authors’ major findings is that in terms of GDP and the labour market, the Nordic countries have so far done somewhat better (or at least no worse) than the EU average. Eichhorst and Brunner hypothesise that three features of the Nordic countries in particular compared to the EU 27 may have played a crucial role:
- A higher degree of digitalisation and teleworking capacity.
- Stronger public finances before the pandemic.
- More advanced public welfare structures.
I find these hypotheses reasonable and certainly do not wish to object to them. However, as plausible as they are, it may be a good idea to be a bit more circumspect.
The first obvious question is whether the slight differences in macro-economic developments between the Nordic countries and the EU detected during the two years of COVID-19 are statistically significant. Macro-economic variables are, as is well-known, subject to seemingly random noise and are also calculated with considerable margins of error. It seems prudent, therefore, to ask whether there is, in reality, any difference to explain. A simple statistical test might answer this question.
The second question concerns the state of the business cycle in the two groups of countries. COVID-19 impacted economies that were already evolving in a certain direction. If the Nordic economies were already heading in a more favourable direction than those of the EU, the macro-economic outcomes observed since COVID-19 may have nothing to do with a greater ability of the Nordic countries to deal with the pandemic. Indeed, taking the initial position on the business cycle into account, it may even be the case that the EU countries have managed to deal with COVID-19 better than the Nordic countries.
The third question concerns policy responses to the COVID-19 pandemic in the Nordic countries compared to those in the EU. These responses seem to have been similar but by no means identical. Taking for granted that the policy responses have had an impact on the ensuing macro-economic outcomes, it seems only natural to begin the search for the explanation for differences in outcomes in the different policy responses.
These questions are not meant to detract from the very reasonable hypotheses proposed by Eichhorst and Brunner. They may well be true. However, I would warn against taking them for granted since there are many equally plausible alternative hypotheses, some of which I have pointed out above.
An interesting feature of the policy responses to COVID-19 both in the EU and the Nordic countries according to Eichhorst and Brunner, and, I believe, around the world, is that they consist of centrally imposed restrictions such as limited business hours and closures, travel restrictions, social distance requirements, compulsory face coverings, vaccination requirements and so on. These types of restrictions and commands go against the generally accepted economic principles of efficient resource allocation and according to which quantitative restrictions are found seriously wanting (see, e.g. Layard and Walters 1978). As a result, there is ample reason to doubt the economic and, therefore, social appropriateness of these policy responses.
This important aspect of the matter is not discussed by Eichhorst and Brunner, understandably so since their primary concern was to collect and present comparative data about the impact of COVID-19. Nevertheless, given the social importance of economically appropriate policy responses, I would like to use the remaining lines to touch upon the issue.
Standard economic theory warns against managing by command or quantity constraints (see virtually every microeconomic textbook, e.g., Layard and Walters 1978, Varian 1992). The fundamental reason is that individuals differ in terms of their preferences (utility functions) and both individuals and companies in terms of their circumstances. It follows that restrictions which may be nonbinding and therefore agreeable to some may be extremely costly to others. For this reason, a far superior method of management is to operate via markets by setting prices to which the various economic entities subsequently adjust their behaviour. The appropriate market prices in this context are the marginal costs or benefits each entity’s behaviour imposes on others.
Transmission of the Covid virus is a typical external effect. Economic theory has a well-developed theory about how to deal efficiently with external effects (see, e.g., Pigou 1920, Cornes and Sandler 1996). The essence of this theory is that behaviour generating positive external effects should receive a subsidy equal to the external benefits, while behaviour generating negative external effects should be taxed) at a rate equal to the negative externality. Thus, in the context of COVID-19, engaging in preventive actions such as undergoing vaccinations, donning masks and maintaining proper distance from others should be rewarded with the appropriate subsidy while behaviour facilitating the transmission of the virus should result in a payment of the appropriate fee.
In other words, standard economic theory recommends qualitatively different policy responses to COVID-19 from those that have actually been adopted. While I do not wish to downplay the difficulties in setting the appropriate prices (i.e., subsidies and/or taxes) for the COVID-19 externalities and ensuring their payment, I believe that the associated expenses are dwarfed by the huge cost of employing a fundamentally incorrect methodology. Moreover, it is important to realise that setting the best possible constraints, which by their very nature can never be efficient, requires very much the same information as that needed to set the appropriate price.
The social cost of the fundamentally erroneous policy responses to the COVID-19 pandemic is probably very high. A good part of this cost is manifested as reduced utility of individuals, which is not reflected in monetary transactions and, therefore, does not show up directly in the national accounts. It may affect current and future behaviour, however, and thus indirectly the evolution of economy and society. Another part of the cost of the erroneous policy responses is borne by producers and, therefore, shows up in the national accounts. How large a part of the substantial reduction in GDP resulting from COVID-19 can be traced to these policy errors is anybody’s guess.
References
Cornes, R. & Sandler, T. (1996). The Theory of Externalities. Cambridge, UK: Cambridge University Press.
Layard, R. & Walters, A. (1978). Microeconomic Theory. New York, NY: McGraw-Hill.
Pigou, A. (1920). Economics of Welfare. London, UK: Macmillan.
Varian, H.R. (1992). Microeconomic Analysis (3rd ed.). New York, NY: Norton and Company.

Iceland’s fight against COVID-19 – An economic perspective
Abstract
The policy response to the Covid-19 pandemic in Iceland consisted of government mandated social distancing, testing at the international airport, and a combination of fiscal and monetary policies designed to reduce the severity of the economic downturn and limit the scarring effects caused by the pandemic. Industry lobbying served to inflate the perceived importance of tourism for the economy and influenced the government to relax infection controls after each new wave of the pandemic in a stop-go fashion. The government did not give much attention to arguments about the true economic importance of tourism and the crucial role played by externalities in a pandemic. Integration of epidemiology and economic analysis in policy-making could improve the policy response in future pandemics.
Keywords: Pandemic, infection controls, public policy, lobbying.
JEL codes: E65, I18.
1 Introduction
The economic problems caused by the COVID-19 pandemic have provided many valuable lessons. In this paper, we describe some practical aspects of the interaction between epidemiology, economic interests and politics in Iceland during the pandemic. In doing so, we explain how the many trade-offs between concerns about the health of the people and the economic interests of the nation were resolved.
As in many other countries, government policy in Iceland was divided between decisions on how to mitigate the spread of the virus through various social distancing measures on the one hand and conventional fiscal and monetary policy on the other. While economic analysis underpinned the latter, decisions on disease control were made by the Chief Epidemiologist and the Minister of Health without any formal or rigorous economic analysis. We argue that what was lacking in Iceland, as in so many other countries, was the application of economic tools, such as cost-benefit analysis, to decision-making on public health. Instead, political arguments took on a life of their own. A debate developed between those who stressed the importance of health (reduction of infection and mortality rates) and those who stressed the personal freedoms and business interests that saw government-imposed social distancing measures as a threat. What was missing was a cost-benefit analysis of the options, which would have included how to value lives and the trade-off between lives and livelihoods, taking into account uncertainty.
Due to this lack of formal economic analysis, an erroneous perception of the tourism industry’s economic importance apparently affected the government’s decision-making, and lobbyists managed to exacerbate this misconception. The result in Iceland, as in many other countries, was a stop-and-go cycle of measures aimed at protecting public health. The removal of mitigation measures at the end of each wave of the pandemic helped trigger the next wave, which then prompted the government to impose new measures. If the costs of the measures are increasing in intensity – i.e., if it is deemed more painful to close schools in a severe lockdown than to close restaurants early and ban large public events – the resulting stop-go cycle cuts into the overall welfare of the nation.
The interaction between industry lobbyists, epidemiologists and politicians provided interesting insights that transcend this crisis, and these interactions were highly visible in Iceland, which has a population of just over 370 000. We start by reviewing some of the academic literature before describing the course of the pandemic and its economic impact.
2 Literature
There is a burgeoning literature on the economics of pandemics, including the multiple trade-offs faced by policy makers.[1]Padhan and Prabheesh (2021) survey the economics of the coronavirus pandemic. Some of these involve trade-offs between public health and economic activity, while others involve trade-offs between the economic interests of different industries and interest groups. The combined effect of these is to complicate policy making.
Several recent papers have incorporated economic trade-offs between infections and output within the SIR framework.[2]Such as Alvarez et al. (2020), Jones et al. (2020) and Farboodi et al. (2020). The COVID-19 pandemic has affected older people more than the young and those with pre-existing conditions more than those without, although it has also hit the healthy middle-aged as well. Glover et al. (2020) show how social distancing involves a trade-off between the welfare of the older population, who benefit through lower mortality to the detriment of the young, who lose out due to reduced output and consumption. Optimal social distancing and redistribution policies interact and reflect a compromise between the interests of the different groups. Acemoglu et al. (2020) consider differences in infection, hospitalisation, and fatality rates between the young, middle-aged, and older population groups. Their policy recommendation is to impose different levels of lockdown across different age groups, such as imposing stricter lockdowns on the most vulnerable group (older people) and limiting interactions between them and other less vulnerable groups.
There is also a trade-off between different causes of distress and mortality. Social distancing measures such as school closures may exacerbate mental health problems, while their removal might increase deaths and long-term health problems caused by the virus. The loss of income caused by shutting down businesses and industries creates economic, social, and health problems for people who become unemployed or own businesses that go bankrupt. Hausmann and Schetter (2020) show that while it may be optimal for rich countries to sacrifice output in order to lower mortality due to infections, this may not be the case in poorer ones, where social distancing may cause an increase in deaths through economic deprivation.
The response of New Zealand and Australia to the pandemic also highlighted a trade-off between different segments of the service industry; that is, between those areas that cater to foreign tourists and those that service the local population, including schools and general health care. These countries, in effect, closed their borders, which protected the domestic service industry but shut down the part of the tourism industry that catered to foreign tourists. This trade-off was visible and, in Iceland’s case, involved much public policy debate on whether to introduce mandatory testing at the international airport. Such testing was eventually introduced despite the tourism industry’s vehement protests.
Gordon et al. (2021) explore the effect of border controls on the spread of COVID-19 in the Nordic countries during the first wave in spring 2020 and find that the imposition of full international travel restrictions reduced infections and deaths in these countries. In three of the Nordic countries, international air border closures began in the middle of March 2020 and continued into the summer, while Sweden kept its borders open until October. The growth in cases flattened off by mid-April in Denmark, Finland and Norway, whereas Sweden experienced a continuous rise in cases. These authors find that Sweden would have had fewer cases and fatalities if it had adopted the air border closures implemented by its Nordic neighbours in the first half of 2020. Conway et al. (2021) also find that such controls would have been useful in Ireland because international travel was the primary source of transmission early in the pandemic.
Social distancing arises naturally in the absence of government mitigation measures when individuals decide to stay at home to avoid being infected. Toxvaerd (2020) derives a model using the SIR epidemiological model in which individuals engage in costly social distancing in order to avoid infection but, as more become infected, they acquire immunity. The model generates equilibrium in social distancing around the peak of the epidemic, which has the effect of flattening the curve of the epidemic and prolonging its duration. A more infectious virus and more severe health consequences of the disease make the curve flatter. The equilibrium does not maximise social welfare because individuals do not internalise the positive externalities deriving from social distancing, i.e., the reduction in the probability of infecting others.
Government measures to increase social distancing become necessary when the peak of the epidemic under non-cooperative but voluntary social distancing exceeds the capacity of the health care system. Many papers focus on disease mitigation measures. Huang (2020) uses a model that measures the relative frequency and geographic distribution of COVID-19 infections and applies it to a panel of daily infections of all counties in the United States. He finds that social distancing lowered the average daily number of infections by 12 percent. Mueller-Langera and Gomez-Herrera (2021) use company data from a large European online labour market to show that online work lowers the economic costs of social distancing. Getaschew (2020) describes the optimisation problem faced by an infection-averse individual, who is confronted by a trade-off between costly social distancing on the one hand and the risk of becoming infected and losing future income on the other. He finds that individuals are more likely to choose social distancing when a disease is more severe and the potential loss of future earnings less severe.
3 Starting with an identity
We can start with the national accounting identity to highlight how the pandemic and related policies changed components of aggregate demand in Iceland,
Y≡C+I+G+X-M
where Y denotes domestic output, C private consumption, I private investment, G government purchases of goods and services, X exports and M imports. Spending by foreign tourists is part of X, and spending by domestic residents on foreign travel is part of M. The pandemic, as well as the border controls, reduced the number of foreign tourists, that is exports, but when Icelanders cut back on travel abroad, imports also fell. In 2019, the tourism industry accounted for over 8 percent of Iceland’s GDP and around 8 percent of total employment. Its share of exports was higher, 35 percent, exceeding the share of fish exports at 19 percent. The perceived economic importance of tourism was used to justify the non-restriction of foreign travel by introducing compulsory testing at the airport and self-isolation after entering the country. However, the effects of the pandemic in the identity are more complicated. Part of the value of tourism exports is created by the importation of goods such as oil, food and wine, which is part of M and needs to be deducted from spending by foreign tourists. In addition, foreign travel also drops, and more residents travel within Iceland instead of going abroad, which makes M fall further.
The effects of the pandemic on the components of domestic output are described in Table 1:
Table 1 The components of output
| 2019 | 2020 | 2021 | ||
| Q1–Q4 | Q1–Q3 | Q1–Q3 | ||
| Consumption | 51 | 50 | 52 | 53 |
| + Investment | 22 | 23 | 28 | 29 |
| + Government purchases | 21 | 20 | 21 | 24 |
| National expenditures | 95 | 93 | 101 | 107 |
| + Exports | 49 | 34 | 34 | 37 |
| Goods | 24 | 22 | 21 | 24 |
| Services | 25 | 12 | 13 | 13 |
| - Imports | -44 | -34 | -35 | -40 |
| Goods | -27 | -23 | -24 | -29 |
| Services | -16 | -10 | -11 | -11 |
| = GDP | 100 | 93 | 100 | 103 |
The first two columns compare the components of demand between 2019 and 2020 at fixed prices, and we have normalised both columns by year-2019 GDP. We find that national expenditures held up while exports fell, and service exports fell by 13 percent as a fraction of year–2019 GDP. However, imports fell by 10 percent, mostly owing to a fall in imported services due to a reduction in Icelanders’ overseas travel. The fact that consumption demand fell very little suggests that consumer spending switched from buying goods and services abroad to buying them at home. The move from spending on foreign travel to buying goods at home is also matched by a switch from local services to goods. Both of these switches affect the components of domestic output.
In the last two columns, the components of demand are compared between the first three quarters of 2020 and the first three quarters of 2021, the last quarter of 2021 not being available at the time of writing. The 2021 values are written as a percentage of the first quarter 2020 until the third quarter 2020 GDP. A comparison of the two columns reveals that there is a recovery in national expenditures but less so in exported goods and services.
The consequences of the pandemic in the national accounting identity reflect rational behaviour by individuals and firms. The pandemic increases the private cost of consuming services at home and of travelling to other countries. Consumers not only have to consider the price of services and compare it to the price of goods, but they must also add to that price the expected loss incurred in the event of infection. This depends on the spread of the virus, the severity of the disease, the health status of the consumer and the individual’s risk aversion. The young and healthy are more likely to want to go out and enjoy services, while the older people, the obese, and the anxious choose to stay at home. However, in making these choices, many will forget to consider the external impact they impose on others if they have been infected by the virus and spread it. In essence, the social cost of consuming services exceeds the private cost.[1]Eichenbaum et al. (2020) derive a model and use it to show that people’s decision to consume less and spend fewer hours working reduces the severity of the epidemic while exacerbating the size of the recession caused by the epidemic. The competitive equilibrium in his model is not socially optimal because of the external effect of infected people not fully internalising the effect of their decisions on the spread of the virus. When the social cost is not considered, the infection rate may overwhelm the capacity of the health care system and increase the mortality rate. Government-imposed social distancing measures will then be necessary, and these will exacerbate the economic depression.
Island economies have the option of testing people who enter the country at borders. Iceland is in the unique position of having only one international airport. This creates another trade-off between more stringent tests at the border to limit the entry of infected individuals on the one hand and social distancing measures within the country to limit the spread of the virus or to lower the R rate of infections in a SIR model on the other. This trade-off creates a choice between the interests of both the section of the tourism industry that caters to foreign tourists and local residents who would like to travel abroad, on the one hand, and the domestic service sector, on the other. Some countries, such as Australia and New Zealand, chose to close their borders in order to encourage a more normal life within the country – i.e., people being able to work and enjoy leisure and consumption – with drastic consequences for the tourism industry. In this context, some would point out that cross-border tourism would have suffered even in the absence of mitigation measures because of the higher private cost of travel.
Footnotes
- ^ Eichenbaum et al. (2020) derive a model and use it to show that people’s decision to consume less and spend fewer hours working reduces the severity of the epidemic while exacerbating the size of the recession caused by the epidemic. The competitive equilibrium in his model is not socially optimal because of the external effect of infected people not fully internalising the effect of their decisions on the spread of the virus.
4 The downturn and policy responses
The objective of the economic policy response to the crisis was to maintain aggregate demand and support the supply-side of the economy by helping businesses survive the pandemic and helping workers in the affected industries. The supply-side response aimed at reducing economic scarring, which would otherwise impede the expected recovery from the crisis.
The central bank responded to the COVID crisis by lowering the policy rate from 2.75 percent to 0.75 percent in several steps. In addition, it lowered its reserve requirement and reduced the banks’ capital requirement to provide more liquidity to the banking system. It then used part of its foreign reserves to prop up the currency. Finally, in a coordinated move with the government, the central bank created money for the commercial banks to lend to companies through a government-guaranteed loan programme. The objective was to help businesses, mostly in tourism and catering, to survive the crisis. The lower interest rates also had the effect of increasing consumers’ disposable income by enabling them to refinance their mortgages at lower rates, which increased house prices and aggregate demand. The higher house prices then helped sustain construction spending.
The government introduced a ‘Kurzarbeit’ scheme, which allowed workers to be employed part-time while receiving part-time unemployment benefits. It subsidised the wages of those who had been given notice of lay-off, effectively subsidising the cost of laying them off and helping businesses survive the pandemic. The finance ministry allowed companies to postpone payments of VAT proceeds and payroll taxes. Workers who were self-isolating received government support. Numerous other initiatives to support municipalities, secondary schools and universities and expenditure was introduced intended to curb domestic violence and protect vulnerable people. The government guaranteed loans to companies in distress. The discretionary spending increase in 2020 and 2021 was equal to 7 percent of 2019 GDP. This is more than in the other Nordic countries but less than in the UK, the US, Canada and New Zealand (Ministry of Finance 2021). In addition, and perhaps most importantly, the automatic stabilisers were allowed to operate in addition to the increase in discretionary spending. The budget deficit was 7.3 percent of GDP in 2020, higher than in the Nordic countries and in Australia (6.6 percent) and New Zealand (0.3 percent) but lower than in the UK (12.2 percent), France (9.2 percent), Italy (9.5 percent) and Spain (11.0 percent).
These actions helped sustain aggregate demand and prevent the collapse of tourism from having an adverse effect on other industries, as well as helping businesses survive the pandemic. The policy also reduced the economic scarring effects on unemployed workers. In this, the combination of fiscal, monetary and social policy proved largely successful.
Despite the offsetting effects of the policy response and the decline in imported tourism, the macroeconomic shock was negative, and real GDP fell by 6.5 percent in 2020. Figure 1 shows real GDP per capita since 1989. The pandemic brought it back to its 2015 level and to the top of the financial boom in 2007. In effect, then, this was no disaster from a macroeconomic point of view, especially given that the factors of production remained intact.
Figure 1 Real GDP per capita (index)
5 Income distribution
The fall in output does not fully describe the economic impact because the recession hit service sector workers disproportionately. Unemployment was 4.4 percent in the first quarter of 2020, then rose to 7.9 percent in the second quarter. It dipped to 7.6 percent in the fourth quarter and remained at 7.9 percent in the second quarter of 2021 before starting to fall, measuring 5.2 percent in August 2021 and ended the year at 4.6 percent. The participation rate did not fall noticeably during the crisis. Thus, while GDP fell less than expected, the blow to tourism affected low-wage workers disproportionately, which could have made the income distribution more unequal.
We use personal income tax return data provided by Statistics Iceland to describe changes in income distribution in 2020.[1]Iceland Revenue and Customs (the tax authority) collected the data and submitted it to Statistics Iceland. In addition to data on income, wealth, and debt, the tax returns contain information on taxpayers’ gender, age, domicile and number of children. They also itemise debt and assets, making it possible to see how much individuals owned (real estate, stocks, savings accounts, etc.) and how much they owed (e.g., mortgages, student loans and consumer debt). However, because stocks and bonds are expressed in nominal value rather than market value, we cannot show the effect of stock price movements on the distribution of income and wealth. The problem applies primarily to the interpretation of changes in net worth for wealthier segments of the population, which own most of the financial assets.
Figure 2 shows the Gini coefficient for disposable income for all taxpayers aged 20–70 since 1989.
Footnotes
- ^ Iceland Revenue and Customs (the tax authority) collected the data and submitted it to Statistics Iceland.
Figure 2 Gini coefficient for disposable income, all taxpayers aged 20–70
Income inequality increased only slightly in 2020, in contrast to the large increase during the financial bubble of 2003–2007, which was driven mostly by an increase in capital income among those in the upper deciles of the income distribution. We cannot see an increase in inequality for the different age groups either. Figures 3a and 3b show changes in the Gini coefficient by age group. A large part of the explanation as to why income distribution did not become more unequal lies in the effective policy response to the crisis and the high unemployment benefit replacement ratio in the low-wage tourism sector.
Figure 3a Gini coefficient for disposable income, different age groups
Figure 3b Gini coefficient for disposable income, different age groups
Figure 4 shows the average pre-tax earnings (wages and income from self-employment) for the two youngest groups, 20–24 and 25–34, the two age groups most represented in the tourism industry. There was no decline in real earnings for these two groups in 2020.
Figure 4 Real annual earnings (average), individuals aged 20–34 (December 2019 prices)
5.1 The recovery
The post-COVID recovery started in late 2020. Real GDP grew by 3.5 percent in the first half of 2021, driven by increased investment and consumption. Tourism exports increased in 2021, and consumption is on the rise, driven by optimism that the worst is over. Consumption of services is rapidly recovering and returned to its pre-pandemic level in summer 2021. Durable consumption expenditures continue to increase, a development that started during the pandemic. Businesses are expecting growing demand. Profits are increasing, and investment is expected to rise this year.
The labour participation rate is currently 1 percent above its pre-pandemic level, and unemployment is also approaching the pre-pandemic level. Wage inflation is running at a rate of 8 percent, price inflation is 5.7 percent, inflation expectations are on the rise and in the current low interest rate environment, asset prices have risen significantly. House prices (homes) rose by 16.4 percent from August 2020 to August 2021, the price of second homes has increased significantly, and the stock market is booming.
Policy is currently being reversed, making it less expansionary. Interest rates have been raised by 125 basis points since early 2021.
6 Comparison with other countries
We compare Iceland to the other Nordic countries, other island economies and several large OECD countries. The island economies are Australia, New Zealand, Japan and South Korea. The inclusion of South Korea is justified by its closed borders with its northern neighbour. In addition, we include the Faroe Islands as representative of other small island economies. We focus on island economies because it should be easier to control their borders, for example, by testing for infections at the border.
Table 2 shows cumulative infections per million of the population, deaths per million, economic growth in 2020 and the share of tourism in GDP before the crisis. We show cumulative infections as of 1 December 2021, before the new Omicron variant took off, and then the latest observation, at the time of writing in January 2022. Our justification for this is that the Omicron variant has turned out to cause less severe symptoms in general, which calls for less stringent social distancing measures.
Comparing Iceland to the other countries shows that the number of infections is lower than in the other Nordic countries apart from Finland, higher than in many of the other island nations, and lower than in the large countries apart from Japan. Similarly, the number of deaths in Iceland is significantly lower than in the other Nordic countries but higher than on the other islands apart from the Faroes and lower than in the large countries, again apart from Japan. In terms of both numbers, Sweden fares particularly poorly. Deaths per million by 1 December 2021 were fifteen times the number in Iceland and seven times the number in neighbouring Norway. The number of infections in Sweden by December was more than twice the number in Iceland and Norway.[1]Lindström (2020) discusses mistakes made by the Swedish authorities in handling the crisis. These include overconfidence in herd immunity, overconfidence in individual responsibility in a pandemic, overconfidence in evidence-based science and failure to coordinate with the WHO and other countries.
Output contracted more in Iceland than in the other Nordic countries and island economies. The COVID-19 recession in 2020 was only deeper in the UK, France, Italy and Spain, the latter three being reliant on tourism and all of them having to impose stricter lockdowns for extended periods of time.
Footnotes
- ^ Lindström (2020) discusses mistakes made by the Swedish authorities in handling the crisis. These include overconfidence in herd immunity, overconfidence in individual responsibility in a pandemic, overconfidence in evidence-based science and failure to coordinate with the WHO and other countries.
Table 2 COVID infections and deaths (per million) and the economic contraction
| Cases, 1 Dec 2021 | Cases, 24 Jan 2022 | Deaths, 1 Dec 2021 | Deaths, 24 Jan 2022 | Growth of real GDP, 2020 (%) | Share of tourism in GDP, 2019 (%) | |
| Nordics | ||||||
| Denmark | 84 732 | 247 395 | 500 | 632 | -2.1 | 8.2 |
| Finland | 33 903 | 66 891 | 242 | 311 | -2.9 | 8.7 |
| Iceland | 48 957 | 158 379 | 95 | 119 | -6.5 | 8.6 |
| Norway | 49 696 | 117 304 | 200 | 259 | -0.8 | 3.6 |
| Sweden | 118 846 | 175 588 | 1 492 | 1 543 | -2.8 | 6 |
| Islands | ||||||
| Australia | 8 273 | 88 689 | 78 | 125 | -2.5 | 3.1 |
| Iceland | 48 957 | 158 379 | 95 | 119 | -6.6 | 8.6 |
| Japan | 13 699 | 17 615 | 146 | 147 | -4.8 | 2 |
| New Zealand | 2 320 | 3 060 | 9 | 10 | -1.1 | 5.5 |
| ‘Korea’ | 8 919 | 15 | 72 | 128 | -0.9 | 4.7 |
| Faroes | 75 184 | 303 040 | 265 | 347 | -6.9* | 1.41* |
| Large countries | ||||||
| France | 115 242 | 249 954 | 1 769 | 1 915 | -7.9 | 7.2 |
| Germany | 71 501 | 106 191 | 1 218 | 1 394 | -4.6 | 8.6 |
| Italy | 83 549 | 165 674 | 2 219 | 2 383 | -8.9 | 13 |
| Japan | 13 699 | 17 615 | 146 | 147 | -4.8 | 2 |
| Spain | 110 701 | 198 542 | 1 884 | 1 968 | -10.8 | 12.3 |
| U.K. | 150 929 | 234 475 | 2 129 | 2 258 | -9.7 | 10.9 |
| U.S. | 146 354 | 215 395 | 2 354 | 2 609 | -3.4 | 7.8 |
* The numbers for the Faroe Islands are taken from the Statistical Office (Hagstova Føroya, Statbank) and Statista.
Source: OECD (https://data.oecd.org/industry/tourism-receipts-and-spending.htm), Our World in Data (www.ourworldindata.org), Statbank (https://statbank.hagstova.fo/pxweb/en/H2/H2__SDG__SDG08/SDG_8_9_1.px/table/tableViewLayout2/) and Statista (https://www.statista.com/statistics/806045/gdp-of-the-faroe-islands/).
Iceland pales in comparison to some of the other island economies, where infection rates were lower per capita and output contracted less. By 1 December 2021, there were 21 times more infections in Iceland than in New Zealand and around six times as many as in Australia. The number of deaths in Iceland was more than eleven times the number in New Zealand and 20 percent higher than in Australia. However, the number of both infections and deaths was much lower in Iceland than on the neighbouring Faroe Islands.
Why did Iceland not benefit more from its island status? One explanation could be the importance of the tourism sector, which accounts for a larger share of GDP in Iceland than in the other three island economies. Figure 5 below shows the relationship between economic growth in 2020 and the share of tourism in GDP in 2019 for the countries in Table 2.[1]Australia (AUS), Denmark (DEN), Finland (FIN), France (FRA), Germany (GER), Iceland (ICE), Italy (ITA), Japan (JAP), New Zealand (NZE), Norway (NOR), South Korea (KOR), Spain (SPA), Sweden (SWE), United Kingdom (UK), United States (USA).
Footnotes
- ^ Australia (AUS), Denmark (DEN), Finland (FIN), France (FRA), Germany (GER), Iceland (ICE), Italy (ITA), Japan (JAP), New Zealand (NZE), Norway (NOR), South Korea (KOR), Spain (SPA), Sweden (SWE), United Kingdom (UK), United States (USA).
Figure 5 Real GDP growth in 2020 and the importance of tourism in 2019
Iceland’s growth performance is below what could be expected based on the size of its tourism industry. Finland, Denmark and Germany have similar-sized tourism sectors but experienced faster growth rates.
Table 3 shows the results of regressions that explain the cross-country variation in cumulative infections and deaths per million inhabitants by 1 December 2021. The cross-country variation is explained by a dummy variable for island economies, the proportion of the population living in urban areas (percent), the population density (percent), GDP per capita in 2019 (in thousand dollars), confidence in the government (taken from the World Values Survey on the scale 1–10, we use the mean value for each country), and trust (also from the WVS on the scale 1–10, again we use mean values). Density and urbanisation should make social distancing more difficult, higher output per capita should make it easier to sacrifice output in the short run to control infections, and confidence in the government and trust towards other citizens should also help contain infections.
Table 3 Determinants of cumulative infections and deaths due to COVID
| Dependent variable | Infections | Deaths |
| Constant | 367 626.1 (0.7) (0.7) | 3437 (0.4) (0.4) |
| Island dummy | -69 169.3* (2.7) | -1 168.5* (3.2) |
| Urbanisation (%) | -2 562.8* (3.0) | -28.5* (2.4) |
| Density (%) | 25.14 (0.4) | 0.14 (0.2) |
| GDP per capita in 2019 dollars | 0.88 (1.1) | -0.01 (1.1) |
| Confidence in government | -741.7 (1.1) | -23.81* (2.5) |
| Trust | -735.0 (0.1) | 18.1 (0.2) |
| Observations | 32 | 32 |
| R-squared | 0.51 | 0.65 |
| F-statistic | 4.4 | 7.7 |
* denotes significance at the 5 percent level.
The island dummy variable is a statistically significant variable in explaining the number of infections and deaths. Island economies have on average, 69 000 fewer cumulative infections and 1 115 fewer cumulative deaths per million inhabitants, where the average number of infections in a sample of 38 OECD countries is 105 391 and the average number of deaths 1 518. Another variable that is significant is confidence in the government, more confidence being correlated with fewer deaths and fewer infections (the latter not statistically significant). Urbanisation has a statistically significant and, perhaps counterintuitively, negative coefficient.
Iceland, being an island, enjoyed the benefits of having potentially better control of its borders. However, as we saw in Table 2, it did not perform very well compared to the other islands. In addition, we saw that Iceland did not fare very well in terms of economic growth either. Why was this the case? Gordon et al. (2021) show there is a relationship between the openness of borders and the number of local infections and Iceland’s border was more porous than those of the other island economies. One likely reason is that the government hesitated before imposing controls at the borders for reasons explained below. Moreover, as in many other countries, decisions surrounding infection controls, in contrast to fiscal and monetary policy, were not supported by economic analysis; instead, epidemiologic and political decision-making was separated from economic analysis. Below, we list several relevant and well-known economic concepts and issues that were not emphasised in public debate, and we then list the purely political arguments that were emphasised instead.
7 Economics
We start with the economic concepts that received little attention in decisions on social distancing. Instead, emphasis was placed on hospital-system capacity in terms of ventilators and wards in which COVID patients could be treated. Some politicians talked about individual freedom while others wanted to ‘follow the science,’ which in practice meant taking capacity constraints in the hospitals into account.
7.1 Externalities
During a pandemic, private and public interests are not fully aligned. While an individual, who may or may not be infected, takes their private interests into account when deciding to go out and mingle with others, the same individual may be less concerned about infecting others. Individuals living in a small town may care enough about the town and their neighbours to pursue social rather than purely private interests, in the narrow definition of that term. Parents may avoid bringing their children to visit grandparents during a pandemic, not so much out of fear of infection but out of concern for the wellbeing of the grandparents. However, as we move beyond the circle of friends and family, it becomes increasingly less likely that individuals take the interests of others into account when deciding to mix with other people. Adam Smith’s thesis that we act with consideration towards other people out of empathy may not extend much beyond a close group of friends and relatives, and levels of empathy can vary between individuals.
This also applies at an industry level. When the tourism industry in Iceland used advertising to boost the number of foreign travellers visiting the country, a portion of the cost was carried by individuals and businesses that were affected by rising infections without them receiving any compensation. The tourism industry made decisions without taking the full social costs into account and neglected part of the marginal cost of increasing tourist numbers, which then created a difference between the socially and privately optimal number of both foreign tourists visiting the country and domestic nationals visiting other countries. The latter may impose higher social costs because they are more tightly embedded in society and therefore more likely to spread infection after returning from foreign travel. The presence of external effects of international travel is a justification for imposing a tax on such travel, which can take the form of mandatory testing at the port of entry into a country.
7.2 Tourism and expenditure switching
Tourism became an important export industry in the six years before the COVID-19 virus first hit Iceland. The number of foreign tourists was 493 000 in 2009, 807 000 in 2013, and then two million in 2019.[1]See Icelandic Tourist Board: https://www.ferdamalastofa.is/is/tolur-og-utgafur/fjoldi-ferdamanna/heildarfjoldi-erlendra-ferdamanna. In 2019, the tourism industry accounted for just over 8 percent of Iceland’s GDP and approximately 8 percent of total employment. Its share of exports was higher, 35 percent, exceeding the share of fish exports, 19 percent.[2]See https://www.statice.is/publications/news-archive/tourism/tourism-satellite-accounts-2018-2019/ and https://knoema.com/atlas/Iceland/topics/Tourism/Visitor-Exports/Visitor-exports-percent-of-exports.
The perceived economic importance of the tourism sector was exaggerated by lobbyists during the COVID-19 recession. First, it must be borne in mind that tourism requires significant imports of wine, oil and other inputs. The number of tourists also masks an important feature of pre-COVID Iceland. Although the number of foreign tourists had increased rapidly, reaching two million in 2019, the local population also travelled abroad more. Countries with large tourism industries differ in their net exports of tourism, and it is net exports that matter when a pandemic makes international travel difficult or impossible.
Footnotes
- ^ See Icelandic Tourist Board: https://www.ferdamalastofa.is/is/tolur-og-utgafur/fjoldi-ferdamanna/heildarfjoldi-erlendra-ferdamanna.
- ^ See https://www.statice.is/publications/news-archive/tourism/tourism-satellite-accounts-2018-2019/ and https://knoema.com/atlas/Iceland/topics/Tourism/Visitor-Exports/Visitor-exports-percent-of-exports.
To illustrate this, we can compare two countries that had many foreign tourists per capita before COVID-19: Iceland and Italy. In 2019, a total of 2 202 000 foreign tourists arrived in Iceland, versus 95 399 000 in Italy.[1]See World Bank: https://data.worldbank.org/indicator/ST.INT.ARVL?locations=OE. On a per capita basis, Iceland received six foreign tourists and Italy received 1.6. However, this comparison does not capture the fact that more Icelanders travel to other countries each year than Italians, nor does it consider the average length of stay or average spending per tourist.
Figures 6a and 6b below show receipts and expenditures from foreign travel in Iceland and Italy in 2019. In Iceland, gross exports of tourism totalled ISK 360 billion in 2019, when GDP was around ISK 3 000 billion and total exports ISK 1 400 billion. However, imports of tourism (foreign travel) totalled ISK 200 billion, which is 7 percent of GDP; therefore, net exports of tourism equalled 5 percent of GDP. This does not take account of the share spent on domestic produce since a portion of the receipts from foreign tourists is spent on imported items such as food, wine and oil. Similarly, when Icelanders spend their money at home, a portion of the expenditure is on imported goods. According to estimates from Iceland’s finance ministry, the average contribution of a foreign tourist was ISK 100 000 in 2019. That same year, 83 percent of Icelanders made at least one trip abroad and spent an average of ISK 500 000 each. In other words, it took five foreign tourists in Iceland to generate the same foreign currency spent abroad by one Icelander in 2019.[2]This may have involved more than one trip.
The situation is different in Italy. Tourism accounted for 13.1 percent of GDP in 2019, 5 percent more than in Iceland, and at about the same level as in Spain. Receipts from foreign tourists totalled EUR 70 billion in Italy in 2019. However, expenditure by Italians abroad averaged only around EUR 20 billion.
Footnotes
- ^ See World Bank: https://data.worldbank.org/indicator/ST.INT.ARVL?locations=OE.
- ^ This may have involved more than one trip.
Figure 6a Tourism exports and imports in Iceland
Figure 6b Tourism exports and imports in Italy
While some industries profited from the expenditures switching, such as the domestic retail sector, businesses that only cater to foreign tourists were badly affected by the pandemic in Iceland. The number of people working in hotels declined from 6 800 in 2019 to 4 600 in 2020, while hours worked fell from 97 000 to 56 000. The share of tourism in GDP fell from 8 percent in 2019 to below 4 percent in 2020, which is the level from 2011.[1]Statistics Iceland (www.hagstofa.is).
Footnotes
- ^ Statistics Iceland (www.hagstofa.is).
8 Politics
The notion of externalities and expenditure switching did not feature much in public debate. Instead, politicians in Iceland, as in most other countries, emphasised either the importance of individual freedoms (mostly politicians on the political right) or the importance of following the science (mostly politicians on the political left).
8.1 Freedom
Some politicians on the right of the spectrum objected to infection controls on the grounds that they restricted individuals’ personal freedoms. However, when considering freedom, a different type of externality arises, something that political philosophers on the subject have recognised for a long time. The Victorian philosopher and sociologist Herbert Spencer argued that the freedom of individuals should be increased up to the point that it begins to reduce the freedom of others (Spencer 1887). In effect, he spelt out how to maximise total freedom in society. Refraining from testing tourists and local people entering a country increases their freedom of movement, but if the cost takes the form of school closures, then the freedom of the young to study and develop is reduced or even stopped. In essence, when one individual takes the risk of infecting others, that individual restricts other people’s freedom of movement.
8.2 Lobbying
It should by now be quite clear that prevailing business interests often outweigh other concerns when it comes to deciding on mitigation measures in Iceland. The government has at times revealed its concern for certain sectors of the economy – i.e., the tourism sector – at the expense of the rest of society. These are admittedly difficult trade-offs, but in public debate, the interests of tourism appear to have eclipsed other concerns.
The question then arises why the interests of one sector that accounted for approximately 8 percent of employment, as well as 8 percent of GDP, seems to have trumped other economic and social concerns when it came to decisions on infection control. One possible explanation is that the negative impact of infection controls at the border is felt by the few, while the benefits are spread among the many. Mancur Olson’s problem of collective action then explains why those who benefit from government intervention are less vocal and influential than those who feel the negative effects (Olson 1965).
Table 4 gives an indication of the level of lobbying during the pandemic. The third line shows the search results from the national television and radio website (ruv.is) in the past two years (since the beginning of the COVID pandemic) for the search term ‘covid’ and each of the terms in the second line: the first, ITIA, is the Icelandic Travel Industry Association, the second the name of its managing director, the third the tourism industry, and the fourth the fishing industry. The fifth search item is mental health, the sixth secondary school, and the seventh is the name of the prime minister. The results show that name of the managing director appears more often than the Icelandic words for mental health, secondary school and the fishing industry. The tourism industry itself appears more often than the name of the prime minister and 44 times more often than the words for the fishing industry and for mental health.
Table 4 Frequency of search strings in [major] Icelandic media
| National television and radio website (ruv.is) | |||||||
| ITIA | Managing director, ITIA | Tourism industry | Fishing industry | Mental health | Secondary schools | Prime minister | |
| COVID | 39 | 64 | 437 | 10 | 11 | 56 | 279 |
| Newspaper Morgunbladid, website (mbl.is) | |||||||
| 38 | 105 | 107 | 80 | 40 | 49 | 676 | |
8.3 Time inconsistency
The government repeatedly attempted to avoid the inescapable trade-offs by responding to a fall in infections by relaxing restrictions, thus triggering a subsequent increase in the number of infections, which then forced it to reintroduce controls. This has happened several times, starting in the summer of 2020, after infections fell to zero and remained there for weeks. Not only did the government open the borders without adequately testing travellers, but it also used public money to advertise Iceland as a COVID-free country. By the end of August, the number of infections had begun to rise again, which called for the introduction of stricter measures, including school closures. Each relaxation of measures preceded a new wave of the pandemic.
Figure 7 below shows the daily number of infections per million of the population and an indicator of infection controls that has the value 1 if controls are being tightened and -1 if they are being relaxed. The figure shows the first wave in the spring of 2020, then a second wave in the autumn of 2020, a third but smaller wave in the spring of 2021 and a fourth wave starting in July 2021. Each wave is preceded by a relaxation of infection controls.
The stop-go cycle has now been repeated often enough to establish a pattern that demands explanation. In the macroeconomics literature, one explanation for a stop-go inflationary cycle is that policy makers have a vested interest in both declaring noble long-term intentions and diverging from these intentions in the short term. Lowering unemployment in the short term may pay political dividends, while higher future inflation is someone else’s problem. Thus, policy makers may strive for popularity in the short term, hoping that they will be forgiven and/or forgotten in the long term if things go badly. This problem of time inconsistency has plagued economic policy making, and there are similarities between inflation and the pandemic in this regard since the state variable responds to the control, the state being the level of inflation and the spread of the pandemic, the control variable being the interest rate and social distancing.
Figure 7 The stop-go cycle, 25 Feb 2020 to 1 December 2021
Source: www.covid.is (Department of Civil Protection and Emergency Management) and John Hopkins Coronavirus Resource Centre.
In Figure 8, we use a published index of the stringency of infection controls, taken from the Oxford Coronavirus Government Response Tracker project.[1]See Hale et al. (2021). The nine metrics used to calculate the Stringency Index are: school closures, workplace closures, cancellation of public events, restrictions on public gatherings, closures of public transport, stay-at-home requirements, public information campaigns, restrictions on internal movements and international travel controls. The index on any given day is calculated as the mean score of the nine metrics, each taking a value between 0 and 100, a higher score indicating a stricter response.
Footnotes
- ^ See Hale et al. (2021).
Figure 8 Daily infections and the COVID Stringency Index
The stop-go cycle of infection controls has had the effect of complicating both business planning and the operation of schools and hospitals. In early October 2021, the government announced once more that all restrictions would be relaxed in four weeks’ time, after having had to reintroduce controls that had been abolished at the beginning of July. It was then forced to reverse policy and tighten restrictions again.
9 Concluding comments
Iceland has not fared badly in this crisis. This stands in stark contrast to the financial crisis of 2008 when it was one of the worst performers in Europe. Fiscal policy was professionally formulated, preventing the crisis from deepening and the income distribution from becoming more unequal. The government largely followed the advice of the Chief Epidemiologist.
However, the pandemic could have been handled better if policy had considered both medical/scientific knowledge about pandemics and some principles of economics. The public debate was overly focused on the choice between concerns about public health on the one hand and individual freedom on the other, without applying a cost-benefit analysis to the possible ways of mitigating the spread of the virus; for example, the choice between testing at the border or imposing social distancing within the country. While economists were brought in to help manage economic policy making, the epidemiologists handled the public health aspects. What was missing was collaboration between epidemiologists and economists when it came to addressing the public health side of the response to the pandemic. Such a collaboration would have helped deal with the inescapable trade-off been health and livelihoods, between the interests of different industries, and the trade-off between the current benefits of relaxing restrictions and future costs in terms of tighter restrictions. The outcome might have been to maintain some level of social distancing, even after the infection rate reached zero, and to have stringent tests at the borders starting in February 2020; to emphasise that controlling the borders related directly to keeping schools open and to relieve the local population of some of the anxiety and fear of becoming infected. A rather straightforward analysis involves using surveys to measure how much people would be willing to pay for limiting the spread of infections on the island and comparing the aggregate willingness to pay with the economic interests of industry affected by testing at the border.
In terms of infections and deaths per capita, Iceland fared better than Sweden and was not vastly different from the other three Nordic countries. However, the stop-go cycle of infection controls (relaxing border controls and domestic infection controls, and then reintroducing more border testing and domestic restrictions) preceded the second, third, and fourth waves of the pandemic and adversely affected the economy. When the marginal costs of the mitigation measures go up, which is highly likely, such a stop-go policy is not an optimal solution. An alternative might have been to maintain some social distancing to slow down or postpone each new wave of the virus. While public policy was based on the recommendations of the Chief Epidemiologist to a greater extent than in many other countries, the ‘pandemic bias’ of the government was clearly visible. In this, Iceland was no different from many other European countries.
The effects of industry lobbying were profound during the COVID crisis in Iceland. Bearing in mind the health consequences of the rising number of infections before the population was vaccinated, including deaths and long-term health effects, it is notable the extent to which the government was apparently influenced by lobbyists and narrowly defined economic interests. This may be because the benefits of infection controls are spread throughout society while the negative economic effect of such controls hits narrowly defined sectors, making the voices of lobbyists louder than those of the general public The problems of collective action are very real.
I am grateful to Andri S. Scheving for research assistance.
References
Acemoglu, D., Chernozhukov, V., Werning, I. & Whinston, M. D. (2020). A multi-risk SIR model with optimally targeted lockdown. (Cemmap Working Paper CWP14/20). London, UK: Cemmap.
Alvarez, F., Argente, D. & Lippi, F. (2020). A simple planning problem for COVID-19 lockdown. (NBER Working Paper 26981). Cambridge, MA: National Bureau of Economic Research.
Conway, R., Kelly, D.M., Mullane, P., Bhuachalla, C.N., O’Connor, L., Buckley, C., Kearney, P. M. & Doyle, S. (2021). Epidemiology of COVID-19 and public health restrictions during the first wave of the pandemic in Ireland in 2020. Journal of Public Health, 43(4), 714–722.
Eichenbaum, M. S., Rebelo, S. & Trabandt, M. (2020). The macroeconomics of epidemics. (NBER Working Paper 26882). Cambridge, MA: National Bureau of Economic Research.
Farboodi, M., Jarosch, G. & Shimer, R. (2020). Internal and external effects of social distancing in a pandemic. (Working paper no. 2020–47). Chicago, IL: Becker Friedman Institute, University of Chicago.
Getaschew, Y. Y. (2020). Optimal social distancing in SIR-based macroeconomic models. Covid Economics, 40, 115–148.
Glover, A., Heathcote, J., Krueger, D. & Ríos-Rull, J-V. (2020). Health versus wealth: On the distributional effects of controlling a pandemic. (NBER Working Paper 27046). Cambridge, MA: National Bureau of Economic Research.
Gordon, D. V., Grafton, R.Q. & Steinshamn, S. I. (2021). Cross-country effects and policy responses to COVID-19 in 2020: The Nordic countries. Economic Analysis and Policy, 71, 198–210.
Hale, T., Angrist, N., Goldszmidt, R., Kira, B., Petherick, A., Phillips, T., Webster, S., Cameron-Blake, E., Hallas, L., Majumdar, S. & Tatlow, H. (2021). A global panel database of pandemic policies (Oxford COVID-19 government response tracker). Nature Human Behaviour, 5, 529–538.
Hausmann, R. & Schetter, U. (2020). Horrible trade-offs in a pandemic: lockdowns, transfers, fiscal space, and compliance. (CID Faculty Working Paper no. 382). Cambridge, MA: Center for international Development, Harvard University.
Huang, D. (2020). How effective is social distancing? Covid Economics, 59, 1–52.
Jones, C. J., Philippon, T. & Venkateswaran, V. (2020). Optimal mitigation policies in a pandemic: Social distancing and working from home. (NBER Working Paper 26984). Cambridge, MA: National Bureau of Economic Research.
Lindström, M. (2020). The COVID-19 pandemic and the Swedish strategy: Epidemiology and postmodernism. Population Health, 11, 1–5.
Ministry of Finance, R. (2021). Úrræði vegna faraldurs. Reykjavik, Island: Ministry of Finance.
Mueller-Langera, F. & Gomez-Herrera, E. (2021). Mobility restrictions and remote work: Empirical evidence on demand and supply on a European online labour market. Information Economics and Policy, 63, 1–16.
Olson, M. (1965). The logic of collective action. Boston, MA: Harvard University Press.
Padhan, R., & Prabheesh, K.P. (2021). The economics of COVID-19 pandemic: A survey. Economic Analysis and Policy, 70, 220–237.
Spencer, H. (1887). Principles of Ethics. Liberty Fund Books.
Toxvaerd, F. (2020). Equilibrium social distancing. (Cambridge-INET Working Paper Series no. 2020/08). Cambridge, UK: Institute for New Economic Thinking.
Comment on G. Zoega: Iceland’s fight against COVID-19: An economic perspective
1 Introduction
Like everywhere else, COVID-19 led to lockdown in Iceland, forcing companies in directly affected sectors, including restaurants, hotels and airlines, to cut supply. With lower output and income, together with increased uncertainty, aggregate demand also fell. This combination of a supply shock and a demand response caused a substantial fall in GDP. The Icelandic authorities responded to this through a combination of fiscal and monetary measures.
Unlike everywhere else, Iceland is in the unique position of being an island economy and having only one international airport. Indeed, this offers the possibility of imposing more stringent tests at the border to limit the entry of infected individuals. While some island economies, such as Australia and New Zealand, decided to close their borders almost completely, Iceland’s approach has more resembled a ‘stop-go’ cycle of infection controls. This not only caused some uncertainty in relation to business planning but also complicated running schools, hospitals etc.
Gylfi Zoega (GZ) offers a balanced and insightful review of these developments in Iceland. In my comments, I will discuss some of the issues presented by GZ, including the impact of COVID-19 on the Icelandic economy compared to other countries and the importance of the tourist industry in Iceland during the pandemic.
2 How did Iceland fare during the pandemic?
GZ concludes that ‘Iceland has not fared badly in the crisis’. However, he also states that ‘the pandemic could have been handled better’. While macroeconomic policies are found to have been conducted in a satisfactory manner, the role of lobbyism seems to count on the downside. GZ is also critical of the decisions taken by the Chief Epidemiologist who, in addition to acting as a health expert with executive power, also became a ‘closet economist’.
In order to better understand how Iceland performed in comparison with other countries, as discussed by GZ in detail, I will elaborate on this issue by using the ‘winners and losers’ criteria developed recently by The Economist (2022). Unfortunately, Iceland was not included in this study. As The Economist (2022) has not disclosed the methodology behind its rankings, let me start by briefly outlining my own approach:
Fifteen countries are included in the study. Five indicators of performance have been selected: (1) GDP, (2) compensation of employees, (3) share prices, (4) real investment (i.e., change in gross fixed capital formation), and (5) public debt. I first compute the mean and standard deviation of each variable. Then I assign a score from 0 to 5 depending on how much the value of the variable was ‘extreme’ based on its own distribution. For example, a country scored 0 if its GDP growth between the third quarter of 2021 and the fourth quarter of 2019 was below the mean growth of the sample minus two times the standard deviation of growth in the sample. Similarly, it scored 5 if its GDP growth between the third quarter of 2021 and the fourth quarter of 2019 was above the mean growth plus two times the standard deviation. Countries scored 4 (2) for growth above (below) the mean plus (minus) one standard deviation, and 3 for growth within the mean plus/minus one standard deviation. The same is true for all variables with the exception of debt-to-GDP, where countries performed well if the growth of the ratio was below the mean, with a score of 3 if the growth rate was less than one standard deviation below, 4 if it was between one and two standard deviations below, and 5 if it was more than two standard deviations below the mean.
The results are reported in Table 1, showing (a) the country rankings, (b) the variables on which the score is based, and (c) the total score. The ranking turns out to be very similar to the one published by The Economist (2022). The few deviations may be ascribable to the fact that I use the compensation of employees instead of household income per capita as used by The Economist.
So, what do we find? First, Iceland has the worst performance among the countries included in terms of real GDP. Second, Iceland records a large increase in public debt-to-GDP ratio. Third, Iceland is doing fine in terms of real investment. Fourth, Iceland fares well with respect to compensation per employee, here used as a proxy for household income, as well as share prices.
Table 1 Performance of selected countries during the pandemic
| GDP | Comp. of employees | Share Prices | Investment | Debt-to-GDP | Total Score | |
| Denmark (1) | 2.20 | 8.27 | 60.43 | 10.77 | 8.35 | 18.00 |
| Sweden (2) | 2.31 | 6.55 | 51.70 | 5.64 | 2.88 | 17.00 |
| Korea (3) | 1.69 | 3.24 | 40.96 | 0.93 | 3.52 | 15.00 |
| Australia (4) | -0.19 | 5.49 | 9.52 | 7.42 | 25.81 | 14.00 |
| New Zealand (4) | 0.38 | 9.92 | 12.57 | -4.20 | 12.53 | 14.00 |
| Norway (4) | 3.49 | 4.61 | 30.75 | -8.54 | 1.82 | 14.00 |
| Finland (7) | 1.53 | 5.25 | 32.20 | -1.44 | 20.57 | 13.00 |
| Iceland (7) | -6.80 | 7.74 | 77.95 | 5.61 | 19.18 | 13.00 |
| US (7) | 1.44 | 7.15 | 26.18 | 3.68 | 22.73 | 13.00 |
| France (10) | 0.20 | 3.52 | 17.44 | 1.40 | 22.94 | 12.00 |
| Germany (11) | -0.81 | 3.36 | 15.81 | -1.89 | 15.41 | 11.00 |
| Italy (11) | -1.07 | 1.86 | 18.36 | 6.91 | 27.06 | 11.00 |
| UK (13) | -1.31 | 8.72 | -1.26 | -3.95 | 37.08 | 10.00 |
| Japan (14) | -1.46 | 0.00 | 18.98 | -4.26 | 19.09 | 9.00 |
| Spain (15) | -5.92 | -0.03 | -7.26 | -6.85 | 30.04 | 5.00 |
Overall, Iceland ranked in the middle, on par with Finland among the Nordic countries, but below Denmark, Sweden and Norway. It is also noteworthy that Iceland ranks lower than other ‘island economies’, including Korea, Australia and New Zealand. Nonetheless, Iceland has fared better than the major European countries.
In order to shed further light on what explains the dramatic drop in GDP, by far the largest among countries included in Table 1, I discuss this outcome by drawing a comparison to the other Nordic countries. The focus of the discussion is whether this can be attributed to the (big?) role of tourism in Iceland.
3 A closer look at the role of tourism: A Nordic perspective
Compared to other Nordic countries, Iceland has two distinctive features. First, it is an island economy with only one international airport. As already pointed out, this facilitates a rigorous testing and travel control strategy, thus allowing locals to enjoy a more ‘normal’ life at the expense of the tourism industry. Second, tourism is widely perceived to play a much larger role in the Icelandic economy than in the other Nordic countries.
As GZ correctly points out, those two features present a trade-off: if strict rules for testing, isolation and quarantine were imposed, the tourism and travel industry would be penalised. This may have affected the decisions taken by the government and the authorities in Iceland. In fact, as discussed above, the stop-go cycles, as captured by the rather erratic course of the ‘COVID stringency index’, seem to have been pronounced in Iceland. Most likely, this has generated a great deal of uncertainty, with potentially negative effects on the economy.
The question is how much of a role tourism plays in Iceland. In fact, I was surprised by GZ’s finding that tourism in Iceland constitutes the same share of GDP as in Denmark and Finland and only slightly more than in Sweden and Norway. If this is the case, then why has much of the debate focused on Iceland being much more vulnerable to COVID-19’s impact on tourism, and hence on the aggregate economy, than other Nordic countries?
To pursue this in further detail, let me first take a look at the direct impact of tourism on GDP in the five Nordic countries, see Figure 1. As noted, the data source is the World Bank, and the numbers clearly deviate from those reported by GZ, which were based on data from the OECD. While numbers for Denmark, Finland and Sweden hover around 2 percent, the numbers for Norway are close to 4 percent. However, the Icelandic numbers are significantly higher, close to 9 percent just before the outbreak of COVID-19.
Figure 1 Direct contribution of travel and tourism in the Nordic region, percent of GDP
It is also noteworthy that the share of tourism increased rapidly throughout the 2010s, with a slowdown observed just before the pandemic, perhaps because the real exchange rate was very high. Even more important, when taking into account the indirect and induced impact of tourism on GDP, the Icelandic numbers become extremely high, see Figure 2. Indeed, since 2015, tourism’s share of GDP in Iceland has been close to 35 percent, which is unmatched by any other Nordic country.
Figure 2 Direct and indirect contribution of travel and tourism in the Nordic region, percent of GDP
Evidently, with tourism playing such a leading role in the economy, it is less puzzling that the pandemic, even with minor travel restrictions, did, in fact, cause a dramatic drop in Iceland’s GDP. It is also easier to understand the scope for lobbyism in such an environment. However, I am still puzzled by the major differences between numbers reported by the OECD (as used by GZ) and the World Bank data reported above.
Tourism should be measured by its value added, and the induced impact must mean domestic value added of inputs into tourism. Leaving aside possible methodological issues, let me try to offer an explanation why the indirect GDP effect is larger in Iceland than in other Nordic countries. While a substantial number of tourists to Denmark (Sweden) might be visiting Copenhagen (Stockholm), very few tourists come to Iceland to see Reykjavík. Iceland’s touristic attractions are all in the rural countryside. This might cause a relatively large ‘indirect effect’ on value added in Iceland since tourists are likely to create a ‘critical mass’ in many rural areas so that it is possible to provide services for residents and tourists alike, which would otherwise not be feasible without tourists. The point is that economic activity takes place in areas where, without tourists, it would not normally take place, and it does so to a greater extent than in other Nordic countries. It would be interesting to see more in-depth investigation of this in due course.
4 Further perspectives
GZ makes a number of other interesting observations. For example, I found it intriguing to see the phenomenon of time inconsistency, well-known from the macroeconomic literature, applied in the context of COVID-19. Indeed, while the problem of time inconsistency is typically associated with an ‘inflation bias’, the same way of thinking within COVID-19 leads to a ‘pandemic bias’. The point is that a myopic authority has an incentive to renege on its original promise in order to obtain short-term gains: while the interest rate (control variable) may fail to keep the inflation rate (state variable) low, in a similar fashion social distancing (the control variable) may fail to avoid too much spread of the pandemic (state variable).
This leads me to another observation, namely that GZ only lists a very restricted arsenal of measures to combat COVID-19. While social distancing clearly is key, I wondered why the word ‘vaccine’ does not appear a single time in the paper. Why is it that GZ does not mention vaccines at all? Vaccination is normally regarded as the ‘super-weapon’ to beat the virus. For example, in Denmark, high vaccine rates have led to the reopening of the Danish economy, as the first country in Europe, by primo February 2022. An interesting observation is that at the time of removing almost all coronavirus restrictions, Denmark had the world's highest COVID-19 infections per capita. The decision was accompanied by a declaration that COVID-19 is now an endemic disease or no longer a ‘socially critical disease’. Indeed, due to Denmark’s high vaccine coverage, the health authorities found that the number of people becoming infected daily with COVID-19 is no longer relevant and, unlike in previous stages of the pandemic, there is a clear decoupling between infection numbers and hospitalisation.
While I have tried to argue that the relatively poor performance of the Icelandic economy compared to its Nordic neighbours may be attributable to the relatively high importance of tourism, the question is if (lack of) trust in government and other public authorities played an additional role. It is a frequently made claim that there is a high correlation between infection rates and a country’s level of distrust in its government. Trust is normally regarded as a major Nordic asset. For example, in a comprehensive survey of how well the Nordic model is doing, Professor Lars Calmfors recently concluded: ‘A high degree of trust in society among citizens may be the most valuable asset when trying to meet these challenges, as it is likely to facilitate the adoption of appropriate policies.’ (Calmfors 2014, p. 50).
However, in a recent study of events in Iceland in the run-up to and following the financial crisis in 2008, Professor Thorvaldur Gylfason made the following statement: ‘In some ways, as you will see, Iceland resembles Italy, Japan, and Russia more than it resembles its Nordic neighbors or even Ireland.’ (Gylfason 2015, p. 311). If this also encompasses trust built into society, a ‘trust deficit’ may partly explain Iceland’s ranking on the league table of which countries have done best and worst during the pandemic. At any rate, it would be relevant to conduct further studies of the importance of trust in combating COVID-19, including in Iceland.
References
Calmfors, L. (2014). How well is the Nordic model doing? Recent performance and future challenge. In Valkonen, T. & Vihriälä, V. (Eds.), The Nordic model – challenged but reformed. Copenhagen, Denmark: Nordic Council of Ministers
The Economist (2022). Which economies have done best and worst during the pandemic? (The Economist, Finance & economics, Jan 1st 2022 edition). UK: The Economist. Available at: https://www.economist.com/finance-and-economics/which-economies-have-done-best-and-worst-during-the-pandemic/21806917.
Gylfason, T. (2015), Iceland: How could this happen? In Andersen, T.M., Bergman, M. & Hougaard Jensen, S. E. (Eds.), Reform capacity and macroeconomic performance in the Nordic countries. Oxford, UK: Oxford University Press.
Comment on G. Zoega: Iceland’s fight against COVID-19: An economic perspective
For obvious reasons, the field of COVID-19 economics is new and, as such, short on theory and empirical data. Time series are much shorter than those typically used for macroeconomic analysis, making it difficult to analyse the effectiveness of government policies. Policy responses to COVID-19 did, however, vary considerably from country to country and even region to region, notably from state to state in the USA. This will eventually provide researchers with better insights into the costs and benefits of different policies. For policy makers dealing with the pandemic in real-time, advice based on in-depth analysis of rich economic data is, however, still in short supply.
Taking this caveat into account, the methodology of the paper is not surprising. It is a case study of the Icelandic response to COVID-19, with an emphasis on border controls and with some comparisons with other countries. The countries chosen for comparison are the other Nordic countries, which have broadly similar political systems, health care and economies as Iceland, and a handful of islands in order to take into account the importance of borders and how they are regulated.
The countries chosen for comparison have a significantly larger population than Iceland, except for the Faroe Islands. This may be important in this context, as halting the spread of a pandemic using track-and-trace and isolation is probably easier in a small population in a sparsely populated country than in a larger and more densely populated society. The larger Nordic countries have borders that are more difficult to close down or control than Iceland, where the bulk of travellers arrive and leave through a single airport. So, ceteris paribus does not apply, a common problem with cross country data that might be troubling here.
Other problems with COVID-19 data are well known and apply to this article, as well as most other studies in the field. Measured infection rates are merely a proxy for actual infection rates, and the ratio between the two can differ significantly both over time and across countries, depending on the quality of, and emphasis on, testing for infections and other factors (Farhadi & Lahooti 2021).
The mortality data is probably more accurate, as most developed countries and certainly the Nordic countries, keep fairly accurate data on deaths. However, the cause of death may not always be correctly identified. There is considerable evidence that official statistics tend to underreport deaths due to COVID-19 (Adam 2022).
A more philosophical question is whether to look at overall death rates or only reported deaths due to COVID-19. In some countries, overall death rates rose considerably more during the height of the pandemic than the numbers attributed to COVID-19, suggesting that pandemic-related deaths were either underreported or that the enormous stress on health care systems was leading to higher mortality rates in other groups, e.g., cancer patients. In other countries, overall death rates rose significantly less than reported COVID-19 deaths, indicating that the effect of the pandemic on actual deaths was lower than reported.
Looking at Iceland, we see that the number of deaths rose by 29 between 2019 and 2020, an increase of just over 1 percent; almost certainly not statistically significant given the normal year-to-year fluctuations. That figure is, however, very close to the number of deaths attributed to COVID-19 in 2020. Considering that the population was growing, the mortality rate was slightly lower in 2020 than in 2019, albeit the difference is minuscule (0.631 percent in 2019 and 0.629 percent in 2020). In two normal years, the mortality rate would be expected to rise slightly due to demographic factors such as the ageing population.
As a result, it is important to interpret mortality data carefully. It could reasonably be argued that the pandemic does not seem to have caused any excess deaths in Iceland. Of course, people did die of COVID-19, and we know who they were, but we do not know who would have died, in a different world, without COVID-19. Notably, the seasonal flu did not strike Iceland in 2020, probably due to travel restrictions. To further complicate the picture, a large proportion of deaths attributed to COVID-19 in Iceland were due to a single outbreak in one institution that cares for elderly and infirm patients. Such random events make it hard to evaluate the pros and cons of different policies based on fatality rates.
Death rates are only one measure of the impact of COVID-19 on society. The economic impact has also been substantial. The use of GDP to measure this impact is not surprising, although it is a flawed measure of how well an economy, let alone society in general, performs. One obvious issue is that, although measures such as lockdowns can and do have a direct economic impact, they are far from the whole story. If people can go to work or work from home and can shop unimpeded, then traditional measures of output and consumption might not show any significant effect except for industries that close their doors, such as the performing arts, some personal services areas and, of course, tourism-related industries.
GDP measures economic activity based on actual or estimated market value, ignoring such simple pleasures as visiting your grandmother in person, chit-chatting with your classmates during breaks in the school day, having a leisurely day at the beach (not really a thing in Iceland), etc. A lot of activities that give us pleasure for free are omitted. The loss of them is not, therefore, accounted for in GDP statistics. The long-term impact of a lockdown on mental health is also still essentially unknown and certainly not taken into consideration when estimating GDP. We also note that the contribution of the educational sector to GDP is based on expenditure, not output, so any decline in the effectiveness of teaching due to the switch to online learning does not show up in GDP statistics at all.
As an example, Australia, one of the islands examined in the study, has relied not only on strict controls at its borders to combat COVID-19, but lockdowns have been repeatedly imposed on parts of the huge country, sometimes for months. Looking at COVID-19 related fatalities or GDP, Australia has seemingly done well, but neither measure examines the indirect and extremely difficult to quantify effect of subjecting people to the hardship of a lockdown for extended periods.
That said, the underperformance of the Icelandic economy as measured by the drop in GDP compared to countries with a similar tourism sector (as seen in Figure 1) might be explained by one or both of two factors. The first is that the slowdown in Iceland began well before COVID-19, i.e. in 2019, when problems arose in the tourism sector, including the bankruptcy of a major domestic airline and the remaining major airline struggling with the grounding of its fleet of Boeing 737 MAX aircraft. These factors meant that the number of tourists fell considerably in 2019. The second is that the tourism sector was growing extremely rapidly pre-2019, and this led to an investment boom in the hotel sector at that time. As a consequence, the problems of the tourism industry that began in 2019 spilled over into the construction sector. This would presumably not have been a major factor in a country with a more mature tourism sector.
The question of an economic trade-off between strict controls on the border on the one hand and strict measures, even a severe lockdown, domestically, on the other, is interesting, especially for an island on which it is relatively easy to control the border. That strategy seemed quite successful in New Zealand, at least initially. The problem with the strategy, as New Zealanders learned, is that even very strict border controls are imperfect. It takes only one infection to kickstart a local pandemic, and it may be near impossible to gain control of some variants of COVID-19, in particular Omicron. This does not mean that no trade-off is possible, but it is not as clear cut. Strict border controls may not be enough in themselves. They need to be supplemented by strict domestic measures where necessary. Australia essentially lived with both for extended periods.
So, perhaps it would not have been realistic for Iceland to aim for relatively normal life for the locals without tourists (and without the coming and goings of locals or migrant workers). To the extent that there is a trade-off between border restrictions and local measures, the pros and cons depend on various factors, including the prevalence of infection in neighbouring countries and, even more importantly, the immunity of the local population. Iceland placed heavy emphasis on immunising the population through vaccinations and was successful in this approach. This meant that the stress on the health care system was manageable, and both the domestic measures and border regulations could be kept relatively mild.
Gylfi Zoega correctly points out the importance of various externalities and public goods for understanding the economics of the pandemic in Iceland and elsewhere. He also notes that various stakeholders lobbied for their interests, often swaying policy in their favour. The tourism sector is a prime example of this. The industry has actively lobbied for the relaxation of border controls in Iceland, practically from day one.
Giving in to pressures from one industry at the expense of others (either those that suffer from harsher domestic controls or those that suffer from COVID-19 itself) may at first glance look like a textbook example of regulatory capture. The picture may, however, be more complicated. Most standard (i.e., neo-classical) economic models do not incorporate frictions such as bankruptcy costs or the various costs incurred when setting up a new business, finding and hiring the best available workers, negotiating with suppliers and resellers, advertising etc. Such costs may mean that a temporary downturn in an industry, putting existing companies out of business, can have long-lasting and costly effects. This could provide a rationale for providing state aid to the industry during an event such as a pandemic, not only with financial measures (funnelling tax revenues to the industry, providing loans or loan guarantees etc.) but also opening borders to some degree at the expense of other stakeholders.
Of course, the same rationale may also hold true for helping other industries than tourism, where the consequences of too dramatic a downturn could have long-term effects. Arguably, the border should have been kept closed to prevent such damage to other domestic sectors, more or less as in New Zealand. If sectors such as the performing arts, spectator sports and, of course, the educational system are at risk of long-term damage with open borders, then that in itself is a clear argument for closing those borders.
References
Adam, D. (2022, Jan 31). The pandemic‘s true death toll: millions more than official counts. Nature. Available at: https://doi.org/10.1038/d41586-022-00104-8.
Farhadi, N. & Lahooti, H. (2021) Are COVID-19 data reliable? A quantitative analysis of pandemic data from 182 countries. COVID, 1(1), 137–152.

The economic cost of COVID-19 – Iceland, Norway, and Sweden
Abstract
We assess the health-related costs of the first two waves of COVID-19 pandemic in Iceland, Norway and Sweden, based on the number of quality-adjusted life-years (QALYs) lost from excess deaths, reduced health during a fixed period of the illness, and the costs of inpatient hospital days. The cost per capita is estimated at 664 euros in Sweden (in total 1.4 percent of GDP), 84 euros in Norway (0.12 percent of GDP), and 115 euros in Iceland (0.2 percent of GDP). As a demonstration of use for policy evaluation, we do a benefit-cost analysis of the closure of upper secondary schools in Sweden during the first wave.
Keywords: Cost-of-illness, cost benefit, value of statistical life, QALY.
JEL codes: D61, I18, I28.
1 Introduction
During the first six months of 2020, the Nordic Region appeared to offer an ideal field laboratory for COVID-19 pandemic reduction and mitigation strategies. With broadly similar economic and institutional environments, Denmark, Norway and Iceland chose precautionary approaches, including closing schools and businesses. By contrast, Sweden was more selective, aiming at encouraging social distancing without fully closing businesses, day-care, and schools.[1]There were also notable differences in strategies between the lockdown countries; for instance, Denmark and Iceland required testing of arriving visitors, see the Background section. However, as the pandemic developed, the ‘natural experiment’ setting became blurred as national policies merged partially, resulting in some – but not complete – convergence in the region. Nonetheless, numerous lessons can be learned from the Nordic COVID-19 measures, not least by comparing countries. This study will establish a common ground for an economic analysis of the pandemic in three of these countries: Iceland, Norway, and Sweden, and in particular will assess the health-related costs of COVID-19 from the start of the pandemic to 15 August 2021.
We conduct a cost-of-illness study that can be used as a platform for an ex-post Benefit-Cost Analysis (BCA) of the specific policy alternatives. To demonstrate this proposed platform, we undertake a limited ex-post evaluation of some of the benefits and costs associated with the closure of upper secondary schools in Sweden during spring 2020. We define the cost of COVID-19 as: the health sector costs associated with hospitalisation, the production loss due to illness, and the cost of pain and suffering due to health loss from premature mortality and morbidity (sometimes referred to as intangible costs). BCA has functioned as a framework for analysing various policy alternatives in numerous studies on policy actions during the pandemic (e.g., Pindyck 2020, Rowthorn & Maciejowski 2020, Thunström et al. 2020). In an early study, Kaiser et al. (2020) examine four Nordic countries, predicting cases and deaths during the first wave (up to the beginning of July 2020) as a function of behaviour and policies. Comparing predicted damages (cost of health loss) to predicted GDP losses, they conclude that the preventive strategies in Denmark, Iceland and Norway paid off. For instance, in Norway, the value of avoided deaths was estimated to be twice the total GDP loss.
Footnotes
- ^ There were also notable differences in strategies between the lockdown countries; for instance, Denmark and Iceland required testing of arriving visitors, see the Background section.
There is, however, an astonishing disparity in the literature on how to value health loss. Some of the studies (Kaiser et al. 2020, Rowthorn & Maciejowski 2020, Thunström et al. 2020) stick to conventional practice in BCA, based on the concept of Value of a Statistical Life (VSL), while others (Hall et al. 2020) value mortality by the Value of a Life Year Lost (VLY). VSL is the marginal willingness of society to pay to prevent risks that add up to the premature death of one individual, while VLY is the marginal willingness to pay per expected life year lost by such death. The difference can be profound, given that the VSL concept is based on a single value per prevented premature death irrespective of age, whereas the VLY concept uses a single value per life-year that is multiplied by the estimated number of life-years ‘saved’. While VSL is readily accepted in the BCA literature, it has widely recognised guidelines and is often used in policy evaluations of, e.g., infrastructure investments and environmental regulation (Atkinson et al. 2018), valuing lives lost in a pandemic through VSL is nonetheless problematic. This is primarily because VSL represents the marginal rate of substitution between wealth and mortality risk, which is sensitive to the magnitude of the mortality-risk change (Pindyck 2020). However, one merit of this approach for multi-country studies is that some studies suggest values that can be used for international comparisons (e.g., Viscusi & Masterman 2017). Another concern is how to value morbidity, which has emerged as an essential issue as evidence accumulates on the significant and persistent health effects of COVID-19. A possible resolution to address both these concerns is to employ the standard approach in most health-economic evaluations, where health loss is quantified, as a starting point, by the number of quality-adjusted life-years (QALYs), and where subsequently the number of QALYs is multiplied by a monetised value per QALY (Herrera-Araujo et al. 2020, Svensson & Hultkrantz 2017). While the approach used in our study (described in greater detail later) has a less solid footing in relation to welfare economic foundations, it has nonetheless grown in popularity among decision-makers in health and medicine. Some aspects of the link between this approach and welfare-economic theory have been clarified (Herrera-Araujo et al. 2020). As previously noted for VSL, there are several meta-analyses (Kouakou & Poder 2022, Ryen & Svensson 2015b) from which it is possible to infer consistent country-specific values of a QALY.
The present study estimates health-related costs of COVID-19 in three countries and is, to our knowledge, the first of its type that bases such an assessment on the calculation of estimates of the loss of health-related quality-of-life adjusted life years. This approach is especially relevant for calculating the public health loss from COVID-19 in the Nordic countries, where the oldest age groups living in long-term residential care facilities reported a large proportion of the recorded deaths. The assessment also highlights some crucial limitations and assumptions in this type of analysis that must be further illuminated by future studies. It shows that Sweden, which was less affected than Norway and Iceland in terms of fall of GDP during 2020, suffered considerably more in terms of the cost of illness. The results from our preferred modelling assumptions indicated the health loss to correspond to 1.4 percent, 0.12 percent, and 0.2 percent of the annual national GDP in Sweden, Norway and Iceland, respectively. The following section provides a brief background to the COVID-19 pandemic, up until autumn 2021, thus covering the first two waves of the pandemic in the three countries, followed by sections presenting the cost-of-illness model and data and methods for identifying, measuring and calculating the degree of health loss, respectively. This is followed by a presentation of the results, including a sensitivity analysis, a discussion and a demonstration of employing the cost-of-illness data in a BCA case study of the closure of upper secondary schools in Sweden during the first wave. The final section offers a number of conclusions.
2 Background
The first confirmed case of COVID-19 in Sweden in late January 2020 was a traveller arriving from Wuhan. By the end of February 2020, all three countries had reported initial cases, and many of these earliest confirmed cases were the result of early winter/spring breaks in the Alps and northern Italy. In March 2020, community spread of the virus was increasing throughout the Nordic Region and in each individual Nordic country (Yarmol-Matusiak et al. 2021)
Initial government responses varied between the countries. Sweden, in particular, relied heavily (at least initially) on voluntary recommendations (Mishra et al. 2021, Ursin et al. 2020). In assessing the timing and introduction of measures such as school and workplace closures, quarantine and isolation policies, cancelling public events, the introduction of stay at home requirements and social distancing rules or regulations, Sweden was generally slightly slower and less strict at first than Norway and Iceland (Saunes et al. 2021). However, methods for ranking and comparing countries in terms of ‘policy strictness’ over the course of the last 1.5 years remain unclear. For example, the Oxford COVID-19 Government Response Tracker Stringency-index (nine indicators of response scaled into an index from 0 to 100, where a higher score implies stricter government response) ranks Sweden as having had stricter policies than Norway and Iceland during large parts of the pandemic (Hale et al. 2021). Considering that government response is endogenous to the development of the pandemic, it is, as has been discussed by an extensive literature on the effectiveness of different government responses, very difficult to accurately assess the impact of varying government measures on morbidity and mortality.
As examples of some of the more heavily debated mitigation and response strategies, the use of tests and contact tracing early in the pandemic was most intensive in Iceland. Data on cumulative testing (on a per capita basis) shows that Iceland conducted the most tests, followed by Norway and Sweden. Iceland was the most successful country in rolling out the vaccination programme in 2021. As of October 2021, the population share of fully vaccinated individuals was approximately 80 percent in Iceland, whereas in Norway and Sweden, the figure was approximately 65 percent (Ritchie et al. 2021).
The morbidity and mortality consequences of the pandemic have also varied greatly in the three countries. In all three, deaths have predominantly been in the older age categories, with a large proportion of deaths coming from the population in long-term residential care facilities. As of late summer 2021, the total number of COVID-19 deaths in Sweden was 14 650, compared to 790 in Norway and 30 in Iceland. Adjusting for population size, this corresponds to 1.44 deaths per 1 000 in Sweden, 0.14 per 1 000 in Norway, and 0.09 per 1 000 in Iceland. However, all three countries had a death rate below the European average at that time, which stood at 1.67 deaths per 1 000 people (Ritchie et al. 2021).
3 The Cost-of-Illness Model
Cost of illness (COI) is defined as the value of the resources that are expended or forgone as a result of a health problem. Assessing the COI is an accounting exercise. It corresponds to benefit-cost analysis (BCA) of a choice between contracting or not contracting an illness in a population when the non-illness option can be considered a zero cost. When the goal is to assess alternatives that reduce the probability of illness and mitigate its consequences, a COI study can be used as a precursor to a BCA from which various economic values can be gathered, much as business accounts can be used in the evaluation of a specific investment proposal in a company.
The core of a COI is the economic assessment of health losses, that is, the mortality and morbidity consequences in a population from the prevalence or incidence of a specific disease. The task of a COI is to identify, quantify and monetise these losses. This section discusses the methods used to calculate the health losses from the COVID-19 pandemic 2020–2021 in Iceland, Norway, and Sweden. Figure 1 shows the basic COI model used in this study.
The total costs of mortality and morbidity can be split into direct and indirect monetary components and non-tangibles. The direct health care costs correspond to the use or loss of real resources from treating the illness. The indirect costs correspond to the value of lost production due to sick leave resulting from an incidence of the illness. These components can usually be assessed from cost accounts, sick-leaves reports and other sources that can be expressed in monetary terms.[1]One can argue (Rowthorn & Maciejowski 2020) that the death of individuals that are still in the work force will incur future productivity losses that are not included in the valuation of a statistical life. However, such effects would be difficult to predict, and one would also need to consider how total consumption is affected. We therefore omit such dynamic consequences here. A main methodological challenge is the non-tangible costs, sometimes called ‘human costs’, which emerge from pain, suffering, constraints, anxiety, grief, and other disutilities associated with sickness and death. The model is a simplification and probably reflects a lower-bound value of the monetised health loss from COVID-19. For example, it does not include potential long-term health problems due to COVID-19, both due to uncertainties in the incidence rate as well as the economic consequences of this loss. Nor does it include the health losses due to the substantially lower hospital productivity during the pandemic when many elective procedures were postponed and some clinics were operating at much lower levels than pre-pandemic (over and beyond the effects of staff shortage).
As Figure 1 shows, the data input requirements to assess the total cost include the number of incident deaths (mortality) and cases (morbidity) from COVID-19 in each of the three countries, together with the associated monetary values for each mortality and morbidity consequence.
Footnotes
- ^ One can argue (Rowthorn & Maciejowski 2020) that the death of individuals that are still in the work force will incur future productivity losses that are not included in the valuation of a statistical life. However, such effects would be difficult to predict, and one would also need to consider how total consumption is affected. We therefore omit such dynamic consequences here.
Figure 1 The basic cost-of-illness model
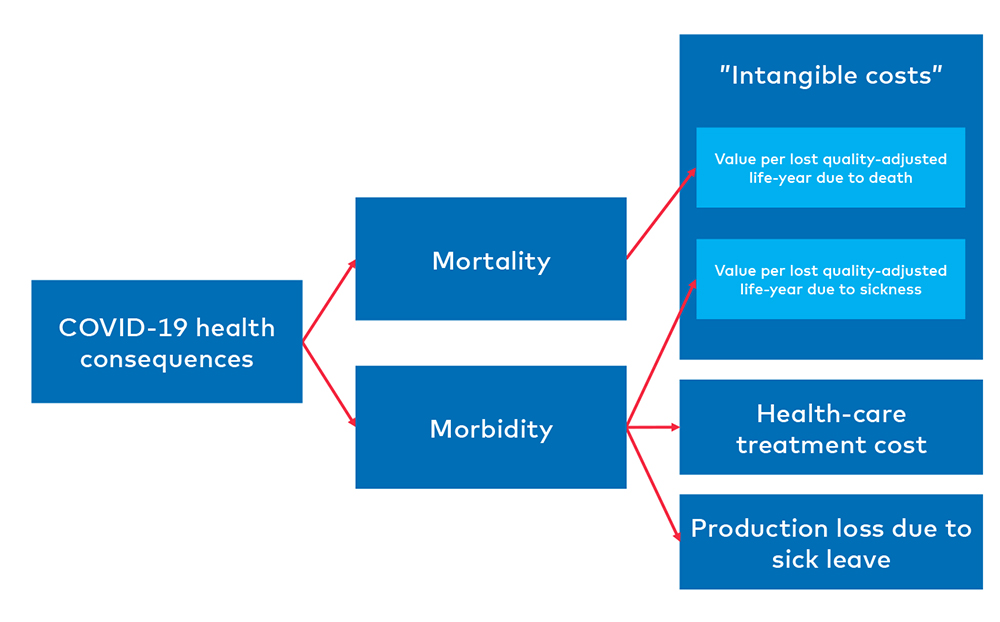
4 Identifying cases and their consequences
To assess the number of incident cases of COVID-19, we rely on the international data project ‘Our World in Data’ (Ritchie et al. 2021). We retrieved data on incident morbidity and mortality covering the period from the start of the pandemic to 15 August 2021.
Our analysis uses both the total number of deaths and the total number of estimated excess deaths. It is the excess number of deaths that leads to an added mortality burden. The number of excess deaths is estimated based on the difference between expected deaths in a specific country (in our case, considering the time-trend during the five years prior to the pandemic) and the time period and the total reported deaths. However, given the difficulties associated with estimating excess deaths, we also conducted analyses with the total number of registered deaths. The health loss from each death is measured by the average number of quality-adjusted life-years (QALYs) lost per death, which is the product of predicted life-years lost per death and health-related quality of life in each of the years. We use the main prediction described by Briggs et al. (2021) with Norwegian data that each COVID-19 death leads to 3.33 lost QALYs.
Regarding non-fatal incident cases, we identify the health burden by the lost QALYs due to the reduced health-related quality of life during a fixed period of illness. Utilising previous research on lost QALYs due to severe influenza, we assume 0.009 lost QALYs per non-fatal incident case, which roughly corresponds to a reduced health-related quality of life by 50 percent for ten days (Hollmann et al. 2013). The consequences of non-fatal incident cases are also measured by the total number of inpatient hospital days (and their associated cost) and the production loss caused by sick leave. For the latter, we use the human capital approach to value lost production and base that on the proportion of cases in the working-age population, the associated employment rate and an average of 10 days of absence per incident case.
5 Valuing lost QALYs due to mortality and morbidity
In this study, the main approach to the valuation of the morbidity and mortality effects of COVID-19 is the so-called v-value, or the willingness to pay (WTP) for a quality-adjusted life-year (QALY) (Baker et al. 2011). The v-value provides an equal monetary value to every expected quality-adjusted life-year lost and can be seen as the ‘consumption value of health’. As it is based on a measure of health-related quality of life, it can also be straightforwardly used to assess the human costs of morbidity effects. An alternative approach, especially for the valuation of mortality effects, would be to use the VSL. As mentioned previously, it places an equal economic value on all premature deaths, irrespective of age or health conditions. The use of VSL is common practice in, for example, BCA of traffic-safety measures (Andersson 2018). A third possible approach could have been the use of a social welfare function (SWF) (Adler 2019). Both the v-value and VSL are used in the conventional (Kaldor-Hicks-Samuelson) strand of welfare economics that derives aggregate values from individual preferences by summing up the total WTP (or willingness to accept (WTA)). Distributional issues have to be considered separately. In contrast, distributional aspects are directly addressed in an SWF analysis that aggregates individual preferences more freely. The choice between these three approaches has several ethical implications for the analysis, which we will return to later in this paper.
V-values that represent citizens’ preferences can be estimated directly or indirectly. A direct method (method A below) uses what is known as stated-preference elicitation of WTP for alternatives with different QALY outcomes. Stated-preference methods derive economic values from the responses of a representative sample of individuals, questioning how much they value an item or which alternative they would prefer, among several provided alternatives with different costs. An indirect approach (method B) uses VSL and divides it by the predicted (and discounted) loss of future quality-adjusted life years. A third method (method C) uses explicit or implicit cut-off thresholds used in cost-effectiveness analysis of medical treatments, for instance, in decisions on the inclusion of new drugs in tax-funded provision programmes. This represents the health opportunity cost, sometimes called the k-value, to distinguish it from the v-value, the consumption value of health (Claxton et al. 2015).
Methods A and B, based on citizens’ preferences, face several validity issues related to using data on hypothetical choices. All three methods contain various shortcomings. Method C can be interpreted as yielding the opportunity cost of a QALY gained or lost at the margin of the specific budget constraints of the subsidised programmes, which may represent a somewhat weak indication of public preferences in the face of a major pandemic. For several reasons, the extent to which these estimated k-values are consistent with the principles of welfare economic theory also remains unclear (Hammitt 2013).
However, a recent study by Herrera-Araujo et al. (2020) provides some theoretical bounds that can be of assistance. Specifically, based on several minimal assumptions about the shape of the agent’s utility function, they show that the (direct) method A can be used as a lower bound on the WTP for improved health, corresponding to the WTP of individuals near the maximum quality of life. In contrast, the (indirect) method B overstates the expected WTP for an improvement in all cases except when baseline health-related quality of life is close to zero. A crucial intuition for understanding this is the ‘dead anyway’-argument (Pratt & Zeckhauser 1996). An individual with a short expected remaining life can spend a larger share of their wealth on a measure that increases their probability of surviving the next year than an individual with a larger expected remaining lifetime. In other words, the WTP for avoiding a health loss depends on both the scale of the loss and the cost of the opportunity. A young individual in good initial health will ceteris paribus have a greater total (duration-weighted quality of life) health loss than an elderly individual in poor initial health but a higher opportunity cost of spending wealth to avoid disease. A young person in good health will thus have more to gain (future life years) but also more to lose (future living standard) than an elderly person in poor health. The basic conclusion of Herrera-Araujo et al. (2020) is that, accepting mild assumptions about representative utility functions, an older individual will be willing to pay more per expected additional year than a younger person.
Table 1 displays values derived by using these three methods. Method A is based on results from a recent systematic review and meta-regression (Kouakou & Poder 2022, Table 4) based on an OLS regression of 511 observations from 39 WTP studies focusing on QALY. From the estimated model in this study, we have calculated values (2018) of WTP for a QALY for Iceland, Norway, and Sweden. Method B has been applied based on the official VSL values (2016) used in Norway and Sweden’s national planning of transportation infrastructure. Finally, method C values are gathered from a study of reimbursement decisions for pharmaceuticals in Sweden (Svensson et al. 2015).
Table 1 Values per QALY for Iceland, Norway, and Sweden in million euros (EUR), PPP adjusted, and million kronor (ISK, NOK, SEK)
| Iceland | Norway | Sweden | ||||
| Method | EUR | ISK | EUR | NOK | EUR | SEK |
| A | 0.08 | 12.59 | 0.10 | 1.04 | 0.08 | 0.81 |
| B | 0.16 | 1.79 | 0.24 | 2.40 | ||
| C | 0.07–1.21 | 0.70–1.20 | ||||
Method B: Persson and Olofsson (2018) based on VSL (2016) = SEK 40.5 M and adapted to VSL (2016) = NOK 30.2 M.
As could be expected, and bearing the theoretical analysis by Herrera-Araujo et al. (2020) in mind, the method A values in Norway and Sweden are lower than method B values.[1]A similar finding is made in a meta-analysis by Ryen and Svensson (2015b), finding that method A values are 2.5 to 5 times smaller than values derived with method B. Method A suggests relatively similar values at around 0.1 million euros for the three countries, with a somewhat higher value for Norway reflecting its higher average individual income. Method B, however, indicates a lower value for Norway than Sweden. Finally, method C for Sweden results in a range centred around 0.1 million euros, that is, the same as the method A value.
Footnotes
- ^ A similar finding is made in a meta-analysis by Ryen and Svensson (2015b), finding that method A values are 2.5 to 5 times smaller than values derived with method B.
6 Model assumptions and sensitivity analysis
Table 2 lists the assumptions for the data used to populate (calibrate) the cost-of-illness model. Detailed references are provided in the supplement. The total number of deaths per 15 August was highest in Sweden (also true when adjusting for population size). The estimated number of excess deaths that we rely on in the model was 10 320 in Sweden. By contrast, the figures were negative in Norway and Iceland (set to 0 in the model), i.e., fewer deaths than expected given the visible trend. The number of inpatient days that we rely on in the model was also, as expected, given the total number of cases, highest in Sweden.
The QALYs lost per death and per non-fatal case are based on predictions from previously published studies and assumed to be fixed across the three countries with similar age profiles of deaths and cases. The cost per inpatient day is based on the cost per patient database from health care registers in the Region Västra Götaland (and takes into consideration the proportion of patients in ICU and the higher cost related to ICU-days), and due to lack of register access in Norway and Iceland, we assume a similar cost per day across all three countries. The production loss per day is based on mean wages, including employer contributions to pensions and social security.
Table 2 Assumptions for the base-case model
| Variables | Sweden | Norway | Iceland |
| Total deaths | 14 650 | 790 | 30 |
| Excess deaths | 10 320 | <0 | <0 |
| Cases | 1 110 147 | 144 484 | 9 522 |
| Total inpatient days | 613 166 | 45 782 | 4 990 |
| QALYs lost per death | 3.33 | 3.33 | 3.33 |
| QALYs lost per non-fatal case | 0.009 | 0.009 | 0.009 |
| Value per QALY | 79 180 EUR | 79 180 EUR | 79 180 EUR |
| Cost per inpatient day | 3 001 EUR | 3 001 EUR | 3 001 EUR |
| Production loss per case in working-age | 2 204 EUR | 2 615 EUR | 3 164 EUR |
| Share of cases in age 15–64 | 0.80 | 0.77 | 0.76 |
| Employment rate 15–64 | 0.74 | 0.74 | 0.77 |
The QALY-loss per death is assumed to be 3.33 with a standard error of 0.33 and normal distribution. The value per QALY is assumed at 79 180 euros (from SEK 808 000) with a standard error of 7 918 euros and normal distribution. The cost per inpatient day of 3 001 euros is based on the cost-per-patient database from Region Västra Götaland (VEGA-database) and with a standard error of 300 euros and a Gamma distribution. The share of cases in the age-range 15–74 years and the employment rates in this age range in the three respective countries are assumed to be fixed in the sensitivity analyses. The Swedish age-range data is from: www.folkhalsomyndigheten.se/smittskydd-beredskap/utbrott/aktuella-utbrott/COVID-19/statistik-och-analyser/bekraftade-fall-i-sverige/. The Norwegian age-range data is from https://www.fhi.no/en/id/infectious-diseases/coronavirus/daily-reports/daily-reports-COVID19/#by-sex-and-age. The Icelandic age-range data is from https://www.covid.is/data. The QALY loss per non-fatal case (0.009) assumes a standard error of 0.0009 and a Beta distribution. The production loss per non-fatal case is based on an assumption of an average of 10 days of sickness absence per case and the mean gross wage, including social fees in the respective country. Average wage data is from https://data.oecd.org/earnwage/average-wages.htm. For the sensitivity analyses, a standard error of a tenth of the mean is assumed with a Gamma distribution.
We also conduct sensitivity analyses allowing the base-case values to vary in specific ranges and with different distributional assumptions (details in supplement). The results from the sensitivity analyses will be reported by showing histograms and the range of results from the 2.5 to the 97.5 percentile of simulated results.
7 Model results
Table 3 shows the main results from the base-case model assumptions and reveals that the cost-of-illness impact is, as expected given total cases and deaths, clearly highest in Sweden. The consequence with the largest monetized impact varies between the countries. In Sweden, the largest impact comes from the value of lost QALYs due to premature (excess) deaths. In Norway and Iceland, the largest impact comes from the production loss due to sickness absence.
Table 3 Base-case cost-of-illness results
| Sweden | Norway | Iceland | |
| Deaths (lost QALYs) | 3 862 million EUR | 208 million EUR | 8 million EUR |
| Excess deaths (lost QALYs) | 2 721 million EUR | 0 EUR | 0 EUR |
| Morbidity (lost QALYs) | 791 million EUR | 102 million EUR | 7 million EUR |
| Inpatient days | 1 840 million EUR | 137 million EUR | 15 million EUR |
| Sick leave | 1 396 million EUR | 217 million EUR | 18 million EUR |
| Total with deaths | 7 890 million EUR | 665 million EUR | 48 million EUR |
| Total with excess deaths | 6 749 million EUR | 457 million EUR | 40 million EUR |
| Total with deaths per capita | 777 EUR | 122 EUR | 138 EUR |
| Total with excess deaths per capita | 664 EUR | 84 EUR | 115 EUR |
Expressed in per capita numbers, and based on excess deaths, the cost-of-illness per capita results are 664 euros, 84 euros, and 115 euros in Sweden, Norway, and Iceland, respectively. The total cost of illness (based on excess deaths) in Sweden at 6 749 million euros corresponds to approximately 1.4 percent of annual GDP. The total cost of illness in Norway amounts to approximately 0.12 percent of GDP and approximately 0.2 percent of GDP in Iceland.
Figures 2a–2c show histograms from the Monte Carlo simulations of the total cost of illness (based on excess deaths). The 95 percent range, which is based on the 2.5 and 97.5 percentile of the simulated results for each country, is between 5 828–7 640 million euros in Sweden, 404–515 million euros in Norway, and 35–45 million euros in Iceland.
Figure 2a Histogram of mean cost (excess deaths based) for Iceland – 95 percent range 35–45 million euros
Figure 2b Histogram of mean cost (excess deaths based) for Norway – 95 percent range 404–515 million euros
Figure 2c Histogram of mean cost (excess deaths based) for Sweden – 95 percent range 5 828–7 640 million euros
8 Discussion
Based on excess deaths, the cost-of-illness per capita of the COVID-19 pandemic up until 15 August 2021 is estimated to be 664 euros, 84 euros, and 115 euros in Sweden, Norway, and Iceland. These numbers correspond to 1.4 percent, 0.12 percent, and 0.2 percent of the respective country’s annual GDP.
Compared to the early cost-benefit analysis of COVID -19 policies in Nordic countries in Kaiser et al. (2020), our assessment of the damage cost is considerably smaller. First, our main case rests on the number of excess deaths instead of attributed deaths, which leads to zero mortality costs for Iceland and Norway. Second, and more importantly, our estimates are based on the loss of quality-adjusted life-years instead of the total number of deaths valued with VSL. This yields much lower overall costs as a larger portion of the burden of COVID-19 was borne by the elderly section of the population. Revising the calculations using the same approach as the one used by Kaiser et al. (2020) results in total overall costs ten times greater or more than those reported here.
8.1 Limitations
The COI model used in this study is obviously a simplification of all resource use consequences from the COVID-19 pandemic. A morbidity factor not included, due to lack of data on both numbers and monetary values, is the long-term consequences of the illness. This implies an underestimation of the true cost-of-illness with COVID-19. Also, health-related quality-of-life may have deteriorated as a consequence of social distancing, school and workplace lockdowns, travel bans and other precautionary measures. In a report based on three surveys of samples of the adult population in Sweden taken in February 2020, April 2020 and January 2021, Olofsson et al. (2021) find a substantial loss of health-related quality-of-life they find difficult to explain as a result of the pandemic alone.
An important limitation is that we did not have country-specific data on the lost QALYs with each death, and considerable uncertainty exists regarding the assumption that each death leads to 3.3 lost QALYs. Other studies indicate larger QALY losses with each COVID-19 death (Olofsson et al. 2021, Persson et al. 2020, Pifarré i Arolas et al. 2021), including estimates that QALY losses per death in Sweden were around 6. On the other hand, given that almost half of all COVID-19 deaths were among individuals living in long-term care homes and the generally low life expectancy for these individuals, 3.3 lost QALYs per death can be considered a relatively high estimate as well (Ryen & Svensson 2015a). As of January 2021, 60 percent of deaths in Norway and 47 percent of deaths in Sweden were among individuals living in care homes (Comas-Herrera et al. 2020).[1]The average period in long-term care homes for elderly in Stockholm is slightly above two years (Stockholms stad, 2014), which means that the average remaining life span is shorter and the remaining number of QALYs even lower.
There are also various simplifications and limitations that may cause our results to overestimate the true cost-of-illness with COVID-19. For example, we have used a human capital approach that values sick leave and that assumes workers were unable to compensate the production loss by, e.g., working to a limited extent, from home while ill with COVID-19.
Footnotes
- ^ The average period in long-term care homes for elderly in Stockholm is slightly above two years (Stockholms stad, 2014), which means that the average remaining life span is shorter and the remaining number of QALYs even lower.
8.2 Validity of v-values transferred from studies in a different context
For a reduction of mortality risk of a one-time event, individuals may be willing to pay from wealth. In contrast, to reduce a persistent mortality risk, such as death from a traffic accident, income is a more relevant constraint on spending because most households have little wealth compared with their incomes (Hammitt 2020). Thus, values that are calibrated to estimates of WTP for traffic safety improvements may lead to an underestimation of the cost of a transitory negative shock to life expectancy, such as COVID, whereas traffic safety changes often affect life expectancy permanently.
On the other hand, one can argue that calibration to the level of the WTP for improved traffic safety leads to an overestimation of the loss of welfare during a pandemic that imposes a greater hazard to health during a limited period than would normally be the case with dangers from traffic. The mortality risk in Sweden was 50 times greater for COVID-19 (excess death rate) than traffic fatalities. The rate at which people will trade income for risk reduction diminishes as the magnitude of the risk increases (Lindhjelm et al 2010), and a common finding in the VSL elicitation literature is that WTP for a safety improvement increases much less in proportion to the size of the risk reduction,[1]For a recent Swedish example see Olofsson et al. (2019a). which may reflect diminishing returns and mental budget accounting by the individual (Thaler 1999).
Another distinct aspect related to the specific context of a pandemic is uncertainty, giving rise to dread. The effects of the COVID-19 pandemic were both difficult to predict and control and may have evoked more fear and anxiety (Jones 2020, Savage 1993) than would necessarily follow from changes in risk of mortality from other more well-known causes. A Swedish study by Olofsson et al (2019b) shows higher VSL for mortality risks, such as death from ALS and pancreatic cancer, are associated with higher levels of dread than fatal road traffic accidents. The difference is driven by the perceived level of control and experience, among other factors. This, in turn, implies that the economic values used here may underestimate the overall cost of the COVID-19 pandemic.
Footnotes
- ^ For a recent Swedish example see Olofsson et al. (2019a).
8.3 Fairness and equity
The design and assessment of health policies raise several issues of fairness and equity, and many of these are not addressed in this type of analysis. The v-value approach here is based on an aggregation of citizens’ preferences as the sum of individuals’ WTP while taking into account age-dependent expectancy of duration and health quality of remaining life. A benefit-cost assessment of a specific policy choice would have to include the possibility that policymakers may want to weigh benefits differently for different groups. For instance, should additional efforts, in terms of marginal cost, be put into saving the lives of those already in poor health as a method of compensating for the loss of health they have already experienced? There are also distributional issues related to the cost of COVID-19 response policies, such as the extent to which younger cohorts should be expected to make sacrifices that primarily benefit the elderly (Gollier 2020). It has been suggested that such considerations can be included by studies that expand into social welfare analysis (Adler 2019) and using utilitarian or even prioritarian welfare functions as a component (Adler 2019).
9 BCA case study: The effects of school closure on COVID-19 mortality in nursing homes
As a demonstration of how data from the cost-of-illness study can be used for a BCA study, we will perform an ex-post economic evaluation of the closure of upper secondary schools (USS) in Sweden during spring 2020 (from 17 March). This analysis is encouraged by the suggestion of a possible causal link between COVID-19 mortality and this closure intervention, proposed in a study by Nilsson (2021), under the Swedish ‘Corona Commission’, a group of independent experts commissioned by the government to scrutinise policy effects during the pandemic. Investigating determinants of mortality in nursing homes for the elderly during the first wave of the COVID-19 pandemic, this study examined the role of the extent the social networks of the relatives of the elderly residents, and the employees at the residential-care homes, played, measured by whether these persons live with children of varying ages or not. It found that a potentially larger network among employees, but not relatives, was associated with increased mortality among the elderly residents. The overall impact was driven by younger children, i.e., those children whose social contacts were not restricted by remote teaching. In particular, a significant decrease in the mortality in nursing homes can be associated with a larger share of workers with children affected by remote teaching. A placebo test for another time period provides support for this being a causal effect.
Based on this finding, it is possible to conduct a tentative ex-post societal benefit-cost assessment of the USS closure. We compare the actual closure with a counterfactual business-as-usual alternative, i.e., keeping these schools open as was the case for primary and lower secondary schools (while, for instance, in Norway, schools remained closed from mid-March until the end of April). Since USS teaching staff continued working with remote teaching, we consider the main cost of the evaluated alternative to be the long-term effects on the students’ future earnings (valued as the productivity loss to society, including income taxes, payroll taxes and contracted social fees). From an overview of the evidence on the efficacy of online remote-teaching, Hall (2022, this journal) concludes that the USS students will, on average, lose future earnings in a range from 0 to at most 0.3–0.6 percent. The question for our evaluation is, therefore, to determine to what extent the benefits from the indicated indirect effect of the USS closure on mortality among the very elderly in nursing homes was sufficient to, at a societal level, justify such a possible cost.
We calculate the maximum total cost, corresponding to a 0.6 percent relative loss of lifetime earnings for 360 000 USS students at 2 500 million euros (present value of lifetime productivity losses, for details, see supplement). On the benefit side, from the results reported in Nilsson (2021), we calculate that the USS closure avoided 279 deaths from COVID in the nation-wide sample of nursing homes used in the study. The total number of deaths from COVID in the sample of this study corresponds to 29 percent of the excess mortality in Sweden during the first half of 2020, and the calculated avoided number of deaths is 18 percent of the actual COVID mortality in these nursing homes. Using the data on deaths and costs for Sweden that we have presented in Tables 2 and 3, the societal benefit of this effect can be valued at approximately 150 million euros, or 6 percent of the maximum cost of the USS closure. Of course, it should be noticed that the cost of the USS closure may be much lower, possibly zero and that there probably were substantial additional benefits from the reduction of the transmission of the disease among students, teachers, families and others, including older people not living in nursing homes. Still, this BCA exercise showed that the magnitude of the worst-case assessment of the economic sacrifice of the USS students is considerable, even in comparison with the value of the substantial indirect beneficial effect on mortality in nursing homes for older people, as indicated by the Nilsson (2021) study.
10 Conclusions
As in most other countries, the economies of the Nordic countries sustained a heavy impact from the COVID-19 pandemic. Depending on differing circumstances, including national policy responses in sequential stages of the pandemic, some national variations in the extent of the overall macro-economic and public-health damages can be observed. Among the three countries studied in this report, Iceland had the largest proportional decrease of GDP in 2020 with -6.6 percent, while Norway and Sweden experienced changes of -3.6 percent and -2.8 percent, respectively (World Bank 2021). In our report, the picture that can be garnered from national accounts is complemented by an assessment of the cost-of-illness of the COVID-19 pandemic from early 2020 to 15 August 2021. Our main finding is that in health terms, Sweden suffered the most, with a cost corresponding to 1.4 percent of annual GDP, while the cost for Norway and Iceland were 0.1 percent and 0.2 percent of annual GDP, respectively. The primary explanation for these variations lies in the fact that only Sweden experienced a surge of excess mortality.
This cost assessment is subject to a number of limitations and uncertainties, some with respect to the availability of data, others to broader assumptions that can be discussed on various grounds, including ethical ones. For several reasons, however, the estimates can be seen as conservative, as they are based on excess deaths and not on total deaths; value of quality-adjusted life-years lost, not the value of statistical lives; and do not account for post-COVID effects. The main conclusion is, therefore, that the total overall cost of the COVID-19 pandemic, including both effects on GDP and public health, was substantial in these three countries. However, as the BCA case study demonstrates, some interventions during the COVID-19 pandemic may, nonetheless, have proved more costly to society in the long term than the disease itself.
References
Adler, M. (2019). Measuring Social Welfare: An Introduction. Oxford University Press.
Andersson, H. (2018). Application of BCA in Europe – Experiences and Challenges. Journal of Benefit-Cost Analysis, 9, 84–96.
Atkinson, G., Braathen, N. A., Groom, B., & Mourato, S. (2018). Cost-benefit analysis and the environment: Further developments and policy use. Paris, France: OECD.
Baker, R., Chilton, S., Donaldson, C., Jones-Lee, M. W., Lancsar, E., Mason, H., Metcalf, H., Pennington, M & Wildman, J. (2011). Searchers vs surveyors in estimating the monetary value of a QALY: Resolving a nasty dilemma for NICE. Health Economics, Policy and Law, 6(4), 435–447.
Briggs, A. H., Goldstein, D. A., Kirwin, E., Meacock, R., Pandya, A., Vanness, D. J. & Wisløff, T. (2021). Estimating (quality-adjusted) life-year losses associated with deaths: With application to COVID-19. Health Econ, 30(3), 699–707.
Claxton, K., Martin, S., Soares, M., Rice, N., Spackman, E., Hinde, S., Devlin, N., Smith, P. C. & Sculpher, M. (2015). Methods for the estimation of the National Institute for health and care excellence cost-effectiveness threshold. Health Technol Assess, 19(14), 1–503.
Comas-Herrera, A., Zalakin, J., Lemmon, E., Henderson, D., Litwin, C., Hsu, A. T., Schmidt, A. E., Arling, G., Kruse, F. & Fernández, J-L. (2020). Mortality associated with COVID-19 in care homes: international evidence. London, UK: International Longterm Care Policy Network.
Gollier, C. (2020). Cost-benefit analysis of age-specific deconfinement strategies. Journal of Public Economic Theory, 22(6), 1746–1771.
Hale, T., Angrist, N., Goldszmidt, R., Kira, B., Petherick, A., Phillips, T., Webster, S., Cameron-Blake, E., Hallas, L., Majumdar, S. & Tatlow, H. (2021). A global panel database of pandemic policies (Oxford COVID-19 Government Response Tracker). Nature Human Behaviour, 5, 529–538. Doi: 10.1038/s41562-021-01079-8
Hall, R. E., Jones, C. & Klenow, P. (2020). Trading off consumption and COVID-19 deaths. (National Bureau of Economic Research Working Paper, no. 27 340).
Hammitt, J. K. (2013). Admissible utility functions for health, longevity, and wealth: integrating monetary and life-year measures. Journal of Risk and Uncertainty, 47(3), 311–325.
Hammitt, J. K. (2020). Valuing mortality risk in the time of COVID-19. J Risk Uncertain, 61(2), 1–26.
Herrera-Araujo, D., Hammitt, J. K. & Rheinberger, C. M. (2020). Theoretical bounds on the value of improved health. Journal of Health Economics, 72, 102341.
Hollmann, M., Garin, O., Galante, M., Ferrer, M., Dominguez, A. & Alonso, J. (2013). Impact of influenza on health-related quality of life among confirmed (H1N1)2009 patients. PLoS One, 8(3).
Jones, D. (2020). The problem with risk. New Scientist, 248(3305), 40–45.
Kaiser, B., Jørgensen, H. P., Porto Echave-Sustaeta, L., Punt, M., Sølsten, S., Horbel, C., & Roth, E. (2020). The cost of being unprepared or the benefit of the precautionary principle? Comparing cost-benefit COVID-19 policies and outcomes in Scandinavia. Covid Economics, 39, 149–185.
Kouakou, C. R. C. & Poder, T. G. (2022). Willingness to pay for a quality-adjusted life year: a systematic review with meta-regression. Eur J Health Econ, 23(2), 277–299.
Lindhjelm, H., Biausque, V., Navrud, S., & Braathen, N. A. (2010). Valuing lives saved from environmental, transport and health policies: a meta-analysis of stated preferences studies. Paris, France: OECD.
Mishra, S., Scott, J. A., Laydon, D. J., Flaxman, S., Gandy, A., Mellan, T. A., Unwin, H. J. T., Vollmer, M., Coupland, H., Ratmann, O., Monod, M., Zhu, H. H., Cori, A., Gaythorpe, K. A. M., Whittles, L. K., Whittaker, C., Donnelly, C. A., Ferguson, N. M. & Bhatt, S. (2021). Comparing the responses of the UK, Sweden and Denmark to COVID-19 using counterfactual modelling. Scientific Reports, vol. 11.
Nilsson, P. (2021). Betydelsen av anställda och anhörigas sociala nätverk för smittspridning av COVID-19 på äldreboenden under 2020. Underlagsrapport till SOU 2021:89. Stockholm, Sweden.
Olofsson, S., Gerdtham, U. G., Hultkrantz, L. & Persson, U. (2019a). Dread and risk elimination premium for the value of a statistical life. Risk Analysis, 39(11), 2391–2407.
Olofsson, S., Gerdtham, U. G., Hultkrantz, L. & Persson, U. (2019b). Value of a QALY and VSI estimated with the chained approach. The European Journal of Health Economics, 20(7), 1063–1077.
Olofsson, S., Persson, U., Yan Gu, N., Gong, C., Jiao, X. & Hay, J. (2021). Quality of life in the Swedish general population during COVID-19 – based on pre- and postpandemic outbreak measurement. Nordic Journal of Health Economcis, 9(1).
Persson, U., Olofsson, S. & Keel, G. (2020). Disease burden associated with COVID-19 in Sweden – QALYs lost due to excess mortality. (Report 2020:8). Lund, Sweden: Institute of Health Economics.
Persson, U. & Olofsson, S. (2018). Ett QALY är mer värt än två miljoner kronor. Stockholm, Sweden: Läkartidningen.
Pifarré i Arolas, H., Acosta, E., López-Casasnovas, G., Lo, A., Nicodemo, C., Riffe, T. & Myrskylä, M. (2021). Y ears of life lost to COVID-19 in 81 countries. Scientific Reports, vol. 11.
Pindyck, R. S. (2020). COVID-19 and the welfare effects of reducing contagion. (National Bureau of Economic Research Working Paper, no. 27 121). Cambridge, MA: National Bureau of Economic Research.
Pratt, J. W. & Zeckhauser, R. J. (1996). Willingness to pay and the distribution of risk and wealth. Journal of Political Economy, 104(4), 747–763.
Ritchie, H., Mathieu, E., Rodés-Guirao, L., Appel, C., Giattino, C., Ortiz-Ospina, E., Hasell, J., Macdonald, B., Dattani, S. & Roser, M. (2021). Coronavirus Pandemic (COVID-19): Statistics and Research. Published online at ourworldindata.org, accessed 21/09/20 at: https://ourworldindata.org/coronavirus.
Rowthorn, R. & Maciejowski, J. (2020). A cost–benefit analysis of the COVID-19 disease. Oxford Review of Economic Policy, vol. 36.
Ryen, L. & Svensson, M. (2015a). Modelling the cost-effectiveness of impact-absorbing flooring in Swedish residential care facilities. The European Journal of
Public Health, 26(3), 407–411.
Ryen, L. & Svensson, M. (2015b). The willingness to pay for a quality adjusted life year: A review of the empirical literature. Health Economics, 24(10), 1289–1301.
Saunes, I. S., Vrangbaek, K, Byrkjeflot, H., Jervelund, S. S., Birk, H. O., Tynkkynen, L.-K., Keskimäki, I., Sigurgeird.ttir, S., Janlöv, N., Ramsberg, J., Hernandez-Quevedo, C., Merkur, S., Sagan, A., & Karanikolos, M. (2021). Nordic responses to COVID-19: Governance and policy measures in the early phases of the pandemic. Health Policy.
Savage, I. (1993). An empirical investigation into the effect of psychological perceptions on the willingness-to-pay to reduce risk. Journal of Risk and Uncertainty, vol. 6, 75–90.
Stockholms stad (2014). Boendetider vård- och omsorgsboenden i Stockholms stad [eng: Length of stay at care- and nursing homes in the city of Stockholm]. Stockholm, Sweden: Stockholms stads äldreförvaltning.
Svensson, M. & Hultkrantz, L. (2017). A comparison of cost-benefit and costeffectiveness analysis in practice: Divergent policy practices in Sweden. Nordic Journal of Health Economcis, 5(2), 41–53.
Svensson, M., Nilsson, F. L., & Arnberg, K. (2015). Reimbursement decisions for pharmaceuticals in Sweden: The impact of disease severity and cost effectiveness. Pharmacoeconomics, 33(11), 1229–36.
Thaler, R. H. (1999). Mental accounting matters. Journal of Behavioral Decision Making, 12(3), 183–206.
Thunström, L., Newbold, S. C., Finnoff, D., Ashworth, M. & Shogren, J. F. (2020). The benefits and costs of using social distancing to flatten the curve for COVID-19. Journal of Benefit-Cost Analysis, 11(2), 179–195.
Ursin, G., Skjesol, I. & Tritter, J. (2020). The COVID-19 pandemic in Norway: The dominance of social implications in framing the policy response. Health Policy and Technology, 9(4), 663–672.
Viscusi, W. K. & Masterman, C. J. (2017). Income elasticities and global values of a statistical life. Journal of Benefit-Cost Analysis, 8(2), 226–250.
Yarmol-Matusiak, E. A., Cipriano, L. E. & Stranges, S. (2021). A comparison of COVID-19 epidemiological indicators in Sweden, Norway, Denmark, and Finland. Scandinavian Journal of Public Health, 49(1), 69–78.
Supplement
This supplement provides detailed information on the references and assumptions for the data used to populate the cost-of-illness model and the BCA study.
Method A: Based on estimates in (Kouakou & Poder 2022, Table 4), from the overall regression model, excluding three studies and own calculations based on Eurostat (GNP/capita), Statistics Canada (Average individual income 2018, National and Quebec). UN Human Development Index and components and Statistics Sweden, Monthly Statistics. The average age of the adult population (over 18 years) was calculated from Swedish census data and used for all three countries. Generally, the most important exogenous variables are average income and average age of the population over 18 years (Christian Kouakou, pers. comm. 2021-08-24). Method B: Persson and Olofsson (2018) based on VSL (2016) = SEK 40.5 M and adapted to VSL (2016) = NOK 30.2 M.
The QALY-loss per death is assumed to be 3.33 with a standard error of 0.33 and normal distribution. The value per QALY is assumed at 79 180 euros (from SEK 808 000) with a standard error of 7 918 euros and normal distribution. The cost per inpatient day of 3 001 euros is based on the cost-per-patient database from Region Västra Götaland (VEGA-database) and with a standard error of 300 euros and a Gamma distribution. The share of cases in the age-range 15–74 years and the employment rates in this age range in the three respective countries are assumed to be fixed in the sensitivity analyses. The Swedish age-range data is from: www.folkhalsomyndigheten.se/smittskydd-beredskap/utbrott/aktuella-utbrott/COVID-19/statistik-och-analyser/bekraftade-fall-i-sverige/. The Norwegian age-range data is from https://www.fhi.no/en/id/infectious-diseases/coronavirus/daily-reports/daily-reports-COVID19/#by-sex-and-age. The Icelandic age-range data is from https://www.covid.is/data. The QALY loss per non-fatal case (0.009) assumes a standard error of 0.0009 and a Beta distribution. The production loss per non-fatal case is based on an assumption of an average of 10 days of sickness absence per case and the mean gross wage, including social fees in the respective country. Average wage data is from https://data.oecd.org/earnwage/average-wages.htm. For the sensitivity analyses, a standard error of a tenth of the mean is assumed with a Gamma distribution.
Payroll taxes and contracted fees (2021): 37.22 percent (Ekonomifakta 2022) Average annual income from earnings (2020): SEK 349 518 (Statistics Sweden) Discount rate: 3 percent Benefits Share of nursing –home workers with USS children Mean 14.47 percent, s.d 6.2 percent (Nilsson 2021) Average COVID mortality-rate spring 2000: 0.031 (1 544 deaths). The marginal effect on the COVID mortality rate of a standard deviation increase of the rate of workers with children at home with ‘unrestricted interaction’, i.e., ages 0–15 and 20+, 0.0043 Same effect for workers with children at home in the USS ages (15–19): 0.0019
Comment on L. Hultkrantz & M. Svensson: The economic cost of COVID-19: Iceland, Norway, and Sweden
Covid-19 affected all economies worldwide, including in all the Nordic countries. Consumer spending fell because people were afraid to go out or were in lockdown and unable to consume as much as usual. At the same time, production suffered as demand fell, and some people were prevented from going to work.
The extent of the pandemic and the health strategies introduced to cope with the virus differed from country to country. The authors present both the direct and indirect mortality and morbidity costs in three Nordic countries, converted to euro, to facilitate a comparison of the calculated economic losses. After conducting an impressive ‘numerical translation’, the authors show that higher mortality and morbidity figures express a considerably higher cost of illness per capita in Sweden than in Norway and Iceland.
Comparing the derived economic cost of illness to the GDP loss of each country, the authors courageously state that ‘some interventions during the COVID-19 pandemic may have been more costly to society than the disease itself’. This implies that interventions (or restrictions) were the driving force behind GDP losses. GDP loss in Sweden in 2020 was 2.8 percent, whereas it was 3.6 percent in Norway and 6.6 percent in Iceland. The authors’ cost calculations for the pandemic in Sweden, Norway and Iceland totalled 1.4 percent, 0.12 percent and 0.2 percent of GDP, respectively. The remainder of the fall in GDP can be assumed to come from other restrictions to the economy or behavioural change.
The GDP loss not only reflects the response to restrictions but also voluntary changes in individual behaviour. Legislative restrictions probably had the greatest effect on consumption. Nevertheless, even though Sweden relied more heavily on persuasion and voluntary behaviour than other countries, it still endured a large (or even greater) fall in individual expenditure, measured by Nordea credit card data available at the time, see Figure 1.
Figure 1 Individual expenditure, total value
If this is true, then the framework translating mortality and morbidity figures into euro is interesting in itself, but to confine the fall in GDP to the cost of restrictions alone, does not seem wholly credible. Difficult and differing calculations of the costs of the pandemic will hopefully pave the way for more informed policy making in the future, but there is still some way to go in this regard.
The views expressed are those of the author and do not necessarily reflect those of the Competition and Consumer Authority.
Comment on L. Hultkrantz & M. Svensson: The economic cost of COVID-19: Iceland, Norway, and Sweden
Several approaches have been used to estimate the value of health and safety. Typically, in the literature, this has been described as the problem of defining the ‘value of human life’. The first approach used was based on human capital theory. This theory rests upon the basic, simple proposition that people enhance their capabilities as producers and consumers by investing in themselves. Activities that influence future monetary and physical income by increasing the resources in people are called investments in human capital (Becker 1962).
The methodology was applied as early as in the seventeenth century by Petty (1699). Another contribution to the literature is ‘The Money Value of a Man’ by Dublin and Lotka (1946). Their purpose was to ‘estimate the value of a man to his dependents, that is to those who have a direct interest in his earnings’. In answering this question, Dublin and Lotka (1946) estimated the discounted present value of an individual’s net earnings. The net earnings were defined as the difference between discounted present value of future earnings and future consumer spending. This also answers the question; ‘What is the size of a life insurance for an individual in order to guarantee the same material living standard to a family should the family provider die?’ This net value is comparable to the value of a slave on the slave market, i.e., the expected value of a slave’s production minus the costs to provide the slave with food and shelter.
Another approach, including consumption by sick or injured individuals, is the gross loss of production value. In these calculations, there is no reduction in consumption value. The classical use of this approach is the estimate of the cost of war (see Petty 1699). The costs of the Franco–Prussian war in 1870–71 was estimated by Giffen (1880). The US involvement in the First World War and the associated loss of human resources valued by using the value of gross lost production was estimated by Clark (1931). This is the same approach used later on to estimate the value of lost production due to illness and injuries in cost of illness studies (COI).
The seminal work in the field of COI is Dorothy P Rice’s study from 1966, which presents and applies a methodology for estimating the cost of major disease categories in the US (Rice 1966). Additional examples applied to Sweden can be found in Lindgren (1981) and Rydenfelt (1949, reprinted 1991).
Using this approach, the economic costs associated with diseases or injuries are divided into two principal categories: direct costs and indirect costs. Direct costs represent the value of resources used for prevention, detection, treatment, rehabilitation and long-term care due to the existence of illness or injuries. Costs are estimated by summing up the expenditures on each category attributable to the disease or injury of interest. Indirect costs represent the value of the goods and services that would have been produced if a person had not fallen ill or been injured. This is often estimated using the ‘human capital’ approach, whereby the lost output is measured by the wages that could have been earned by individuals if the illness or injury in question had not occurred. The costs are estimated on the basis of observed market prices of goods, services and labour.
A completely different approach is the willingness-to-pay approach. In the influential article ‘The Life You Save May Be Your Own’, Schelling (1968) does not assess the value of a human life per se but of the prevention of death. Mishan (1971) and Jones-Lee (1976) also advocated that the cost of morbidity and mortality should be defined and estimated in terms of the value of their avoidance. This implies that a public allocative decision should take account of individual preferences at the time of the decision, i.e. an ex-ante valuation of the alternatives.
Of singular importance for the willingness-to-pay approach is that the changes in the probability of mortality and morbidity should be very small for any given individual. Empirical estimates of individual preferences for changes in survival probabilities are obtained by two different methods, the revealed preference approach (RP) or the stated preference approach (SP). In the RP approach, the individual’s trade off income for physical risk is typically estimated from labour markets or markets for safety goods. In the SP approach, people are more or less directly asked how much they would be willing to pay or would require in compensation for specific variations in risk.
In the paper by Hultkrantz and Svensson, the human capital approach to value lost production, i.e. the cost of illness approach, is used together with the willingness-to-pay approach in order to estimate the health-related cost of the COVID-19 pandemic in Iceland, Norway and Sweden. It should be noted that the cost of illness approach is a positive estimation of resources lost due to mortality and morbidity. The willingness-to-pay approach is a normative approach with the purpose of guiding allocative resource decisions to reduce morbidity and mortality.
Hultkrantz and Svensson use estimates of the number of deaths, lost quality-adjusted life-years (QALYs) due to deaths and the number of QALYs lost due to morbidity as health consequences of COVID-19. In addition, Hultkrantz and Svensson also include the production loss due to sick leave and health care treatment cost, i.e., the traditional cost components in a COI study.
Three different methods are used to estimate the value per QALY lost in the three countries. (A) Direct stated preference elicitation of the willingness-to-pay for choice alternatives with different QALY outcomes. Values are taken from a systematic review and meta-regression by Kouakou & Poder (2021). They are estimated to represent citizens’ preferences for QALY gain/losses. (B) The second method for valuation of QALY lost is an indirect approach based on estimates of the Value of a Statistical Death (VSL), i.e., the value of a VSL is divided by the predicted and (discounted) loss of future QALYs. (C) The third approach employs explicit cut-off thresholds used in cost-effectiveness analyses of medical treatments, e.g. in pricing and reimbursement officials’ decisions to include a new drug in tax-funded benefit programmes.
A and B are both values that are based on individual preferences ex-ante and correspond to a large extent with early theory by Mishan (1971) and Jones-Lee (1976); that the cost of morbidity and mortality should be defined and estimated considering the value of their avoidance. However, the third approach C, may to some degree be influenced by budgetary limitations. If so, the value is biased downwards. The same can be said of the value of health when represented as the health opportunity cost, sometimes called the k-value, to distinguish from the v-value, the consumption value of health. A and B approaches both represent the v-value.
Hultkrantz and Svensson suggest that their cost-of-illness study can be used as a platform for ex-post Benefit-Cost-Analysis (BCA), and they also provide an interesting example of school closure as one measure aiming at reducing transmission. All such BCA estimations are dependent on the availability of strong evidence demonstrating outcomes on morbidity and mortality that can be expected in the real world, not under ideal circumstances. Unfortunately, to a large extent, such evidence studies are still at a premature phase. Evidence from randomised clinical trials, Hirt et al. (2022), is highly regarded as well as meta-analysis, Hanke et al. (2022).
While waiting for robust clinical evidence for BCA, we can nonetheless learn something about the health loss associated with non-pharmaceutical interventions already introduced. For example, several studies have tried to estimate health-related quality of life loss related to restrictions. One example is a study by Persson et al. (2021a, 2021b). The aim of their study was to investigate how the health-related quality of life has changed during the COVID-19 in the general population in Sweden. They conducted three web-surveys of the population (18 years+): February 2020 (prior to COVID-19) n=1 016, April 2020 (first wave of COVID-19) n=1 003, January 2021 (second wave of COVID-19) n=1 013.
Their results for Sweden are summarised in Figure 1 and show that the loss of health due to excess mortality for the entire year 2020 was 42 802 QALYs. Loss of health for April 2020 was 29 263 QALYs and for January 2021 was 44 329 QALYs. The authors conclude that health loss due to restrictions and lockdown is, therefore, considerable and should be taken into consideration in future research.
Figure 1 QALY-loss by age
References
Becker, G. (1962). Investment in human capital: A theoretical analysis. Journal of Political Economy, 70(5), 9–49.
Clark, J. M. (1931). The cost of the world war to the American people. New Haven, CT: Yale University Press.
Dublin, L. I. & Lotka, A. J. (1946). The money value of a man. New York, NY: Ronald Press.
Giffen, R. (1880). Essays in finance. London, UK: G. Bell & Sons.
Hirt, J., Janiaud, P. & Hemkens, L. G. (2022). Randomized trials on non-pharmaceutical interventions for COVID-19: a scoping review. BMJ Evidence-Based Medicine.
Jones-Lee, M. W. (1976). The value of life: An economic analysis. Chicago, IL: University of Chicago Press.
Kouakou, C. R. C. & Poder, T. G. (2021). Willingness to pay for a quality-adjusted life year: a systematic review with meta-regression. Eur J Health Econ, 23(2), 277–299.
Lindgren, B. (1981). Costs of illness in Sweden 1964–1975. Lund, Sweden: Lund Economic Studies.
Mishan, E.J. (1971). Evaluation of life and limb: a theoretical approach. Journal of Political Economy, 79(4), 687–705
Persson, U., Olofsson, S., Gu, N. Y., Gong, C., Jiao, X. & Hay, J. (2021a). Livskvalitet i den svenska befolkningen under covid-19 [eng: Quality of life in the Swedish population during covid-19]. (State of the art Covid-19, 2021 Nov.). Stockholm, Sweden: Svenska Läkaresällskapet.
Persson, U., Olofsson, S., Gu, N. Y., Gong, C., Jiao, X. & Hay, J. (2021b). Quality of life in the Swedish general population during COVID-19 – based on pre- and post-pandemic outbreak measurement. Nordic Journal of Health Economcis, 9(1).
Petty, Sir W. (1964). The economic writings of Sir William Petty 1665. Together with the observations upon the bills of mortality. In Hull, C. H. (Ed.) Reprints of economic classics. New York, NY: Cornell University.
Rice, D. P. (1966). Estimating the cost of illness. (Health Economic Series, no. 6). Washington, DC: US Department of Health, Education and Welfare.
Rydenfelt, S. (1949). Sjukdomarnas samhällsekonomiska aspekt [eng: The economic aspect of diseases]. Mimeograph. Lund, Sweden: Department of Economics.
Rydenfelt, S. (1991). Sjukdomarnas samhällsekonomiska aspekt [eng: The economic aspect of diseases]. IHE Monograph. Lund, Sweden: Institutet för hälso- och Sjukvårdsekonomi.
Schelling, T.C. (1968). The life you save may be your own. In Chase, S. B. (Eds.) Problems in public expenditure analysis. Washington, DC: The Brookings Institution.

Schooling in the Nordic countries during the COVID-19 pandemic
Abstract
This article gives an overview of the extent of school closures and use of distance learning in the Nordic countries during the COVID-19 pandemic. We also discuss expected effects on student outcomes. Surveys indicate that the Nordic education systems were relatively well-prepared for a transition to distance learning in terms of access to digital technology. Sweden kept compulsory schools open to a greater extent than the other countries, while policies at the upper-secondary level were more similar across the region. Research suggests that school closures can be expected to have long-term negative effects on skill formation and future earnings and that the negative impacts are likely to be larger for disadvantaged students and larger the younger the students were when exposed to remote instruction. The size of the long-term impact will eventually depend on the success of policies put in place to counteract the potential negative effects on student learning.
Keywords: school closures, distance learning, COVID-19, student performance.
JEL codes: I21, I24, I26, I28.
1 Introduction
Schooling is the most important public policy tool available for raising skill levels, and ample evidence exists of the positive impacts of enhanced skills and abilities on subsequent labour market attachment and trajectories. In countries like those in the Nordic Region, where education is free and universal, and where quality differences between private and public schools are small, schooling is also a major tool to enhance social mobility. The COVID-19 pandemic has implied a huge shock to education systems worldwide. Most governments have taken the precautionary measure of closing schools and initiating remote teaching to help reduce the spread of the virus. School lockdowns are likely to have had a considerable impact on how much students have learned with potential long-term consequences, as has been pointed out and assessed in a number of studies (e.g., Hanushek & Woessmann 2020, Kuhfeld et al. 2020, Psacharopoulos et al. 2021). The measures put in place have varied across countries, and so has the preparedness of the education systems to handle a shift to remote learning. In this article, we take a closer look at school closures and the use of distance learning in compulsory and upper secondary schools in the Nordic countries (Sweden, Norway, Denmark, Finland, and Iceland) during the initial phase of the COVID-19 pandemic (March 2020 to June 2021).
In light of the preparedness of the education systems and various reports summarising the recent experiences from the educational sectors in the region, we discuss the expected impact of distance learning on student outcomes in the short and long term. We draw both on research conducted before the pandemic on the effects of distance learning and school closures on student performance, and on the few recent studies of how COVID-19 has affected learning outcomes.[1]We only include studies based on objective learning measures, i.e., not based on teacher assessments. We primarily include studies from the Nordic countries and studies from countries with similar education systems and levels of preparedness for remote teaching. However, research from other international contexts is brought up in certain discussions. For example, the most reliable studies on the impact of distance learning conducted before the pandemic are from the US. It should be noted that new research on the impact of the COVID-19 pandemic is still being compiled and released at the time of writing. We have tried, as far as possible, to include studies published up to the end of 2021. The compilation of knowledge presented in this article can serve as a guide to policy makers, suggesting areas to emphasise when developing policies to counteract the potentially multiple negative effects of school closures on student learning.[2]See Werner and Woessmann (2021) for a study with a similar ambition but focused on Germany.
Footnotes
The pandemic has been an unprecedented event and, of course, any predictions of the future are tentative. To investigate the effects of schooling conditions today on future outcomes, we could model how outcomes are likely to develop under different assumptions based on previous research. Some studies already employ this approach (e.g., Fuchs-Schündeln et al. 2020, Hanushek & Woessmann 2020). Here, we focus less on quantifying possible effects. Rather, we discuss potential implications of school closures and remote learning for students’ learning environments and how children in different age groups and from different socio-economic backgrounds may be affected.
In an international perspective, the Nordic countries, with the exception of Sweden during the start of the pandemic, have had among the lowest incidence of deaths among advanced economies.[1]Data on the coronavirus is available on the website of Worldometer. Information was retrieved 30/06/2021 from https://www.worldometers.info/coronavirus/?#countries. In many regards, the Nordic countries have taken similar actions. For example, all countries permitted (even encouraged) outdoor activities, such as exercising and going for walks. In comparison with most other advanced economies, they prioritised the return of pupils to school, particularly the youngest ones, above the return to work. However, there are also clear differences in policy between the countries. For instance, Sweden adopted a less interventionist proactive approach to the pandemic in comparison to its neighbours, and as we shall see, this included policies in the education sector. Accordingly, it is interesting to discuss to what extent the experiences are similar in the various Nordic countries, and whether the expected impacts are likely to be the same. Although this article does not represent a systematic and pervasive comparative study, we allow ourselves to discuss these matters to some extent.
Footnotes
- ^ Data on the coronavirus is available on the website of Worldometer. Information was retrieved 30/06/2021 from https://www.worldometers.info/coronavirus/?#countries.
We limit the focus of this article to a discussion of possible and revealed effects of school closures and remote teaching on student learning, although the pandemic is likely to have impacted school children and their families in a multiplicity of ways. Our intention is to discuss how student learning is likely to have been impacted by receiving education in the home compared to attending school as usual. We leave it to others to investigate whether decisions regarding how to organise teaching during the pandemic were important for the spread of infection, parents’ ability to work, health issues, etc., and the effects of these factors on children in the long term.
This review is structured as follows: In Section 2, we define distance learning and discuss how it might impact student learning. In Section 3, we describe when schools in the Nordic countries have been opened and closed, and to what extent distance learning has been used, during the period March 2020 to June 2021. Section 4 focuses on the experiences of providing remote teaching during the pandemic in the Nordic countries. This discussion is based on descriptive reports, primarily survey studies, from the various countries. In Section 5, we present an overview of international research on the causal effects of distance learning on student performance. The greater part of this research has been conducted before the pandemic. In Section 6, we broaden our perspective by covering lessons that can be drawn from previous research on temporary school closures, hours of teaching, class size, graduation standards and exams and the importance of the family environment in supporting children’s learning. Previous studies from these fields of research can help us shed light on some of the potential dangers school closures presented to student learning during the pandemic. Section 7 concludes the paper.
2 Distance learning – expected effects on learning
In the Nordic countries, the relevant policy alternative during the pandemic was never a complete closure of schools without any teaching at all, but rather a transition to distance learning. Distance (or remote) learning is a form of education where students and teachers, instead of meeting in-person, hold classes and communicate through the internet, communication platforms, e-mail, etc. Distance learning can be both synchronous through real-time interaction and asynchronous through self-paced learning activities that take place independently of the teacher. In the first case, students and teachers are separated in space; students follow an online class in real-time and have the possibility to interact with the teacher and each other. In the latter case, students and teachers are separated both in space and time; for example, when students follow a pre-recorded lecture. Prior to the COVID-19 pandemic, teaching in-person was the norm at the compulsory and upper secondary level in all the Nordic countries, although distance learning was occasionally used under special circumstances.[1]For example, Sweden sometimes allowed for synchronous remote instruction if the student base was very small or when there was a severe lack of qualified teachers. In such cases, students participated in distance learning on school premises and a mentor was present (see, e.g., SOU 2017).
In theory, transitioning to distance learning could have both positive and negative effects on how much students learn.[2]The following discussion is partly based on a review article by Escueta et al. (2020). One advantage of distance learning often highlighted in the literature is the increased flexibility this form of teaching entails: students are able to access course material, including pre-recorded lectures, whenever it suits them, and they have greater possibilities to spend more time on content they find difficult and skip parts they have already mastered. Through distance learning, students can potentially also gain access to a larger supply of courses than is available locally. However, it is hard to believe that the latter has been the case during the switch to distance learning brought on by the COVID-19 pandemic. Moreover, distance learning is sometimes advocated from a cost-saving perspective (e.g., Deming et al. 2015), but in this article, we will disregard any effects on school budgets. It is not likely that the rapid transition to remote learning has resulted in cost-saving opportunities for schools. On the contrary, the opposite may be the case, given that several reports find that the teachers’ and school principals’ workloads have increased (see Section 4). Researchers have noted that it is hard to believe that schools have been able to take full advantage of the positive aspects of remote instruction during the pandemic. It has also been suggested that the type of instruction provided during the crisis has been more of a temporary solution. Thus, emergency remote teaching has been proposed as a more appropriate term to denote online teaching during a crisis like the COVID-19 pandemic (Bozkurt & Sharma 2020, Hodges et al. 2020).
Footnotes
- ^ For example, Sweden sometimes allowed for synchronous remote instruction if the student base was very small or when there was a severe lack of qualified teachers. In such cases, students participated in distance learning on school premises and a mentor was present (see, e.g., SOU 2017).
- ^ The following discussion is partly based on a review article by Escueta et al. (2020).
One of the concerns raised is that distance learning tends to demand more of the students themselves in terms of planning and self-discipline. Students who struggle with these challenges run an increased risk of falling behind. Here, we can expect a strong age gradient, where remote learning can be expected to be more challenging the younger the students are, and increasingly dependent on parental assistance to work satisfactorily. Moreover, it is likely that distance learning removes opportunities for interaction that arise more naturally when students and teachers meet in-person, and makes it is harder for teachers to adjust the lessons to the students’ specific needs. The social interactions that take place in a physical school setting are also important for the development of non-cognitive abilities, such as social skills, perseverance, teamwork, which are important for future labour market prospects (e.g., Heckman & Rubinstein 2001). To meet teachers and fellow students in-person can also create more social pressure to perform better and motivate students to be more committed to their studies (Loeb 2020).[1]Effects of distance learning may differ for boys and girls. Research finds that competitiveness is more prevalent in boys (Gneezy & Rustichini 2004), which can affect the willingness to perform. It is also possible that home schooling could be beneficial for a small group of students who prefer a less competitive or social interactive environment.
Note that the expected advantages and disadvantages can differ somewhat depending on whether distance learning is synchronous or asynchronous. For example, asynchronous teaching with self-paced learning activities is likely to provide greater flexibility, while opportunities for interaction are better with real-time instruction. In our review of the research presented in Section 5, we make no distinction between synchronous and asynchronous remote teaching. In the studies conducted before the pandemic that we refer to, there are elements of real-time interaction, but in most cases, distance learning has been asynchronous. We have no detailed information on the extent to which schools in the Nordic Region relied on synchronous vs asynchronous remote teaching during the pandemic. In practice, it has often been up to individual schools and/or teachers to decide on these matters. Thus, it is reasonable to believe that the use of synchronous vs asynchronous practices varies.
Footnotes
- ^ Effects of distance learning may differ for boys and girls. Research finds that competitiveness is more prevalent in boys (Gneezy & Rustichini 2004), which can affect the willingness to perform. It is also possible that home schooling could be beneficial for a small group of students who prefer a less competitive or social interactive environment.
3 School closures and distance learning in the Nordic countries during the pandemic
In this section, we describe the extent to which each of the Nordic countries has relied on distance learning for compulsory and upper secondary schooling[1]All five countries have nine or ten years of comprehensive compulsory schooling, after which students may continue to upper secondary school which consists of several different tracks (both general college preparatory and vocational). Upper secondary school is voluntary, but the vast majority choose to pursue this level of education in all of the Nordic countries. during the first three semesters of the pandemic, more specifically from March 2020 until June 2021. Table 1 provides a summary of the various strategies adopted. But before going into the details for each country, it is helpful to state some common features as well as outline some broad differences between the policies adopted.
Overall, the initial strategies followed to fight the COVID-19 pandemic were based on the understanding that children and adolescents were not the driving force of the pandemic: they did not seem to spread the virus as easily and were not getting as sick as older individuals, although the risks were assumed to increase with age. There was also a widespread conviction that school closures would have severe negative impacts on children, such as loss of learning opportunities and worse mental health, as school attendance is also considered important for a child’s social and emotional wellbeing and development.[2]See, e.g., Public Health Agency of Sweden (2020). In all of the Nordic countries, however, children were obliged to stay home from school if they had COVID-19 symptoms, and COVID-tests have been required or recommended if symptoms were noted.[3]There are also reports, from at least Sweden and Norway, of parents choosing to keep their children home from school due to fear of infection (Swedish Schools Inspectorate 2020, Norwegian Directorate for Education 2021c). Sometimes schools provided remote teaching to students also during such spells of absence. Common for all the Nordic countries, except Iceland, is also that many standardised national exams have been cancelled.
Footnotes
- ^ All five countries have nine or ten years of comprehensive compulsory schooling, after which students may continue to upper secondary school which consists of several different tracks (both general college preparatory and vocational). Upper secondary school is voluntary, but the vast majority choose to pursue this level of education in all of the Nordic countries.
- ^ See, e.g., Public Health Agency of Sweden (2020).
- ^ There are also reports, from at least Sweden and Norway, of parents choosing to keep their children home from school due to fear of infection (Swedish Schools Inspectorate 2020, Norwegian Directorate for Education 2021c).
Table 1 Summary of school closures and distance learning in the Nordic countries
| Sweden | Norway | Denmark | Finland | Iceland | |
| Primary School | |||||
| Spring 2020 (from mid-March) | Open | Closed for 6 weeks for grades 1–5 and 9 weeks for grades 6–7. Thereafter open | Closed for 4 weeks for grades 1–5 and 8 weeks for grades 6–9. Thereafter open | Open for grades 1–3, but remote teaching was recommended. Closed for 8 weeks for grades 4–6, thereafter open | Open, but with limited activities for 6 weeks |
| Autumn 2020 | Open | Mostly open except for a couple of weeks around Christmas | Open for grades 1–4. Closed for 2 weeks before Christmas for grades 5–9 in half of the municipalities. Otherwise partially open, with local exceptions | Open, with local exceptions for grades 4–6 | Open, with local exceptions (in some cases also limited activities) |
| Spring 2021 | Open | Mostly open except for a couple of weeks around Easter | Closed for 5 weeks for grades 1–4, thereafter open. Closed until 15 March for grades 5–9, thereafter partially open (50 % for grade 9 and 1 day/week for grades 5–8) with local exceptions. From 6 April: 50 % open for all. From 6 May: Fully open | Open, with local exceptions for grades 4–6 | Open, except for 2–4 days before Easter |
| Middle school | |||||
| Spring 2020 (from mid-March) | Open | Closed for 9 weeks, thereafter partially open | See above | Closed for 8 weeks, thereafter open | Open, but with limited activities for 6 weeks |
| Autumn 2020 | Open | Open or partially open, with local exceptions. Fully closed for 2 weeks | See above | Open, with local exceptions | Open |
| Spring 2021 | Open, with local exceptions | Open or partially open, with local exceptions. Closed for 2 weeks around Easter | See above | Partially open, fully closed for 3 weeks | Open, except for 2–4 days before Easter |
| Upper secondary school | |||||
| Spring 2020 (from mid-March) | Closed | Closed for 9 weeks, thereafter partially open | Closed for 6–10 weeks | Closed | Closed for 6–8 weeks |
| Autumn 2020 | Partially open, fully closed for 2 weeks | Open or partially open, with local exceptions. Closed for 2 weeks around Christmas | Partially open, with local exceptions. Closed for 2 weeks before Christmas in half of the municipalities | Open, with local exceptions | Open, but with limitations and distance learning during peak of infections |
| Spring 2021 | Partially open | Open or partially open, with local exceptions. Closed for 2 weeks around Easter | Closed for 8 weeks. Thereafter gradually reopened, starting with students in the final year. From 21 May fully open | Partially open, fully closed for 3 weeks | Open, except for 2–4 days before Easter |
From March 2020, Denmark and Norway closed all schools and introduced distance learning for school children of all ages for a period of four to eight weeks.[1]The decision to close schools for the youngest students was not unanimous. For instance, in Norway an important argument for the closure of schools was to minimise mobility. From the outset, the Norwegian Heath Institute did not support the initiative. The Holden Commission (Norwegian Directorate of Health 2020) concluded in April that closing schools and kindergartens was the measure that incurred the highest socio-economic cost and the Corona commission (NOU 2021) arrived at the same conclusion. The school closures often lasted longer for the older students. Finland adopted a similar strategy during spring 2020, with the exception that children in grades 1–3 could attend school (although distance learning was strongly recommended also for this age group). During the same period, Iceland closed upper secondary schools and imposed certain limitations on compulsory schools, whereas Sweden only introduced distance learning in upper secondary school. During the remainder of the period covered in this article, all of the Nordic countries except for Denmark[2]Denmark had a longer period of school closures also during the spring of 2021, see Table 1. kept compulsory schools open most of the time, but often with regional or local (temporary) exceptions in areas/schools with a high rate of COVID-19 infection. Overall, Sweden stands out as having kept its compulsory schools open to a greater extent than the other countries. This is not the case for upper secondary school, where Sweden and Finland had the longest periods of school closures during spring 2020. In spring 2021, Denmark instead stands out by imposing the most restrictive policies on attendance in upper secondary schools in the Nordic Region.
Digital technology is a prerequisite for distance learning to work satisfactorily. In this respect, it is important to note that the Nordic education systems had come a rather long way already before the pandemic began. The conditions for remote learning in all five countries are rated among the best in the world in terms of digital preparedness (European Commission 2019, OECD 2021a). Even in the most disadvantaged schools[3]Defined as a school whose socio-economic profile is at the bottom quarter among all schools in the relevant country., over 90 percent of the students that took part in PISA 2018 reported that they had access to a computer linked to the internet at home which they could use for school work (OECD 2021a). It is common for upper secondary schools to provide students with their own computer. For instance, approximately nine out of ten upper secondary schools in Sweden provided students with their own laptop or tablet in 2018, according to the Swedish National Agency for Education (Swedish NAE 2019). In Norway, close to 100 percent of upper secondary school students had access to a computer provided by their school in 2019 (Fjørtoft et al. 2019). One-to-one computer programmes are also increasingly common among younger students, although computer access tends to increase with student age (Hall et al. 2021). For example, in Norway, 83 percent of students in grade 9 had access to a personal school computer in 2019, while the corresponding numbers for grades 7 and 4 were 56 and 32 percent, respectively (Fjørtoft et al. 2019).
Footnotes
- ^ The decision to close schools for the youngest students was not unanimous. For instance, in Norway an important argument for the closure of schools was to minimise mobility. From the outset, the Norwegian Heath Institute did not support the initiative. The Holden Commission (Norwegian Directorate of Health 2020) concluded in April that closing schools and kindergartens was the measure that incurred the highest socio-economic cost and the Corona commission (NOU 2021) arrived at the same conclusion.
- ^ Denmark had a longer period of school closures also during the spring of 2021, see Table 1.
- ^ Defined as a school whose socio-economic profile is at the bottom quarter among all schools in the relevant country.
Access to computers is, of course, not enough for distance learning to work well. Teachers may, for example, lack the skills needed to be effective using this mode of instruction. In a survey conducted among lower-secondary teachers in 2018, 19–22 percent in Finland, Sweden, Norway, and Iceland reported a high level of need for professional development in ICT skills for teaching (OECD 2020c, 2020d, 2020e, 2020b). These figures are close to the OECD average of 18 percent. Digital competence among teachers was somewhat higher in Denmark, where only 11 percent reported the same level of need (OECD 2020a).
When distance learning has been used in the Nordic countries during the COVID-19 pandemic, children with limited access to a computer or the internet have usually been offered instruction in the school facilities. This has sometimes also been the case for children from a disadvantaged home environment and children with special needs, as well as those with parents in essential professions like nurses and doctors. For example, 34 000 pupils in compulsory school in Norway had in-person instruction during periods when the schools were closed in 2020 (Norwegian Directorate for Education 2020b).
3.1 Sweden
In Sweden, all teaching in upper secondary schools was to be carried out remotely from 18 March 2020. In practice, this meant that most teaching during the last three months of the spring semester was online, although sometimes in combination with classes held on the school premises (Swedish NAE 2020b). Compulsory schools (grades 1–9), on the other hand, were not affected – they remained open as usual. In May 2020, the Swedish Teachers’ Union conducted a survey among their members. They found that around 75 percent of the upper secondary school teachers who responded to the survey had switched entirely to remote teaching.[1]This proportion increases to approximately 90 percent, if we include teachers answering that more than half of their teaching is conducted remotely. Even though compulsory schools continued to be open throughout the spring, distance learning was sometimes used here as well, for example, for students who were absent.[2]In grades 7–9, four out of ten teachers had provided remote instruction for students. In grades 4–6, the corresponding number was three out of ten, and in grades 1–3, two out of ten (Swedish Teachers’ Union 2020).
From March 2020 to June 2021, several decisions were made regarding possibilities of providing in-person vs remote instruction. In compulsory schools, teaching was mainly conducted on site throughout the entire period, but the government increased the possibilities for local school organisers to decide when to use distance learning. In particular, the opportunities to use remote instruction were increased for lower secondary schools (grades 7–9) in the spring semester of 2021. A survey by the Swedish Teachers’ Union (2021) in February 2021 showed that approximately half of their members working in lower secondary schools used some degree of remote instruction. However, distance learning became less frequently used as the semester progressed (Swedish NAE 2021a, 2021b, 2021c). Younger children (grades 1–6) were almost exclusively taught on-site.[3]Note that remote learning was used to a small extent also in grades 1–6. According to the Swedish Teachers’ Union (2021), approximately 1–10 percent of their members in grades 1–6 conducted some teaching remotely in February 2021.
In upper secondary schools, the situation was somewhat different. After conducting remote instruction throughout the spring semester 2020, it was decided that teaching at this level would be on-site again in the autumn, although the option of partially using remote instruction remained open. The government also emphasised that teaching should be carried out so that the guidelines that applied to society as a whole could be followed.[4]For example, the general recommendations on social distancing and restrictions on the number of people that were allowed to gather in one place. This meant that distance learning continued to be a common feature also during the autumn semester. On 3 December 2020, it was again decided that all teaching in upper secondary schools would be carried out remotely for the remaining two weeks of the semester. In January 2021, upper secondary schools gradually began to transition back to teaching in-person. However, as the COVID-19 situation was still considered severe, caution was urged, and decisions about when and how to use remote instruction were to be made locally by school organisers depending on their local situation. Thus, distance learning remained an element of education in many upper secondary schools,[5]According to a survey of principals of upper secondary schools conducted in April 2021, 60 percent of the principals participating in the study reported that in-person and remote instruction was combined. When remote learning was used, it was almost always conducted as synchronous instruction (Swedish Schools Inspectorate 2021). although the amount of classroom teaching increased during the spring (Swedish NAE 2021c, 2021b).
Footnotes
- ^ This proportion increases to approximately 90 percent, if we include teachers answering that more than half of their teaching is conducted remotely.
- ^ In grades 7–9, four out of ten teachers had provided remote instruction for students. In grades 4–6, the corresponding number was three out of ten, and in grades 1–3, two out of ten (Swedish Teachers’ Union 2020).
- ^ Note that remote learning was used to a small extent also in grades 1–6. According to the Swedish Teachers’ Union (2021), approximately 1–10 percent of their members in grades 1–6 conducted some teaching remotely in February 2021.
- ^ For example, the general recommendations on social distancing and restrictions on the number of people that were allowed to gather in one place.
- ^ According to a survey of principals of upper secondary schools conducted in April 2021, 60 percent of the principals participating in the study reported that in-person and remote instruction was combined. When remote learning was used, it was almost always conducted as synchronous instruction (Swedish Schools Inspectorate 2021).
3.2 Norway
All kindergartens and schools in Norway were closed from 13 March to 26 April 2020. Thereafter, schools gradually reopened, beginning with the youngest students. By 11 May 2020, all schools were fully reopened. Remote instruction was used during the school closures.
Since the start of the school year 2020/21, schools have, for the most part, remained open. Except for during some higher peaks of infection rates when all schools were closed – at the start of the pandemic, around Christmas 2020, and Easter 2021 – it has been up to the municipality/institution to decide on educational measures (NOU 2021). When schools were notified of a COVID-19 outbreak, all individuals who potentially could have had contact with the infected had to isolate for ten days. This meant that several classes and grades, and sometimes the entire school, switched to distance learning from one day to the next. The overall policy has been to give priority to classroom teaching for the youngest pupils. To ensure that remote teaching was not used more than necessary, a directive was introduced on 25 January 2021, under which decisions about distance learning had to be reported to a higher public authority.
Oslo is a special case, as it has had considerably higher levels of infection and transmission than the rest of the country. In an attempt to flatten the curve, the city mayor implemented considerably more restrictive policies than elsewhere. Primary school children have received some remote instruction, but teaching has taken place mostly at school. Around half of Oslo’s primary school students received either a combination of remote and in-person schooling or just schooling at home (NOU 2021). Lower secondary schools have generally mixed remote and in-person teaching, and upper secondary schools have mostly relied on remote teaching. Since Christmas 2020, and due to the spread of more contagious COVID-19 variants, policies became even more restrictive. Oslo reopened in the last week of May 2021.
3.3 Denmark
On 16 March 2020, all schools and other educational institutions in Denmark closed and moved to remote teaching. A month later, a gradual reopening began, starting with schools for the youngest children. Preschools, early childhood care centres, and primary grades 0–5 reopened on 15 April (the first country in Europe to start reopening). Both lower and upper secondary schools were allowed to reopen for senior year students after six weeks; special needs schools were also allowed to reopen on this date. Grades 6–10 stayed closed for eight weeks and reopened on 18 May. During lockdown, schools had an obligation to provide extra support to students with special educational needs. Additional support was also provided to vulnerable student groups to prevent drop-out rates from rising.
Schools remained partly open for the autumn semester of 2020. The usual pattern was to divide classes into two or three smaller groups and, whenever possible, teaching took place outdoors. Attendance was staggered to avoid crowding, students were required to observe social distancing regulations, and desks were placed two metres apart. It was also common for students to have shorter school days and/or to not have daily attendance. Any child or teacher displaying even minor COVID-19 symptoms was not allowed to attend school. Students in isolation at home were entitled to receive remote instruction, and it was up to their parents to decide when they could return to school.
As of 9 November 2020, and through April 2021, more restrictive policies were again introduced. During this period, restrictions and the degree of lockdown imposed on schools varied by regional level of contagion with the most strongly affected municipalities giving priority for classroom teaching for the youngest students (grades 1–4) and those in the final years of lower secondary school. For instance, on 9 December, all schools in 38 municipalities closed and switched to remote teaching for all students (except grades 1–4 and vulnerable students). From Christmas until 8 February, Danish schools again went into a total lockdown with remote teaching. Schools gradually reopened during the spring semester; they were closed for five weeks for grades 1–4, while most students in grades 5–8 had limited in-person teaching for approximately three months. From 6 May 2021 onwards, all 0–10 grade classes were allowed to return to school every day. As for upper secondary school, final year students returned part-time after eight weeks, and the rest after about three months. From 21 May, all students were allowed full access to their schools until the end of the semester.
3.4 Finland[1]This section is based on information from the following sources: Ahtiainen (2021), Lavonen and Salmela-Aro (2022), Finnish NAE (2020, 2021a, 2021b).
From 18 March until 14 May 2020, Finland closed its school system and transitioned to remote instruction (i.e., for a total of eight weeks). Students with special needs and children in grades 1–3 were still allowed to attend school in-person. However, remote instruction was recommended for students in grades 1–3 where possible. Compulsory schools (grades 1–9) returned to the classrooms in mid-May, whereas teaching in upper secondary schools continued to be conducted remotely throughout the spring semester.
When the new school year started in mid-August, the general recommendation was that teaching should take place in classrooms, but schools were advised to switch to remote instruction if COVID-19 made it impossible to deliver teaching on site in a safe way. Finland relied on their decentralised institutional setting, and local school authorities were given a mandate to decide whether to provide in-person or remote instruction based on the number of verified COVID-19 cases in their area. This meant that the use of distance learning varied geographically. However, remote instruction was not possible for students with special needs or for children in grades 1–3.
In March 2021, the spread of COVID-19 was deemed problematic, and distance learning was introduced for all students in grade 7 and upwards for three weeks starting on March 8. Younger students continued to be taught in classrooms. In April 2021, all schools were reopened, including upper secondary school.
Footnotes
- ^ This section is based on information from the following sources: Ahtiainen (2021), Lavonen and Salmela-Aro (2022), Finnish NAE (2020, 2021a, 2021b).
3.5 Iceland
As in the other Nordic countries, Iceland’s upper secondary schools switched to remote instruction in mid-March 2020. In compulsory school, activities were limited. For example, a ban on gatherings of more than 20 people guided decisions on how to organise teaching. In practice, this implied different things in different schools: school days were shortened, subjects like sports, arts and crafts were postponed, canteens were closed, some schools stopped providing school transport, and schools where COVID-19 spread among the staff were closed.[1]A survey by Statistics Iceland shows that 80 percent of the students in compulsory schools did not miss any teaching day or only missed 1–2 days during the 2019–2020 school year due to school closures. However, on average there were 14 days with reduced attendance. Remote learning was more common among older children: in the first grade the average number of days of remote learning was 2.3 and in grade 10 it was 9.9 days (see https://www.statice.is/publications/news-archive/education/covid-19-and-school-days-in-compulsory-schools-2019-2020/). Remote instruction was common for the higher grades. As of 4 May 2020, upper secondary schools reopened with certain limitations, whereas compulsory schools essentially returned to normal.
During the autumn semester of 2020, schools were, in principle, open in Iceland. However, restrictions, such as mask wearing, social distancing and upper limits on the number of people who could gather also applied in the education system. The precise restrictions were altered and adjusted a couple of times during the autumn, and restrictions were stricter in upper secondary schools than in compulsory schools. Remote teaching was still used to some extent during this semester, especially for older students.
On 1 January 2021, new rules on school restrictions were introduced: upper secondary schools were able to start the semester on-site to a large extent, and more relaxed regulations applied to compulsory schools. In mid-March 2021, the infection rate began to increase, especially amongst children. As a result, Iceland decided to start the Easter holiday break a couple of days earlier than normal. Schools reopened again on 31 March.
Footnotes
- ^ A survey by Statistics Iceland shows that 80 percent of the students in compulsory schools did not miss any teaching day or only missed 1–2 days during the 2019–2020 school year due to school closures. However, on average there were 14 days with reduced attendance. Remote learning was more common among older children: in the first grade the average number of days of remote learning was 2.3 and in grade 10 it was 9.9 days (see https://www.statice.is/publications/news-archive/education/covid-19-and-school-days-in-compulsory-schools-2019-2020/).
4 Student and teacher experiences during the pandemic
How COVID-19 has impacted the school systems in the Nordic countries has been the subject of several reports since the start of the pandemic. A common problem with many of these studies is that it is difficult to know to what extent the findings can be generalised; conclusions are sometimes based on qualitative data or non-representative samples. In addition, the time for planning, data collection and analysis has sometimes been limited. Nevertheless, similar findings can be observed in many of the studies, and we believe that these offer valuable insights, although some caution should be applied.
Some reports note that distance learning has worked surprisingly well given the circumstances (e.g., Finnish NAE 2020, Swedish NAE 2020e, 2020c, Swedish Schools Inspectorate 2020). The Norwegian Directorate for Education’s survey of school principals, school organisers and teachers shows that the digital infrastructure can hardly be regarded as an obstacle to implement remote instruction (Federici & Vika 2020). Almost nine out of ten schools report that they have the necessary digital infrastructure, such as computers, networks, programs and learning resources, to be able to provide students with education at home. This applies to both primary and secondary schools in Norway (Norwegian Directorate for Education 2021c).[1]The largest technical challenge for distance learning seems to be poor internet access (e.g., Andersen et al. 2021). A vast majority of teachers also report that they have improved their digital competencies during the pandemic (Federici & Vika 2020). Lavonen and Salmela-Aro (forthcoming), discussing the experiences in Finland, also conclude that teachers’ digital competencies improved during the pandemic and that the shift to remote teaching was rather smooth.
Footnotes
- ^ The largest technical challenge for distance learning seems to be poor internet access (e.g., Andersen et al. 2021).
Although the teaching may have worked better than many feared, most teachers and students believe that learning deteriorated when students and teachers did not meet in-person (Gudmundsdottir & Hathaway 2020, Fjørtoft 2020, Swedish Teachers’ Union 2020, Swedish Schools Inspectorate 2021, Swedish NAE 2021e, Ahtiainen 2021, Finnish NAE 2020, 2021a, 2021b, Lavonen & Salmela-Aro forthcoming). For example, reports from Sweden conclude that many teachers find it more difficult to help students reach the educational objectives when classes are held online (Swedish Teachers’ Union 2020, Swedish NAE 2021e) and the majority of students find that teaching in-person is more rewarding than remote instruction. Norwegian survey studies among students and teachers in upper secondary schools conclude that learning was significantly reduced during the school closure in the spring of 2020 (Andersen et al. 2021). A survey from Denmark reaches the same conclusions – students in upper secondary school experienced that they learned less when schools were closed (Wester 2021). A common view is that it is difficult to have discussions on digital platforms; students are generally less involved. This also means that it becomes harder for teachers to notice when students need additional help (e.g., Fjørtoft 2020, Swedish Schools Inspectorate 2021). Survey studies from other European countries show that many students only had sporadic contact with their teachers during school closures and that students spent less time on school work (e.g. Grätz & Lipps 2021, Grewenig et al. 2021, Andrew et al. 2020). Blikstad-Balas et al. (forthcoming) report the same patterns among Norwegian students, especially among the lowest grades. For instance, more than half of the parents of students in grades 1–4 respond that their child had contact with their teacher 2–3 times a week at most and that the child spent less time on schoolwork than on a normal school day.
Several studies from Norway indicate that many teachers found both motivating students and creating an engaging online classroom environment challenging (Gudmundsdottir & Hathaway 2020, Fjørtoft 2020, Federici & Vika 2020, Norwegian Directorate for Education 2020b). Decreasing student motivation during the pandemic is also found in studies from the other Nordic countries (e.g., Ahtiainen 2021, Swedish Schools Inspectorate 2020, Finnish NAE 2020, 2021a, 2021b). Another finding from a large-sample study of Icelandic students, aged 13–18, is that depressive symptoms increased, and mental wellbeing decreased during the pandemic, beyond expectations based on previous trends. This pattern is especially strong among girls and among 16–18-year-olds (Thorisdottir et al. 2021).[1]However, the study finds that substance use decreased. A Norwegian study, based on population-wide data on health care consultations related to mental health symptoms and disorders among 6–19-year-olds, also find evidence of deteriorating mental health, which became apparent during the autumn of 2020 and onwards (Evensen et al. 2021).[2]There are also some Norwegian studies, based on much smaller samples (2500-3500 students), that do not find any increase in depressive symptoms, based on self-reported data; see Hafstad et al. (2021) and Burdzovic and Brunborg (2021). However, it is not clear to what extent these patterns are caused by school closures or by other circumstances during the pandemic. Svaleryd and Vlachos (2021) try to separate the effect of school closures from the effects of other pandemic-related factors, by comparing how mental health indicators developed over time for Swedish students in upper secondary school (which was partly closed) with the development for students in lower secondary school (which remained open). Using data on health care contacts and prescriptions of medication for psychiatric conditions, they find that mental health among upper secondary school students, in fact, seemed to improve during the period schools were partly closed. Hence, the findings in Svaleryd and Vlachos (2021) suggest that deteriorating mental health may not have been caused by school closures alone, but also by other policies that reduced social contact during the pandemic.
Footnotes
Certain groups of students are likely to have been more adversely impacted by distance learning than others. A general observation is that remote learning seems to have worked better for older students than for younger (e.g., Swedish NAE 2020e, 2021e, Swedish Schools Inspectorate 2021, Blikstad-Balas et al. forthcoming). Moreover, vulnerable groups are often disadvantaged by remote learning. For example, children with poor Swedish language skills – especially those who have recently immigrated[1]A lack of digital skills and restricted access to computers and the internet among new immigrants are some of the problems highlighted. Schools were, in many cases, able to lend students computers and tablets. However, some schools also reported a lack of available technical equipment (Swedish NAE 2020d). – and students with a poor study environment at home are considered to have been negatively affected by distance learning according to studies by the Swedish NAE (2020d, 2020b) and the Swedish Schools Inspectorate (2020). Studies from Norway indicate that students’ academic progression during remote instruction was greater the more the parents got involved, and the higher the socioeconomic background of the parents (e.g., Bakken et al. 2020, Fjørtoft 2020). Federici and Vika (2020), also studying the Norwegian context, show that a majority of schools had guidelines and had reallocated resources for identifying vulnerable students when schools were closed. Nonetheless, teachers in both primary and secondary schools reported that assisting vulnerable students remained a challenge.
It has also been observed that the workload and stress placed on teachers (and school principals) has been greater than normal (Federici & Vika 2020, Fjørtoft 2020, Swedish Schools Inspectorate 2021, Lavonen & Salmela-Aro forthcoming). Hence, teaching was considered more challenging than usual. Some subjects seem to have been more difficult than others to teach online. In particular, practical elements and workplace-based learning have been challenging to carry out (e.g., Swedish NAE 2020e, 2020c).[2]According to a study by the Swedish School Inspectorate (2021), mathematics is ill-suited for remote learning, since it is a subject that requires close individual follow-up from the teacher. See also Lavonen and Salmela-Aro (forthcoming) for a similar conclusion based on experiences from Finland. Students following a vocational track in upper secondary school have, for instance, faced challenges finding work practice (e.g., Andersen et al. 2021).[3]An extra challenge to upper secondary school students in vocational tracks identified in Norway, is layoffs among apprentices. In the spring of 2020 one in ten apprentices was laid off (Norwegian Directorate for Education 2020a). In November 2020, 0.7 percent of all apprentices were laid off. Within Hospitality and Food, the proportion of laid-off workers was much higher, at 12 percent (Bjørnset 2021). This can negatively affect the apprentices’ ability to complete their training.
The transition to distance learning has also made assessment and grading more difficult (e.g., Swedish NAE 2020b). Many oral and written exams, such as standardised national exams, were cancelled and replaced by teachers’ assessments. Both Norway and Sweden have seen a significant rise in marks among final year students in both upper and lower secondary school in 2020, relative to previous years (Swedish NAE 2020f, 2020a, Norwegian Directorate for Education 2021b). Similarly, the proportion of students graduating from upper secondary school within the expected time increased in Sweden (Swedish NAE 2021d), and in Norway, the share dropping out decreased both in 2020 and in 2021 (Norwegian Directorate for Education 2021a).[4]It has been hypothesised that home schooling and cancelled exams may have played a role in the fall of the dropout rate. As the same time, since absenteeism was not registered in Norway from mid-March until the end of the school year, it is also possible that not everyone who abandoned their studies was recorded. That study results seem to have improved, despite the many challenges faced by both teachers and students during the pandemic, suggests that teachers applied more lenient grading standards in the absence of objective exams (Swedish NAE 2021d, Svaleryd & Vlachos 2021). Because grades are key to students’ access to higher education, the move to teachers’ subjective assessments may have unforeseen long-term consequences for the equality of opportunity.
In summary, although teachers have been able to continue teaching, and that technical equipment generally seems to have been available, teachers, parents, and students generally agree that the quality of education declined when schools shifted to remote teaching during the pandemic. Studies also agree on that all students are not equally affected: younger students, students with special needs and students with poor skills in the majority language are pointed out as particularly vulnerable groups. Student in vocational tracks in upper secondary school constitute another group of potential concern, as the pandemic has limited their opportunities to take part in workplace-based learning. Overall, the experiences seem very similar in the five Nordic countries. It should be emphasised, however, that it is uncertain how stated experiences of teachers and students correspond with actual learning.
Footnotes
- ^ A lack of digital skills and restricted access to computers and the internet among new immigrants are some of the problems highlighted. Schools were, in many cases, able to lend students computers and tablets. However, some schools also reported a lack of available technical equipment (Swedish NAE 2020d).
- ^ According to a study by the Swedish School Inspectorate (2021), mathematics is ill-suited for remote learning, since it is a subject that requires close individual follow-up from the teacher. See also Lavonen and Salmela-Aro (forthcoming) for a similar conclusion based on experiences from Finland.
- ^ An extra challenge to upper secondary school students in vocational tracks identified in Norway, is layoffs among apprentices. In the spring of 2020 one in ten apprentices was laid off (Norwegian Directorate for Education 2020a). In November 2020, 0.7 percent of all apprentices were laid off. Within Hospitality and Food, the proportion of laid-off workers was much higher, at 12 percent (Bjørnset 2021). This can negatively affect the apprentices’ ability to complete their training.
- ^ It has been hypothesised that home schooling and cancelled exams may have played a role in the fall of the dropout rate. As the same time, since absenteeism was not registered in Norway from mid-March until the end of the school year, it is also possible that not everyone who abandoned their studies was recorded.
5 Research on the short-term effects of distance learning
The causal impact of remote vs in-person instruction has been the subject of many studies. In this section, we discuss the expected impact of remote instruction on student learning by reviewing previous high-quality research.[1]The discussion in this section builds to a considerable extent on a discussion presented in Hall and Lundin (2021).
Footnotes
- ^ The discussion in this section builds to a considerable extent on a discussion presented in Hall and Lundin (2021).
5.1 Studies of distance learning in higher education
Research on distance learning conducted before the pandemic has focused primarily on tertiary education, where remote instruction has a long history, building on the tradition of correspondence studies (Escueta et al. 2020). Although the focus of this article is on younger students, clear lessons can be drawn from a number of convincing studies based on university students, several of which rely on evidence from randomised controlled trials (RCTs).
What does prior empirical research then tell us regarding the impact of taking university (or college) courses online, compared to in-person in a classroom or lecture hall? Comparing the academic performance of students choosing distance learning with those taught in classrooms is likely to provide a misleading answer to this question as the characteristics and circumstances of the two groups may also differ in various ways. For instance, distance learning has generally been more common among university students who work at the same time (Deming et al. 2015, Statistics Sweden 2012). Observing a potentially poorer academic performance by students on distance learning courses could thus be explained by less time devoted to studying, rather than distance learning in itself being less effective than in-person instruction.
Figlio et al. (2013) circumvent this methodological problem by conducting a randomised experiment. Students taking an introductory course in economics at a large prestigious university in the US were randomly assigned to either attend the lectures in-person or watch recorded lectures online. All other factors – content, examinations, and lecturers – were the same for both groups. The results show that the students who attended the lectures in-person on average performed slightly better than those who participated online. For certain groups of students, there was a larger difference in performance: minority students, male students, and students whose prior college GPA was below the median benefited more from being taught in-person.[1]On average, the students who participated remotely scored 2 points less than those who were taught in-person, on a test where the maximum score was 100. Male students scored on average 3.5 points less, those with a GPA below the median scored 4 points less, and those who belonged to a minority (Hispanic) as much as 11 points less when being taught online. All of the differences were statistically significant.
In another compelling study, Bettinger et al. (2017) examine the same question but use data from a broad range of undergraduate courses at a less prestigious American university, where admissions criteria are lower.[2]In terms of method the authors use an instrumental variables approach, exploiting the fact that the possibility of taking a certain course face-to-face varies between semesters, and also depends on the students’ travel time to the campus where the course is held. They find clear negative effects of distance learning for several outcomes: Students participating remotely receive lower grades both in the course taken online and in other future courses, particularly when the subsequent course is based on the previous online course. Students who participated remotely also had a higher probability of dropping out. The estimated effects are judged to be large.[3]Participating remotely led to student grades in that course falling by about a third of a standard deviation. Effects exceeding 0.2 standard deviations are usually considered large in the literature on effects of educational interventions; see Kraft (2020). In line with the results in Figlio et al. (2013), the lower ability students (previous low grades) are the most adversely affected. Noteworthy, for students with a prior GPA in the top three deciles, they find no negative impact of remote learning.
Footnotes
- ^ On average, the students who participated remotely scored 2 points less than those who were taught in-person, on a test where the maximum score was 100. Male students scored on average 3.5 points less, those with a GPA below the median scored 4 points less, and those who belonged to a minority (Hispanic) as much as 11 points less when being taught online. All of the differences were statistically significant.
- ^ In terms of method the authors use an instrumental variables approach, exploiting the fact that the possibility of taking a certain course face-to-face varies between semesters, and also depends on the students’ travel time to the campus where the course is held.
- ^ Participating remotely led to student grades in that course falling by about a third of a standard deviation. Effects exceeding 0.2 standard deviations are usually considered large in the literature on effects of educational interventions; see Kraft (2020).
The results from these two studies are in line with the conclusions drawn in a recent review article by Escueta et al. (2020). The authors review several studies based on either RCTs or regression discontinuity designs, where the aim has been to examine the effects of distance learning compared to being taught face-to-face. Most of the studies are conducted at American universities. The authors conclude that distance learning generally seems to lead to poorer results, although the average difference is often quite small. However, there does not seem to be the same negative pattern for courses where teaching in-person is combined with elements that are carried out online.
The overall message from studies of university students, conducted before the pandemic, is thus that remote teaching tends to have a negative impact on learning, although effect sizes vary depending on context and student population. Another clear message is that the negative impacts are largest among the weakest student groups; the academically strongest students are not necessarily negatively affected.[1]See Cacault et al. (2021) for an RCT that specifically examines heterogeneity by student ability. They find that the possibility of attending online lectures lowers achievement among low-ability students and increases achievement among high-ability ones. However, in the setting examined, online lectures were offered as a complement; all students had the possibility of also attending the lectures in-person, and online access only decreased attendance by 8 percent.
The COVID-19 pandemic has provided a unique context in the sense that remote instruction has been required also for courses not designed to be given online and taught by teachers not necessarily accustomed to this mode of teaching. The rapid transition also gave limited time for preparation and adjustment of teaching styles and pedagogy to the online format. Given this, one could suspect that the negative impacts would be larger during the pandemic than under normal circumstances. A new (not yet published) study by Kofoed et al. (2021) conducted at a US Military Academy during the pandemic autumn of 2020 sheds some light on this. The study is based on an RCT, where students in economics are randomised to either attend lectures in-person or online. The results show that online participation lowered a student’s final grade by 0.215 standard deviations, which can be considered a large effect (cf. Kraft 2020).[2]Although not as large the effect found by Bettinger et al. (2017) for a less selective university. In line with previous studies, the negative impact is largest for students with lower academic ability. Answers from a post-course survey show no difference in study time between online and in-person students. However, online students disclosed that they found it harder to concentrate and felt less connected to their teachers and peers than students that were taught in-person. Although more research is clearly needed, this study gives some support to the idea that the negative impacts found before the pandemic may constitute a lower bound on the learning gap induced by policy responses to the pandemic in the higher education sector.
The mechanisms present at the tertiary level can also be expected among secondary and primary school students, and it is likely that the pattern of negative impacts will be even more pronounced in those age groups, as university students are both older and have been selected on the basis of prior educational achievements. The younger the students, the less capable they are of doing independent work, and the more they are reliant on the support of parents and teachers.[3]Xu and Jaggars (2014) find that there seems to be an age gradient in learning impact of remote instruction even among college students: online learning appears to be less effective the younger the students are. In line with the studies mentioned above, they also find that minority students, students with lower GPA, and males seem to perform worse when being taught remotely.
Footnotes
- ^ See Cacault et al. (2021) for an RCT that specifically examines heterogeneity by student ability. They find that the possibility of attending online lectures lowers achievement among low-ability students and increases achievement among high-ability ones. However, in the setting examined, online lectures were offered as a complement; all students had the possibility of also attending the lectures in-person, and online access only decreased attendance by 8 percent.
- ^ Although not as large the effect found by Bettinger et al. (2017) for a less selective university.
- ^ Xu and Jaggars (2014) find that there seems to be an age gradient in learning impact of remote instruction even among college students: online learning appears to be less effective the younger the students are. In line with the studies mentioned above, they also find that minority students, students with lower GPA, and males seem to perform worse when being taught remotely.
5.2 Studies of distance learning in primary and secondary education
There are considerably fewer studies of how remote instruction affects learning among primary and secondary school students. Moreover, the studies that are available tend to be methodologically less convincing; few studies have used experimental or quasi-experimental methods (Escueta et al. 2020). There is thus greater uncertainty as to whether the patterns found are really caused by distance learning or if they could be driven by other differences between the groups of students compared, or educational content, that was not possible to account for in the analyses.
An important exception is a randomised experiment conducted among US high school students by Heppen et al. (2017). The authors examine how students’ knowledge of algebra is affected by taking a course online rather than being taught in-person. The course examined provided an opportunity for first-year students who had failed algebra to recover their credits. Around 1 200 students from 17 different schools were randomly assigned to either take the course online or in-person. The online students followed the course from a classroom where a mentor was present. The online version of the course not only contained recorded lessons but also elements of formative assessment and interactive games. The students who participated online reported that they perceived the course to be significantly more difficult. They were also less likely to pass the course and scored lower on an algebra posttest.[1]Students who participated digitally were 12 percentage points less likely to recover their credits compared to those who were taught face-to-face. One possible explanation discussed by the authors is that the online format did not allow the teachers the same opportunities to identify gaps in the students’ knowledge and adapt the lessons accordingly. However, on examining the students’ performance on subsequent maths courses one year later, the authors find no statistically significant differences between the two groups of students.
Another study worth mentioning is Fitzpatrick et al. (2020). This study examines how switching from a traditional public school to two types of US charter schools, virtual charter schools vis-à-vis charter schools with traditional classroom teaching, affects student performance.[2]The study uses a matching approach to identify causal effects. Students who switched schools are compared to non-switchers with similar background variables and school results, from the same school, grade, and year. The students examined attended grades 5–8. The authors find that switching from a traditional school to a school where all teaching takes place online, is associated with large negative effects on performance in both mathematics and English. However, the study also finds clear differences between the different types of schools when it comes to, for example, teacher quality, which seem to account for at least a part of the differences in outcomes.
The sudden and sometimes complete transition to distance learning during the COVID-19 pandemic has implied many additional challenges for schools and teachers that did not exist in the contexts studied above: remote teaching has, for instance, sometimes been required in subjects that seem particularly ill-suited for this mode of teaching (such as physical education, art, and music) and sometimes involved students who are likely to be too young to be able to handle the additional responsibility typically required for this form of learning. Researchers around the world are working to understand and gauge the pandemic’s human capital impact on children and youth, and studies based on more objective measures of learning are now beginning to emerge.[3]The first round of COVID-19 studies in the field of education have been based on surveys, where the purpose has been to assess how school lockdowns have impacted students’ study time and learning environment. We discussed this type of studies in Section 4. Although they provide a valuable description of the challenges school lockdowns have entailed for students and parents, they do not provide a good basis for quantitatively assessing the learning impact of school closures. However, most studies released so far originate from countries where the transition to distance learning appears to have presented much greater challenges than has been the case in the Nordic countries, in terms of access to technology and opportunities to rapidly transition to online teaching (see, e.g. Maldonado & De Witte 2021, Kuhfeld et al. 2020). It is not fully clear to what extent these studies capture impacts of remote teaching as opposed to impacts of no teaching (see Section 6).
Footnotes
- ^ Students who participated digitally were 12 percentage points less likely to recover their credits compared to those who were taught face-to-face.
- ^ The study uses a matching approach to identify causal effects. Students who switched schools are compared to non-switchers with similar background variables and school results, from the same school, grade, and year.
- ^ The first round of COVID-19 studies in the field of education have been based on surveys, where the purpose has been to assess how school lockdowns have impacted students’ study time and learning environment. We discussed this type of studies in Section 4. Although they provide a valuable description of the challenges school lockdowns have entailed for students and parents, they do not provide a good basis for quantitatively assessing the learning impact of school closures.
A study by Engzell et al. (2021) from the Netherlands is an important exception. As in the Nordic countries, access to digital technology and broadband in the Netherlands seems to have been widespread, which should facilitate a transition to distance learning. The authors use the fact that national exams took place both before and after the 8-week school closure during the initial phase of the pandemic to estimate the impact on 8–11-year-old students’ progress in maths, spelling, and reading.[1]The authors use a difference-in-differences design, comparing test results before and after lockdown to changes in test results during the same time period in previous years. They estimate an average learning loss which corresponds to around one-fifth of what students normally learn in a year. Since the school closure lasted about one-fifth of the school year, the authors conclude that students made little or no progress at all during the time schools remained closed.[2]They do not find evidence of important differences in effects between the different subjects studied. The results also show that the learning loss was largest among students with less educated parents. In a recent working paper, Haelermans et al. (2021) examine the progress made by Dutch primary school students one year into the pandemic after they had been exposed to two periods of school closures (in total 15.5 weeks). Their results show that students had made less progress in reading, maths, and spelling compared to a similar period in the years before the pandemic. The size of the effect corresponds to 6 weeks less progress for spelling, 12 weeks for maths, and 17 weeks for reading. While the average impact per week of school closure is somewhat lower than in Engzell et al. (2021), the results confirm a substantial learning loss. The losses were again largest for socioeconomically disadvantaged students.[3]Two other studies from the Netherlands, which are based on data from digital learning tools, arrive at a more optimistic view regarding student learning during school closures, at least for the students that use these tools and for the specific aspects of language and maths skills practiced; see Meeter (2021) and van der Velde et al. (2021). However, since it is likely that these digital learning tools replaced other forms of teaching during lockdowns, these results do not allow for an assessment of how students’ overall performance in maths and language developed.
A recent study from Norway by Skar et al. (2021) also points to a considerable drop in learning during school closures, at least in the short term. The authors compare writing tests among grade 1 students taken one month after schools reopened in the spring of 2020 (after seven weeks of remote teaching) to an equivalent test among grade 1 students the previous year. The learning loss is significant both in terms of writing quality and fluency. A comparison with performance differences between grade 1 and 2 students before the pandemic suggests that grade 1 students affected by school closures would need to increase writing quality and fluency gains by 175 and 130 percent, respectively, during the following year in order to perform at the same level as grade 2 students did before the pandemic.
However, a new (so far unpublished) Danish study partly contradicts the concerning results of the above-mentioned studies, at least for the youngest cohorts of Danish children. Birkelund and Karlson (2021) study the development of student results on a national reading test 14 months into the pandemic, when the students had been exposed to between 8 and 22 weeks of school closures, using a similar method as Haelermans et al. (2021). For students in grade 8, who had been exposed to the longest periods of school closures, they find evidence of a decrease in reading performance, corresponding to around seven weeks of lost learning. However, among students in grades 2 and 4, they observe a learning gain. They also find little evidence of widening learning gaps by socioeconomic background. While the authors cannot pinpoint the factors responsible for the lack of learning loss in reading among the youngest students, they suggest that the explanation may lie in the national responses seen in Denmark to mitigate a large learning loss (e.g., additional teacher resources), but also that the teachers may have favoured reading above other subjects when children eventually returned to school. Two recent Swedish reports also fail to find evidence of any decline in student performance: Fälth et al. (2021) find no effect of the pandemic on reading skills among Swedish children in grades 1–3 and Svaleryd and Vlachos (2021) find no indication of any decline in maths performance among grade 9 students, based on a diagnostic test taken when starting upper secondary school.[4]Svaleryd and Vlachos (2021) also show results from standardised tests in a few specific high school courses, given in the autumn of 2020, which were not cancelled. The results do not indicate that students’ performance declined in relation to previous years. However, as only a minority of upper secondary school students took these tests and these students were primarily from the academic tracks, it is not possible to conclude how upper secondary school students were affected on average. However, given that compulsory schools generally remained open in Sweden, the absence of effects is less surprising.
In summary, the few convincing studies of distance learning in primary and secondary schools conducted before the pandemic, align with the results found among university students: remote learning seems to have a negative effect on performance, at least for students who are academically weaker. The recent research results from school closures during the pandemic in Norway and the Netherlands confirm fears that distance learning may be particularly harmful to younger students. Learning losses among young students are more generally of particular concern: since learning is a dynamic process in which further learning builds on prior learning, future learning growth may also be affected (e.g., Cunha & Heckman 2007). However, the recent (not yet published) results from Denmark suggest that learning impacts may differ across contexts within the Nordic countries and that large learning losses could be counteracted by mitigating policies.
Footnotes
- ^ The authors use a difference-in-differences design, comparing test results before and after lockdown to changes in test results during the same time period in previous years.
- ^ They do not find evidence of important differences in effects between the different subjects studied.
- ^ Two other studies from the Netherlands, which are based on data from digital learning tools, arrive at a more optimistic view regarding student learning during school closures, at least for the students that use these tools and for the specific aspects of language and maths skills practiced; see Meeter (2021) and van der Velde et al. (2021). However, since it is likely that these digital learning tools replaced other forms of teaching during lockdowns, these results do not allow for an assessment of how students’ overall performance in maths and language developed.
- ^ Svaleryd and Vlachos (2021) also show results from standardised tests in a few specific high school courses, given in the autumn of 2020, which were not cancelled. The results do not indicate that students’ performance declined in relation to previous years. However, as only a minority of upper secondary school students took these tests and these students were primarily from the academic tracks, it is not possible to conclude how upper secondary school students were affected on average.
6 Research on other aspects relevant for the effectiveness of distance learning during the pandemic
Worldwide school closures may be more appropriately described as absence of schooling rather than remote schooling. According to UNICEF (2020), two-thirds of the world’s school-age children have no internet access at home, which provides an indication of the educational gap the pandemic will cause worldwide. Even in areas/households in wealthy countries like the UK and the US, lack of access to the internet and devices has been a problem (see, e.g., Stelitano et al. 2020). As we have described earlier, this appears to have been less of an obstacle in the Nordic countries. Still, ample evidence indicates that the amount of time parents devote to educational activities and the quality of the instructional support they provide differs by family background, undermining the compensatory ambition the Nordic school systems have in reducing inequalities.
The impact of distance learning may be investigated along different dimensions. One is the direct effect of remote vs in-person teaching, covered above. This is the most relevant dimension for upper secondary schools, which were closed longest. However, for younger children, instruction has consisted of a combination of home schooling and classroom teaching during periods of the pandemic. This has been the case in all of the Nordic countries except Sweden, where schools never closed. Social distancing also changed how teaching was organised, the number of hours of instruction, the form of assessments, and perhaps also what children were expected to learn. For instance, in both Norway and Denmark, classes were sometimes divided into smaller groups. An implication of this is that the number of students per class was reduced and that teachers were able to pay more attention to each individual student. This could potentially mitigate the negative learning impacts we could expect from (partly) switching to remote teaching. In the following section, we summarise the lessons that can be learned from previous research related to temporary school closures, hours of teaching, class size, graduation standards, as well as the importance of the family environment for supporting children’s learning.
6.1 Impact of temporary school closures and fewer teaching hours
There is a large literature that in different ways tries to measure how much students learn in school during a given period of time. Such measurements can be used to assess the extent of learning loss we can expect from a certain amount of missed teaching. Hence, we can get an idea of how large the loss of knowledge due to school closures could be, in cases where the reduction in classroom time is not adequately compensated by (equally effective) remote instruction and/or home schooling involving the support of parents. This could be regarded as an upper limit on the potential loss of knowledge.
The strategies used to assess how much students learn in school include, for instance, comparing students who, owing to their birth date (early or later in the year), started school at different ages (e.g. Cliffordson 2010, Webbink & Gerritsen 2013, Luyten et al. 2017) and assessing learning losses resulting from temporary school closures due to teacher strikes (e.g. Baker 2013, Jaume & Willén 2019), bad weather (e.g. Marcotte 2007), or summer holidays. Carlsson et al. (2015) is an example of the latter. They consider a situation in which young men in Sweden had completed differing amounts of (upper secondary) education at the time they took a set of cognitive tests in preparation for military service. The differences are conditionally random, as they occurred due to (testing) capacity constraints, allowing the authors to estimate a causal effect of schooling on cognitive skills. Using that some of the participants took the test before and some after the summer holiday, the authors can separate the effect of additional education from that of age. The authors find that even as little as ten days of additional schooling significantly raises test scores by 1 percent of a standard deviation (corresponding to 18 percent of a standard deviation for a full school year).
Öckert (2021) provides an extensive review of this literature, with particular emphasis on studies from education systems similar to those found in the Nordic countries. He concludes that there is overwhelming evidence that the amount of time spent in school affects learning and later labour market prospects: Estimates vary across studies, but many suggest that one additional year of schooling improves performance by around 20–30 percent of a standard deviation. Estimated effects tend to be largest for the youngest students and decrease thereafter. Apart from Sweden and Iceland, primary and middle schools in the other Nordic countries closed and moved to remote instruction for 4–9 weeks in the spring of 2020. Bearing this in mind, the (short term) impact on test scores would be expected to vary from 2.5–6 percent of a standard deviation[1]Schools were closed for 6–9 weeks (out of 38 weeks of instruction) in Norway, i.e., 15–24 percent of the school year; 4–8 weeks (out of 40 weeks) in Denmark, i.e., 10–20 percent of the school year; and 8 weeks (out of 38 weeks) in Finland, i.e., 21 percent of the school year. Assuming a full year of instruction improves performance by 25 percent of a standard deviation (cf. Öckert 2021), the estimated decline corresponds to 2.5–6 percent of a standard deviation. Number of teaching days per year for various countries are available at https://stats.oecd.org/Index.aspx?datasetcode=EAG_WT_ORG. for those with the weakest ability and poorest home conditions (assuming they did not learn anything) to no change at all (in cases where remote instruction and home schooling fully compensated for the reduction in classroom teaching).
Several papers in this strand of the literature have also been able to capture more long-term impacts of more teaching time; for instance, effects on the amount of completed schooling or later earnings as adults (e.g., Oreopoulos 2006, Pischke 2007, Jaume & Willén 2019, Fischer et al. 2020). Many of these papers exploit educational reforms, for example, prolongation of compulsory schooling or extensions of the school year to identify causal relationships. Most studies seem to conclude that more schooling leads to higher earnings, but there are also some examples of cases where this is not found to be the case (e.g. Pischke & von Wachter 2008, Grenet 2013). In his review, Öckert (2021) concludes that most evidence indicates that the effects of time spent in compulsory schooling also persist later in life, and that one additional year of teaching seems to increase income by about 2–3 percent. Based on this estimate, 4–9 weeks of school closure would correspond to future decreased earnings of at most 0.3–0.6 percent (if the students did not learn anything during the time schools were closed). It should be emphasised that this approximation relies on numerous uncertain elements, as estimates vary across studies, and it does not take into account that effects are likely to differ by, e.g., student age, socioeconomic background and school subject.
Footnotes
- ^ Schools were closed for 6–9 weeks (out of 38 weeks of instruction) in Norway, i.e., 15–24 percent of the school year; 4–8 weeks (out of 40 weeks) in Denmark, i.e., 10–20 percent of the school year; and 8 weeks (out of 38 weeks) in Finland, i.e., 21 percent of the school year. Assuming a full year of instruction improves performance by 25 percent of a standard deviation (cf. Öckert 2021), the estimated decline corresponds to 2.5–6 percent of a standard deviation. Number of teaching days per year for various countries are available at https://stats.oecd.org/Index.aspx?datasetcode=EAG_WT_ORG.
6.2 Impact of reduced class size
As discussed above, it is possible that some of the expected negative impacts of school closures would be offset by teaching sometimes taking place in smaller groups (to facilitate social distancing). There is a vast literature on the impact of reducing class size on educational performance; see Rockoff (2009) and Öckert (2021) for reviews. Krueger (1999) and Angrist and Lavy (1999) are two well-known studies finding positive short-term impacts on test scores and which both rely on credible identification strategies. While the former is based on a famous experiment in the US where children were randomised to classes of different sizes (project STAR),[1]The Tennessee Student/Teacher Achievement Ratio experiment. the latter exploits quasi-experimental variation in class size occurring due to a maximum class size rule in Israel.[2]Krueger (1999) estimates that one additional student in the class reduces test scores by around 3 percent of a standard deviation. The effects are larger for minority students and students receiving free school meals. Angrist and Lavy (1999) report that their estimates are in the low end of those found in the STAR experiment. The latter approach has been followed by similar studies in other countries. For instance, Fredriksson et al. (2013) use the same approach in Sweden and conclude that one less student in the class during grades 4–6 improves cognitive performance by around 3 percent of a standard deviation. There are also indications of long-term positive impacts of reduced class size in terms of education and later labour market outcomes in adulthood (e.g., Chetty et al. 2011, Browning & Heinesen 2007, Fredriksson et al. 2013). The literature is, however, not conclusive; see, for example, the review by Rockoff (2009). Angrist et al. (2019) and Leuven et al. (2008) use the same empirical approach as Angrist and Lavy (1999) on data from Norway and Israel, but find no impact of class size on student performance, and Leuven and Løkken (2020) find no impact on later earnings. Moreover, Chetty et al. (2014) show that students assigned to high quality teachers have better long-term educational and labour market outcomes. An implication of the above is that the potentially positive effect of smaller classes might be offset by poorer quality teachers (Jepsen & Rivkin 2009, Dieterle 2015). This may be the case if fewer students per teacher was made possible by recruiting other (less qualified) staff to do the teaching, as seems to have been the case during the pandemic in Norway, for example (Norwegian Directorate for Education 2021c). All in all, it is not clear based on previous literature to what extent we should expect a reduced class size to compensate for the reduced amount of teaching many children have received during the pandemic.
Footnotes
- ^ The Tennessee Student/Teacher Achievement Ratio experiment.
- ^ Krueger (1999) estimates that one additional student in the class reduces test scores by around 3 percent of a standard deviation. The effects are larger for minority students and students receiving free school meals. Angrist and Lavy (1999) report that their estimates are in the low end of those found in the STAR experiment.
6.3 Impact of family environment
Parents have had to step in during the pandemic. The younger the children are, the more dependent they are on assistance in learning in the absence of a teacher. But not all families are equally capable of handling this additional responsibility. It is well known that family background has a decisive influence on the process and intergenerational transferability of human capital. For instance, using changes in compulsory schooling laws, Oreopoulos et al. (2006) estimate the causal contribution of parental education on children’s educational outcomes. Their results suggest that parents completing compulsory school reduces the likelihood of their offspring repeating a grade or dropping out of high school. Björklund and Salvanes (2011) examine how much of the inequality in educational attainment that can be explained by factors that siblings share. Summarising estimates from several studies, they conclude that a lower bound on the share of variation in years of education that stem from family background factors (including community factors) is in the range of 40–60 percent, of which parents’ education accounts for just around one third. Socio-emotional skills also play an important role, and research shows that non-cognitive competencies vary systematically by socio-economic status (see, e.g., Carneiro et al. 2007). Typical socio-emotional skills include the ability to interact with others, but also to focus, pay attention, and to be organised. Such skills are important for several reasons and facilitates the accumulation and utilisation of cognitive skills (e.g., Cunha & Heckman 2008).
Research also shows that time invested and dedication to help children with their schoolwork vary with socioeconomic background. For instance, Andrew et al. (2020) compare time use before and during the COVID-19 pandemic in homes with school children (aged 4–15) in the UK and reach the following conclusions: 1) there are socioeconomic inequalities in learning time, which have increased for smaller children during the pandemic; 2) differences in school-provided learning were magnified by differences in resources at home, including lack of space; 3) since children have spent more time at home during the pandemic, inequalities in home circumstances are likely to have a greater impact on educational attainment and well-being than otherwise. Based on a German time-use study, Werner and Woessmann (2021) conclude that the pandemic’s impact on children’s learning opportunities varies by socioeconomic status also in Germany. The UK and German patterns are not representative of the Nordic countries, where school lockdowns generally have been less extensive and access to digital technology, which facilitates remote teaching, is more widespread. However, the pattern that high-SES parents compensate more for lost school inputs than low-SES parents has previously been found in Sweden, too (Fredriksson et al. 2016).[1]It is possible that two months of summer holidays, in addition to one–three months of school closure in the spring of 2020, will contribute to further disproportionally affect learning by family background (cf. Stewart et al. 2018). For instance, Alexander et al. (2007) calculate that, by age 14, the accumulated disadvantage from the summer holiday may account for as much as to two-thirds of the attainment gap between the richest and poorest children. Moreover, children of foreign parents with insufficient knowledge of the native language risk being especially negatively affected.
It is also important to note that the pandemic has brought additional challenges to many families. Job insecurity and job loss have, for instance, been either a threat or a reality for many households, potentially increasing parental stress, which in turn can negatively impact children.[2]There is evidence that economic hardship increases parental depression, which in turn places strain on the parent-child relationship (e.g., Williams & Cheadle 2016). Previous research indicates that economic shocks to the family unit, such as parental job loss, can negatively affect children’s school performance (e.g., Rege et al. 2011, Stevens & Schaller 2011). However, not all studies find such an effect from parental unemployment (e.g., Mörk et al. 2020), and varying effects may be due to the extent to which different welfare state institutions (e.g., benefit schemes and educational institutions) manage to protect family members against the impacts of negative income shocks. It is conceivable that school closures have made children more exposed to the potential negative effects of increased stress among parents than if schools had remained open.
Footnotes
- ^ It is possible that two months of summer holidays, in addition to one–three months of school closure in the spring of 2020, will contribute to further disproportionally affect learning by family background (cf. Stewart et al. 2018). For instance, Alexander et al. (2007) calculate that, by age 14, the accumulated disadvantage from the summer holiday may account for as much as to two-thirds of the attainment gap between the richest and poorest children.
- ^ There is evidence that economic hardship increases parental depression, which in turn places strain on the parent-child relationship (e.g., Williams & Cheadle 2016).
6.4 Impact of cancelled exams
As discussed previously, remote teaching naturally makes assessment and grading more difficult. All of the Nordic countries (except Iceland) also cancelled many standardised national exams, which further complicated objective assessments of students’ knowledge. The loss of this information may delay the recognition of both high potential and learning difficulties in pupils and may thus have harmful long-term consequences for the individual child’s learning (Andersen & Nielsen 2020).
Standardised exams have an important role to play in capturing bias. Prior research indicates that there are systematic deviations in grading between unblind and blind examinations, and several studies have documented a teacher bias against boys (e.g., Lavy 2008, Lekholm & Cliffordson 2009, Berg et al. 2020) and some others against certain ethnic minorities (e.g., Burgess & Greaves 2013, Hinnerich et al. 2015). While it is not clear how this has played out during the pandemic, it is possible that the fact that teachers’ assessments have replaced national exams could have particularly disfavored certain groups of students.
Cancelling important exams is also likely to affect how much effort students put into their schoolwork. Hvidman and Sievertsen (2021) use a reform-induced recoding of student GPA in Denmark in 2007 to show how students adjust their effort when ‘high-stakes’ are involved, in that the students work harder to achieve better grades if this increases their chances of university enrollment. The empirical literature on graduation standards often finds that increasing standards, for example, by the introduction of final exams, induces some students to perform better, while also tending to lead to higher dropout rates among less able students (e.g., Figlio & Lucas 2004, Dee & Jacob 2006, Ou 2010). Cancelled national exams may thus have heterogenous impacts on students: weaker (upper secondary school) students may, to a greater extent, have chosen to remain in education, as the decreased dropout rate in Norway suggests (Norwegian Directorate for Education 2021a). Other students may have chosen to put in less effort, resulting in a lower learning gain. Studies (OECD 2021b, Swedish NAE 2021d) suggest that they might still have received just as high (or even higher) grades, but despite these grades, they are likely to be less prepared as they enter working life and/or higher education.
7 Conclusion
Based on available evidence of the impact of distance learning and the amount of teaching time, we have discussed expected effects of the pandemic-induced school closures on student outcomes in the short and long term. In doing so, we have taken into account the preparedness of the Nordic education systems for a transition to remote instruction as well as various reports summarising student and teacher experiences.
Reviewing the literature on the effects of the number of teaching hours, we saw that 4–9 weeks of missed teaching in school may lead to reduced earnings in adulthood by 0.3–0.6 percent if no policies are put in place to compensate for the setback the pandemic has caused on skill formation. It must be emphasised, however, that estimates vary across studies, implying that these types of approximations are characterised by great uncertainty. Such a learning loss – and subsequent income loss – can be expected if the schooling that took place at home was far less effective than the usual teaching at school (and is more appropriately described as the absence of schooling). Since the effectiveness of home schooling depends on the resources available in the home, especially parental resources, children from socioeconomically disadvantaged homes can be expected to suffer larger learning losses from school closures than children from more advantaged homes. And since younger children are more dependent on assistance from parents, learning losses are likely to be particularly large for younger children (cf. Andrew et al. 2020, Blikstad-Balas et al., forthcoming). Evidence from school closures in the Netherlands during the pandemic points in this direction: less seems to have been learned during school lockdowns, at least by the youngest students (Engzell et al. 2021, Haelermans et al. 2021). A recent preprint from Denmark, however, suggest that young students in Denmark actually fared relatively well during the pandemic, at least in terms of reading performance (Birkelund & Karlson 2021).
In cases where remote teaching is just as effective as classroom teaching in the school (and grading standards are not affected), we naturally should not expect any long-term negative effects on human capital and subsequent earnings. However, reviewing several surveys of children (or their parents) and teachers conducted in the Nordic countries during the COVID-19 pandemic, we saw that teachers and students generally agree that the quality of education has not lived up to the same standard during periods of distance learning. The literature on impacts of distance learning per se has mainly focused on short-term learning effects but points to several clear and consistent patterns: i) remote teaching is on average less effective than classroom teaching (although estimates vary in size across studies); ii) the effectiveness is closely linked to student ability – it is the weakest student groups that are most negatively affected by distance learning; the academically strongest students do not necessarily perform worse in comparison to when being taught in the classroom. Remote instruction also seems to be less effective, the younger the age of the students involved.
All in all, it is clear from the literature that school closures can be expected to have long-term negative effects on skill formation and earnings if no mitigating policies are put in place, and that these losses are unlikely to be equally distributed: The negative impacts are likely to be larger for more disadvantaged students, and larger the younger the students have been when exposed to remote instruction. The negative effects can also be expected to increase monotonically with the length of the school closure.[1]However, whether we should expect the relationship to be linear is unclear as a longer duration of distance learning may involve adaptation that improves the effectiveness of the teaching. Alternatively, it could also make it harder for students to remain motivated, resulting in reduced effectiveness. It is also likely that the effectiveness of remote instruction varies depending on the subject, although there is so far limited causal evidence of this.
Footnotes
- ^ However, whether we should expect the relationship to be linear is unclear as a longer duration of distance learning may involve adaptation that improves the effectiveness of the teaching. Alternatively, it could also make it harder for students to remain motivated, resulting in reduced effectiveness.
When it comes to compulsory schooling, we should expect there to be a higher fraction of students in Norway, Finland, and Denmark who risk being negatively affected compared to Sweden, which (for the most part) kept all compulsory schools open. Iceland probably represents an intermediate position in this regard. The negative impacts on students in upper secondary school can be expected to be more similar across the Nordic countries. Moreover, we saw that there has been a substantial amount of regional variation in the extent and duration of school closures in all of the Nordic countries, as policies have varied depending on regional infection rates. Different schools have also adopted different strategies, which may vary by, for example, the form of school management, resources and school size. Thus, within each country, there will be schools and regions where students are likely to have been more severely affected than elsewhere in the same country. This is important to bear in mind when developing policies designed to counteract the expected negative effects on student learning.
Although remote teaching seems to be less effective the younger the students are, the potential negative impacts for older students should not be downplayed – in all the Nordic countries, upper-secondary students have had far more distance learning than younger students. In addition, there is now less time available to compensate this group for shortcomings in their learning environment over the last two years. Students in vocational tracks constitutes a group of particular concern, as the pandemic is likely to have limited their possibilities of taking part in work-place based learning. Moreover, the potential consequences of cancelling national exams for student learning and later outcomes should not be ignored.
The discussion in this paper has partly been based on research conducted before the COVID-19 pandemic, and the pandemic has given rise to many special circumstances that have made children and youth particularly vulnerable, possibly aggravating the expected negative effects of school closures. Job insecurity and job loss have been a reality or threat in many households, potentially increasing parental stress that also could have negative impacts on children. School closures, in combination with other measures to ensure social distancing, have often meant that children and youth have for periods been largely isolated from their normal social contexts. As we saw in Section 4, some studies indicate that depressive symptoms have increased among youth (Thorisdottir et al. 2021, Evensen et al. 2021). Although the evidence on this from the Nordic countries is not conclusive, this is a concerning observation as mental health problems in adolescence have been found to be associated with worse long-term outcomes in terms of health, education and labour market prospects.[1]It is documented that the onset of mental disorders usually occurs in childhood or adolescence (e.g. de Girolamo et al. 2012). Longitudinal studies show that early onset of mental disorders rarely remits spontaneously and contributes to explain the burden of mental disorders in adulthood (see e.g. discussion in Wittchen et al. 2011). Mental health problems in adolescence have been linked to poor educational outcomes and increased risk of NEET status (Not in Employment, Education or Training) (Veldman et al. 2015, Esch et al. 2014). For those student cohorts who have left school during the pandemic, the (expected) negative impacts of distance learning may be further exacerbated by graduating during an economic downturn.[2]Studies of previous recessions find that youths who enter the labour market during a recession have worse labour market outcomes also in the long-term, compared to those who graduate when the economy is stronger (see Engdahl 2021 for a review of this literature).
The size of the long-term effects of school closures will eventually depend on how long the pandemic continues to affect the school system and the extent and scope of policies put in place to counteract the potential negative learning impacts of school closures. The recent preliminary results from Denmark in Birkelund and Karlson (2021), provides a rather optimistic picture as they suggest that large learning losses could be counteracted by mitigating policies.
Footnotes
- ^ It is documented that the onset of mental disorders usually occurs in childhood or adolescence (e.g. de Girolamo et al. 2012). Longitudinal studies show that early onset of mental disorders rarely remits spontaneously and contributes to explain the burden of mental disorders in adulthood (see e.g. discussion in Wittchen et al. 2011). Mental health problems in adolescence have been linked to poor educational outcomes and increased risk of NEET status (Not in Employment, Education or Training) (Veldman et al. 2015, Esch et al. 2014).
- ^ Studies of previous recessions find that youths who enter the labour market during a recession have worse labour market outcomes also in the long-term, compared to those who graduate when the economy is stronger (see Engdahl 2021 for a review of this literature).
We would like to thank Iben Bolvig, Hjördís Harðardóttir, Hanna Virtanen, Hulda Skogland, Helena Holmlund, two anonymous referees as well as seminar participants at the Nordic Economic Policy Review workshop in Reykjavik for useful comments and suggestions. Finally, we would also like to thank the Norwegian Research Council, grant nr. 256217.
References
Ahtiainen, R. (2021, April 7). What has remote learning looked like in Finland? School closures, equity, stress, and well-being. International Education News. Available at: https://internationalednews.com/2021/04/07/what-has-remote-learning-looked-like-in-finland-school-closures-equity-stress-and-well-being/
Alexander, K. L., Entwisle, D. R. & Olson, L.S. (2007). Lasting consequences of the summer learning gap. American Sociological Review, 72(2), 167–80.
Andersen, R. K., Bråten, M., Bøckmann E., Kindt M. T., Nyen, T. & Tønder, H. H. (2021). Håndtering og konsekvenser av koronautbruddet for videregående opplæring [eng: Management and consequences of the corona outbreak for higher education.]. Oslo, Norway: Fafo-report 2021:09. Retrieved from: https://www.fafo.no/zoo-publikasjoner/fafo-rapporter/handtering-og-konsekvenser-av-koronautbruddet-for-videregaende-opplaering
Andersen, S. C. & Nielsen, H. S. (2020). Learning from performance information. Journal of Public Administration Research and Theory, 30(3), 415–31.
Andrew, A., Cattan S., Dias, M. C., Farquharson, C., Kraftman, L., Krutikova, S., Phimister, A. & Sevilla, A. (2020). Inequalities in children’s experiences of home learning during the COVID-19 lockdown in England. Fiscal Studies, 41(3), 653–83.
Angrist, J. D. & Lavy, V. (1999). Using Maimonides’ rule to estimate the effect of class size on scholastic achievement. The Quarterly Journal of Economics, 114(2), 533–75.
Angrist, J. D., Lavy V., Leder-Luis, J. & Shany, A. (2019). Maimonides’ rule redux. American Economic Review: Insights, 1(3), 309–24.
Baker, M. (2013). Industrial actions in schools: Strikes and student achievement. Canadian Journal of Economics/Revue Canadienne d’économique, 46(3), 1014–36.
Bakken, A., Pedersen, W., von Soest, T. & Sletten, Aa. (2020). Oslo-ungdom i koronatiden. En studie av ungdom under covid-19-pandemien [eng: Adolescents in Oslo in the time of the COVID-19 pandemic]. Oslo, Norway: NOVA Report 2020:12.
Berg, P., Palmgren, O. & Tyrefors, B. (2020). Gender grading bias in junior high school mathematics. Applied Economics Letters, 27(11), 915–19.
Bettinger, E. P., Fox, L., Loeb, S. & Taylor, E. S. (2017). Virtual classrooms: How online college courses affect student success. American Economic Review, 107(9), 2855–75.
Birkelund, J. F. & Karlson, K. B. (2021, November). No evidence of a major learning slide 14 months into the COVID-19 pandemic in Denmark. (University of Copenhagen Working paper). Copenhagen, Denmark: Department of Sociology. Available at: SocArXiv. https://doi.org/10.31235/osf.io/md5zn
Björklund, A. & Salvanes, K. G. (2011). Education and family background: Mechanisms and policies. In Hanushek, E. A., Machin, S. & Woessmann, L. (Ed.), Handbook of the economics of education (p. 201–47). North Holland, Netherlands: Elsevier.
Bjørnset, M. (2021). Konsekvenser av korona – Arbeidsledighet og gjennomføring blant unge i Viken [eng: Conqequences of Corona – Unemployment and implementation among young people in Viken]. Oslo, Norway: Fafo-notat 2021:04. Retrieved from: https://www.fafo.no/zoo-publikasjoner/fafo-notater/item/konsekvenser-av-korona
Blikstad-Balas, M., Dalland, C. P., Klette, K., & Roe, A. (forthcoming). Homeschooling in Norway during the pandemic – Digital learning with unequal access to qualified help at home and unequal learning opportunities provided by the school. In Reimers, F. M. (Ed.), Primary and Secondary Education During Covid-19. Disruptions to Educational Opportunity During a Pandemic (p. 177–201). Springer, Cham.
Bozkurt, A., & Sharma R. C. (2020). Emergency remote teaching in a time of global crisis due to CoronaVirus pandemic. Asian Journal of Distance Education, 15(1), 1–4.
Browning, M. & Heinesen, E. (2007). Class size, teacher hours and educational attainment. The Scandinavian Journal of Economics, 109(2), 415–38.
Burdzovic A. J. & Brunborg, G. S. (2021). Self-reported mental and physical health among Norwegian adolescents before and during the COVID-19 pandemic. JAMA Network Open, 4(8).
Burgess, S. & Greaves, E. (2013). Test scores, subjective assessment, and stereotyping of ethnic minorities. Journal of Labor Economics, 31(3), 535–76.
Cacault, M P., Hildebrand, C., Laurent-Lucchetti, J. & Pellizzari, M. (2021). Distance learning in higher education: Evidence from a randomized experiment. Journal of the European Economic Association, 19(4), 2322–72.
Carlsson, M., Dahl, G. B., Öckert, B. & Rooth, D-O. (2015). The Effect of Schooling on Cognitive Skills. The Review of Economics and Statistics, 97(3), 533–47.
Carneiro, P., Crawford, C. & Goodman, A. (2007). The impact of early cognitive and non-cognitive skills on later outcomes. London, England: Centre for the Economics of Education.
Chetty, R., Friedman, J. N., Hilger, N., Saez, E., Schanzenbach, D. W. & Yagan, D. (2011). How does your kindergarten classroom affect your earnings? Evidence from project Star. The Quarterly Journal of Economics, 126(4), 1593–1660.
Chetty, R., Friedman, J. N. & Rockoff, J. E. (2014). Measuring the Impacts of Teachers II: Teacher value-added and student outcomes in adulthood. American Economic Review, 104(9), 2633–79.
Cliffordson, C. (2010). Methodological issues in investigations of the relative effects of schooling and age on school performance: The between-grade regression discontinuity design applied to Swedish TIMSS 1995 Data. Educational Research and Evaluation, 16(1), 39–52.
Cunha, F. & Heckman, J. (2007). The technology of skill formation. American Economic Review, 97(2), 31–47.
Cunha, F. & Heckman, J. (2008). Formulating, identifying and estimating the technology of cognitive and noncognitive skill formation. Journal of Human Resources, 43(4), 738–82.
Dee, T. S. & Jacob, B. A. (2006). Do high school exit exams influence educational attainment or labor market performance? (National Bureau of Economic Research Working Paper 12199). Cambridge, MA: National Bureau of Economic Research.
Deming, D. J., Goldin, C., Katz, L. F. & Yuchtman, N. (2015). Can online learning bend the higher education cost curve? American Economic Review, 105(5), 496–501.
Dieterle, S. G. (2015). Class-size reduction policies and the quality of entering teachers. Labour Economics, Elsevier, vol. 36, 35–47.
Engdahl, M. (2021). Youth labour market entry and economic downturns. In Sjögren, A. (Ed.), Swedish children and youth during the COVID-19 Pandemic. (IFAU Working Paper Vol. 2021:3). Uppsala, Sweden: IFAU.
Engzell, P., Frey A. & Verhagen, M. D. (2021). Learning loss due to school closures during the COVID-19 Pandemic. Proceedings of the National Academy of Sciences, 118(17).
Esch, P., Bocquet, V., Pull, C., Couffignal, S., Lehnert, T., Fond-Harmant, L. & Ansseau, M. (2014). The downward spiral of mental disorders and educational attainment: A systematic review on early school leaving. BMC Psychiatry, 14(237).
Escueta, M., Nickow, A. J., Oreopoulos, P. & Quan, V. (2020). Upgrading education with technology: Insights from experimental research. Journal of Economic Literature, 58(4), 897–996.
European Commission (2019). 2nd survey of schools: ICT in education. Objective 1: Benchmark progress in ICT in schools. Final Report. Luxembourg: European Commission.
Evensen, M., Hart, R., Godøy, A. A., Hauge, L. J., Lund, I. O., Skrindo Knudsen, A. K. Grøtting, M. W., Surén, P & Reneflot,A. (2021). Impact of the COVID-19 pandemic on mental healthcare consultations among children and adolescents in Norway: A nationwide registry study. Oslo, Norway: Norwegian Institute of Public Health. Retrieved from: https://doi.org/10.1101/2021.10.07.21264549
Fälth, L., Hallin, A. E. & Nordström, T. (2021). Corona-pandemins påverkan på lågstadieelevers läsinlärning [eng: The impact of the corona pandemic on primary school students' reading ability]. Stockholm, Sweden: LegiLexi. Retrieved from: https://www.diva-portal.org/smash/get/diva2:1592434/FULLTEXT01.pdf
Federici, R. A. & Vika, K. S. (2020). Spørsmål til Skole-Norge: Analyser og resultater fra Utdanningsdirektoratets spørreundersøkelse til skoleledere, skoleeiere og lærere under korona-utbruddet 2020 [eng: Questions to School Norway: analysis and results from the Norwegian Directorate of education's survey of school leaders, school owners and teachers during the corona outbreak 2020]. NIFU-report 2020:13. Oslo, Norway: NIFU.
Figlio, D. & Lucas, M. E. (2004). Do high grading standards affect student performance? Journal of Public Economics, 88(9), 1815–34.
Figlio, D. Rush, M. & Yin, L. (2013). Is It live or is it internet? Experimental estimates of the effects of online instruction on student learning. Journal of Labor Economics, 31(4), 763–84.
Finnish NAE (2020). Distance Education in Finland during the COVID-19 Crisis. Initial Observations. Helsinki, Finland: National Agency for Education (Opetushallitus). Retrieved from: https://www.oph.fi/sites/default/files/documents/distance-education-in-finland-during-covid19_initial-observations.pdf.
Finnish NAE (2021a). Ordnande av grundläggande utbildning från och med 1.1 2021. [eng: Arranging basic education from January 1 2022]. Helsinki, Finland: National Agency for Education (Opetushallitus). Retrieved from: https://www.oph.fi/sv/utbildning-och-examina/ordnande-av-grundlaggande-utbildning-och-aterhamtning-fran-coronapandemin.
Finnish NAE (2021b). Ordnande av gymnasieutbildning från och med 1.1 2021 [eng: Arranging high school education from January 1 2022]. Helsinki, Finland: National Agency for Education (Opetushallitus). Retrieved from: https://www.oph.fi/sv/utbildning-och-examina/ordnande-av-gymnasieutbildning-och-aterhamtning-fran-coronapandemin-112022.
Fischer, M., Karlsson, M., Nilsson, T. & Schwarz, N. (2020). The long-term effects of long terms – compulsory schooling reforms in Sweden. Journal of the European Economic Association, 18(6), 2776–2823.
Fitzpatrick, B. R., Berends, M., Ferrare, J. J. & Waddington, R. J. (2020). Virtual illusion: Comparing student achievement and teacher and classroom characteristics in online and brick-and-mortar charter schools. Educational Researcher, 49(3), 161–75.
Fjørtoft, S. O. (2020). Nær og fjern. Læreres erfaringer med digital hjemmeskole våren 2020 [eng: Near and far. Teachers' experiences of digital home schooling spring 2020]. SINTEF Report 2020:00805. Trondheim, Norway: SINTEF Digital.
Fjørtoft, S. O., Thun, S. & Pettersen Buvik, M. (2019). Monitor 2019 – En deskriptiv kartlegging av digital tilstand i norske skoler og barnehager [eng: Monitor 2019 – A descriptive mapping of the digital state in Norwegian schools and kindergarten]. SINTEF Report 2019:00877. Trondheim, orway: SINTEF Digital.
Fredriksson, P., Öckert, B. & Oosterbeek, H. (2013). Long-term effects of class size. The Quarterly Journal of Economics, 128(1), 249–85.
Fredriksson, P., Öckert, B. & Oosterbeek, H. (2016). Parental responses to public investments in children: Evidence from a maximum class size rule. Journal of Human Resources, 51(4), 832–68.
Fuchs-Schündeln, N., Krueger, D., Ludwig, A. & Popova, I. (2020). The long-term distributional and welfare effects of Covid-19 School Closures. (National Bureau of Economic Research, Working Paper 27773). Cambridge, MA: National Bureau of Economic Research.
de Girolamo, G., Dagani, J., Purcell, R., Cocchi, A. & McGorry, P. D. (2012). Age of onset of mental disorders and use of mental health services: needs, opportunities and obstacles. Epidemiology and Psychiatric Sciences, 21(1), 47–57.
Gneezy, U. & Rustichini, A. (2004). Gender and competition at a young age. American Economic Review, 94(2), 377–81.
Grätz, M. & Lipps, O. (2021). Large loss in studying time during the closure of schools in Switzerland in 2020. Research in Social Stratification and Mobility, Vol. 71(100554).
Grenet, J. (2013). Is extending compulsory schooling alone enough to raise earnings? Evidence from French and British compulsory schooling laws. The Scandinavian Journal of Economics, 115(1), 176–210.
Grewenig, E., Lergetporer, P., Werner, K., Woessmann, L. & Zierow, L. (2021). COVID-19 and educational inequality: how school closures affect low- and highachieving students. European Economic Review, 140(103920).
Gudmundsdottir, G. B. & Hathaway, D. (2020). ‘We always make it work’: Teachers’ agency in the time of crisis. Journal of Technology & Teacher Education, 28(2), 239–50.
Haelermans, C., Jacobs, M., van Vugt, L., Aarts, B., Abbink, H., Smeets, C., van der Velden, R. & van Wetten, S. (2021). A full year COVID-19 crisis with interrupted learning and two school closures: The effects on learning growth and inequality in primary education. ROA External Reports. Maastricht, Netherlands: Center for Open Science. Retrieved from: https://osf.io/78fje/.
Hafstad, G. S., Sætren, S. S., Wentzel-Larsen, T. & Augusti, E-M. (2021). Adolescents’ symptoms of anxiety and depression before and during the Covid-19 outbreak – a prospective population-based study of teenagers in Norway. The Lancet Regional Health – Europe, 5(100093).
Hall, C. & Lundin, M. (2021). The COVID-19 pandemic and distance learning: how will academic performance be affected? In Sjögren, A. (Ed.), Swedish Children and Youth during the COVID-19 Pandemic (IFAU Working Paper Vol. 2021:3). Uppsala, Sweden: IFAU.
Hall, C., Lundin, M., Mörtlund, T. & Sibbmark, K. (2021). En dator per elev I mellanstadiet. Hur påverkas undervisningen och studieresultaten? [eng: One computer per student in middle school. How are teaching and results affected?]. IFAU Report 2021:18. Uppsala, Sweden: IFAU.
Hanushek, E. A. & Woessmann, L. (2020). The economic impacts of learning losses. Paris, France: OECD.
Heckman, J. J. & Rubinstein, Y. (2001). The importance of noncognitive skills: lessons from the GED testing program. American Economic Review, 91(2), 145–49.
Heppen, J. B., Sorensen, N., Allensworth, E., Walters, K., Rickles, J., Taylor, S. S. & Michelman, V. (2017). The struggle to pass algebra: online vs. face-to-face credit recovery for at-risk urban students. Journal of Research on Educational Effectiveness, 10(2), 272–96.
Hinnerich, B. T., Höglin E. & Johannesson, M. (2015). Discrimination against students with foreign backgrounds: evidence from grading in Swedish public high schools. Education Economics, 23(6), 660–76.
Hodges, C., Moore, S., Lockee, B., Trust, T. & Bond, A. (2020, March). The difference between emergency remote teaching and online learning. Educause Review. Available at: https://er.educause.edu/articles/2020/3/the-difference-between-emergency-remote-teaching-and-online-learning.
Hvidman, U. & Sievertsen, H. H. (2021). High-stakes grades and student behavior. Journal of Human Resources, 56(3), 821–49.
Jaume, D. & Willén, A. (2019). The long-run effects of teacher strikes: evidence from Argentina. Journal of Labor Economics, 37(4), 1097–1139.
Jepsen, C. & Rivkin, S. (2009). Class size reduction and student achievement: the potential tradeoff between teacher quality and class size. Journal of Human Resources, 44(1), 223–50.
Kofoed, M. S., Gebhart, L., Gilmore, D. & Moschitto, R. (2021). Zooming to class?: Experimental evidence on college students’ online learning during COVID-19. (IZA Discussion Paper 14356). Bonn, Germany: IZA.
Kraft, M. A. (2020). Interpreting effect sizes of education interventions. Educational Researcher, 49(4), 241–53.
Krueger, A. B. (1999). Experimental estimates of education production functions. The Quarterly Journal of Economics, 114(2), 497–532.
Kuhfeld, M., Soland, J., Tarasawa, B., Johnson, A., Ruzek, E. & Liu, J. (2020). Projecting the potential impact of COVID-19 school closures on academic achievement. Educational Researcher, 49(8), 549–65.
Kuhfeld, M., Tarasawa, B., Johnson, A., Ruzek, E. & Lewis, K. (2020). Learning during COVID-19: initial findings on students’ reading and math achievement and growth. Research brief November 2020. Portland, OR: NWEA.
Lavonen, J. & Salmela-Aro, K. (fortcoming). Experiences of moving quickly to distance teaching and learning at all levels of education in Finland. In Rei,ers, F. M. (Ed.), Primary and Secondary Education During Covid-19. Disruptions to Educational Opportunity During a Pandemic (p. 105–123). Springer, Cham.
Lavy, V. (2008). Do gender stereotypes reduce girls’ or boys’ human capital outcomes? Evidence from a natural experiment. Journal of Public Economics, 92(10), 2083–2105.
Lekholm, A. K. & Cliffordson, C. (2009). Effects of student characteristics on grades in compulsory school. Educational Research and Evaluation, 15(1), 1–23.
Leuven, E. & Løkken, S. A. (2020). Long-term impacts of class size in compulsory school. Journal of Human Resources, 55(1), 309–48.
Leuven, E., Oosterbeek, H. & Rønning, M. (2008). Quasi-experimental estimates of the effect of class size on achievement in Norway. Scandinavian Journal of Economics, 110(4), 663–93.
Loeb, S. (2020, March). How effective Is online learning? What the research does and doesn’t tell us. Education Week, Classroom Technology. Available at: https://www.edweek.org/technology/opinion-how-effective-is-online-learning-what-the-research-does-and-doesnt-tell-us/2020/03.
Luyten, H., Merrell, C & Tymms, P. (2017). The contribution of schooling to learning gains of pupils in years 1 to 6. School Effectiveness and School Improvement, 28(3), 374–405.
Maldonado, J. & De Witte, K. (2021). The effect of school closures on standardized student test outcomes. (Discussion Paper Series 20.17). Leuven, Belgium: KU Leuven – Faculty of Economics and Business.
Marcotte, D. E. (2007). Schooling and test scores: a mother-natural experiment. Economics of Education Review, 26(5), 629–40.
Meeter, M. (2021). Primary school mathematics during the COVID-19 pandemic: no evidence of learning gaps in adaptive practicing results. Trends in Neuroscience and Education, Vol. 25.
Mörk, E., Sjögren, A. & Svaleryd, H. (2020). Consequences of parental job loss on the family environment and on human capital formation-evidence from workplace closures. Labour Economics, Vol. 67.
Norwegian Directorate for Education (2020a). Konsekvenser av smitteverntiltakene i grunnskolen – høsten 2020. [eng: Consequences of infection control measures in primary school – autumn 2020]. Oslo, Norway: Norwegian Directorate for Education. Retrieved from: https://www.udir.no/tall-og-forskning/statistikk/statistikk-grunnskole/analyser/konsekvenser_smitteverntiltak_GSI/korona_gsi_2020/.
Norwegian Directorate for Education (2020b). The Educational Mirror. Oslo, Norway: Norwegian Directorate for Education.
Norwegian Directorate for Education (2021a). 3.0 prosent av elevene slutter i løpet av skoleåret [eng: 3.0 percent of the students drop out during the school year]. Oslo, Norway: Norwegian Directorate for Education. Retrieved from: https://www.udir.no/tall-og-forskning/statistikk/statistikk-videregaende-skole/analyser/andel-av-elevene-slutter-i-lopet-av-skolearet/.
Norwegian Directorate for Education (2021b). Høyt karaktersnitt i grunnskolen 2020–21 [eng: High GPA in primary school 2020–21]. Oslo, Norway: Norwegian Directorate for Education. Retrieved from: https://www.udir.no/tall-og-forskning/statistikk/statistikk-grunnskole/analyser/karakterer-i-grunnskole/.
Norwegian Directorate for Education (2021c). Konsekvenser av smitteverntiltak I grunnskolen – våren 2021 [eng: Consequences of infection control measures in primary school – spring 2021]. Oslo, Norway: Norwegian Directorate for Education. Retrieved from: https://www.udir.no/tall-og-forskning/statistikk/statistikk-grunnskole/analyser/konsekvenser-av-smitteverntiltak-i-grunnskolen--varen-2021/.
Norwegian Directorate of Health (2020). Covid-19 – samfunnsøkonomisk curdering av smitteverntiltak – Andre Rapport [eng: Covid-19 – socio-economic assessments of infection control measures – second report]. Oslo, Norway: Norwegian Directorate of Health.
NOU (2021) Myndighetenes håndtering av koronapandemien –rapport fra koronakommisjonen [eng: The authorities'handling of the corona pandemic – report from the corona commission]. Oslo, Norway: Koronakommisjonen.
Öckert, B. (2021). School absenteeism during the COVID-19 pandemic – how will student performance be affected? In Sjögren, A. (Ed.), Swedish Children and Youth during the COVID-19 Pandemic. (IFAU Working Paper, 2021:3). Uppsala, Sweden: IFAU.
OECD (2020a). School education during COVID-19: were teachers and students ready? Country note: Denmark. Paris, France: OECD. Retrieved from: https://www.oecd.org/education/Denmark-coronavirus-education-country-note.pdf.
OECD (2020b). School education during COVID-19: were teachers and students ready? Country note: Finland. Paris, France: OECD. Retrieved from: https://www.oecd.org/education/Finland-coronavirus-education-country-note.pdf.
OECD (2020c). School education during COVID-19: were teachers and students ready? Country note: Norway. Paris, France: OECD. Retrieved from: https://www.oecd.org/education/Norway-coronavirus-education-country-note.pdf.
OECD (2020d). School education during COVID-19: were teachers and students ready? Country note: Sweden. Paris, France: OECD. Retrieved from: https://www.oecd.org/education/Sweden-coronavirus-education-country-note.pdf.
OECD (2020e). School education during COVID-19: were teachers and students ready? Country note: Iceland. Paris, France: OECD. Retrieved from: https://www.oecd.org/education/Iceland-coronavirus-education-country-note.pdf.
OECD (2021a). 21st-Century readers: developing literacy skills in a digital world En OECD. Paris, France: OECD. Retrieved from: https://www.oecd.org/publications/21st-century-readers-a83d84cb-en.htm.
OECD (2021b). The state of school education: one year into the COVID pandemic. Paris, France: OECD. Retrieved from: https://www.oecd.org/education/state-of-school-education-one-year-into-covid.htm.
Oreopoulos, P. (2006). Estimating average and local average treatment effects of education when compulsory schooling laws really matter. American Economic Review, 96(1), 152–75.
Oreopoulos, P., Page, M. E. & Stevens, A. H. (2006). The intergenerational effects of compulsory schooling. Journal of Labor Economics, 24(4), 729–60.
Ou, D. (2010). To leave or not to leave? A regression discontinuity analysis of the impact of failing the high school exit exam. Economics of Education Review, 29(2), 171–86.
Pischke, J-S. (2007). The impact of length of the school year on student performance and earnings: evidence from the German short school years. The Economic Journal, 117(523), 1216–42.
Pischke, J-S. & von Wachter, T. (2008). Zero returns to compulsory schooling in Germany: evidence and interpretation. The Review of Economics and Statistics, 90(3), 592–98.
Psacharopoulos, G., Collis, V., Patrinos, H. A. & Vegas, E. (2021). The COVID-19 cost of school closures in earnings and income across the world. Comparative Education Review, 65(2), 271–87.
Public Health Agency of Sweden (2020). COVID-19 in Children and Adolescents. A Knowledge Summary – Version 2. Solna, Sweden: Public Health Agency (Folhälsomyndigheten). Retrieved from: https://www.folkhalsomyndigheten.se/contentassets/1e5e09395b9a4f498ff635cdd2b1a888/covid-19-children-adolescents.pdf.
Rege, M., Telle, K. & Votruba, M. (2011). Parental job loss and children’s school performance. The Review of Economic Studies, 78(4), 1462–89.
Rockoff, J. (2009). Field experiments in class size from the early twentieth century. Journal of Economic Perspectives, 23(4), 211–30.
Skar, G. B. U., Graham, S. & Huebner, A. (2021). Learning loss during the COVID-19 pandemic and the impact of emergency remote instruction on first grade students’ writing: a natural experiment. Journal of Educational Psychology. Online publication available at: https://doi.org/10.1037/edu0000701.
SOU (2017). Entreprenad, fjärrundervisning och distansundervisning [eng: Constracting and distance learning]. (2017:44). Stockholm, Sweden: Utbildningsdepartementet, Regeringskansliet.
Statistics Sweden (2012). Tema utbildning: distansutbildning på högskolan. Temarapport 2012:6 [eng: Theme education: distance learning for University. Theme report 2012:6]. Sweden: Statistics Sweden.
Stelitano, L., Doan, S., Woo, A., Diliberti, M. K., Kaufman, J. H. & Henry, D. (2020). The digital divide and COVID-19: teachers’ perceptions of inequities in students’ internet access and participation in remote learning. Santa Monica, CA: RAND Corporation. Retrieved from: https://www.rand.org/pubs/research_reports/RRA134-3.html.
Stevens, A. H. & Schaller, J. (2011). Short-run effects of parental job loss on children’s academic achievement. Economics of Education Review, 30(2), 289–99.
Stewart, H., Watson, N. & Campbell, M. (2018). The cost of school holidays for children from low income families. Childhood, 25(4), 516–29.
Svaleryd, H. & Vlachos, J. (2021). Skolresultat och psykisk ohälsa bland elever. Underlagsrapport till SOU 2021:89 Sverige under pandemin [eng: School results and mental illness among students. Background report for SOU 2021:89 Sweden during the pandemic]. Stockholm, Sweden: coronakommissionen. Retrieved from: https://coronakommissionen.com/wp-content/uploads/2021/10/underlagsrapport-svaleryd-o-vlachos-skolresultat-och-psykisk-ohalsa-bland-elever.pdf.
Swedish NAE (2019). Digital kompetens i förskola, skola och vuxenutbildning. Skolverkets uppföljning av den nationella digitaliseringsstrategin för skolväsendet 2018 [eng: Digital competence in preschool, school and adult education. Swedish National Agency for Education's follow-up of the national digitalisation strategy for the school system 2018]. Stockholm, Sweden: National Agency for Education (Skolverket). Retrieved from: https://www.skolverket.se/download/18.6bfaca41169863e6a65d808/1553968256985/pdf4041.pdf.
Swedish NAE (2020a). Betyg och studieresultat i gymnasieskolan 2020. Beskrivande statistik Dnr 2020:1893 [eng: Grades and results in high school 2020. Descriptive statistocs Dnr 2020:1893]. Stockholm, Sweden: National Agency for Education (Skolverket).
Swedish NAE (2020b). Covid-19-pandemins påverkan på skolväsendet. Delredovisning Augusti 2020 [eng: The impact of the covid-19 pandemic on the school system. Sub-report August 2020]. Stockholm, Sweden: National Agency for Education (Skolverket).
Swedish NAE (2020c). Lägesbild av situationen i gymnasieskolan med anledning av Covid-19-pandemin. Insamling 21–25 September [eng: Report of the situation in high school due to the covid-19 pandemic. 21–25 September]. Stockholm, Sweden: National Agency for Education (Skolverket).
Swedish NAE (2020d). Lägesbild av situationen i Komvux med anledning av covid-19-pandemin. Insamling vecka 41–42 [eng: Report of the situation in adult education (Komvux) due to the covid-19 pandemic. Week 41–42]. Stockholm, Sweden: National Agency for Education (Skolverket).
Swedish NAE (2020e). Sammanställd information om situationen hos huvudmän inom riktade insatser med anledning av Corona-krisen [eng: Compiled information on the situation of the targeted principal due to the Corona crisis]. Stockholm, Sweden: National Agency for Education (Skolverket).
Swedish NAE (2020f). Slutbetyg i grundskolan våren 2020. Beskrivande statistik Dnr 2020:1159. [eng: Final grades in compulsory school, Spring 2020. Descriptive statistics Dnr 2020:1159]. Stockholm, Sweden: National Agency for Education (Skolverket). Retrieved from: https://www.skolverket.se/download/18.22df6cdd172a07d4e642228/1600768070605/pdf7301.pdf.
Swedish NAE (2021a). Fjärr- och distansundervisning på högstadiet. Intervjuer med huvudmän med anledning av covid-19-pandemin. Januari 2021. [eng: distance learning in high school. Interviews with the principals due to the covid-19 pandemic. January 2021]. Stockholm, Sweden: National Agency for Education (Skolverket).
Swedish NAE (2021b). Fjärr- och distansundervisning på högstadiet. Intervjuer med huvudmän med anledning av covid-19-pandemin. April 2021. [eng: distance learning in high school. Interviews with the principals due to the covid-19 pandemic. April 2021]. Stockholm, Sweden: National Agency for Education (Skolverket).
Swedish NAE (2021c). Fjärr- och distansundervisning på högstadiet. Intervjuer med huvudmän med anledning av covid-19-pandemin. February 2021. [eng: distance learning in high school. Interviews with the principals due to the covid-19 pandemic. February 2021]. Stockholm, Sweden: National Agency for Education (Skolverket).
Swedish NAE (2021d). Kursbetyg i slutet av gymnasieskolan: En jämförelse av betygen åren 2016–2020. Beskrivande statistik Diarienummer: 2020:1893. [eng: Course grades at the end of high school: A comparison of grades 2016–2020. Descriptive statistics, 2020:1893]. Stockholm, Sweden: National Agency for Education (Skolverket). Retrieved from: https://www.skolverket.se/publikationsserier/beskrivande-statistik/2021/kursbetyg-i-slutet-av-gymnasieskolan.
Swedish NAE (2021e). Undersökning om covid-19-pandemin. Enkätundersökning bland personal i skolväsendet om covid-19-pandemins påverkan, Januari–Februari 2021 [eng: Investigation of the covid-19 pandemic. School staff survey about the impact of the covid-19 pandemic, January–February 2021]. Stockholm, Sweden: National Agency for Education (Skolverket).
Swedish Schools Inspectorate (2020). Gymnasieskolors distansundervisning under covid-19-pandemin: Skolinspektionens centrala iakttagelser efter intervjuer med rektorer [eng: Distance learning in high school during the covid-19 pandemic: Swedish Schools Inspectorate's observations after interviews with school principals]. Stockholm, Sweden: Swedish Schools Inspectorate (Skolinspektionen).
Swedish Schools Inspectorate (2021). Fjärr- och distansundervisning på gymnasieskolor. Iakttagelser baserade på intervjuer med rektorer och elever från 119 verksamheter under covid-19-pandemin [eng: Distance education in high school. Observations based on interviews with school principals and students from 119 schools during the covid-19 pandemic]. Stockholm, Sweden: Swedish Schools Inspectorate (Skolinspektionen).
Swedish Teachers’ Union (2020). Ett ohållbart uppdrag – Lärarförbundets medlemmar om coronavåren 2020 [eng: An unsustainable mission – opinions from members of the Swedish Teachers’ Union about corona in the spring of 2020]. Stockholm, Sweden: Swedish Teachers’ Union (Lärarförbundet).
Swedish Teachers’ Union (2021). Digitalisera inte bort lärarprofessionen. En rapport om lärarnas och skolledarnas roll när skolan digitaliseras. Stockholm, Sweden: Swedish Teachers’ Union (Lärarförbundet).
Thorisdottir, I. E., Asgeirsdottir, B. B., Kristjansson, A. L., Valdimarsdottir, H. B., Tolgyes, E. M. J., Sigfusson, J., Allegrante, J. P., Sigfusdottir, I. D. & Halldorsdottir, T. (2021). Depressive symptoms, mental wellbeing, and substance use among adolescents before and during the COVID-19 pandemic in Iceland: A longitudinal, populationbased study. The Lancet Psychiatry, 8(8), 663–72.
UNICEF (2020). How many children and young people have internet access at home? Estimating digital connectivity during the COVID-19 pandemic. New York, NY: UNICEF.
van der Velde, M., Sense, F., Spijkers, R., Meeter, M. & van Rijn, H. (2021). Lockdown learning: Changes in online foreign-Llanguage study activity and performance of Dutch secondary school students during the COVID-19 pandemic. Frontiers in Education, Vol. 6.
Veldman, K., Reijneveld, S. A., Ortiz, J. A., Verhulst, F. C. & Bültmann, U. (2015). Mental health trajectories from childhood to young adulthood affect the educational and employment status of young adults: Results from the TRAILS study. J Epidemiol Community Health, 69(6), 588–93.
Webbink, D. & Gerritsen, S. (2013). How much do children learn in school? (CPB Discussion Paper 255). The Hauge, Netherlands: CPB.
Werner, K. & Woessmann, L. (2021). The legacy of COVID-19 in education. (Discussion Paper IZA, no. 14796). Bonn, Germany: IZA.
Wester, M. T. (2021). Trivsel blandt førsteårsstuderende under hjemsendelsen i foråret 2021 [eng: Well-being among first-year students during the repatriation in the spring of 2021]. Report Danish Evaluation Institute (EVA). Holbaek, Denmark: EVA. Retrieved from: https://www.eva.dk/videregaaende-uddannelse/trivsel-blandt-foersteaarsstuderende-under-hjemsendelsen-foraaret-2021.
Williams, D. T. & Cheadle, J. E. (2016). Economic hardship, parents’ depression, and relationship distress among couples with young children. Society and Mental Health, 6(2), 73–89.
Wittchen, H. U., Jacobi, F., Rehm, J., Gustavsson, A., Svensson, M., Jönsson, B., Olesen, J., Allgulander, C., Alonso, J., Faravelli, C., Fratiglioni, L., Jennum, P., Lieb, R., Maercker, A., van Os, J., Preisig, M., Salvador-Carulla, L., Simon, R. & Steinhausen, H-C. (2011). The size and burden of mental disorders and other disorders of the brain in Europe 2010. European Neuropsychopharmacology: The Journal of the European College of Neuropsychopharmacology, 21(9), 655–79.
Xu, D. & Jaggars, S. S. (2014). Performance gaps between online and face-to-face courses: Differences across types of students and academic subject areas. The Journal of Higher Education, 85(5), 633–59.
Comment on C. Hall, I. Hardoy & M. Lundin: Schooling in the Nordic countries during the COVID-19 pandemic
The contribution of Hall et al., is twofold. First, the paper summarises the measures taken regarding school closures during the first phase of the COVID-19 pandemic (March 2020 to June 2021) in the Nordic countries. The authors provide a detailed description of the timeline of events in the five countries for three school levels: primary school, middle school, and upper secondary school. Second, the paper summarises evidence on the impact of the school closures, or more especially, the switch to distance learning, on student outcomes in the Nordic countries.
The paper provides a very valuable contribution for policymakers who now, in the aftermath of the COVID-induced school closures, need to assess the effects of the switch to distance learning on student outcomes and tailor future actions to meet potential adverse effects. In addition, the comprehensive compiling of information on the timeline and nature of the school closures in the five Nordic countries provides academic researchers studying the topic a concise source of information that would otherwise be cumbersome to collate.
Given the short time that has elapsed since the school closures in the Nordic countries, the existing evidence of their impact on student outcomes primarily centres on short-term outcomes, and this is reflected in the main focus of the paper. Hall et al., correctly point out that the future is unknown, making any conclusion about the long-term effects prone to a great deal of uncertainty. Nonetheless, using existing evidence of the impact of schooling, or rather the lack of schooling, on earnings, Hall et al., draw the conclusion that an upper bound to the loss in earnings due to the switch to distance learning is 0.3–0.6 percent for 4–9 weeks of school closures (this represents the earnings loss for students who did not learn anything during the closures).
For policy makers who now, in the aftermath of the school closures, have to make decisions regarding which, if any, extra supports are needed in the school system to minimise the adverse effects of the closures on student outcomes, understanding the long-term consequences of those closures is as important as understanding the short- term effects. In what follows, I will add to the discussion on the long-term effects of the switch to distance learning on student outcomes.
Most of the evidence regarding the consequences of the switch to distance learning during the school closures regards learning outcomes (cognitive skills). However, it is reasonable to assume that schooling also nurtures non-cognitive skills, such as critical thinking and social skills (see the summary of the literature in Oreopoulos and Salvanes 2011, p. 165). While a causal relationship from schooling to non-cognitive skills has been studied far less than the corresponding relationship for cognitive skills, there is ample evidence that non-cognitive skills are important for long-term outcomes such as educational attainment and lifetime earnings (Weinberger 2014, Deming 2017).
Assuming that schooling nurtures both cognitive and non-cognitive skills and that the acquisition of both types of skills was negatively affected during the switch to distance learning, the important question for policy makers is how, in the aftermath of the school closures, resources should be allocated to enhance learning on the one hand and non-cognitive skills on the other. The main challenge here is that non-cognitive skills are more difficult to measure than cognitive ones and that there is little concrete evidence of the causal impact of schooling on non-cognitive skills (despite there being a strong correlation between the two, as noted above). Also, it is important to consider that while non-cognitive skills are important in the labour market on their own, cognitive and non-cognitive skills are not independent of each other since non-cognitive skills have been shown to facilitate learning and the development of cognitive skills (Kautz et al. 2014, Liu 2019).
One of the conclusions of Hall et al., is that it is likely that the weakest students and students from a lower socioeconomic background fared worse in the switch to distance learning than stronger students and students from a higher socioeconomic background. This has been shown to be the case for learning outcomes, as discussed in Hall et al., but evidence from the effect of school closures (due to bad weather and teacher strikes) reviewed in Öckert (2021) suggests that the same holds true for future earnings. In addition to this, the switch to distance learning might hinder the development of non-cognitive skills in an unequal manner across student groups. For example, when students are unable to interact with their peers to the same degree as in normal times, the development of social skills is likely to be affected. This may contribute to a widening of the general skills gap. It may also contribute to the gap in learning since non-cognitive skills have been shown to enhance cognitive skills and learning, as noted above. Importantly, non-cognitive skills have been shown to alleviate the relationship between socioeconomic status and educational achievement (Liu 2019). As such, focusing on the non-cognitive skills of students in the aftermath of the school closures may help to avoid a widening of the socioeconomic gap in learning outcomes. Also, given the increasing importance of non-cognitive skills (such as social skills) in the labour market, it is likely that increasing divergence in non-cognitive skills will have consequences for patterns in future earnings.
Finally, a related issue is the role of social networks created in school for future labour market outcomes. During school closures, students did not have the opportunity to create and maintain their social network in the same way as in normal times. Since social networks are important for success in the labour market (see, e.g. Barbone and Dolton 2014), the lack of opportunities to maintain and enlarge their social network may affect students’ career prospects.
In conclusion, it is critical that policy makers consider the expected long-term effects of the switch to distance learning when judging the need for action. In particular, the impact of the switch to distance learning on the development of non-cognitive skills may be an important factor to consider in this regard.
References
Barbone, L. M. & Dolton, P. (2014). Key players? High school networking effects on earnings. (Working paper, University of Sussex). Brighton, UK: University of Sussex.
Deming, D. J. (2017). The growing importance of social skills in the labor market. The Quarterly Journal of Economics, 132(4), 1593–1640.
Kautz, T., Heckman, J. J., Diris, R., Ter Weel, B. & Borghans, L. (2014). Fostering and measuring skills: Improving cognitive and non-cognitive skills to promote lifetime success. (National Bureau of Economic Research Working Paper No. 20749). Cambridge, MA: National Bureau of Economic Research.
Liu, A. (2019). Can non-cognitive skills compensate for background disadvantage? – the moderation of non-cognitive skills on family socioeconomic status and achievement during early childhood and early adolescence. Social science research, 83(102306).
Oreopoulos, Ph. & Salvanes, K. G. (2011). Priceless: The nonpecuniary benefits of schooling. Journal of Economic Perspectives, 25(1), 159–84.
Weinberger, C. J. (2014). The increasing complementarity between cognitive and social skills. The Review of Economics and Statistics, 96(5), 849–861.
Öckert, B. (2021). School absenteeism during the COVID-19 pandemic – how will student performance be affected? In Sjögren, A. (Ed.), Swedish Children and Youth during the COVID-19 Pandemic. (IFAU Working Paper, 2021:3). Uppsala, Sweden: IFAU.
Comment on C. Hall, I. Hardoy & M. Lundin: Schooling in the Nordic countries during the COVID-19 pandemic
Hall et al. makes an important contribution to the policy debate on the consequences of the COVID-19 pandemic on children. It highlights potential issues with distance learning and discusses the learning deficiencies and inequalities created during the past two years. The adverse effects on children and their learning outcomes cannot be stressed strongly enough. Without a proper policy response, there may well be detrimental long-term consequences for individuals and societies alike.
The paper provides a very detailed literature review on the effects of distance learning on schooling outcomes. However, most of the research reviewed is into distance learning before the pandemic. As the authors point out, there may be critical differences in the circumstances before and during the pandemic that affect what conclusions we draw from these studies. While Hall et al. do a good job in discussing the differences in the characteristics of the treatment, i.e., distance learning prior to and during the COVID-19 pandemic, they largely ignore the substantial differences that may exist in the counterfactual, i.e., continuing with in-person learning. These differences can be at least as important for the generalisability of the findings in the earlier literature on the effects of school closures caused by the COVID-19 pandemic.
The main aim of school closures has been to contain the pandemic. If that policy has succeeded in controlling the spread of the virus, it may have had an important role in protecting the health and wellbeing of children and their families. These considerations are highly relevant to the research question at hand since negative health shocks, anxiety and distress caused by a greater likelihood of contracting the virus are also likely to have very negative consequences on children’s learning outcomes.[1]Previous literature has shown that even the health of other family members has a spillover effect on their siblings’ learning (e.g., Daysal et al. 2022, Black et al. 2021). To better understand the overall effects of distance learning during COVID-19, we need to consider whether decisions on school closures have had any significant effect on infection rates.
Most COVID-related school closures have been universal and done at the same time as other interventions, which makes identifying their effects very challenging. Vlachos et al. (2022) utilises the decision of Swedish authorities to close upper secondary schools while keeping lower secondary schools open. The study exploits the partial school closure to compare the incidence rate in parents and teachers at schools that were open and closed but who otherwise faced similar conditions. They show that closing upper secondary schools had only a minor effect on the spread of the virus in society, but it reduced the rate of infection among parents, as well as teachers and their partners.
Footnotes
- ^ Previous literature has shown that even the health of other family members has a spillover effect on their siblings’ learning (e.g., Daysal et al. 2022, Black et al. 2021).
Juutinen et al. (2021) compares incidence trends between areas that took different decisions about closing lower secondary schools in Finland. They find no effect on the infection rates among 13–15-year-olds or other age groups. Finally, Godøy et al. (2022) studies the consequences of reopening schools in Norway and finds a minor effect on the incidence rate in upper secondary teachers but no effects for students, parents, or other subgroups of teachers.
These studies from the Nordic counties, as well as research from elsewhere (e.g., Viner et al. 2020) suggest that school closures do not have a significant impact on containing the COVID-19 pandemic, at least when other social distancing interventions are in place and contagion is at a low level.[1]On the other hand, Juranek and Zoutman (2021) provide evidence on the effectiveness of non-pharmaceutical interventions that included also closing preschools and compulsory schools. They show that the strict approach followed by Denmark and Norway can explain their success in minimising COVID-related hospitalisation and mortality compared to Sweden, which chose to a far more lenient approach. However, they are unable to separate the effect of closing schools from other measures such as remote working. However, more convincing research is called for, not least because new variants keep appearing.[2]There are also several issues with the research approaches that may call the causal identification into question. For example, areas that have kept schools open have, in general, had lower incidence rates than areas that closed schools. The underlying reasons causing the differential prevalence of the virus, may also create divergent trends during the periods studied. In addition, closing schools for some groups may have spillover effects for other groups in the region, and thus, comparing their infection rates may lead us to underestimate the effects on the spread of the virus.
Even if not directly increasing the likelihood of being infected with COVID, in-person teaching during the pandemic may affect learning potential in other ways. The recurrent periods of isolation during this pandemic may, for example, prevent students from receiving teaching while schools are open but make little difference during distance learning. Öckert (2021) shows that although Sweden chose not to close the preschools and compulsory schooling, absenteeism rose significantly, by 50 to 70 percent, among children, students and staff. Hence, the counterfactual for distance learning in the pandemic can hardly be described as in-person teaching, and thus, it is very difficult to draw conclusions from studies from before the pandemic.[3]The effects of school closures have also been examined during other exceptional circumstances such as natural disaster (e.g., Sacerdote 2012, Gibbs et al. 2008). These studies may be more relevant when considering the effects of school closures during the pandemic since there are several similarities in the conditions regarding mental and physical health, distress, and uncertainty.
The discussion above highlights the importance of collating evidence during the pandemic. However, there are also some concerns about interpreting findings from the period of the pandemic (or similar conditions). Disentangling the impact of school closures from the effects of other lockdown policies or conditions caused by the pandemic is highly challenging. Schools are more likely to be closed in areas with a high incidence rate and during periods with a higher number of COVID cases. Hence, it is highly likely that while these policies are in place, other issues caused by the pandemic can also contribute to the observed decreases in learning. Therefore, it is difficult to find convincing evidence of the effects of closing schools. Consequently, the vast majority of the research findings from the past two years should perhaps be interpreted as the overall effects of the pandemic on student outcomes rather than the specific consequences of the policy of closing schools.
Despite these challenges, Hall et al. improves our understanding of the consequences of the pandemic on student learning in an important way. It is evident that there has been a very worrying development of deteriorating learning outcomes and greater inequality in the last two years. A growing body of research also reports large declines in mental and physical health (e.g., Giuntella et al. 2021, Banks & Xu 2020). One policy goal shared by the Nordic countries must surely be to find the most efficient ways to repair the damage and improve student outcomes for those most badly affected. This will require the allocation of considerable resources, but failure to address these problems now may well lead to massive human and financial costs in the future.
Footnotes
- ^ On the other hand, Juranek and Zoutman (2021) provide evidence on the effectiveness of non-pharmaceutical interventions that included also closing preschools and compulsory schools. They show that the strict approach followed by Denmark and Norway can explain their success in minimising COVID-related hospitalisation and mortality compared to Sweden, which chose to a far more lenient approach. However, they are unable to separate the effect of closing schools from other measures such as remote working.
- ^ There are also several issues with the research approaches that may call the causal identification into question. For example, areas that have kept schools open have, in general, had lower incidence rates than areas that closed schools. The underlying reasons causing the differential prevalence of the virus, may also create divergent trends during the periods studied. In addition, closing schools for some groups may have spillover effects for other groups in the region, and thus, comparing their infection rates may lead us to underestimate the effects on the spread of the virus.
- ^ The effects of school closures have also been examined during other exceptional circumstances such as natural disaster (e.g., Sacerdote 2012, Gibbs et al. 2008). These studies may be more relevant when considering the effects of school closures during the pandemic since there are several similarities in the conditions regarding mental and physical health, distress, and uncertainty.
References
Banks, J. & Xu, X. (2020). The mental health effects of the first two months of lockdown during the COVID‐19 pandemic in the UK. Fiscal Studies, 41(3), 685–708.
Black, S. E., Breining, S., Figlio, D. N., Guryan, J., Karbownik, K., Nielsen, H. S., Roth, J. & Simonsen, M. (2021). Sibling spillovers. The Economic Journal, 131(633), 101–128.
Daysal, N. M., Simonsen, M., Trandafir, M. & Breining, S. (2022). Spillover effects of early-life medical interventions. Review of Economics and Statistics, 104(1), 1–16.
Gibbs, L., Nursey, J., Cook, J., Ireton, G., Alkemade, N., Roberts, M., Gallagher, H., Bryant, R., Block, K., Molyneaux, R. & Forbes, D. (2019). Delayed disaster impacts on academic performance of primary school children. Child Development, 90(4), 1402–1412.
Giuntella, O., Hyde, K., Saccardo, S. & Sadoff, S. (2021). Lifestyle and mental health disruptions during COVID-19. Proceedings of the National Academy of Sciences, 118(9).
Godøy, A., Grøtting, M. W. & Hart, R. K. (2022). Reopening schools in a context of low COVID-19 contagion: Consequences for teachers, students and their parents. Journal of Population Economics, 35, 935–961.
Juranek, S. & Zoutman, F. T. (2021). The effect of non-pharmaceutical interventions on the demand for health care and on mortality: evidence from COVID-19 in Scandinavia. Journal of Population Economics, 34, 1299–1320.
Juutinen, A., Sarvikivi, E., Laukkanen-Nevala, P. & Helve, O. (2021). Closing lower secondary schools had no impact on COVID-19 incidence in 13–15-year-olds in Finland. Epidemiology and Infection.
Öckert, B. (2021). School absenteeism during the COVID-19 pandemic – how will student performance be affected? In Sjögren, A. (Ed.), Swedish Children and Youth during the COVID-19 Pandemic. (IFAU Working Paper, 2021:3). Uppsala, Sweden: IFAU.
Sacerdote, B. (2012). When the saints go marching out: Long-term outcomes for student evacuees from hurricanes Katrina and Rita. American Economic Journal: Applied Economics, 4(1), 109–35.
Viner, R. M., Russell, S. J., Croker, H., Packer, J., Ward, J., Stansfield, C., Mytton, O., Bonell, C. & Booy, R. (2020). School closure and management practices during coronavirus outbreaks including COVID-19: a rapid systematic review. The Lancet Child & Adolescent Health, 4(5), 397–404.
Vlachos, J., Hertegård, E. & Svaleryd, H. (2022). School closures and SARS-CoV-2. Evidence from Sweden’s partial school closure. Proceedings of the National Academy of Sciences, forthcoming.

COVID-19 and labour market outcomes by gender in Finland
Abstract
This paper presents evidence of the immediate labour market effects of the COVID-19 pandemic by gender, using Finnish daily administrative data. We document that employment reductions during the COVID-19 pandemic were more pronounced in female-dominated industries. However, other industries that weathered the pandemic particularly well also have high proportions of female employees, leading to an attenuated aggregate impact. We also document substantial earnings losses among workers who lost their jobs during the pandemic. These losses are relatively similar between genders. We do not find that earnings losses were more pronounced for women with children than for those without, indicating that childcare responsibilities did not exacerbate the costs of job losses during the pandemic.
Keywords: Covid-19, gender, job loss, earnings, childcare.
JEL codes: J16, J21, J3, J63.
1 Introduction
The COVID-19 pandemic has had major impacts on labour markets. The changes to employment during the resulting recession have differed greatly from previous recessions in Western economies (see, e.g., Albanesi & Kim 2021). The services sector, which generally employs more women than men, has been the most affected by the COVID-19 recession. In many countries, the pandemic shifted both childcare and educational responsibilities from schools and daycare facilities to parents at home. Survey evidence (Adams-Prassl et al. 2020) suggests that the COVID-19 crisis had a major impact on workers, especially women and low-skilled workers. Studies using administrative data from Nordic countries are still scarce and have focused on documenting unemployment and furlough incidence during the pandemic (e.g., Alstadsæter et al. 2020, Hensvik & Skans 2020, Juranek et al. 2021).
This paper presents evidence of the immediate labour-market effects of the COVID-19 pandemic by gender in Finland. We also provide, for comparison, a brief overview of the impact of the COVID-19 crisis on the employment of men and women in all the Nordic countries using Labour Force Survey data. We then dig deeper into the gender differences in the employment effects of the recession triggered by COVID-19 using high frequency (daily) population-wide administrative data for Finland. We document how the employment of men and women developed in Finland during the pandemic and calculate the earnings losses associated with job loss (unemployment or furlough) within a six-month follow-up period.
Despite some differences in containment measures, the development of aggregate employment was quite similar in most of the Nordic countries after the onset of the COVID-19 crisis. With the exception of Iceland, all of the Nordic countries experienced a drop in the employment rate of approximately 1 percentage point between the fourth quarter of 2019 and the fourth quarter of 2020. In Iceland, the employment rate fell by almost 7 percentage points during the same period, but this change was affected by a break in the time series. Gender differences in the development of employment were minimal in Denmark, Norway and Iceland, while in Sweden and especially Finland, the employment rate for women dropped slightly more than that for men.
Our results from the more detailed analysis of Finnish administrative data indicate that the COVID-19 recession had a big and immediate impact on the Finnish economy. It resulted in widespread job losses, especially in the service sector and logistics. The relative employment loss was greatest in sectors with a higher share of women workers, such as the hotel and restaurant industry. However, other sectors with a high proportion of female workers, such as health and social care, did relatively well in terms of employment during the pandemic. Among industries with a higher proportion of male workers, the largest relative fall in employment was in logistics. The employment losses for women were quite short-lived at the aggregate level, while aggregate employment for men recovered more slowly.
In the final part of the paper, we focus on the employment and earnings consequences of job losses during the pandemic. We follow the framework from the job displacement literature (see, e.g., Jacobson et al. 1993, Couch & Placzek 2010, Huttunen et al. 2011 and Illing et al. 2021) and analyse the earnings losses of workers who lost their jobs during the pandemic. Our paper differs from these others in certain aspects: We have higher frequency data, a shorter follow-up period and we focus on all kinds of job losses, including furlough. Our results show that workers who were furloughed or became unemployed during the pandemic suffered significant earnings losses. The magnitude of the immediate losses was high, 51 percent for both men and women. The losses were more significant for workers in the hospitality sector and in logistics.
Since our focus is on gender differences, we also investigate whether the consequences of job loss were different for parents than for childless workers. Restrictions on schooling and daycare may have adversely affected the ability of parents to work or actively seek employment. These effects may have been more pronounced for women since they traditionally bear a larger share of childcare responsibilities. The results do not support this conjecture, as the costs of job losses are similar for women both with and without children.
Some studies have already documented how employment has changed during the COVID-19 pandemic. Interestingly, unlike in previous recessions, female employment in many countries has been hit harder during the pandemic recession. Albanesi and Kim (2021) use the Current Population Survey to compare the employment effects of the pandemic recession to the effects of the Great Recession in the US. While female employment generally is less cyclical than male employment, women, especially those with children, experienced a much greater drop in overall employment during the COVID-19 pandemic. Adams-Prassl et al. (2020) investigate the short-term employment effect of the pandemic using real-time surveys from three different countries; the UK, the US and Germany. They find significant national differences in job losses. A large proportion of the workforce lost their jobs in the UK and US, whereas the employment effects were less severe in Germany. Women and low-skilled workers were the most negatively affected in all three countries. Farré et al. 2020 come to a different conclusion using survey data from Spain. They find that the pandemic reduced paid work for men and women equally in Spain. Our paper uses population-wide administrative data to add to this literature and documents how employment of men and women evolved in Finland during this period. We also analyse the employment and earnings consequences of temporary and permanent layoffs during the pandemic.
This paper is structured as follows. First, we discuss the development of employment in the Nordic countries during the pandemic. In Section 3, we turn specifically to Finland and provide an overview of the major restrictions and policies implemented in the country to prevent the spread of the COVID-19 virus and alleviate problems faced by firms and workers. In Section 4, we describe the data in greater detail and in Section 5, we present evidence on aggregate employment changes by gender during 2019-2021. In Section 6, we investigate the magnitude of earnings losses associated with job termination during the COVID-19 recession. We analyse the effects separately by gender, industry and family status. In the final section, we present our conclusions.
2 COVID-19 and Labour Markets by Gender in the Nordic Countries
2.1 Employment rates for men and women at the onset of the pandemic
Figures 1a and 1b show the employment rates in the Labour Force Statistics for men and women in the Nordic countries between the first quarter of 2019 and the second quarter of 2021. Differences in pre-pandemic employment levels between the Nordic countries can be affected by a number of factors, e.g., differences in policies that influence labour-force participation, labour market institutions in general and economic growth. Iceland, which suffered the sharpest drop following the financial crisis, has since recovered well and had an employment rate well above the other Nordic countries prior to the pandemic and after the onset of it. In Finland, on the other hand, where economic growth was lower than in the other Nordic countries for several years following the financial crisis, the male employment rate was significantly below that of the other countries, despite reasonable levels of economic growth in the years prior to the pandemic.
Figures A1a and A1b in the Appendix indicate that the difference in male employment rates between Finland and the other Nordic countries was due to a sharp drop in male employment rates in Finland after the age of 50. It should also be noted that, due to differences in the prevalence of part-time work, the full-time-equivalent (FTE) employment rate in Finland is higher than in Denmark for both men and women. For women, the FTE employment rate in Finland also exceeds that of Norway.
The differences in employment levels by gender may also reflect differences in family policies between these countries. All four have extensive parental leave, totalling 39 weeks (Iceland), 52 weeks (Finland, Norway, Denmark) and 69 weeks (Sweden). In all of them, the leave can be shared between parents, although some weeks are reserved exclusively for one of the parents in two-parent families (Nososco 2017).[1]In Sweden, Norway and Iceland, parental leave benefits can be divided equally between parents, while in Denmark and Finland, women are still eligible for a longer period of paid leave than fathers (See Nososco 2017). There are, however, clear differences in the subsidy policies for caring for children at home after formal parental leave. Finland, in particular, has a generous allowance policy for care in the home, which has been in place since the mid-1980s and is widely used.[2]Norway and Sweden subsequently introduced similar policies (although only temporarily in Sweden), but the take up has never been as high as in Finland. See Ellingsæter (2012). Parents with children under the age of three not attending formal daycare outside the home are eligible for the allowance. As a result, the share of children in formal daycare is significantly lower in Finland than in the other Nordic countries.[3]Around 80 percent of children aged 4–5 attended formal daycare in Finland in 2018, while for the other Nordic countries the rate is between 97–99 percent (OECD 2021). The results of these policies can be seen in the average employment rates for fertile-age women. Figures A1a and A1b in the Appendix show that there is a clear drop in the employment rate among women aged 30–39 in Finland. This drop in the employment age profile for women is not replicated in the other Nordic countries. Kosonen (2014) and Gruber et al. (2021) show that the Finnish policy of paying a home care allowance has had a significant effect on maternal labour supply in Finland.
Footnotes
- ^ In Sweden, Norway and Iceland, parental leave benefits can be divided equally between parents, while in Denmark and Finland, women are still eligible for a longer period of paid leave than fathers (See Nososco 2017).
- ^ Norway and Sweden subsequently introduced similar policies (although only temporarily in Sweden), but the take up has never been as high as in Finland. See Ellingsæter (2012).
- ^ Around 80 percent of children aged 4–5 attended formal daycare in Finland in 2018, while for the other Nordic countries the rate is between 97–99 percent (OECD 2021).
Figure 1a Employment rates for women in the Nordic countries
Figure 1b Employment rates for men in the Nordic countries
2.2 The COVID-19 pandemic in the Nordic countries
The COVID-19 pandemic started almost simultaneously in the Nordic countries, with the 100th confirmed case on 4 March in Norway, 6 March in Sweden, 9 March in Denmark and 12 March in both Finland and Iceland.[1]Downloaded from Our world in data, 2 December 2021 (https://ourworldindata.org/coronavirus). The countries reacted somewhat differently in terms of containment measures, with all of them except Sweden adopting relatively strict measures, including restrictions on restaurants and personal services, which in turn directly affected many businesses. While the Swedish Government adopted a policy based primarily on recommendations with few actual restrictions, people appear to have complied with the recommendations to a large extent, and the implications for economic activity have been substantial (Hensvik & Skans 2020).[2]Keeping schools open in Sweden constituted the major policy difference and was not affected by whether people observed the official recommendations or not. Juranek et al. (2021) analyse unemployment and furlough spells in Denmark, Finland, Norway and Sweden at the onset of the COVID-19 crisis and find that while the incidence of unemployment and furlough increased in all these countries, the situation in Sweden lagged behind that of the other countries by a few weeks.
All the Nordic countries adopted measures such as deferral of tax payments and grants for businesses that struggled due to the pandemic.[3]Downloaded from Eurofund and Government of Iceland, 2 December 2021 (https://static.eurofound.europa.eu/covid19db/, https://www.government.is/government/covid-19/) The measures aimed at supporting those at risk of unemployment differed somewhat. Finland and Norway already had existing furlough schemes in place, which enabled firms to lay off workers temporarily while maintaining their employment contracts. Furloughed workers in Finland and Norway are entitled to unemployment benefits based on full furlough or reduced working hours. At the onset of the pandemic, the redundancy regulations and conditions for accessing unemployment benefits were made more lenient in both Finland and Norway.
In Denmark, Sweden and Iceland, new short-time work compensation programmes were put in place under which workers kept their jobs but reduced their hours either partly (Sweden and Iceland) or in full (Denmark). Workers either retained their total salaries (Denmark) or part of their salary. In both Denmark and Sweden, employers were compensated for wage costs up to a pre-determined cap, while in Iceland, workers who were downgraded to part-time employment were entitled to partial unemployment benefit. Similarly, eligibility conditions for accessing unemployment insurance were made more lenient in Denmark, Sweden, and Iceland.
The flexibility provided by the pre-existing furlough schemes, as well as the newly introduced short-time work compensation schemes, appears to have been widely used in the Nordic countries. In Norway, 90 percent of layoffs during the first seven weeks of the pandemic were temporary in character (Alstadsæter et al. 2020), and in our analysis of the Finnish data, 77 percent of laid-off workers initially registered as furloughed. Some of these workers may, obviously, have been laid off permanently at a later date. In Sweden, 9 percent of the labour force was covered by the short time working scheme, eight weeks after the containment measures were announced (Hensvik & Skans 2020). Survey evidence from Denmark indicates that 24 percent of employees were employed in firms that took advantage of the support measures to preserve jobs (Bennedsen et al. 2020).
Footnotes
- ^ Downloaded from Our world in data, 2 December 2021 (https://ourworldindata.org/coronavirus).
- ^ Keeping schools open in Sweden constituted the major policy difference and was not affected by whether people observed the official recommendations or not.
- ^ Downloaded from Eurofund and Government of Iceland, 2 December 2021 (https://static.eurofound.europa.eu/covid19db/, https://www.government.is/government/covid-19/)
The differences in policy approaches to supporting workers lead to variations in how the actual decrease in work manifests in the employment and unemployment statistics. Full-time furloughed workers should not be counted as employed, while workers with less than a 100 percent hour reduction will be included. As seen in Figures 1a and 1b, the overall development is quite similar for men and women in all of the Nordic countries, with a drop in employment rates at the onset of the pandemic followed by a gradual recovery. Having started from a higher level than in many other countries, employment rates in Iceland suffered the largest drops, but the development is affected by a break in the time series in the fourth quarter of 2020. It is notable that the employment rate for women exceeded pre-pandemic levels in the second quarter of 2021 in Norway and Denmark. However, caution should be exercised in comparing the development of employment rates between countries due to differences in the COVID-19 support measures outlined above.
Figure 2 focuses on the change in employment rates for men and women between the fourth quarter of 2019 and the fourth quarter of 2020. The impact of the pandemic was very similar for the employment rates of men and women in Denmark, Norway and Iceland, albeit the drop in Iceland was larger overall.[1]Note that there is a break in the Icelandic timeseries in the fourth quarter of 2020. In Finland and Sweden, the employment rate for women was affected more than that for men. The employment rate for women in Finland fell further than for men, and the impact of the pandemic on the employment rate for Finnish men was the lowest in the Nordic countries.
Footnotes
- ^ Note that there is a break in the Icelandic timeseries in the fourth quarter of 2020.
Figure 2 Changes in employment rates between the fourth quarter of 2019 and the fourth quarter of 2020[1]Due to the break in the time series for Iceland in the fourth quarter of 2020, the change in the employment rates is not comparable with the other countries.
Footnotes
- ^ Due to the break in the time series for Iceland in the fourth quarter of 2020, the change in the employment rates is not comparable with the other countries.
3 COVID-19 and Policy in Finland
3.1 Restrictions and recommendations
Once the number of confirmed cases of COVID-19 started rising in Finland, the government moved fast and imposed several restrictions in March and April 2020. Figure 3 shows the confirmed cases and initial restrictions implemented in spring 2020. As always, the number of confirmed cases is subject to testing practices and may not depict the actual spread of the disease. On 16 March, the government issued a recommendation for remote work, public gatherings were restricted to ten or fewer people, individuals over the age of 70 were asked to isolate, and all public facilities, such as libraries and sports facilities, were closed.
Schools, including upper secondaries, as well as universities, moved to remote teaching from 18 March 2020. An exception was made for children whose parents were employed in ‘essential’ occupations and who were in pre-school or in grades 1–3 of compulsory schooling. The interpretation of ‘essential’ was not entirely clear and left room for case-by-case discussions. The list included occupations such as healthcare workers, police officers, firemen, utility workers, cleaners and occupations related to food supply. Children with a parent in one of these occupations could remain in school. A recommendation was also made that families with children in daycare keep their children home, if possible. The number of children attending daycare dropped significantly following this particular recommendation. Additional restrictions were introduced in the following weeks. People were not allowed to travel in or out of Helsinki between 28 March and 15 April. All bars and restaurants were closed on 4 April. All sporting activities and events were suspended. Shops did, however, remain open.
Most of the restrictions remained in place until late May or early June. Compulsory schools were re-opened on 14 May 2020, while upper-secondary schools and universities remained closed. At the beginning of June 2020, the government allowed public gatherings of up to 50 individuals indoors and 500 outdoors. Restaurants, sports facilities, swimming pools, libraries and other public facilities were re-opened with less severe restrictions. In summer 2020, Finland imposed a revised set of restrictions: restaurants were re-opened, and many children’s outdoor sporting activities resumed. However, the recommendation to work from home remained in place, and cultural activities remained closed.
In August 2020, compulsory schooling and upper-secondary schools (vocational schools and high schools) continued with in-person teaching. However, by November 2020, the number of COVID-19 infections started to rise again, and restrictions were re-introduced. These restrictions were now location-specific. In areas where the number of COVID-19 infections passed a critical threshold, upper secondary schools were moved to online teaching, indoor sports facilities were closed, and restaurants again faced restrictions on their opening hours and customer capacity. In spring 2021, restaurants were closed down for a while in the most affected areas. The biggest drop in employment occurred during the early months of the pandemic when nationwide restrictions were in place.
Figure 3 COVID-19 cases and initial restrictions in Finland
3.2 Existing and new support measures
Prior to the COVID-19 crisis, employers in Finland were already able, subject to advance notification, to furlough workers. The employment contracts of furloughed workers remained valid, and they were entitled to unemployment benefits. Unemployment benefits are earnings-related if conditions related to prior employment and membership of an unemployment insurance fund are met. Earnings-related unemployment insurance benefits last a maximum of 300 or 400 days, depending on the employment history of the claimant. Unemployed or furloughed workers who are not entitled to earnings-related unemployment insurance benefits or have exhausted these benefits receive a fixed unemployment benefit. Furlough schemes can be full-time or part-time, with part-time schemes implying reduced hours of work and pay. Workers who involuntarily (i.e., due to furlough or unemployment) work part-time or short-term are entitled to partial unemployment benefits, which are relatively generous in Finland. A worker is entitled to full unemployment benefit if their monthly earnings fall below 300 euro. Earnings above this threshold reduce the benefit by 50 percent for each euro earned.
Following the onset of the pandemic, the government introduced several changes to redundancy regulations and unemployment insurance. The advance notice period for furlough was shortened, and in conjunction with this, the five-day waiting period for unemployment benefit was removed. The employment condition required for earnings-related unemployment insurance was shortened, and the earnings threshold was raised to 500 euro. The maximum length of time for which unemployment insurance benefit could be paid was temporarily extended by a policy of not counting days on unemployment insurance towards the maximum time on benefits. Self-employed people who would otherwise have to close their business to qualify for unemployment benefit were also made eligible.
The shorter advance notice period for furlough was aimed at providing flexibility for companies. Numerous other policy changes were introduced targeting employers and enabling them to stay afloat despite the restrictions and behavioural changes by consumers caused by the pandemic. Bankruptcy legislation was made more lenient to prevent companies from having to file for bankruptcy, tax payments were deferred, and various direct grants were provided based on, e.g., reductions in turnover. An initial evaluation of these subsidies indicates an increase in sales and wage bills for those companies that received the grants when compared to similar non-subsidised firms (Kutilainen et al. 2021). The subsidies also appear to have reduced the probability of furloughs, and to a lesser extent, the threat of permanent layoffs.
4 Data
We use administrative income register data that provides daily information on earnings payments for all Finnish employees from January 2019 onwards. Statistics Finland receives daily updates of the income register data. Payments of earnings are, for the most part, registered by the employer with a lag of maximum 30 days. We have access to the income register data with an additional lag of approximately 45 days due to Statistics Finland’s regulations. By using linked employer-employee identifiers, the daily data can be linked to up-to-date information from the tax administration on, e.g., the employer’s industry.
We also complement the earnings data with daily individual-level data from the public employment service on unemployment inflow and furlough (temporary layoffs) to identify transitions from employment to unemployment. In addition to the data on earnings and unemployment, we also have access to extensive information on background characteristics for the whole population as well as employers. This background data depicts the situation at the end of each calendar year, with a lag of 6–24 months depending on the variable.
We use the income register data to study employment as well as earnings since no up-to-date data on periods of employment is available. We define a person as employed if they earn the equivalent of 1 000 euro per month during a payment period.[1]Around 10.5 percent of women and 7.2 percent of men earned 0–1 000 euro per month (See Figures A5a–A5d in Appendix). There are some differences in the employment dynamics depending on the income cut-off used, with employment for individuals on higher incomes appearing to have recovered slightly faster than for others. The 1 000 euro cut-off will also include individuals who work part-time. A payment period is covered by one payment, and the start and end dates of the period of employment for which the payment is made are registered by the employer. However, these dates do not necessarily coincide with the dates of the employment contract. This implies that there may be some measurement error in our definition of employment.
Footnotes
- ^ Around 10.5 percent of women and 7.2 percent of men earned 0–1 000 euro per month (See Figures A5a–A5d in Appendix).
When studying earnings after job losses, we limit our analysis to individuals who registered as unemployed or furloughed between March 2020 and February 2021 to enable a balanced panel for follow-up.[1]If a worker leaves the labour force after losing their job and does not register as unemployed or furloughed, we are unable to observe this and thus do not register that worker as having lost their job. However, this is not very common because unemployment benefits are conditional on registering as unemployed. A person is defined as furloughed if their employer lays them off for a temporary period, but they remain officially employed with an employment contract (though without pay). The furloughed person can thus return to their job but may also be laid off at a later date.
We only consider the first incidence of unemployment or furlough, with potential subsequent registrations included in the follow-up period. If a person who is furloughed becomes unemployed later, this is not, therefore, counted as a permanent layoff in our analysis. As a comparison group, we use individuals who are observed in the income register at least once between March 2020 and February 2021 and who do not register as unemployed or furloughed between March 2020 and the end of our follow-up period. We follow both the group of unemployed and furloughed workers as well as the comparison group of employed individuals six months before and six months after the month of job loss or corresponding reference month for employed people. Both groups are restricted to have been employed in the sense that they earned at least the equivalent of 1 000 euro per month six months prior to the reference month.
Table 1 provides descriptive statistics for our sample. It shows that the reason for job loss for most workers in the sample (77 percent) is furlough, and only 23 percent become unemployed because of permanent layoff. Job losses seem to be equally common among both genders. Most job losses (furlough/unemployment) in Finland occurred during the early months of the COVID-19 pandemic, between March 2020 and June 2020.
Footnotes
- ^ If a worker leaves the labour force after losing their job and does not register as unemployed or furloughed, we are unable to observe this and thus do not register that worker as having lost their job. However, this is not very common because unemployment benefits are conditional on registering as unemployed.
Table 1 Descriptive Statistics
| No job loss 03/2020–02/2021* | Job loss 03/2020–02/20211 | All | ||||
| Mean | SD | Mean | SD | Mean | SD | |
| Share unemployed, % | 0 | 0 | 23.09 | 42.14 | 3.35 | 17.98 |
| Share furloughed, % | 0 | 0 | 76.91 | 42.14 | 11.15 | 31.47 |
| Share female, % | 49.45 | 50.00 | 50.73 | 49.99 | 49.63 | 50.00 |
| Share with children under 18, % | 36.52 | 48.15 | 34.54 | 47.55 | 36.23 | 48.07 |
| Labor earnings at beginning of observation period (EUR monthly) ** | 3456.42 | 2946.54 | 3023.58 | 1712.33 | 3393.70 | 2805.71 |
| Labor earnings during observation period (EUR monthly) *** | 3314.36 | 3075.02 | 2530.21 | 2055.12 | 3226.32 | 2988.24 |
| Share employed in different industries, % | ||||||
| Agriculture, forestry and fishing | 1.18 | 10.82 | 0.77 | 8.74 | 1.12 | 10.55 |
| Mining and quarrying | 0.30 | 5.47 | 0.10 | 3.11 | 0.27 | 5.20 |
| Manufacturing | 12.65 | 33.25 | 20.19 | 40.14 | 13.75 | 34.43 |
| Electricity, gas, steam and air conditioning supply | 0.67 | 8.13 | 0.08 | 2.79 | 0.58 | 7.59 |
| Water supply; sewerage, waste management and remediation | 0.49 | 7.02 | 0.12 | 3.44 | 0.44 | 6.62 |
| Construction | 7.29 | 26.00 | 4.64 | 21.04 | 6.91 | 25.36 |
| Wholesale and retail trade; repair of motor vehicles | 10.59 | 30.77 | 13.90 | 34.60 | 11.07 | 31.38 |
| Transportation and storage | 4.76 | 21.29 | 8.12 | 27.31 | 5.25 | 22.30 |
| Accommodation and food service | 1.54 | 12.30 | 9.99 | 29.98 | 2.76 | 16.38 |
| Information and communication | 5.15 | 22.11 | 2.95 | 16.92 | 4.83 | 21.45 |
| Finance and insurance | 2.34 | 15.12 | 0.51 | 7.15 | 2.08 | 14.26 |
| Real estate | 1.03 | 10.12 | 0.90 | 9.43 | 1.01 | 10.02 |
| Professional, scientific and technical activities | 5.98 | 23.72 | 4.03 | 19.67 | 5.70 | 23.18 |
| Administrative and support services | 6.49 | 24.63 | 8.52 | 27.92 | 6.78 | 25.14 |
| Public administration and defence | 19.52 | 39.64 | 12.23 | 32.76 | 18.46 | 38.80 |
| Education | 4.00 | 19.59 | 1.90 | 13.67 | 3.69 | 18.86 |
| Health and social work | 12.72 | 33.32 | 6.57 | 24.78 | 11.83 | 32.29 |
| Arts, entertainment and recreation | 0.92 | 9.54 | 2.36 | 15.18 | 1.13 | 10.56 |
| Other services | 2.17 | 14.56 | 2.03 | 14.11 | 2.15 | 14.50 |
| Activities of households as employers | 0.16 | 3.96 | 0.07 | 2.58 | 0.14 | 3.80 |
| Extraterritorial organisations | 0.02 | 1.49 | 0.00 | 0.55 | 0.02 | 1.39 |
| Industry unknown | 0.01 | 0.93 | 0.00 | 0.48 | 0.01 | 0.88 |
| Month of job loss (share, %) | ||||||
| March 2020 | 0 | 0 | 20.99 | 40.72 | 3.04 | 17.17 |
| April 2020 | 0 | 0 | 40.67 | 49.12 | 5.89 | 23.55 |
| May 2020 | 0 | 0 | 15.79 | 36.46 | 2.29 | 14.95 |
| June 2020 | 0 | 0 | 13.42 | 34.09 | 1.95 | 13.81 |
| July 2020 | 0 | 0 | 5.05 | 21.91 | 0.73 | 8.53 |
| August 2020 | 0 | 0 | 4.07 | 19.77 | 0.59 | 7.66 |
| Observations, individuals | 1 ___935 ___715 | 375 ___418 | 2 ___311 ___133 | |||
| Observations, person-months | 4 ___3311 ___858 | 4 ___878 ___621 | 48___190 ___479 | |||
* No job loss group includes individuals who did not register as unemployed of furloughed between March 2020 and August 2020, were observed in the Incomes Register at least once between March 2020 and August 2020 and had earned at least EUR 1000/month 6 months prior to this observation. The job loss group includes individuals who registered as unemployed or furloughed between March 2020 and August 2020 and had earned at least 1 000 euro 6 months prior to job loss. The month of job loss refers to the first registration.
** Labour earnings measured 6 months prior to job loss or 6 months prior to first observation during COVID-crisis.
*** Labour earnings in job loss month and 6 months before/after for job loss group. For group with no job loss labour earnings 6 months before first observation after March 2020 and 6 months after last observation observed up to February 2021.
5 Changes in employment by gender
We begin by documenting how aggregate employment has evolved by gender during the COVID-19 pandemic. Figures 4a and 4b plot the number of employed people, defined as workers earning more than 1 000 euro a month, in different months in 2019, 2020 and 2021. The figure shows that there is a clear drop in the number of employed women at the start of the pandemic in April 2020. The number of employed men drops at the same time, but the magnitude in relative terms was less pronounced. After the sharp initial drop, the employment levels for women remained below 2019 levels until the end of 2020 but have since recovered. Male employment, on the other hand, has remained at lower levels throughout 2020 and 2021, after the slightly lower relative drop at the onset of the pandemic.
Figure 4a Aggregate employment, women
Figure 4b Aggregate employment, men
Figures 5a.1–5d.2 illustrate the changes in employment in some of the hardest-hit industries and, for comparison, employment in health and social care, a sector that has done well during the pandemic in terms of retaining jobs. Other sectors with large relative drops in employment include hotels and restaurants, arts and recreation and logistics. These sectors differ both in terms of size and in the proportion of women workers, with the female share particularly high in the hospitality industry and the male share high in logistics. The employment drop at the beginning of the pandemic was especially pronounced for women working in hotels and restaurants. For men, the drop in employment in logistics was also relatively large. The largest relative drop in employment was in the hotel and restaurants sector: 50 percent for women and 51 percent for men.
While the difficulties in the hospitality sector particularly affected female employment, health and social care, with its very high number of women workers has done well in terms of retaining jobs during the pandemic. Figures 5a.1–5d.2 also show that female employment in health and social care was over five times that of hotels and restaurants prior to the pandemic, which attenuates the aggregate impact of the drop in female employment in the most hard-hit industries and contributes to the positive employment figures for women in 2021 already seen in Figures 4a and 4b. Appendix Figure A2 plots the overall change in earnings from 2019 to 2020 against the female proportion in each industry. While the largest earnings drop occurred in sectors with a high proportion of female workers, earnings also fell considerably in the male-dominated construction sector. As pointed out, the relatively positive development in the large health and social care sector with its high share of women workers offsets the weaker earnings development in the smaller service sectors to a certain extent.[1]In appendix Figures A3 and A4a– A4d we document the total wage bill 2019–2021. When considering the size of the sectors, there is hardly any association between the female share of the workforce and the relative change in earnings in 2020.
Footnotes
- ^ In appendix Figures A3 and A4a– A4d we document the total wage bill 2019–2021.
Figure 5a.1 Employment by gender 2019–2021: Most affected and resilient industries – Hotels and restaurants, women
Figure 5a.2 Employment by gender 2019–2021: Most affected and resilient industries – Hotels and restaurants, men
Figure 5b.1 Employment by gender 2019–2021: Most affected and resilient industries – Logistics, women
Figure 5b.2 Employment by gender 2019–2021: Most affected and resilient industries – Logistics, men
Figure 5c.1 Employment by gender 2019–2021: Most affected and resilient industries – Arts and recreation, women
Figure 5c.2 Employment by gender 2019–2021: Most affected and resilient industries – Arts and recreation, men
Figure 5d.1 Employment by gender 2019–2021: Most affected and resilient industries – Health and social care, women
Figure 5d.2 Employment by gender 2019–2021: Most affected and resilient industries – Health and social care, men
6 How did job losses affect workers?
6.1 Effect of job loss on earnings
We have illustrated above that the COVID-19 pandemic led to a significant drop in employment. These drops were especially large for women working in the service sector (retail, hotels and restaurants). What were the consequences of job loss for individual workers? Previous literature has documented that workers displaced from their jobs suffer long-lasting employment losses (See, e.g., Jacobson et al. 1993, Couch & Placzek 2010, Huttunen et al. 2011 and Illing et al. 2021). Displaced workers tend to experience lower levels of earnings and employment for several years after job loss compared to similar non-displaced workers.
Using our daily data on earnings and information to examine reasons for job terminations, we investigate the immediate earning losses for workers whose employment came to an end during the COVID-19 period. We account for both temporary (furlough) and more permanent job losses. Figure 6 plots the monthly earnings of those who lost their jobs (registered as furloughed or unemployed) in time 0. The earnings measure consists of earnings from paid work and does not include any benefits or transfer payments. For comparison, monthly earnings of workers who were not furloughed or made unemployed in year 0 are also plotted. Both groups are restricted to workers whose earnings six months prior to possible job termination were at least 1 000 euro a month.
The figure shows that while there is a difference in the earnings of these two categories, even before the job loss, those who lost their job at time 0 experienced a significant drop in the first two months after the job loss and remained at a lower level during the six-month follow-up period.
Figure 6 Average monthly earnings at first incidence of unemployment/furlough
Next, we illustrate the magnitude of the job loss using a regression framework. Figure 7 plots point estimates from a regression that estimates the effect of job loss (due to furlough/unemployment) at month 0 on monthly earnings from five months before to six months after job loss. The specification includes worker fixed effects and is estimated separately for men and women. The period six is used as a baseline, and we drop the coefficient for that year from the event study regression. The point estimates should therefore be interpreted as the drop in monthly earnings due to furlough/unemployment.
Figure 7 The effect of job loss on monthly earnings
The earnings losses due to job loss are substantial. In the first month after a job loss, male workers who were furloughed or became unemployed earned 1 700 euro less a month. This corresponds to a 50 percent decrease when compared to mean earnings in one month prior to job loss (3 300 euro). For women, the loss is 1 300 euro, which also corresponds to a 50 percent decrease when compared with the monthly earnings level prior to job loss (2 600 euro). The immediate earnings loss is, therefore, of the same magnitude for men and women. It is important to note that the earnings measure also includes zero earners, and thus the immediate impact reflects both the drop in earnings and in employment. Over time, the earnings loss diminishes both for men and women but does not fade away completely during the six-month follow-up period.
6.2 Effect of job loss/furlough by sector
Next, we illustrate these losses by sector. Figures 8a–8d show earnings losses for workers in the worst affected sectors and in health and social care, which, if anything, benefited from the pandemic in terms of employment. The earnings losses are most pronounced for men and women working in hotels and restaurants and in logistics. The average loss in the month following job loss was 65 percent for women and 72 percent for men in the hotels and restaurants sector, and 61 percent and 62 percent in logistics. It should be noted that earnings losses for men and women are of the same magnitude in relative terms. Earnings recover more slowly in logistics than in the other sectors. While those who lost a job in health and social care also experienced an immediate drop in earnings, the recovery was quicker for them, with earnings reaching pre-job loss levels four-six months after becoming unemployed or furloughed.
Figure 8a Effect of job loss, hotels and restaurants
Figure 8b Effect of job loss, logistics
Figure 8c Effect of job loss, recreation
Figure 8d Effect of job loss, healthcare and social
6.3 Effect of job loss by family status
The COVID-19 pandemic did not just affect the labour market. It also had a big impact on children’s schooling and daycare, both in the form of school closures in the spring of 2020 and absence due to self-isolation and flu-like symptoms. As a result, the pandemic may have affected families and single individuals differently, with parents of young children potentially finding it harder to work or actively look for work.
To investigate this, we estimate the effect of job loss separately for women and men with and without children. Figure 9 shows that the magnitude of earnings loss after furlough/unemployment was similar for men and women with and without children. If anything, earnings for men and women with children recovered slightly faster, but as the estimates are from separate regressions, proper inference on this is not possible.
Figure 9 Effect of job loss by family status and gender
7 Discussion
The COVID-19 pandemic has had a big impact on labour markets throughout the world. The crisis was expected to affect the sexes differently and affect women’s employment opportunities more strongly for two reasons. First, the sectors with a proportion of women workers were hit harder. Second, as restrictions affected children’s schooling and daycare, they may also have influenced women’s employment opportunities.
In this paper, we provided a brief overview of employment for men and women in the Nordic countries during the pandemic. While policies to counteract the crisis differed between the countries, employment rates reacted in a broadly similar manner, with men and women suffering relatively similar drops in employment. In Finland, the employment rate for women decreased more than for men. We examined the Finnish case more thoroughly by studying high-frequency administrative data. Our analysis indicates that employment in Finland dropped significantly after the outbreak of COVID-19, with women experiencing slightly larger relative drops. However, the aggregate effect was relatively short-lived, especially for women. Employment effects varied substantially between sectors, with employment in service sectors with a high share of women dropping by over 50 percent year-on-year.
Our results show that permanent or temporary job loss (furlough) during the COVID-19 pandemic resulted in a sharp and significant losses in earnings. On average, the percentage drop in earnings after job loss was very similar between genders, around 50 percent, when compared to pre-displacement earnings levels. The losses were greater in the more affected industries, such as hotels and restaurants, where laid-off workers suffered an approximately 60–70 percent drop in monthly earnings at the time of job loss. Interestingly, family status did not appear to have any relation to earnings losses due to unemployment or furlough. While we cannot yet say how long-lasting these losses will be, previous studies analysing the costs of job loss from past recessions indicate that job loss can reduce earnings for decades. The consequences extend far beyond mere economic costs and can adversely affect the mortality outcomes of those made redundant.
We would like to thank the editors and referees as well as participants at the NEPR workshop in Reykjavik for valuable comments.
References
Adams-Prassl, A., Boneva, T., Golin, M. & Rauh, C. (2020). Inequality in the impact of the coronavirus shock: Evidence from real time surveys. Journal of Political Economics, vol. 189.
Albanesi, S. & Jiyeon, K. (2021). Effects of the COVID-19 recession on the US labor market: Occupation, family, and gender. Journal of Economic Perspectives, 35(3), 3–24.
Alstadsæter, A., Bratsberg, B., Eielsen, G., Kopczuk, W., Markussen, S., Raaum, O. & Røed, K. (2020). The first weeks of the coronavirus crisis: Who got hit, when and why? Evidence from Norway. Covid Economics, 15, 63–87.
Bennedsen, M., Larsen, B., Schmutte, I. & Scur, D. (2020). Preserving job matches during the COVID-19 pandemic: Firm-level evidence on the role of government aid. Covid Economics, 27, 1–21.
Couch, K. A. & Placzek, D. W. (2010). Earnings losses of displaced workers revisited. American Economic Review, 100(1), 572–89.
Ellingsæter, A. L. (2012). Cash for childcare: Experiences from Finland, Norway and Sweden. Berlin, Germany: Friedrich-Ebert-Stiftun.
Farré, L., Fawaz, Y., Gonzalez, L. & Graves, J. (2020). How the COVID-19 lockdown affected gender inequality in paid and unpaid work in Spain. (Discussion paper series 13434). Bonn, Germany: IZA.
Gruber, J., Huttunen, K. & Kosonen, T. (2021). Paying moms to stay home: Short and long run effects on children. (Working paper Aalto University). Esbo, Finland: Aalto University.
Hensvik, L. & Skans, O.N. (2020). IZA COVID-19 crisis response monitoring: Sweden. Bonn, Germany: IZA.
Huttunen, K., Møen J. & Salvanes, K. G. (2011). How destructive Is creative destruction? Effects of job loss on job mobility, withdrawal and income. Journal of the European Economic Association, 9(5), 840–870.
Illing, H., Schmieder, J. & Trenkle, S. (2021). The gender gap in earnings losses after job displacement. (Discussion paper series 14724). Bonn, Germany: IZA.
Jacobson, L. S., LaLonde, R. J., & Sullivan, D. G. (1993). Earnings losses of displaced workers. The American Economic Review, 83(4), 685–709.
Juranek, S., Paetzold, J., Winner, H., & Zoutman, F. (2021). Labor market effects of COVID-19 in Sweden and its neighbors: Evidence from administrative data. Kyklos, 74(4), 512–526.
Kosonen, T. (2014). To work or not to work? The effect of childcare subsidies on the labour supply of parents, The B.E. Journal of Economic Analysis & Policy, 14(3), 817–848.
Kutilainen, A., Nokso-Koivisto, O. & Toivanen, O. (2021). Koronakriisin aikaisten yritystukien arviointi. Helsinki, Finland: Työ- ja elinkeinoministerin julkaisuja. [eng: Publications of the Minister of Employment and the Economy].
Nososco (2017). Social protection in the Nordic countries 2015/2016. Scope, expenditure and financing. Copenhagen, Denmark: Nordic Social Statistical Committee (Nososco).
OECD (2021). OECD Family database: Enrolment in childcare and pre-school. Paris, France: OECD. Retrieved from: https://www.oecd.org/els/soc/PF3_2_Enrolment_childcare_preschool.pdf.
Appendix
Figure A1a Employment rates by age in 2019, women
Figure A1b Employment rates by age in 2019, men
Figure A2 Change in aggregate labour earnings by industry, female share
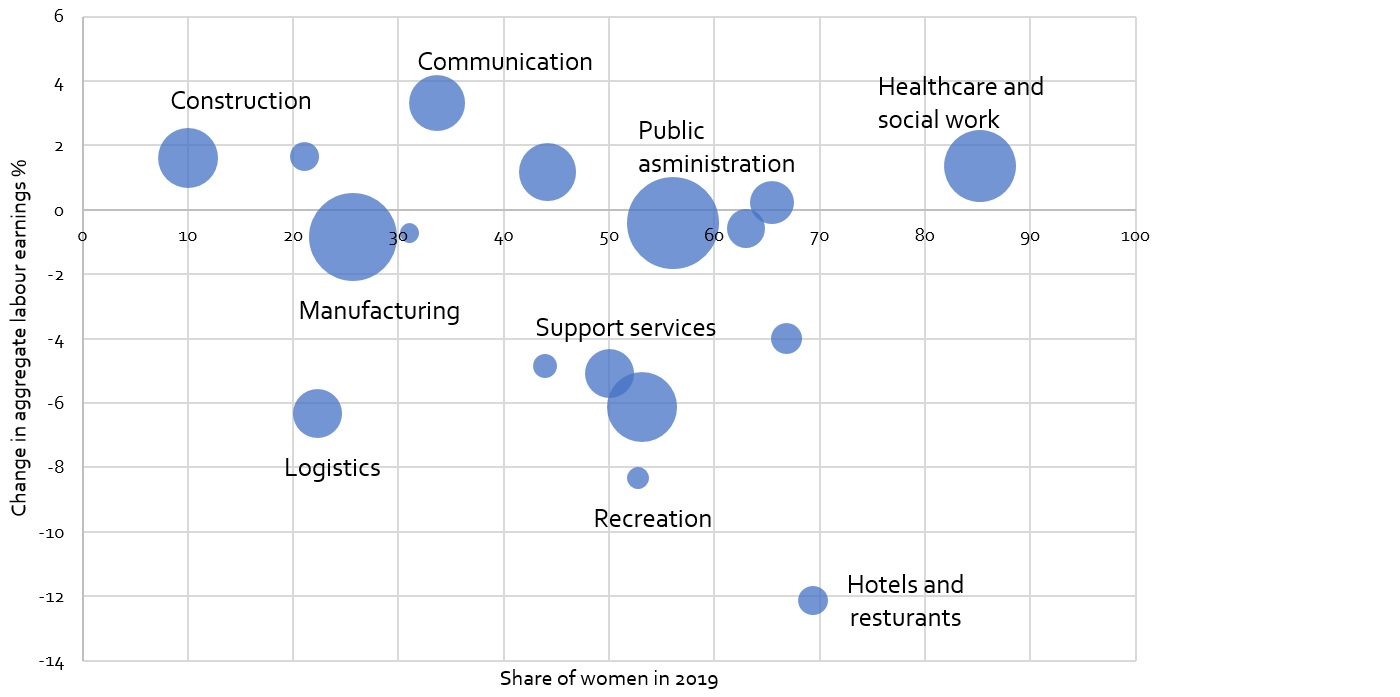
Figure A3 Monthly earnings sum (wage bill) by gender in 2019–2020
Figure A4a Total wage sum (wage bill) by gender in 2019–2020: Hotels and restaurants
Figure A4b Total wage sum (wage bill) by gender in 2019–2020: Logistics
Figure A4c Total wage sum (wage bill) by gender in 2019–2020: Recreation
Figure A4d Total wage sum (wage bill) by gender in 2019–2020: Health and social care
Figure A5a Number employed with any earnings per month in 2019–2021, women
Figure A5b Number employed with any earnings per month in 2019–2021, men
Figure A5c Number employed with earnings equivalent to at least 1 000 euro per month in 2019–2021, women
Figure A5d Number employed with earnings equivalent to at least 1 000 euro per month in 2019–2021, men
Comment on K. Huttunen & H. Pesola: COVID-19 and labour market outcomes by gender in Finland
This paper presents an engaging and valuable study of gender inequality during the pandemic. It also contains a detailed and helpful description of the different furlough schemes in the Nordic countries.
Although job flexibility is in high demand, the tendency for women to spend more time on childcare than men can exacerbate the gender gap if women are also expected to assist with home schooling during pandemics. Similarly, women are more likely to have temporary jobs, which are the first to go during recessions. As a general rule, furlough schemes are only for people on permanent contracts.
The authors use administrative data to analyse the impact of the COVID-19 pandemic on inequality in terms of employment and earnings between men and women in different sectors of the Finnish economy. They show that the COVID-19 recession has had an oversized and immediate negative impact on the Finnish employment rate. Sectors with a larger proportion of female workers were more negatively affected, while sectors with a larger proportion of male workers recovered more slowly. However, earnings losses were equal for both men and women and similar for women with and without children.
That women with and without children were equally affected is an intriguing observation. It gives rise to two questions. Can we encourage a similar effect in other Nordic countries, and what would the long term consequences of such a move be? The authors describe how Finland heavily subsidises childcare at home and, therefore, has a considerably smaller portion of children in daycare than the other Nordic countries. Approximately 80 percent of 4–5 year-olds are in daycare in Finland, compared to almost 100 percent in the same age group in its Nordic neighbours. In addition, the authors indicate a clear drop in the employment rate among 30–39-year-old women in Finland during the pandemic, a drop that is not noticeable in the other Nordic countries studied. They also reveal that women were more affected by unemployment than men in Finland and Sweden. It transpires that while male employment figures were hardly affected in Finland, the rate for women dropped significantly.
The question remains whether the pandemic will have long-term consequences for gender inequality. Let me suggest three potential areas of impact worth considering: numbers in work, promotion and pensions.
We have observed an extensive drop in labour force participation in the US during the pandemic (see, for example, Bauer & Edelberg 2021). However, it remains to be seen whether a return to office working after the pandemic coupled with a decrease in remote working, with resulting lower flexibility between home schooling and childcare on the one hand and working from home on the other, will make employment less attractive for women. In other words, will the overall number of women in work fall?
Home schooling and working from home may have proved difficult for all, but perhaps directly affected women the most. However, will it also affect women’s careers negatively relative to men’s (Sim 2021)? Although working from home may be more preferable for women than men after the pandemic, it may also negatively impact women’s likelihood of promotion since, as a consequence, they may be less likely to be physically present in the office where many decisions are ultimately taken.
Finally, the recent Danish inequality report (Finansministeriet 2021) shows that men are significantly wealthier than women. For women, a period of lower income may have substantially reduced their savings and contributed to a reduction in their pensions and other buffers against challenging times. When women have lower wealth than men as a starting point, any reduction in their savings is of far graver consequence than for men.
The extent and breadth of the long-term impacts on gender inequality in employment remain to be seen.
References
Bauer, L. & Edelberg, W. (2021, Dec.). Labor market exist and entrances are elevated: Who is coming back? Brookings. Available at: https://www.brookings.edu/blog/up-front/2021/12/14/labor-market-exits-and-entrances-are-elevated-who-is-coming-back/.
Finansministeriet (2021). Ulighedsredegørelsen. Copenhagen, Denmark: Finansministeriet
Sim, B. (2021, June). Covid-19 is causing a ‘shecession’ as pandemic impacts gender equality at work. Financial News. Available at: https://www.fnlondon.com/articles/covid-19-is-causing-a-shecession-as-pandemic-impacts-gender-equality-at-work-20210302.
Comment on K. Huttunen & H. Pesola: COVID-19 and labour market outcomes by gender in Finland
The COVID-19 pandemic has had substantial effects on labour markets across the globe. Both the spread of the virus and the containment measures introduced have led to a decline in economic activity, changes in consumer spending patterns and a shift to working from home. To combat the negative impact on companies and workers, countries have introduced business support programmes, including job retention schemes. The full effects on the labour market and on workers remain an open question. This paper contributes to knowledge about the effects on the labour market by studying the short-term consequences of job losses in Finland, with a particular focus on differences between men and women. Using a novel data set containing daily information on earnings from employment, the study analyses the effects on employment in different sectors and the impact of job losses on earnings during the pandemic. The paper provides a valuable analysis of the immediate effects of the COVID-19 pandemic in Finland.
The labour markets of men and women may be differently affected due to both demand and supply side factors. In a normal recession, male employment is generally affected most as production in male-dominated sectors such as manufacturing and construction is more sensitive to the business cycle. The COVID-19 containment measures have, however, hit sectors that involve travel and face-to-face interaction hardest. In Table 1, I show how revenue and employment changed between 2019–2020 for some of the Swedish industries that experienced the largest decreases and increases in demand during the crisis. The largest reduction in employment is seen in Amusement & Recreation (-31 percent), followed by Hotels (-26 percent) and Travel agencies (-20 percent). As shown by Huttunen and Pesola, the employment pattern looks similar in Finland; the most affected industries were Hotels & Restaurants and Recreation. Since more women than men work in hotels and restaurants, women are more vulnerable to large falls in demand. At the same time, the Health & Social Service sector, with a relatively high proportion of female employees, experienced a slight increase in employment during the pandemic. Overall, Huttunen and Pesola show that demand-side changes led to minor gender differences in employment in Finland.
On the supply side, closing daycare facilities and schools may have increased the household workload for families with children, which may have had negative consequences for women’s employment since they traditionally assume a larger share of childcare responsibilities. Occupational differences between men and women may also result in gender differences in labour market outcomes. Some occupations are more amenable to work via the internet which means that working from home is – for better and for worse – feasible. On the one hand, it is possible to combine work and family when daycare and schools are closed; on the other, productivity may suffer if working from home includes assuming greater responsibility for housework and children. Adams-Prassl (2020) finds, in a study of workers on an online labour platform, that women with children are more likely to interrupt their working time with consequences for their task completion. Thus, having children reduce women’s productivity, while men’s productivity is unaffected.
Huttunen and Pesola provide an analysis of the effects of job losses on earnings for men and women with and without children. Interestingly, they do not find any differential effects, which suggests that the closing of schools and daycare was not a major obstacle in finding employment after job loss. In other words, there were no differences with regard to sex or the presence of children in the household. The impact on job loss and the long-term consequences for women’s careers are important questions for future research. If the household workload increased for mothers during the pandemic, it may not have had an effect on the probability of them finding new employment but may have a negative effect on their job prospects and earnings in the long term.
Huttunen and Pesola do indicate, however, that recovery from job loss depends on the sector. Workers in Hotel & Restaurant and especially in Logistics have lower earnings at the end of the six-month follow-up period, whereas workers in Health & Social work experienced limited consequences for earnings. Thus, earnings of workers in industries with persistent lower demand do not recover as quickly as earnings of workers in sectors with high demand. This is to be expected, as workers’ human capital is likely to be sector-specific in the short term but still an interesting finding. Also, support programmes for temporary layoffs may weaken incentives for workers to find jobs in other sectors. In the job-loss sample, 75 percent of the workers were furloughed, implying that they still have employment contracts and, therefore, are less likely to apply for work in other industries. These programmes are probably used to a larger extent in industries with substantial reductions in demand. An important question for future research is to understand whether the long-term consequences of the extensive use of furlough schemes and other business-support programmes have been effective. On the one hand, the schemes made it easier for companies and workers to hibernate during extraordinary circumstances (‘labour hoarding’), which possibly prevented costly restructuring and loss of human capital. On the other hand, the programmes may have conserved existing structures and kept companies with limited prospects alive, so-called zombie companies, and reduced the incentive for workers to retrain and move to growth sectors.
A question not addressed in the article is whether the effects of job loss during the pandemic differ from those in normal recessions? The job-loss literature usually studies earnings over the subsequent years rather than subsequent months, which make comparing results difficult. A general finding in the literature is that job loss has a long-term impact on earnings. Using Swedish data, Eliason (2011) finds a reduction of earnings of 6 percent up to 12 years after job loss. Huttunen et al. (2011) find a 3 percent reduction after seven years, using Norwegian data. The literature tends to indicate that the effects are more severe in deep recessions (see e.g. Eliason & Storrie 2006). This is also what we see in Huttunen and Pesola as sectoral labour market conditions are important for the recovery of earnings.
Are the effects found in Finland likely to be similar in the other Nordic countries? As discussed by Huttunen and Pesola, the effects on the labour market depend on country-specific institutions, industry structure and the measures taken to support industry and workers. Although industry demand-shocks are similar across countries, industry structure is not. In addition, support schemes have had effects on employment and earnings. As seen in the table, net revenues in Amusement and Recreation activities decreased by 48 percent and employment by 31 percent in Sweden. Passenger air transport had a slightly larger decrease of net revenues (-54 percent) but only a 16 percent decrease in employment. Similary manufacturers of motor vehicles reduced employment to a much lesser extent when their net revenues decreased. This may partly be due to differences in the take-up of support programmes. According to a study by the OECD (2020), job retention schemes in the first phase of the pandemic were used most in Sweden, followed by Denmark and Norway. Finland had the lowest take-up. (No information was available for Iceland.) Take-up rates at the end of May 2020 were about 12 percent in Sweden and 8 percent in Finland relative to the percentage of total employees in the fourth quarter of 2019.
In summary, this paper concisely analyses the immediate effects of the COVID-19 pandemic on male and female employment in Finland. Although demand and supply-side factors may be expected to lead to different effects on male and female employment, the study finds no differences. Huttunen and Pesola provide the initial evidence on which future research can build.
Table 1 Changes in net revenues and number of employees in select Swedish industries
| Industry SNI2007 | Net revenues | Number of employees | ||
| Million (SEK) | Change (percent) | Number | Change (percent) | |
| Travel agency and tour operators (79.1) | 24 831 | 61 | 6 044 | 20 |
| Passenger air transport (51.1) | 12 745 | 54 | 3 43 | 16 |
| Amusement and recreation activities (93.2) | 3 786 | 48 | 3 093 | 31 |
| Hotels (55.1) | 26 89 | 43 | 25 12 | 26 |
| Passenger train transport (49.1) | 7 408 | 36 | 4 492 | 1 |
| Creative, arts and entertainment activities (90.0) | 12 945 | 28 | 8 422 | 5 |
| Manufacture of motor vehicles (29.1) | 253 15 | 20 | 47 622 | 6 |
| Restaurants (56.1) | 93 918 | 16 | 91 504 | 10 |
| Renting and leasing of motor vehicles (77.1) | 9 342 | 13 | 1 888 | 13 |
| Passenger transport buses (49.3) | 77 663 | 12 | 52 998 | 8 |
| Other human health activities (86.9) | 18 258 | 6 | 12 659 | 0 |
| Manufacture of pharmaceutical products (21.1-21.2) | 118 057 | 10 | 13 156 | 8 |
| Retail sale of household equipment (47.5) | 125 779 | 11 | 34 909 | 1 |
| Veterinary activities (75.0) | 7 008 | 15 | 5 746 | 4 |
| Manufacture of medical and dental equipment (32.5) | 19 042 | 17 | 6 611 | 2 |
| Retail sale not in stores, stalls or markets (47.9) | 83 779 | 18 | 18 181 | 9 |
References
Adams-Prassl, A. (2020). The gender wage gap in an online labour market: The cost of interruptions. London, UK: Centre for Economic Policy Research.
Eliason, M. (2011). Income loss: the role of the family and the welfare state. Applied Economics, 43(5), 603–618
Eliason, M. & Storrie, D. (2006) Lasting or latent scars? Swedish evidence on the long-term effects of job displacement. Journal of Labour Economics, 24(4), 831–856.
Huttunen, K., Møen J. & Salvanes, K. G. (2011). How destructive is creative destruction? Effects of job loss on job mobility, withdrawal and income. Journal of the European Economic Association, 9(5), 840–870.
OECD (2020). Job retention schemes during the COVID-19 lockdown and beyond. Paris, France: OECD. Retrieved from: https://www.oecd.org/coronavirus/policy-responses/job-retention-schemes-during-the-covid-19-lockdown-and-beyond-0853ba1d/.
About this publication
Nordic Economic Policy Review 2022: COVID-19 effects on the economy in the Nordics
Nord 2022:001
ISBN 978-92-893-7177-3 (PDF)
ISBN 978-92-893-7178-0 (ONLINE)
ISSN 1904-8092
http://dx.doi.org/10.6027/nord2022-001
© Nordic Council of Ministers 2022
Layout: Erling Lynder and Louise Jeppesen
Front page photo: Johnér.dk
Photos in articles: The Nordic economies and the COVID-19 pandemic: Ricky John Molloy/Norden.org
Economic developments and policies during the COVID-19 crisis – Nordic experiences: Ricky John Molloy/Norden.org
Labour market and social policy responses to the COVID-19 pandemic in the Nordic countries – A view from the outside: Ricky John Molloy/Norden.org
Iceland’s fight against COVID-19 – An economic perspective: Visiticeland.com
The Economic Cost of COVID-19 – Iceland, Norway, and Sweden: Ricky John Molloy/Norden.org
Schooling in the Nordic countries during the COVID-19 pandemic: Unsplash.com
COVID-19 and labour market outcomes by gender in Finland: Ricky John Molloy/Norden.org
Nordic co-operation
Nordic co-operation is one of the world’s most extensive forms of regional collaboration, involving Denmark, Finland, Iceland, Norway, Sweden, and the Faroe Islands, Greenland and Åland.
Nordic co-operation has firm traditions in politics, economics and culture and plays an important role in European and international forums. The Nordic community strives for a strong Nordic Region in a strong Europe.
Nordic co-operation promotes regional interests and values in a global world. The values shared by the Nordic countries help make the region one of the most innovative and competitive in the world.
Nordic Council of Ministers
Nordens Hus
Ved Stranden 18
DK-1061 Copenhagen
www.norden.org
Read more Nordic publications on www.norden.org/publications